energy and emission reduction opportunities for the cement industry
TRANSCRIPT

Energy and Emission Reduction Opportunities for the Cement Industry
Prepared for
Industrial Technologies Program
Energy and Emission Reduction Opportunities for the Cement Industry
Prepared by William T Choate
BCS Incorporated 5550 Sterrett Place Suite 306
Columbia MD 21044
December 29 2003
Prepared Under Contract for
Industrial Technologies Program
Cover Rotary kilns represent the largest energy consumer and carbon dioxide emission source of the cementconcrete industry The cover diagram shows a thermal image of an operating kiln The high temperature of the kiln surface (300degF to 400degF) accounts for about a 5 energy efficiency loss The diagram on the cover depicts a kiln that has lost insulating refractory material and shows hot spots and a hot ring that will require future repair
Acknowledgments
We gratefully acknowledge the support of the US Department of Energyrsquos Office of Energy Efficiency and Renewable Energy Industrial Technologies Program We especially thank The Portland Cement Association and the National Ready Mixed Concrete Association for their valuable input and information
This document represents the valuable input of many individuals and organizations We particularly want to recognize Anne Klontz (BCS Incorporated) for the graphic design of the figures and tables
Disclaimer This report was prepared as an account of work sponsored by an Agency of the United States
Government Neither the United States Government nor any Agency thereof nor any of their employees makes any warranty expressed or implied or assumes any legal liability or responsibility for the accuracy completeness or usefulness of any information apparatus product or process disclosed or represents that its use would not infringe privately owned rights Reference herein to any specific commercial product process or service by trade name trademark manufacturer or otherwise does not necessarily constitute or imply its endorsement recommendation or favoring by the United States Government or any Agency thereof The views and opinions expressed by the authors herein do not necessarily state or reflect those of the United States Government or any Agency thereof
Table of Contents
Executive Summary -i-
Introduction -1shyENERGY AND EMISSION METRICS -2shyOVERALL ENERGY USE AND EMISSIONS -3shy
The US Cement Industry -6shy
Cement -9shyCEMENT MANUFACTURING PROCESS -11shy
Quarrying -11shyRaw Material Preparation -12shyKiln Operations -13shyCement Milling -16shyStorage and Dispatch -17shy
Concrete -18shy
Opportunities for Improving Energy Efficiency and Reducing CO2 Emissions -21shyPYROPROCESSING OPPORTUNITIES -24shy
Upgrading Existing Technology -26shyAdopting New Technology -26shyCogeneration -26shyBiomass Fuels -26shyAlternateWaste Fuels -27shy
GRINDING AND MILLING OPPORTUNITIES -28shyPRODUCT FORMULATION CHANGES TO IMPROVE ENERGY EFFICIENCY -29shy
Pozzolan -29shy
Endnotes -31shy
Appendix A - Energy Data and Calculation Tables Appendix B - Portland Cement Types Appendix C - Major Components of Cement
Table of Diagrams Figures and Charts
Diagram A ndash Energy Use Distribution for Quarrying Cement Manufacturing and Concrete Production -i-
Diagram B ndash Carbon Dioxide Emissions for Quarrying Cement Manufacturing and Concrete Production -ii-
Table 1 ndash Annual On-site Energy Use and CO2 Emissions Associated with Cement and Concrete Production 3
Table 8 ndash Annual Energy Use and CO2 Emissions Associated with Cement and Concrete
Table 2 ndash 2001 US Cement Industry 6
Diagram 1 ndash US Kiln Locations 6
Table 3 ndash On-site Fuel Consumption for Cement Manufacturing (excluding Quarrying) 7
Table 4 ndash Final Composition of Typical Portland Cement 9
Diagram 2 ndash Phase Diagram of Major Cement Components 10
Diagram 3 ndash Quarrying for Cement Limestone 11
Table 5 ndash Energy Consumption for Surface Limestone Quarrying 12
Diagram 4 ndash Raw Material Preparation 12
Diagram 5 ndash Preheater Precalciner Kiln 13
Diagram 6 ndash Preheater Precalciner Section 15
Table 6 ndash Average Energy Consumption in US Kilns by Number and Process 16
Diagram 7 ndash Clinker and Gypsum Milling 16
Diagram 8 ndash Concrete Production 18
Table 7 ndash Typical Concrete Mix 18
Production 21
Table 9 ndash Thermal Energy Balances to Produce Clinker in Process Kiln 24
Aggregate Quarrying
Limestone Quarrying
QUARRYING
CEMENT
MANUFACTURING
CONCRETE
Grinding
Raw Meal Storage
Raw Meal Exhaust Gas to Treatment Inlet
PREHEATER CYCLONES
Precalcine Burner
ROTARY KILN
Cement Storage
Dispatch
Primary Crushing
Secondary Crushing
Quarried Raw Materials
Blending
Cooler Air
Finish Milling
Clinker
Clinker
Clinker
Gypsum
Burner
CLINKER COOLER
Cement
Aggregate Ready Mix Pre Cast
Executive Summary Cement is a gray finely ground combination of minerals which when mixed with water
sand gravel and other materials forms concrete Cement provides the chemical bonds that hold the other materials together to form a dense rocklike substance Concrete is the worldrsquos most commonly used construction material and second only to water as the most-consumed substance on Earth Demand for cement is directly tied to the use of concrete in building construction and public works projects It closely follows GDP growth in the United States and in developing countries Nearly all cement is used to produce concrete Cement manufacturing and concrete production are bound together in the Life Cycle Analysis of energy use and emissions of these industries
The United States has 118 cement manufacturing facilities operating 192 kilns These plants manufactured over 88900000 tonnes of cement in the year 2001 On average they required 4982000 Btu to produce one metric ton (tonne) of cement not including the energy required for quarrying raw materials The production of concrete consumes nearly all manufactured cement Ready Mixed Concrete is produced in more than 2700 plants and accounts for over 75 of all concrete production Over 390646000 cubic yards (687000000 tonnes) of ready mixed concrete were produced in 2002 Concrete blocks and precast products account for 13 on-site concrete mixing accounts for 6 and the remaining 6 of concrete production is used in well lining mining operations and other activities Concrete accounts for about 20 of the energy and 12 of the CO2 emissions associated with cementconcrete
The cementconcrete industry operates at less than 40 thermal efficiency This low efficiency suggests that there are significant opportunities to improve energy efficiency and reduce emissions Diagram A shows the proportion of the more than 550 x 1012 Btu (055 quad) that were consumed in 2000 for US quarrying cement manufacturing and concrete production Cement manufacturing requires very high temperatures 2700degF (1500degC) to initiate the reactions and phase changes necessary to form the complex mineral compounds that give cement its unique properties Pyroprocessing in large rotary kilns is the operational step that provides the energy and environmental conditions necessary for the reactions and phase changes This operation dominates the energy consumption and environmental impacts associated with the manufacture of cement and use of concrete and accounts for 742 of the industriesrsquo energy consumption US pyroprocessing systems on average operate at roughly 34 energy efficiency
-ishy
More than 104 x 106 tonnes of CO2 emissions were associated with US quarrying cement manufacturing and concrete production Diagram B shows the proportion by source of these emissions The raw materials used in cement manufacturing undergo chemical reactions during pyroprocessing that result in the generation of carbon dioxide (CO2) These chemical reactions produce 054 tonnes of CO2 per tonne of cement about 48 x 106 tonnes annually Nearly 60 of the 689 x 106 tonnes of CO2 produced annually in the United States from non-combustion industrial sources (chemical reactions) originate from cement manufacturing1
Industrial non-combustion CO2 sources account for approximately 12 of all US CO2 emissions In addition the fuels burned to supply the energy necessary for pyroprocessing produce roughly 043 tonnes of CO2 per tonne of cement In total pyroprocessing generates nearly 097 tonnes of CO2 for each tonne of cement produced (86 x 106
tonnes annually) and accounts for 81 of the CO2 emissions associated with the use of cementconcrete The CO2 produced from the chemical reactions is not influenced by changes in technology equipment or pyroprocessing energy efficiency A consequence of the large portion of CO2 generated from chemical reactions is that a 25 reduction in pyroprocessing energy use results in only an 11 reduction of total CO2 emissions
The greatest gains in reducing energy consumption and lowering emissions in the cementconcrete industry will be obtained with improvements in pyroprocessing Process improvement will come from better energy management upgrading existing equipment adopting new pyroprocessing technologies and in the longer term performing the research and development (RampD) necessary to develop new cement manufacturing processes Pyroprocessing is ideally suited to utilizing biomass and other non-traditional alternative fuel sources Its extremely high operating temperature and long residence time ensure complete combustion of these fuel sources Biomass fuels are considered to provide energy with near net-zero carbon-based emissions RampD directed at developing the systems necessary to prepare and feed biomass fuels into pyroprocessing equipment will dramatically lower carbon-based emissions Many industrial manufacturing and consumer wastes are suitable alternate fuels for pyroprocessing (eg used oils solvents tires and other wastes) RampD directed at safely increasing the use of alternate fuels provides an indirect means of improving energy efficiency Alternate fuels are frequently assumed to have no energy requirement for their manufacture and their feedstock energy (energy inherent to the material) is normally associated with the finished product not the used product Hence when alternate fuels that are typically disposed of in landfills are utilized as fuels they provide a source of ldquofreerdquo energy
Energy efficiency improvements and emission reductions can also result from changes in
-iishy
the Product Formulation of cement Research has shown that modifications to the cement formula are possible without a loss in desired properties or performance These modifications include the addition of cement-like (pozzolanic) materials (eg fly ash furnace slag or other materials) that do not require the large energy inputs associated with pyroprocessing Changes to cement product formulations require significant time to be incorporated into ASTM standards and be accepted in the marketplace Concrete producers specify cement based on ASTM standards in order to guarantee the performance characteristics of concrete Changes to these formulations are perceived as ldquoriskyrdquo because change represents a move away from standards that have a very long and well-documented performance history There is a trend in public works projects of specifying newer ldquolow-energyrdquo product formulations
This report describes the cement industry and its technology It provides background information necessary to develop realistic work plans to reduce energy usage and to lower CO2 emissions This report finds that opportunities exist both in the near-term and in the long-term for reducing energy usage and lowering emissions Immediate and near-term improvements can be achieved by implementing demand-side energy management measures to improve energy efficiency and reduce electricity and fuel use These improvements can come from utilizing free and low-cost options that include motor compressed air and process heater optimization software tools participating in local and regional energy management training workshops and seminars and conducting university-based energy assessments Other site-specific near-term energy and environmental improvements can be achieved with contracted formal energy audits Changes in product formulation also offer significant near-term energy and environmental improvements Longer-term improvements could come from advanced research and development programs However the cement industry like most of the commodity materials industries does not have the resources or incentives to conduct advanced and significant RampD on their own Successful research and development programs will require significant collaboration between industry government and academia
-iiishy
Introduction
Cement is a gray finely ground combination of minerals which when mixed with water sand gravel and other materials forms concrete Cement provides the chemical bond that holds the other materials together Concrete when newly mixed is plastic and malleable which allows it to be cast into shapes to build homes sidewalks superhighways dams skyscrapers and many other objects Concrete is inert nontoxic naturally waterproof and fire resistant It is the worldrsquos most commonly used construction material
The words cement and concrete in every day usage are frequently interchanged even though cement is only
Concrete is second only to water as the most consumed substance on Earth with almost one ton of it being used for each human every year - Lafarge Coppee SA Globe and Mail October 20 2000
Annual global production of concrete hovers around 5 billion cubic yards Twice as much concrete is used in construction around the world than the total of all other building materials including wood steel plastic and aluminum - Cement Association of Canada
one of the multiple materials used in the making of concrete (Is it a cement sidewalk or a concrete sidewalk) Cement manufacturing and concrete production are bound together in any analysis of energy use and emissions
The raw materials used to produce cement are primarily limestone clay shale and silica sand (Appendix A Table A3) These materials are quarried crushed and for economy are usually transported to a nearby cement plant The cement plant proportions the raw materials to the correct chemical composition and grinds the material to a fine consistency Small quantities of iron ore alumina and other minerals may be added to adjust the raw material mixture The finely ground raw material ldquoraw mealrdquo is fed into large rotary kilns cylindrical furnaces 10 to 25 feet in diameter and 200 to 1000 feet in length The rotary cement kiln is the worlds largest moving manufacturing machine and one of the hottest It is typically set on a slight incline and rotates from 1 to 4 revolutions per minute A large kiln may ldquopyroprocessrdquo more than 300 tonnes of raw meal an hour The raw meal is heated in the kiln to extremely high temperatures about 1500degC (2700degF) The high temperature pyroprocessing causes the raw meal to react and form complex mineral compounds These compounds exit the kiln as a hard nodular material called ldquoclinkerrdquo Many newer cement plants use the hot exiting kiln gases to preheat the raw meal Clinker is cooled and ground with approximately 5 gypsum (which controls concrete setting time) and other minor additives to produce cement
Concrete is produced by blending cement with fine aggregate (sand) coarse aggregate (gravel or crushed stone) and frequently with small amounts of chemicals called ldquoadmixturesrdquo Admixtures are used to accelerate or retard setting time control early plasticity properties increase strength improve resistance to acid and sulfates control shrinkage and improve freezethaw cracking When water is added to the concrete mix at the job site it forms a slurry that coats the surfaces of the aggregate and fills the voids to form rock-solid concrete The process of hardening or setting is the result of the water hydration chemical reaction of the cement The properties of concrete are determined by the exact chemical composition of cement
-1shy
used the additives and the overall proportions of cement aggregate and water Concrete contains about 12 weight percent cement Because of the relatively small cement content concrete is not energy intensive when compared to other construction materials2
ENERGY AND EMISSION METRICS
Technologies practices and product use determine the energy consumption and environmental impact of a product The energy values and emissions studied and presented in this
Concretersquos Relative Energy Intensity2
Extruded Aluminum 184 Plastics 92 Structural Ceramics 17 Steel 12 Cement 8 Glass 7 Concrete 1
eg It requires 184 times more energy per unit mass to build with extruded aluminum compared to concrete
report are based on a ldquovalue chainrdquo analysis of the cementconcrete industry Value chain analysis allows for the capture of the direct energy and feedstock inputs of each processing step (link) to build a cumulative value along the chain A value chain analysis is an integral part of a Life Cycle Assessment (LCA) and provides valuable information and data values for organizations performing a complete LCA LCAs are important to ensure that process improvements in one area are not merely shifting the energy and environmental burdens to another area Numerous LCAs and energy inventories have examined the cementconcrete industry3 These are valuable references
On-site energy values are based on actual process measurements taken within a facility These measurements are valuable because the on-site values are the benchmarks that industry uses to compare performance between processes facilities and companies On-site measurements however do not account for the complete energy and environmental impact of manufacturing a product A full accounting of the impact of manufacturing must include the energy used to produce the electricity the fuels and the raw materials used on-site These ldquosecondaryrdquo or ldquotacitrdquo additions are very important from a regional national and global energy and environment perspective
The ldquotacit energyrdquo associated with the production and transportation of fossil fuels used for combustion adds roughly 3 to the energy values of the fuels Tacit electrical energy and environmental impact measurements account for the fact that substantial electrical generation inefficiencies and transmission losses occur outside the cement manufacturing facility It can take as much as three units of hydrocarbon or coal calorific energy to produce one unit of electric energy Saving 1 kilo watt hour (kWh) of on-site electricity is equivalent to saving over 3 kWh of the energy contained in the petroleum or coal-based fuels used to generate electrical power Typical US grid electricity requires about 9935 Btu of energy to deliver 1 kWh of on-site electricity (3412 Btu) for use (Appendix A Table A16) Industrial tacit energy values also account for feedstock energy Feedstock energy is defined as the energy inherent in fuels that are used in the manufacturing as materials rather than fuels The feedstock energy associated with cement and concrete production is near-zero This report for clarity distinguishes between on-site energy values and tacit energy values with the use of a superscript (Any value that is a tacit
-2shy
value is denoted with the superscript ldquotrdquo eg 10 t kWh)
OVERALL ENERGY USE AND EMISSIONS
The annual cementconcrete energy ldquovalue chain analysisrdquo from quarrying raw material to the final placement of concrete is shown in Table 1 The United States produced approximately 89000000 tonnes of cement in 2002 In total the cementconcrete industry consumed over 550 x 1012 Btu (055 quad) Cement manufacturing is the most energy-intensive link accounting for nearly 80 447 x 1012 Btu (0447 quad) of the on-site energy consumed in the cementconcrete energy value chain
The amount of energy required to produce one tonne of cement averaged 4982000 Btutonne of cement for US plants (not including the energy required for quarrying the raw
Table 1 - Annual On-site Energy Use and CO2 Emissions Associated with Cement and Concrete Production
CEMENT CONCRETE
Energy CO2 Energy CO2
109 Btu 106
tonne 109 Btu 106
tonne
RAW MATERIALS QUARRYING and CRUSHING
Cement Materials 3817 036
Concrete Materials 14287 128
CEMENT MANUFACTURING
Raw Grinding 8346 150
Kiln fuels 410464 3847
reactions 4835
Finish Milling 24057 432
TOTAL CEMENT 446683 9300 446683 9300
CONCRETE PRODUCTION
Blending Mixing 31444 565
Transportation 61933 453
TOTAL 554409 10450 See Appendix A Table A10
-3shy
materials) The most energy efficient US plant required 3230000 Btutonne of cement while the least efficient used 8150000 Btutonne of cement4 One unit operation pyroprocessing accounts for 742 of the total on-site energy more than 410 x 1012 Btu (041 quad) requiring nearly 4617000 Btu per tonne of cement for pyroprocessing alone
The CO2 emissions associated with the cementconcrete value chain are also presented in Table 1 Kilns and ancillary equipment used for pyroprocessing produce 831 of the CO2 emissions These emissions are generated by two mechanisms
lt Reaction-based CO2 Generation ndash the thermochemical decomposition reaction or calcining of limestone (CaCO3 micro CaO + CO2) and other minor raw materials produce CO2
lt Fuel-based CO2 Generation ndash the combustion of fuels used to obtain the high temperature needed for the calcining reactions produce CO2
The calcium carbonate calcining reaction (CaCO3 micro CaO + CO2) produces 0785 tonnes of CO2 per tonne of CaO There is no technological or physical way to reduce calcination reaction emissions Many cements contains about 61 CaO Hence the calcining reaction produces roughly 048 tonnes of CO2 for each tonne of cement manufactured This report calculated reaction CO2 emissions to be 0544 tonnes of CO2 per tonne of cement based on the raw materials used by the US cement industry (Appendix A Table A11 and A3) This difference can be accounted for by recognizing that the MgCO2 portion of the raw materials also contributes to CO2 emissions Industrial emissions of CO2 that are not caused by the combustion of fossil fuels Reaction-based CO2 Generation accounted for 12 (68900000 metric tons of CO2 equivalent)5 of total US CO2 emissions in 2000 The cement industry contributed 61 of this non-fuel value5
The level of CO2 emissions from fuels depends on the cement process and the fuels used These emissions can be controlled to some degree by fuel selection burner choice burner controls kiln operation and heat recovery equipment The fuel mix and operating systems that supplied the energy necessary to pyroprocess in US cement kilns in 2001 produced roughly 0433 tonnes of CO2 per tonne of cement In total pyroprocessing generates nearly 0977 tonnes of CO2 for each tonne of cement produced (Appendix A Table A11)
Cement manufacturing also generates other emissions of environmental concern Particulates (dust) become airborne during the grinding pyroprocessing milling operations and with the conveying of raw materials and product within the cement plant Large volumes of gases mixing with finely powdered material naturally result in airborne particulates On-site airborne dust is captured and controlled through optimal design and application of electrostatic precipitators and bag-house filtration systems6 These fine particulates can be difficult to capture and when they escape collection systems can spread over a large area
Emissions of non-CO2 gaseous pollutants are minimal because of the high temperatures and long residence times associated with kiln operations Fuels and waste fuel materials are completely combusted and limestone in the raw meal acts as a natural dry scrubber that
-4shy
captures many potential pollutants Sulfur dioxide (SO2) emissions from a cement manufacturing plant are dependent upon the sulfur content of the raw materials and fuels used If a raw material or fuel with little or no sulfur content is used within a kiln then there will be little or no SO2 emissions If there is a high sulfur content within the raw meal then the sulphide and organically combined sulphur will combust in the preheating stage the majority of SO2 formed is scrubbed out by the raw meal and only a small portion may be emitted to the atmosphere7
Other emissions from fuel combustion include nitrogen oxides (NOx) and carbon monoxide (CO) NOx is produced during combustion due to the elevated temperatures in the kiln and to the presence of nitrogen in the airfuel mixture The temperatures at the firing end of the kiln approach 1870degC (3400degF) NOx is produced in this environment due to the reaction of nitrogen in air with excess oxygen The amount of NOx produced is dependent upon the temperature and the amount of oxygen present The higher the temperature or higher excess oxygen used in the kiln the higher the resultant NOx emissions will be CO can result from poor solid-fuel feed systems in which sub-stoichiometric combustion will produce CO8 However the high temperature and long residence time associated with kiln operations provide little opportunity for CO emissions to occur
The energy consumed for concrete production is associated mainly with three operations quarrying fine and course aggregates mixing and blending cement aggregates and admixtures and transporting the concrete mix to the work site The energy associated with concrete production is about 193 of the total energy associated with all quarrying cement manufacturing and concrete production
CO2 emissions associated with concrete production results from quarrying blending and transportation Emissions from concrete account for 109 of the CO2 emissions associated with both cement manufacturing and concrete production (Table 1) CO2 emissions for concrete relative to energy input are smaller than for cement manufacturing which produces CO2 from both reaction chemistry and fuel use
-5shy
The US Cement Industry
The US Cement Industry produced 89000000 metric tons (tonnes) of building cement in 20029 The total value of cement plant sales was about $86 billion2 US cement industry plants directly employ about 16400 workers The United States ranks third in the world in overall cement output behind China and India Cement production worldwide is about 1700000000 tonnes10
Building cements accounts for about 95 of the cement sold in North America This was used in the production of more than $40 billion of concrete
Table 2 - 2001 US Cement Industry
Number of Companies 39
Number of Plants 118
Number of Kilns 192
Number of States with Plants 38
Largest Company Market Share (tonnes)
131
Source US Cement Industry Fact Sheet 2003 edition Portland Cement Association in the United States in 20012 Masonry cement
accounts for the remaining 5 of cement sales in the United States Masonry cement is a combination of building cement and 30 to 50 limestone It is used as mortar for blocks bricks stucco and other building projects
Cement manufacturing is a highly capital-intensive industry requiring large-scale equipment to be economically competitive The capital investment per worker in the cement industry is among the highest in all industries The high capital intensity limits the financial incentive to build new plants or update old plants There are 118 cement facilities that operate 192 kilns in the United States (Diagram 1) Over 45 of US kilns were built before1980 and 5 of operating kilns were built prior to 195511 The US cement industry currently operates at an average 80 kiln utilization rate12
The industry is diverse involving 39 companies with no single company controlling more than 131 of the market based on tonnes produced The five largest companies control nearly 50 of the market Roughly 80 of the cement production capacity in the United States has foreign ownership or affiliation Based on plant capacity the top six countries with US plant ownership are France (145) Mexico (144) Switzerland (143) Germany (138) Italy (96) and Japan (54) These countries each have two corporations present in the United States except for Switzerland which has only one The top six
Diagram 1 - US Kiln Locations
Source Portland Cement Association
-6shy
companies in terms of US capacity are Holcim Ltd (Switzerland - 131) Lafarge Coppee (France - 127) CEMEX SA de CV (Mexico - 122) Heidelberger Zement AG (Germany - 825) Ash Grove Cement Co (United States - 65) and Buzzi UNICEM SpA (Italy shy44)
The cement industry has reduced the amount of energy needed in cement production by more than 33 since the early 1970s (Appendix A Table A9) Cement manufacturers achieved greater energy efficiency by closing small plants and modernizing others Energy savings were primarily achieved by shifting from the energy-intensive wet manufacturing process to the dry manufacturing process Wet processing plants use water in raw meal grinding operations This water must be evaporated in the pyroprocessing area In 1974 234 cement kilns used the wet process currently only 54 wet process cement kilns are in operation Cement plants have also reduced energy consumption and costs by taking advantage of excess heat from pyroprocessing to preheat the raw meal before it enters the kiln
Pyroprocessing energy costs are significant and cement manufacturers attempt to utilize the lowest-cost energy supplies to reach the high temperatures required Many cement plants routinely burn a mix of fuels in order to minimize energy costs They are able to switch among a variety of conventional fuels and alternate waste fuels
Table 3 shows the significant shift in fuel sources over the past thirty years Cement manufacturers have switched from natural gas and petroleum based fuels to coal and petroleum coke for pyroprocessing This switch was initially a result of federal legislation in response to the ldquo1973 Energy Crisisrdquo The Energy Supply and Environmental Coordination Act of 1974 (ESECA Public Law 93-319) compelled ldquoMajor Fuel Burning Installationsrdquo to stop burning natural gas and petroleum and to burn coal The Powerplant and Industrial Fuel Use Act of 1978 (Public Law 95-620) required Congressional approval and a waiver from the Department of Energy for the use of fuels other than coal in heating plants over 50 x 106 Btuhr In 1987 Public Law 100-42 amended the Powerplant and
Table 3 - On-site Fuel Consumption for Cement Manufacturing (excluding Quarrying)
1971 2000 Btutonne Percent Btutonne Percent
CONVENTIONAL FUELS Coal 2639000 36 2984100 60
Petroleum Coke 39600 1 760700 15 Natural Gas 3347100 45 261600 5 Middle Distillates 88300 1 39400 1 Residual Oil 808900 11 3900 0 Gasoline 7400 0 4600 0 LPG 1400 0 300 0
ALTERNATEWASTE FUELS Oils 0 15000 0 Solvents 0 251900 5 Tires 0 115400 2 Solids 0 12600 0 Misc 0 7600 0
FUELS Subtotal 6931700 93 4457100 90 ELECTRICITY 488600 7 524700 11
TOTAL 7420400 100 4981700 100 Source Cement Industry Fact Sheet 2002 edition
Portland Cement Association
-7shy
Industrial Fuel Use Act to repeal prohibitions against the use of natural gas and petroleum Fuel switching is costly in terms of capital costs and todayrsquos lower costBtu of coal compared to petroleum or natural gas economically favor coal as the fuel of choice
The switch from petroleum and natural gas results in an increase in CO2 fuel emissions per Btu consumed Coal produces about 18 times more CO2 than natural gas and about 12 times more than residual oils on a Btu basis Overall the industry has lowered their CO2 emission by 15 between 1971 and 2000 This was accomplished with improvements in energy efficiency that produced a reduction in the Btutonne requirement for production of cement by over 33 If year 2000 plants were operating on the 1971 fuel mix emissions would have been lowered by 21 (Appendix A Table A9)
Kilns are ideally suited to recycling alternatewastes for recovering their energy value because of the intense heat of pyroprocessing The cement industry has steadily increased its use of waste materials to fuel cement kilns and currently relies on the combustion of waste materials for 82 of its energy needs Cement plants can burn many household and industrial wastes including waste solvents scrap tires used motor oils surplus printing inks dry-cleaning solvents paint thinners petroleum sludge and agricultural wastes such as almond shells and rice hulls
Nearly all cement is used to produce concrete Ready Mixed Concrete concrete mixed at local plants for delivery in the familiar trucks with revolving tanks accounts for over 75 of all concrete production Concrete masonry (eg 8 x 16 inch blocks) and precast concrete products account for 13 contractor (on-site concrete mixing) accounts for 6 and the remaining 6 of concrete production is used in well lining mining operations and other activities13 The United States has about 2700 ready mixed concrete companies that operate 5000 to 6000 plants and utilize 70000 to 80000 trucks for delivery Ready mixed companies employ between 126000 and 144000 workers They supplied more than 390646000 cubic yards of concrete in 2002 enough to build a road ten feet wide four inches thick that encircles the globe 51 times14
-8shy
Cement
Cement is the key ingredient in concrete products Comprising roughly 12 of the average residential-grade ready mixed concrete cement is the binding agent that holds sand and other aggregates together in a hard rock-like mass Building cement or portland cement accounts for about 95 of the cement produced in North America Portland cement was patented in 1824 by Joseph Aspdin an English stonemason and named after a quarried stone it resembled from the Isle of Portland
The properties of concrete depend on the quantities and qualities of its components Because cement is the most active component of concrete and usually has the greatest unit cost its selection and proper use are of paramount importance in obtaining the most economical balance of properties desired for any particular concrete mixture Different types of portland cement are manufactured to meet different physical and chemical requirements for specific purposes such as durability and high-early strength
The American Society for Testing and Materials (ASTM) Specification C-150 provides for eight types of portland cement (Appendix B) ASTM standards serve as the basis for manufacturing procurement and regulatory activities In 2001 more than 88 of the portland cement produced in the United States was ASTM Type I and II (or Type III) Type III accounted for about 35 and Type V accounted for 44 of cement production15 Air-entraining cements Type IA IIA and IIIA are available but have little market share Concrete producers prefer to use admixture for air-entraining during concrete production where they can have better control in obtaining the desired air content
The chemical composition of cement is what distinguishes one type from another Portland cements are made up of clinker and gypsum (CaSO4bull2H2O) The four main compounds in clinker are tricalcium silicate (3CaObullSiO2) dicalcium silicate (2CaObullSiO2) tricalcium aluminate (3CaObullAl2O3) and tetra-calcium aluminoferrite (4CaObullAl2O3bullFe2O3) The industry commonly uses an abbreviated notation differing from normal chemical formulae These compounds are designated as C3S C2S C3A and C4AF where C stands for calcium oxide (CaO lime) S for silica (SiO2) A for alumina (Al2O3) and F for iron oxide (Fe2O3) The approximate composition of compounds in typical portland cement is listed in Table 4
Table 4 - Final Composition of Typical Portland Cement
Cement Compound
Tricalcium silicate Dicalcium silicate
Weight Percentag
50 25
e Chemical Formula
Ca3SiO5 or 3CaObullSiO2
Ca2SiO4 or 2CaObullSiO2
Abbreviated Notation
C3S C2S
Tricalcium aluminate 10 Ca3Al2O6 or 3CaO bullAl2O3 C3A Tetracalcium aluminoferrite 10 Ca4Al2Fe2O10 or 4CaObullAl2O3bullFe2O3 C4AF Gypsum 5 CaSO4bull2H2O
-9shy
The industry frequently reports the composition of cement as a percentage of the raw materials and not as a percentage of the final compounds formed The composition of portland cement falls within the range of 60 to 67 lime (CaO) 19 to 25 silica (Si) 3 to 8 alumina (Al2O3) and 03 to 6 iron oxide together with 1 to 3 sulphur trioxide derived mainly from the added gypsum 05 to 5 magnesia and 03 to 13 alkalies Titanium oxide is usually present to the extent of 01 to 04 Manganese oxide is usually present only in small amounts except when blast-furnace slag is used as a raw material then it may rise to 1
The proportions of components in the final composition results from obtaining a phase equilibrium of all components in the raw meal ash from fuels and from other additions The final compounds reflect the effects of kiln temperatures residence time quenching oxygen availability and many other kiln conditions The actual final components are complex chemical crystalline and amorphous structures Diagram 2 is a phase diagram of the major raw meal pyroprocess products16 About 20 to 30 of the raw materials become liquid at the highest temperatures in the kiln Portland cement composition is noted in one small area Complex reactions and phase changes occur at the surfaces of the
Diagram 2 - Phase Diagram of Major Cement Components14
solids and within the liquid The behavior of each type of cement depends on the mixture of final components
-10shy
CEMENT MANUFACTURING PROCESS
Cement manufacturing requires exacting measurements and careful controls to produce a product that meets precise chemical and physical specifications The first step in the cement manufacturing process is the quarrying of a combination of raw materials (Appendix A - Table A3) that when sized blended and processed yield the exact chemical composition required These raw materials then undergo a series of high temperature chemical reactions and physical changes after which they are ground into a very fine carefully sized powder
Quarrying
Generally cement raw materials consisting of mainly limestone (71) and combinations of cement rock (16) shale clay sand or iron ore are extracted from a quarry near the cement plant Limestone and cement rock are the most
Diagram 3 - Quarrying for Cement Limestone
common source of CaCO3 for cement production making up about 87 of the raw materials (Appendix A - Table A3) Typically the limestone used in cement production contains 75 to 90 CaCO3 with the remainder predominately MgCO3 and minor impurities Limestone is typically categorized as high-calcium (lt5 MgCO3) magnesium-limestone (5 to 20 MgCO3) or dolomitic-limestone (gt20 to lt456 MgCO3) Cement rock is impure limestone possessing the ideal balance of silica alumina and CaCO3 for portland cement17
A typical limestonecement rock quarrying process for producing crushed and broken stone includes bull removal of the overburden (ie soil clay and loose rock overlaying the deposit) bull blasting of the limestone deposit bull loading and transporting the blasted limestone to the crushing plant bull Crushing to reduce stone to about 5 inches (125 mm) in primary crushers then to roughly
38 inch to 34 inch (10 mm to19 mm) in secondary crushers
The total energy required to quarry and process limestonecement rock is 29932 Btutonne The quarrying of the limestonecement rock consumes approximately 88 of the total energy requirement and the crushing of the ore accounts for the remaining 12 of the energy requirement18 Table 5 provides a detailed listing of the equipment used and the Btu per tonne consumed for each equipment operation19 Appendix A Table A5 lists quarrying fuels and consumption values In the quarrying of the limestonecement rock diesel fuel is the main source of energy and provides about 80 of the quarrying operations energy Diesel fuel is used to run the heavy machinery in the limestone quarryrsquos daily operation Utilization of biodiesel provides an opportunity for quarrying operations to lower lifecycle emission profiles
-11shy
Primary crushing reduces quarried stone to about 5 inches Primary crushed stone is fed into secondary crushers where it is broken down to a size (-0375 to -075 inch) suitable for feed to the fine grinding machines located at the cement manufacturing plant Crushing consumes an estimated 2927 Btutonne of limestone
Limestonecement rock account for 87 of the raw materials used to produce cement The energy and emissions associated with quarrying of the remaining 13 of raw materials has been estimated using the limestonecement rock data (Appendix A Table A6)
The environmental issues related to quarrying are mostly local and are common to most surface mines These issues include dust increased sediment loads to local streams noise and ground vibrations from blasting
Raw Material Preparation
When raw materials arrive at the cement plant they are stored in dry sheds or silos These materials are then carefully proportioned accounting for combustion fuel ash and other additives to create a cement with a specific chemical composition Two different methods dry-process and wet-process are used to grind raw materials In the dry-process raw materials are proportioned ground to a powder blended together and fed to the kiln in a dry state In the wet-process a slurry is formed by adding water to the properly proportioned raw materials The grinding and blending operations are then completed with the materials in slurry form This significantly lowers dust levels but requires additional energy to later remove the water from the raw meal
Limestone -0375 inch to -075 inch in size is blended with other raw materials (Appendix A Table A3) and fed into grinding mills where it is reduced in size until approximately 70 to 85 passes a 200-mesh screen (00027 inch 0069 mm screen opening) Raw meal grinding equipment
Table 5 - Energy Consumption for Surface Limestone Quarrying
Btu Tonne
On-site Operations
QUARRYING Percussion Drill 6140
Hydraulic Shovel 5670 Rear-Dump Truck 4030
Bulldozer 3420 Pick-Up Trucks 2250
Water Tanker 1170 Service Truck 1120 Lighting Plant 66
Front-End Loader 187 Bulk Truck 147
Pumps 2250 Grader 7
subtotal 26457 CRUSHING
Conveyor 182 Screens 366
Primary Crushers 1830 Secondary Crushers 1097
subtotal 3475 TOTAL 29932
Source US Department of Energy Mining Industry of the Future Energy and Environmental Profile of the US Mining Industry pg 9-9
Diagram 4 - Raw Material Preparation
-12shy
includes ball mills tube mills compound mills ring roll mills and impact mills Raw meal grinding has a significant effect on pyroprocessing and clinker quality The raw meal quality (fineness the amount and nature of oversized particles) and flowability (kiln circulating and separation patterns and conductive energy transfer) affect the final clinker quality
Raw material grinding consumes about 2 of the on-site energy associated with cement manufacturing Grinding and milling are electrically driven processes In addition to the electricity consumed on-site electric processes have large tacit energy requirements associated with the generation and transmission of electricity Grinding raw materials for cement manufacturing consumes approximately 93885 (273235t) Btutonne of cement (Appendix A Table A11) Grinding energy is a function of numerous factors including how the material fractures (under slow pressure under impact) compressive strength coefficient of elasticity hardness starting and finish size desired particle distribution etc The exact amount of work required for grinding is difficult to calculate Grinding efficiency ranges from 6 to 25 based on the thermal measurements20 Since grinding consumes electricity a costly energy source cement manufacturers work to improve grinding efficiency On-site grinding efficiency improvements provide significant offsite energy savings related to electric generation and transmission losses
Kiln Operations
Pyroprocessing in giant rotating furnaces or kilns represent the major technical process common to all cement plants It is also the most technically complex and energy-intensive operation from quarrying to concrete placement Rotary cement kilns are cylindrical refractory-lined steel furnaces that range from 200 to more than 1000 feet long and from 10 to over 25 feet in diameter Cement kilns are the worldrsquos largest piece of moving industrial process equipment shyand one of the hottest
Blended raw material is fed into the upper end of the tilted rotating kiln As the kiln slowly rotates (1 to 4 revolutions per minute) the raw material tumbles through progressively hotter zones toward the flame at the lower end of the kiln The mixture passes at a rate controlled by the diameter and rotational speed of the kiln The flame is fueled by powdered coal petroleum coke natural gas oil recycled materials or other fuels A 1870degC (3400degF) flame heats the mixture to 1480degC (2700degF) The extreme heat triggers a series of chemical reactions The raw materials break down (calcine) become partially molten and fuse together into nodules called clinker
Diagram 5 - Preheater Precalciner Kiln
-13shy
The raw meal undergoes complex chemical and physical changes as it tumbles then flows through the kiln These chemical reactions and changes can be viewed as a sequence of thermal events some of which may occur outside the kiln in a preheater andor precalciner section The following describes the sequence of chemical and physical changes
bull Evaporation of uncombined water from raw material preparation in the wet process as material temperature increases to 100C (212F)
bull Dehydration the evolution of bound water from the material as temperatures increase from 100C to approximately 550C (1020F) to form the unhydrated oxides of silicon aluminum and iron
bull Calcination of the calcium carbonate (CaCO3) to calcium oxide (CaO) and magnesium carbonate (MgCO3) to magnesium oxide (MgO) with the evolution of carbon dioxide (CO2) between 900C (1650F) and 980C (1800F) The CO2 gas fluidizes the raw materials which changes raw material movement from tumbling to flowing
bull Reaction of CaO with silica to form dicalcium silicate bull Reaction of CaO with the aluminum and iron-bearing constituents to form
the liquid molten phase bull Formation of the clinker nodules Reactions bonding the calcium oxide
and silica oxide to form dicalcium and tricalcium silicates and small amounts of tricalcium aluminate and tetracalcium aluminoferrite These compounds form the four principal components that determine the properties of the cement manufactured
bull Evaporation of volatile constituents (eg sodium potassium chlorides and sulfates)
bull Reaction of excess CaO with dicalcium silicate to form tricalcium silicate bull Formation of clinker as material approaches the exit of the kiln at
temperatures of approximately 1500C (2700F)
Clinker is discharged red-hot from the lower end of the kiln and transferred to various types of coolers to recover thermal energy and lower the clinker to handling temperatures Clinker when cooled is typically gray glass-hard spherically shaped nodules that range from 03 to 50 centimeters (0125 to 20 inches) in diameter
Kilns are divided into two groups dry-process (805 of US capacity) and wet-process depending on how the raw materials were prepared Wet-process kilns are fed raw material as a slurry with a moisture content of 30 to 40 A wet-process kiln needs additional length to evaporate the water contained in the raw material feed Nearly 33 additional kiln energy is consumed in evaporating the slurry water Wet-process kilns tend to be older fully capitalized operations The last wet-process kiln to be built in the United States was constructed in 1975
Dry-process kilns are fed dry powder raw materials Three major variations of dry-process kilns are in operation no-preheater kiln preheater kiln and precalciner kiln Dry-process kilns operate with high exiting gas temperatures In most dry-process no-preheater
-14shy
operations the kiln is equipped with metal chain sections at the gas exit end These chains hang from the refractories in the gas path The gases pass through the chains which absorb heat from the gas stream As the kiln rotates the chains intermix and become covered by the feed raw materials at the bottom of the kiln The chains transfer their thermal energy by conduction to the raw material entering the kiln
Most dry process plants preheat the finely ground raw material before it enters the kiln The preheating takes place typically in a tall tower consisting of multistage countercurrentshyflow cyclones Diagram 6 These towers can be over 450 feet tall Multiple solidgas cyclone heat exchangers swirl the raw materials with the hot exit gases from the kiln and heat them quickly and efficiently Some preheater towers include a special preheater section which contains a fuel combustion chamber These sections provide some of the precalciner energy and are referred to as precalciner
Diagram 6 - Preheater Precalciner Section
Today the most common type of cement kiln (accounting for 80 of capacity in the United States) is a dry-process kiln in which the raw meal is processed dry Many older kilns (20) still in operation use the wet-process Table 6 provides an inventory of US cement kilns Each kiln wet-process and the three versions of dry-process operate with a different energy efficiency The theoretical energy requirement for pyroprocessing (ie the minimum energy required to remove hydrated water calcine and raise the temperature to obtain the phases necessary for cement clinker) is about 1710000 Btutonne of clinker21 The thermal efficiencies for various kiln processes are also shown in Table 6 On average pyroprocessing operations run at about 34 thermal efficiency This leaves ample opportunities to improve thermal performance The last chapter of this report Opportunities for Improving Energy Efficiency and Reducing CO2 Emissions and in particular Table 9 examines the thermal balance of the kiln and kiln losses and suggests where efficiency improvement could have a major impact
-15shy
Table 6 - Approximate Energy Consumption in US Kilns by Number and Process
US Kilns1
Percent of Kilns
2000 Clinker Production
tonnes
Percent of US
Capacity
Million Btu per tonne 3
Percent Thermal
Efficiency
Total US Kilns 192 100 71860000 2
100 498 34
Wet Process Kiln Plants 54 284 14030000 2
195 625 27
Dry Process Kiln Plants 136 716 57830000 2
805 467 37
No Preheater or Precalciner 59 311 12950000 2
180 564 30
Preheater (only) 35 184 13830000 2
192 458 37
Precalciner 42 221 31050000 2
432 431 40
PreheaterPrecalciner 4 77 405 44880000 2
624 439 39
1 - Kiln process types were provided by the Portland Cement Association Two kilns were not classified and are not listed as wet or dry process kilns These data represent approximately 92 of US clinker production and about 93 of US kilns (Appendix A Table A1) 2 - 2000 US and Canadian Labor-Energy Input Survey Portland Cement Association pages 12-27 3 - 2000 US and Canadian Labor-Energy Input Survey Portland Cement Association page 7 4 - Includes plants that are preheater only precalciner only and combinations
Clinker Cooling
Red-hot clinker tumbles from the kiln onto a grate and is cooled by recirculating air The hot air recovered from this cooling process is recycled back to the kiln or preheater system to recover its thermal energy After energy is recovered from the process gases the gases are routed to pollution control devices Electrostatic precipitators or fabric filters remove particulate matter (dust) from the gases before they are discharged to the atmosphere Particulate removal efficiencies of 997 are common throughout the industry
Cement Milling
Cooled clinker is combined with approximately 3 to 6 gypsum and groundmilled into an extremely fine gray powder This fine gray powder is cement Gypsum is used to control the setting time of concrete
Finish milling usually uses tube or ball mill equipment Clinker is milled so finely
Diagram 7 - Clinker and Gypsum Milling
-16shy
that nearly all of it passes through a 200 mesh (00027 inch 0069 mm) screen that will hold water The final powder has a surface area of 3000 to 5000 cm2g and about 85 to 95 of the powder will pass through a 325-mesh screen (00017 inch 0043 mm) The fineness of the cement is an important property and affects the rate of hydration The finer the milled cement the more surface area is available for hydration The greater area for hydration causes greater early strength and more rapid generation of heat Cements are classified by their fineness with Type III containing a more finely milled cement than Type I cement
Clinker milling uses the same general type of equipment as raw meal grinding However the final product is much finer and requires almost three times the energy 270610 (778043t) Btutonne of cement as raw meal grinding requires (Appendix A Table A11) Clinker milling is not energy efficient and typical cement milling systems can consume nearly twenty times their theoretical energy requirement22 After milling portland cement is ready to be bagged or shipped in bulk by truck or rail to concrete producers
Storage and Dispatch
Cement is stored at the cement manufacturing facility or a cement terminal until it is shipped to a customer Storage of bulk cement is in watertight bins or silos About 40 of manufactured cement is shipped by rail and barge to directly to terminals Direct customer shipments are predominately made by truck All transportation vehicles should be equipped with watertight properly sealed compartments Cement is very moisture-sensitive and must be stored in a dry environment When kept dry it will retain its quality indefinitely If stored in contact with damp air or moisture cement will set more slowly and have lower concrete strength than dry cement Cement stored for long periods of time should undergo standardized tests for strength and loss on ignition before use
-17shy
Concrete Concrete is produced by mixing
cement with fine aggregate (sand) coarse aggregate (gravel or crushed stone) and water Small amounts of chemicals called admixtures are frequently added to the concrete mix to control setting time and
Diagram 8 - Concrete Production
plasticity A properly designed concrete mixture will possess the desired workability for the fresh concrete and the required durability and strength for the hardened concrete Typically a concrete mix is by volume about 10 to 15 cement 60 to 75 aggregates and 15 to 20 water Entrained air bubbles in many concrete mixtures may also take up another 5 to 8 of the volume Table 7 shows a typical weight percent mix The character of concrete is determined by the quality of the cement and the mix ratios Higher-quality concrete is produced by lowering the water-cement ratio as much as possible without sacrificing the workability of fresh concrete
When water is added to the concrete mix it combines with the cement to form a slurry or gel that coats the surfaces of the aggregate and fills the voids of the concrete mix The water and cement compounds undergo hydration reactions that slowly form the complex hydrated microstructure that sets the concrete and makes it solid These reactions continue after the concrete is set and
Table 7 - Typical Concrete Mixare not complete for months (and even years) after Component Weight placement The microstructure of the cement hydrates
Portland cement 12determine the mechanical behavior and durability of the Sand 34concrete Crushed stone 48
Water 6The strength developed in concrete depends on Source National Ready Mix Concreteits composition and the fineness to which the cement is Association
ground Cements high in C3S (3CaObullSiO2) especially those that are finely ground will hydrate more rapidly and lead to higher early strength However rapid hydration can lead to a lower final strength C3S is mainly responsible for the strength developed in the first week of hardening Cements high in C2S (2CaObullSiO2) will hydrate much more slowly leading to a denser structure with higher long-term strength The alumina and iron compounds in cement make little contribution to final strength
Concrete can deteriorate from attack by some natural or artificial chemicals The alumina compound C3A (3CaObullAl2O3) is the most vulnerable to chemical attack in damp soils containing sulphate salts or in seawater while the iron compound C4AF (4CaObullAl2O3bullFe2O3) and the two calcium silicates (C3S and C2S) are more resistant
Cement liberates heat when it hydrates Consequently concrete placed in large masses as in dams can cause the temperature inside the mass to rise as much as 72degF (40degC) above the outside temperature Subsequent thermal stresses when cooling cause cracking in the concrete
-18shy
structure The highest heat of hydration is shown by C3A followed in descending order by C3S C4AF and C2S
Ready mixed concrete consisting of cement aggregates water and admixtures mixed at local plants for delivery to a work site by truck accounts for over 75 of all concrete production Concrete masonry (eg 8 x 16 inch blocks) and other precast concrete products (eg pipes) account for 13 contractor (on-site concrete mixing) accounts for 6 and the remaining 6 of concrete production is used in well lining mining operations and other activities
Ready mixed facilities store convey measure and discharge cement aggregates and admixtures into trucks for transport to a job site These facilities typically receive raw materials by rail truck or barge Cement is transferred and stored in elevated dry-storage silos Sand and coarse aggregate are stored and transferred to elevated bins as needed The raw materials are typically fed by gravity into weigh hoppers where they are proportioned in the exact amounts specified for the concrete mix Approximately 75 of ready mixed concrete is ldquotransit mixedrdquo Transit mix trucks are loaded with sand aggregate cement and water by gravity from weigh hoppers The materials are mixed and blended in a rotating truck mounted drum while being transported to a work site About 25 of the ready mixed concrete is blended at the ready mixed facility The premixed and blended concrete is placed in open bed dump or agitator trucks for transport to a work site Dry batching with concrete mixed and hauled to the construction site dry is uncommon
The water sand and gravel or crushed stone used in ready mixed concrete production are abundant and usually sourced as close to the ready mixed plant as possible The distance and quality of the sources have an impact on transportation energy use (costs) water use for washing and dust generation The energy consumed for ready mixed concrete production are associated mostly with three operations (Appendix A Table A13)
bull Quarrying (fine and course aggregates) 160700 Btutonne cement bull Mixing and blending (cement aggregates and admixtures) 353700 Btutonne cement bull Transporting the concrete mix to the work site 697300 Btutonne cement
Ready mixed concrete production from US manufactured cement is estimated to have consumed about 1177 x 1012 Btu in 2001 approximately 1211700 Btutonne of cement (Appendix A Table A13)
Concrete block pipe and other precast products follow the same production steps (quarrying and blending) as ready mixed concrete but are cast at a manufacturing site and then transported to the work site Hence the total energy requirement for precast product is similar to ready mixed The difference between the two products is location of where the concrete sets Likewise contractor well-lining concrete operations and mining concrete all transport quarried aggregates and then blend on the work site These operations result in overall energy use and emissions similar to ready mixed concrete For simplicity this report uses the ready mixed energy use and emissions data to calculate values for all industrial concrete products Hence in
-19shy
total the quarrying mixing and transportation operations account for 26 (143 x 1012 Btuyr) 57 (314 x 1012 Btuyr) and 112 (620 x 1012 Btuyr) respectively of the on-site energy use for all cement and concrete (Appendix A Table A10)
CO2 emissions associated with concrete production can be calculated based on the fuels used The three major concrete operations quarrying blending and transportation account for 12 54 and 43 respectively a total of 109 of the CO2 emissions associated with both cement manufacturing and concrete production (Appendix A Table A10) CO2 emissions for concrete relative to energy usage are smaller than for cement manufacturing which produces CO2 from both reaction chemistry and fuel use
-20shy
Opportunities for Improving Energy Efficiency and Reducing CO2 Emissions
Many opportunities exist for improving energy efficiency and reducing CO2 emissions in the cementconcrete industry These opportunities come from both changes in the manufacturing and production processes and from changes in the chemical formulation of cement Process changes range from energy management improvements to investments in equipment upgrades or new technologies Formulation changes have been demonstrated to save energy and reduce emissions but their widespread adoption is slowed by the burdens of developing new industrial standards
The largest opportunities for improving energy efficiency and reducing CO2 emissions related to energy inputs in the cementconcrete industry are mostly related to cement manufacturing Table 8 lists the annual energy use and emissions associated with cementconcrete industry Pyroprocessing accounts for 74 of the cementconcrete industriesrsquo energy consumption (93 of cementrsquos manufacturing energy requirement) and operates at roughly 34 thermal efficiency This low thermal efficiency provides many opportunities to improve performance If it were possible to operate at the theoretical minimum energy requirements to produce clinker nearly 400 x 1012 Btu per year (04 quad) in energy savings could be obtained Realistic and cost-effective energy savings are smaller but achievable
Grinding and milling account for 58 (123t) of cementconcrete energy consumption These operations consume electricity and have energy efficiency ranging from 6 to 25 They offer a large opportunity for energy reduction considering that each kWh saved on-site saves nearly 3 kWh of tacit energy at the electric generation site
The potential opportunities for improving energy efficiency and lower emissions in quarrying and concrete production are smaller in terms of Btu and CO2 emissions than in cement manufacturing Quarrying and
-21shy
Table 8 - Annual Energy Use and CO2 Emissions Associated with Cement and Concrete Production
On-site Energy CO2 Emissions
109 Btu 106 tonne
RAW MATERIALS QUARRYING and CRUSHING
Cement Materials 3817 07 036 03
Concrete Materials 14287 26 128 12
CEMENT MANUFACTURING
Raw Grinding 8346 15 150 14
Kiln fuels 410464 740 3847 368
reactions 4835 463
Finish Milling 24057 43 432 41
CONCRETE PRODUCTION
Blending Mixing 31444 57 565 54
Transportation 61933 112 453 43
TOTAL 554409 100 10450 100 See Appendix A Table A10
transportation related to concrete production consume significant quantities of diesel fuel approximately 74 x 1012 Btuyear ( 550 x 106gallons) Replacement of diesel fuel with biodiesel offers an opportunity to effectively lower lifecycle emission profiles Biodiesel is a renewable energy fuel source typically containing the mono alkyl esters of long-chain fatty acids derived from vegetable oils (commonly soybean oil) or animal fats It can be blended at any level with petroleum diesel to create a biodiesel blend and can be used in compression-ignition (diesel) engines with little or no modifications It has lower emissions compared to petroleum diesel is less toxic than table salt and bio-degrades as rapidly as sugar Total US production of biodiesel was 254 x 106 gallons in 200123 Total US production represent only 46 of the diesel fuel requirement of the cementconcrete industry Hence biodiesel availability will limit the opportunity to substitute for petroleum based diesel fuel
Normally energy efficiency improvements proportionally reduce the emissions of CO2 generated from fossil fuel combustion and electricity generation However reducing cement manufacturing CO2 emissions by a percentage proportional to energy efficiency improvements is not possible More than half of the CO2 emissions associated with cementconcrete are a result of the chemical reactions necessary for converting raw materials and not a result of the energy required to produce these reactions If a near-zero CO2 emitting fuel (eg nuclear biomass) were utilized for all pyroprocessing energy needs then CO2 emissions could be reduced by 54 from approximately 104 x 106 tonnesyr to 48 x 106 tonnesyr It is also possible to reduce reaction CO2 emissions by changing the product formulation with the substitution of raw materials which provide cement-like properties
The opportunities for reducing energy usage and lowering environmental impact are described in the Pyroprocessing and Product Formulations sections below Briefly these improvements will come from
bull Managing energy more efficiently lt performing energy assessmentaudits utilizing energy
management training and implementations programs bull Upgrading existing equipment
lt shifting to more energy-efficient processes (eg from wet to dry process from dry process to preheater)
lt installing improved heat recovery systems from clinker coolers lt installing new design high-efficiency crushing grinding and
milling equipment bull Adopting new pyroprocessing technologies bull Performing the RampD necessary to develop new cement manufacturing
processes bull Utilizing biomass fuels bull Utilizing waste fuels bull Replacing high-carbon fuels by low-carbon fuels (eg shifting from coal
to natural gas) (This lowers CO2 emissions however at current fuel prices it increases operating costs)
-22shy
bull Changing cement product formulations applying a lower clinker to final cement mixture ratio (ie increasing the ratio of cement additives that do not require pyroprocessing)
bull Utilizing alternative cements (mineral polymers) bull Sequestering CO2 from the gas streams
Cement manufacturing is a highly capital intensive and competitive industry This fact combined with the long economic life of existing facilities will constrain the rate of upgrading exiting technology or adopting new technology The near-term energy and emission-reduction opportunities will mainly come from better energy management practices changes to ldquogreenerrdquo fuels and to a smaller degree changes in product formulation
-23shy
PYROPROCESSING OPPORTUNITIES
The greatest opportunities in reducing energy consumption and lowering emissions associated with cementconcrete will be obtained with improvements in cement pyroprocessing On average pyroprocessing systems in the United States operate at about 34 thermal efficiency This low efficiency implies that there are potentially significant process and system improvements to improve energy and environmental performance These process improvements will come from better energy management upgrading existing equipment (eg replacing wet kilns upgrading to preheater and precalciners) adopting new pyroprocessing technologies (eg fluidized bed systems) and in the longer term performing the RampD necessary to develop completely new concepts for the cement manufacturing processes
The typical energy balances for the major pyroprocessing systems are shown in Table 9 These balances show where energy losses occur (areas where no useful work is accomplished) Any area other than the theoretical requirement that is losing energy represents an
Table 9 - Thermal Energy Balances to Produce Clinker in Process Kilns
Wet Kiln Dry Kiln Preheater Kiln
Energy Use Area Btutonne Percent Btutonne Percent Btutonne Percent
Theoretical Requirement 1690000 305 1730000 366 1670000 496
Exit Gas Losses 713000 129 1310000 277 471000 138
Evaporation of Moisture 2120000 383 285000 60 223000 65
Dust in Exit Gas 10700 02 12300 03 1220 0
Clinker Discharge 53700 10 58000 12 62400 18
Clinker Stack 180000 33 560000 118 582000 184
Kiln Shell 642000 116 575000 121 166000 49
Calcination of Waste Dust
38600 07 17500 04 5870 0
Unaccounted Losses 84300 15 182000 38 164000 48
TOTAL 5536000 100 4734000 100 3424000 100
Source The Rotary Cement Kiln Kurt E Perry Chemical Publishing Co Inc New York page 107-111
opportunity for improving energy efficiency and lowering fuel-based emissions The large energy efficiency difference between cement processes from 5536000 Btutonne of clinker for wet process to 3424000 Btutonne of clinker for dry process with preheater shows the significant gains that can be made by upgrading to the more efficient process The individual energy use areas (eg clinker discharge kiln shell etc) in Table 9 show the area and the magnitude of the opportunities available from managing energy losses by improving specific
-24shy
equipment or practices
Pyroprocessing Energy Audits
Energy audits including kiln system performance testing and calculation of mass and heat balances are the most comprehensive approaches to improving an existing systems energy efficiency These audits can identify specific opportunities for improving energy efficiency and lowering CO2 emissions A cement manufacturing energy audit should at a minimum address the energy use areas identified in Table 9 and recommend potential actions Typically the following actions will improve energy efficiency
lt Lower kiln exit gas losses bull install devices to provide better conductive heat transfer from the
gases to the materials (eg kiln chains) bull operate at optimal oxygen levels (control combustion air input) bull optimize burner flame shape and temperature bull improve or add additional preheater capacity
lt Lower moisture absorption opportunities for raw meal and fuels (avoiding the need to evaporate adsorbed water)
lt Lower dust in exhaust gases by minimizing gas turbulence (dust carries energy away from the kiln where it is captured in dust collectors The dust is recycled into the raw meal and fed into the kiln where it is reheated)
lt Lower clinker discharge temperature (retaining more heat within the pyroprocessing system)
lt Lower clinker cooler stack temperature bull recycle excess cooler air bull reclaim cooler air by using it for drying raw materials and fuels or
preheating fuels or air
lt Lower kiln radiation losses by using the correct mix and more energy efficient refractories to control kiln temperature zones
lt Lower cold air leakage bull close unnecessary openings bull provide more energy efficient seals bull operate with as high a primary air temperature as possible
lt Optimize kiln operations to avoid upsets
Upgrading Existing Technology ndash The addition of preheater sections precalcination sections or
-25shy
more efficient clinker coolers would allow less efficient operations to maximize heat recovery The impact of upgrading can be seen by comparing the processes shown in Table 6 If all US plants upgraded pyroprocessing to the technology of the best US plant (a dry process preheater with precalciner system3 ) the industry would lower its energy consumption by approximately 30 to approximately 3230000 Btutonne of cement and lower CO2 emissions by 13 to 753 x 106 tonnesyear
Adopting New Technology ndash Large pilot-scale fluidized-bed kilns (200 tonnesday) have been developed (1996) and have demonstrated significant energy savings It is estimated that a full-scale fluidized-bed (3000 tonnesday) system will consume about 2800000 Btutonne of clinker ndash as efficient as the most advanced US kiln utilizing a preheater and precalciner and 37 more efficient than the average US plant Fluidized-bed systems are estimated to have capital costs equivalent to 88 of the capital costs of a modern cement facility and operating costs equivalent to 75 of a modern cement facilityrsquos operating costs24 They have smaller footprints and their superior combustion characteristics of fluidized beds enable the use of lower-grade lower cost coal
Fluidized-bed systems do not provide ldquoShutdown Economicsrdquo That is their operating and capital costs are not less than the operating costs of older fully capitalized kiln-based plants This slows their adoption by the industry since they are likely to be considered only for future capacity expansion The US cement industry currently operates at an average 80 kiln utilization rate25 Another barrier to adoption is the natural reluctance to invest in the large capital expenditures associated with new plant construction The risks associated with building a new technology commercial-scale plant based on the successful demonstration of a one-tenth scale facility are considered high
Cogeneration ndash Large industrial thermal energy demand offers opportunities for cogeneration of electricity andor steam production particularly if the cogeneration system is part of the initial plant design Cogeneration has demonstrated that it can significantly improve the overall energy efficiency of some manufacturing operations Five cement manufacturing plants cogenerate electricity on-site26 Currently about 38 of US cement capacity does not take advantage of preheater andor precalciner systems These plants typically have large heat losses (waste heat streams) Utilization of waste heat in preheater heat exchange systems is usually more energy efficient than the cogeneration of electricity with its inherently low conversion efficiency of thermal to electrical energy (typically about 9935 Btu are required to produce 1 kWh (3412 Btu)) Cogeneration of steam at a cement plant is possible but typically cement plants require little steam and are located in isolated areas where markets for excess steam generation are not available
Biomass Fuels ndash Trees plants and crops (biomass) incorporate (sequester) CO2 as carbon compounds as they grow On a life-cycle basis where the life-cycle includes both the growth phase and the use phase (combustion) there is a near net-zero emission of CO2 associated with the use of biomass fuels (Net life-cycle emissions are not zero because energy is used to gather increase density reduce moisture deliver and store biomass fuels) Therefore the use of biomass
-26shy
fuels for pyroprocessing can provide energy with low-net CO2 emissions
Cement pyroprocessing is suited to utilizing biomass as an ancillary fuel Careful system design is required to account for biomass combustion characteristics (moisture load flowability burn temperature) and byproducts (ash composition) Biomass fuels do not improve energy efficiency per se however they do replace conventional fuels and lower life-cycle CO2 emissions Burning biomass fuels can offer other indirect benefits
lt US dependence on imported fuels is reduced lt crops grown exclusively for energy production can provide economic
opportunity for underutilized agricultural lands lt energy crops require fewer herbicides and pesticides compared to row
crops and lt chemical runoff into surface water and groundwater is reduced
An additional benefit of burning biomass over fossil fuels is the reduction of sulfur dioxide (SO2) emissions Most forms of biomass contain small amounts of sulfur therefore biomass being burned emits little sulfur dioxide (SO2) For example using biomass for 5 of a coal-fired heat input would reduce SO2 emissions by approximately 5 This benefit may not be fully realized in cement kiln operations Limestone in the cement kilnrsquos raw meal acts as a natural SO2 scrubber resulting in low SO2 emissions Hence biomass fuels will not significantly change the SO2 emissions associated with cement kiln operations
AlternateWaste Fuels ndash Utilization of alternatewaste fuels does not directly improve the energy efficiency or lower the CO2 emissions of cement manufacturing However it does reduce the use of conventional fuels lowers US dependence on imported fuels and reduces waste material sent to landfills Depending on the alternatewaste fuel used it can be argued that there are real indirect energy savings and emission reductions Placing a quantitative value on these indirect energy savings and emission reductions however is problematic
Cement pyroprocessing is currently used for and highly suited to the disposal of alternate or waste fuels such as used solvents oils tires carpets and other hazardous wastes (see fuel mix Table 3) In the case of many hazardous wastes cement pyroprocessing is more advantageous than commercial incinerators Time temperature and turbulence are the three most important factors to ensure the destruction of organic andor hazardous organic wastes Cement pyroprocessing systems have a high degree of mixing have long gas residence times and burn hotter (30 higher than the temperatures in a commercial hazardous waste incinerator) than a typical thermal waste treatment facility Cement kilns are very large and have a high heat capacity Temperatures cannot change quickly due to process upsets ensuring that waste destruction is complete Limestone also acts as a natural dry scrubber inside the kiln to capture chlorine and sulfur compounds as well as some metals Organic materials are completely combusted Cement kilns easily achieve a Destruction and Removal Efficiency of at least 9999 percent as required by US Environmental Protection Agency regulations for most organic wastes However care must be taken for high volatile elements (ie mercury thallium etc)
-27shy
Kilns operate with a temperature profile along their length that controls the sequence of kiln reactions and phase changes Waste materials combust and burn at different temperatures under different conditions Solid waste fuels need to be introduced into the kiln in such a manner as to not significantly change the temperature profile and chemical reactions It is sometimes necessary to add solid waste through a hatch or valve structure in the kiln shell This is technically challenging and creates an additional source of thermal and emission losses
Receiving and handling of alternate or waste fuels can raise technical liability and political concerns Cement manufacturing companies do not desire to be labeled as handlers of hazardous wastes and surrounding communities have valid concerns about hazardous waste transport and final emissions These concerns can be difficult to address and in some cases are perceived as a financial liability to the cement manufacturer
GRINDING AND MILLING OPPORTUNITIES
Grinding and milling operations are notoriously energy inefficient Typical systems routinely run at 6 to 25 on-site energy efficiency17 Although these systems do not account for a large portion of the on-site energy consumption profile of a cement plant they do offer significant opportunities for energy improvement Raw material grinding and finish mill systems should be evaluated for both efficiency of energy usage and cement quality Modern finish mill systems may comprise several units of process equipment ndash high-pressure twin-roll presses tube mills ball mills and conventional or high-efficiency separators Air flow and material and heat balances should be measured and evaluated Optimization of these systems may include
lt Adjustment of ball charges lt Studies of circulating loads lt Analyses of Tromp curves lt Modifying particle size distribution lt Controlling gypsum dehydration
-28shy
PRODUCT FORMULATION CHANGES TO IMPROVE ENERGY EFFICIENCY
Energy efficiency improvements and emission reductions can also result from changes in the Product Formulation of cement Research has shown that energy-saving modifications are possible without a loss in concrete performance These modifications include the addition of limestone and other cement-like materials (eg fly ash furnace slag or other pozzolanic materials) that do not require the large energy inputs and emissions associated with pyroprocessing
Changes to cement product formulations require significant time to be incorporated into ASTM standards and be accepted in the marketplace An ASTM committee (C0110) is considering a proposal to allow 5 limestone in portland cement This formulation is supported with over thirty years of research and 20 years of field experience that confirms that this formulation change meets all chemical and physical property requirements Current European (EN197) and Canadian (CSA A5) specifications allow this formulation This change in product formulation results in roughly a 5 decrease in energy use and a 26 reduction in CO2 emissions Concrete producers specify cement based on ASTM standards in order to guarantee the performance characteristics of concrete Changes to these formulations are perceived as ldquoriskyrdquo because change represents a move away from standards that have a long and well-documented performance history
Pozzolan
Materials that can be added to cement to extend its volume without a significant loss of properties are known as ldquopozzolansrdquo They are named after the ash deposits adjacent to the Pozzol volcano that the Romans used as cement The Pantheon in Rome is a testament to the high strength and durability of pozzolan cement Its hemispherical dome 141 feet (43 meters) in diameter is made completely from pozzollan cement and does not contain any reinforcing bars It has been in use since 135 AD (for comparison the US Capital dome is 96 feet in diameter)
The addition of pozzolan to cement will modify its characteristics Depending on the type of pozzolan chosen the density and compressive strength of the formed concrete may be increased and porosity reduced Pozzolanic materials can combine with uncarbonated lime (calcium hydroxide) to form stable compounds thus reducing the risk of early leaching or frost damage and increasing the potential durability of the mortar
Pozzolan materials in general do not require pyroprocessing and hence can save very significant quantities of energy and lower emissions when supplementing regular cement Concrete research is now calling for increased usage and high-volume usage of pozzolans especially fly ash Some have suggested that all concrete should contain fly ash 27 The economic and environmental advantages of adding pozzolan would seem to indicate that their regular and high-volume use will become standard practice in the concrete industry The US Environmental Protection Agency requires fly ash content in concrete to be used in buildings that receive
-29shy
federal funding
Coal-fired power fly ash is sometimes used as a source of silica in cement manufacturing but more commonly is used in concrete production as a substitute for a portion of the cement This is beneficial in two ways it reduces solid waste and overall energy use since it does not require pyroprocessing Fly ash can readily be substituted for 15 to 35 of the cement in concrete mixes and in some applications fly ash content can be up to 70 These addition change the performance characteristic of the concrete Of the 68 million short tons of coal fly ash produced in 2001 124 million short tons were used in cement and concrete products28 Fly ash can contain elements (eg carbon) compounds (eg ammonia) and other constituents that are detrimental to concrete performance
Fly ash and slags react with any free lime left after the hydration to form calcium silicate hydrate which is similar to the tricalcium and dicalcium silicates formed in cement curing This process increases strength improves sulfate resistance decreases permeability reduces the water ratio required and improves the pumpability and workability of the concrete Western coal-fired power plants produce better fly ash for concrete than eastern plants because of lower sulfur and lower carbon content in the ash Fly ash from incinerators cannot be used Portland cement with fly ash added is sometimes identified with the letter P after the type number (eg Type IP)
Other industrial waste products including blast furnace slag cinders silica fume and steel mill scale are sometimes substituted for some of the aggregate in concrete mix Recycled concrete can be crushed into aggregate and reused in the concrete mix However the irregular and higher surface area of crushed concrete aggregate is more costly than sand or crushed stone because it takes more cement slurry to coat the surface
-30shy
Endnotes
1 Emission of Greenhouse Gases in theUnited States 2001 Energy Information Agency DOE December 2002 page 31
2Cement Manufacturing Energy Solutions Center Inc Washington DC Copyright DTE Energy TechProcopy2001 Version11 October 2002
3Concrete Sustainability and Life Cycle - Life Cycle Research Reports 1994 through 2000 This CD contains 31 reports with a focus on concrete Cement is a key component in a LCA and data are presented in many of these reports
4 2000 US AND CANADIAN LABOR-ENERGY INPUT SURVEY Portland Cement Association March 2002 page 3
5 Emission of Greenhouse Gases in the United States 2001 page 31
6 Integrated Pollution Prevention and Control (IPPC) Reference Document on Best Available Techniques in the Cement and Lime Manufacturing Industries March 2001 European Commission Directorate-General Joint Research Centre Institute for Prosepective Technological Studies Technology for Sustainable Development European IPPC Bureau page 26
7 Integrated Pollution Prevention and Control (IPPC) Reference Document on Best Available Techniques in the Cement and Lime Manufacturing Industries page 27
8 Integrated Pollution Prevention and Control (IPPC) Reference Document on Best Available Techniques in the Cement and Lime Manufacturing Industries page 27
9 Mineral Commodity Summaries US Geological Survey Jan 2003 page 44
10 Cement US Geological Survey Minerals Yearbook -2001 Hendrik G van Oss page 161
11 US Cement Industry Factsheet Portland Cement Association Il 2002 Edition Update Table 17
12 US Cement Industry Factsheet Table 14
13 US Cement Industry Factsheet page 14
14 Ready Mixed Concrete Industry An Integral Part of the American Economy National Ready Mixed Concrete Association Washington DC January 2002
15 Cement US Geological Survey Minerals Yearbook -2001 Table 16
-31shy
16 Encyclopedia of Chemical Technology Kirk-Othmer 3rd edition 1979 John Wiley amp Sons NY NY Volume 5 page 165
17 Encyclopedia of Chemical Technology Volume 14 page 343
18 Energy and Environmental Profile of the US Mining Industry US Department of Energy Office of Industrial Technologies Mining Industry of the Future page 9-8
19 Energy and Environmental Profile of the US Mining Industry page 9-8
20 Chemical Engineering Handbook Fourth edition John H Perry McGraw-Hill Book Company page 8-8
21 The Rotary Cement Kiln Kurt E Perry 1986 Chemical Publishing Co Inc New York page 107
22 Chemical Engineering Handbook page 8-8
23 Alternatives to Traditional Fuels 2000 September 2002 US Department of Energy table 10
24 Kawasaki Heavy Industries Ltd website (httpwwwkhicojpproductssankisanfakshtm) FAKS (Fluidized Bed Advanced Cement Kiln System)
25 US Cement Industry Factsheet Portland Cement Association Il 2002 Edition Update Table 14
26 Cement US Geological Survey Minerals Yearbook -2001 Hendrik G van Oss Table 8
27 Mineral Admixtures John Scanlon ACI Compilation 22 1992
28 2001 Coal Combustion Product Survey American Coal Ash Association Aurora CO
-32shy
Table A1 - Cement Manufacturing by Pyroprocess System
Note This table provides kiln information based on survey data collected by the Portland Cement Association It represents approximately 95 of the US cement manufacturing companies 92 of US production and 93 of US kilns In total the United States has 204 operating kilns and produced 78451000 metric tons in 2001 (US Geological Survey Minerals Yearbook - 2001 Cement Hendrick G van Oss Table 5)
Number of Kilns
Percent Kilns
Metric Tonnes clinker
produced in 2001
Percent Tonnes
Wet Process Dry Process
No Preheater or Precaliner PreheaterPrecalciner Preheater Only Precalciner
54 136
59 77 35 42
284 716 311 405 184 221
14029433 57831070 12953759 44877311 13832465 31044846
195 805180625192432
Total 190 100 71860503 100 Source 2000 US and Canadian Labor-Energy Input Survey Portland Cement Association
Table A2 - Total US Clinker and Cement Supply based on 2001 data from the US Geological Minerals Yearbooks
78451000 1884000
U S Clinker Manufacturing US Clinker Imports
a b
80335000 Total US Clinker Manufacturing and Imports c
84450000 4450000
Total US BuildingPortland Cements Total US Masonry Cements
d e
88900000 Total US Cement (USGS) f 91037000 Total US Cement (PCA) g
Sources
a - US Geological Survey Minerals Yearbook - 2001 Cement Hendrick G van Oss Table 5 b - US Geological Survey Minerals Yearbook - 2001 Cement Hendrick G van Oss Table 12 c - Sum of US Clinker Manufacturing and Imports d - US Geological Survey Minerals Yearbook - 2001 Cement Hendrick G van Oss Table 3 e - US Geological Survey Minerals Yearbook - 2001 Cement Hendrick G van Oss Table 4 f - sum of Portland and Masonry Cements g - For comparison 2001 Portland and Masonry Cements total from United States Cement Industry
Fact Sheet 2003 Portland Cement Association
Table A3 - Raw Materials (non-fuel) for Clinker and Cement Production in the United States and Puerto Rico
2001 Clinker 2001 Cement
tonnes (a)
loss on ignition
percent (b)
tonnes (a)
non - clinker percent
Calcareous Limestone 95600000 706 437 1600000 222 Cement Rock 21900000 162 372 100000 14 Kiln Dust 600000 04 100000 14 Lime 300000 02 40000 06 Other 20000 00 20000 03
Aluminous Clay 4500000 33 80 10000 01 Shale 3200000 24 82 10000 01
Other (includes bauxite alumina aluminum dross ) 500000 04
Ferrous Iron Ore Pyrites Other 1500000 11
Siliceous Sand and Calcium Silicate 3500000 26 Sandstone Quartzite Other 500000 04 66 Fly Ash 1600000 12 70000 10 Other Ash 800000 06 Blast Furnace slag 200000 01 300000 42 Steel slag 500000 04 Other slags 50000 00 5000 01
Pozzolans 100000 01 59000 08 Miscellaneous 40000 00 50000 07
TOTAL Raw Materials for Clinker Manufacturing 135410000 100
Total Clinker Manufactured -based on kiln processing ignition losses for limestone cement rock
84831000 63
and other raw materials (c)
Total CO2 Emissions (d) 49924000 37
Cement Non-Clinker Raw Materials continued Gypsum 4800000 665
Other 50000 07 Total non-Clinker Materials 7214000 100
Cement Raw Materials tonnes percent Total non-Clinker Materials 7214000 8 Imported Clinker 2950000 3 Clinker Manufactured (c) 84831000 89 TOTAL Cement Production 94995000 100
Source a - US Geological Survey Minerals Yearbook - 2001 Cement Hendrick G van Oss Table 6
b - Encyclopedia of Chemical Technology 3rd Edition Kirk-Othmer John Wiley amp Sons NY NY 1979 Vol 5 page 171
c - Calculated weight loss based on ignition losses Ignition loss is a measure of the CO2 H20 and other products release at high temperature Ignition loss data are available for 93 of the raw material Ignition loss values for the remaining raw materials are assumed to be small
d - CO2 emissions assumes that ignition losses for limestone (437) and cement rock (372) are all CO2 (Note CO2 accounts for 44 of pure CaCO3 ignition loss)
cement
Table A4 Important Ratios and Numbers for Raw Materials Quarried Clinker Raw Materials
131660000 Quarried Clinker Raw Materials (total minus kiln dust ash and slag)
1434 Mass Ratio of Quarried Clinker Raw Materials to Cement Manufactured from US Manufactured Clinker 1552 Mass Ratio of Quarried Clinker Raw Materials to Clinker Manufactured
1127 Mass Ratio of Limestone Quarried to Clinker Manufactured
1785 Mass Ratio of CaCO3 to CaO
1776 Mass Ignition Ratio for limestone (beforeafter)
Quarried Cement Raw Materials 6739000 Quarried Cement Raw Materials (total minus kiln dust ash and slag)
0071 Mass Ratio of Quarried Cement Raw Material to Cement
Calcine Reaction Data 0589 Ratio for chemical reaction tonne of CO2 per tonne of manufactured
clinker 0544 Ratio for chemical reaction tonne of CO2 per tonne of manufactured
Source Values are based on the data presented in Table A3
Table A5 - Energy Use Associated with Limestone Quarrying
Btutonne Limestone
Tacit Btutonne Limestone
Primary Fuel
kilogram CO2
per tonne Limestone (a)
QUARRYING Percussion Drill 6140 6377 Diesel 04491 Hydraulic Shovel 5670 5888 Diesel 04148 Rear-Dump Truck 4030 4185 Diesel 02948 Bulldozer 3420 3552 Diesel 02502 Pick-Up Trucks 2250 2468 Gasoline 01596 Water Tanker 1170 1215 Diesel 00856 Service Truck 1120 1163 Diesel 00819 Lighting Plant 66 192 Electric 00119 Front-End Loader 187 194 Diesel 00137 Bulk Truck 147 153 Diesel 00108 Pumps 2250 6548 Electric 04044 Grader 7 7 Diesel 00005
subtotal 26457 31943 21772 BENEFICIATION
Conveyor 182 530 Electric 00327 Screens 366 1065 Electric 00658 Primary Crushers 1830 5326 Electric 03289 Secondary Crushers 1097 3193 Electric 01972
subtotal 3475 10113 06246 TOTAL 29932 42056 28017 Source Energy and Environmental Profile of the US Mining Industry US Department of Energy Industrial Technologies Program page 9-9a - Carbon dioxide emissions are calculated based on the Btutonne of limestone times the carbon emission equivalent in Table A15 for the specific fuel times the ratio of CO2 to C (4412)
Table A6 - Energy Associated With Quarrying Raw Materials Necessary to Manufacture Cement
These values assume that all quarried raw materials
used in cement manufacturing require
the same energy per mass as does limestone
quarrying
Quarrying Energy
Btutonne cement
a
Quarrying Energy Tacit
Btutonne cement
b
Quarrying
kilogram CO2
per tonne cement
c 42931 60321 402
a - Btu per tonne of limestone from Table A5 multiplied by 143 which is the mass ratio of quarried clinker raw materials to cement manufactured from US manufactured
clinker Table A3
b - Same as (a) but using tacit energy values from Table A5
c - Same as (a) but using carbon dioxide emission values from Table A5
Table A7 - Energy Associated With Quarrying Raw Materials Necessary for the Production of Concrete
These values assume energy ratios described
below
Mass Quantity Relative to
Cement
a
Quarrying Energy
Btutonne cement
b
Quarrying Energy Tacit
Btutonne cement
c
Quarrying
kilogram CO2
per tonne cement
d Sand Gravel or Crushed Stone
TOTAL
283 400
59118 101594 160712
76956 138434 215389
518 926
1443
a - Common weight ratio of concrete raw materials to cement for ready mixed cement is used for all cement products (34 sand to 12 cement) (48 crushed stone to 12 cement)
b - For the raw material sand this value is assume to be equal to limestone quarrying energy less the percussion drilling primary and secondary crushing operations For gravel or crushed stone this value is assumed to be equal to limestone quarrying energy less half of the percussion drilling primary and secondary crushing operations
c - Tacit adjust uses the same basis described in (b) above d - Carbon dioxide emission use Table A5 values adjusted for the basis described in (b) above
A14
Table A8 - Energy Consumed by Fuel Type in Cement Manufacturing (excluding Quarrying)
All Fuel Tacit Fuel 2001 US Annual tonnes Table A2 Plants Percentage All Percentage CO2
Clinker Production 78451000 10^9 Btu Plants emissions Cement Production 88900000 10^9 Btu 10^6 tonnes
(a) (b) (d)
FUELS Coal 265284 60 266703 50 24931 Petroleum Coke 67628 15 67628 13 6906 Natural Gas 23258 5 23326 4 1234 Middle Distillates 3500 1 3626 1 0266 Residual Oil 344 0 355 0 0027 Gasoline 407 0 447 0 0029 LPG 25 0 25 0 0002
WASTE FUELS Oils 1334 0 1334 0 0086 Solvents 22397 5 22397 4 1081 Tires 10258 2 10258 2 1218 Solids 1119 0 1119 0 0082 Misc 673 0 673 0 0049
Subtotal 396226 89 397890 35911
ELECTRICITY Raw Material Grinding (c) 8346 2 24291 5 Pyroprocessing 14238 3 41437 8 Finish Milling (c) 24057 5 70014 13
Subtotal 46642 11 135742 8383
TOTAL 442868 100 533632 100 4429 a - These values are adjusted to reflect the entire 2001 US production of cement shown in Table A2 (88900000 tonne) The data are based on Btutonne of cement values reported in the 2000 US and Canadian Labor-Energy Input Survey by Portland Cement Association page 12 These are based on surveys of approximately 90 of US capacity b - Tacit values are calculated using the All Plants data multiplied by the appropriate tacit correction factor listed in Table c - Electricity is proportioned by applying percentages used in The Reduction of Resource Input and Emissions Achieved by the Addition of Limestone to Portland Cement M A Nesbit Portland Cement Association 1996 page 6
d - Carbon dioxide emissions are calculated based on the Btu value times the carbon emission equivalent in Table A15 for the specific fuel times the ratio of CO2 to C (4412)
Table A9 - Fuel and CO2 Differences in Cement Manufacturing between 1971 and 2000
Onsite Production Btutonne Cement
1971 CO2
Production tonnetonne
Cement
Onsite Energy Use Btutonne Cement
2000 CO2
Production tonnetonne
Cement FUELS Coal 2639000 02480 2984100 02804 Petroleum Coke 39600 00040 760700 00777 Natural Gas 3347100 01776 261600 00139 Middle Distillates 88300 00065 39400 00029 Residual Oil 808900 00631 3900 00003 Gasoline 7400 00005 4600 00003 LPG 1400 00001 280 00000
WASTE FUELS Oils 0 15000 00010 Solvents 0 251900 00122 Tires 0 115400 00137 Solids 0 12600 00009 Misc 0 7600 00006
FUELS Subtotal 6931700 04999 4457080 04038 ELECTRICITY 488600 00878 524700 00943
TOTAL 7420300 05877 4981780 04982
Decrease in energy and emissions levels from 1971 to 2000 33 15
Btutonne of cement 4981780 03945 Percent change 0 21
Total CO2 Emissions are a function of the fuels used If year 2000 cement manufacturing plants used the 1971 fuel mix ratio CO2 emission would be lower by 21 in year 2000
Source Cement Industry Fact Sheet 2002 edition Portland Cement Association
Table A10 - Annual Energy Use Associated with US Cement Manufacturing and Concrete Production from US Cement Kiln operations pyroprocessing accounts for the vast majority of energy consumption and CO2 emissions in the cement and concrete industries Kilns consume 742 of the energy and produce 813 of the CO2 emissions associated with the cement and concrete industries Kilns consume 82 of the energy and produce 94 of the CO2 emissions associated with the cement manufacturing
Onsite Tacit Annual Onsite Tacit Annual Annual Annual CO2 Annual Annual CO2
Energy Use Energy Use Production Energy Use Energy Use Production 10^9 Btu 10^9 Btu 10^6 tonnes
Quarrying cement raw materials (a) 3817 5363 036 07 07 03 concrete raw materials (b) 14287 19148 128 26 25 12
Cement Manufacturing (c) raw material grinding 8346 24291 150 15 32 14 kiln fuels 410464 439327 3847 740 574 368 kiln reactions (d) 4835 463 finish milling 24057 70014 432 43 91 41
Concrete Production (e) raw material mixing 31444 122017 565 57 159 54 transport 61993 85842 453 112 112 43
Total 554409 766001 1045 100 100 100 a - Values from Table A6 adjusted for USGS cement production estimates for 2001 b - Values from Table A7 adjusted for USGS cement production estimates for 2001 c - Values from Table A8 d - Values from Table A3 and A4 e - Values from Table A13 adjusted for the assumption that all concrete energy use and emissions will be equivalent to ready mix values
Table A11 - Energy Use per Tonne Associated with US Cement Manufacturing and Concrete Production from US Cement
Onsite Tacit CO2 Onsite Tacit CO2
Energy Use Energy Use Production Energy Use Energy Use Production Btutonne Btutonne tonnetonne Cement Cement Cement
Quarrying cement raw materials (a) 42931 60321 00040 07 08 03 concrete raw materials (b) 160712 215389 00144 26 27 12
Cement Manufacturing (c) raw material grinding 93885 273235 00169 15 34 14 kiln fuels 4617146 4941815 04327 740 615 368 kiln reactions (d) 05438 463 finish milling 270610 787561 00486 43 98 41
Concrete Production (e) raw material mixing 353704 1029390 00636 57 128 54 transport 697337 724198 00510 112 90 43
Total 6236325 8031910 11751 100 100 100
a - Values from Table A6 b - Values from Table A7 c - Values from Table A8 adjusted for USGS cement production estimates for 2001 d - Values from Table A3 and A4 e - Values from Table A13 adjusted for USGS cement production estimates for 2001 adjusted for the assumption that all concrete energy use and emissions will be equivalent to ready mix values
Table A12 - Costs Associated with Ready Mixed Concrete Production 2002 Cost Range
Cubic Yards 390646000 $yd $yd
Utilities $075 $100 Fuel $118 $209 Environmental $005 $010 Sales Price $6500 $8000
Source Based on information provided in a conversation with Mr Herbert of the National Ready Mix Concrete Association
Table A13 - Projection of Energy Consumption for Ready Mixed Concrete Using Average of Cost Range Values for Ready Mixed Concrete Table A12 and Quarrying Data from Table A7
Tacit kg CO2
Annual Cost 10^9 Btuyr Btutonne Btutonne per tonne of Cement of Cement of Cement
a b c d e Quarrying 1 13248 160712 215389 144 Mixing amp Blending 2 $ 341815250 29157 353704 1029390 636 Transportation 3 $ 638706210 57484 697337 724198 510
TOTAL 99888 1211753 1968978 129
Note the total Btu consumed per year are higher in this table for concrete operations than the values shown in Table A10 This table is based on the combined total of US manufactured cement and imported cement
1- The data for ready mixed quarrying energy requirements is based on the quarrying energy requirements developed in Table A7 multipled by the propotion of the cement market that goes into ready mixed
The cement ready mixed portion is 75 2- Mixing and Blending operations are predominatly electric based and are assumed to be fully reflected in the utility
cost in Table A12 3- Fuel costs in Table A12 are predominately related to Transportation of the mixedblended aggregate and cement
plus water to the work site Diesel is the predominate fuel a - average price multiplied by annual production from Table A12 b - annual cost (a) divided by cost per energy unit - electric $004 $kWh or $(3412 Btu)
- fuel $150 $gal c - Btuyr (b) divided by the cement required to produce concrete using the values
2300 kgm3 for concrete and 12 weight cement to concrete
d - Btutonne of cement (c) times tacit correction factor from Table A14 (Fuel assume to be diesel) e - Annual CO2 production based on the c column times the carbon emission equivalent in Table A15 value for the
specific fuel times the ratio of CO2 to C (4412)
Table A14 - Calorific and Process Energy Values Associated with Fuels Calorific energy values are the energy content inherent to the material Except for pure materials eg propane these values vary depending on the raw
materials used and the final products formulations Process energy is a measure of the energy required to manufacture the material Process Energy values are also variable and depend on equipment
efficiency estimates and system boundaries These values for crude oil-derived products are variable and depend on the specific crude processed refinery configuration local product specifications and refinery efficiency Process energy values from the CEC include the energy for processing as well as factors for raw material eg delivery of crude to refiners and transporting fuels to their point of use
Tacit or gross energy is the sum of the calorific and process energy values The Tacit Correction factor is the ratio of the Tacit Energy value divided by the inherent or calorific energy value
Cement concrete
input units
Coal Industrial short ton Coal electric utility short ton BituminousSub short ton Petroleum Coke short ton Green Coke short ton Calcined Coke short ton Pitch
Natural Gas million ft3 Fuel Oil light gallon Fuel Oil medium gallon Residual Fuel Oil gallon Distillate fuel gallon Lube Oil gallon Gasoline gallon Kerosene gallon Diesel gallon LPG gallon Propane gallon Solvent gallon Rolling Oil gallon
WASTE shyOils gallon Solvents gallon Tires ton Solids Misc
Electric Average US Electric Coal-Fired Electric
Calorific Energy Values Primary-Energy
Process Energy Values Secondary-Energy
Tacit Energy
Tacit Correction
Factor
Data Btu per
Source Input UnitBtu per Common Unit
FUELS Data Btu per
Source Input Unit
Btu per Common Unit Required to
Produce
Btu per Input
input unit Unit
Fuels and Fuels used as materials 22433000 Btuton AEO2003 22433000 60 Btulb EampE Mining 120000 22553000 1005 20511000 Btuton AEO2003 20511000 60 Btulb EampE Mining 120000 20631000 1006
11110 Btulb CIA2000 22220000 60 Btulb EampE Mining 120000 22340000 1005 30120000 Btuton MECS 30120000 30120000 1000
14200 Btulb MidCon 28400000 Btulb Drexel 28400000 1000 15250 Btulb MidCon 30500000 179 Btulb EampE pg 52 358000 30858000 1012
1027 Btuft3 AEO2003 1027000000 30 Btuft3 3000000 1030000000 1003 150000 Btugal cogenerationnet 150000 5000 Btugal Drexel 5000 155000 1033 139000 Btugal cogenerationnet 139000 5000 Btugal Drexel 5000 144000 1036
6287000 Btubbl AEO2003 149690 5000 Btugal Drexel 5000 154690 1033 5825000 Btubbl AEO2003 138690 5000 Btugal Drexel 5000 143690 1036 6065000 Btubbl EIA 144405 5000 Btugal Drexel 5000 149405 1035 5202000 Btubbl AEO2003 123857 12000 Btugal CEC 12000 135860 1097 5670000 Btubbl AEO2003 135000 5200 Btugal CEC 5200 140200 1039 5670000 Btubbl EIA 135000 5200 Btugal CEC 5200 140200 1039 3603000 Btubbl AEO2003 85786 85790 1000 3824000 Btubbl EGGUS 91048 91050 1000 5248000 Btubbl EIA naphtha 124952 12000 Btugal Drexel 12000 136952 1096 6065000 Btubbl EIA 144405 5000 Btugal Drexel 5000 149405 1035
95 - 150000 Btugal a b 122500 100085 - 100000 Btugal a b 92500 1000
22 - 35000000 Btuton a b 28500000 100010001000
ELECTRICITY 1 kWh ISO 3412 Hydroelectric Utility ISO - 3412 1000 1 kWh ISO 3412 Average US Grid c 6523 9930 2910 1 kWh ISO 3412 Coal-Fired Utility c 7097 10510 3080
tacit Btu accounts for generation and transmission energy losses for average US generation SOURCES
AEO2003- Annual Energy Outlook 2003 Energy Information Administration US DOE Jan 2003 page 249 CEC - California Energy Commission CIA2000- Coal Industry Annual 2000Energy Information Administration Jan 2002 page 284 -This report uses an average value for bituminous and sub-bituminous coals Drexel - data approximations derived from Drexel University study EampE - documents from DOE - OIT these are from the Energy and Environmental Profiles of the Aluminum and Mining Industries EGGUS - Emissions of Greenhouse Gases in the United States 1987-1992 Energy Information Administration US DOE Oct 1994 Appendix A MidCon- Data from Mid-Continent Coal amp Coke Co
MECS - Energy Information Administration US DOE Manufacturing Energy Consumption Survey -1994 a - Heat range values form US and Canadian Labor-Energy Survey 2000 Portland Cement Association b - There are negligible secondary energy additions for waste fuels The final tacit value is assumed to be the midpoint of reported heat values c - Secondary energy requirements for electricity are based on the heat rate given in Table A16 minus 3412 Btu
Table A15 - Carbon Equivalent Emission Coefficients for Fuels Associated with Cement Production This table presents the carbon equivalent emission values for the fuels and materials associated with the production of cement The carbon dioxide equivalent can be obtained by multiplying the carbon equivalent by (4412) the mass ratio of carbon dioxide to carbon
FUEL
Btu per Input Unit
Tacit Input Unit
Carbon Emission
Coefficient
MtQBtu
Carbon Emission
Coefficient Source
Percent API Carbon Gravity (EGGUS) (EGGUS)
Density Poundsgal
(EGGUS)
Million Btubbl (EGGUS)
Coal BituminousSub Petroleum Coke Green Coke Calcined Coke Pitch Natural Gas Fuel Oil light (2) Fuel Oil medium Residual Fuel Oil Distillate Fuel Oil Lube Oil Gasoline Kerosene Diesel LPG Propane
WASTE shyOils Solvents Tires Solids Misc
22553000 22340000 30120000 28400000 30858000
-1030000000
155000 144000 154690 143690 149405 135860 140200 140200 85790 91050
122500 92500
28500000 --
short ton short ton short ton short ton short ton
-million ft3
gallon gallon gallon gallon gallon gallon gallon gallon gallon gallon
gallon gallon
ton --
2563 2581 2785 2785 2785 2062 1447 1995 2072 2129 1995
1934 1972 1995 1699 1720
1763 1317 3239
2020
EGG2000 EGGUS
EGG2000 EGG2000
c d
EGG2000 b a
EGG2000 EGG2000
EGG2000 EGG2000 EGGUS
EGG2000 EGGUS
efg
na na
923 na
858 256
863 339
857 170
866 586 861 414 863 355
9543
7064
7064
6024
5825
6287
5253 5670 5825
Electricity Hydro Electric
Average US Electric Coal-Fired Electric
4902 7697
lbsCO2kWh
135 CDE 212 CDE
MtQBtu - million metric tons of carbon per Quadrillion Btu (10^6 metric tons 10^15 Btu)
SOURCES EGG2000 - Emission of Greenhouse Gases in the United States 2000 Energy Information Administration US DOE Nov 2001 page 140 EGGUS - Emissions of Greenhouse Gases in the United States 1987-1992 Energy Information Administration US DOE Oct 1994 Appendix A CDE - Carbon Dioxide Emissions from the generation of Electric Power in the United States Oct 15 1999 DOE amp EPA a - Medium Fuel Oil values are the average of the light and heavy fuel oil values b - Diesel and light fuel oil is assumed to have the same carbon coefficient in EGGUS c - Green coke and Calcined coke are assumed to have the same carbon coefficient d - Pitch is assumed to have the same carbon coefficient as asphalt reported in EGGUS e - Waste fuel oils are assumed to have the same carbon coefficient as Medium Fuel Oil f - Waste solvents are assumed to have the same carbon coefficient as gasoline reported in EGG2000 e - Waste fuel oils are assumed to have the same carbon coefficient as Coal reported in EGG2000
Table A16 - Electric Generation Heat Rates U S
Electricity
Produced in 2001 1
billion kWh a
Units Consumed 2
b c
Heat Content
10^9 Btu
Consumed
b x c
BtukWh
a (b x c )
Coal 19040 9756 106 short tons 20511000 Btuton 3 20009916 10509
Petroleum
320 106 bbl Distillate 5825000 Btugal 3 186517
1632 106 bbl Residual 6287000 Btubbl 3 1025837
14 106 bbl Other Liquids 5670000 Btubbl 5 7932
4 106 short tons Coke 14200 Btulb 6 118116
sub-Total 1260 1338402 10622
Natural Gas 6130 5690 109 ft3 1019 Btuft3 3 5798110 9459
Other gases 141 127 1012 Btu 127000 9007
Nuclear 7688 10623 BtukWh 7 8166962 10623
Hydroelectric 2175 3412 BtukWh 4 742110 3412
Renewable 798 808 1012 Btu 808000 10125
Other 50 49 1012 Btu 49000 9800
TOTAL 37282 37039500 9935
Source 1 AER2001 - Annual Energy Review 2001 Table 82a Electricity Net Generation page 224 2 AER2001 - Annual Energy Review 2001 Table 83a Consumption of Combustible Fuels for Electricity
Generation page 229 3 AEO2003- Annual Energy Outlook 2003 Energy Information Administration US DOE Jan 2003
page 249 4 Convention based on assumed value used by EIA and others 5 assume diesel fuel is the majority of other fuels 6 Data from Mid-Continent Coal amp Coke Co for green petroleum coke 7 AER2000 - Annual Energy Review 2000 Table A6 Nuclear SteamElectric plants page 336
CEEO_Appendix_16
APPENDIX B - Portland Cement Types and Their Use
The American Society for Testing and Materials (ASTM) Specification C-150 provides for eight types of portland cement ASTM standards serve as the basis for manufacturing procurement and regulatory activities More than 92 of portland cement produced in the United States is ASTM Type I and II (or Type III) Type III accounts for about 35 of cement production Type IV and Type V account for less than 05 of production Although IA IIA and IIIA (air-entraining cements) are available concrete producers prefer to use an air-entraining admixtures during concrete manufacture where they can get better control in obtaining the desired air content
ASTM Type Use
I1
General purpose cement when there are no extenuating conditions Widely used for concrete construction including pavements building foundations bridges floors and various precast concrete products Some ready mixed concrete producers add admixtures to meet specific job requirements
II2 Aids in providing moderate resistance to sulfate attack
I-II Meets the specification requirements for both Type I and Type II the most widely used type for all kinds of concrete construction
III Used when high-early strength is required It is chemically and physically similar to Type I except that its particles have been ground finer It is used when forms need to be stripped as soon as possible or when the structure must be put into service quickly
IV3 When a low heat of hydration is desired (Used in massive structures)
V4
When high sulfate resistance is required Type V gains strength more slowly than Type I cement and is used only in concrete exposed to severe sulfate action - principally where soils or groundwaters have a high sulfate content This cement is particularly effective for structures such as sewage treatment plants and septic tanks
IA4 A type I cement containing an integral air-entraining agent
IIA4 A type II cement containing an integral air-entraining agent
IIIA4 A type III cement containing an integral air-entraining agent
1 - Cements that simultaneously meet requirements of Type I and Type II are also widely available 2 - Type II low alkali (total alkali as Na2O lt 06) is often specified in regions where aggregates susceptible to alkali-silica reactivity are employed 3 - Type IV cements are only available on special request 4 - These cements are in limited production and not widely available
APPENDIX C - Major Components of Cement
The chemical composition of cement influences the characteristics of cement and the concrete produced The clinker mineral C3S is the majority clinker component The strength developed by portland cement depends on its composition of C3S C2S C3A C4AF and the fineness (Blaine) to which it is ground The lsquoStandard Specifications for Portland Cementrdquo contain different requirements of chemical and physical properties MgO SO3 alkalis as Na2O ignition loss insoluble residue Bogue composition fineness (Blaine) soundness autoclave expansion compressive strength and initial and final setting
C3S - Tricalcium Silicate - Ca3SiO5 - 3CaObullSiO2 - CAS 12168-85-3 C3S is the main clinker component in cement typically more than 50 Quick development of strength - C3S reacts more quickly than C2S High contribution to the final strength Resistant to sulphur attack 25 weight water bind under hydration of C3S Heat development 500 kJkg Hydration of C3S (Ca3SiO5 + (y+z)H2O = zCA(OH)2 + Ca(3-z)SiO(5-z)yH2O) are to some extent dependent on the presence of C3A and gypsum Both C3A and gypsum stimulate the hydration of C3S Also Alkalis have some influence at the hydration C3S = 4071CaO-(7600SiO2+6718Al2O3+1430Fe2O3+2852SO3) according to Bogues methods
C2S - Dicalcium Silicate - Ca2SiO4 - 2CaObullSi2 - CAS 10034-77-2 C2S is the second clinker component in cement between 10 - 60 Slow development of strength - C2S reacts more slow than C3S High contribution to the final strength Resistant to sulphur attack 20 weight water bind under hydration of C2S Heat development 250 kJkg On hydration C2S shows similar behaviour to C3S but is slower to react It does however continue to hydrate late in the setting period and may then contribute to the strength of the cement C2S = 287SiO2-0754(Ca3SiO5) according to Bogues methods
C3A - Tricalcium Aluminate - 3CaObullAl2O3 - CAS 12042-78-3 C3A range in the cement between 3 - 10 High contribution to the early strength Low contribution to the final strength Not resistant to sulphur attack 40 - 210 weight water bind under hydration of C3A Fast and high heat development 900 kJkg Compared with C3S C3A reacts very rapidly with water giving two hydrated
products 2C3A + 21H = C4AH13 + C2AH8 These form platelets within the cement and convert to C3AH6 which forms very quickly and is responsible for the initial formation of a crystalline network In the presence of free lime in the cement the formation of C4AH13 is favoured This slows the formation of C3AH6 but even so the formation of C4AH13 can cause the cement to set too quickly To avoid speed setting is gypsum added to the cement and the mineral ettringite is formed on hydration C3A + 3CaSO42H2O + 25-26H2O = Ca6Al2O6(SO4)31-32H2O C3A = 265Al2O3-169Fe2O3 according to Bogues methods
C4AF - Tetracalcium aluminoferrite - 4CaObullbullAl2O3bullbullFe2O3 - CAS 12068-35-8 C4AF Range in the cement between 5 - 10 Small contribution to the development of strength 37 - 70 weight water bind under hydration of C4AF Moderate to low heat development 300 kJkg Hydration of C4AF + 13H = C4AFH13 C4AF = 304Fe2O3 according to Bogues methods
Calcium Sulfate dihydrate (Gypsum) - CaSO4bullbull2H2O - CAS 7778-18-9
Alkalis (Na2O + K2O) Cements with a low alkali content may be required for use in the manufacture of concrete in which the use of aggregate introduces silica Alkalis may enhance reactions with amorphous silica The content of alkalis contributes to the acceleration of the early strength and lowering of the final strength The content of alkalis is dependent on the raw materials but also the manufacturing process also determines the content of alkalis Cement manufactured by the wet processing will contain less alkalis compared to dry processing Alkalis as Na2O = Na2O + 0658 K2O
Magnesia - MgO Cements with a high magnesia content may hydrates and expand after setting
Lime - CaO Cements with a high free lime content may react with water and result in expansion
Calcium Carbonate - CaCO3 - CAS 1317-65-3
- Acknowledgments
- Table of Contents
- Table of Diagrams Figures and Charts
- Illustration13
- Executive Summary
- Introduction
- The US Cement Industry
- Opportunities for Improving Energy Efficiency and Reducing CO2 Emissions
- PYROPROCESSING OPPORTUNITIES
- GRINDING AND MILLING OPPORTUNITIES
- PRODUCT FORMULATION CHANGES TO IMPROVE ENERGYEFFICIENCY
- Endnotes
- Appendix A - Energy Data and Calculation Tables
- APPENDIX B - Portland Cement Types and Their Use
- APPENDIX C - Major Components of Cement
-
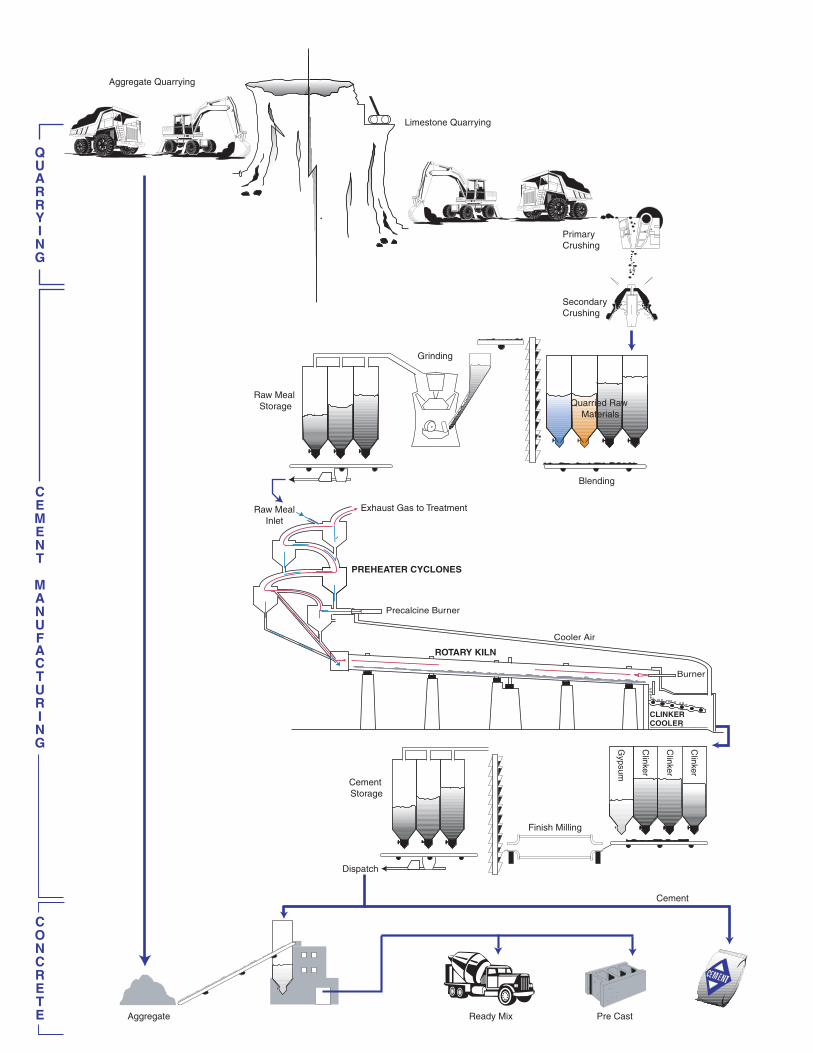
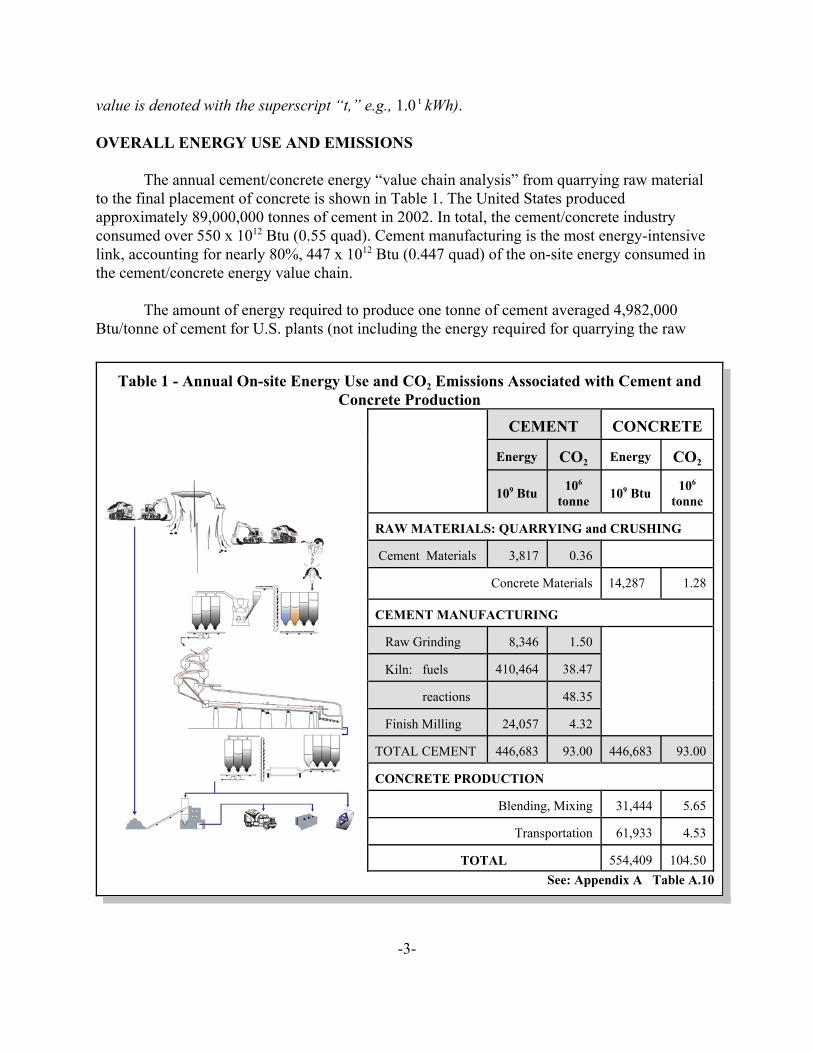
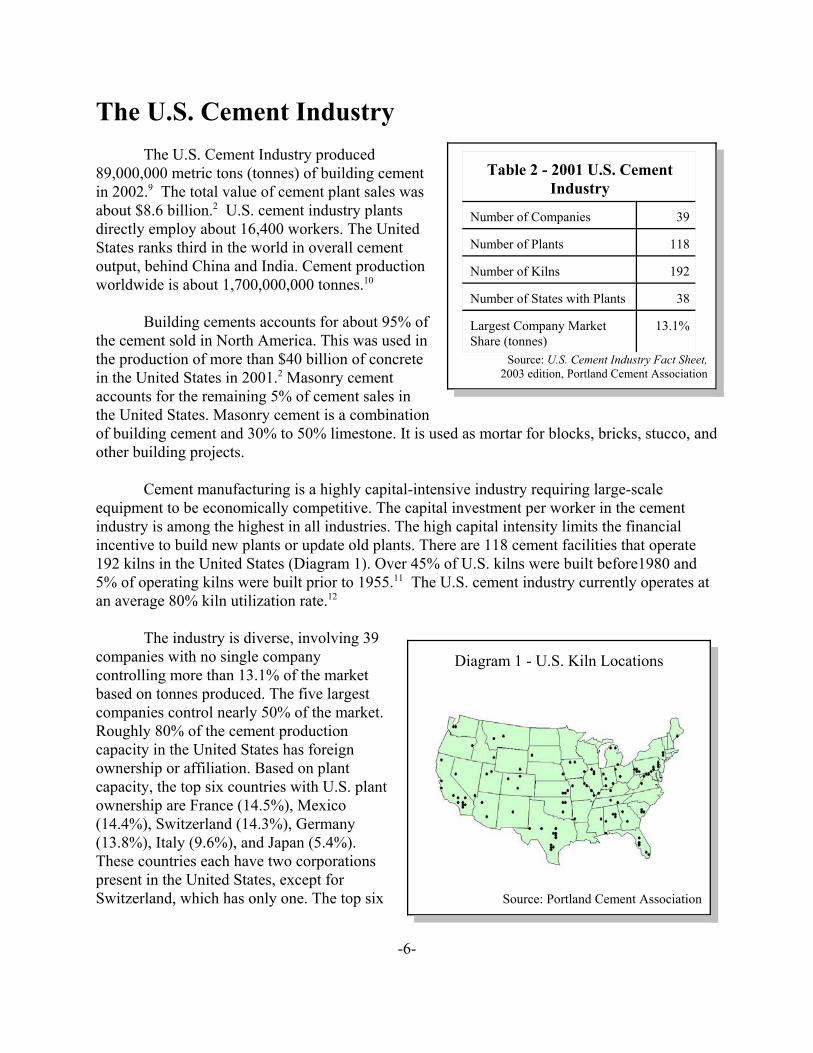
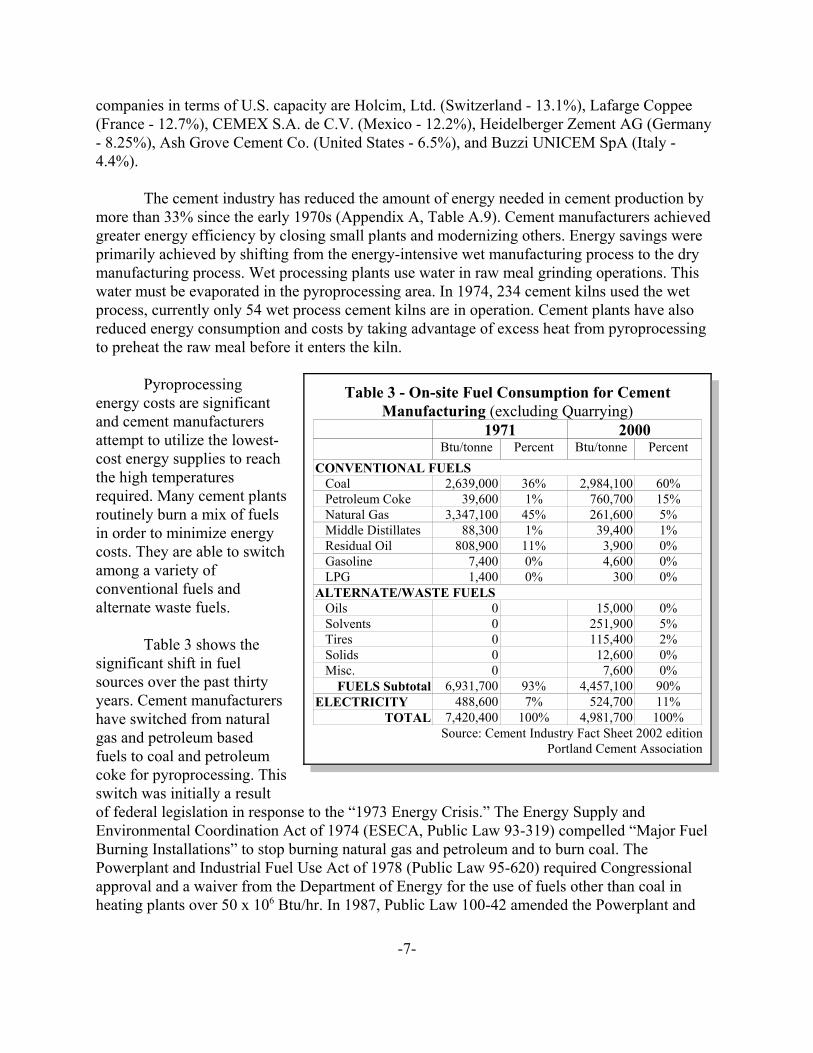
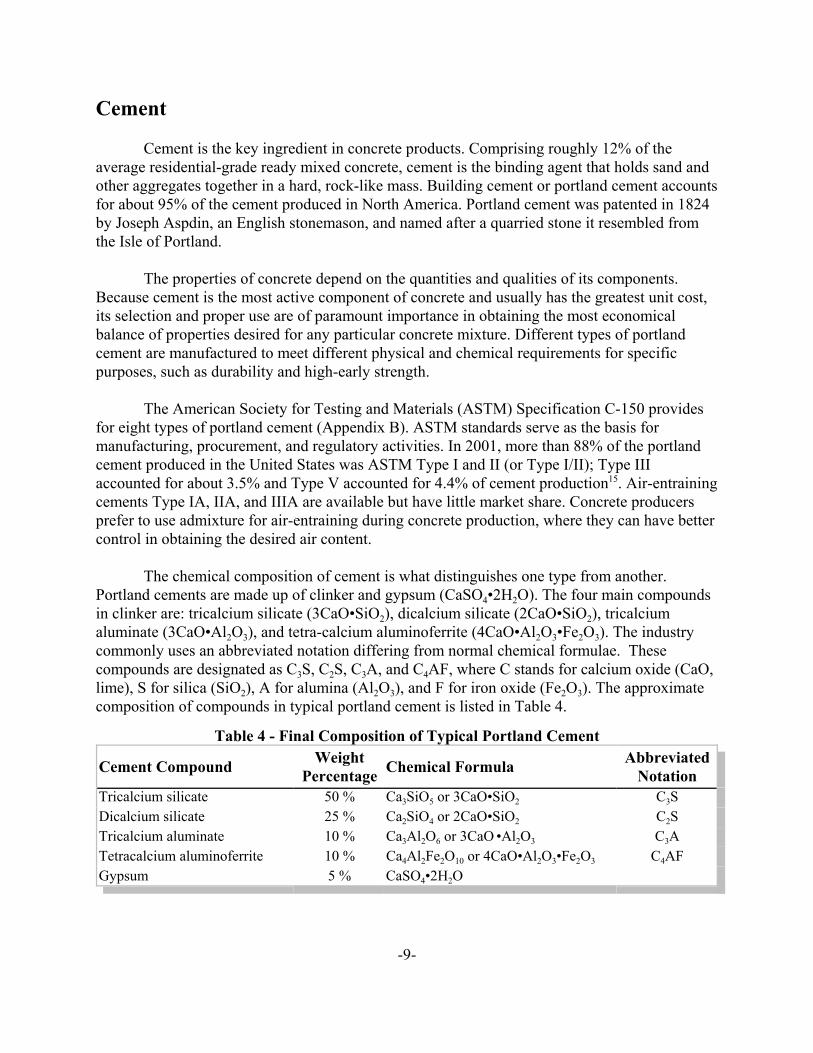
Cement
Cement is the key ingredient in concrete products Comprising roughly 12 of the average residential-grade ready mixed concrete cement is the binding agent that holds sand and other aggregates together in a hard rock-like mass Building cement or portland cement accounts for about 95 of the cement produced in North America Portland cement was patented in 1824 by Joseph Aspdin an English stonemason and named after a quarried stone it resembled from the Isle of Portland
The properties of concrete depend on the quantities and qualities of its components Because cement is the most active component of concrete and usually has the greatest unit cost its selection and proper use are of paramount importance in obtaining the most economical balance of properties desired for any particular concrete mixture Different types of portland cement are manufactured to meet different physical and chemical requirements for specific purposes such as durability and high-early strength
The American Society for Testing and Materials (ASTM) Specification C-150 provides for eight types of portland cement (Appendix B) ASTM standards serve as the basis for manufacturing procurement and regulatory activities In 2001 more than 88 of the portland cement produced in the United States was ASTM Type I and II (or Type III) Type III accounted for about 35 and Type V accounted for 44 of cement production15 Air-entraining cements Type IA IIA and IIIA are available but have little market share Concrete producers prefer to use admixture for air-entraining during concrete production where they can have better control in obtaining the desired air content
The chemical composition of cement is what distinguishes one type from another Portland cements are made up of clinker and gypsum (CaSO4bull2H2O) The four main compounds in clinker are tricalcium silicate (3CaObullSiO2) dicalcium silicate (2CaObullSiO2) tricalcium aluminate (3CaObullAl2O3) and tetra-calcium aluminoferrite (4CaObullAl2O3bullFe2O3) The industry commonly uses an abbreviated notation differing from normal chemical formulae These compounds are designated as C3S C2S C3A and C4AF where C stands for calcium oxide (CaO lime) S for silica (SiO2) A for alumina (Al2O3) and F for iron oxide (Fe2O3) The approximate composition of compounds in typical portland cement is listed in Table 4
Table 4 - Final Composition of Typical Portland Cement
Cement Compound
Tricalcium silicate Dicalcium silicate
Weight Percentag
50 25
e Chemical Formula
Ca3SiO5 or 3CaObullSiO2
Ca2SiO4 or 2CaObullSiO2
Abbreviated Notation
C3S C2S
Tricalcium aluminate 10 Ca3Al2O6 or 3CaO bullAl2O3 C3A Tetracalcium aluminoferrite 10 Ca4Al2Fe2O10 or 4CaObullAl2O3bullFe2O3 C4AF Gypsum 5 CaSO4bull2H2O
-9shy
The industry frequently reports the composition of cement as a percentage of the raw materials and not as a percentage of the final compounds formed The composition of portland cement falls within the range of 60 to 67 lime (CaO) 19 to 25 silica (Si) 3 to 8 alumina (Al2O3) and 03 to 6 iron oxide together with 1 to 3 sulphur trioxide derived mainly from the added gypsum 05 to 5 magnesia and 03 to 13 alkalies Titanium oxide is usually present to the extent of 01 to 04 Manganese oxide is usually present only in small amounts except when blast-furnace slag is used as a raw material then it may rise to 1
The proportions of components in the final composition results from obtaining a phase equilibrium of all components in the raw meal ash from fuels and from other additions The final compounds reflect the effects of kiln temperatures residence time quenching oxygen availability and many other kiln conditions The actual final components are complex chemical crystalline and amorphous structures Diagram 2 is a phase diagram of the major raw meal pyroprocess products16 About 20 to 30 of the raw materials become liquid at the highest temperatures in the kiln Portland cement composition is noted in one small area Complex reactions and phase changes occur at the surfaces of the
Diagram 2 - Phase Diagram of Major Cement Components14
solids and within the liquid The behavior of each type of cement depends on the mixture of final components
-10shy
CEMENT MANUFACTURING PROCESS
Cement manufacturing requires exacting measurements and careful controls to produce a product that meets precise chemical and physical specifications The first step in the cement manufacturing process is the quarrying of a combination of raw materials (Appendix A - Table A3) that when sized blended and processed yield the exact chemical composition required These raw materials then undergo a series of high temperature chemical reactions and physical changes after which they are ground into a very fine carefully sized powder
Quarrying
Generally cement raw materials consisting of mainly limestone (71) and combinations of cement rock (16) shale clay sand or iron ore are extracted from a quarry near the cement plant Limestone and cement rock are the most
Diagram 3 - Quarrying for Cement Limestone
common source of CaCO3 for cement production making up about 87 of the raw materials (Appendix A - Table A3) Typically the limestone used in cement production contains 75 to 90 CaCO3 with the remainder predominately MgCO3 and minor impurities Limestone is typically categorized as high-calcium (lt5 MgCO3) magnesium-limestone (5 to 20 MgCO3) or dolomitic-limestone (gt20 to lt456 MgCO3) Cement rock is impure limestone possessing the ideal balance of silica alumina and CaCO3 for portland cement17
A typical limestonecement rock quarrying process for producing crushed and broken stone includes bull removal of the overburden (ie soil clay and loose rock overlaying the deposit) bull blasting of the limestone deposit bull loading and transporting the blasted limestone to the crushing plant bull Crushing to reduce stone to about 5 inches (125 mm) in primary crushers then to roughly
38 inch to 34 inch (10 mm to19 mm) in secondary crushers
The total energy required to quarry and process limestonecement rock is 29932 Btutonne The quarrying of the limestonecement rock consumes approximately 88 of the total energy requirement and the crushing of the ore accounts for the remaining 12 of the energy requirement18 Table 5 provides a detailed listing of the equipment used and the Btu per tonne consumed for each equipment operation19 Appendix A Table A5 lists quarrying fuels and consumption values In the quarrying of the limestonecement rock diesel fuel is the main source of energy and provides about 80 of the quarrying operations energy Diesel fuel is used to run the heavy machinery in the limestone quarryrsquos daily operation Utilization of biodiesel provides an opportunity for quarrying operations to lower lifecycle emission profiles
-11shy
Primary crushing reduces quarried stone to about 5 inches Primary crushed stone is fed into secondary crushers where it is broken down to a size (-0375 to -075 inch) suitable for feed to the fine grinding machines located at the cement manufacturing plant Crushing consumes an estimated 2927 Btutonne of limestone
Limestonecement rock account for 87 of the raw materials used to produce cement The energy and emissions associated with quarrying of the remaining 13 of raw materials has been estimated using the limestonecement rock data (Appendix A Table A6)
The environmental issues related to quarrying are mostly local and are common to most surface mines These issues include dust increased sediment loads to local streams noise and ground vibrations from blasting
Raw Material Preparation
When raw materials arrive at the cement plant they are stored in dry sheds or silos These materials are then carefully proportioned accounting for combustion fuel ash and other additives to create a cement with a specific chemical composition Two different methods dry-process and wet-process are used to grind raw materials In the dry-process raw materials are proportioned ground to a powder blended together and fed to the kiln in a dry state In the wet-process a slurry is formed by adding water to the properly proportioned raw materials The grinding and blending operations are then completed with the materials in slurry form This significantly lowers dust levels but requires additional energy to later remove the water from the raw meal
Limestone -0375 inch to -075 inch in size is blended with other raw materials (Appendix A Table A3) and fed into grinding mills where it is reduced in size until approximately 70 to 85 passes a 200-mesh screen (00027 inch 0069 mm screen opening) Raw meal grinding equipment
Table 5 - Energy Consumption for Surface Limestone Quarrying
Btu Tonne
On-site Operations
QUARRYING Percussion Drill 6140
Hydraulic Shovel 5670 Rear-Dump Truck 4030
Bulldozer 3420 Pick-Up Trucks 2250
Water Tanker 1170 Service Truck 1120 Lighting Plant 66
Front-End Loader 187 Bulk Truck 147
Pumps 2250 Grader 7
subtotal 26457 CRUSHING
Conveyor 182 Screens 366
Primary Crushers 1830 Secondary Crushers 1097
subtotal 3475 TOTAL 29932
Source US Department of Energy Mining Industry of the Future Energy and Environmental Profile of the US Mining Industry pg 9-9
Diagram 4 - Raw Material Preparation
-12shy
includes ball mills tube mills compound mills ring roll mills and impact mills Raw meal grinding has a significant effect on pyroprocessing and clinker quality The raw meal quality (fineness the amount and nature of oversized particles) and flowability (kiln circulating and separation patterns and conductive energy transfer) affect the final clinker quality
Raw material grinding consumes about 2 of the on-site energy associated with cement manufacturing Grinding and milling are electrically driven processes In addition to the electricity consumed on-site electric processes have large tacit energy requirements associated with the generation and transmission of electricity Grinding raw materials for cement manufacturing consumes approximately 93885 (273235t) Btutonne of cement (Appendix A Table A11) Grinding energy is a function of numerous factors including how the material fractures (under slow pressure under impact) compressive strength coefficient of elasticity hardness starting and finish size desired particle distribution etc The exact amount of work required for grinding is difficult to calculate Grinding efficiency ranges from 6 to 25 based on the thermal measurements20 Since grinding consumes electricity a costly energy source cement manufacturers work to improve grinding efficiency On-site grinding efficiency improvements provide significant offsite energy savings related to electric generation and transmission losses
Kiln Operations
Pyroprocessing in giant rotating furnaces or kilns represent the major technical process common to all cement plants It is also the most technically complex and energy-intensive operation from quarrying to concrete placement Rotary cement kilns are cylindrical refractory-lined steel furnaces that range from 200 to more than 1000 feet long and from 10 to over 25 feet in diameter Cement kilns are the worldrsquos largest piece of moving industrial process equipment shyand one of the hottest
Blended raw material is fed into the upper end of the tilted rotating kiln As the kiln slowly rotates (1 to 4 revolutions per minute) the raw material tumbles through progressively hotter zones toward the flame at the lower end of the kiln The mixture passes at a rate controlled by the diameter and rotational speed of the kiln The flame is fueled by powdered coal petroleum coke natural gas oil recycled materials or other fuels A 1870degC (3400degF) flame heats the mixture to 1480degC (2700degF) The extreme heat triggers a series of chemical reactions The raw materials break down (calcine) become partially molten and fuse together into nodules called clinker
Diagram 5 - Preheater Precalciner Kiln
-13shy
The raw meal undergoes complex chemical and physical changes as it tumbles then flows through the kiln These chemical reactions and changes can be viewed as a sequence of thermal events some of which may occur outside the kiln in a preheater andor precalciner section The following describes the sequence of chemical and physical changes
bull Evaporation of uncombined water from raw material preparation in the wet process as material temperature increases to 100C (212F)
bull Dehydration the evolution of bound water from the material as temperatures increase from 100C to approximately 550C (1020F) to form the unhydrated oxides of silicon aluminum and iron
bull Calcination of the calcium carbonate (CaCO3) to calcium oxide (CaO) and magnesium carbonate (MgCO3) to magnesium oxide (MgO) with the evolution of carbon dioxide (CO2) between 900C (1650F) and 980C (1800F) The CO2 gas fluidizes the raw materials which changes raw material movement from tumbling to flowing
bull Reaction of CaO with silica to form dicalcium silicate bull Reaction of CaO with the aluminum and iron-bearing constituents to form
the liquid molten phase bull Formation of the clinker nodules Reactions bonding the calcium oxide
and silica oxide to form dicalcium and tricalcium silicates and small amounts of tricalcium aluminate and tetracalcium aluminoferrite These compounds form the four principal components that determine the properties of the cement manufactured
bull Evaporation of volatile constituents (eg sodium potassium chlorides and sulfates)
bull Reaction of excess CaO with dicalcium silicate to form tricalcium silicate bull Formation of clinker as material approaches the exit of the kiln at
temperatures of approximately 1500C (2700F)
Clinker is discharged red-hot from the lower end of the kiln and transferred to various types of coolers to recover thermal energy and lower the clinker to handling temperatures Clinker when cooled is typically gray glass-hard spherically shaped nodules that range from 03 to 50 centimeters (0125 to 20 inches) in diameter
Kilns are divided into two groups dry-process (805 of US capacity) and wet-process depending on how the raw materials were prepared Wet-process kilns are fed raw material as a slurry with a moisture content of 30 to 40 A wet-process kiln needs additional length to evaporate the water contained in the raw material feed Nearly 33 additional kiln energy is consumed in evaporating the slurry water Wet-process kilns tend to be older fully capitalized operations The last wet-process kiln to be built in the United States was constructed in 1975
Dry-process kilns are fed dry powder raw materials Three major variations of dry-process kilns are in operation no-preheater kiln preheater kiln and precalciner kiln Dry-process kilns operate with high exiting gas temperatures In most dry-process no-preheater
-14shy
operations the kiln is equipped with metal chain sections at the gas exit end These chains hang from the refractories in the gas path The gases pass through the chains which absorb heat from the gas stream As the kiln rotates the chains intermix and become covered by the feed raw materials at the bottom of the kiln The chains transfer their thermal energy by conduction to the raw material entering the kiln
Most dry process plants preheat the finely ground raw material before it enters the kiln The preheating takes place typically in a tall tower consisting of multistage countercurrentshyflow cyclones Diagram 6 These towers can be over 450 feet tall Multiple solidgas cyclone heat exchangers swirl the raw materials with the hot exit gases from the kiln and heat them quickly and efficiently Some preheater towers include a special preheater section which contains a fuel combustion chamber These sections provide some of the precalciner energy and are referred to as precalciner
Diagram 6 - Preheater Precalciner Section
Today the most common type of cement kiln (accounting for 80 of capacity in the United States) is a dry-process kiln in which the raw meal is processed dry Many older kilns (20) still in operation use the wet-process Table 6 provides an inventory of US cement kilns Each kiln wet-process and the three versions of dry-process operate with a different energy efficiency The theoretical energy requirement for pyroprocessing (ie the minimum energy required to remove hydrated water calcine and raise the temperature to obtain the phases necessary for cement clinker) is about 1710000 Btutonne of clinker21 The thermal efficiencies for various kiln processes are also shown in Table 6 On average pyroprocessing operations run at about 34 thermal efficiency This leaves ample opportunities to improve thermal performance The last chapter of this report Opportunities for Improving Energy Efficiency and Reducing CO2 Emissions and in particular Table 9 examines the thermal balance of the kiln and kiln losses and suggests where efficiency improvement could have a major impact
-15shy
Table 6 - Approximate Energy Consumption in US Kilns by Number and Process
US Kilns1
Percent of Kilns
2000 Clinker Production
tonnes
Percent of US
Capacity
Million Btu per tonne 3
Percent Thermal
Efficiency
Total US Kilns 192 100 71860000 2
100 498 34
Wet Process Kiln Plants 54 284 14030000 2
195 625 27
Dry Process Kiln Plants 136 716 57830000 2
805 467 37
No Preheater or Precalciner 59 311 12950000 2
180 564 30
Preheater (only) 35 184 13830000 2
192 458 37
Precalciner 42 221 31050000 2
432 431 40
PreheaterPrecalciner 4 77 405 44880000 2
624 439 39
1 - Kiln process types were provided by the Portland Cement Association Two kilns were not classified and are not listed as wet or dry process kilns These data represent approximately 92 of US clinker production and about 93 of US kilns (Appendix A Table A1) 2 - 2000 US and Canadian Labor-Energy Input Survey Portland Cement Association pages 12-27 3 - 2000 US and Canadian Labor-Energy Input Survey Portland Cement Association page 7 4 - Includes plants that are preheater only precalciner only and combinations
Clinker Cooling
Red-hot clinker tumbles from the kiln onto a grate and is cooled by recirculating air The hot air recovered from this cooling process is recycled back to the kiln or preheater system to recover its thermal energy After energy is recovered from the process gases the gases are routed to pollution control devices Electrostatic precipitators or fabric filters remove particulate matter (dust) from the gases before they are discharged to the atmosphere Particulate removal efficiencies of 997 are common throughout the industry
Cement Milling
Cooled clinker is combined with approximately 3 to 6 gypsum and groundmilled into an extremely fine gray powder This fine gray powder is cement Gypsum is used to control the setting time of concrete
Finish milling usually uses tube or ball mill equipment Clinker is milled so finely
Diagram 7 - Clinker and Gypsum Milling
-16shy
that nearly all of it passes through a 200 mesh (00027 inch 0069 mm) screen that will hold water The final powder has a surface area of 3000 to 5000 cm2g and about 85 to 95 of the powder will pass through a 325-mesh screen (00017 inch 0043 mm) The fineness of the cement is an important property and affects the rate of hydration The finer the milled cement the more surface area is available for hydration The greater area for hydration causes greater early strength and more rapid generation of heat Cements are classified by their fineness with Type III containing a more finely milled cement than Type I cement
Clinker milling uses the same general type of equipment as raw meal grinding However the final product is much finer and requires almost three times the energy 270610 (778043t) Btutonne of cement as raw meal grinding requires (Appendix A Table A11) Clinker milling is not energy efficient and typical cement milling systems can consume nearly twenty times their theoretical energy requirement22 After milling portland cement is ready to be bagged or shipped in bulk by truck or rail to concrete producers
Storage and Dispatch
Cement is stored at the cement manufacturing facility or a cement terminal until it is shipped to a customer Storage of bulk cement is in watertight bins or silos About 40 of manufactured cement is shipped by rail and barge to directly to terminals Direct customer shipments are predominately made by truck All transportation vehicles should be equipped with watertight properly sealed compartments Cement is very moisture-sensitive and must be stored in a dry environment When kept dry it will retain its quality indefinitely If stored in contact with damp air or moisture cement will set more slowly and have lower concrete strength than dry cement Cement stored for long periods of time should undergo standardized tests for strength and loss on ignition before use
-17shy
Concrete Concrete is produced by mixing
cement with fine aggregate (sand) coarse aggregate (gravel or crushed stone) and water Small amounts of chemicals called admixtures are frequently added to the concrete mix to control setting time and
Diagram 8 - Concrete Production
plasticity A properly designed concrete mixture will possess the desired workability for the fresh concrete and the required durability and strength for the hardened concrete Typically a concrete mix is by volume about 10 to 15 cement 60 to 75 aggregates and 15 to 20 water Entrained air bubbles in many concrete mixtures may also take up another 5 to 8 of the volume Table 7 shows a typical weight percent mix The character of concrete is determined by the quality of the cement and the mix ratios Higher-quality concrete is produced by lowering the water-cement ratio as much as possible without sacrificing the workability of fresh concrete
When water is added to the concrete mix it combines with the cement to form a slurry or gel that coats the surfaces of the aggregate and fills the voids of the concrete mix The water and cement compounds undergo hydration reactions that slowly form the complex hydrated microstructure that sets the concrete and makes it solid These reactions continue after the concrete is set and
Table 7 - Typical Concrete Mixare not complete for months (and even years) after Component Weight placement The microstructure of the cement hydrates
Portland cement 12determine the mechanical behavior and durability of the Sand 34concrete Crushed stone 48
Water 6The strength developed in concrete depends on Source National Ready Mix Concreteits composition and the fineness to which the cement is Association
ground Cements high in C3S (3CaObullSiO2) especially those that are finely ground will hydrate more rapidly and lead to higher early strength However rapid hydration can lead to a lower final strength C3S is mainly responsible for the strength developed in the first week of hardening Cements high in C2S (2CaObullSiO2) will hydrate much more slowly leading to a denser structure with higher long-term strength The alumina and iron compounds in cement make little contribution to final strength
Concrete can deteriorate from attack by some natural or artificial chemicals The alumina compound C3A (3CaObullAl2O3) is the most vulnerable to chemical attack in damp soils containing sulphate salts or in seawater while the iron compound C4AF (4CaObullAl2O3bullFe2O3) and the two calcium silicates (C3S and C2S) are more resistant
Cement liberates heat when it hydrates Consequently concrete placed in large masses as in dams can cause the temperature inside the mass to rise as much as 72degF (40degC) above the outside temperature Subsequent thermal stresses when cooling cause cracking in the concrete
-18shy
structure The highest heat of hydration is shown by C3A followed in descending order by C3S C4AF and C2S
Ready mixed concrete consisting of cement aggregates water and admixtures mixed at local plants for delivery to a work site by truck accounts for over 75 of all concrete production Concrete masonry (eg 8 x 16 inch blocks) and other precast concrete products (eg pipes) account for 13 contractor (on-site concrete mixing) accounts for 6 and the remaining 6 of concrete production is used in well lining mining operations and other activities
Ready mixed facilities store convey measure and discharge cement aggregates and admixtures into trucks for transport to a job site These facilities typically receive raw materials by rail truck or barge Cement is transferred and stored in elevated dry-storage silos Sand and coarse aggregate are stored and transferred to elevated bins as needed The raw materials are typically fed by gravity into weigh hoppers where they are proportioned in the exact amounts specified for the concrete mix Approximately 75 of ready mixed concrete is ldquotransit mixedrdquo Transit mix trucks are loaded with sand aggregate cement and water by gravity from weigh hoppers The materials are mixed and blended in a rotating truck mounted drum while being transported to a work site About 25 of the ready mixed concrete is blended at the ready mixed facility The premixed and blended concrete is placed in open bed dump or agitator trucks for transport to a work site Dry batching with concrete mixed and hauled to the construction site dry is uncommon
The water sand and gravel or crushed stone used in ready mixed concrete production are abundant and usually sourced as close to the ready mixed plant as possible The distance and quality of the sources have an impact on transportation energy use (costs) water use for washing and dust generation The energy consumed for ready mixed concrete production are associated mostly with three operations (Appendix A Table A13)
bull Quarrying (fine and course aggregates) 160700 Btutonne cement bull Mixing and blending (cement aggregates and admixtures) 353700 Btutonne cement bull Transporting the concrete mix to the work site 697300 Btutonne cement
Ready mixed concrete production from US manufactured cement is estimated to have consumed about 1177 x 1012 Btu in 2001 approximately 1211700 Btutonne of cement (Appendix A Table A13)
Concrete block pipe and other precast products follow the same production steps (quarrying and blending) as ready mixed concrete but are cast at a manufacturing site and then transported to the work site Hence the total energy requirement for precast product is similar to ready mixed The difference between the two products is location of where the concrete sets Likewise contractor well-lining concrete operations and mining concrete all transport quarried aggregates and then blend on the work site These operations result in overall energy use and emissions similar to ready mixed concrete For simplicity this report uses the ready mixed energy use and emissions data to calculate values for all industrial concrete products Hence in
-19shy
total the quarrying mixing and transportation operations account for 26 (143 x 1012 Btuyr) 57 (314 x 1012 Btuyr) and 112 (620 x 1012 Btuyr) respectively of the on-site energy use for all cement and concrete (Appendix A Table A10)
CO2 emissions associated with concrete production can be calculated based on the fuels used The three major concrete operations quarrying blending and transportation account for 12 54 and 43 respectively a total of 109 of the CO2 emissions associated with both cement manufacturing and concrete production (Appendix A Table A10) CO2 emissions for concrete relative to energy usage are smaller than for cement manufacturing which produces CO2 from both reaction chemistry and fuel use
-20shy
Opportunities for Improving Energy Efficiency and Reducing CO2 Emissions
Many opportunities exist for improving energy efficiency and reducing CO2 emissions in the cementconcrete industry These opportunities come from both changes in the manufacturing and production processes and from changes in the chemical formulation of cement Process changes range from energy management improvements to investments in equipment upgrades or new technologies Formulation changes have been demonstrated to save energy and reduce emissions but their widespread adoption is slowed by the burdens of developing new industrial standards
The largest opportunities for improving energy efficiency and reducing CO2 emissions related to energy inputs in the cementconcrete industry are mostly related to cement manufacturing Table 8 lists the annual energy use and emissions associated with cementconcrete industry Pyroprocessing accounts for 74 of the cementconcrete industriesrsquo energy consumption (93 of cementrsquos manufacturing energy requirement) and operates at roughly 34 thermal efficiency This low thermal efficiency provides many opportunities to improve performance If it were possible to operate at the theoretical minimum energy requirements to produce clinker nearly 400 x 1012 Btu per year (04 quad) in energy savings could be obtained Realistic and cost-effective energy savings are smaller but achievable
Grinding and milling account for 58 (123t) of cementconcrete energy consumption These operations consume electricity and have energy efficiency ranging from 6 to 25 They offer a large opportunity for energy reduction considering that each kWh saved on-site saves nearly 3 kWh of tacit energy at the electric generation site
The potential opportunities for improving energy efficiency and lower emissions in quarrying and concrete production are smaller in terms of Btu and CO2 emissions than in cement manufacturing Quarrying and
-21shy
Table 8 - Annual Energy Use and CO2 Emissions Associated with Cement and Concrete Production
On-site Energy CO2 Emissions
109 Btu 106 tonne
RAW MATERIALS QUARRYING and CRUSHING
Cement Materials 3817 07 036 03
Concrete Materials 14287 26 128 12
CEMENT MANUFACTURING
Raw Grinding 8346 15 150 14
Kiln fuels 410464 740 3847 368
reactions 4835 463
Finish Milling 24057 43 432 41
CONCRETE PRODUCTION
Blending Mixing 31444 57 565 54
Transportation 61933 112 453 43
TOTAL 554409 100 10450 100 See Appendix A Table A10
transportation related to concrete production consume significant quantities of diesel fuel approximately 74 x 1012 Btuyear ( 550 x 106gallons) Replacement of diesel fuel with biodiesel offers an opportunity to effectively lower lifecycle emission profiles Biodiesel is a renewable energy fuel source typically containing the mono alkyl esters of long-chain fatty acids derived from vegetable oils (commonly soybean oil) or animal fats It can be blended at any level with petroleum diesel to create a biodiesel blend and can be used in compression-ignition (diesel) engines with little or no modifications It has lower emissions compared to petroleum diesel is less toxic than table salt and bio-degrades as rapidly as sugar Total US production of biodiesel was 254 x 106 gallons in 200123 Total US production represent only 46 of the diesel fuel requirement of the cementconcrete industry Hence biodiesel availability will limit the opportunity to substitute for petroleum based diesel fuel
Normally energy efficiency improvements proportionally reduce the emissions of CO2 generated from fossil fuel combustion and electricity generation However reducing cement manufacturing CO2 emissions by a percentage proportional to energy efficiency improvements is not possible More than half of the CO2 emissions associated with cementconcrete are a result of the chemical reactions necessary for converting raw materials and not a result of the energy required to produce these reactions If a near-zero CO2 emitting fuel (eg nuclear biomass) were utilized for all pyroprocessing energy needs then CO2 emissions could be reduced by 54 from approximately 104 x 106 tonnesyr to 48 x 106 tonnesyr It is also possible to reduce reaction CO2 emissions by changing the product formulation with the substitution of raw materials which provide cement-like properties
The opportunities for reducing energy usage and lowering environmental impact are described in the Pyroprocessing and Product Formulations sections below Briefly these improvements will come from
bull Managing energy more efficiently lt performing energy assessmentaudits utilizing energy
management training and implementations programs bull Upgrading existing equipment
lt shifting to more energy-efficient processes (eg from wet to dry process from dry process to preheater)
lt installing improved heat recovery systems from clinker coolers lt installing new design high-efficiency crushing grinding and
milling equipment bull Adopting new pyroprocessing technologies bull Performing the RampD necessary to develop new cement manufacturing
processes bull Utilizing biomass fuels bull Utilizing waste fuels bull Replacing high-carbon fuels by low-carbon fuels (eg shifting from coal
to natural gas) (This lowers CO2 emissions however at current fuel prices it increases operating costs)
-22shy
bull Changing cement product formulations applying a lower clinker to final cement mixture ratio (ie increasing the ratio of cement additives that do not require pyroprocessing)
bull Utilizing alternative cements (mineral polymers) bull Sequestering CO2 from the gas streams
Cement manufacturing is a highly capital intensive and competitive industry This fact combined with the long economic life of existing facilities will constrain the rate of upgrading exiting technology or adopting new technology The near-term energy and emission-reduction opportunities will mainly come from better energy management practices changes to ldquogreenerrdquo fuels and to a smaller degree changes in product formulation
-23shy
PYROPROCESSING OPPORTUNITIES
The greatest opportunities in reducing energy consumption and lowering emissions associated with cementconcrete will be obtained with improvements in cement pyroprocessing On average pyroprocessing systems in the United States operate at about 34 thermal efficiency This low efficiency implies that there are potentially significant process and system improvements to improve energy and environmental performance These process improvements will come from better energy management upgrading existing equipment (eg replacing wet kilns upgrading to preheater and precalciners) adopting new pyroprocessing technologies (eg fluidized bed systems) and in the longer term performing the RampD necessary to develop completely new concepts for the cement manufacturing processes
The typical energy balances for the major pyroprocessing systems are shown in Table 9 These balances show where energy losses occur (areas where no useful work is accomplished) Any area other than the theoretical requirement that is losing energy represents an
Table 9 - Thermal Energy Balances to Produce Clinker in Process Kilns
Wet Kiln Dry Kiln Preheater Kiln
Energy Use Area Btutonne Percent Btutonne Percent Btutonne Percent
Theoretical Requirement 1690000 305 1730000 366 1670000 496
Exit Gas Losses 713000 129 1310000 277 471000 138
Evaporation of Moisture 2120000 383 285000 60 223000 65
Dust in Exit Gas 10700 02 12300 03 1220 0
Clinker Discharge 53700 10 58000 12 62400 18
Clinker Stack 180000 33 560000 118 582000 184
Kiln Shell 642000 116 575000 121 166000 49
Calcination of Waste Dust
38600 07 17500 04 5870 0
Unaccounted Losses 84300 15 182000 38 164000 48
TOTAL 5536000 100 4734000 100 3424000 100
Source The Rotary Cement Kiln Kurt E Perry Chemical Publishing Co Inc New York page 107-111
opportunity for improving energy efficiency and lowering fuel-based emissions The large energy efficiency difference between cement processes from 5536000 Btutonne of clinker for wet process to 3424000 Btutonne of clinker for dry process with preheater shows the significant gains that can be made by upgrading to the more efficient process The individual energy use areas (eg clinker discharge kiln shell etc) in Table 9 show the area and the magnitude of the opportunities available from managing energy losses by improving specific
-24shy
equipment or practices
Pyroprocessing Energy Audits
Energy audits including kiln system performance testing and calculation of mass and heat balances are the most comprehensive approaches to improving an existing systems energy efficiency These audits can identify specific opportunities for improving energy efficiency and lowering CO2 emissions A cement manufacturing energy audit should at a minimum address the energy use areas identified in Table 9 and recommend potential actions Typically the following actions will improve energy efficiency
lt Lower kiln exit gas losses bull install devices to provide better conductive heat transfer from the
gases to the materials (eg kiln chains) bull operate at optimal oxygen levels (control combustion air input) bull optimize burner flame shape and temperature bull improve or add additional preheater capacity
lt Lower moisture absorption opportunities for raw meal and fuels (avoiding the need to evaporate adsorbed water)
lt Lower dust in exhaust gases by minimizing gas turbulence (dust carries energy away from the kiln where it is captured in dust collectors The dust is recycled into the raw meal and fed into the kiln where it is reheated)
lt Lower clinker discharge temperature (retaining more heat within the pyroprocessing system)
lt Lower clinker cooler stack temperature bull recycle excess cooler air bull reclaim cooler air by using it for drying raw materials and fuels or
preheating fuels or air
lt Lower kiln radiation losses by using the correct mix and more energy efficient refractories to control kiln temperature zones
lt Lower cold air leakage bull close unnecessary openings bull provide more energy efficient seals bull operate with as high a primary air temperature as possible
lt Optimize kiln operations to avoid upsets
Upgrading Existing Technology ndash The addition of preheater sections precalcination sections or
-25shy
more efficient clinker coolers would allow less efficient operations to maximize heat recovery The impact of upgrading can be seen by comparing the processes shown in Table 6 If all US plants upgraded pyroprocessing to the technology of the best US plant (a dry process preheater with precalciner system3 ) the industry would lower its energy consumption by approximately 30 to approximately 3230000 Btutonne of cement and lower CO2 emissions by 13 to 753 x 106 tonnesyear
Adopting New Technology ndash Large pilot-scale fluidized-bed kilns (200 tonnesday) have been developed (1996) and have demonstrated significant energy savings It is estimated that a full-scale fluidized-bed (3000 tonnesday) system will consume about 2800000 Btutonne of clinker ndash as efficient as the most advanced US kiln utilizing a preheater and precalciner and 37 more efficient than the average US plant Fluidized-bed systems are estimated to have capital costs equivalent to 88 of the capital costs of a modern cement facility and operating costs equivalent to 75 of a modern cement facilityrsquos operating costs24 They have smaller footprints and their superior combustion characteristics of fluidized beds enable the use of lower-grade lower cost coal
Fluidized-bed systems do not provide ldquoShutdown Economicsrdquo That is their operating and capital costs are not less than the operating costs of older fully capitalized kiln-based plants This slows their adoption by the industry since they are likely to be considered only for future capacity expansion The US cement industry currently operates at an average 80 kiln utilization rate25 Another barrier to adoption is the natural reluctance to invest in the large capital expenditures associated with new plant construction The risks associated with building a new technology commercial-scale plant based on the successful demonstration of a one-tenth scale facility are considered high
Cogeneration ndash Large industrial thermal energy demand offers opportunities for cogeneration of electricity andor steam production particularly if the cogeneration system is part of the initial plant design Cogeneration has demonstrated that it can significantly improve the overall energy efficiency of some manufacturing operations Five cement manufacturing plants cogenerate electricity on-site26 Currently about 38 of US cement capacity does not take advantage of preheater andor precalciner systems These plants typically have large heat losses (waste heat streams) Utilization of waste heat in preheater heat exchange systems is usually more energy efficient than the cogeneration of electricity with its inherently low conversion efficiency of thermal to electrical energy (typically about 9935 Btu are required to produce 1 kWh (3412 Btu)) Cogeneration of steam at a cement plant is possible but typically cement plants require little steam and are located in isolated areas where markets for excess steam generation are not available
Biomass Fuels ndash Trees plants and crops (biomass) incorporate (sequester) CO2 as carbon compounds as they grow On a life-cycle basis where the life-cycle includes both the growth phase and the use phase (combustion) there is a near net-zero emission of CO2 associated with the use of biomass fuels (Net life-cycle emissions are not zero because energy is used to gather increase density reduce moisture deliver and store biomass fuels) Therefore the use of biomass
-26shy
fuels for pyroprocessing can provide energy with low-net CO2 emissions
Cement pyroprocessing is suited to utilizing biomass as an ancillary fuel Careful system design is required to account for biomass combustion characteristics (moisture load flowability burn temperature) and byproducts (ash composition) Biomass fuels do not improve energy efficiency per se however they do replace conventional fuels and lower life-cycle CO2 emissions Burning biomass fuels can offer other indirect benefits
lt US dependence on imported fuels is reduced lt crops grown exclusively for energy production can provide economic
opportunity for underutilized agricultural lands lt energy crops require fewer herbicides and pesticides compared to row
crops and lt chemical runoff into surface water and groundwater is reduced
An additional benefit of burning biomass over fossil fuels is the reduction of sulfur dioxide (SO2) emissions Most forms of biomass contain small amounts of sulfur therefore biomass being burned emits little sulfur dioxide (SO2) For example using biomass for 5 of a coal-fired heat input would reduce SO2 emissions by approximately 5 This benefit may not be fully realized in cement kiln operations Limestone in the cement kilnrsquos raw meal acts as a natural SO2 scrubber resulting in low SO2 emissions Hence biomass fuels will not significantly change the SO2 emissions associated with cement kiln operations
AlternateWaste Fuels ndash Utilization of alternatewaste fuels does not directly improve the energy efficiency or lower the CO2 emissions of cement manufacturing However it does reduce the use of conventional fuels lowers US dependence on imported fuels and reduces waste material sent to landfills Depending on the alternatewaste fuel used it can be argued that there are real indirect energy savings and emission reductions Placing a quantitative value on these indirect energy savings and emission reductions however is problematic
Cement pyroprocessing is currently used for and highly suited to the disposal of alternate or waste fuels such as used solvents oils tires carpets and other hazardous wastes (see fuel mix Table 3) In the case of many hazardous wastes cement pyroprocessing is more advantageous than commercial incinerators Time temperature and turbulence are the three most important factors to ensure the destruction of organic andor hazardous organic wastes Cement pyroprocessing systems have a high degree of mixing have long gas residence times and burn hotter (30 higher than the temperatures in a commercial hazardous waste incinerator) than a typical thermal waste treatment facility Cement kilns are very large and have a high heat capacity Temperatures cannot change quickly due to process upsets ensuring that waste destruction is complete Limestone also acts as a natural dry scrubber inside the kiln to capture chlorine and sulfur compounds as well as some metals Organic materials are completely combusted Cement kilns easily achieve a Destruction and Removal Efficiency of at least 9999 percent as required by US Environmental Protection Agency regulations for most organic wastes However care must be taken for high volatile elements (ie mercury thallium etc)
-27shy
Kilns operate with a temperature profile along their length that controls the sequence of kiln reactions and phase changes Waste materials combust and burn at different temperatures under different conditions Solid waste fuels need to be introduced into the kiln in such a manner as to not significantly change the temperature profile and chemical reactions It is sometimes necessary to add solid waste through a hatch or valve structure in the kiln shell This is technically challenging and creates an additional source of thermal and emission losses
Receiving and handling of alternate or waste fuels can raise technical liability and political concerns Cement manufacturing companies do not desire to be labeled as handlers of hazardous wastes and surrounding communities have valid concerns about hazardous waste transport and final emissions These concerns can be difficult to address and in some cases are perceived as a financial liability to the cement manufacturer
GRINDING AND MILLING OPPORTUNITIES
Grinding and milling operations are notoriously energy inefficient Typical systems routinely run at 6 to 25 on-site energy efficiency17 Although these systems do not account for a large portion of the on-site energy consumption profile of a cement plant they do offer significant opportunities for energy improvement Raw material grinding and finish mill systems should be evaluated for both efficiency of energy usage and cement quality Modern finish mill systems may comprise several units of process equipment ndash high-pressure twin-roll presses tube mills ball mills and conventional or high-efficiency separators Air flow and material and heat balances should be measured and evaluated Optimization of these systems may include
lt Adjustment of ball charges lt Studies of circulating loads lt Analyses of Tromp curves lt Modifying particle size distribution lt Controlling gypsum dehydration
-28shy
PRODUCT FORMULATION CHANGES TO IMPROVE ENERGY EFFICIENCY
Energy efficiency improvements and emission reductions can also result from changes in the Product Formulation of cement Research has shown that energy-saving modifications are possible without a loss in concrete performance These modifications include the addition of limestone and other cement-like materials (eg fly ash furnace slag or other pozzolanic materials) that do not require the large energy inputs and emissions associated with pyroprocessing
Changes to cement product formulations require significant time to be incorporated into ASTM standards and be accepted in the marketplace An ASTM committee (C0110) is considering a proposal to allow 5 limestone in portland cement This formulation is supported with over thirty years of research and 20 years of field experience that confirms that this formulation change meets all chemical and physical property requirements Current European (EN197) and Canadian (CSA A5) specifications allow this formulation This change in product formulation results in roughly a 5 decrease in energy use and a 26 reduction in CO2 emissions Concrete producers specify cement based on ASTM standards in order to guarantee the performance characteristics of concrete Changes to these formulations are perceived as ldquoriskyrdquo because change represents a move away from standards that have a long and well-documented performance history
Pozzolan
Materials that can be added to cement to extend its volume without a significant loss of properties are known as ldquopozzolansrdquo They are named after the ash deposits adjacent to the Pozzol volcano that the Romans used as cement The Pantheon in Rome is a testament to the high strength and durability of pozzolan cement Its hemispherical dome 141 feet (43 meters) in diameter is made completely from pozzollan cement and does not contain any reinforcing bars It has been in use since 135 AD (for comparison the US Capital dome is 96 feet in diameter)
The addition of pozzolan to cement will modify its characteristics Depending on the type of pozzolan chosen the density and compressive strength of the formed concrete may be increased and porosity reduced Pozzolanic materials can combine with uncarbonated lime (calcium hydroxide) to form stable compounds thus reducing the risk of early leaching or frost damage and increasing the potential durability of the mortar
Pozzolan materials in general do not require pyroprocessing and hence can save very significant quantities of energy and lower emissions when supplementing regular cement Concrete research is now calling for increased usage and high-volume usage of pozzolans especially fly ash Some have suggested that all concrete should contain fly ash 27 The economic and environmental advantages of adding pozzolan would seem to indicate that their regular and high-volume use will become standard practice in the concrete industry The US Environmental Protection Agency requires fly ash content in concrete to be used in buildings that receive
-29shy
federal funding
Coal-fired power fly ash is sometimes used as a source of silica in cement manufacturing but more commonly is used in concrete production as a substitute for a portion of the cement This is beneficial in two ways it reduces solid waste and overall energy use since it does not require pyroprocessing Fly ash can readily be substituted for 15 to 35 of the cement in concrete mixes and in some applications fly ash content can be up to 70 These addition change the performance characteristic of the concrete Of the 68 million short tons of coal fly ash produced in 2001 124 million short tons were used in cement and concrete products28 Fly ash can contain elements (eg carbon) compounds (eg ammonia) and other constituents that are detrimental to concrete performance
Fly ash and slags react with any free lime left after the hydration to form calcium silicate hydrate which is similar to the tricalcium and dicalcium silicates formed in cement curing This process increases strength improves sulfate resistance decreases permeability reduces the water ratio required and improves the pumpability and workability of the concrete Western coal-fired power plants produce better fly ash for concrete than eastern plants because of lower sulfur and lower carbon content in the ash Fly ash from incinerators cannot be used Portland cement with fly ash added is sometimes identified with the letter P after the type number (eg Type IP)
Other industrial waste products including blast furnace slag cinders silica fume and steel mill scale are sometimes substituted for some of the aggregate in concrete mix Recycled concrete can be crushed into aggregate and reused in the concrete mix However the irregular and higher surface area of crushed concrete aggregate is more costly than sand or crushed stone because it takes more cement slurry to coat the surface
-30shy
Endnotes
1 Emission of Greenhouse Gases in theUnited States 2001 Energy Information Agency DOE December 2002 page 31
2Cement Manufacturing Energy Solutions Center Inc Washington DC Copyright DTE Energy TechProcopy2001 Version11 October 2002
3Concrete Sustainability and Life Cycle - Life Cycle Research Reports 1994 through 2000 This CD contains 31 reports with a focus on concrete Cement is a key component in a LCA and data are presented in many of these reports
4 2000 US AND CANADIAN LABOR-ENERGY INPUT SURVEY Portland Cement Association March 2002 page 3
5 Emission of Greenhouse Gases in the United States 2001 page 31
6 Integrated Pollution Prevention and Control (IPPC) Reference Document on Best Available Techniques in the Cement and Lime Manufacturing Industries March 2001 European Commission Directorate-General Joint Research Centre Institute for Prosepective Technological Studies Technology for Sustainable Development European IPPC Bureau page 26
7 Integrated Pollution Prevention and Control (IPPC) Reference Document on Best Available Techniques in the Cement and Lime Manufacturing Industries page 27
8 Integrated Pollution Prevention and Control (IPPC) Reference Document on Best Available Techniques in the Cement and Lime Manufacturing Industries page 27
9 Mineral Commodity Summaries US Geological Survey Jan 2003 page 44
10 Cement US Geological Survey Minerals Yearbook -2001 Hendrik G van Oss page 161
11 US Cement Industry Factsheet Portland Cement Association Il 2002 Edition Update Table 17
12 US Cement Industry Factsheet Table 14
13 US Cement Industry Factsheet page 14
14 Ready Mixed Concrete Industry An Integral Part of the American Economy National Ready Mixed Concrete Association Washington DC January 2002
15 Cement US Geological Survey Minerals Yearbook -2001 Table 16
-31shy
16 Encyclopedia of Chemical Technology Kirk-Othmer 3rd edition 1979 John Wiley amp Sons NY NY Volume 5 page 165
17 Encyclopedia of Chemical Technology Volume 14 page 343
18 Energy and Environmental Profile of the US Mining Industry US Department of Energy Office of Industrial Technologies Mining Industry of the Future page 9-8
19 Energy and Environmental Profile of the US Mining Industry page 9-8
20 Chemical Engineering Handbook Fourth edition John H Perry McGraw-Hill Book Company page 8-8
21 The Rotary Cement Kiln Kurt E Perry 1986 Chemical Publishing Co Inc New York page 107
22 Chemical Engineering Handbook page 8-8
23 Alternatives to Traditional Fuels 2000 September 2002 US Department of Energy table 10
24 Kawasaki Heavy Industries Ltd website (httpwwwkhicojpproductssankisanfakshtm) FAKS (Fluidized Bed Advanced Cement Kiln System)
25 US Cement Industry Factsheet Portland Cement Association Il 2002 Edition Update Table 14
26 Cement US Geological Survey Minerals Yearbook -2001 Hendrik G van Oss Table 8
27 Mineral Admixtures John Scanlon ACI Compilation 22 1992
28 2001 Coal Combustion Product Survey American Coal Ash Association Aurora CO
-32shy
Table A1 - Cement Manufacturing by Pyroprocess System
Note This table provides kiln information based on survey data collected by the Portland Cement Association It represents approximately 95 of the US cement manufacturing companies 92 of US production and 93 of US kilns In total the United States has 204 operating kilns and produced 78451000 metric tons in 2001 (US Geological Survey Minerals Yearbook - 2001 Cement Hendrick G van Oss Table 5)
Number of Kilns
Percent Kilns
Metric Tonnes clinker
produced in 2001
Percent Tonnes
Wet Process Dry Process
No Preheater or Precaliner PreheaterPrecalciner Preheater Only Precalciner
54 136
59 77 35 42
284 716 311 405 184 221
14029433 57831070 12953759 44877311 13832465 31044846
195 805180625192432
Total 190 100 71860503 100 Source 2000 US and Canadian Labor-Energy Input Survey Portland Cement Association
Table A2 - Total US Clinker and Cement Supply based on 2001 data from the US Geological Minerals Yearbooks
78451000 1884000
U S Clinker Manufacturing US Clinker Imports
a b
80335000 Total US Clinker Manufacturing and Imports c
84450000 4450000
Total US BuildingPortland Cements Total US Masonry Cements
d e
88900000 Total US Cement (USGS) f 91037000 Total US Cement (PCA) g
Sources
a - US Geological Survey Minerals Yearbook - 2001 Cement Hendrick G van Oss Table 5 b - US Geological Survey Minerals Yearbook - 2001 Cement Hendrick G van Oss Table 12 c - Sum of US Clinker Manufacturing and Imports d - US Geological Survey Minerals Yearbook - 2001 Cement Hendrick G van Oss Table 3 e - US Geological Survey Minerals Yearbook - 2001 Cement Hendrick G van Oss Table 4 f - sum of Portland and Masonry Cements g - For comparison 2001 Portland and Masonry Cements total from United States Cement Industry
Fact Sheet 2003 Portland Cement Association
Table A3 - Raw Materials (non-fuel) for Clinker and Cement Production in the United States and Puerto Rico
2001 Clinker 2001 Cement
tonnes (a)
loss on ignition
percent (b)
tonnes (a)
non - clinker percent
Calcareous Limestone 95600000 706 437 1600000 222 Cement Rock 21900000 162 372 100000 14 Kiln Dust 600000 04 100000 14 Lime 300000 02 40000 06 Other 20000 00 20000 03
Aluminous Clay 4500000 33 80 10000 01 Shale 3200000 24 82 10000 01
Other (includes bauxite alumina aluminum dross ) 500000 04
Ferrous Iron Ore Pyrites Other 1500000 11
Siliceous Sand and Calcium Silicate 3500000 26 Sandstone Quartzite Other 500000 04 66 Fly Ash 1600000 12 70000 10 Other Ash 800000 06 Blast Furnace slag 200000 01 300000 42 Steel slag 500000 04 Other slags 50000 00 5000 01
Pozzolans 100000 01 59000 08 Miscellaneous 40000 00 50000 07
TOTAL Raw Materials for Clinker Manufacturing 135410000 100
Total Clinker Manufactured -based on kiln processing ignition losses for limestone cement rock
84831000 63
and other raw materials (c)
Total CO2 Emissions (d) 49924000 37
Cement Non-Clinker Raw Materials continued Gypsum 4800000 665
Other 50000 07 Total non-Clinker Materials 7214000 100
Cement Raw Materials tonnes percent Total non-Clinker Materials 7214000 8 Imported Clinker 2950000 3 Clinker Manufactured (c) 84831000 89 TOTAL Cement Production 94995000 100
Source a - US Geological Survey Minerals Yearbook - 2001 Cement Hendrick G van Oss Table 6
b - Encyclopedia of Chemical Technology 3rd Edition Kirk-Othmer John Wiley amp Sons NY NY 1979 Vol 5 page 171
c - Calculated weight loss based on ignition losses Ignition loss is a measure of the CO2 H20 and other products release at high temperature Ignition loss data are available for 93 of the raw material Ignition loss values for the remaining raw materials are assumed to be small
d - CO2 emissions assumes that ignition losses for limestone (437) and cement rock (372) are all CO2 (Note CO2 accounts for 44 of pure CaCO3 ignition loss)
cement
Table A4 Important Ratios and Numbers for Raw Materials Quarried Clinker Raw Materials
131660000 Quarried Clinker Raw Materials (total minus kiln dust ash and slag)
1434 Mass Ratio of Quarried Clinker Raw Materials to Cement Manufactured from US Manufactured Clinker 1552 Mass Ratio of Quarried Clinker Raw Materials to Clinker Manufactured
1127 Mass Ratio of Limestone Quarried to Clinker Manufactured
1785 Mass Ratio of CaCO3 to CaO
1776 Mass Ignition Ratio for limestone (beforeafter)
Quarried Cement Raw Materials 6739000 Quarried Cement Raw Materials (total minus kiln dust ash and slag)
0071 Mass Ratio of Quarried Cement Raw Material to Cement
Calcine Reaction Data 0589 Ratio for chemical reaction tonne of CO2 per tonne of manufactured
clinker 0544 Ratio for chemical reaction tonne of CO2 per tonne of manufactured
Source Values are based on the data presented in Table A3
Table A5 - Energy Use Associated with Limestone Quarrying
Btutonne Limestone
Tacit Btutonne Limestone
Primary Fuel
kilogram CO2
per tonne Limestone (a)
QUARRYING Percussion Drill 6140 6377 Diesel 04491 Hydraulic Shovel 5670 5888 Diesel 04148 Rear-Dump Truck 4030 4185 Diesel 02948 Bulldozer 3420 3552 Diesel 02502 Pick-Up Trucks 2250 2468 Gasoline 01596 Water Tanker 1170 1215 Diesel 00856 Service Truck 1120 1163 Diesel 00819 Lighting Plant 66 192 Electric 00119 Front-End Loader 187 194 Diesel 00137 Bulk Truck 147 153 Diesel 00108 Pumps 2250 6548 Electric 04044 Grader 7 7 Diesel 00005
subtotal 26457 31943 21772 BENEFICIATION
Conveyor 182 530 Electric 00327 Screens 366 1065 Electric 00658 Primary Crushers 1830 5326 Electric 03289 Secondary Crushers 1097 3193 Electric 01972
subtotal 3475 10113 06246 TOTAL 29932 42056 28017 Source Energy and Environmental Profile of the US Mining Industry US Department of Energy Industrial Technologies Program page 9-9a - Carbon dioxide emissions are calculated based on the Btutonne of limestone times the carbon emission equivalent in Table A15 for the specific fuel times the ratio of CO2 to C (4412)
Table A6 - Energy Associated With Quarrying Raw Materials Necessary to Manufacture Cement
These values assume that all quarried raw materials
used in cement manufacturing require
the same energy per mass as does limestone
quarrying
Quarrying Energy
Btutonne cement
a
Quarrying Energy Tacit
Btutonne cement
b
Quarrying
kilogram CO2
per tonne cement
c 42931 60321 402
a - Btu per tonne of limestone from Table A5 multiplied by 143 which is the mass ratio of quarried clinker raw materials to cement manufactured from US manufactured
clinker Table A3
b - Same as (a) but using tacit energy values from Table A5
c - Same as (a) but using carbon dioxide emission values from Table A5
Table A7 - Energy Associated With Quarrying Raw Materials Necessary for the Production of Concrete
These values assume energy ratios described
below
Mass Quantity Relative to
Cement
a
Quarrying Energy
Btutonne cement
b
Quarrying Energy Tacit
Btutonne cement
c
Quarrying
kilogram CO2
per tonne cement
d Sand Gravel or Crushed Stone
TOTAL
283 400
59118 101594 160712
76956 138434 215389
518 926
1443
a - Common weight ratio of concrete raw materials to cement for ready mixed cement is used for all cement products (34 sand to 12 cement) (48 crushed stone to 12 cement)
b - For the raw material sand this value is assume to be equal to limestone quarrying energy less the percussion drilling primary and secondary crushing operations For gravel or crushed stone this value is assumed to be equal to limestone quarrying energy less half of the percussion drilling primary and secondary crushing operations
c - Tacit adjust uses the same basis described in (b) above d - Carbon dioxide emission use Table A5 values adjusted for the basis described in (b) above
A14
Table A8 - Energy Consumed by Fuel Type in Cement Manufacturing (excluding Quarrying)
All Fuel Tacit Fuel 2001 US Annual tonnes Table A2 Plants Percentage All Percentage CO2
Clinker Production 78451000 10^9 Btu Plants emissions Cement Production 88900000 10^9 Btu 10^6 tonnes
(a) (b) (d)
FUELS Coal 265284 60 266703 50 24931 Petroleum Coke 67628 15 67628 13 6906 Natural Gas 23258 5 23326 4 1234 Middle Distillates 3500 1 3626 1 0266 Residual Oil 344 0 355 0 0027 Gasoline 407 0 447 0 0029 LPG 25 0 25 0 0002
WASTE FUELS Oils 1334 0 1334 0 0086 Solvents 22397 5 22397 4 1081 Tires 10258 2 10258 2 1218 Solids 1119 0 1119 0 0082 Misc 673 0 673 0 0049
Subtotal 396226 89 397890 35911
ELECTRICITY Raw Material Grinding (c) 8346 2 24291 5 Pyroprocessing 14238 3 41437 8 Finish Milling (c) 24057 5 70014 13
Subtotal 46642 11 135742 8383
TOTAL 442868 100 533632 100 4429 a - These values are adjusted to reflect the entire 2001 US production of cement shown in Table A2 (88900000 tonne) The data are based on Btutonne of cement values reported in the 2000 US and Canadian Labor-Energy Input Survey by Portland Cement Association page 12 These are based on surveys of approximately 90 of US capacity b - Tacit values are calculated using the All Plants data multiplied by the appropriate tacit correction factor listed in Table c - Electricity is proportioned by applying percentages used in The Reduction of Resource Input and Emissions Achieved by the Addition of Limestone to Portland Cement M A Nesbit Portland Cement Association 1996 page 6
d - Carbon dioxide emissions are calculated based on the Btu value times the carbon emission equivalent in Table A15 for the specific fuel times the ratio of CO2 to C (4412)
Table A9 - Fuel and CO2 Differences in Cement Manufacturing between 1971 and 2000
Onsite Production Btutonne Cement
1971 CO2
Production tonnetonne
Cement
Onsite Energy Use Btutonne Cement
2000 CO2
Production tonnetonne
Cement FUELS Coal 2639000 02480 2984100 02804 Petroleum Coke 39600 00040 760700 00777 Natural Gas 3347100 01776 261600 00139 Middle Distillates 88300 00065 39400 00029 Residual Oil 808900 00631 3900 00003 Gasoline 7400 00005 4600 00003 LPG 1400 00001 280 00000
WASTE FUELS Oils 0 15000 00010 Solvents 0 251900 00122 Tires 0 115400 00137 Solids 0 12600 00009 Misc 0 7600 00006
FUELS Subtotal 6931700 04999 4457080 04038 ELECTRICITY 488600 00878 524700 00943
TOTAL 7420300 05877 4981780 04982
Decrease in energy and emissions levels from 1971 to 2000 33 15
Btutonne of cement 4981780 03945 Percent change 0 21
Total CO2 Emissions are a function of the fuels used If year 2000 cement manufacturing plants used the 1971 fuel mix ratio CO2 emission would be lower by 21 in year 2000
Source Cement Industry Fact Sheet 2002 edition Portland Cement Association
Table A10 - Annual Energy Use Associated with US Cement Manufacturing and Concrete Production from US Cement Kiln operations pyroprocessing accounts for the vast majority of energy consumption and CO2 emissions in the cement and concrete industries Kilns consume 742 of the energy and produce 813 of the CO2 emissions associated with the cement and concrete industries Kilns consume 82 of the energy and produce 94 of the CO2 emissions associated with the cement manufacturing
Onsite Tacit Annual Onsite Tacit Annual Annual Annual CO2 Annual Annual CO2
Energy Use Energy Use Production Energy Use Energy Use Production 10^9 Btu 10^9 Btu 10^6 tonnes
Quarrying cement raw materials (a) 3817 5363 036 07 07 03 concrete raw materials (b) 14287 19148 128 26 25 12
Cement Manufacturing (c) raw material grinding 8346 24291 150 15 32 14 kiln fuels 410464 439327 3847 740 574 368 kiln reactions (d) 4835 463 finish milling 24057 70014 432 43 91 41
Concrete Production (e) raw material mixing 31444 122017 565 57 159 54 transport 61993 85842 453 112 112 43
Total 554409 766001 1045 100 100 100 a - Values from Table A6 adjusted for USGS cement production estimates for 2001 b - Values from Table A7 adjusted for USGS cement production estimates for 2001 c - Values from Table A8 d - Values from Table A3 and A4 e - Values from Table A13 adjusted for the assumption that all concrete energy use and emissions will be equivalent to ready mix values
Table A11 - Energy Use per Tonne Associated with US Cement Manufacturing and Concrete Production from US Cement
Onsite Tacit CO2 Onsite Tacit CO2
Energy Use Energy Use Production Energy Use Energy Use Production Btutonne Btutonne tonnetonne Cement Cement Cement
Quarrying cement raw materials (a) 42931 60321 00040 07 08 03 concrete raw materials (b) 160712 215389 00144 26 27 12
Cement Manufacturing (c) raw material grinding 93885 273235 00169 15 34 14 kiln fuels 4617146 4941815 04327 740 615 368 kiln reactions (d) 05438 463 finish milling 270610 787561 00486 43 98 41
Concrete Production (e) raw material mixing 353704 1029390 00636 57 128 54 transport 697337 724198 00510 112 90 43
Total 6236325 8031910 11751 100 100 100
a - Values from Table A6 b - Values from Table A7 c - Values from Table A8 adjusted for USGS cement production estimates for 2001 d - Values from Table A3 and A4 e - Values from Table A13 adjusted for USGS cement production estimates for 2001 adjusted for the assumption that all concrete energy use and emissions will be equivalent to ready mix values
Table A12 - Costs Associated with Ready Mixed Concrete Production 2002 Cost Range
Cubic Yards 390646000 $yd $yd
Utilities $075 $100 Fuel $118 $209 Environmental $005 $010 Sales Price $6500 $8000
Source Based on information provided in a conversation with Mr Herbert of the National Ready Mix Concrete Association
Table A13 - Projection of Energy Consumption for Ready Mixed Concrete Using Average of Cost Range Values for Ready Mixed Concrete Table A12 and Quarrying Data from Table A7
Tacit kg CO2
Annual Cost 10^9 Btuyr Btutonne Btutonne per tonne of Cement of Cement of Cement
a b c d e Quarrying 1 13248 160712 215389 144 Mixing amp Blending 2 $ 341815250 29157 353704 1029390 636 Transportation 3 $ 638706210 57484 697337 724198 510
TOTAL 99888 1211753 1968978 129
Note the total Btu consumed per year are higher in this table for concrete operations than the values shown in Table A10 This table is based on the combined total of US manufactured cement and imported cement
1- The data for ready mixed quarrying energy requirements is based on the quarrying energy requirements developed in Table A7 multipled by the propotion of the cement market that goes into ready mixed
The cement ready mixed portion is 75 2- Mixing and Blending operations are predominatly electric based and are assumed to be fully reflected in the utility
cost in Table A12 3- Fuel costs in Table A12 are predominately related to Transportation of the mixedblended aggregate and cement
plus water to the work site Diesel is the predominate fuel a - average price multiplied by annual production from Table A12 b - annual cost (a) divided by cost per energy unit - electric $004 $kWh or $(3412 Btu)
- fuel $150 $gal c - Btuyr (b) divided by the cement required to produce concrete using the values
2300 kgm3 for concrete and 12 weight cement to concrete
d - Btutonne of cement (c) times tacit correction factor from Table A14 (Fuel assume to be diesel) e - Annual CO2 production based on the c column times the carbon emission equivalent in Table A15 value for the
specific fuel times the ratio of CO2 to C (4412)
Table A14 - Calorific and Process Energy Values Associated with Fuels Calorific energy values are the energy content inherent to the material Except for pure materials eg propane these values vary depending on the raw
materials used and the final products formulations Process energy is a measure of the energy required to manufacture the material Process Energy values are also variable and depend on equipment
efficiency estimates and system boundaries These values for crude oil-derived products are variable and depend on the specific crude processed refinery configuration local product specifications and refinery efficiency Process energy values from the CEC include the energy for processing as well as factors for raw material eg delivery of crude to refiners and transporting fuels to their point of use
Tacit or gross energy is the sum of the calorific and process energy values The Tacit Correction factor is the ratio of the Tacit Energy value divided by the inherent or calorific energy value
Cement concrete
input units
Coal Industrial short ton Coal electric utility short ton BituminousSub short ton Petroleum Coke short ton Green Coke short ton Calcined Coke short ton Pitch
Natural Gas million ft3 Fuel Oil light gallon Fuel Oil medium gallon Residual Fuel Oil gallon Distillate fuel gallon Lube Oil gallon Gasoline gallon Kerosene gallon Diesel gallon LPG gallon Propane gallon Solvent gallon Rolling Oil gallon
WASTE shyOils gallon Solvents gallon Tires ton Solids Misc
Electric Average US Electric Coal-Fired Electric
Calorific Energy Values Primary-Energy
Process Energy Values Secondary-Energy
Tacit Energy
Tacit Correction
Factor
Data Btu per
Source Input UnitBtu per Common Unit
FUELS Data Btu per
Source Input Unit
Btu per Common Unit Required to
Produce
Btu per Input
input unit Unit
Fuels and Fuels used as materials 22433000 Btuton AEO2003 22433000 60 Btulb EampE Mining 120000 22553000 1005 20511000 Btuton AEO2003 20511000 60 Btulb EampE Mining 120000 20631000 1006
11110 Btulb CIA2000 22220000 60 Btulb EampE Mining 120000 22340000 1005 30120000 Btuton MECS 30120000 30120000 1000
14200 Btulb MidCon 28400000 Btulb Drexel 28400000 1000 15250 Btulb MidCon 30500000 179 Btulb EampE pg 52 358000 30858000 1012
1027 Btuft3 AEO2003 1027000000 30 Btuft3 3000000 1030000000 1003 150000 Btugal cogenerationnet 150000 5000 Btugal Drexel 5000 155000 1033 139000 Btugal cogenerationnet 139000 5000 Btugal Drexel 5000 144000 1036
6287000 Btubbl AEO2003 149690 5000 Btugal Drexel 5000 154690 1033 5825000 Btubbl AEO2003 138690 5000 Btugal Drexel 5000 143690 1036 6065000 Btubbl EIA 144405 5000 Btugal Drexel 5000 149405 1035 5202000 Btubbl AEO2003 123857 12000 Btugal CEC 12000 135860 1097 5670000 Btubbl AEO2003 135000 5200 Btugal CEC 5200 140200 1039 5670000 Btubbl EIA 135000 5200 Btugal CEC 5200 140200 1039 3603000 Btubbl AEO2003 85786 85790 1000 3824000 Btubbl EGGUS 91048 91050 1000 5248000 Btubbl EIA naphtha 124952 12000 Btugal Drexel 12000 136952 1096 6065000 Btubbl EIA 144405 5000 Btugal Drexel 5000 149405 1035
95 - 150000 Btugal a b 122500 100085 - 100000 Btugal a b 92500 1000
22 - 35000000 Btuton a b 28500000 100010001000
ELECTRICITY 1 kWh ISO 3412 Hydroelectric Utility ISO - 3412 1000 1 kWh ISO 3412 Average US Grid c 6523 9930 2910 1 kWh ISO 3412 Coal-Fired Utility c 7097 10510 3080
tacit Btu accounts for generation and transmission energy losses for average US generation SOURCES
AEO2003- Annual Energy Outlook 2003 Energy Information Administration US DOE Jan 2003 page 249 CEC - California Energy Commission CIA2000- Coal Industry Annual 2000Energy Information Administration Jan 2002 page 284 -This report uses an average value for bituminous and sub-bituminous coals Drexel - data approximations derived from Drexel University study EampE - documents from DOE - OIT these are from the Energy and Environmental Profiles of the Aluminum and Mining Industries EGGUS - Emissions of Greenhouse Gases in the United States 1987-1992 Energy Information Administration US DOE Oct 1994 Appendix A MidCon- Data from Mid-Continent Coal amp Coke Co
MECS - Energy Information Administration US DOE Manufacturing Energy Consumption Survey -1994 a - Heat range values form US and Canadian Labor-Energy Survey 2000 Portland Cement Association b - There are negligible secondary energy additions for waste fuels The final tacit value is assumed to be the midpoint of reported heat values c - Secondary energy requirements for electricity are based on the heat rate given in Table A16 minus 3412 Btu
Table A15 - Carbon Equivalent Emission Coefficients for Fuels Associated with Cement Production This table presents the carbon equivalent emission values for the fuels and materials associated with the production of cement The carbon dioxide equivalent can be obtained by multiplying the carbon equivalent by (4412) the mass ratio of carbon dioxide to carbon
FUEL
Btu per Input Unit
Tacit Input Unit
Carbon Emission
Coefficient
MtQBtu
Carbon Emission
Coefficient Source
Percent API Carbon Gravity (EGGUS) (EGGUS)
Density Poundsgal
(EGGUS)
Million Btubbl (EGGUS)
Coal BituminousSub Petroleum Coke Green Coke Calcined Coke Pitch Natural Gas Fuel Oil light (2) Fuel Oil medium Residual Fuel Oil Distillate Fuel Oil Lube Oil Gasoline Kerosene Diesel LPG Propane
WASTE shyOils Solvents Tires Solids Misc
22553000 22340000 30120000 28400000 30858000
-1030000000
155000 144000 154690 143690 149405 135860 140200 140200 85790 91050
122500 92500
28500000 --
short ton short ton short ton short ton short ton
-million ft3
gallon gallon gallon gallon gallon gallon gallon gallon gallon gallon
gallon gallon
ton --
2563 2581 2785 2785 2785 2062 1447 1995 2072 2129 1995
1934 1972 1995 1699 1720
1763 1317 3239
2020
EGG2000 EGGUS
EGG2000 EGG2000
c d
EGG2000 b a
EGG2000 EGG2000
EGG2000 EGG2000 EGGUS
EGG2000 EGGUS
efg
na na
923 na
858 256
863 339
857 170
866 586 861 414 863 355
9543
7064
7064
6024
5825
6287
5253 5670 5825
Electricity Hydro Electric
Average US Electric Coal-Fired Electric
4902 7697
lbsCO2kWh
135 CDE 212 CDE
MtQBtu - million metric tons of carbon per Quadrillion Btu (10^6 metric tons 10^15 Btu)
SOURCES EGG2000 - Emission of Greenhouse Gases in the United States 2000 Energy Information Administration US DOE Nov 2001 page 140 EGGUS - Emissions of Greenhouse Gases in the United States 1987-1992 Energy Information Administration US DOE Oct 1994 Appendix A CDE - Carbon Dioxide Emissions from the generation of Electric Power in the United States Oct 15 1999 DOE amp EPA a - Medium Fuel Oil values are the average of the light and heavy fuel oil values b - Diesel and light fuel oil is assumed to have the same carbon coefficient in EGGUS c - Green coke and Calcined coke are assumed to have the same carbon coefficient d - Pitch is assumed to have the same carbon coefficient as asphalt reported in EGGUS e - Waste fuel oils are assumed to have the same carbon coefficient as Medium Fuel Oil f - Waste solvents are assumed to have the same carbon coefficient as gasoline reported in EGG2000 e - Waste fuel oils are assumed to have the same carbon coefficient as Coal reported in EGG2000
Table A16 - Electric Generation Heat Rates U S
Electricity
Produced in 2001 1
billion kWh a
Units Consumed 2
b c
Heat Content
10^9 Btu
Consumed
b x c
BtukWh
a (b x c )
Coal 19040 9756 106 short tons 20511000 Btuton 3 20009916 10509
Petroleum
320 106 bbl Distillate 5825000 Btugal 3 186517
1632 106 bbl Residual 6287000 Btubbl 3 1025837
14 106 bbl Other Liquids 5670000 Btubbl 5 7932
4 106 short tons Coke 14200 Btulb 6 118116
sub-Total 1260 1338402 10622
Natural Gas 6130 5690 109 ft3 1019 Btuft3 3 5798110 9459
Other gases 141 127 1012 Btu 127000 9007
Nuclear 7688 10623 BtukWh 7 8166962 10623
Hydroelectric 2175 3412 BtukWh 4 742110 3412
Renewable 798 808 1012 Btu 808000 10125
Other 50 49 1012 Btu 49000 9800
TOTAL 37282 37039500 9935
Source 1 AER2001 - Annual Energy Review 2001 Table 82a Electricity Net Generation page 224 2 AER2001 - Annual Energy Review 2001 Table 83a Consumption of Combustible Fuels for Electricity
Generation page 229 3 AEO2003- Annual Energy Outlook 2003 Energy Information Administration US DOE Jan 2003
page 249 4 Convention based on assumed value used by EIA and others 5 assume diesel fuel is the majority of other fuels 6 Data from Mid-Continent Coal amp Coke Co for green petroleum coke 7 AER2000 - Annual Energy Review 2000 Table A6 Nuclear SteamElectric plants page 336
CEEO_Appendix_16
APPENDIX B - Portland Cement Types and Their Use
The American Society for Testing and Materials (ASTM) Specification C-150 provides for eight types of portland cement ASTM standards serve as the basis for manufacturing procurement and regulatory activities More than 92 of portland cement produced in the United States is ASTM Type I and II (or Type III) Type III accounts for about 35 of cement production Type IV and Type V account for less than 05 of production Although IA IIA and IIIA (air-entraining cements) are available concrete producers prefer to use an air-entraining admixtures during concrete manufacture where they can get better control in obtaining the desired air content
ASTM Type Use
I1
General purpose cement when there are no extenuating conditions Widely used for concrete construction including pavements building foundations bridges floors and various precast concrete products Some ready mixed concrete producers add admixtures to meet specific job requirements
II2 Aids in providing moderate resistance to sulfate attack
I-II Meets the specification requirements for both Type I and Type II the most widely used type for all kinds of concrete construction
III Used when high-early strength is required It is chemically and physically similar to Type I except that its particles have been ground finer It is used when forms need to be stripped as soon as possible or when the structure must be put into service quickly
IV3 When a low heat of hydration is desired (Used in massive structures)
V4
When high sulfate resistance is required Type V gains strength more slowly than Type I cement and is used only in concrete exposed to severe sulfate action - principally where soils or groundwaters have a high sulfate content This cement is particularly effective for structures such as sewage treatment plants and septic tanks
IA4 A type I cement containing an integral air-entraining agent
IIA4 A type II cement containing an integral air-entraining agent
IIIA4 A type III cement containing an integral air-entraining agent
1 - Cements that simultaneously meet requirements of Type I and Type II are also widely available 2 - Type II low alkali (total alkali as Na2O lt 06) is often specified in regions where aggregates susceptible to alkali-silica reactivity are employed 3 - Type IV cements are only available on special request 4 - These cements are in limited production and not widely available
APPENDIX C - Major Components of Cement
The chemical composition of cement influences the characteristics of cement and the concrete produced The clinker mineral C3S is the majority clinker component The strength developed by portland cement depends on its composition of C3S C2S C3A C4AF and the fineness (Blaine) to which it is ground The lsquoStandard Specifications for Portland Cementrdquo contain different requirements of chemical and physical properties MgO SO3 alkalis as Na2O ignition loss insoluble residue Bogue composition fineness (Blaine) soundness autoclave expansion compressive strength and initial and final setting
C3S - Tricalcium Silicate - Ca3SiO5 - 3CaObullSiO2 - CAS 12168-85-3 C3S is the main clinker component in cement typically more than 50 Quick development of strength - C3S reacts more quickly than C2S High contribution to the final strength Resistant to sulphur attack 25 weight water bind under hydration of C3S Heat development 500 kJkg Hydration of C3S (Ca3SiO5 + (y+z)H2O = zCA(OH)2 + Ca(3-z)SiO(5-z)yH2O) are to some extent dependent on the presence of C3A and gypsum Both C3A and gypsum stimulate the hydration of C3S Also Alkalis have some influence at the hydration C3S = 4071CaO-(7600SiO2+6718Al2O3+1430Fe2O3+2852SO3) according to Bogues methods
C2S - Dicalcium Silicate - Ca2SiO4 - 2CaObullSi2 - CAS 10034-77-2 C2S is the second clinker component in cement between 10 - 60 Slow development of strength - C2S reacts more slow than C3S High contribution to the final strength Resistant to sulphur attack 20 weight water bind under hydration of C2S Heat development 250 kJkg On hydration C2S shows similar behaviour to C3S but is slower to react It does however continue to hydrate late in the setting period and may then contribute to the strength of the cement C2S = 287SiO2-0754(Ca3SiO5) according to Bogues methods
C3A - Tricalcium Aluminate - 3CaObullAl2O3 - CAS 12042-78-3 C3A range in the cement between 3 - 10 High contribution to the early strength Low contribution to the final strength Not resistant to sulphur attack 40 - 210 weight water bind under hydration of C3A Fast and high heat development 900 kJkg Compared with C3S C3A reacts very rapidly with water giving two hydrated
products 2C3A + 21H = C4AH13 + C2AH8 These form platelets within the cement and convert to C3AH6 which forms very quickly and is responsible for the initial formation of a crystalline network In the presence of free lime in the cement the formation of C4AH13 is favoured This slows the formation of C3AH6 but even so the formation of C4AH13 can cause the cement to set too quickly To avoid speed setting is gypsum added to the cement and the mineral ettringite is formed on hydration C3A + 3CaSO42H2O + 25-26H2O = Ca6Al2O6(SO4)31-32H2O C3A = 265Al2O3-169Fe2O3 according to Bogues methods
C4AF - Tetracalcium aluminoferrite - 4CaObullbullAl2O3bullbullFe2O3 - CAS 12068-35-8 C4AF Range in the cement between 5 - 10 Small contribution to the development of strength 37 - 70 weight water bind under hydration of C4AF Moderate to low heat development 300 kJkg Hydration of C4AF + 13H = C4AFH13 C4AF = 304Fe2O3 according to Bogues methods
Calcium Sulfate dihydrate (Gypsum) - CaSO4bullbull2H2O - CAS 7778-18-9
Alkalis (Na2O + K2O) Cements with a low alkali content may be required for use in the manufacture of concrete in which the use of aggregate introduces silica Alkalis may enhance reactions with amorphous silica The content of alkalis contributes to the acceleration of the early strength and lowering of the final strength The content of alkalis is dependent on the raw materials but also the manufacturing process also determines the content of alkalis Cement manufactured by the wet processing will contain less alkalis compared to dry processing Alkalis as Na2O = Na2O + 0658 K2O
Magnesia - MgO Cements with a high magnesia content may hydrates and expand after setting
Lime - CaO Cements with a high free lime content may react with water and result in expansion
Calcium Carbonate - CaCO3 - CAS 1317-65-3
- Acknowledgments
- Table of Contents
- Table of Diagrams Figures and Charts
- Illustration13
- Executive Summary
- Introduction
- The US Cement Industry
- Opportunities for Improving Energy Efficiency and Reducing CO2 Emissions
- PYROPROCESSING OPPORTUNITIES
- GRINDING AND MILLING OPPORTUNITIES
- PRODUCT FORMULATION CHANGES TO IMPROVE ENERGYEFFICIENCY
- Endnotes
- Appendix A - Energy Data and Calculation Tables
- APPENDIX B - Portland Cement Types and Their Use
- APPENDIX C - Major Components of Cement
-
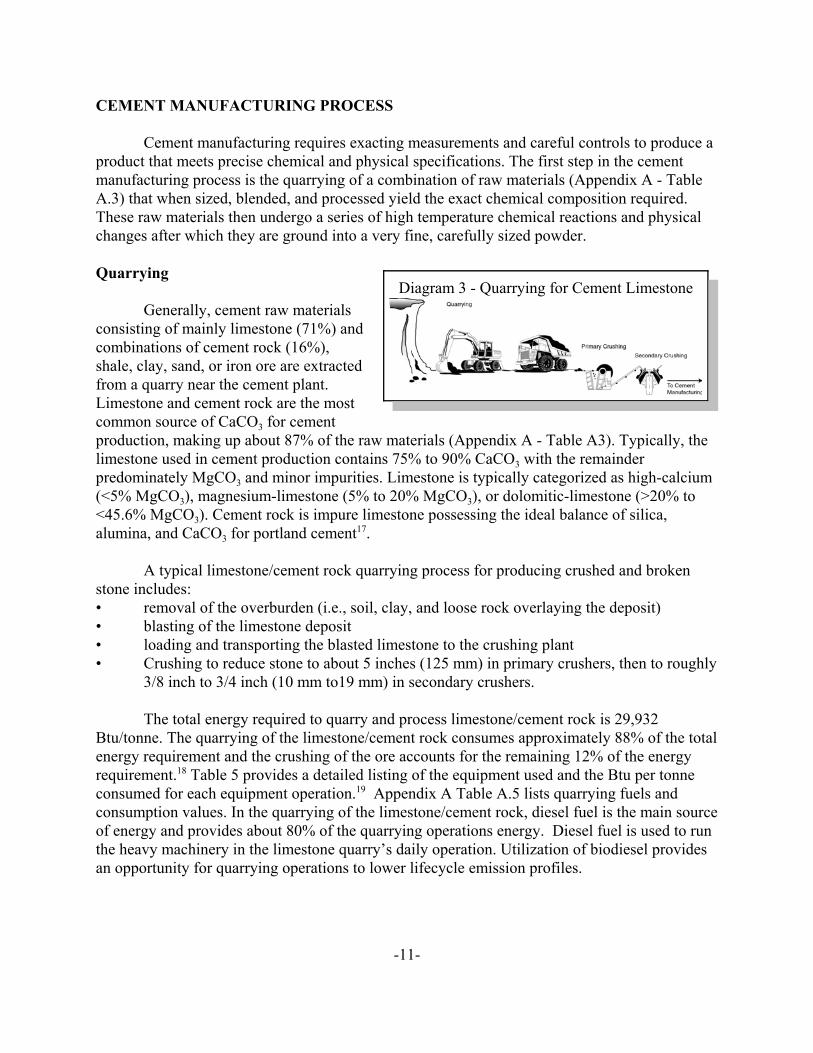
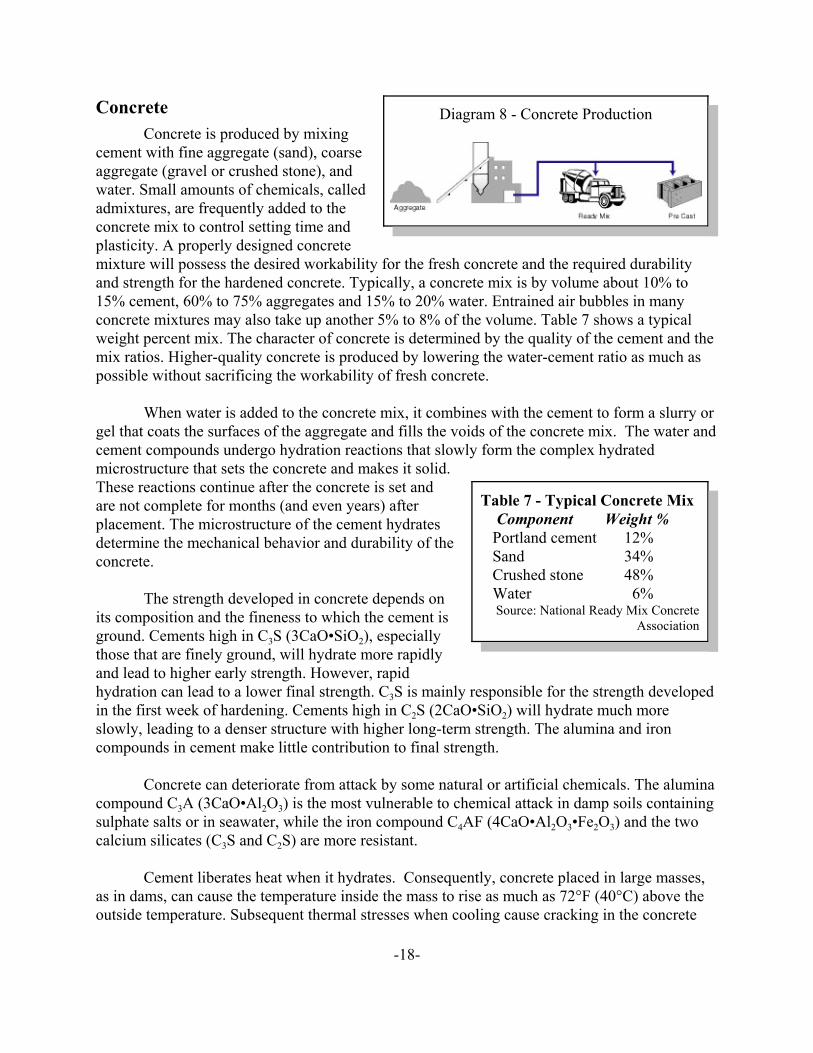
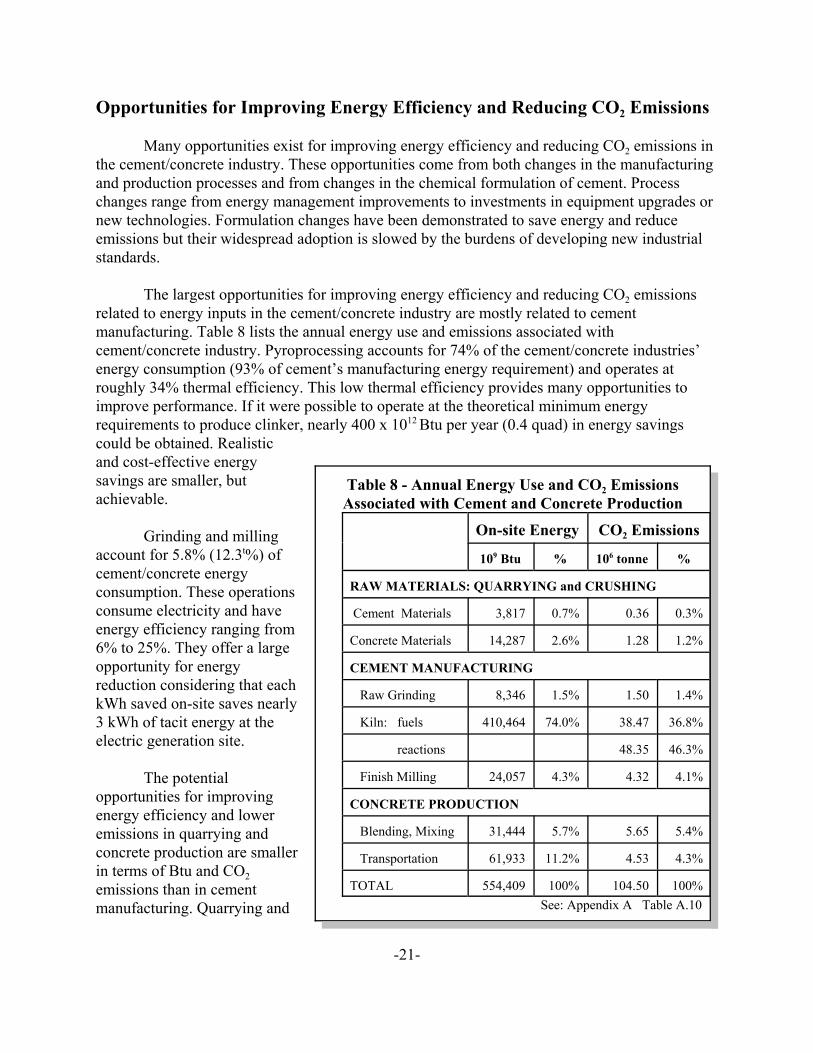
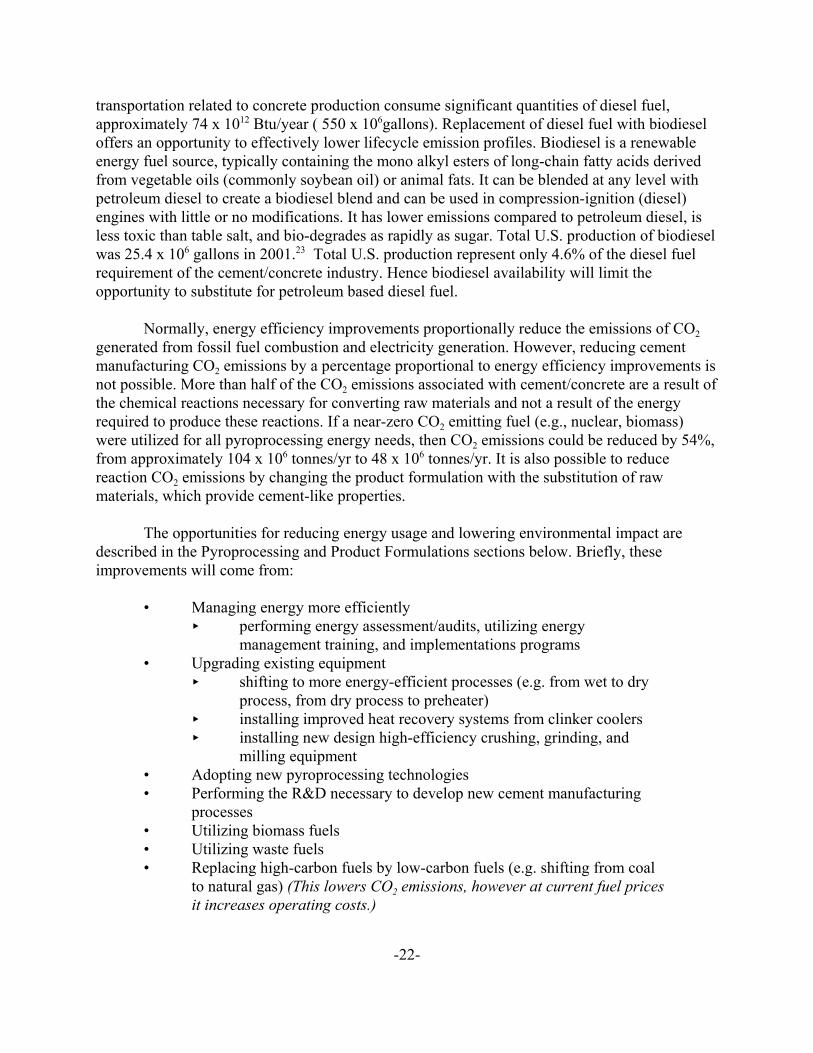
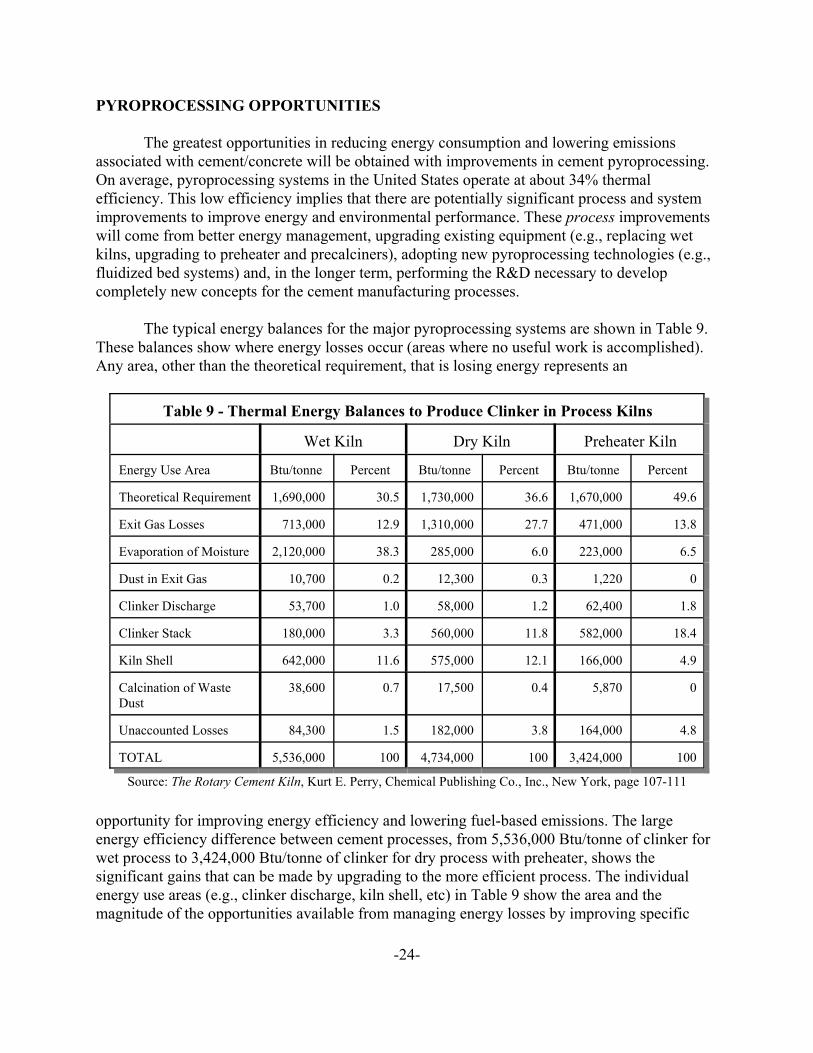
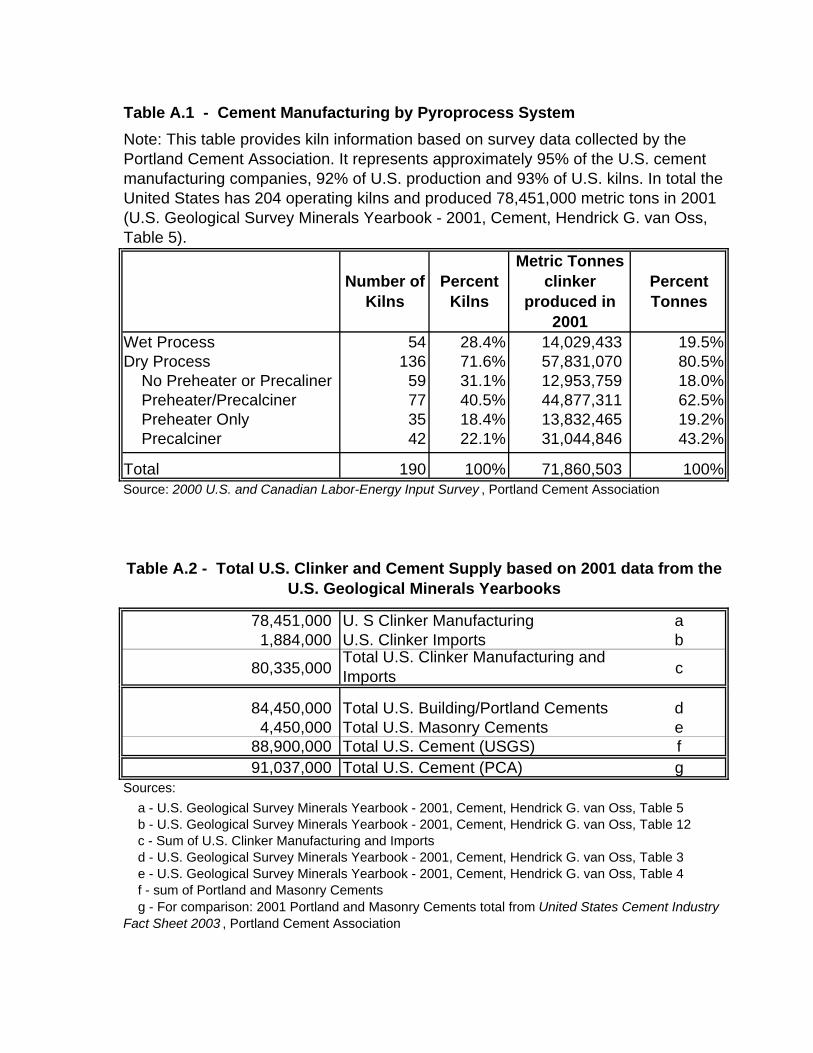
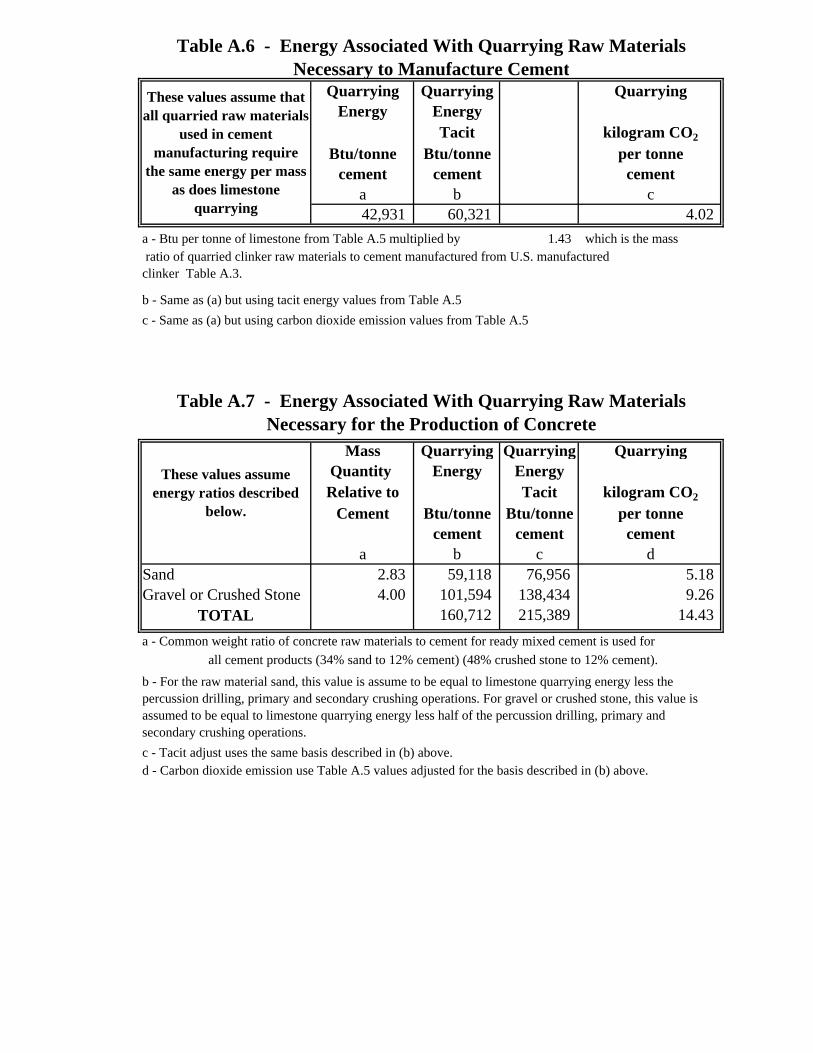
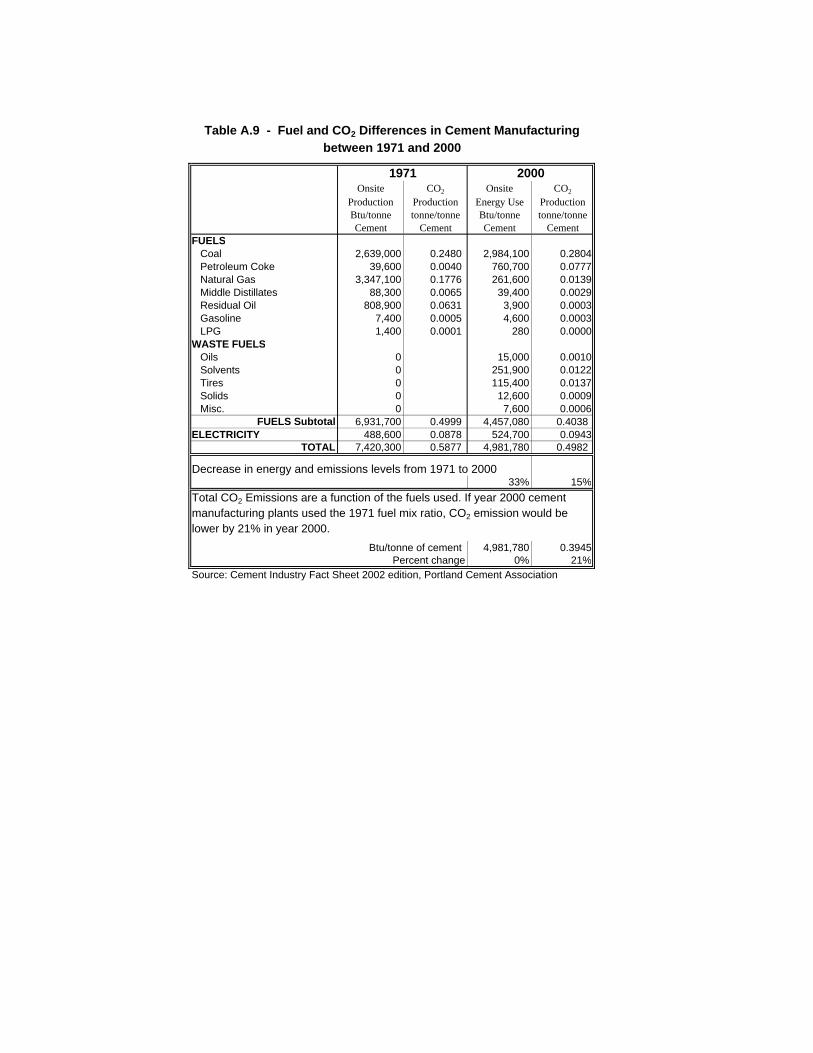
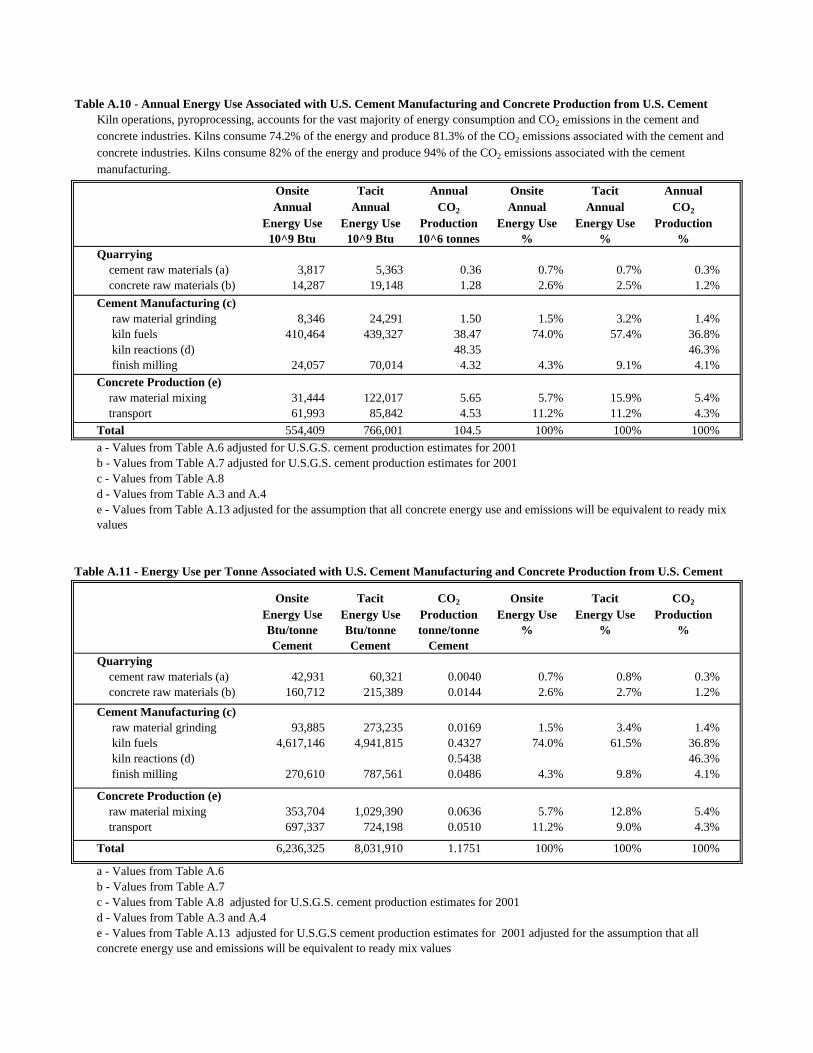
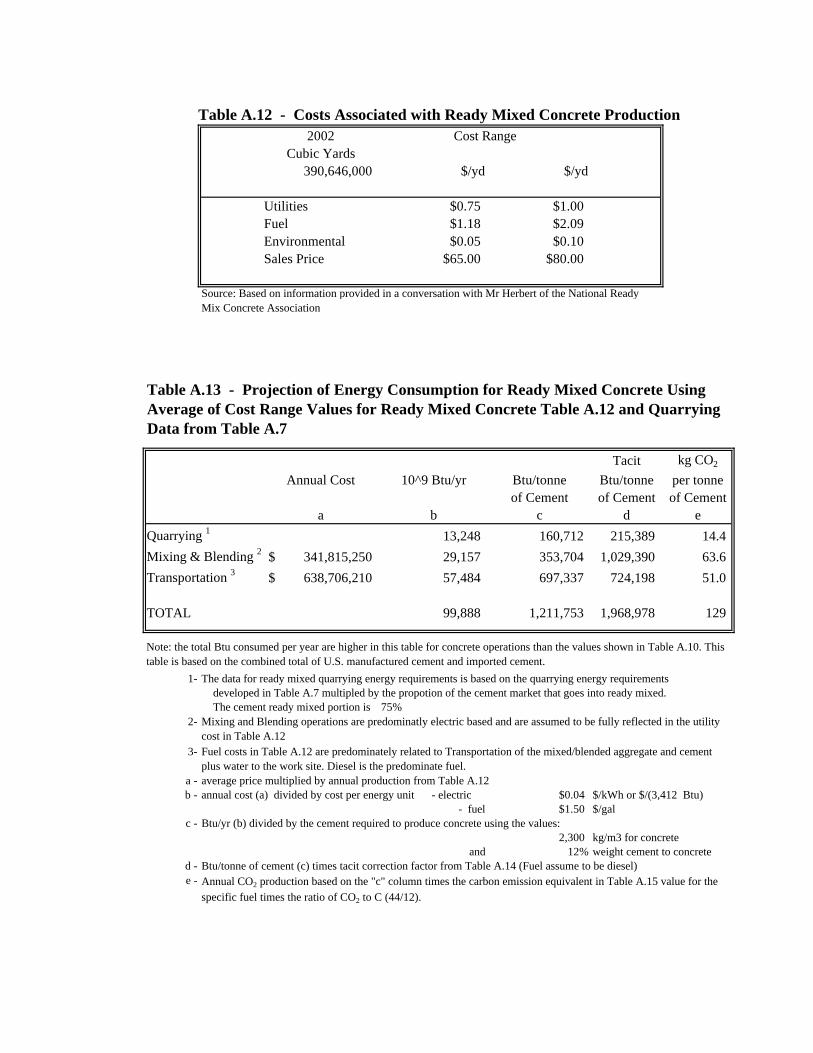
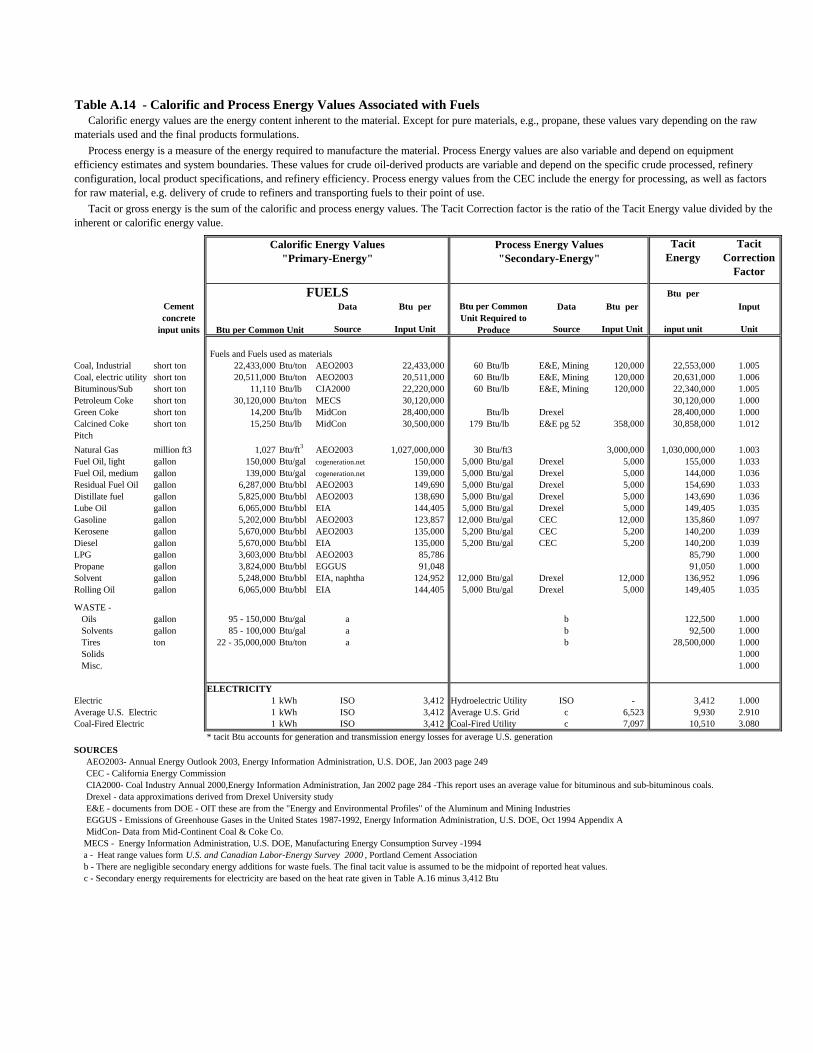
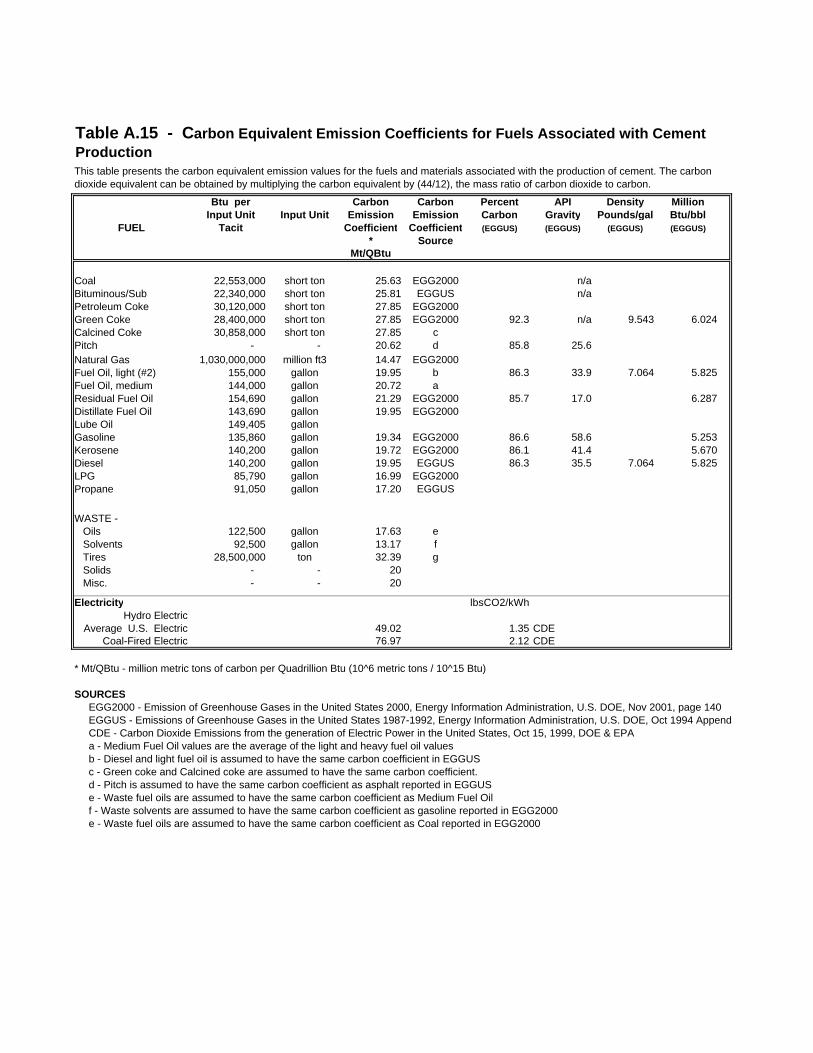
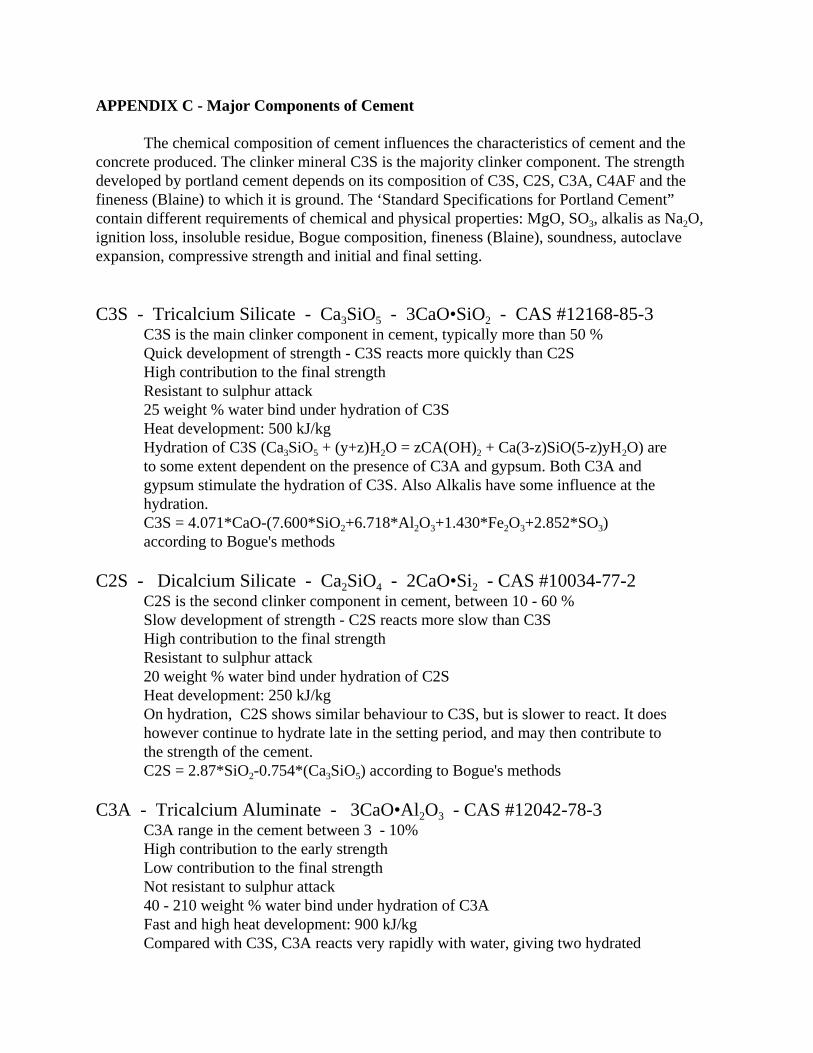
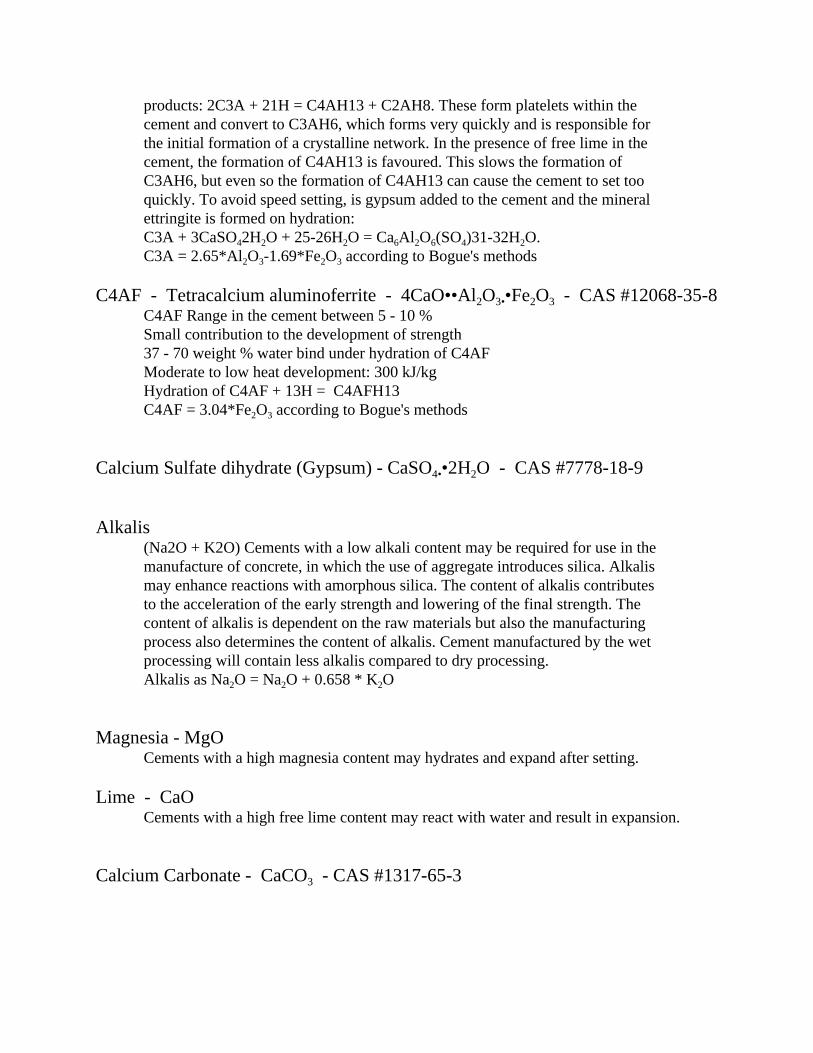