energy and climate imperative - 2018 energy education … · fuel switching forests & soils co...
TRANSCRIPT
Energy and climate – Imperative
concepts for tomorrow’s engineers
Susan E Powers & Jan DeWaters
Institute for a Sustainable Environment
Clarkson University
June 7, 2016

Behaviors /
intentions
Knowledge – Affect – Behavior
Self-Efficacy
1DeWaters & Powers, Energy Policy 39(3) 2011
Spearman’s rank
correlations
Education
Energy literacy data:1
Affective vs. Behavioral: ρ =0.54
Self-efficacy vs. Behavioral: ρ =0.44
Cognitive vs. Affective: ρ =0.38
Cognitive vs. Behavioral: ρ =0.16
Content
Knowledge Affect – attitudes,
values, beliefs

Undergraduate Class –
Climate Change: Engineering, Science, Policy
Four years of data
Junior, Seniors
Class taught in computer room
weekly in-class computer activities
~40 students/y
Mix of engineering students
Sustainable energy systems
engineering minor
0
10
20
30
40
50
60
70
Females Males
# S
tudents
Student Demographics
MAE ChE CE E&M EnvE
MAE 41%
ChE 9%
EE 3%
EnvE 29%
CE 6%
E&M 12%
EnvE MAE

Pedagogical Approach
Make it Count (ABET !)
Content knowledge
Problem solving / decision making skills
Make it Relevant
Materials with a societal context
Appreciate climate change and consequences
Explore and analyze data themselves rather than being told what to believe.
Hurricane Sandy
Some snow cover at least 30 days per year
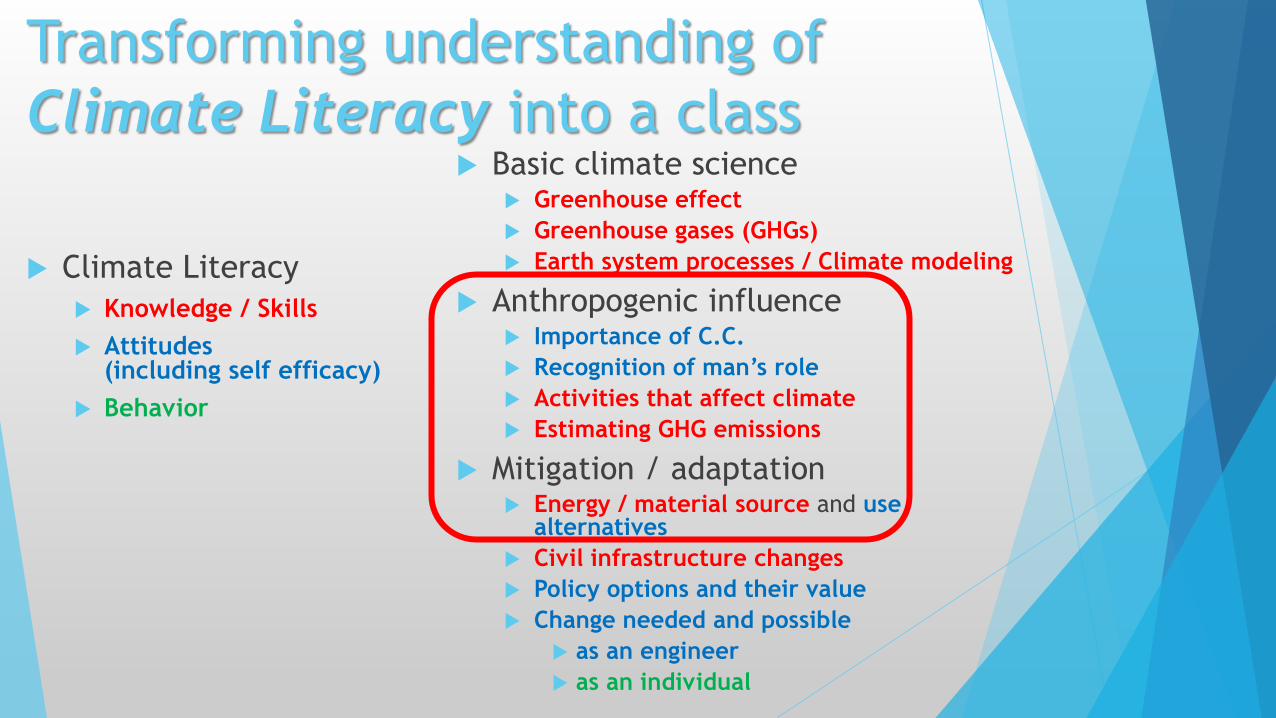
Transforming understanding of
Climate Literacy into a class
Climate Literacy
Knowledge / Skills
Attitudes (including self efficacy)
Behavior
Basic climate science Greenhouse effect
Greenhouse gases (GHGs)
Earth system processes / Climate modeling
Anthropogenic influence Importance of C.C.
Recognition of man’s role
Activities that affect climate
Estimating GHG emissions
Mitigation / adaptation Energy / material source and use
alternatives
Civil infrastructure changes
Policy options and their value
Change needed and possible
as an engineer
as an individual

USA
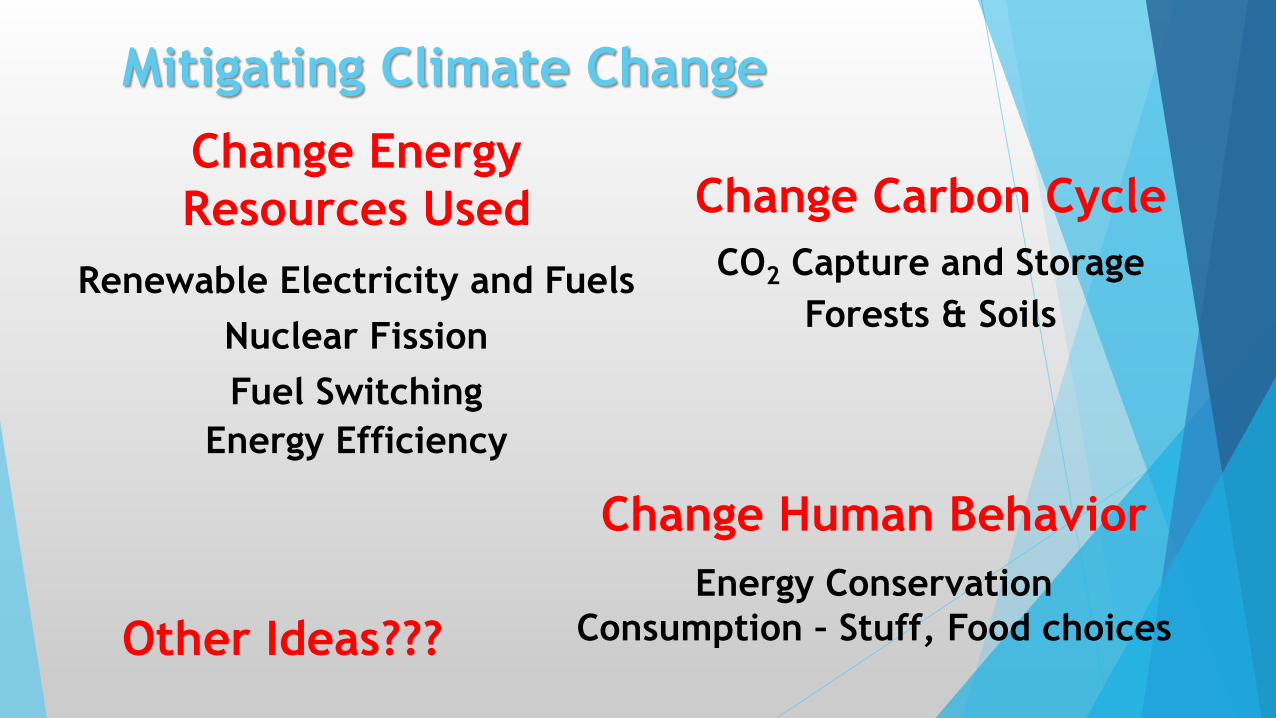
Energy Conservation
Consumption – Stuff, Food choices
Fuel Switching
Forests & Soils
CO2 Capture and Storage
Nuclear Fission
Renewable Electricity and Fuels
Change Energy
Resources Used
Change Human Behavior
Change Carbon Cycle
Energy Efficiency
Other Ideas???
Mitigating Climate Change

Example – GHGs from Electricity
Questions:
How much GHGs do you generate with electricity use?
Does it matter where you live?
Explain Why or Why not
What can you conclude about New York State?
Procedure:
Explore fuels used and resulting CO2 emissions
http://epa.gov/powerprofiler
Your home town (or school)
East Hampton NY 11937 Chicago IL 60601
Boston MA 02129 Kansas City MO 64101
Seattle WA 98101 Atlanta GA 30301
Los Angeles CA 90001 Denver CO 80012
Columbus OH 43201 Honolulu HI 96801
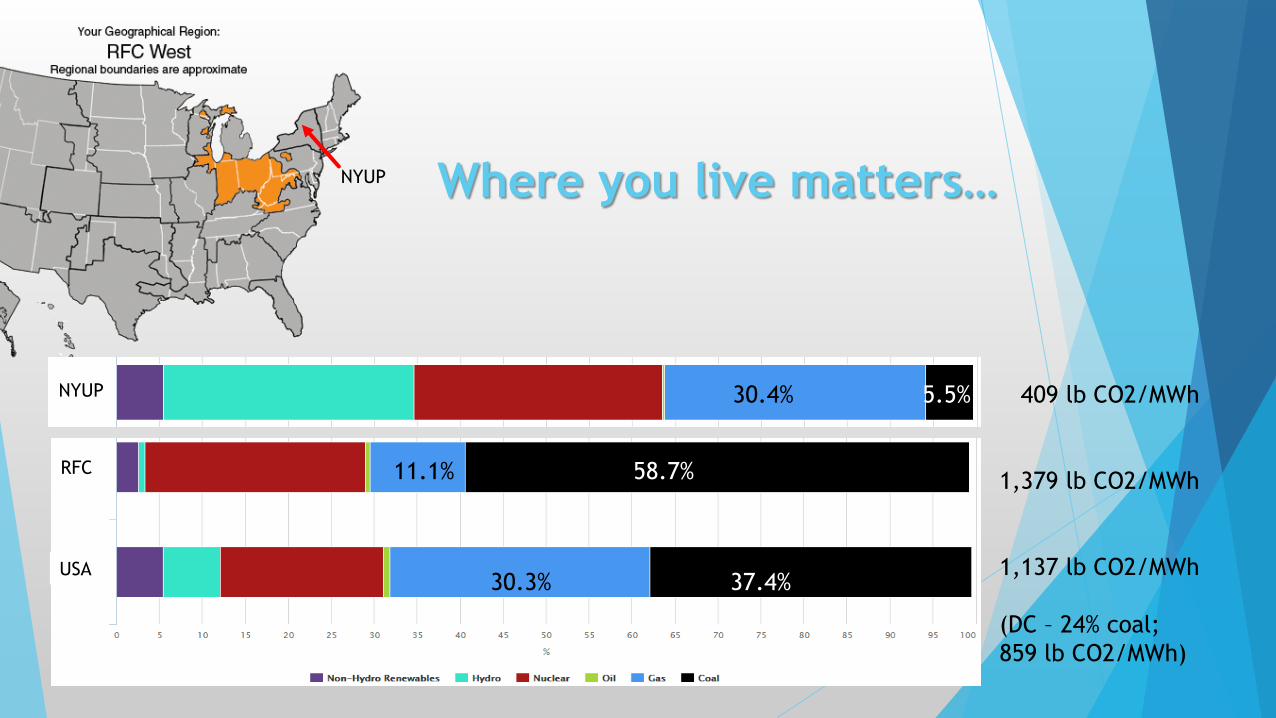
Where you live matters…
11.1% 58.7%
30.3% 37.4%
409 lb CO2/MWh
1,379 lb CO2/MWh
1,137 lb CO2/MWh
(DC – 24% coal;
859 lb CO2/MWh)
30.4% 5.5%
NYUP
NYUP
RFC
USA

Does it work? – Climate Literacy /
Critical Thinking Climate literacy questionnaire developed and administered
N=82, matched pre/post completed questionnaires
Critical thinking rubric – applied to semester projects
Climate Literacy Questionnaire in 3 subscales
Cognitive
21 items
5 option multiple choice
Affective
14 items,
5-point Likert-type scale
5 self-efficacy items embedded within affective subscale
Behavioral
9 items,
5-point Likert-type scale

Overall Results
significant increase in knowledge (p<<0.001), affect (p<<0.001), behavior (p=0.002)
0
10
20
30
40
50
60
70
80
90
100
Knowledge Affect Behavior
Perc
ent
Corr
ect
(know
ledge)
Pre Post
3
5
4
2
1
Like
rt S
cale
(1
-5)
(Aff
ect
& B
eh
avio
r)
3.74±0.57 3.94±0.53 3.68±0.53 3.80±0.51 62.4±8.4 76.1±8.3
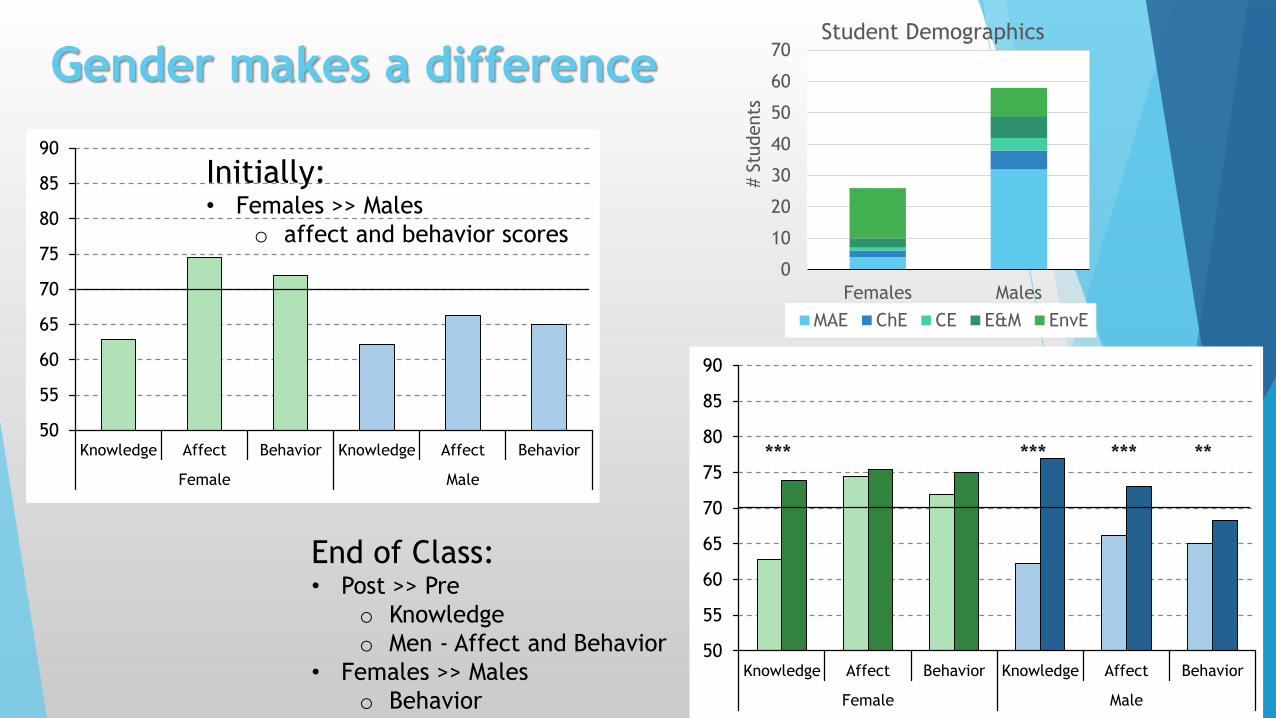
Gender makes a difference
50
55
60
65
70
75
80
85
90
Knowledge Affect Behavior Knowledge Affect Behavior
Female Male
50
55
60
65
70
75
80
85
90
Knowledge Affect Behavior Knowledge Affect Behavior
Female Male
0
10
20
30
40
50
60
70
Females Males
# S
tudents
Student Demographics
MAE ChE CE E&M EnvE
*** *** *** **
Initially: • Females >> Males
o affect and behavior scores
End of Class: • Post >> Pre
o Knowledge
o Men - Affect and Behavior
• Females >> Males
o Behavior
Summary
Climate and energy systems for mitigation is a grand
challenge for engineering students
There is a lot to be gained from offering a climate
change class specifically to engineers
They can change!!
Students need to think critically
o Data quality
o Deeper data interpretation
o Systems perspective
Thank you!!
Susan Powers
Director, Institute for a Sustainable Environment
Clarkson University
Potsdam NY

Summary of Resources
NOAA – State of the Climate: http://www.ncdc.noaa.gov/sotc/
Very basic science
http://www.epa.gov/climatestudents/impacts/signs/index.html
Snow and Ice
http://nsidc.org/cryosphere/sotc/sea_ice.html
http://arctic.atmos.uiuc.edu/cryosphere/
Access to historical temperatures http://data.giss.nasa.gov/gistemp/station_data
Access to GCM results http://www.ipcc-data.org/maps/
Climate Science visualization tools
http://phet.colorado.edu/en/simulation/greenhouse
http://www.kcvs.ca/site/projects/climate.html
http://carboncycle.aos.wisc.edu/carbon-budget-tool
Global CO2 Emissions http://www.wri.org/tools/cait/
CO2 Concentrations http://co2now.org/
• Emissions from electricity (by zipcode) http://epa.gov/powerprofiler

Student Group makes a difference
MAE 41%
ChE 9%
EE 3%
EnvE 29%
CE 6%
E&M 12%
Group 1 – MAE
dominated
Group 2 – CEE
dominated
47 students 41 students
17% female 49% female
50
55
60
65
70
75
80
85
90
Know
ledge
Aff
ect
Behavio
r
Know
ledge
Aff
ect
Behavio
rGroup 2 Group 1
50
55
60
65
70
75
80
85
90
Know
ledge
Aff
ect
Behavio
r
Know
ledge
Aff
ect
Behavio
r
Group 2 Group 1
Group 1 – MAE
dominated
Group 1 – MAE
dominated
Group 2 – CEE
dominated
Group 2 – CEE
dominated
CEE students –
• Initially better affect
and behavior

Semester Projects
Address a research question that requires
the use of real-world data,
critical analysis of the causes and consequences of climate change,
or decisions necessary for mitigating or adapting to these changes.
Approach:
Select a specific research question
Develop a plan to address question (data, types of analysis)
Complete analysis
Document work

Reducing CO2 emissions through Coal Efficiency -
“50 by 50” Plan
30
35
40
45
50
2000 2010 2020 2030 2040 2050 2060
% E
ffic
iency
Years in decade intervals
Realistic Efficiency Plan
0
200000
400000
600000
800000
1000000
1200000
1970 1990 2010 2030 2050 2070
Coal C
onsu
med
(Thousa
nd S
hort
tons)
Year
Annual Coal Consumption
6000
6500
7000
7500
8000
8500
9000
2000 2010 2020 2030 2040 2050 2060
CO
2 E
mis
sio
ns
(To
ns)
Year
Projected CO2 Emissions
With Solution
Without Solution
Relevant question for Mechanical Engrgs.
Reasonable literature based plan for efficiency
Connections mitigation change in emissions
Good discussion of implications

STUDENT GAINS ON SELECTED COGNITIVE ITEMS
Survey Items Pre-test
average
Post-test
average1
H2O is the most abundant greenhouse gas. 29.3 70.7***
CO2 is the greenhouse gas we are most concerned about
limiting emissions of, to reduce global warming. 80.5 97.6***
Energy in the infrared wavelength is absorbed by the
atmosphere and mainly causes temperature increase. 35.4 75.6***
The greenhouse effect is caused by naturally occurring
gases in the atmosphere. 68.3 81.7**
Global climate change is accelerated by the melting of snow
and ice covered surfaces. 68.9 82.0**
Anthropogenic causes of global climate change (overall
score) 61.9 73.7***
Fossil fuel combustion is a cause of climate change. 93.9 98.8***
Livestock production contributes to climate change. 66.5 85.4***

STUDENT GAINS ON SELECTED NON-COGNITIVE ITEMS
Survey Items
(followed by Likert-type response option)
Pre-test
Response3
Post-test
Response3,4
I feel I know (a lot, quite a bit) about global climate
change. 30.5 86.6***
I am (completely, mostly) convinced that global
warming is happening. 90.2 100***
Global warming is caused (mostly by human
activities). 68.3 79.3**
Global warming is an (urgent/very serious) threat to:
Plants and animals 80.5 86.6**
People in other countries 62.2 75.6***
I would (strongly/somewhat favor) increasing taxes on
electricity so people use less of it. 41.5 53.7**

Beyond Literacy…
Rubric Attributes Competency expectations -
example for a “proficient” score (4)
Formulates problem/
question or issue
Satisfactorily identifies and clarifies problem
Describes within the context of the broader issue
Recognizes key points or issues among details in relation to given question.
Uses data and evidence
appropriately, systematically and
objectively to address a problem
Approach to and use of data/evidence is organized
Some assumptions stated
Examines quality of data and other source of evidence
Formulates evidence-based
conclusion or problem solution
Appropriately applies evidence-based interpretation of data to solution of
the problem
States conclusion or problem solution, shows how conclusions or solutions
emerge from the evidence or data
Demonstrates its relationship to the given question within the context of
larger implications
Evaluates solution
Assesses solution in terms of its reliability and its need for further evidence.
Assesses implications of solutions to specific questions or problems in
context of larger issue
Evaluates trade-offs, benefits, detriments of various solutions.
Critical Thinking Competency Rubric Criteria

Critical Thinking
0% 20% 40% 60% 80% 100%
Brings in different perspectives; evaluates trade-offs
Assesses implications in context of larger issue
Assesses solution - reliability & need for further…
Evaluates Solution
Demonstrates relationship to question with broader…
States conclusion/solution, how emerges from the…
Evidence-based interpretation of data
Formulates Solution/Conclusion
Examines sources or data/evidence
States assumptions
Use of data/evidence is organized
Uses Data/Evidence Appropriately
Recognizes key points, priorities
Describes problem in context - broader issues
Identifies & clarifies problem
Identifies ProblemProblem Formulation
Uses Data/Evidence Appropriately
Formulates Solution / Conclusion
Evaluates Solution
% scoring at least proficient (4/5)
% scoring superior (5/5)