energy: a global challenge · coal 5013 msts (million short tons) hydro 2584 bkwh (billion...
TRANSCRIPT

Produced by and for Hot Science - Cool Talks by the Environmental Science Institute. We request that
the use of these materials include an acknowledgement of the presenter and Hot Science - Cool Talks
by the Environmental Science Institute at UT Austin. We hope you find these materials educational
and enjoyable.
Dr. William Fisher
October 12, 2001
Energy: A Global Challenge
# 15

Energy:
A Global Challenge
by Dr. William Fisher

World Energy, Gross Domestic Product,
Population Trends

World Primary Energy Consumption
Coal
23.2 %
(87.5 Quads)
Natural Gas
22.3 %
(84.4 Quads)
Petroleum
39.6 %
(149.7 Quads)
Hydro
7.1 %
(26.9 Quads)
Nuclear
6.5 %
(24.5 Quads)
Biomass,
Geothermal,
Solar, Wind
0.6 %
(2.5 Quads)

Energy Units for Different SourcesFUEL TYPE STANDARD
MEASURE
PETROLEUM 73.6 MMB/D (million barrels per day)
NATURAL GAS 82.7 TCF (trillion cubic feet)
COAL 5013 MSTs (million short tons)
HYDRO 2584 BKwh (billion kilowatthours)
BIOMASS,
GEOTHERMAL,
SOLAR, WIND 196 BKwh (billion kilowatthours)
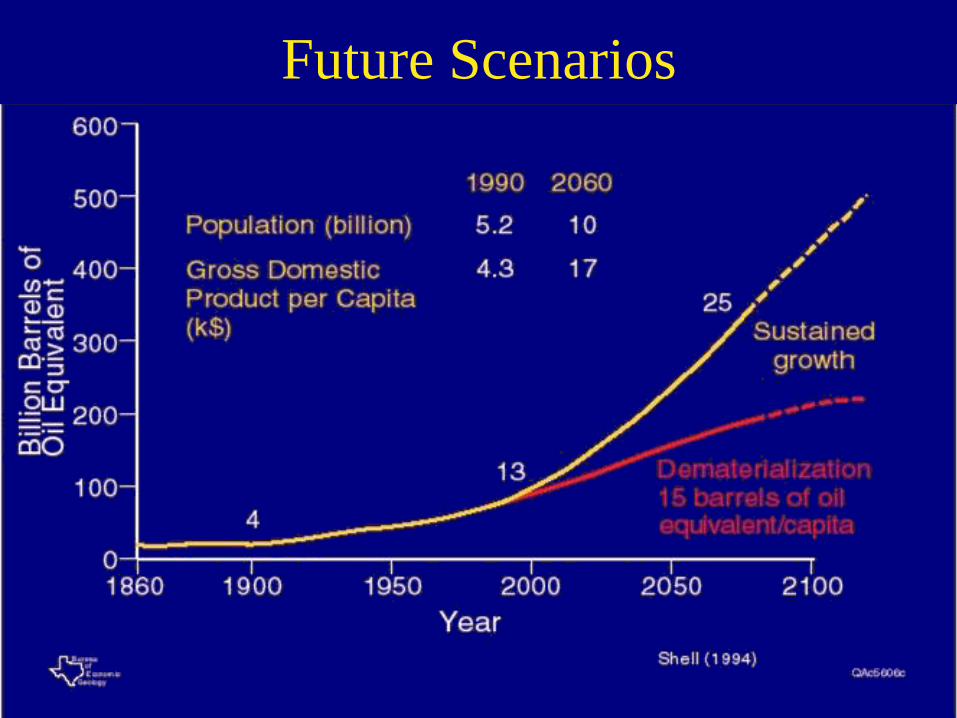
Future Scenarios

Energy Requirements of the 21st Century
(Tboe - Trillion barrels of oil)
Shell Scenarios:
Available Fossil Fuel Base:
•Sustained Growth - 25 Tboe
•Dematerializtion - 15 Tboe
•Oil - 3 Tboe
•Natural Gas - 4.3 Tboe
•Coal - 23.5 Tboe

WORLDWIDE PRODUCTION OF OIL AND
NATURAL GAS
Bureauof
EconomicGeology
60
40
20
01950 1970 1990 2010 2030 2050 2070 2090
Time (years)
GasOil
Oil and gas5655 G boe
Cum. Prod.
7445 G boe
3715 G boe
Oil and gas:
end of internal
combustion
engine
Jan. 1, 1997
Schollnberger (1998)
Jan. 1, 2101
(boe = barrels of oil equivalent)
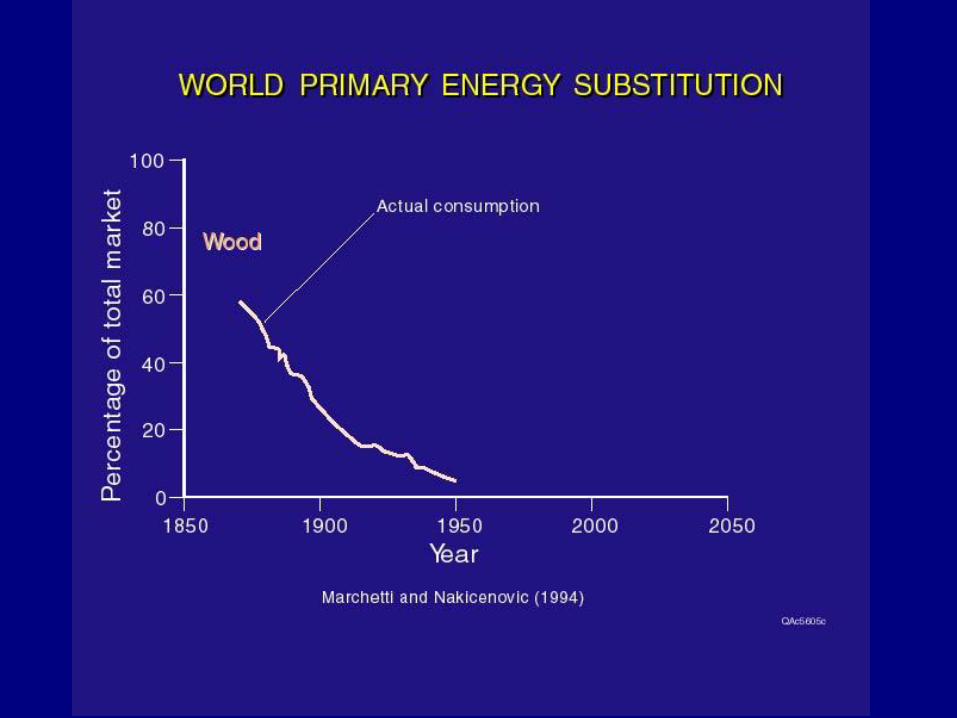
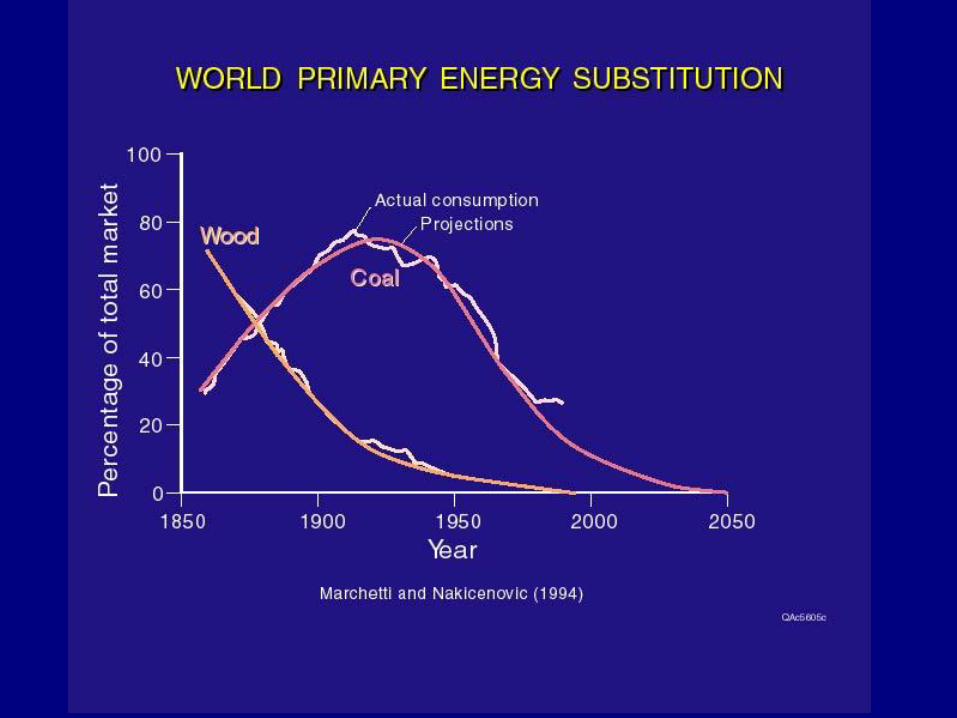
World Primary Energy
Substitution
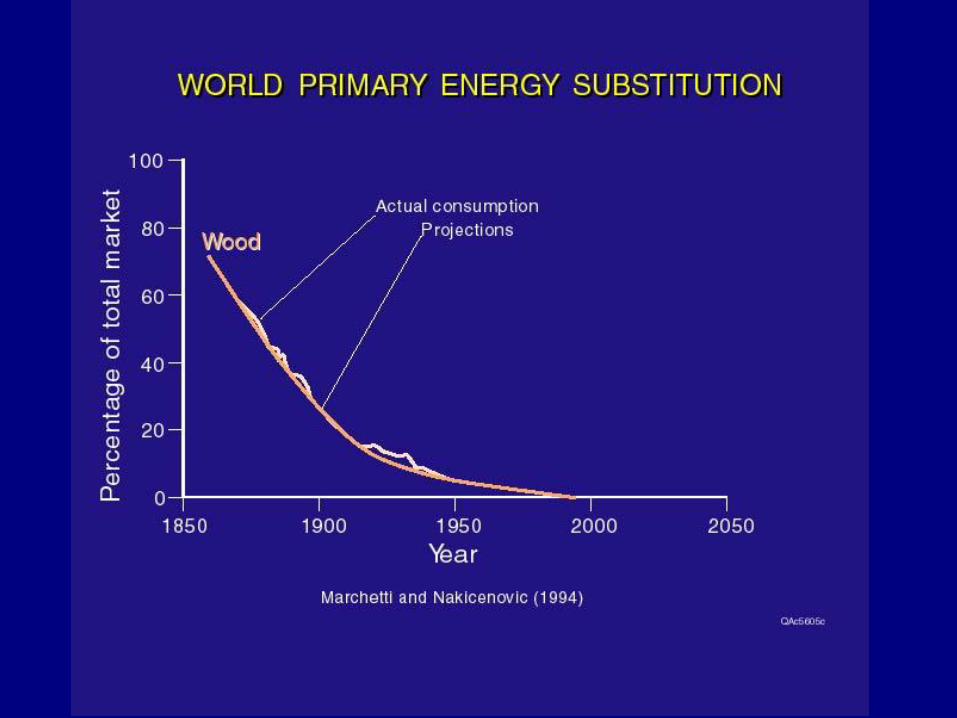
World Primary Energy
Substitution
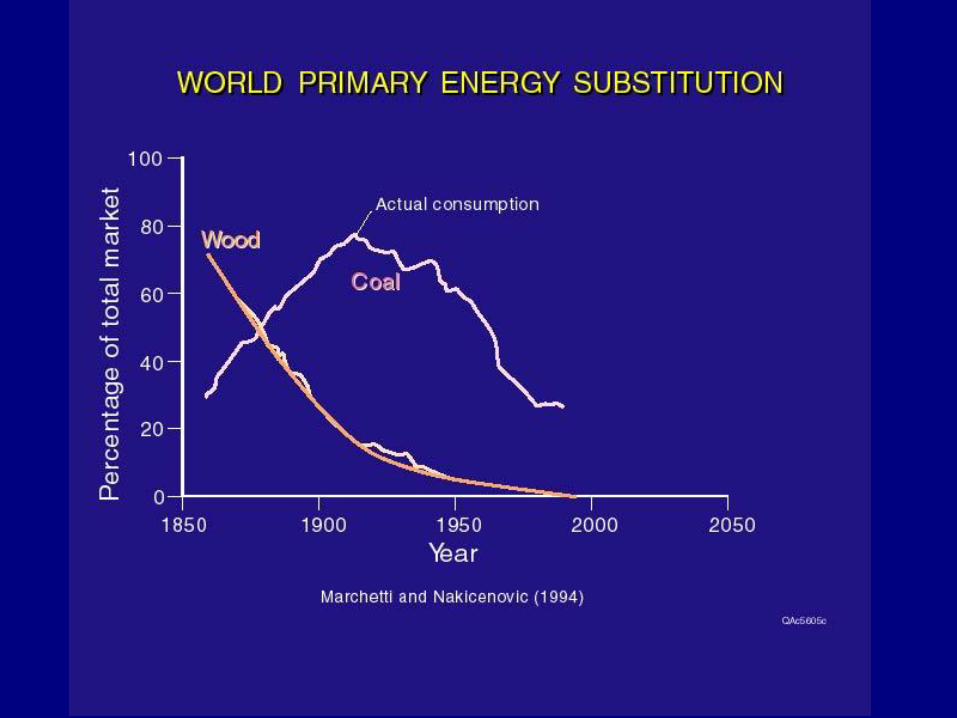
World Primary Energy
Substitution
World Primary Energy
Substitution

World Primary Energy
Substitution

World Primary Energy
Substitution

World Primary Energy
Substitution

World Primary Energy
Substitution

World Primary Energy
Substitution

THE RATIO OF HYDROGEN TO CARBON IN
OUR FUELS IS CHANGING.
• Fuels with more carbon release more carbon
dioxide.
• Fuels with more hydrogen burn more cleanly.

Global Primary Energy
Consumption

0
50
100
150
200
250
300
350
400
Estimate of U.S. Oil Reserves and Future
Needs
Estimate of future
U.S. oil needs.
Estimate of the
U.S. oil reserves.
Amount of U.S oil
reserves already
used.
Barrels of Oil
(in Billions)
Estimate of
additional U.S. oil
resources.
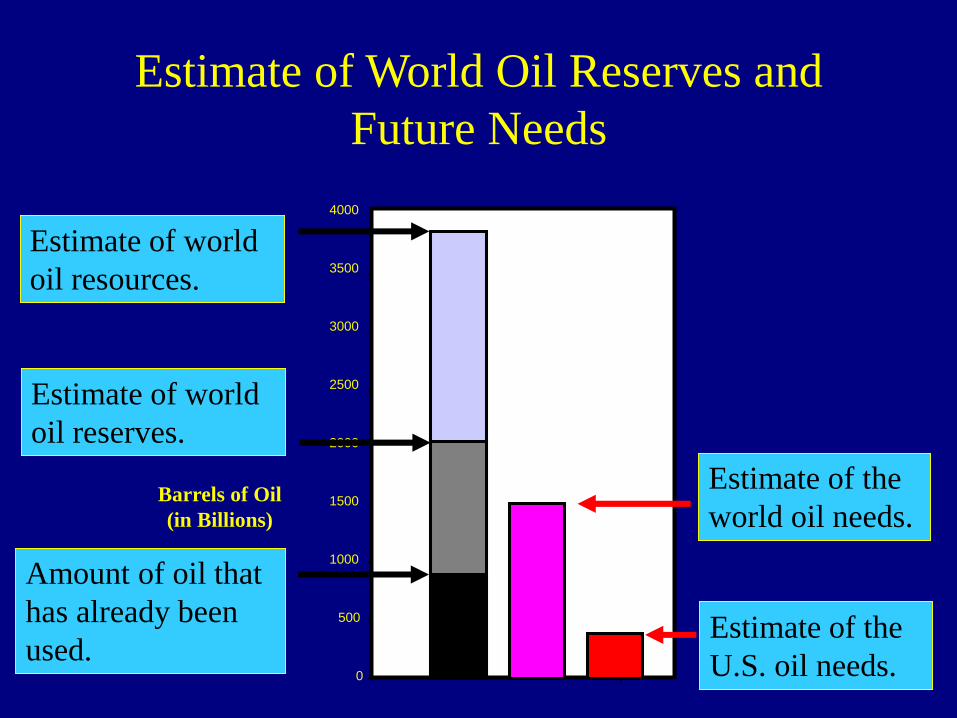
Estimate of World Oil Reserves and
Future Needs
Estimate of the
world oil needs.
Estimate of world
oil reserves.
Amount of oil that
has already been
used.
Barrels of Oil
(in Billions)
Estimate of the
U.S. oil needs.0
500
1000
1500
2000
2500
3500
3000
Estimate of world
oil resources.
4000

U.S. and World Natural Gas
Account

RECENT ESTIMATES OF ULTIMATE
OIL RECOVERY FOR THE WORLD.
BureauofEconomic
GeologyQAc4412(a)c
0
1
2
3
4
1970 1980 1990 2000Time (year)
RECENT ESTIMATES:
ULTIMATE OIL RECOVERY, WORLD
Hubbert2.1 API
2.03
Moody
3.2 Odell &
Resing
3.0
Fisher, 3.8
Schollnberger, 3.3Townes, 3.0USGS, 2.8
Edwards, 2.8
MacKenzie, 2.6
Montadert & Alazord
2.2USGS, 2.17
Bookout, 2.0
Laherre, 1.75Campbell, 1.65
Mabro
1.8 Campbell &
Laherre, 1.8
C.P. 800
P.R. 850
DISC. 150R.G. 0
C.P. 790 DISC. 1000
P.R. 1100 R.G. 950
USGS 3.4
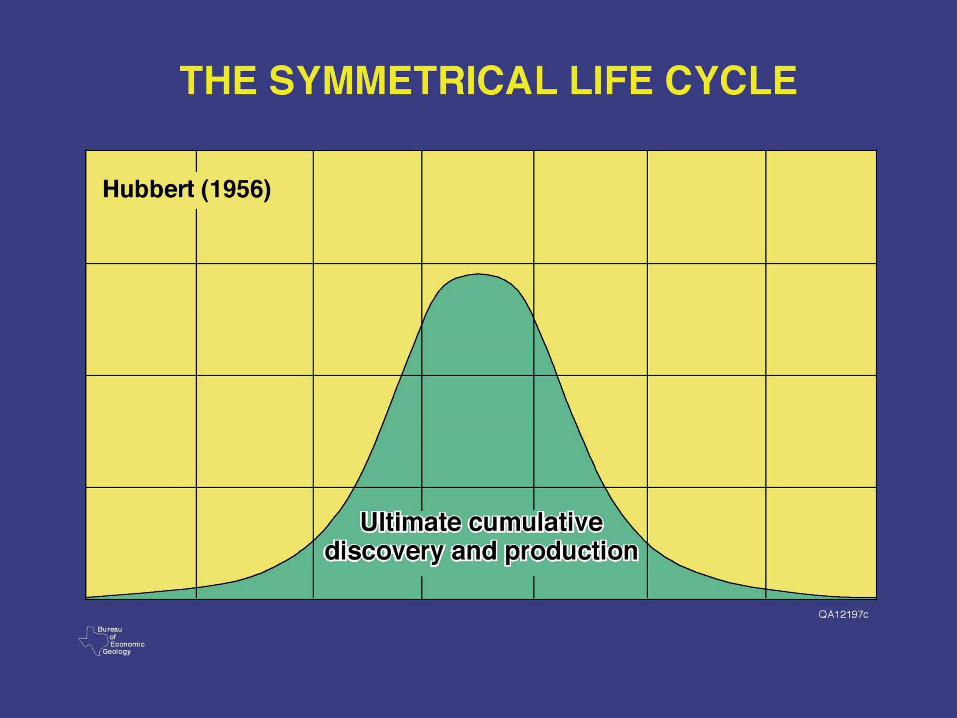
The Symmetrical Life Cycle

CHANGING VIEWS OF RESOURCE DEPLETION
Cumulative drilling
Ultimate gas recovery
870 30 T
1970's view (exponential decline)
Reso
urc
e a
dd
itio
n r
ate
cF
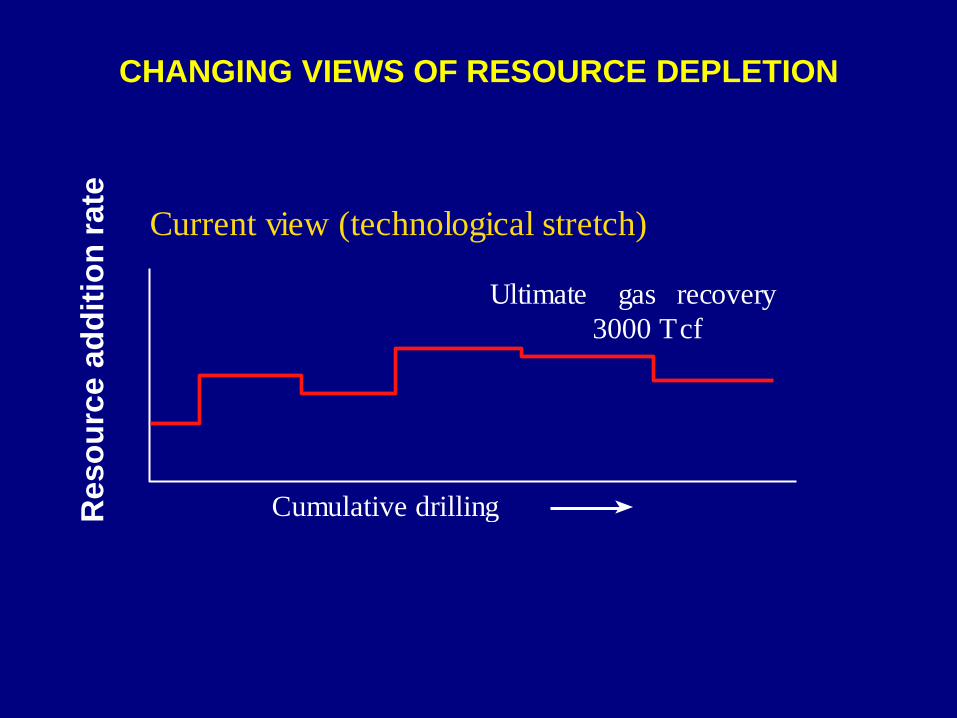
CHANGING VIEWS OF RESOURCE DEPLETION
Ultimate gas recovery
3000 Tcf
Cumulative drilling
Current view (technological stretch)
Reso
urc
e a
dd
itio
n r
ate

Offshore Production Platform
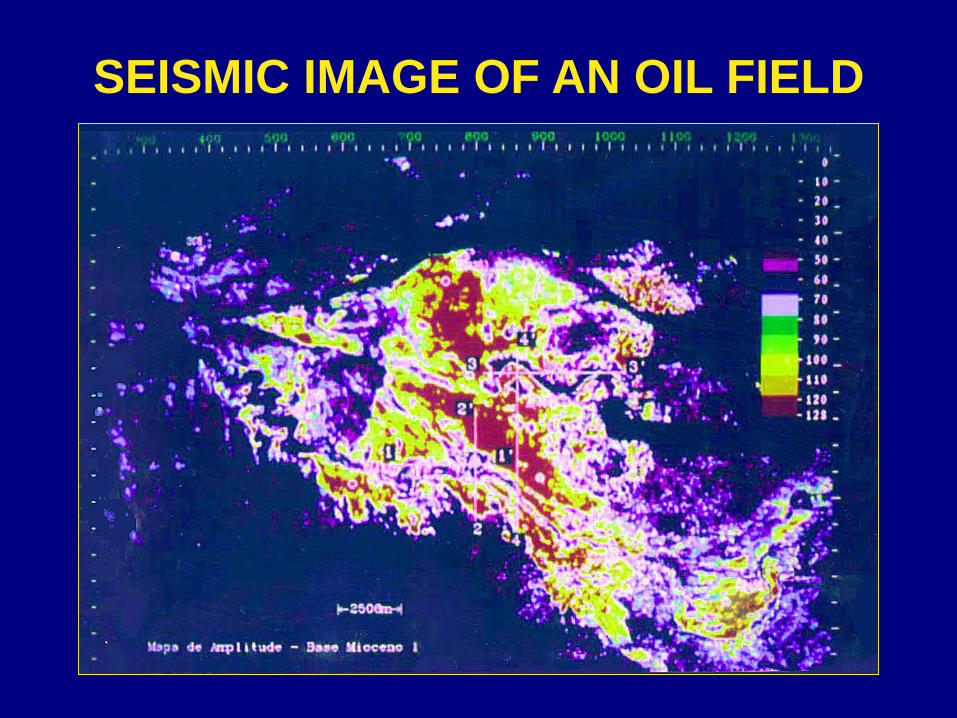
SEISMIC IMAGE OF AN OIL FIELD

Directional, Extended-Reach
Drilling
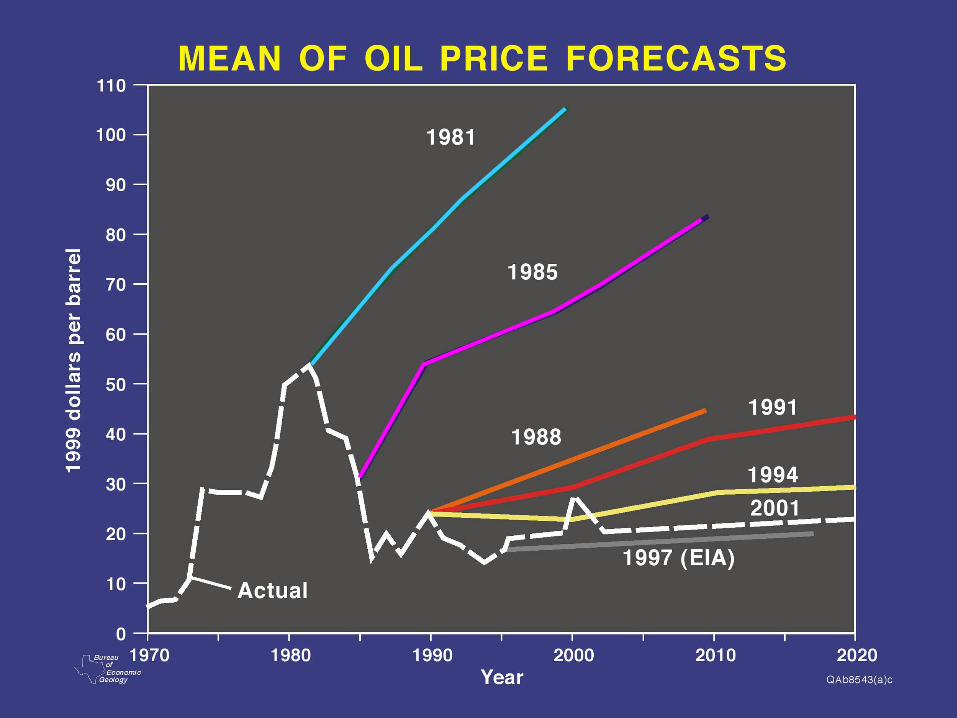
Mean of Oil Price Forecasts
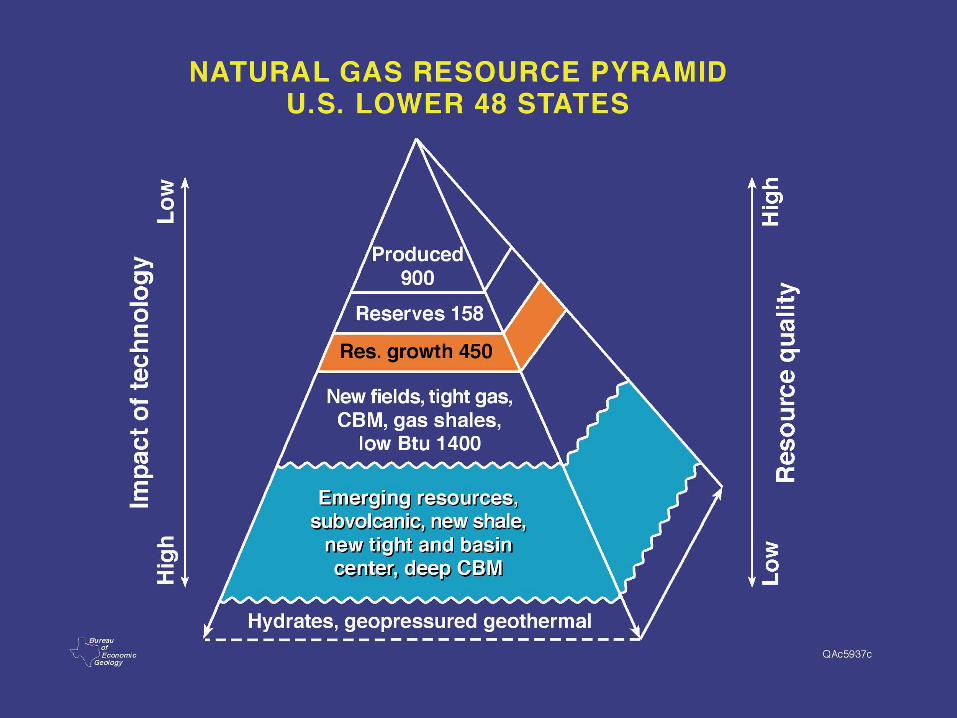
Natural Gas Resource Pyramid

ESTIMATES OF REMAINING NATURAL GAS
IN THE UNITED STATES
BureauofEconomic
Geology
QAb4759(a)c
USGS
USGS
PGC
PGC
PGC
Hefner
PGC PGC
USGS
PGC
PGC PGC
DOI
Mobil NRCUSGS
HubbertExxon
Shell
NehringHubbert
Exxon Shell
Sohio
Smith &Lidsky
PGC
Enron
DOE
GRIEIA
NRC
AAPG
NPC
EnronEIA
GRI
GRI
PGC
Enron
PGCTrend line
1800
1600
1400
1200
1000
800
600
400
200
0
1975 1980 1985 1990 1995
(Several estimates for lower 48 only)
Estimates adjusted for production
since date of estimate
Year
EIA
PGC
2000
DOI
2000
2200
EIAGRI
NPC
PGC
Natu
ral G
as
(Tcf)
(Several estimates for lower 48 only)
Estimates adjusted for production
since date of estimate
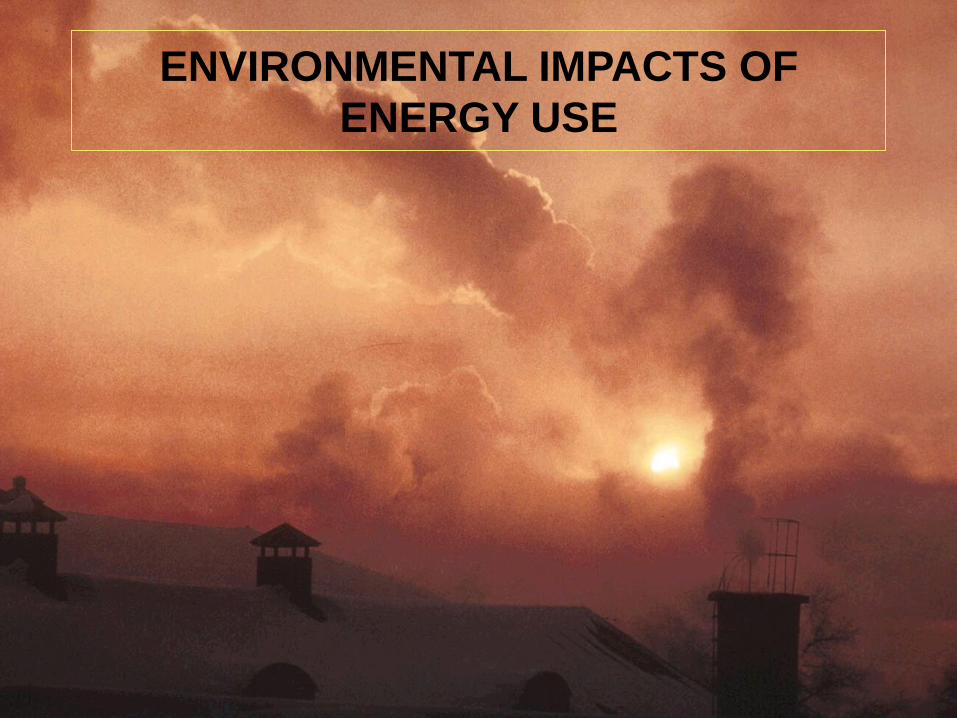
ENVIRONMENTAL IMPACTS OF
ENERGY USE
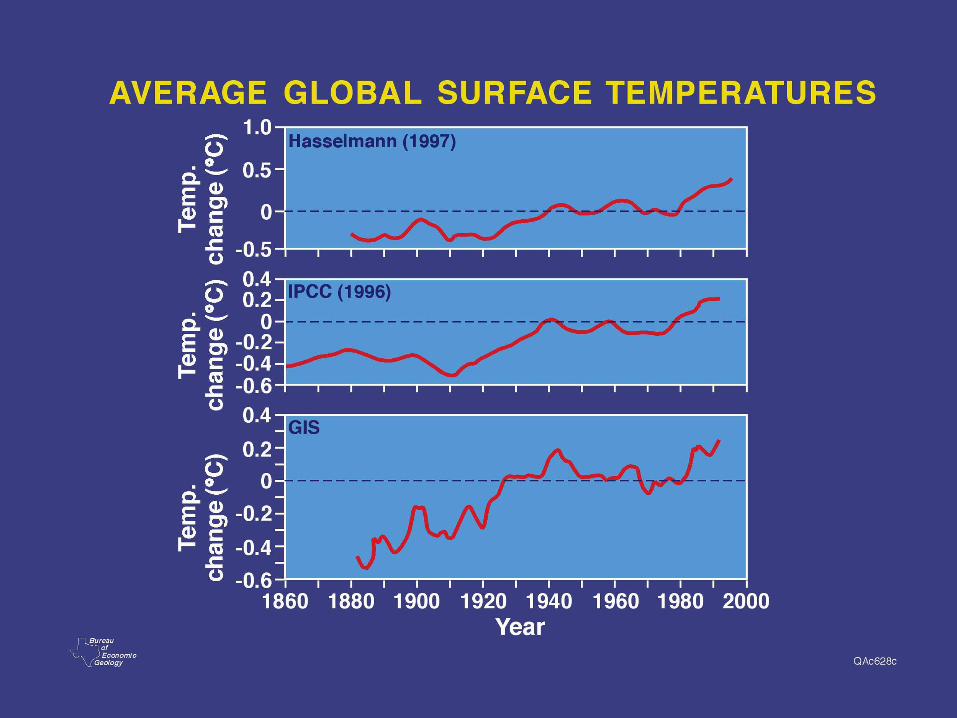
Average Global Surface
Temperatures

CO2 Concentrations

Global Temperature and Solar
Activity
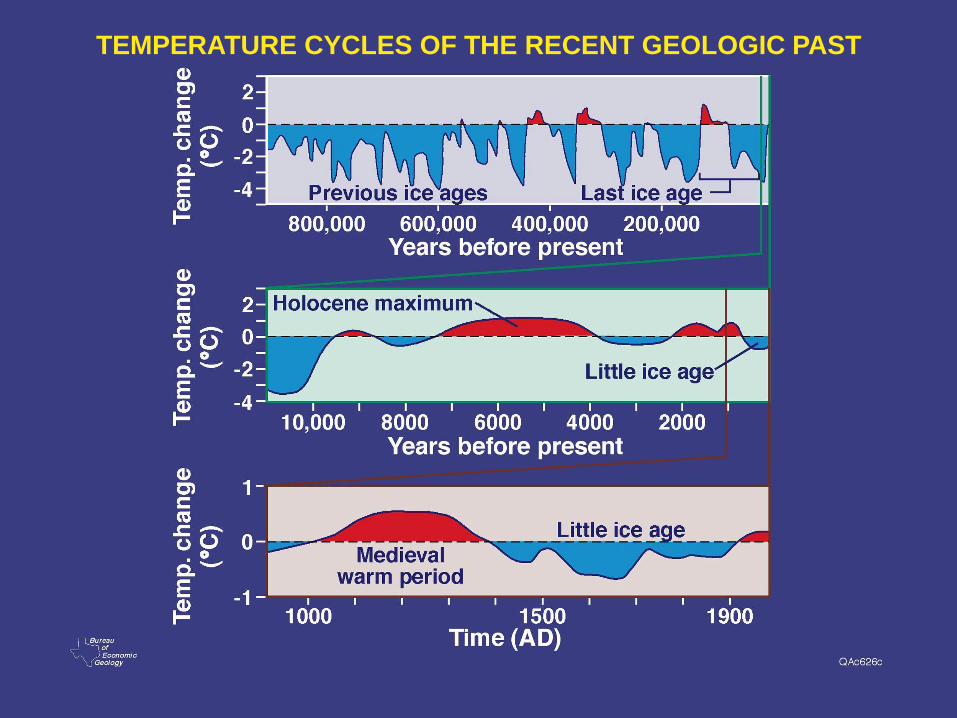
TEMPERATURE CYCLES OF THE RECENT GEOLOGIC PAST

CARBON CONTENT (GtC) OF
AVAILABLE FOSSIL FUEL RESOURCES
Bureauof
EconomicGeology QAc5604(a)cModified from Linden (1998)
Fuel
Natural gas
Oil
Coal
Totals
Natural gas
Oil
Coal
Totals
Fuel Proved reservesProved reserves
70
140
920
1130
70
140
920
1130
Total resourceTotal resource
290
340
4450
5080
290
340
4450
5080

World Energy Use Intensity

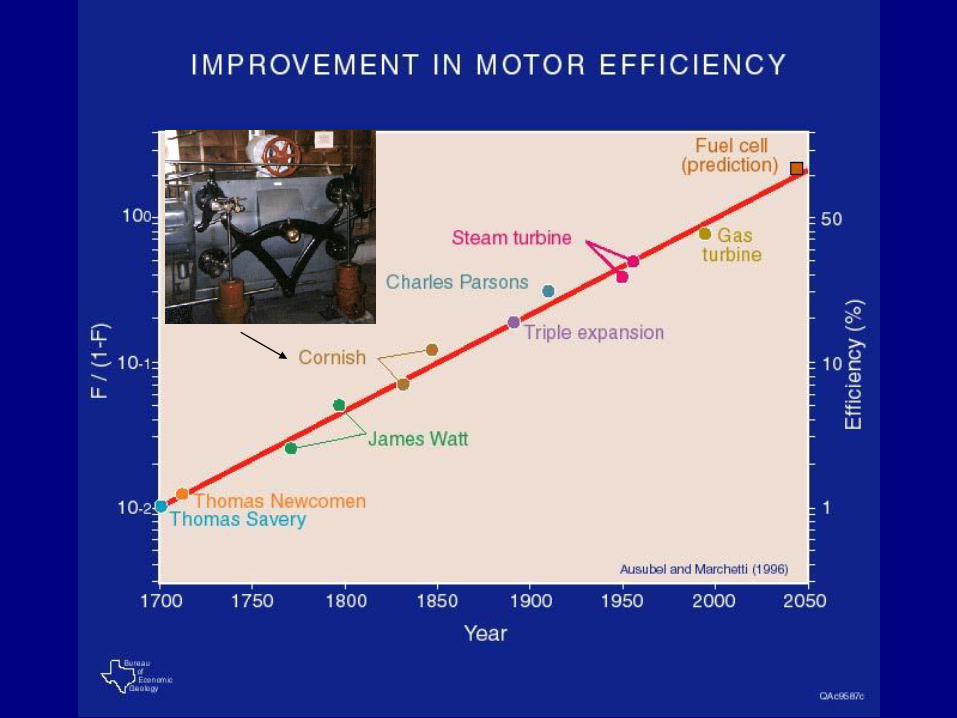
Improvement in Motor Efficiency

Improvement in Motor Efficiency

Improvement in Motor Efficiency

Improvement in Motor Efficiency
Improvement in Motor Efficiency

Improvement in Motor Efficiency

Improvement in Motor Efficiency

WORLD POPULATION PROJECTIONS
12,000,000
10,000,000
8,000,000
6,000,000
4,000,000
2,000,000
01950 1970 1990 2010 2030 2050
Year
Current population
Low
Medium
High
Projections
United Nations (1994)

Carbon Intensity of Global
Energy Consumption

Conclusions
Many of the pessimistic predictions of resource
availability have been wrong.
We are currently moving toward plentiful and clean
energy.
We should not exhaust ourselves worrying about
problems before they occur.
Acknowledgements
Thanks to:
Environmental Science Institute
Mayfield Fund of Geology Foundation
Department of Geology
Bureau of Economic Geology
Jay Banner
Gary Kocurek
Deanna Combs

References• References
• Ausubel, J. H., (1996) Can technology spare the earth?: American Scientist, v. 84, p. 166-178.
• Bookout, J. F., (1989) Two centuries of fossil fuel energy: Episodes, v. 12, p. 257-262.
• Dupont-Roc, G., and Khor, A., (1994) The evolution of the world’s energy systems: The Hague, Royal Dutch Shell, Corporate Centre.
• Ausubel, J. H., and Marchetic, C., (1996) Elektron: Electrical systems in retrospect and prospect: Daedalus, v. 125, p. 139-169.
• Kuuskraa, V., (2001) Resource depletion vs. technology progress: who will win the race! Presentation to the National Resource Council.
• Hubber, M. K., (1956) Nuclear energy and the fossil fuels: New York, American Petroleum Institute, Drilling and Production Practice, p. 7-25.
• IPPC WGI (1996) Climate Change 1995: The Science of Climate Change: Cambridge University Press.
• Schollnberger, W. E., (1998) Projections of the world’s hydrocarbon resources and reserve depletion in the 21st Century; Bulletin, Houston Geological Society, November.
• Marchettic, C. Nakicenovic , (1994)
• Energy Information Administration, Annual Energy Outlooks, U. S. Department of Energy, Washington, D. C.
• Hasselmann, K., (1997) Are we seeing global warming?: Science, v. 276, p. 914-915.
• IPCC WGI, (1996) Climate change 1995: The Science of climate change: Cambridge University Press.
• Hansen, J., and Lebedeff, S., (1987) Global trends of measured surface air temperature: Journal of Geophysical Research, v. 92, p. 13345-72.
• Lassen, K., and Friss-Christensen, E., (1995) Variability of the solar cycle length during the past five centuries and the apparent association with terrestrial climate: Journal of Atmospheric and Terrestrial Physics, v. 57, p. 835-845.
• Fisher, W. L., (1999) Energy and environment into the Twenty-first Century; The challenge to technology and ingenuity: Environmental Geosciences, v. 6, p. 191-199.
• United Nation (1994) World projections.

Dr. William Fisher
Dr. Fishers’ principal interests are in basin analysis, sequence stratigraphy,
depositional systems, and petroleum geology. Dr. Fisher also researchers
analytical efforts in energy resource assessment and energy policy.
Within the University Dr. Fisher chairs the Executive Committee of the
Geology Foundation and chairs the Steering Committee of the Jackson
School of Geosciences. He also serves on the National Petroleum Council
which is advisory to the Secretary of Energy, the Interstate Oil and Gas
Compact Commission, the Board of Environmental and Energy Systems
of the National Research Council, and several committees of professional
geological societies. Fisher is trustee of the American Association of
Petroleum Geologists Foundation, the American Geological Institute
Foundation, and the Southwest Research Institute. Within the National
Academy of Engineering he currently chairs Section 11 (Petroleum,
Mining and Geological Engineering).