energizing finance: missing the mark
TRANSCRIPT
ENERGIZING FINANCEENERGIZING FINANCE
MISSING THE MARK
ACKNOWLEDGEMENT
The report was commissioned by Sustainable Energy for All (SEforALL) The SEforALL team composed of Christine
Eibs Singer Olivia Coldrey Annette Aharonian and Tamojit Chatterjee worked in close collaboration with the South
Pole team who researched and wrote the report Martin Stadelmann Gaetan Hinojosa Isabel Hagbrink Marion
Allimant Frank Muci Yannick Pape Nata Tavonvunchai and Umdatul Mujahidah
We are grateful for substantive inputs received from the Steering Committee as this research effort evolved from
inception through publication Lyndree Malang (ADB) Kee-Yung Nam (ADB) Grace Yeneza (ADB) Monojeet Pal
(AfDB) Daniel Scroth (AfDB) Cyril Renault (AFD) Roberta Bove (CCA) Peter George (CCA) Michael Franz (GET
Invest) Regine Dietz (GIZ) Monika Rammelt (GIZ) Alex Evans (GLPGP) Silvia Francioso (GOGLA) Katrina Pielli
(Independent Consultant) Giorgio Gualberti (OECD) Jens Sedemund (OECD) Mark Correnti (Shine) Rianne Teule
(SNV) Wim van Nes (SNV) Usha Rao (UNDP) and Juliette Besnard (World Bank)
The report also benefitted from information and data received from numerous colleagues and survey respondents
We would to especially like thank Giorgio Gualberti and Jens Sedemund (OECD) for advice regarding data Valuable
guidance and oversight were provided by Damilola Ogunbiyi Chief Executive Officer and Special Representative of
the UN Secretary-General for Sustainable Energy for All
SEforALL is grateful to the IKEA Foundation the Austrian Development Agency the Ministry of Foreign Affairs of
Denmark the Ministry for Foreign Affairs of Iceland and the Charles Stewart Mott Foundation for their institutional
support to our work that has enabled the production of this report For a full list of SEforALL supporters please visit
our website at wwwSEforALLorg
FOREWORD 5EXECUTIVE SUMMARY 7INTRODUCTION 11 11 Background 12
12 Scope of the report 12
APPROACH 13 21 Statistical analysis 14
22 Limitations of the analysis 15
TRENDS IN DEVELOPMENT FINANCE FOR ENERGY 16 31 Overall trends 2013ndash2018 17
32 Trends from 2013ndash2018 for HICs for energy finance
commitments and disbursements 18
33 Trends from 2013ndash2018 by sub-sector 20
Commitments 20
Disbursements 21
34 Trends from 2013ndash2018 by donor 22
TRENDS IN DEVELOPMENT FINANCE FOR CLEAN COOKING 23DISBURSEMENT EFFICIENCY 26 51 Methodology 27
52 Data 27
53 Indicators 28
54 Results 29
ANALYSIS OF DISBURSEMENT CONSTRAINTS AND SOLUTIONS 35 61 Quantitative analysis of connection to Regulatory Indicators
for Sustainable Energy 36
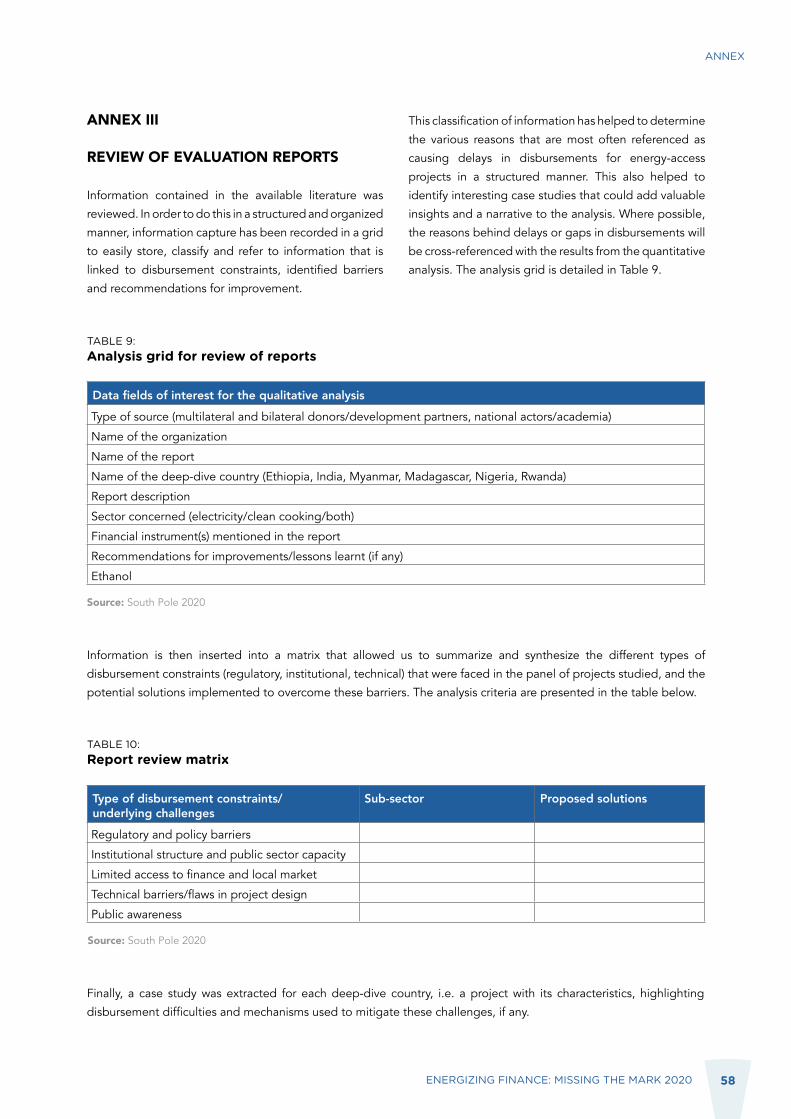
62 Review of evaluation reports 37
63 Surveys 41
64 Summary of qualitative insights 44
ANNEX 47 Annex I Methodology 48
Annex II 54
Detailed methodology for the RISE correlation analysis 54
Detailed results 54
Annex III Review of evaluation reports 58
ABBREVIATIONS 59GLOSSARY 60BIBLIOGRAPHY 61
TABLE OF CONTENTS
1
2
3
4
5
6
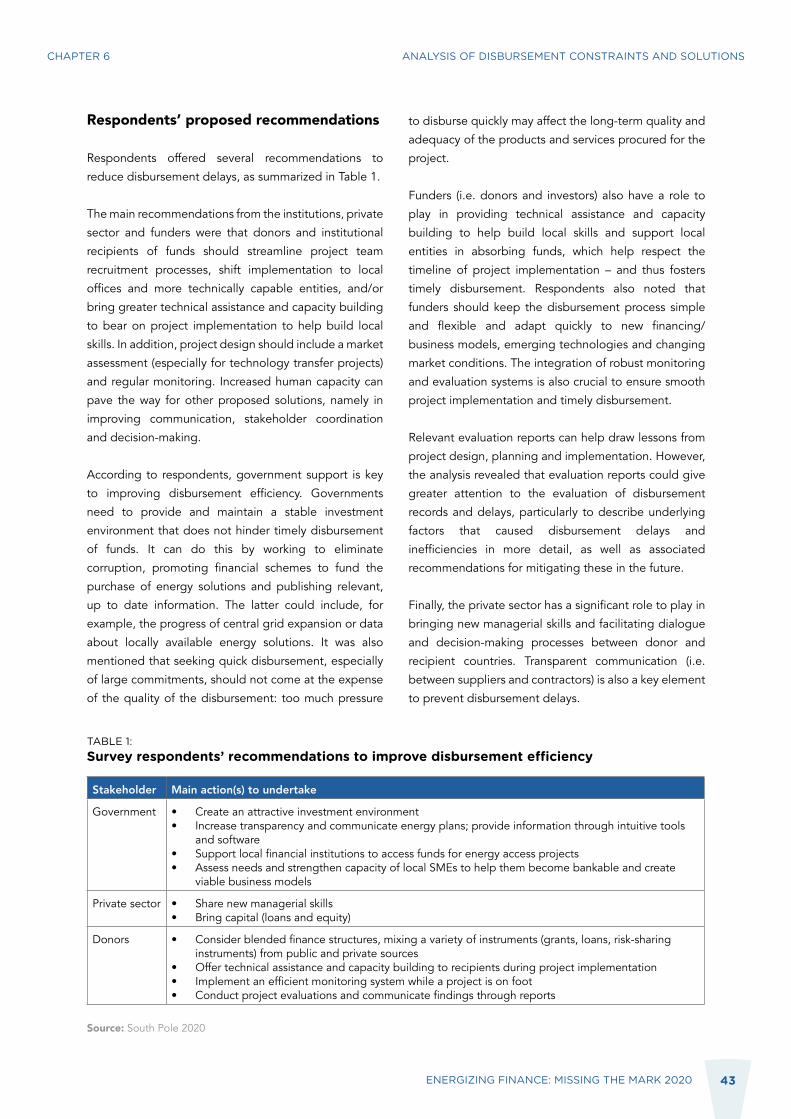
TABLE 1 Survey respondentsrsquo recommendations to improve
disbursement efficiency 43
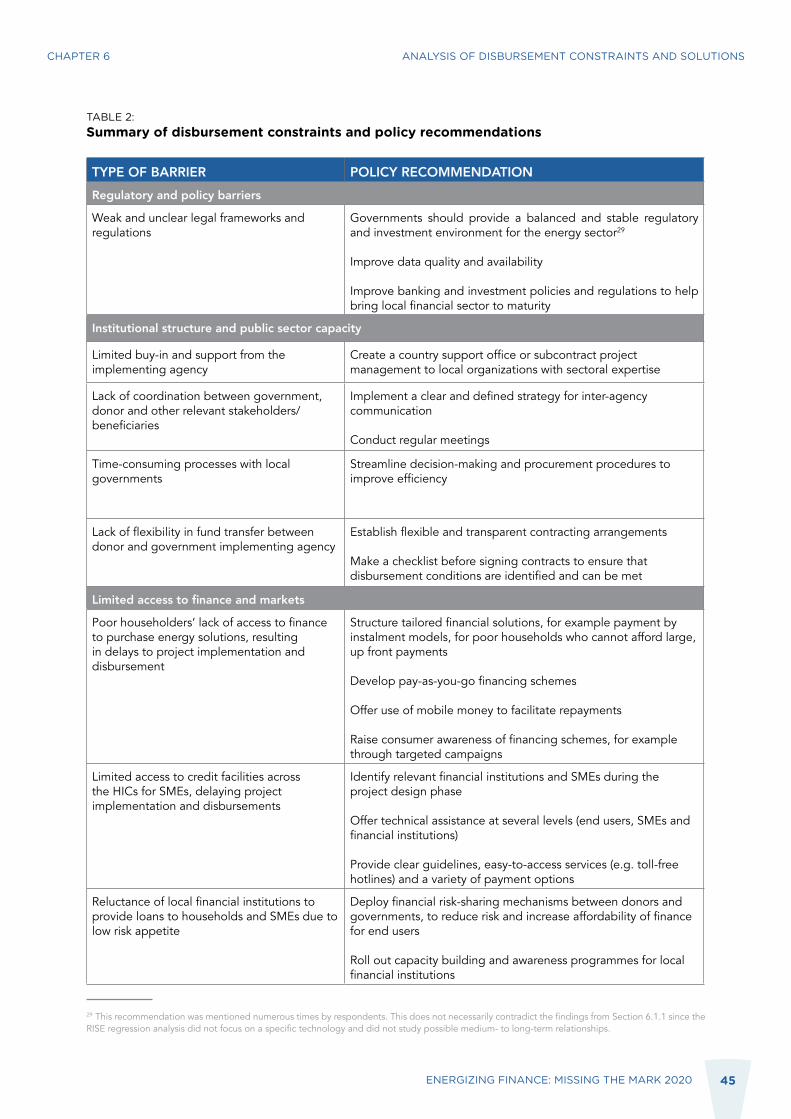
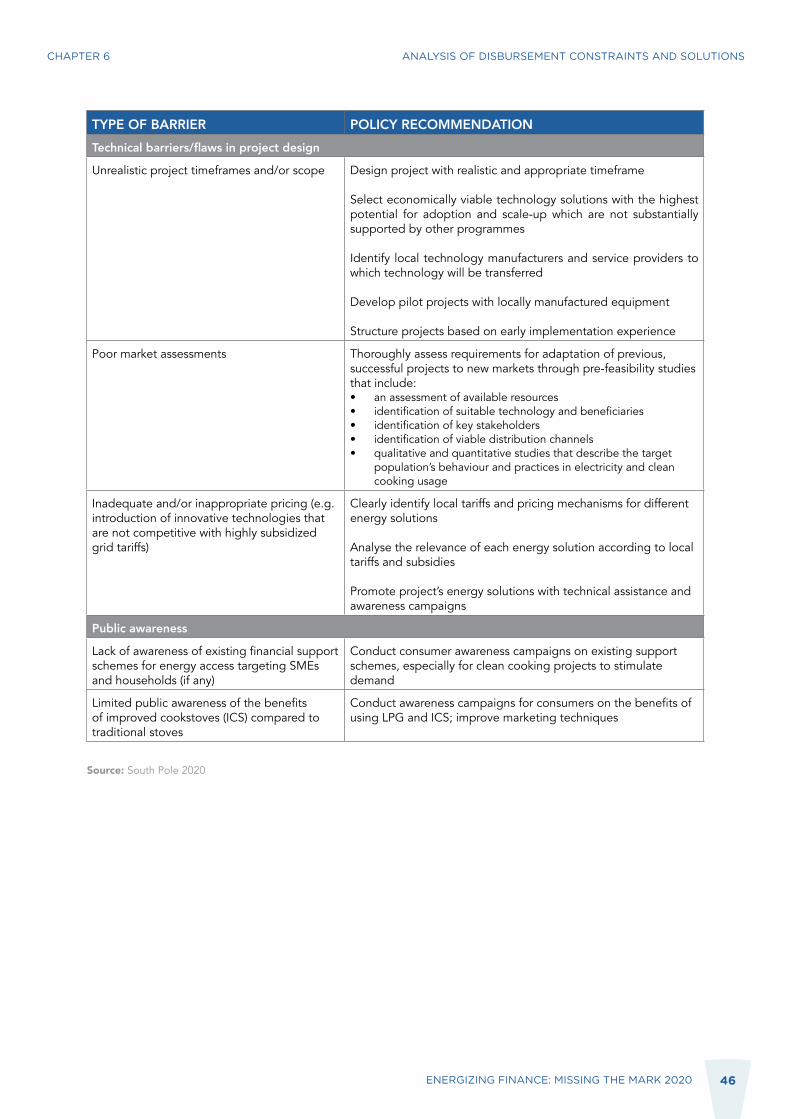
TABLE 2 Summary of disbursement constraints and policy recommendations 45
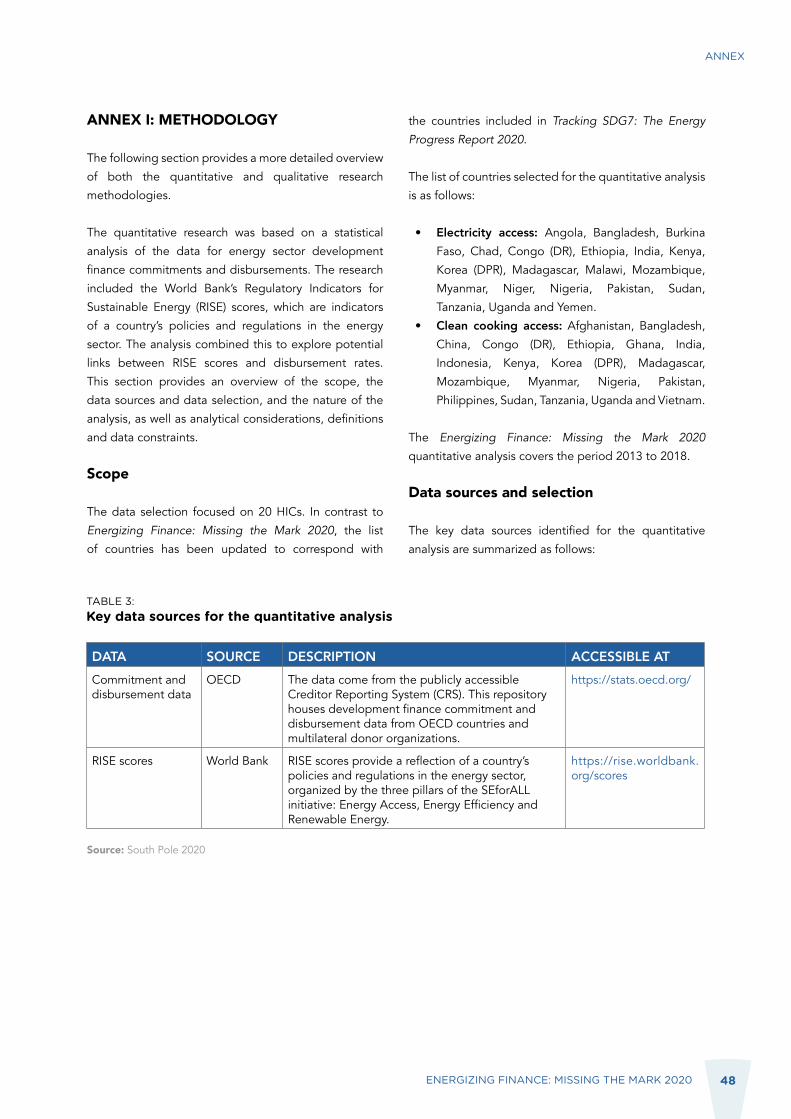
TABLE 3 Key data sources for the quantitative analysis 48
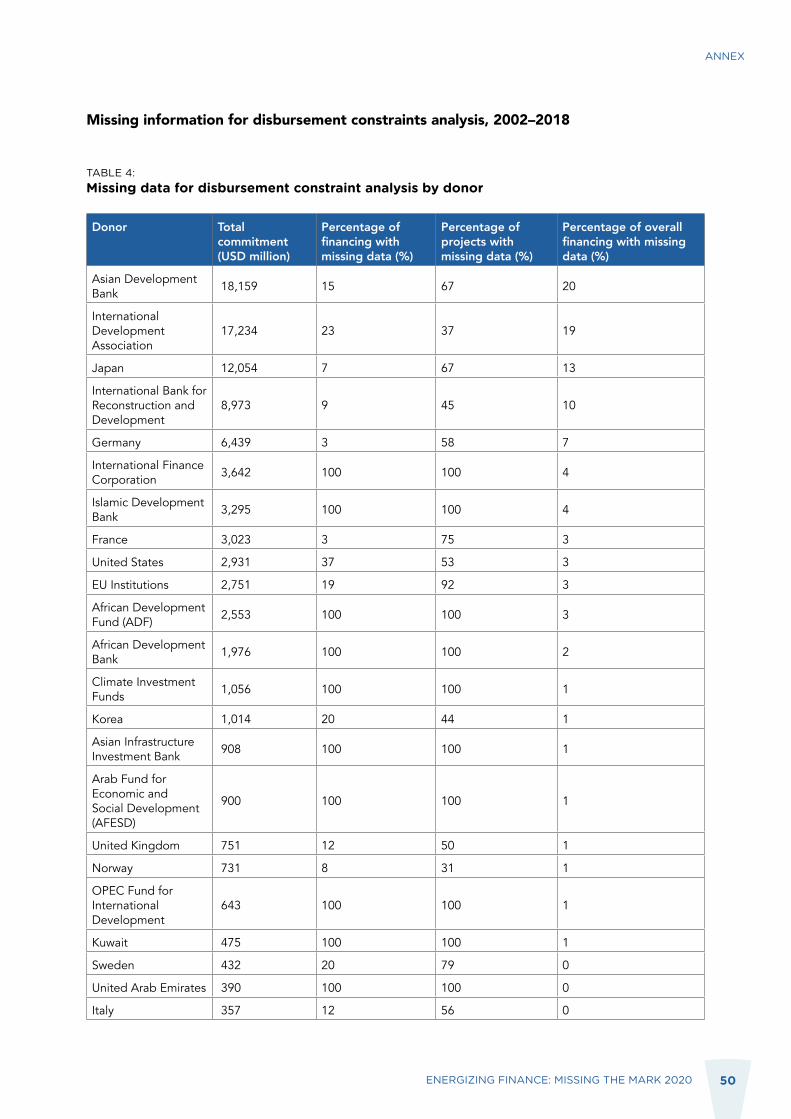
TABLE 4 Missing data for disbursement constraint analysis by donor 50
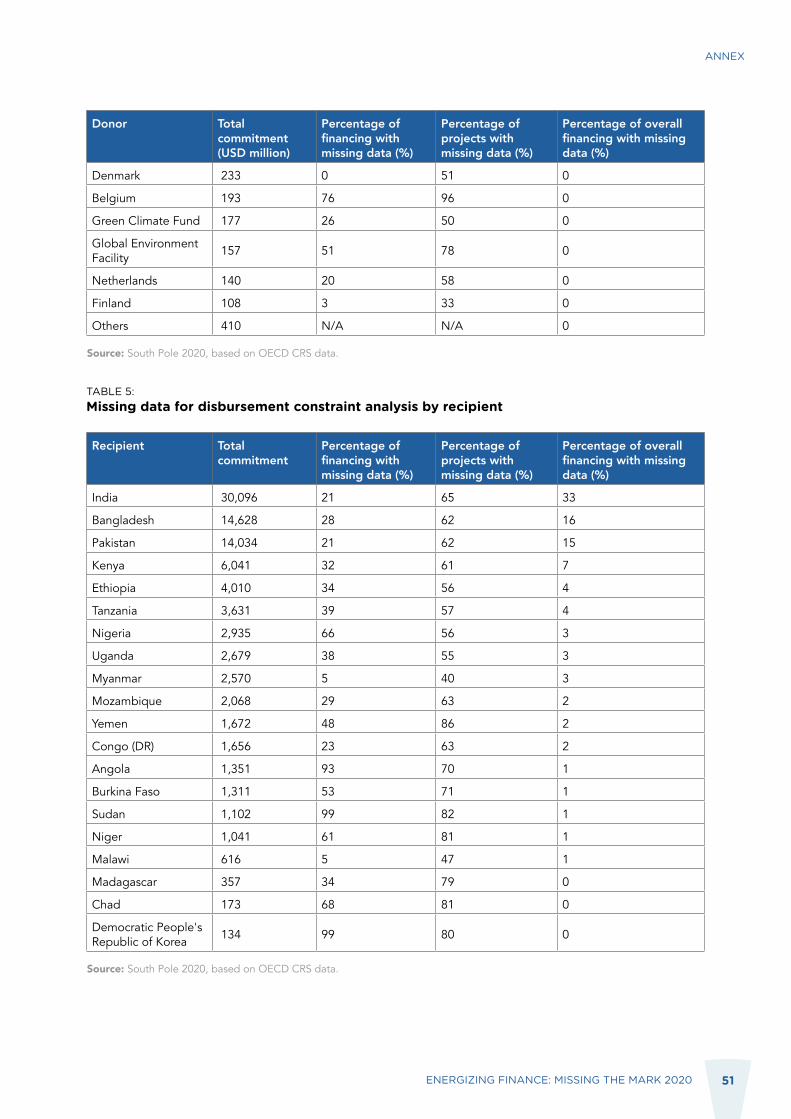
TABLE 5 Missing data for disbursement constraint analysis by recipient 51
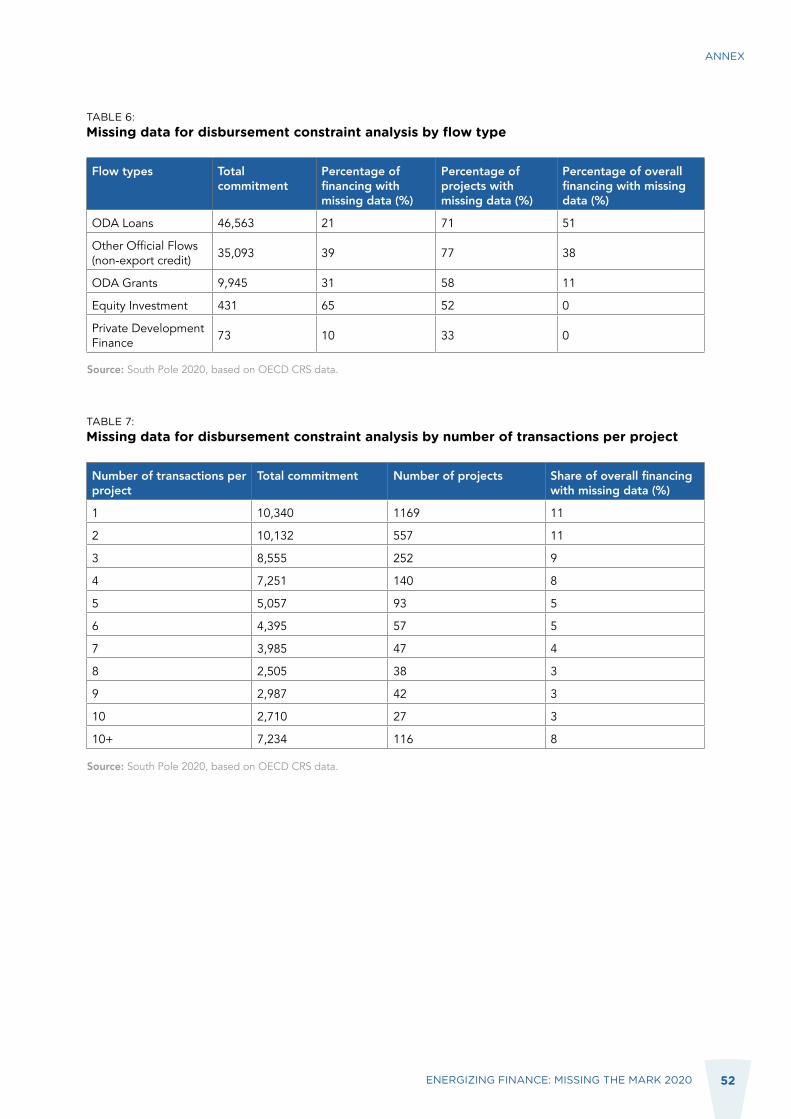
TABLE 6 Missing data for disbursement constraint analysis by flow type 52
TABLE 7 Missing data for disbursement constraint analysis by number
of transactions per project 52
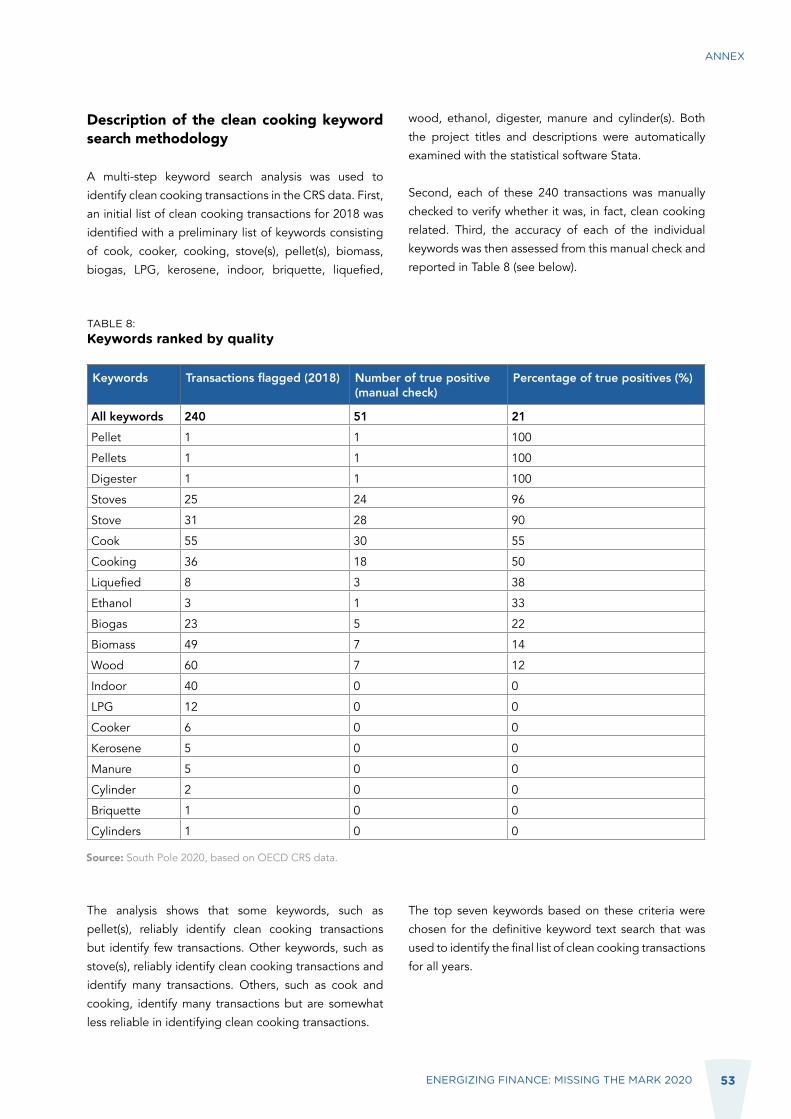
TABLE 8 Keywords ranked by quality 53
TABLE 9 Analysis grid for reports review 58
TABLE 10 Report review matrix 58
LIST OF TABLES
FIGURE 1 Growth of energy finance disbursements in HICs compared
to overall development finance disbursements 2013-2018 8
FIGURE 2 Energy finance commitments and disbursements for HICs 2013-2018 9
FIGURE 3 Energy projects delayed and financing delayed by recipient
2002-2018 9
FIGURE 4 Annual commitments and disbursements to energy and
overall development projects 17
FIGURE 5 Energy finance commitments and disbursements 2013-2018 18
FIGURE 6 Treemap of volume of energy finance disbursements
(in USD billion) to HICs by country 2013ndash2018 19
FIGURE 7 Share of energy finance commitments in HICs
by sub-sector 2013-2018 20
FIGURE 8 Energy finance disbursements to HICs per sub-sector 21
FIGURE 9 Clean cooking finance commitments and disbursements
to HICs 2013-2018 24
FIGURE 10 Improvements in clean cooking access and
clean cooking disbursements 2000-2016 25
FIGURE 11 Graphical interpretation of average project delay (APD) 28
FIGURE 12 Delays in energy sector financing and project implementation
2002-2018 29
LIST OF FIGURES
FIGURE 13 Projects delayed financing delayed
and APD by sub-sector 2002-2018 30
FIGURE 14 Percentage of projects delayed financing delayed
and APD by HIC 2002-2018 31
FIGURE 15 Projects delayed financing delayed and APD by
financing instrument 2002-2018 32
FIGURE 16 APD by project size for renewable generation projects 33
FIGURE 17 APD by project size for non-renewable generation projects 33
FIGURE 18 APD by project size for energy policy projects 34
FIGURE 19 APD by project size for energy distribution projects 34
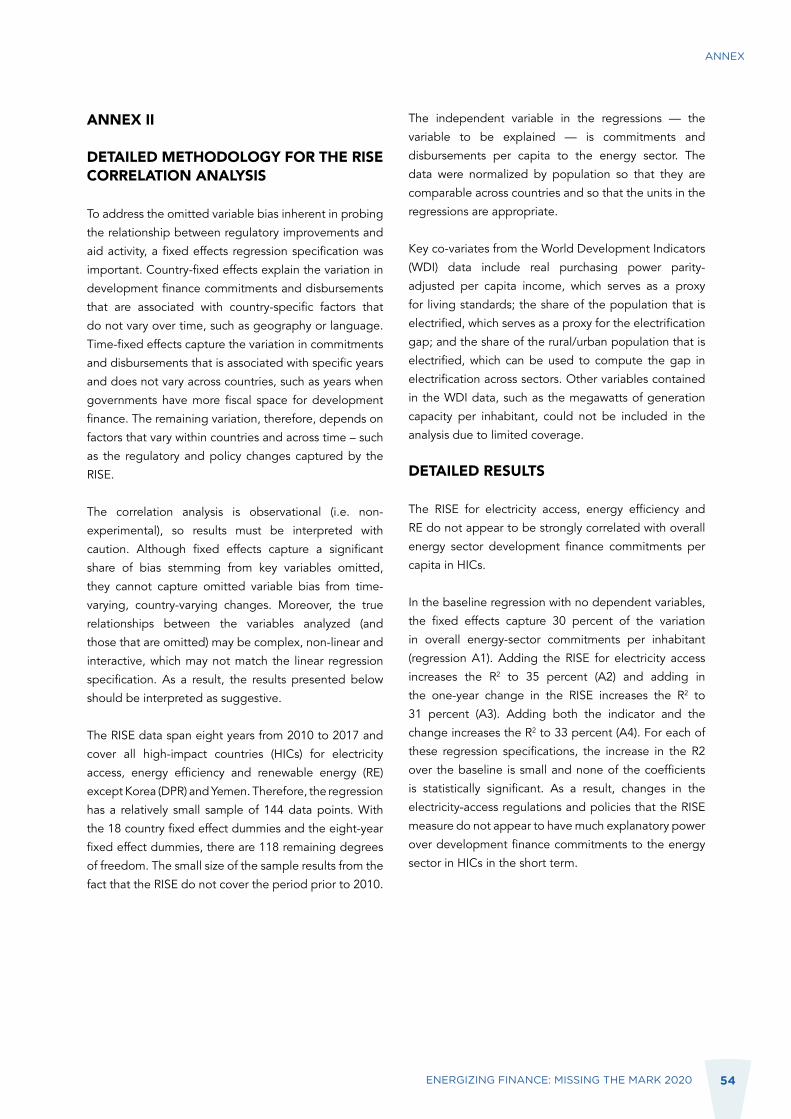
FIGURE 20 Energy sector commitments per capita
and RISE scores HICs 2013-2018 55
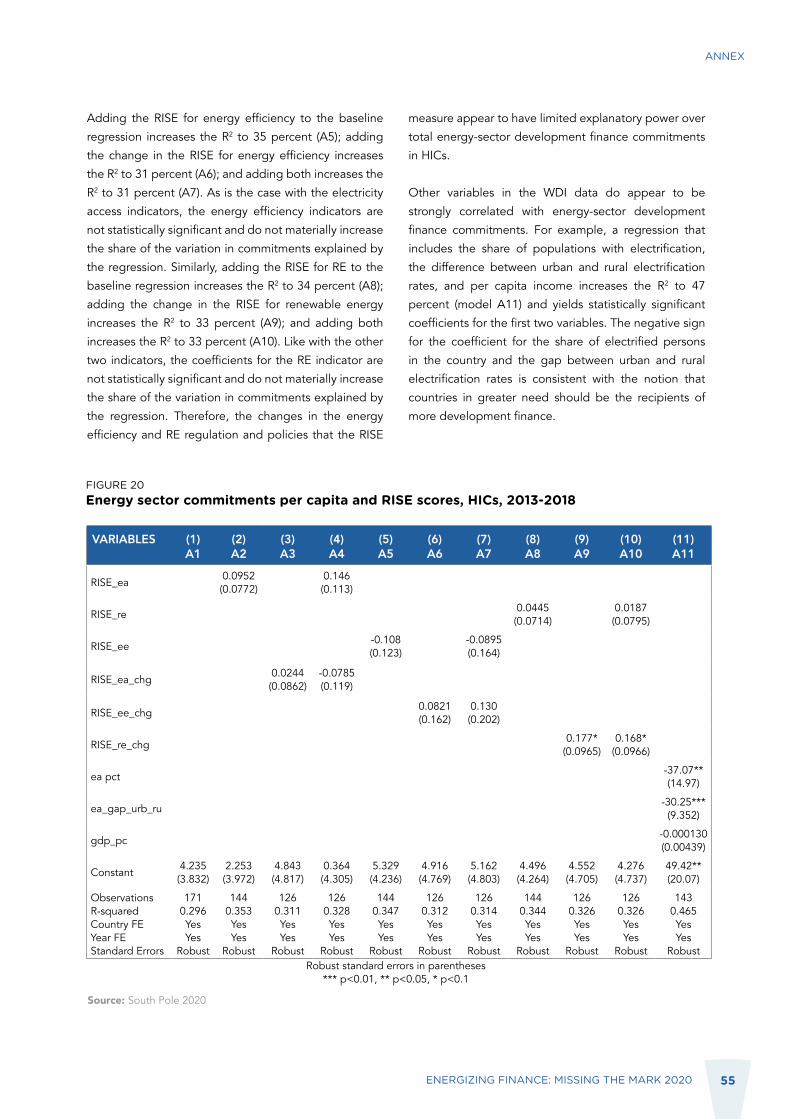
FIGURE 21 Energy sector disbursements per capita
and RISE scores HICs 2013-2018 56
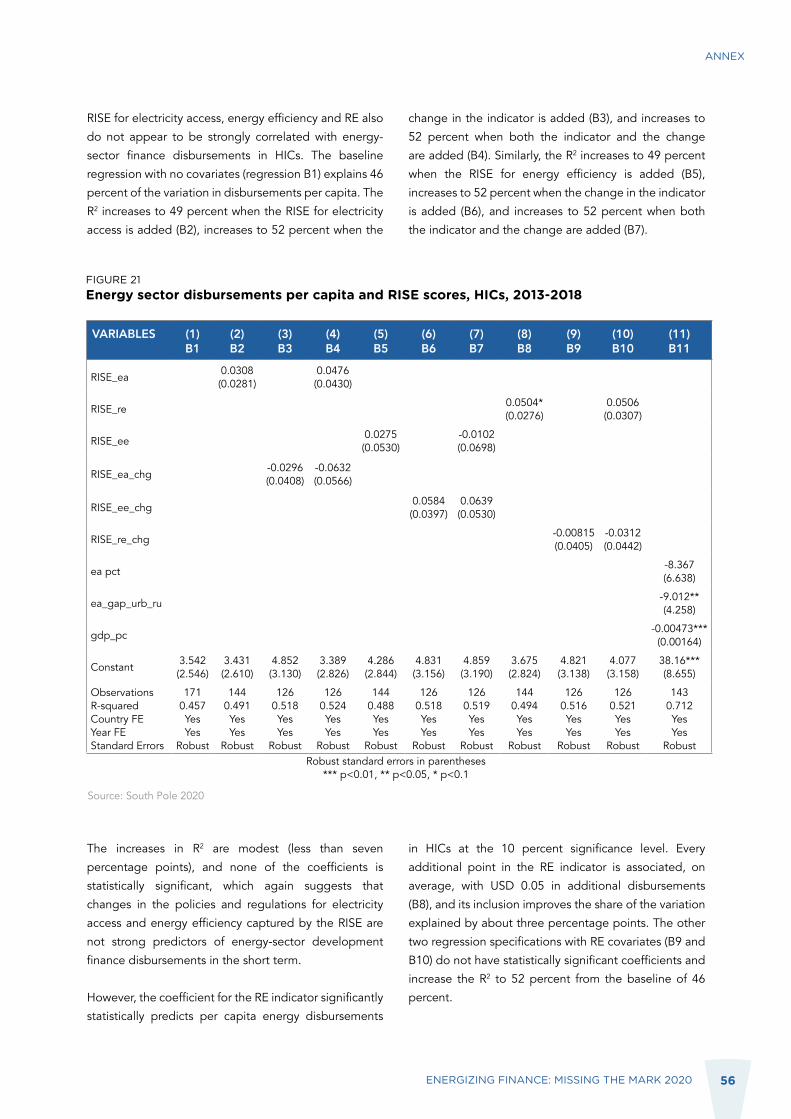
FIGURE 22 RE commitments per capita and RISE scores 57
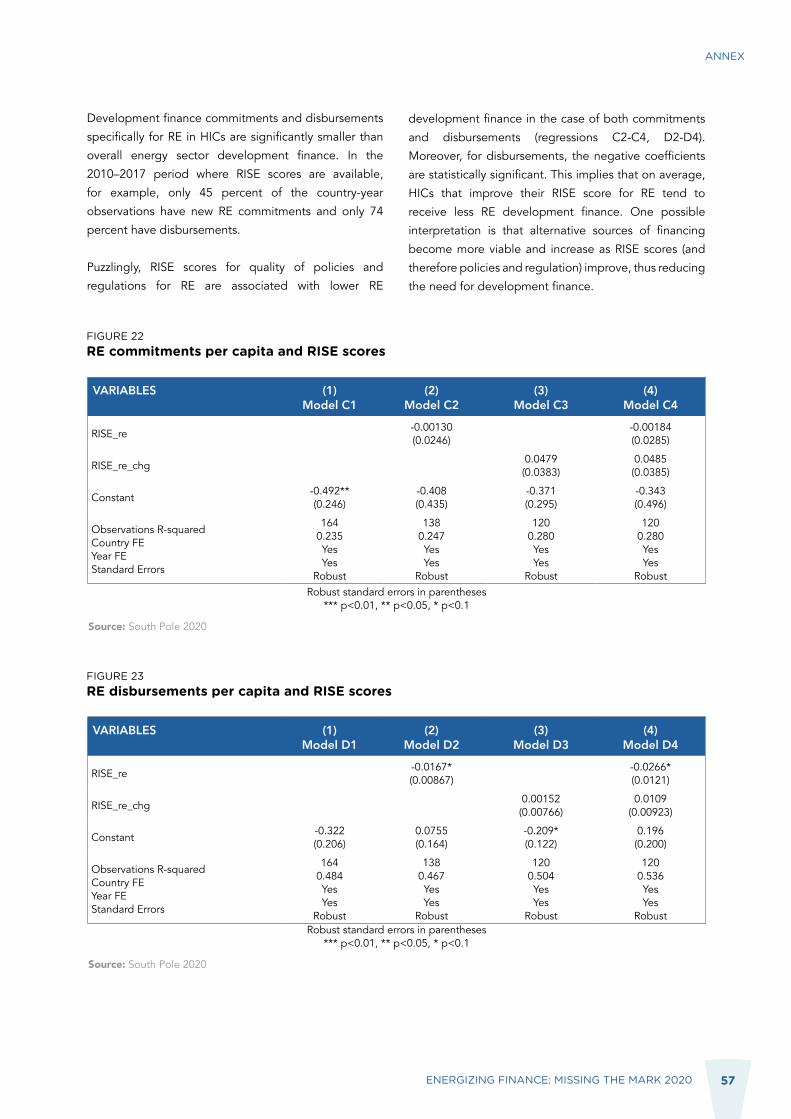
FIGURE 23 RE disbursements per capita and RISE scores 57
FOREWORD
We know that 789 million people lack access to electricity
and 28 billion lack access to clean cooking These
access gaps translate into a poor individual quality of
life a deepening climate crisis and countriesrsquo inability to
protect their citizens and economies from the COVID-19
pandemic The stakes are high for immediate progress
on Sustainable Development Goal 7 (SDG7) which calls
for affordable reliable sustainable and modern energy
for all by 2030
There are two sides to the financing challenge of
closing energy access gaps First we need financial
commitments made to programmes designed to close
the gaps Second we need these funds to be disbursed
Until disbursements occur there is no positive impact
on the ground
Energizing Finance Missing the Mark 2020 identifies
gaps between commitments and disbursements of
development finance for energy in 20 countries in Africa
and Asia with the largest electricity and clean cooking
access deficits referred to as the high-impact countries
(HICs) There are many reports that focus on the finance
needed or committed to energy access this report
provides much-needed evidence on how efficiently
committed energy finance is disbursed
It shows that already insufficient levels of finance
commitments for energy access are suffering from
woeful lags in disbursement This inhibits progress on
SDG7 which as we know enables all other SDGs While
USD 52 billion in energy finance was committed to
these countries between 2013 and 2018 disbursements
totalled only USD 32 billion over the same period
The cumulative effect of disbursement lags combined with
continuing shortfalls in commitments to financing energy
access in the HICs as identified in Energizing Finance
Understanding the Landscape 2020 means the world is
on track to miss the 2030 SDG7 deadline by decades
5ENERGIZING FINANCE MISSING THE MARK 2020
Photo by Asian Development Bank
6ENERGIZING FINANCE MISSING THE MARK 2020
This report finds that while investment delays have
declined overall since 2002 fully 58 percent of planned
financing to the energy sector and 49 percent of projects
in HICs were delayed from 2002 to 2018 This is both
astonishing and unacceptable and should galvanise a
full range of stakeholders to devise solutions to ensure
critical energy access initiatives receive the financing
they need ndash on schedule ndash to proceed
The true value of Energizing Finance Missing the
Mark 2020 is not that it unearths disbursement lags
It also identifies the causes of these lags which exist
throughout the entire energy access ecosystem By
examining the experiences of projects and programmes
in India Madagascar Myanmar Nigeria and Rwanda the
report brings to light how factors such as a strong local
financial services sector well-organized administrative
processes robust institutions and regulations and good
coordination underpin efficient disbursement These
are valuable insights for policymakers development
financiers donors and project developers alike
This report gives these stakeholders a series of
recommendations to act on including improving initial
project design simplifying administrative processes
facilitating stakeholder interaction and creating an
enabling environment to fast-track disbursements It
also stresses the need for stakeholders to collaborate
on building standardized tracking indicators for energy
finance disbursement so that constraints can be
identified and addressed swiftly
The findings and advice contained in Energizing Finance
Missing the Mark 2020 could not come at a more critical
time for the international community grappling as it is
with strategies for how to best-respond to COVID-19 to
ensure developing countries do not fall further behind
economically Increased access to sustainable energy
should be a central part of those strategies and access
can only increase if we address current bottlenecks that
delay the disbursement of energy access finance
DAMILOLA OGUNBIYICEO and Special Representative of the UN Secretary-General for Sustainable
Energy for All and Co-Chair of UN-Energy
RENAT HEUBERGERCEO and Founding Partner
South Pole
7ENERGIZING FINANCE MISSING THE MARK 2020
EXECUTIVE SUMMARY
Access to affordable reliable clean safe and sustainable
energy is critical to improving the living conditions of
people around the world Today an estimated 789
million people still do not have access to affordable and
reliable electricity sources and 28 billion people1 are
without clean cooking facilities2 greatly affecting their
quality of life International climate and development finance can help reduce energy finance deficits for both electricity and clean cooking but what happens if the funds are pledged but never disbursed
This report identifies the gaps between commitments
and disbursements of development finance for
energy3 as tracked in the OECD Creditor Reporting
System (CRS) database This database consists of
official development finance and private development
finance from philanthropies It assesses the efficiency
of disbursement both in terms of the percentage of
financial commitments that suffer disbursement delays
and the number of projects that experience delayed
implementation Through a qualitative lens the report
also identifies reasons why development finance
disbursement constraints occur
Monitoring the disbursement gap is important because while commitments reflect ambition only disbursements actually deliver impact on the ground Since Sustainable Development Goal 7 (SDG7) is heavily
linked to finance mdash specifically the disbursement of
funds mdash it is vital to examine the efficiency with which
finance is actually disbursed to achieve energy targets
This Energizing Finance Missing the Mark 2020 report
is a new edition of the Energizing Finance Missing the
Mark 2017 report and focuses on 20 countries in Africa
and Asia that are classified as high-impact countries4
(HICs) by Sustainable Energy for All (SEforALL) HICs
are the countries with the most significant electricity
and clean cooking access deficits and therefore
need substantial international and national support
Energizing Finance Missing the Mark 2020 numbers
are not directly comparable to the findings from the
Energizing Finance Understanding the Landscape 2020
report which tracks finance commitments to energy
from a broader group of data sources including private
investment5
1 ESMAPrsquos State of Access to Modern Energy Cooking Services 2020 report released in September 2020 finds that four billion people around the world still lack access to clean efficient convenient safe reliable and affordable cooking energy with 125 billion considered in transition and the other 275 billion facing significantly higher barriers to access2 ldquoAccess to affordable reliable sustainable and modern energy for all ndash Access to clean cookingrdquo SDG7 ndash Data and projections International Energy Agency (IEA) 18 May 2020 httpswwwieaorgreportssdg7-data-and-projectionsaccess-to-clean-cooking3 A clear and reliable distinction between electricity and clean cooking data was not possible due to CRS data classification constraints As such the report refers to energy rather than solely electricity4 For electricity the countries are Angola Bangladesh Burkina Faso Chad Congo (DR) Ethiopia India Kenya Korea (DPR) Madagascar Malawi Mozambique Myanmar Niger Nigeria Pakistan Sudan Tanzania Uganda and Yemen For clean cooking the countries are Afghanistan Bangladesh China Congo (DR) Ethiopia Ghana India Indonesia Kenya Korea (DPR) Madagascar Mozambique Myanmar Nigeria Pakistan Philippines Sudan Tanzania Uganda and Vietnam5 Energizing Finance Missing the Mark 2020 includes only the OECDrsquos CRS data due to the reportrsquos focus on disbursement numbers which only the CRS database provides As a result the energy sector commitment statistics from both reports are not directly comparable
MAIN FINDING 1 Disbursements for energy in HICs have increased much faster than overall development finance disbursements Disbursements for energy projects in HICs increased by more than 61 percent between 2013 and 2018 This is much faster than overall
development finance disbursements over the same period in the same
countries which was about a 12 percent increase (see Figure 1)
EXECUTIVE SUMMARY
8ENERGIZING FINANCE MISSING THE MARK 2020
Energy finance disbursements continue to significantly lag behind commitmentsDespite a trend in growing energy finance disbursements disbursements (USD 32 billion) still substantially lagged commitments (USD 52 billion) in the period 2013 to 2018 (see Figure 2) Given
the continued low levels of commitments for energy finance the lag
in disbursements only compounds the lack of finance flowing to the
sector leaving many HICs further and further behind The message is
clear significantly increased disbursements at approximately USD 45
billion per year6 between 2020 and 2030 are urgently needed to meet
SDG7 energy access targets Aggregate disbursements from 2013-2018
(USD 32 billion) were insufficient to cover even one year of the annual
investment need of USD 45 billion
6 IEA International Renewable Energy Agency United Nations Statistics Division World Bank WHO (2020) Tracking SDG 7 The Energy Progress Report World Bank Washington DC
EXECUTIVE SUMMARY
FIGURE 1Growth of energy finance disbursements in HICs compared to overall development finance disbursements 2013-2018
Source South Pole 2020 based on OECD CRS data
Gro
wth
rate
(100
=201
3 ba
selin
e)
170
160
150
140
130
120
110
100
2013 2014 2015 2016 2017 2018
Energy finance disbursements in HICs Overall development finance disbursements
90
80
MAIN FINDING 2
9ENERGIZING FINANCE MISSING THE MARK 2020
FIGURE 3Energy projects delayed and financing delayed by recipient 2002-2018
Finance Delayed () Projects Delayed ()
Madag
ascar
Yemen
Banglad
esh
Tanzan
ia
Uganda
India
Congo (D
R)
Pakist
anKen
ya
Mozambique
Ethiopia
Malawi
Myanmar
3337 37
574849 50 49 48
4051 53 49
4155 55 5256 6057
67 70 7381
94 96
0
100
50
Source South Pole 2020 based on OECD CRS dataNote Six of the 20 HIC countries are not shown here as incomplete data on commitments accounted for more than 50 percent of total commitments
On average disbursement delays have declined since 2002 Project delays and delayed disbursements were often seen as interlinked
While there has been a slight decline in disbursement delays they remain substantial 58 percent of planned disbursements to the energy sector and 49 percent of projects in HICs were delayed in the period 2002ndash2018 This is a slight improvement on the findings
in Energizing Finance Missing the Mark 2017 which reported that 69
percent of planned disbursements were delayed and 52 percent of
projects were affected by disbursement delays
FIGURE 2Energy finance commitments and disbursements for HICs 2013-2018
Source South Pole 2020 based on OECD CRS data
USD
(bill
ions
)
12
10
8
6
4
2
02013 2014 2015 2016 2017 2018
Commitments Disbursements
EXECUTIVE SUMMARY
These delays seem pervasive as they do not stem only from a few large projects almost half of all energy sector projects (49 percent) in HICs since 2002 were delayed In the 13 countries with sufficient data Myanmar had the
longest average delay and Madagascar had the shortest (see Figure 3)
MAIN FINDING 3
10ENERGIZING FINANCE MISSING THE MARK 2020
Project-specific factors such as sound project design including consideration for limited local financial services and good coordination among key actors are crucial to efficient disbursementTo understand disbursement delays better this study looked at evaluation
reports and databases and conducted interviews and surveys as part of
deep-dives in five countries (India Madagascar Myanmar Nigeria and
Rwanda) These countries were selected for their geographic diversity
different stages of development and different income and energy access
levels
EXECUTIVE SUMMARY
MAIN FINDING 4
Survey respondents highlighted the significance of project-related factors for low disbursements including
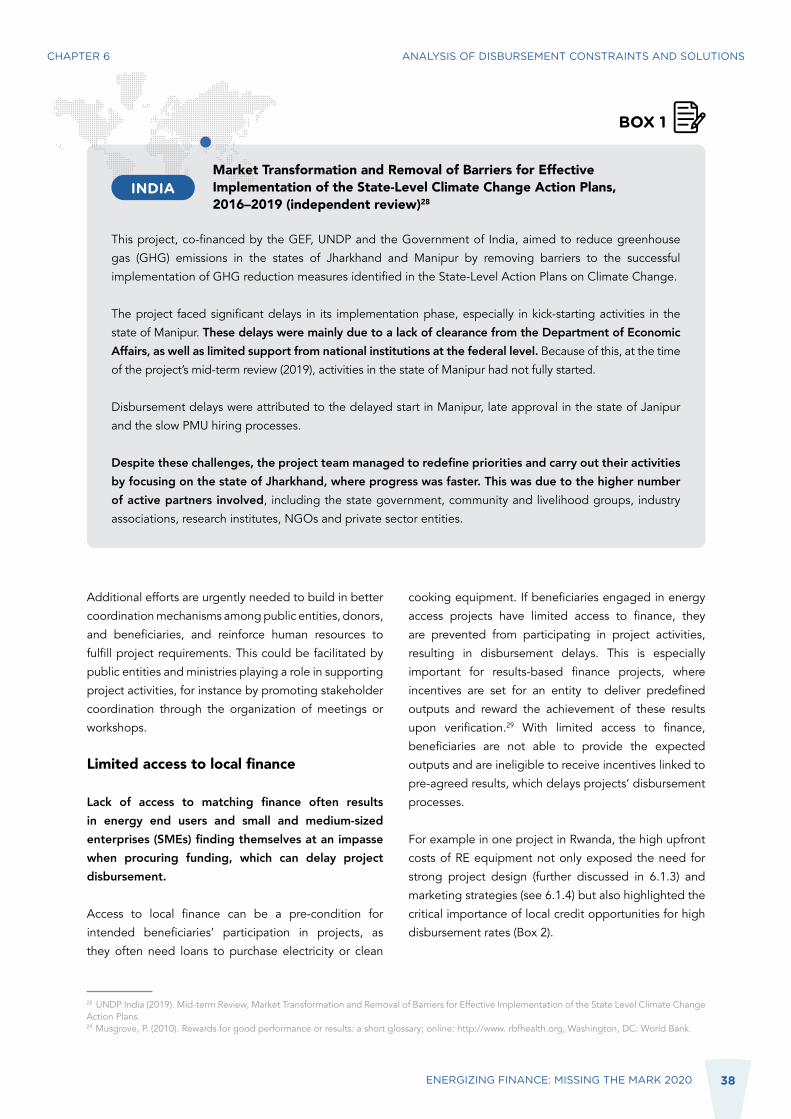
bull Cumbersome administrative processes and lack of capacity among donors and implementing entities For example a Global Environment Facility (GEF)-UNDP project aimed at reducing greenhouse
gas (GHG) emissions in the Indian states of Jharkhand and Manipur was not as successful as
expected because of significant delays due to administrative processes (delayed clearance) at
the federal level notably from the Department of Economic Affairs
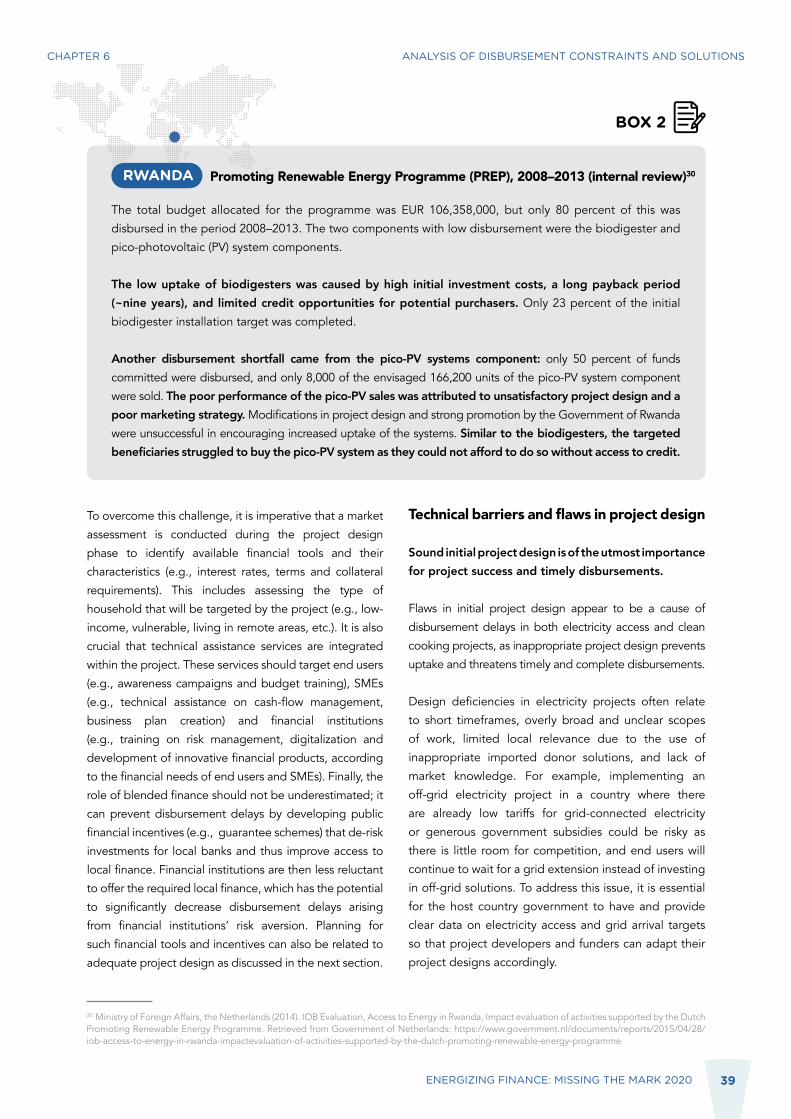
bull Design flaws that hinder project execution For example the Promoting Renewable
Energy Programme (PREP) in Rwanda and particularly its sub-project on biodigesters faced
disbursement delays because the initial project design was not adapted to local end usersrsquo capacity
and consumption habits Failing to consider potentially limited local access to financial and banking
services in project design may also present disbursement and implementation constraints
In summary insufficient committed investment coupled with continued disbursement delays and project-specific
weaknesses jeopardize achievement of SDG7 targets and the provision of energy for the most vulnerable in society
Not only is there a pressing need to significantly increase finance commitments to the energy sector as set out in
SEforALLrsquos report Energizing Finance Understanding the Landscape 2020 it is also imperative to increase the speed of disbursing energy finance It bears repeating that only disbursed money can have an impact on the ground
POLICY RECOMMENDATIONS
This report recommends that national policymakers bilateral and multilateral development agencies and financial
institutions take the following steps to accelerate the disbursement of energy finance
bull It is imperative that national policymakers improve the country-level factors that can accelerate disbursements for energy projects including policies and programmes that improve access to local finance
bull Donors and development finance institutions (DFIs) should combine investment programmes with technical assistance and capacity building for recipient countries and institutions to increase the efficiency of
disbursement at country level
bull Donors and their agencies and DFIs and recipient countries should invest more in sound project feasibility assessment and design and simplify administrative processes to make them more efficient
bull The OECD and its members particularly multilateral development banks should introduce more precise and standardized tracking indicators for energy access finance disbursements to better measure progress
This will help the global community identify underlying reasons for inefficient disbursement and will inform
mitigation actions
11
1CHAPTER
INTRODUCTION
Phot
o by
Asi
an D
evel
opm
ent B
ank
12ENERGIZING FINANCE MISSING THE MARK 2020
BACKGROUND
Access to affordable reliable clean safe and sustainable
energy is an integral component of the UN Sustainable
Development Goals (SDGs) In 2020 it is estimated that
789 million people do not have access to an affordable
and reliable electricity source and 28 billion people are
without clean cooking facilities7 There is an urgent need
to address this critical lack of access to electricity and
clean cooking to improve living conditions for people
around the world and meet the targets set out in SDG7
The flow of international climate and development
finance targeting electricity and clean cooking access in
developing countries is a key component in supporting
action toward SDG7
In this context SEforALL and its partners produce a
series of reports under the auspices of the Energizing
Finance research series which provide a systematic
analysis of finance flows and market trends in developing
countries The reports include
Understanding the Landscape (Tracking Finance
for Electricity and Clean Cooking in High-Impact
Countries)
Missing the Mark (Identifying Gaps and Lags in
Disbursement of Development Finance for the
Energy Sector)
Taking the Pulse (Understanding Energy Access
Market Needs in Five High-Impact Countries)
These reports were first published in 2017 New editions
of Energizing Finance Understanding the Landscape
have been published annually since 2017 and a second
edition of Taking the Pulse was published in 2019 This
is the second edition of the Energizing Finance Missing
the Mark report
The reports focus on 20 countries in Sub-Saharan Africa
and Asia with the highest energy access deficits (referred
to as high-impact countries (HICs) These countries are
facing important difficulties in accessing electricity and
clean cooking solutions and are consequently those most
in need of international and national development finance
SCOPE OF THE REPORT
In this context Energizing Finance Missing the Mark
2020 provides an updated understanding of the
gaps between public sector development finance
commitments and disbursements relating to energy
projects in HICs while also identifying the barriers that
prevent efficient disbursements based on a six-year
period of analysis (2013ndash2018) The ultimate goal is to inform policy and finance decision-makers to enable them to take action to improve disbursement efficiency and thereby accelerate the deployment of funds for energy projects
This report builds on Energizing Finance Missing the
Mark 2017 Section 2 summarizes the approach and
methodology then Sections 3 and 4 present energy and
clean cooking commitment and disbursement trends
Section 5 investigates disbursement delays and how
they differ by country sector and recipient
Finally Section 6 examines additional quantitative
and qualitative inputs to aid the understanding
of disbursement gaps and provides policy
recommendations to facilitate disbursements
Specifically the analysis tests the strength of the
correlation between the World Bankrsquos Regulatory
Indicators for Sustainable Energy (RISE) scores and
disbursement rates and reviews disbursement
efficiency through an analysis of evaluation reports
databases and the results of semi-structured interviews
and surveys
7 Tracking SDG7 The Energy Progress Report 2020 Accessible at httpstrackingsdg7esmaporgdownloads
CHAPTER 1 INTRODUCTION
bull
bull
bull
13
2CHAPTER
APPROACH
Phot
o by
Asi
an D
evel
opm
ent B
ank
14ENERGIZING FINANCE MISSING THE MARK 2020
CHAPTER 2 APPROACH
STATISTICAL ANALYSIS
This reportrsquos statistical analysis is based on data from the
OECDrsquos Creditor Reporting System (CRS) database which
contains data on development finance commitments
and disbursements for energy and energy access
projects While the Energizing Finance Understanding
the Landscape report considers additional data sources
Energizing Finance Missing the Mark analyses only CRS
data due to the reportrsquos focus on disbursement data
which only the CRS database provides This means
that for the purposes of this report commitment
and disbursement data only include data from donor
countries multilateral institutions and multilateral and
bilateral development finance institutions (DFIs) as
reported in the OECD CRS database This does not
include finance from corporates impact investors or
overseas development finance from China India or
Russia This means that figures in this report relating
to finance commitments cannot be directly compared
with those in the Energizing Finance Understanding
the Landscape 2020 report as that report draws from a
broader set of data sources
The trend analysis uses the most recent available data
and covers the six-year period between 2013 and 2018
The disbursement constraints analysis examines a longer
period from 2002 to 2018 to account for the fact that
disbursement of funds for a project may be scheduled
over several years
The CRS database categorizes projects by their
purpose through a code system For energy projects
only the projects coded under lsquo230 II3 Energy Totalrsquo
were considered As the CRS data do not provide a
categorization of clean cooking projects such projects
were identified in the entire dataset by a keyword
search algorithm Data collection includes financial
flows concerning commitments disbursements
disbursement schedules transaction dates project start
and completion dates and basic flow characteristics
(donor recipient country and project purpose) Key
terms are described in the Glossary
The trend analysis assesses close to 45000 energy
sector transactions8 and over 1700 transactions for
clean cooking between 2013 and 2018 for all recipient
countries (not just HICs) For the disbursement
constraints analysis between 2002 and 2018 nearly
7000 projects were analysed All data are presented in
2018 USD
The analysis also includes a review of the World Bankrsquos
Regulatory Indicators for Sustainable Energy (RISE)
RISE scores reflect a countryrsquos policies and regulations
in the energy sector and act as a reference point for
policymakers to develop policies and regulations that
advance sustainable energy goals This analysis attempts
to assess whether (and if so to what extent) there are
parallels between RISE scores (or their evolution over
time) and the commitmentdisbursement gap
Details of the methodology used for the statistical
analysis are provided in Annex I
8 Transactions are individual record lines in the CRS database that describe either a commitment or a disbursement a single project could have multiple transactions
15ENERGIZING FINANCE MISSING THE MARK 2020
LIMITATIONS OF THE ANALYSIS
The analysis is limited by the completeness and quality
of the data notably the availability in the CRS database
of a projectrsquos characteristics eg commitment amount
disbursement amount dates of transactions and
expected end date In addition disbursement transaction
data are recorded only on a yearly basis which limits
the lsquoresolutionrsquo and accuracy of disbursement delays
Recording and reporting transaction data on a quarterly
or monthly basis would increase the accuracy of the
analysis
As the CRS database classification is not well suited to
researching clean cooking projects (ie there is no lsquoclean
cookingrsquo category) a multi-step keyword search was used
to identify clean cooking projects in the database As a
result the data selectioncollection may be imperfect
as there is the risk of incorrectly excluding projects that
are clean cooking related and incorrectly including
projects that are not clean cooking related or only
have a minor clean cooking component For example
Energizing Finance Understanding the Landscape 2019
reported an estimated public finance commitment of
USD 108 million for residential clean cooking access
for 2015ndash2016 This is far higher than the clean cooking
commitment figures from the CRS database discussed
in Section 4 This difference highlights the challenge of
capturing all clean cooking data in the CRS database
without a lsquoclean cookingrsquo category See Annex I for
more details Finally as was also noted in the Energizing
Finance Missing the Mark 2017 analysis the CRS
coding system is also less suited to distinguishing and
tracking off-grid disbursements Nonetheless the CRS
remains the most complete database of information for
development finance for the energy sector The ability
to track successful disbursement of commitments to
clean cooking and off-grid projects would benefit from
a database that specifically categorizes such projects
As a result of recommendations arising from Energizing
Finance in 2017 and following consultations with the
OECD a clean cooking isolated grids and standalone
systems category will be implemented for data from
2019 onwards to facilitate such analysis
CHAPTER 2 APPROACH
16
3CHAPTER
TRENDS IN DEVELOPMENT FINANCE
FOR ENERGY
17ENERGIZING FINANCE MISSING THE MARK 2020
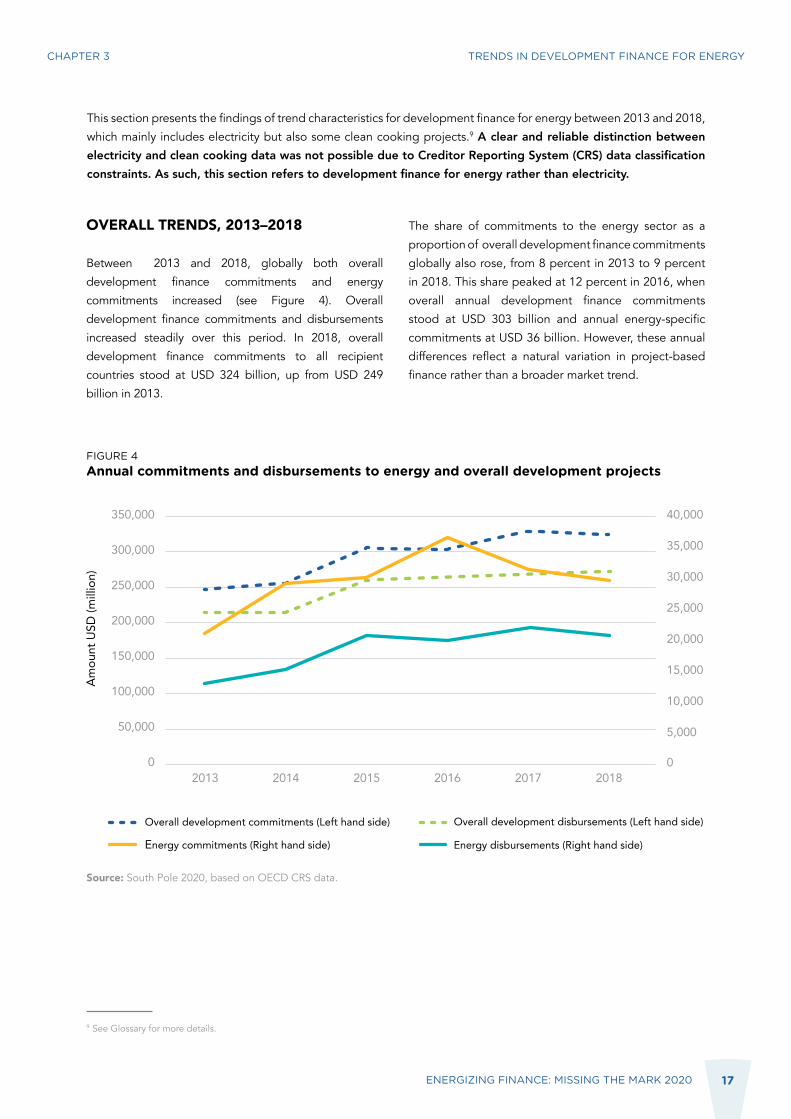
This section presents the findings of trend characteristics for development finance for energy between 2013 and 2018
which mainly includes electricity but also some clean cooking projects9 A clear and reliable distinction between electricity and clean cooking data was not possible due to Creditor Reporting System (CRS) data classification constraints As such this section refers to development finance for energy rather than electricity
The share of commitments to the energy sector as a
proportion of overall development finance commitments
globally also rose from 8 percent in 2013 to 9 percent
in 2018 This share peaked at 12 percent in 2016 when
overall annual development finance commitments
stood at USD 303 billion and annual energy-specific
commitments at USD 36 billion However these annual
differences reflect a natural variation in project-based
finance rather than a broader market trend
CHAPTER 3 TRENDS IN DEVELOPMENT FINANCE FOR ENERGY
FIGURE 4Annual commitments and disbursements to energy and overall development projects
Amou
nt U
SD (m
illio
n)
350000
300000
250000
200000
150000
100000
50000
0
40000
35000
30000
25000
20000
15000
10000
5000
02013 2014 2015 2016 2017 2018
Overall development commitments (Left hand side) Overall development disbursements (Left hand side)
Energy commitments (Right hand side) Energy disbursements (Right hand side)
9 See Glossary for more details
Source South Pole 2020 based on OECD CRS data
OVERALL TRENDS 2013ndash2018
Between 2013 and 2018 globally both overall
development finance commitments and energy
commitments increased (see Figure 4) Overall
development finance commitments and disbursements
increased steadily over this period In 2018 overall
development finance commitments to all recipient
countries stood at USD 324 billion up from USD 249
billion in 2013
18ENERGIZING FINANCE MISSING THE MARK 2020
10 Disbursement data do not allow for a distinction between funds being applied to implementation or pending in the beneficiaryrsquos bank accounts11 A non-HIC is a recipient country that is not considered an HIC for either energy transactions or clean cooking transactions There are 152 non-HICs for energy and 115 non-HICs for clean cooking
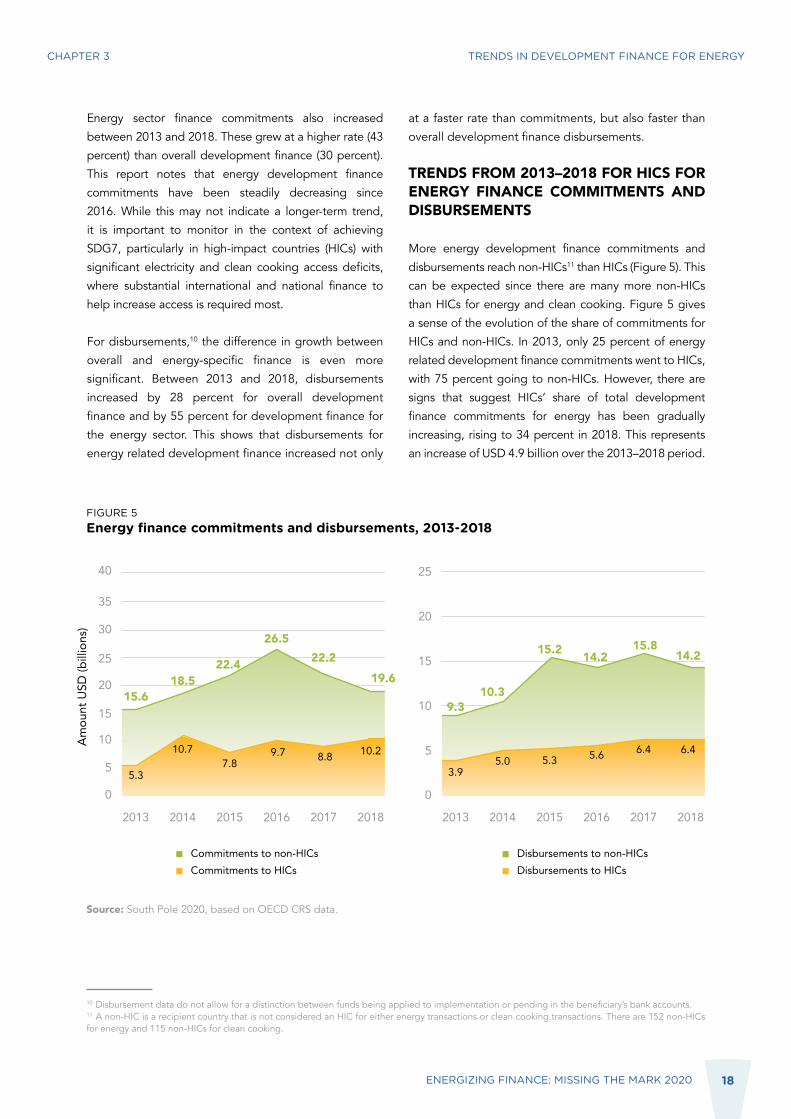
Energy sector finance commitments also increased
between 2013 and 2018 These grew at a higher rate (43
percent) than overall development finance (30 percent)
This report notes that energy development finance
commitments have been steadily decreasing since
2016 While this may not indicate a longer-term trend
it is important to monitor in the context of achieving
SDG7 particularly in high-impact countries (HICs) with
significant electricity and clean cooking access deficits
where substantial international and national finance to
help increase access is required most
For disbursements10 the difference in growth between
overall and energy-specific finance is even more
significant Between 2013 and 2018 disbursements
increased by 28 percent for overall development
finance and by 55 percent for development finance for
the energy sector This shows that disbursements for
energy related development finance increased not only
at a faster rate than commitments but also faster than
overall development finance disbursements
TRENDS FROM 2013ndash2018 FOR HICS FOR ENERGY FINANCE COMMITMENTS AND DISBURSEMENTS
More energy development finance commitments and
disbursements reach non-HICs11 than HICs (Figure 5) This
can be expected since there are many more non-HICs
than HICs for energy and clean cooking Figure 5 gives
a sense of the evolution of the share of commitments for
HICs and non-HICs In 2013 only 25 percent of energy
related development finance commitments went to HICs
with 75 percent going to non-HICs However there are
signs that suggest HICsrsquo share of total development
finance commitments for energy has been gradually
increasing rising to 34 percent in 2018 This represents
an increase of USD 49 billion over the 2013ndash2018 period
FIGURE 5Energy finance commitments and disbursements 2013-2018
Source South Pole 2020 based on OECD CRS data
Commitments to non-HICsCommitments to HICs
Disbursements to non-HICsDisbursements to HICs
Am
ount
USD
(bill
ions
) 30
35
40
25
25
20
20
15
15
10
10
55
0 0
2013 20132014 20142015 20152016 20162017 20172018 2018
53
156185
224 222196
265
10778
97 88 102
39
93103
152 158142 142
50 53 56 64 64
CHAPTER 3 TRENDS IN DEVELOPMENT FINANCE FOR ENERGY
19ENERGIZING FINANCE MISSING THE MARK 2020
In terms of disbursement the report also observes
a positive growth trend between 2013 and 2018
Disbursements for energy projects to HICs have
grown at a more rapid rate (61 percent growth) than
disbursements to non-HICs (52 percent growth) While
the share of disbursements for energy projects going to
HICs has stagnated at around 30 percent disbursements
still increased by USD 24 billion in absolute terms over
the 2013ndash2018 period
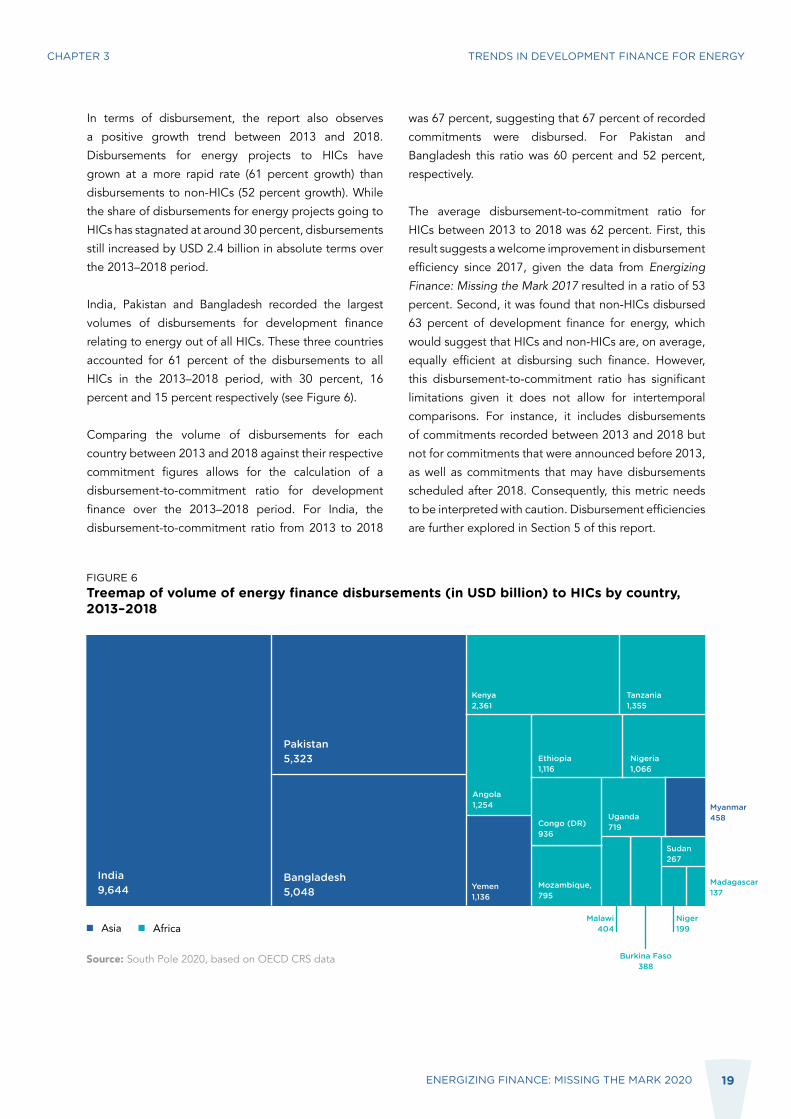
India Pakistan and Bangladesh recorded the largest
volumes of disbursements for development finance
relating to energy out of all HICs These three countries
accounted for 61 percent of the disbursements to all
HICs in the 2013ndash2018 period with 30 percent 16
percent and 15 percent respectively (see Figure 6)
Comparing the volume of disbursements for each
country between 2013 and 2018 against their respective
commitment figures allows for the calculation of a
disbursement-to-commitment ratio for development
finance over the 2013ndash2018 period For India the
disbursement-to-commitment ratio from 2013 to 2018
was 67 percent suggesting that 67 percent of recorded
commitments were disbursed For Pakistan and
Bangladesh this ratio was 60 percent and 52 percent
respectively
The average disbursement-to-commitment ratio for
HICs between 2013 to 2018 was 62 percent First this
result suggests a welcome improvement in disbursement
efficiency since 2017 given the data from Energizing
Finance Missing the Mark 2017 resulted in a ratio of 53
percent Second it was found that non-HICs disbursed
63 percent of development finance for energy which
would suggest that HICs and non-HICs are on average
equally efficient at disbursing such finance However
this disbursement-to-commitment ratio has significant
limitations given it does not allow for intertemporal
comparisons For instance it includes disbursements
of commitments recorded between 2013 and 2018 but
not for commitments that were announced before 2013
as well as commitments that may have disbursements
scheduled after 2018 Consequently this metric needs
to be interpreted with caution Disbursement efficiencies
are further explored in Section 5 of this report
CHAPTER 3 TRENDS IN DEVELOPMENT FINANCE FOR ENERGY
FIGURE 6Treemap of volume of energy finance disbursements (in USD billion) to HICs by country 2013ndash2018
Source South Pole 2020 based on OECD CRS data
India9644
Bangladesh5048
Pakistan5323
Kenya2361
Angola1254
Yemen1136
Mozambique 795
Tanzania1355
Nigeria 1066
Ethiopia1116
Uganda719
Sudan 267
Myanmar458
Malawi404
Burkina Faso388
Niger199
Madagascar137
Congo (DR) 936
20ENERGIZING FINANCE MISSING THE MARK 2020
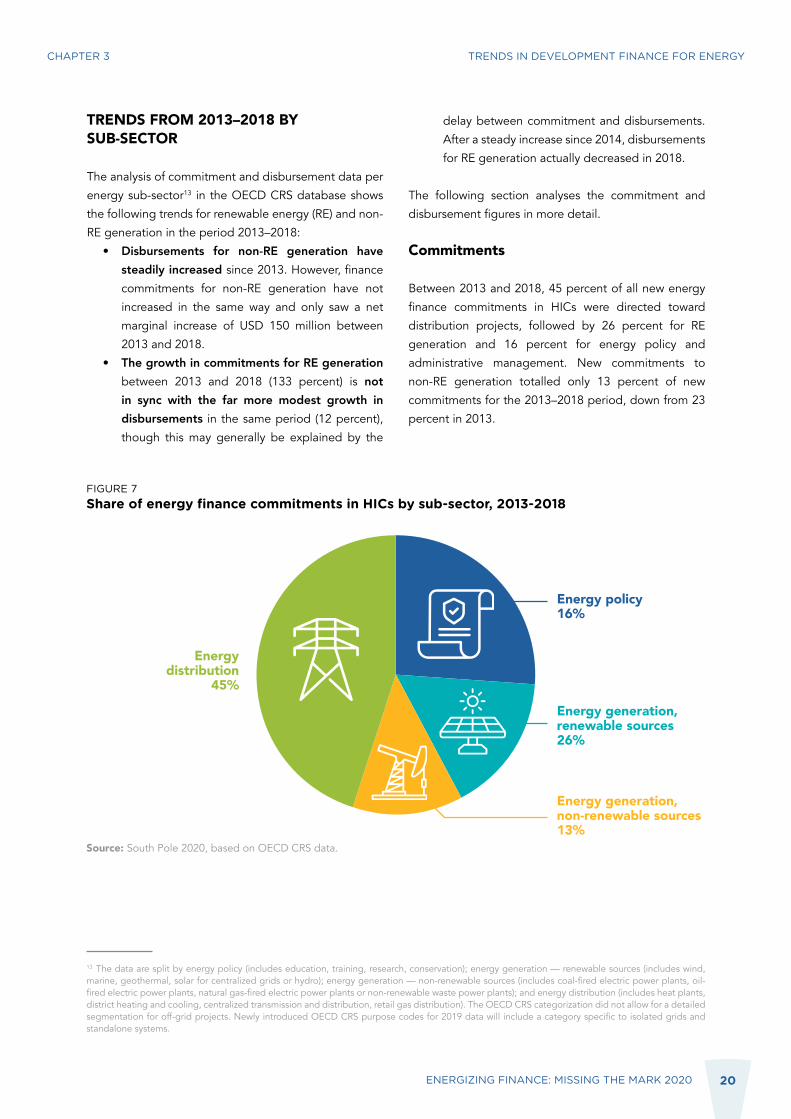
TRENDS FROM 2013ndash2018 BY SUB-SECTOR
The analysis of commitment and disbursement data per
energy sub-sector13 in the OECD CRS database shows
the following trends for renewable energy (RE) and non-
RE generation in the period 2013ndash2018
bull Disbursements for non-RE generation have steadily increased since 2013 However finance
commitments for non-RE generation have not
increased in the same way and only saw a net
marginal increase of USD 150 million between
2013 and 2018
bull The growth in commitments for RE generation between 2013 and 2018 (133 percent) is not in sync with the far more modest growth in disbursements in the same period (12 percent)
though this may generally be explained by the
delay between commitment and disbursements
After a steady increase since 2014 disbursements
for RE generation actually decreased in 2018
The following section analyses the commitment and
disbursement figures in more detail
Commitments
Between 2013 and 2018 45 percent of all new energy
finance commitments in HICs were directed toward
distribution projects followed by 26 percent for RE
generation and 16 percent for energy policy and
administrative management New commitments to
non-RE generation totalled only 13 percent of new
commitments for the 2013ndash2018 period down from 23
percent in 2013
FIGURE 7Share of energy finance commitments in HICs by sub-sector 2013-2018
Source South Pole 2020 based on OECD CRS data
13 The data are split by energy policy (includes education training research conservation) energy generation mdash renewable sources (includes wind marine geothermal solar for centralized grids or hydro) energy generation mdash non-renewable sources (includes coal-fired electric power plants oil-fired electric power plants natural gas-fired electric power plants or non-renewable waste power plants) and energy distribution (includes heat plants district heating and cooling centralized transmission and distribution retail gas distribution) The OECD CRS categorization did not allow for a detailed segmentation for off-grid projects Newly introduced OECD CRS purpose codes for 2019 data will include a category specific to isolated grids and standalone systems
Energydistribution
45
Energy policy16
Energy generationrenewable sources26
Energy generationnon-renewable sources13
CHAPTER 3 TRENDS IN DEVELOPMENT FINANCE FOR ENERGY
21ENERGIZING FINANCE MISSING THE MARK 2020
Disbursements
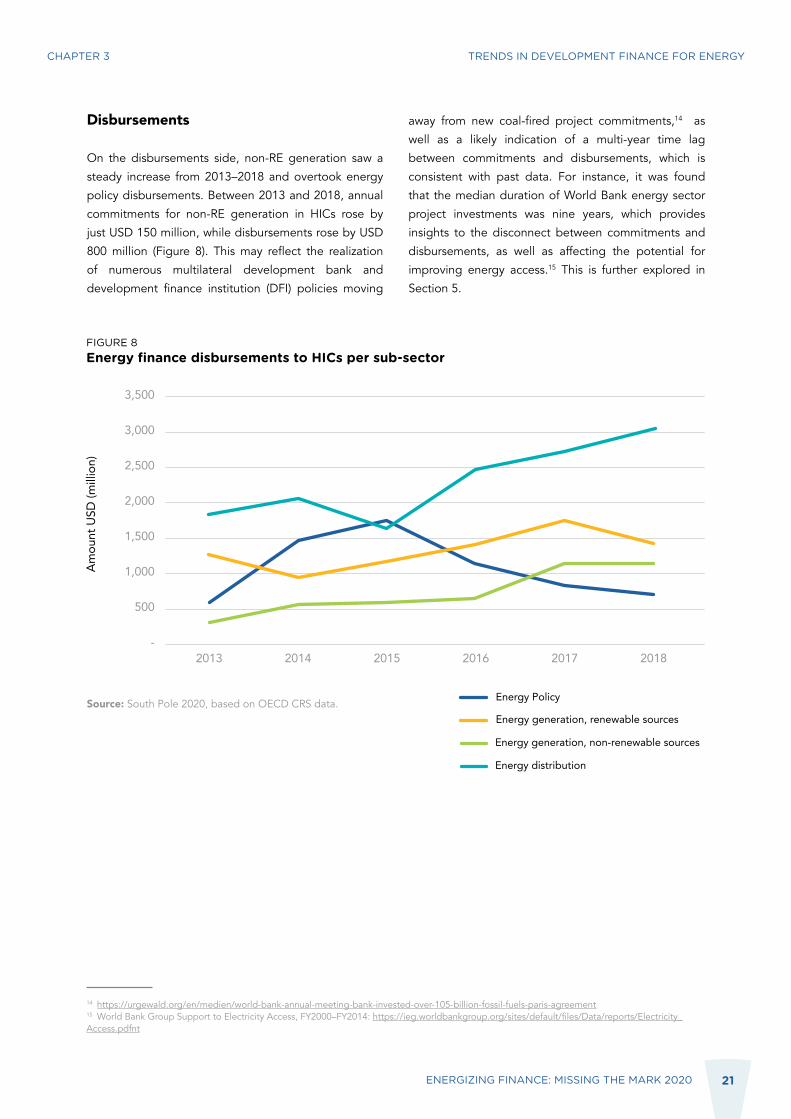
On the disbursements side non-RE generation saw a
steady increase from 2013ndash2018 and overtook energy
policy disbursements Between 2013 and 2018 annual
commitments for non-RE generation in HICs rose by
just USD 150 million while disbursements rose by USD
800 million (Figure 8) This may reflect the realization
of numerous multilateral development bank and
development finance institution (DFI) policies moving
away from new coal-fired project commitments14 as
well as a likely indication of a multi-year time lag
between commitments and disbursements which is
consistent with past data For instance it was found
that the median duration of World Bank energy sector
project investments was nine years which provides
insights to the disconnect between commitments and
disbursements as well as affecting the potential for
improving energy access15 This is further explored in
Section 5
14 httpsurgewaldorgenmedienworld-bank-annual-meeting-bank-invested-over-105-billion-fossil-fuels-paris-agreement15 World Bank Group Support to Electricity Access FY2000ndashFY2014 httpsiegworldbankgrouporgsitesdefaultfilesDatareportsElectricity_Accesspdfnt
FIGURE 8Energy finance disbursements to HICs per sub-sector
Energy Policy
Energy generation non-renewable sources
Energy generation renewable sources
Energy distribution
Amou
nt U
SD (m
illio
n)
3500
3000
2500
2000
1500
1000
500
-2013 2014 2015 2016 2017 2018
Source South Pole 2020 based on OECD CRS data
CHAPTER 3 TRENDS IN DEVELOPMENT FINANCE FOR ENERGY
22ENERGIZING FINANCE MISSING THE MARK 2020
TRENDS FROM 2013ndash2018 BY DONOR
International institutions and multilateral development
organizations account for a greater share of development
finance commitments for the energy sector than nation
states Six of the ten highest contributing funders to
energy projects in HICs between 2013 and 2018 were
multilateral development banks and international
finance institutions including members of the World
Bank Group The top contributing funders to HICs
included the Asian Development Bank (ADB) (20
percent) and the World Bank Group members
International Development Association (IDA) (18
percent) International Finance Corporation (IFC)
and the International Bank for Reconstruction and
Development (IBRD) (both 6 percent) Among nation
states the top donors included Japan (13 percent)
Germany (8 percent) and France (4 percent)
In terms of disbursements the ADB was also top of
the list accounting for 21 percent (USD 68 billion) of
disbursements between 2013 and 2018 This is likely
due to the high share of finance flowing into three Asian
HICs Bangladesh India and Pakistan as mentioned in
the previous section The IDA was the second highest
funder (USD 58 billion) in terms of disbursements
between 2013 and 2018 It has vastly increased its
share of commitments to HICs since 2016 more than
doubling its contribution share from 2017 (15 percent)
to 2018 (31 percent)
While major disbursement trends could not be identified
due to the high annual variability of data this report
notes the following observations The United Arab
Emirates disbursed only USD 2 million in 2013 and 2014
combined but disbursed as much as USD 187 million in
2015 and was the 11th largest donor in terms of total
disbursements between 2013 to 2018 Within the top
10 the biggest consistent increases in disbursements
between 2013 and 2018 came from Japan and France
CHAPTER 3 TRENDS IN DEVELOPMENT FINANCE FOR ENERGY
4CHAPTER
TRENDS IN DEVELOPMENT FINANCE
FOR CLEAN COOKING
23
Phot
o by
Cle
an C
ooki
ng A
llian
ce
24ENERGIZING FINANCE MISSING THE MARK 2020
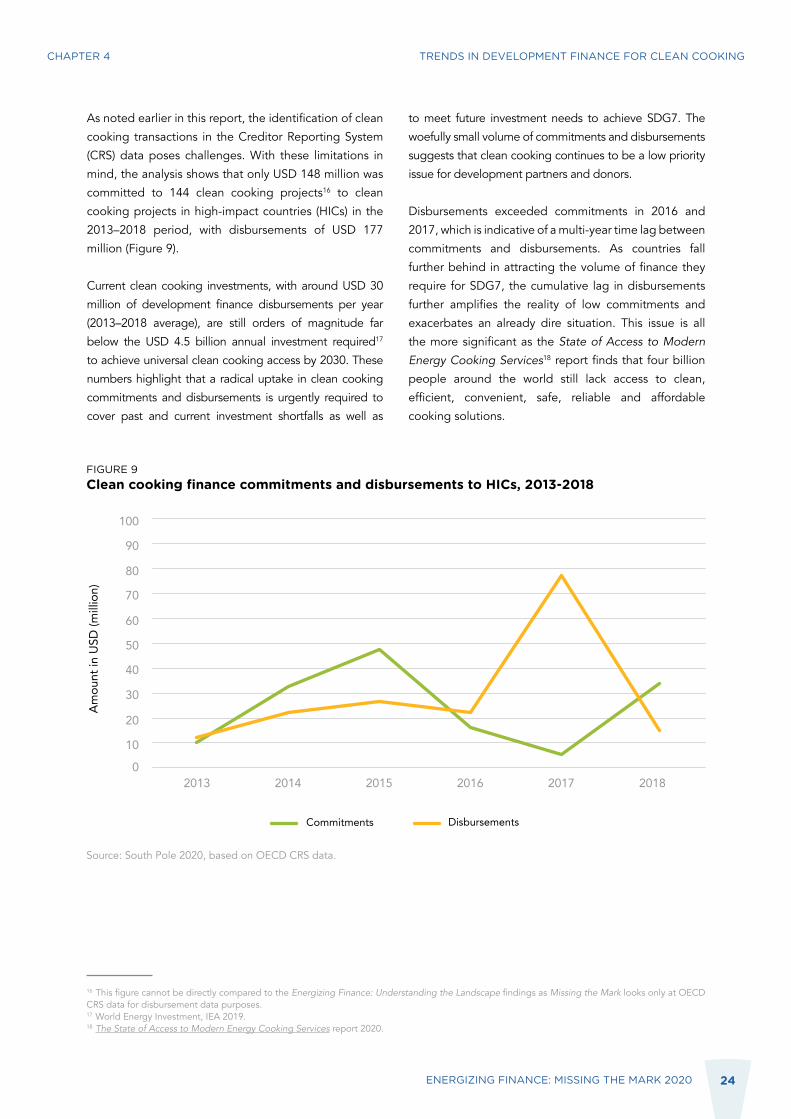
As noted earlier in this report the identification of clean
cooking transactions in the Creditor Reporting System
(CRS) data poses challenges With these limitations in
mind the analysis shows that only USD 148 million was
committed to 144 clean cooking projects16 to clean
cooking projects in high-impact countries (HICs) in the
2013ndash2018 period with disbursements of USD 177
million (Figure 9)
Current clean cooking investments with around USD 30
million of development finance disbursements per year
(2013ndash2018 average) are still orders of magnitude far
below the USD 45 billion annual investment required17
to achieve universal clean cooking access by 2030 These
numbers highlight that a radical uptake in clean cooking
commitments and disbursements is urgently required to
cover past and current investment shortfalls as well as
to meet future investment needs to achieve SDG7 The
woefully small volume of commitments and disbursements
suggests that clean cooking continues to be a low priority
issue for development partners and donors
Disbursements exceeded commitments in 2016 and
2017 which is indicative of a multi-year time lag between
commitments and disbursements As countries fall
further behind in attracting the volume of finance they
require for SDG7 the cumulative lag in disbursements
further amplifies the reality of low commitments and
exacerbates an already dire situation This issue is all
the more significant as the State of Access to Modern
Energy Cooking Services18 report finds that four billion
people around the world still lack access to clean
efficient convenient safe reliable and affordable
cooking solutions
CHAPTER 4 TRENDS IN DEVELOPMENT FINANCE FOR CLEAN COOKING
FIGURE 9Clean cooking finance commitments and disbursements to HICs 2013-2018
Amou
nt in
USD
(mill
ion)
60
70
80
90
100
50
40
30
20
10
02013 2014 2015 2016 2017 2018
Commitments Disbursements
16 This figure cannot be directly compared to the Energizing Finance Understanding the Landscape findings as Missing the Mark looks only at OECD CRS data for disbursement data purposes 17 World Energy Investment IEA 201918 The State of Access to Modern Energy Cooking Services report 2020
Source South Pole 2020 based on OECD CRS data
25ENERGIZING FINANCE MISSING THE MARK 2020
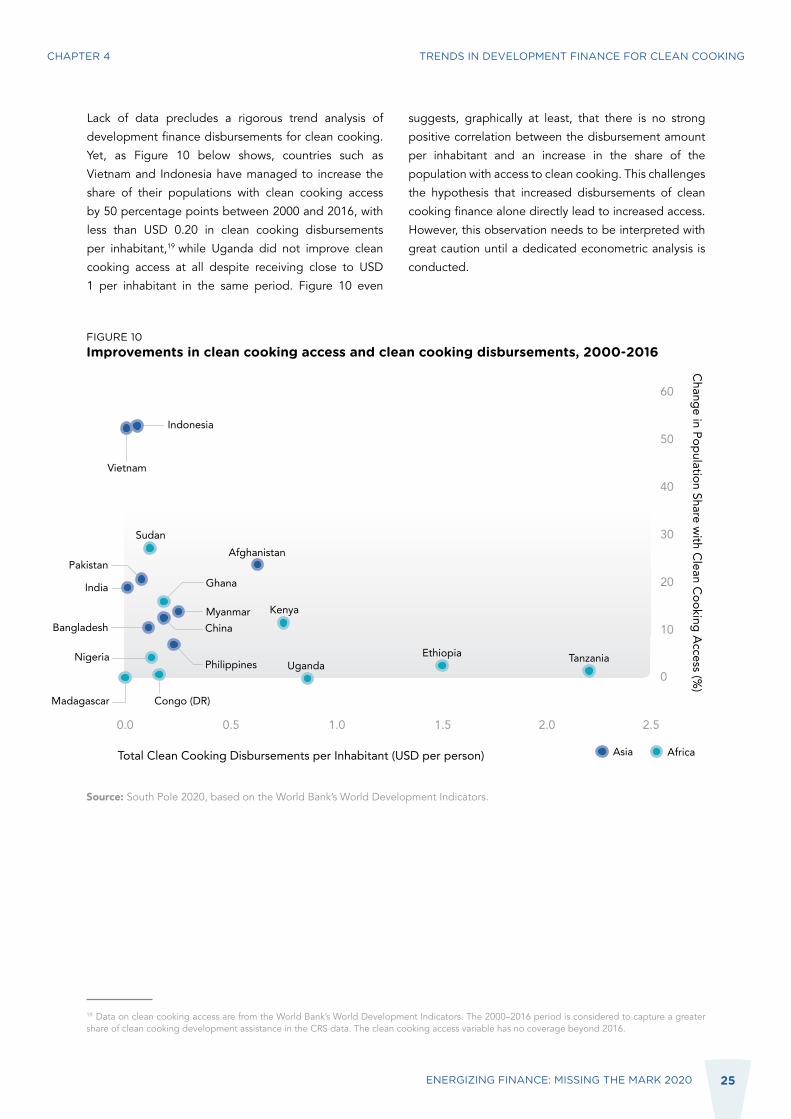
Lack of data precludes a rigorous trend analysis of
development finance disbursements for clean cooking
Yet as Figure 10 below shows countries such as
Vietnam and Indonesia have managed to increase the
share of their populations with clean cooking access
by 50 percentage points between 2000 and 2016 with
less than USD 020 in clean cooking disbursements
per inhabitant19 while Uganda did not improve clean
cooking access at all despite receiving close to USD
1 per inhabitant in the same period Figure 10 even
suggests graphically at least that there is no strong
positive correlation between the disbursement amount
per inhabitant and an increase in the share of the
population with access to clean cooking This challenges
the hypothesis that increased disbursements of clean
cooking finance alone directly lead to increased access
However this observation needs to be interpreted with
great caution until a dedicated econometric analysis is
conducted
CHAPTER 4
19 Data on clean cooking access are from the World Bankrsquos World Development Indicators The 2000ndash2016 period is considered to capture a greater share of clean cooking development assistance in the CRS data The clean cooking access variable has no coverage beyond 2016
TRENDS IN DEVELOPMENT FINANCE FOR CLEAN COOKING
Source South Pole 2020 based on the World Bankrsquos World Development Indicators
FIGURE 10Improvements in clean cooking access and clean cooking disbursements 2000-2016
Total Clean Cooking Disbursements per Inhabitant (USD per person)
00 05 10 15 20 25
Change in Population Share with Clean Cooking Access (
)0
10
20
30
40
50
60
Indonesia
Vietnam
Sudan
India
PakistanGhana
MyanmarChinaBangladesh
PhilippinesNigeria
Congo (DR)Madagascar
Kenya
UgandaEthiopia Tanzania
Afghanistan
5CHAPTER
DISBURSEMENT EFFICIENCY
26
27ENERGIZING FINANCE MISSING THE MARK 2020
CHAPTER 5 DISBURSEMENT EFFICIENCY
METHODOLOGY
Development interventions in the energy sector have
historically been large and are typically scheduled
over multiple years after an initial commitment As a
result project-level data are required to assess the
extent to which disbursements are made on time after
funds are initially committed and payments scheduled
To that end transactions from the OECD Creditor
Reporting System (CRS) database were grouped into
projects using a matching algorithm The algorithm
was designed to group transactions into projects in a
multi-step process that included donor name project
title and CRS transaction ID This yielded a high-quality
initial grouping (see Annex I for a full presentation of
the methodology) The database was then transformed
from a series of transactions to project-level information
to perform the disbursement constraints analysis
DATA
Over 19000 energy transactions from the CRS database
were assessed for high-impact countries (HICs) in the
2002ndash2018 period Through the matching algorithm
these transactions were grouped into 6700 projects
with USD 92 billion in commitments Around 2500
projects (37 percent of the total) with USD 65 billion
in commitments (71 percent of the total) had sufficient
information20 to be meaningfully analysed in terms of
disbursement efficiency
As a result some donor countries institutions
recipients and transaction types are under-represented
in the analysis The analysis found that 20 percent of the
commitments that were without sufficient information
and were therefore excluded from the analysis came
from the Asian Development Bank (ADB) followed by
the International Development Association (IDA) (19
percent) and Japan (13 percent) (see Table 5 Annex I)
Some donors also systematically reported transactions
to the CRS database in a way that made them
unsuitable for a disbursement constraints analysis This
is the case for instance with the International Finance
Corporation (IFC) and the ADB where 100 percent of
their commitments had insufficient information to be
meaningfully analysed for disbursement efficiency As
a result some donors are not represented at all which
affects the completeness of the analysis Finally around
half of the commitments excluded are loans while just
over a third are Other Official Flows (OOF) and the rest
are grants (see Table 7 Annex I) Some country-level
results cannot be interpreted due to data limitations
In Angola Korea (DPR) and Sudan for example over
90 percent of energy sector development finance
commitments lack sufficient data to be analysed so
the results mdash which are based on the remaining 10
percent of commitments that can be analysed mdash are not
meaningful See Table 5 Annex I for more details
As a recommendation future analyses of the OECD CRS
data would benefit from more complete and consistent
transaction-level information for key variables21 to
allow for a higher-quality grouping of transactions into
projects and to minimize the exclusion of projects from
project-level analyses Incomplete data hampered the
assessment of disbursement efficiencies and affected
the pertinence of observations and recommendations
Further the CRS data would benefit from recording
transaction data on a quarterly or monthly basis (rather
than yearly) to improve the accuracy of the disbursement
efficiency assessment
Bangladesh India and Pakistan received the most
development finance that could not be considered in the
analysis due to missing data with 28 percent 21 percent
and 21 percent respectively of the commitments to those
countries excluded and 62 percent 65 percent and 62
percent respectively of projects excluded Together
Bangladesh India and Pakistan account for over half of
the development finance that does not contain enough
information to be subjected to the disbursements
constraints analysis (see Table 6 Annex I)
20 Over 90 percent of projects that were excluded are missing either an expected start date an expected end date or both21 These include but are not limited to project number CRS ID project title project purpose and flow type
28ENERGIZING FINANCE MISSING THE MARK 2020
INDICATORS
To assess disbursement delays two indicators were
constructed as in the 2017 edition of Energizing
Finance Missing the Mark
The first indicator is a binary variable that identifies projects that are delayed This variable simply records
whether a project is delayed and does not capture the
severity of the delay
The indicator identifies projects as late if any one of the
following three conditions is met
The projectrsquos last disbursement occurs after the
expected project end date
The projectrsquos last disbursement22 takes place
during the expected end year but cumulative
disbursements are less than 95 percent of
commitments
The projectrsquos last disbursement takes place
before the expected end year but the difference
between the percentage of time passed and
cumulative disbursements as a percentage of
project commitments is greater than 10 percent
For example if 50 percent of a project timeline
has elapsed but only 30 percent of commitments
have been disbursed the project is considered
late because the difference (20 percent) is larger
than the 10 percent threshold
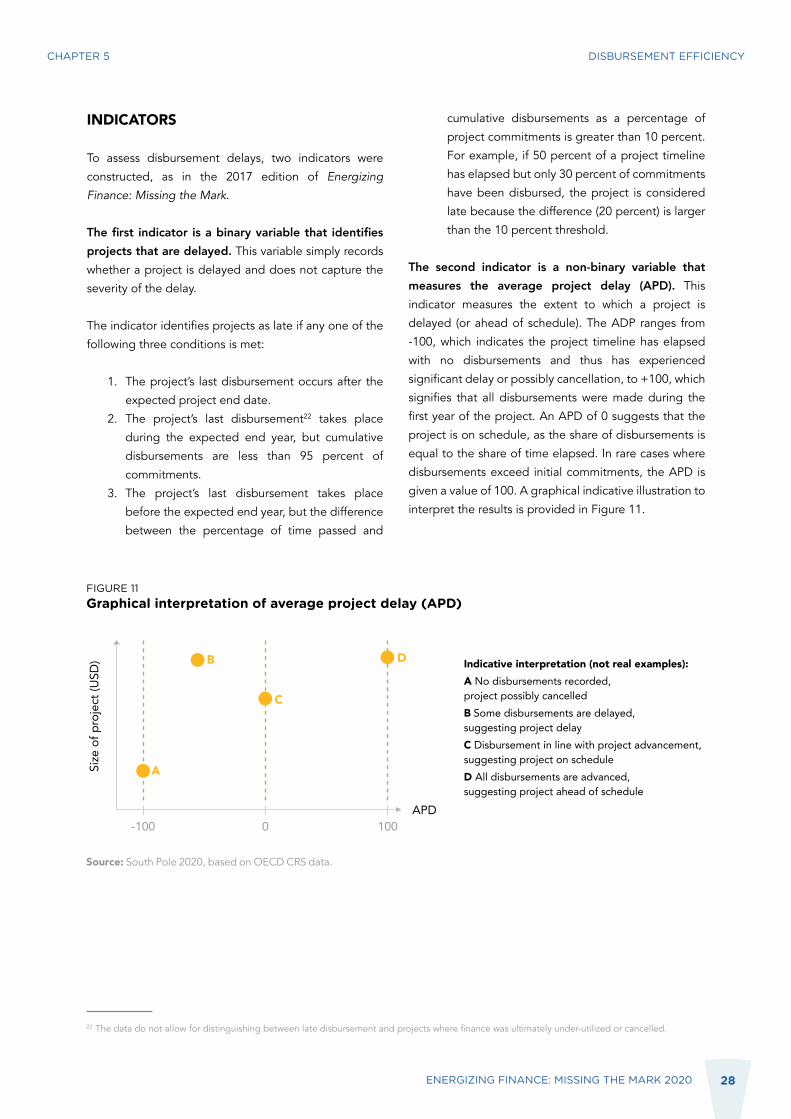
The second indicator is a non-binary variable that measures the average project delay (APD) This
indicator measures the extent to which a project is
delayed (or ahead of schedule) The ADP ranges from
-100 which indicates the project timeline has elapsed
with no disbursements and thus has experienced
significant delay or possibly cancellation to +100 which
signifies that all disbursements were made during the
first year of the project An APD of 0 suggests that the
project is on schedule as the share of disbursements is
equal to the share of time elapsed In rare cases where
disbursements exceed initial commitments the APD is
given a value of 100 A graphical indicative illustration to
interpret the results is provided in Figure 11
1
2
3
FIGURE 11Graphical interpretation of average project delay (APD)
Indicative interpretation (not real examples)A No disbursements recorded project possibly cancelledB Some disbursements are delayed suggesting project delayC Disbursement in line with project advancement suggesting project on scheduleD All disbursements are advanced suggesting project ahead of schedule
22 The data do not allow for distinguishing between late disbursement and projects where finance was ultimately under-utilized or cancelled
Source South Pole 2020 based on OECD CRS data
CHAPTER 5 DISBURSEMENT EFFICIENCY
Size
of p
roje
ct (U
SD)
APD
A
B
C
D
-100 0 100
29ENERGIZING FINANCE MISSING THE MARK 2020
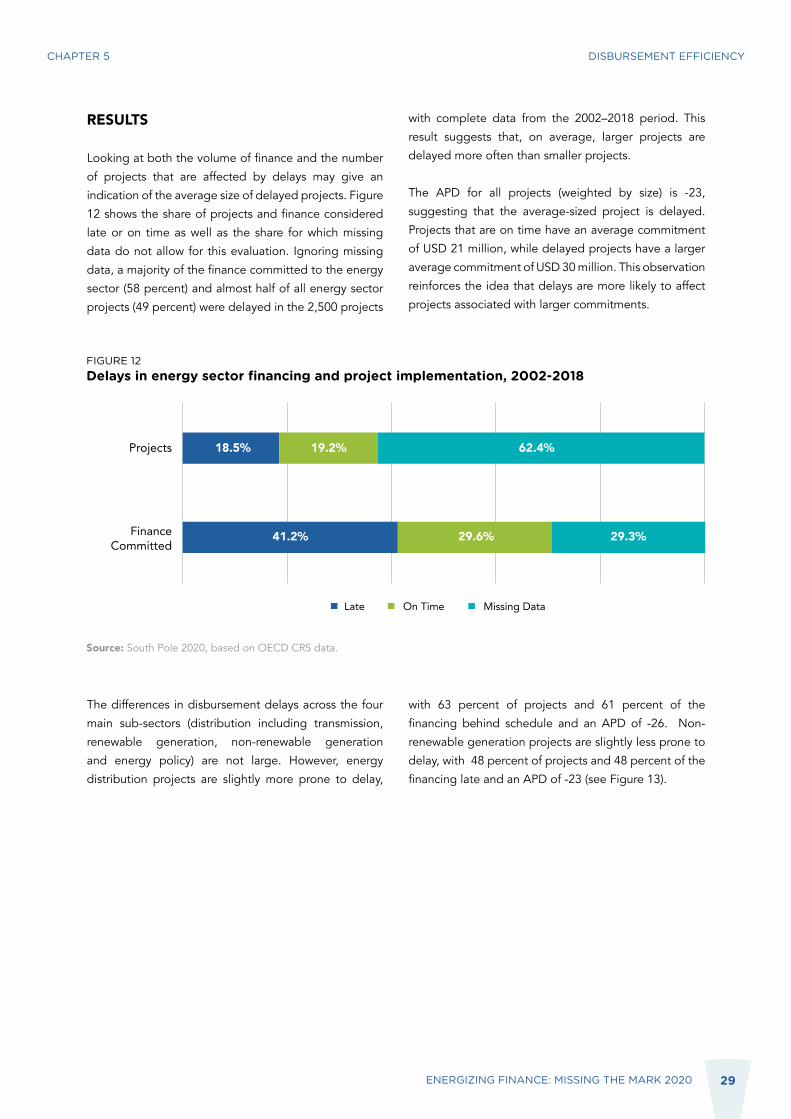
RESULTS
Looking at both the volume of finance and the number
of projects that are affected by delays may give an
indication of the average size of delayed projects Figure
12 shows the share of projects and finance considered
late or on time as well as the share for which missing
data do not allow for this evaluation Ignoring missing
data a majority of the finance committed to the energy
sector (58 percent) and almost half of all energy sector
projects (49 percent) were delayed in the 2500 projects
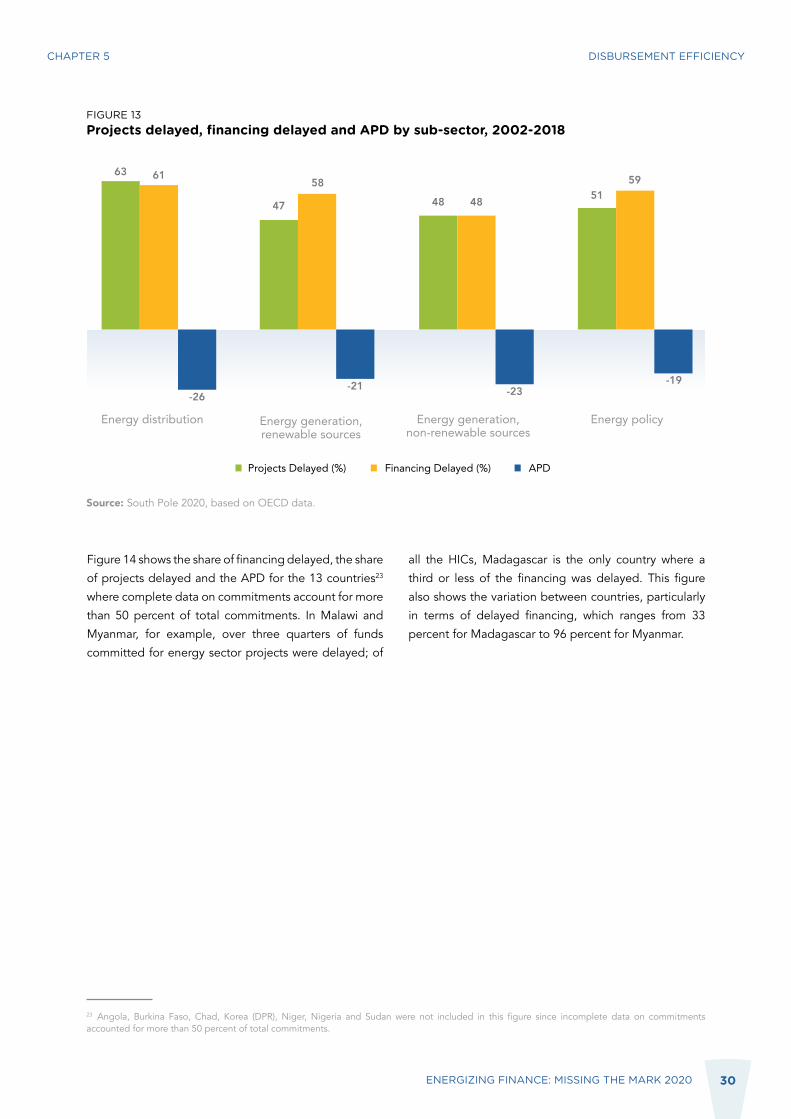
The differences in disbursement delays across the four
main sub-sectors (distribution including transmission
renewable generation non-renewable generation
and energy policy) are not large However energy
distribution projects are slightly more prone to delay
with complete data from the 2002ndash2018 period This
result suggests that on average larger projects are
delayed more often than smaller projects
The APD for all projects (weighted by size) is -23
suggesting that the average-sized project is delayed
Projects that are on time have an average commitment
of USD 21 million while delayed projects have a larger
average commitment of USD 30 million This observation
reinforces the idea that delays are more likely to affect
projects associated with larger commitments
with 63 percent of projects and 61 percent of the
financing behind schedule and an APD of -26 Non-
renewable generation projects are slightly less prone to
delay with 48 percent of projects and 48 percent of the
financing late and an APD of -23 (see Figure 13)
FIGURE 12Delays in energy sector financing and project implementation 2002-2018
Late On Time Missing Data
Projects
Finance Committed
185
412 296 293
192 624
Source South Pole 2020 based on OECD CRS data
CHAPTER 5 DISBURSEMENT EFFICIENCY
30ENERGIZING FINANCE MISSING THE MARK 2020
FIGURE 13Projects delayed financing delayed and APD by sub-sector 2002-2018
Energy distribution Energy policyEnergy generationrenewable sources
Energy generationnon-renewable sources
Projects Delayed () Financing Delayed () APD
63
47
58
48 48 515961
-26-21 -23
-19
Source South Pole 2020 based on OECD data
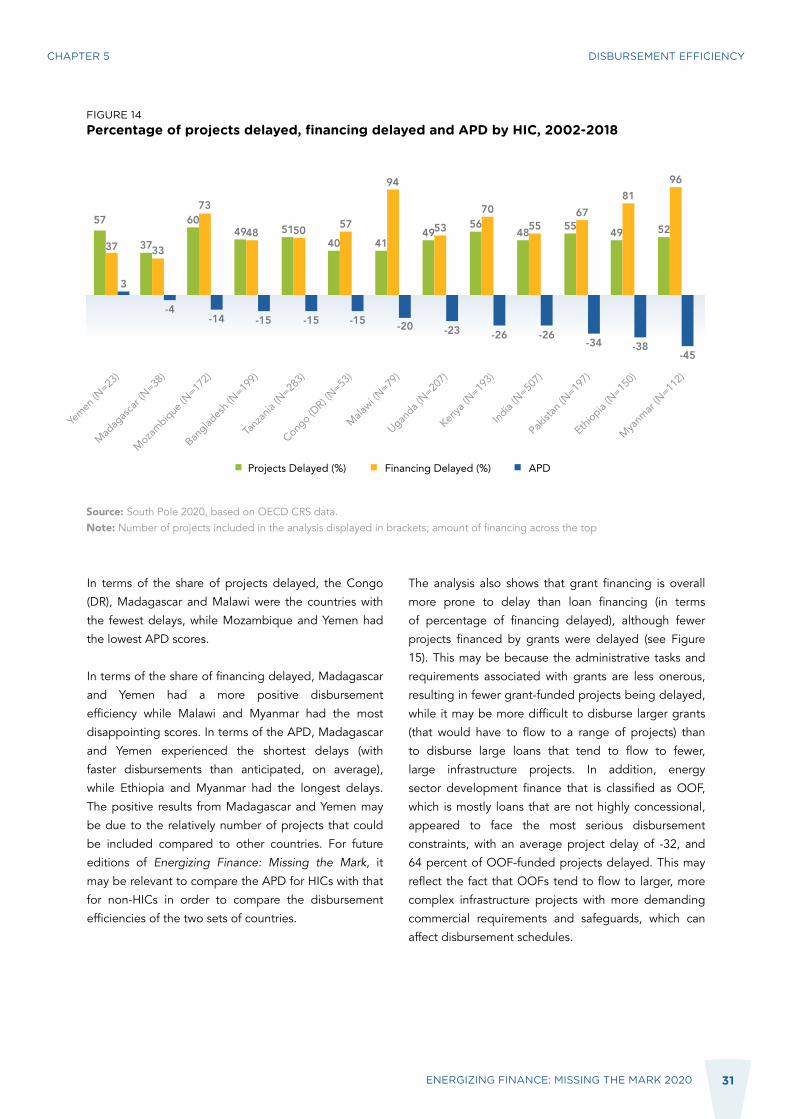
Figure 14 shows the share of financing delayed the share
of projects delayed and the APD for the 13 countries23
where complete data on commitments account for more
than 50 percent of total commitments In Malawi and
Myanmar for example over three quarters of funds
committed for energy sector projects were delayed of
all the HICs Madagascar is the only country where a
third or less of the financing was delayed This figure
also shows the variation between countries particularly
in terms of delayed financing which ranges from 33
percent for Madagascar to 96 percent for Myanmar
23 Angola Burkina Faso Chad Korea (DPR) Niger Nigeria and Sudan were not included in this figure since incomplete data on commitments accounted for more than 50 percent of total commitments
CHAPTER 5 DISBURSEMENT EFFICIENCY
31ENERGIZING FINANCE MISSING THE MARK 2020
FIGURE 14Percentage of projects delayed financing delayed and APD by HIC 2002-2018
Source South Pole 2020 based on OECD CRS dataNote Number of projects included in the analysis displayed in brackets amount of financing across the top
Projects Delayed () Financing Delayed () APD
57
37 37
6073
4948 515040 41
57
94
4953 5670
4855 5567
49
81
52
96
33
-4-14 -15 -15 -15 -20 -23 -26 -26
-34 -38-45
3
Yemen
(N=23
)
Madag
ascar
(N=38
)
Mozambique
(N=17
2)
Banglad
esh (N
=199)
Tanzan
ia (N
=283)
Congo (D
R) (N=53
)
Malawi (N
=79)
Uganda (
N=207)
Kenya
(N=19
3)
India
(N=50
7)
Pakist
an (N
=197)
Ethiopia
(N=15
0)
Myanmar
(N=11
2)
In terms of the share of projects delayed the Congo
(DR) Madagascar and Malawi were the countries with
the fewest delays while Mozambique and Yemen had
the lowest APD scores
In terms of the share of financing delayed Madagascar
and Yemen had a more positive disbursement
efficiency while Malawi and Myanmar had the most
disappointing scores In terms of the APD Madagascar
and Yemen experienced the shortest delays (with
faster disbursements than anticipated on average)
while Ethiopia and Myanmar had the longest delays
The positive results from Madagascar and Yemen may
be due to the relatively number of projects that could
be included compared to other countries For future
editions of Energizing Finance Missing the Mark it
may be relevant to compare the APD for HICs with that
for non-HICs in order to compare the disbursement
efficiencies of the two sets of countries
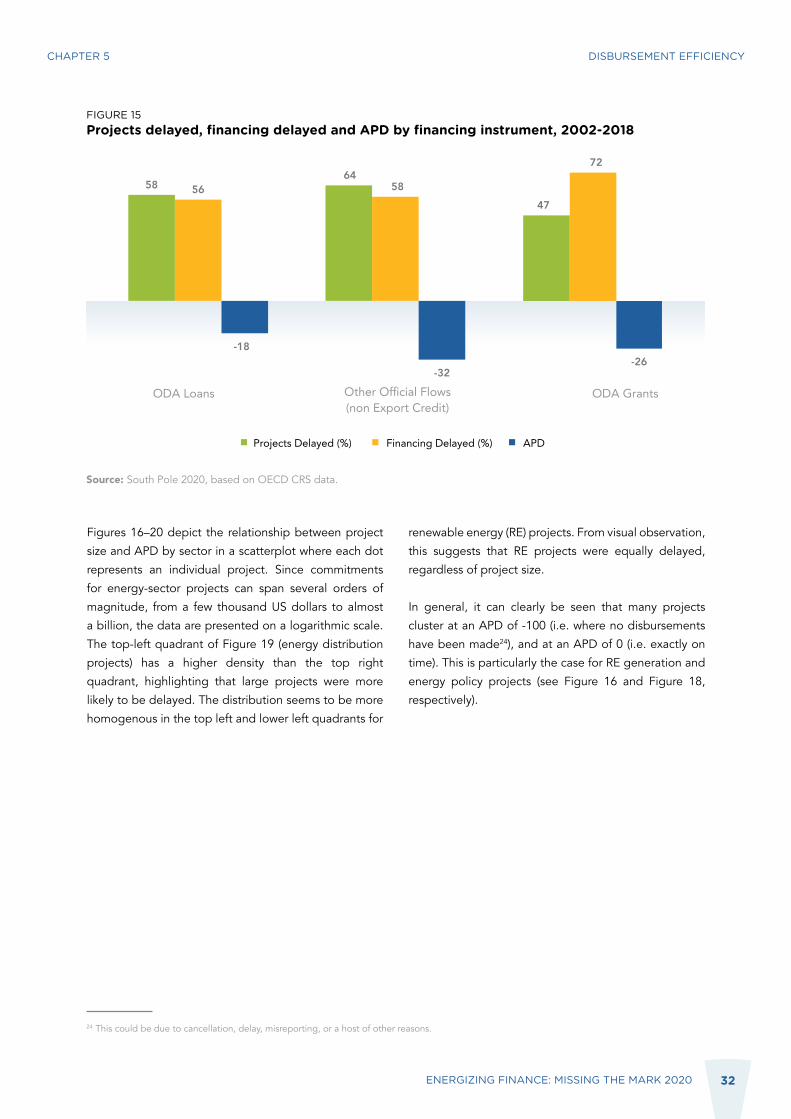
The analysis also shows that grant financing is overall
more prone to delay than loan financing (in terms
of percentage of financing delayed) although fewer
projects financed by grants were delayed (see Figure
15) This may be because the administrative tasks and
requirements associated with grants are less onerous
resulting in fewer grant-funded projects being delayed
while it may be more difficult to disburse larger grants
(that would have to flow to a range of projects) than
to disburse large loans that tend to flow to fewer
large infrastructure projects In addition energy
sector development finance that is classified as OOF
which is mostly loans that are not highly concessional
appeared to face the most serious disbursement
constraints with an average project delay of -32 and
64 percent of OOF-funded projects delayed This may
reflect the fact that OOFs tend to flow to larger more
complex infrastructure projects with more demanding
commercial requirements and safeguards which can
affect disbursement schedules
CHAPTER 5 DISBURSEMENT EFFICIENCY
32ENERGIZING FINANCE MISSING THE MARK 2020
FIGURE 15Projects delayed financing delayed and APD by financing instrument 2002-2018
ODA Loans Other Official Flows(non Export Credit)
ODA Grants
Projects Delayed () Financing Delayed () APD
58 56
-18
-32-26
6458
47
72
Source South Pole 2020 based on OECD CRS data
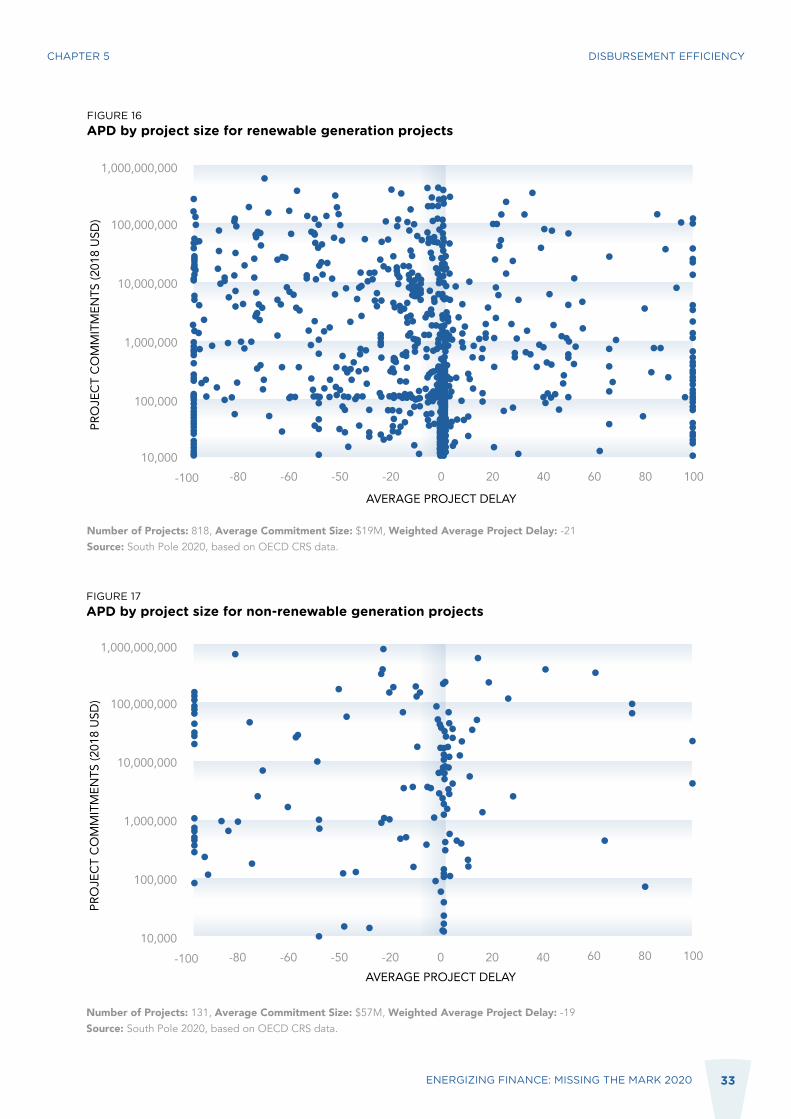
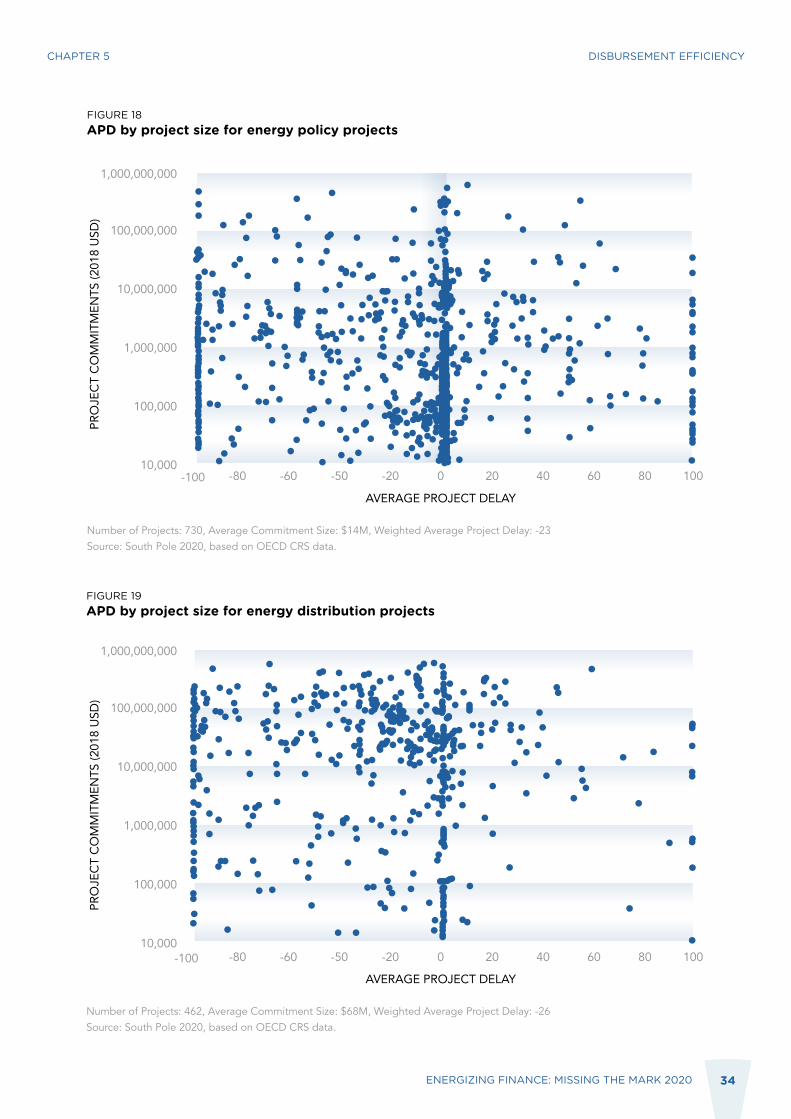
Figures 16ndash20 depict the relationship between project
size and APD by sector in a scatterplot where each dot
represents an individual project Since commitments
for energy-sector projects can span several orders of
magnitude from a few thousand US dollars to almost
a billion the data are presented on a logarithmic scale
The top-left quadrant of Figure 19 (energy distribution
projects) has a higher density than the top right
quadrant highlighting that large projects were more
likely to be delayed The distribution seems to be more
homogenous in the top left and lower left quadrants for
renewable energy (RE) projects From visual observation
this suggests that RE projects were equally delayed
regardless of project size
In general it can clearly be seen that many projects
cluster at an APD of -100 (ie where no disbursements
have been made24) and at an APD of 0 (ie exactly on
time) This is particularly the case for RE generation and
energy policy projects (see Figure 16 and Figure 18
respectively)
24 This could be due to cancellation delay misreporting or a host of other reasons
CHAPTER 5 DISBURSEMENT EFFICIENCY
33ENERGIZING FINANCE MISSING THE MARK 2020
FIGURE 16APD by project size for renewable generation projects
Number of Projects 818 Average Commitment Size $19M Weighted Average Project Delay -21Source South Pole 2020 based on OECD CRS data
FIGURE 17APD by project size for non-renewable generation projects
Number of Projects 131 Average Commitment Size $57M Weighted Average Project Delay -19Source South Pole 2020 based on OECD CRS data
PRO
JECT
CO
MM
ITM
ENTS
(201
8 US
D)
AVERAGE PROJECT DELAY
10000
100000
1000000
10000000
100000000
1000000000
-100 100-80 80-60 60-50 40-20 200
PRO
JECT
CO
MM
ITM
ENTS
(201
8 US
D)
AVERAGE PROJECT DELAY
10000
100000
1000000
10000000
100000000
1000000000
-100 100-80 80-60 60-50 40-20 200
CHAPTER 5 DISBURSEMENT EFFICIENCY
34ENERGIZING FINANCE MISSING THE MARK 2020
FIGURE 18APD by project size for energy policy projects
FIGURE 19APD by project size for energy distribution projects
Number of Projects 730 Average Commitment Size $14M Weighted Average Project Delay -23Source South Pole 2020 based on OECD CRS data
Number of Projects 462 Average Commitment Size $68M Weighted Average Project Delay -26Source South Pole 2020 based on OECD CRS data
PRO
JECT
CO
MM
ITM
ENTS
(201
8 US
D)
AVERAGE PROJECT DELAY
10000
100000
1000000
10000000
100000000
1000000000
-100 100-80 80-60 60-50 40-20 200
PRO
JECT
CO
MM
ITM
ENTS
(201
8 US
D)
AVERAGE PROJECT DELAY
10000
100000
1000000
10000000
100000000
1000000000
-100 100-80 80-60 60-50 40-20 200
CHAPTER 5 DISBURSEMENT EFFICIENCY
6CHAPTER
ANALYSIS OF DISBURSEMENT
CONSTRAINTS AND SOLUTIONS
35
36ENERGIZING FINANCE MISSING THE MARK 2020
CHAPTER 6 ANALYSIS OF DISBURSEMENT CONSTRAINTS AND SOLUTIONS
This section presents findings from both an additional
quantitative assessment and a qualitative review to shed
light on disbursement constraints These findings were
gathered through evaluation reports and responses to
surveys sent to donors private sector stakeholders and
institutions operating in the energy ecosystem
Section 61 provides a quantitative analysis of the
relationship between development finance for the
energy sector and regulatory indicators From Section
62 onward the analysis studies energy access projects
specifically rather than the energy sector in general this
is rendered possible through the analysis of evaluation
reports and primary data obtained through surveys and
interviews with stakeholders Section 62 provides insights
from project reports Section 63 highlights findings from
surveys and interviews and draws recommendations for
improving disbursement efficiency and Section 64 offers
conclusions to this analysis
QUANTITATIVE ANALYSIS OF THE CONNECTION TO REGULATORY INDICATORS FOR SUSTAINABLE ENERGY
To seek a clearer understanding of the extent to which
disbursement efficiency may relate to the quality of
a countryrsquos energy sector policies and regulations
the report looked to the World Bankrsquos Regulatory
Indicators for Sustainable Energy (RISE) RISE scores
assess countries on the quality of their electricity access
energy efficiency and renewable energy (RE) policies25
and are constructed as the average of several sub-
indices The energy index for example depends on the
existence and monitoring of an official electrification
plan the scope of such a plan and the framework for
grid electrification among other sub-indicators
The objective of this analysis is to test the strength of the
correlation between RISE scores and disbursement rates
and therefore whether disbursements may be linked to
an improvement in the quality of energy sector policies
or regulations The data show that while there have
been significant and steady improvements in the quality
of the policies and regulations measured by RISE the
same steady improvement pattern has not generally
followed for disbursements
While there is no statistically significant correlation between overall development finance disbursements for energy and the RISE scores for Electricity Access and Energy Efficiency there is a statistically significant relation with the RISE RE indicator even if the practical significance of the coefficient is small On average in
high-impact countries (HICs) every additional point in
the RISE score for RE is associated with an additional
USD 005 per capita additional development finance
disbursed for the energy sector The results imply that the
changes in regulations and policies measured by RISE do
not appear to have a material short-term relationship with
energy sector development finance disbursements in
HICs This result does not rule out a medium- or long-term
impact from regulatory improvements on energy sector
disbursements and may also differ when only analysing
specific technologies It also does not rule out a positive
impact on overall finance commitments including private
finance as has been observed in Rwanda which is the
subject of a more detailed review in Energizing Finance
Understanding the Landscape 2020
For more details on methodology and results see
Annex II
25 This analysis of RISE does not include the indicatorsresults on clean cooking
37ENERGIZING FINANCE MISSING THE MARK 2020
REVIEW OF EVALUATION REPORTS
To obtain additional country-specific insights on the
reasons behind disbursement delays and to test these
against trends found in the quantitative analysis 36
reports from the deep-dive countries26 were reviewed
This review included project evaluation reports single
and multi-country market assessment reports and
papers on development finance effectiveness to gain
a better understanding of individual country contexts
About two thirds of the reports analysed pertained to
energy access while one third focused on clean cooking
The main points extracted from the reports relate to
disbursement challenges and the context encountered
in specific countries as well as solutions implemented
successfully or not to overcome project disbursement
constraints More details are provided in Annex III
It is essential that best practices are adopted when
designing and implementing energy access projects to
ensure and maintain efficient and timely disbursement
processes Recommendations developed in this section
notably align with the four dimensions (prioritization
ownership transparency learning) of the Quality of
Official Development Assistance tool27 an important
instrument developed by the Center for Global
Development and the Brookings Institution that
supports donors to improve the quality of their own aid
Several types of barriers hinder disbursement in energy
access projects the following subsections provide
more detail
Poor institutional and coordination structures and constrained public sector capacity
Insufficient staff capacity and a lack of coordination among stakeholders (funders government private sector andor civil society implementing partners) combined with inadequate institutional structures and administrative requirements can threaten the timely disbursement of finance for energy projectsThe main barriers to efficient disbursement of finance
for electricity and clean cooking access as identified
through the desk review and survey responses are
primarily administrative in nature insufficient human
resources such as understaffing or limited number of
experts in project management units (PMUs) and time-
intensive processes These two factors are linked as
insufficient human resources exacerbate the barrier of
time-intensive processes due to limited organizational
capacity to cope with complex bureaucratic procedures
(eg due diligence compliance with procurement
processes and reporting requirements)
To overcome these challenges some suggestions
include streamlining staff recruitment processes and
shifting implementation responsibilities to entities
with more knowledge of the local context (ie country
offices) or technical capacity as they may be better
positioned to provide direct support Increased human
capacity can pave the way for other proposed solutions
namely improving communication and decision-making
strategies and establishing more flexible and tailored
contractual arrangements
An additional disbursement barrier mentioned by
survey respondents is the lack of coordination between
project stakeholders The importance of coordination
is notably supported by key takeaways from the GEF-
UNDP India project (Box 1) where administrative
processes and project implementation delays were cited
as a contributing factor to disbursement delays Limited
coordination among stakeholders and limited support
from national institutions further affected disbursements
a constraint that could be improved by shifting to sub-
national entities with improved stakeholder interactions
Conversely the evaluation report on the Madagascar
Energy Sector Reform Support Programme (PARSE)
evidenced the importance of continuous coordination
between the donor and its implementing partners in
contributing to success The programme aimed to remove
the barriers that hinder the development of Madagascarrsquos
electricity sector and showed that a continuous dialogue
with local authorities and development partners was
essential to ensure the programme was aligned with the
governmentrsquos priorities complemented programmes
supported by other donors and created buy-in and
ownership for the programmersquos creditor
26 India Madagascar Myanmar Nigeria and Rwanda27 Center for Global Development (2018) Quality of Official Development Assistance QuODA 2018 Methodology online httpswwwcgdevorgsitesdefaultfilesquoda-methodology-2018pdf
CHAPTER 6 ANALYSIS OF DISBURSEMENT CONSTRAINTS AND SOLUTIONS
38ENERGIZING FINANCE MISSING THE MARK 2020
Additional efforts are urgently needed to build in better
coordination mechanisms among public entities donors
and beneficiaries and reinforce human resources to
fulfill project requirements This could be facilitated by
public entities and ministries playing a role in supporting
project activities for instance by promoting stakeholder
coordination through the organization of meetings or
workshops
Limited access to local finance
Lack of access to matching finance often results in energy end users and small and medium-sized enterprises (SMEs) finding themselves at an impasse when procuring funding which can delay project disbursement
Access to local finance can be a pre-condition for
intended beneficiariesrsquo participation in projects as
they often need loans to purchase electricity or clean
cooking equipment If beneficiaries engaged in energy
access projects have limited access to finance they
are prevented from participating in project activities
resulting in disbursement delays This is especially
important for results-based finance projects where
incentives are set for an entity to deliver predefined
outputs and reward the achievement of these results
upon verification29 With limited access to finance
beneficiaries are not able to provide the expected
outputs and are ineligible to receive incentives linked to
pre-agreed results which delays projectsrsquo disbursement
processes
For example in one project in Rwanda the high upfront
costs of RE equipment not only exposed the need for
strong project design (further discussed in 613) and
marketing strategies (see 614) but also highlighted the
critical importance of local credit opportunities for high
disbursement rates (Box 2)
28 UNDP India (2019) Mid-term Review Market Transformation and Removal of Barriers for Effective Implementation of the State Level Climate Change Action Plans29 Musgrove P (2010) Rewards for good performance or results a short glossary online httpwww rbfhealthorg Washington DC World Bank
This project co-financed by the GEF UNDP and the Government of India aimed to reduce greenhouse
gas (GHG) emissions in the states of Jharkhand and Manipur by removing barriers to the successful
implementation of GHG reduction measures identified in the State-Level Action Plans on Climate Change
The project faced significant delays in its implementation phase especially in kick-starting activities in the
state of Manipur These delays were mainly due to a lack of clearance from the Department of Economic Affairs as well as limited support from national institutions at the federal level Because of this at the time
of the projectrsquos mid-term review (2019) activities in the state of Manipur had not fully started
Disbursement delays were attributed to the delayed start in Manipur late approval in the state of Janipur
and the slow PMU hiring processes
Despite these challenges the project team managed to redefine priorities and carry out their activities by focusing on the state of Jharkhand where progress was faster This was due to the higher number of active partners involved including the state government community and livelihood groups industry
associations research institutes NGOs and private sector entities
Market Transformation and Removal of Barriers for Effective Implementation of the State-Level Climate Change Action Plans 2016ndash2019 (independent review)28
INDIA
BOX 1
CHAPTER 6 ANALYSIS OF DISBURSEMENT CONSTRAINTS AND SOLUTIONS
39ENERGIZING FINANCE MISSING THE MARK 2020
To overcome this challenge it is imperative that a market
assessment is conducted during the project design
phase to identify available financial tools and their
characteristics (eg interest rates terms and collateral
requirements) This includes assessing the type of
household that will be targeted by the project (eg low-
income vulnerable living in remote areas etc) It is also
crucial that technical assistance services are integrated
within the project These services should target end users
(eg awareness campaigns and budget training) SMEs
(eg technical assistance on cash-flow management
business plan creation) and financial institutions
(eg training on risk management digitalization and
development of innovative financial products according
to the financial needs of end users and SMEs) Finally the
role of blended finance should not be underestimated it
can prevent disbursement delays by developing public
financial incentives (eg guarantee schemes) that de-risk
investments for local banks and thus improve access to
local finance Financial institutions are then less reluctant
to offer the required local finance which has the potential
to significantly decrease disbursement delays arising
from financial institutionsrsquo risk aversion Planning for
such financial tools and incentives can also be related to
adequate project design as discussed in the next section
Technical barriers and flaws in project design
Sound initial project design is of the utmost importance for project success and timely disbursements
Flaws in initial project design appear to be a cause of
disbursement delays in both electricity access and clean
cooking projects as inappropriate project design prevents
uptake and threatens timely and complete disbursements
Design deficiencies in electricity projects often relate
to short timeframes overly broad and unclear scopes
of work limited local relevance due to the use of
inappropriate imported donor solutions and lack of
market knowledge For example implementing an
off-grid electricity project in a country where there
are already low tariffs for grid-connected electricity
or generous government subsidies could be risky as
there is little room for competition and end users will
continue to wait for a grid extension instead of investing
in off-grid solutions To address this issue it is essential
for the host country government to have and provide
clear data on electricity access and grid arrival targets
so that project developers and funders can adapt their
project designs accordingly
The total budget allocated for the programme was EUR 106358000 but only 80 percent of this was
disbursed in the period 2008ndash2013 The two components with low disbursement were the biodigester and
pico-photovoltaic (PV) system components
The low uptake of biodigesters was caused by high initial investment costs a long payback period (~nine years) and limited credit opportunities for potential purchasers Only 23 percent of the initial
biodigester installation target was completed
Another disbursement shortfall came from the pico-PV systems component only 50 percent of funds
committed were disbursed and only 8000 of the envisaged 166200 units of the pico-PV system component
were sold The poor performance of the pico-PV sales was attributed to unsatisfactory project design and a poor marketing strategy Modifications in project design and strong promotion by the Government of Rwanda
were unsuccessful in encouraging increased uptake of the systems Similar to the biodigesters the targeted beneficiaries struggled to buy the pico-PV system as they could not afford to do so without access to credit
RWANDA
BOX 2
Promoting Renewable Energy Programme (PREP) 2008ndash2013 (internal review)30
CHAPTER 6 ANALYSIS OF DISBURSEMENT CONSTRAINTS AND SOLUTIONS
30 Ministry of Foreign Affairs the Netherlands (2014) IOB Evaluation Access to Energy in Rwanda Impact evaluation of activities supported by the Dutch Promoting Renewable Energy Programme Retrieved from Government of Netherlands httpswwwgovernmentnldocumentsreports20150428iob-access-to-energy-in-rwanda-impactevaluation-of-activities-supported-by-the-dutch-promoting-renewable-energy-programme
40ENERGIZING FINANCE MISSING THE MARK 2020
suppliers financial institutions etc)
qualified and as far as possible local experts
coordination mechanisms included in the initial
project structure
As mentioned in the previous section a mismatch
between demand and supply of local finance can be a
barrier to timely disbursement To reduce this risk it is
critical that programme and project design account for
the operational realities of the local market and local
financial institutions In fact careful design considerations
also extend to financial arrangements and guarantees
between banks project developers and suppliers In
Nigeria the late signing of agreements and contractual
requirements between the guaranteeing bank project
developers and their suppliers in one project compromised
timely disbursement and delayed completion (Box 3)
While the outcome in this example may result from a
combination of several factors it still reflects how the
suboptimal design of financial guarantees among actors
can exacerbate disbursement delays
bull
bull
bull
bull
The Solar Energy Programme in Nigeria financed by UNDP and Nigeriarsquos Bank of Industry (BOI) aimed to
promote and support the expansion of RE services for micro businesses that represent almost 80 percent of
total businesses in the country
Two project developers (GVE Project Ltd and Arnergy Solar Ltd) were selected The BOI loan was offered
through a guaranteeing bank (Zenith Bank) to facilitate the latter bank refinancing the project developersrsquo
activities and developing public-private partnerships
The public-private partnership structure was intended to reinforce successful project implementation
but its complexity slowed the disbursement of funds To manage its risk Zenith Bank required additional
documents and confirmations from the BOI before disbursing funds to GVE Project Ltd The BOI thus had to conduct inspection visits to verify the procurement of equipment and confirm appropriate use of funds to reassure Zenith Bank and justify the release of further funds Delays were caused by this last-minute
requirement and by the fact that BOI had not anticipated this situation
One recommendation proposed to mitigate the risk was to secure disbursement of funds to the project
developerrsquos suppliers through the provision of Advance Payment Guarantees (APGs) or Letters of Comfort from the BOI in favour of the local suppliers instead of the project developer
NIGERIA
BOX 3
Solar Energy Programme 2017ndash2018 (independent evaluation)31
Regarding clean cooking projects it is critical to
ensure that there are sufficient and appropriate natural
resources to use the clean cooking technologies funded
by the project Such issues can be minimized during
a robust project design phase that also demands
the availability of qualified experts and incorporates
their technical understanding When projects involve
technology transfer funders should identify the local
technology manufacturers and service providers to
which the technology will be transferred the duration of
the transfer and prioritize the technology applications
with the highest potential for upscaling This process
needs to be clearly designed with monitoring tools
determined staff roles and periodic reporting
Overall for an electricity or clean cooking project
design to be lsquodisbursement-friendlyrsquo the following key
elements are essential
transparent data on energy planning (ie grid
arrival targets)
solid technical understanding of the local
market notably key stakeholders (manufacturers
CHAPTER 6 ANALYSIS OF DISBURSEMENT CONSTRAINTS AND SOLUTIONS
31 UNDP (2018) Solar Energy Programme in Nigeria
41ENERGIZING FINANCE MISSING THE MARK 2020
At the project design stage it is crucial for developers
to identify and engage with financial institutions
bankable SMEs and beneficiaries that have an interest
in energy access projects and companies As mentioned
previously adequate technical assistance services must
also be integrated at several levels (end users SMEs
and financial institutions) especially when targeting
vulnerable populations Developing business plan
training for SMEs or supporting financial institutions in
using digital services such as mobile money may allow
financial institutions to reduce their transaction costs
(eg from not having to visit remote areas to collect
credit repayments) thus increasing access to finance
for remote households From the public sector side tax
incentive programmes and reducing the retail prices of
improved cookstoves (ICS) could also encourage more
manufacturers to participate for instance in voluntary
standards and labelling programmes
Lack of public awareness
Lack of awareness of modern energy access solutions and their benefits hinders project implementation and threatens timely disbursement Awareness campaigns must be built in to energy access projects and should be at the centre of clean cooking project design
Lack of public awareness about new energy access
solutions is a barrier to energy access disbursements
particularly for clean cooking technologies Weak public
awareness limits demand which prevents project uptake
and delays disbursements especially in a results-based
financing scheme Clean cooking solutions particularly
suffer from a lack of public awareness and are thus
often sidelined by decision-makers To overcome this
awareness campaigns particularly around existing
support schemes and knowledge sharing of the benefits
of clean fuels and technologies for cooking should be
at the centre of clean cooking project design
The lack of end user awareness of the multiple co-
benefits of energy access is a serious barrier to
disbursement and a major topic that goes beyond the
scope of this report Further references can be found in
the Bibliography
SURVEYS
Surveys targeting both public and private sector
stakeholders were conducted in parallel with review
of evaluation reports Interviews were conducted
virtually through targeted phone consultations and
supplemented by online questionnaires Both of these
surveys were sent through SEforALL and its partnersrsquo
networks
Questionnaires combined targeted open and structured
multiple-choice questions and the objective was
to explore the impact of exogenous (ie political
economic technological social environmental)
and endogenous (ie internal delays behavioural
barriers human resources cultural factors) factors
as well as any other relevant elements Responses
were collected from 34 entities seven governmental
entities implementing energy-access projects or
participating in the implementation of those projects
18 private entities and nine donorsinvestors Of the
deep-dive countries Madagascar was most frequently
referenced by respondents as a country they operated
in (16 responses) followed by Nigeria (11 responses)
India (eight responses) Rwanda (eight responses) and
Myanmar (four responses)
Disbursement delays and associated causes
The majority of respondents surveyed cited gaps
between the expected and actual disbursement dates
with some respondents noting delays or cancellations
of disbursement after contractsagreements had
been signed This was experienced by 17 out of
30 respondents across all stakeholder groups (ie
donors private sector stakeholders and institutions)
Respondents frequently noted how the delay in some
project-related activities such as pre-disbursement
studies specific milestones associated with tranche-
based financing and administrative procedures
particularly amongst contractors and suppliers directly
affected disbursement schedules
CHAPTER 6 ANALYSIS OF DISBURSEMENT CONSTRAINTS AND SOLUTIONS
42ENERGIZING FINANCE MISSING THE MARK 2020
Administrative factors were the most frequently cited
internal factor responsible for disbursement delays
Administrative processes such as extensive time-
consuming paperwork and reporting requirements
in addition to old internal management tools and
requirements to seek tax and legal advice were cited
as slowing down the process This was exacerbated by
the previously highlighted human capital constraints
on carrying out these activities Other examples noted
were cumbersome due diligence and procurement
processes Private companies in particular mentioned
difficulties in complying with donor procurement
requirements without proper guidance and a lack of
clarity on local processes for example obtaining long-
term land permits when those are preconditions to
disbursement by donors
External factors referred to by survey respondents
included political factors (eg changes in political
priorities) underdeveloped financial markets and long
implementation delays when subcontracting was required
The current COVID-19 crisis was mentioned as the most
significant risk factor for timely disbursement in 2020
Regulation was also mentioned as a potential factor
affecting disbursements On this topic feedback
on the links between regulation and disbursements
was more mixed particularly in responses provided
by respondents from donor organizations which is
consistent with results from the Regulatory Indicators
for Sustainable Energy (RISE) analysis However in
general there was agreement that balanced attractive
and stable investment regulations (ie tax incentive
programmes) reduce disbursement delays as do
facilitating mechanisms such as technical assistance for
financial institutions and SMEs
On the relationship between specific energy solutions
and disbursement constraints some respondents
believed that it was not the solution type itself that
hindered fund disbursement but rather the end users
associated with that solution For instance demand
for off-grid solutions tends to be from remote areas
Due to high transaction costs associated with visiting
remote areas there is more room for delay in the
implementation of project activities and consequently
in projectsrsquo disbursements One donor mentioned that
the size of the project plays a role and that difficulties
in disbursement are mostly faced when managing
large engineering procurement and construction (EPC)
projects for electrification a trend that was already
noted in Missing the Mark 2017 Mini-grid projects
were mentioned several times as being riskier in
terms of disbursement delays On the other hand no
respondents mentioned any particular link between
types of clean cooking solutions or solar home systems
and disbursement constraints
Disbursement barriers and financial tools
No specific links were drawn by survey respondents
between delays in disbursements and funding tools (eg
debt grants equity etc) other than in large projects It
was stated that large projects are often associated with
loans disbursed in stages where payments are dependent
on achievement of milestones in project delivery which
can delay disbursements if they are not met
Several respondents mentioned lack of bankability and
integration with viable business models as a reason
behind disbursement delays which in fact reflects flaws
in initial project design ndash notably a mismatch between
project objectives and underlying financial instruments
offered through the project andor local financial market
Disbursement barriers and type of recipients
According to respondents national development
banks are the type of recipient with which there is a
higher risk of disbursement delay because overall
they tend to lack experience in energy access projects
and thus their involvement requires engagement and
assistance Survey respondents also noted that national
development banks can be slow-moving strongly risk-
averse and impose long due-diligence processes
CHAPTER 6 ANALYSIS OF DISBURSEMENT CONSTRAINTS AND SOLUTIONS
43ENERGIZING FINANCE MISSING THE MARK 2020
Stakeholder Main action(s) to undertake
Government bull Create an attractive investment environmentbull Increase transparency and communicate energy plans provide information through intuitive tools
and softwarebull Support local financial institutions to access funds for energy access projectsbull Assess needs and strengthen capacity of local SMEs to help them become bankable and create
viable business models
Private sector bull Share new managerial skillsbull Bring capital (loans and equity)
Donors bull Consider blended finance structures mixing a variety of instruments (grants loans risk-sharing instruments) from public and private sources
bull Offer technical assistance and capacity building to recipients during project implementationbull Implement an efficient monitoring system while a project is on footbull Conduct project evaluations and communicate findings through reports
Respondentsrsquo proposed recommendations
Respondents offered several recommendations to
reduce disbursement delays as summarized in Table 1
The main recommendations from the institutions private
sector and funders were that donors and institutional
recipients of funds should streamline project team
recruitment processes shift implementation to local
offices and more technically capable entities andor
bring greater technical assistance and capacity building
to bear on project implementation to help build local
skills In addition project design should include a market
assessment (especially for technology transfer projects)
and regular monitoring Increased human capacity can
pave the way for other proposed solutions namely in
improving communication stakeholder coordination
and decision-making
According to respondents government support is key
to improving disbursement efficiency Governments
need to provide and maintain a stable investment
environment that does not hinder timely disbursement
of funds It can do this by working to eliminate
corruption promoting financial schemes to fund the
purchase of energy solutions and publishing relevant
up to date information The latter could include for
example the progress of central grid expansion or data
about locally available energy solutions It was also
mentioned that seeking quick disbursement especially
of large commitments should not come at the expense
of the quality of the disbursement too much pressure
to disburse quickly may affect the long-term quality and
adequacy of the products and services procured for the
project
Funders (ie donors and investors) also have a role to
play in providing technical assistance and capacity
building to help build local skills and support local
entities in absorbing funds which help respect the
timeline of project implementation ndash and thus fosters
timely disbursement Respondents also noted that
funders should keep the disbursement process simple
and flexible and adapt quickly to new financing
business models emerging technologies and changing
market conditions The integration of robust monitoring
and evaluation systems is also crucial to ensure smooth
project implementation and timely disbursement
Relevant evaluation reports can help draw lessons from
project design planning and implementation However
the analysis revealed that evaluation reports could give
greater attention to the evaluation of disbursement
records and delays particularly to describe underlying
factors that caused disbursement delays and
inefficiencies in more detail as well as associated
recommendations for mitigating these in the future
Finally the private sector has a significant role to play in
bringing new managerial skills and facilitating dialogue
and decision-making processes between donor and
recipient countries Transparent communication (ie
between suppliers and contractors) is also a key element
to prevent disbursement delays
TABLE 1 Survey respondentsrsquo recommendations to improve disbursement efficiency
Source South Pole 2020
CHAPTER 6 ANALYSIS OF DISBURSEMENT CONSTRAINTS AND SOLUTIONS
44ENERGIZING FINANCE MISSING THE MARK 2020
SUMMARY OF QUALITATIVE INSIGHTS
As in Energizing Finance Missing the Mark 2017 this
updated 2020 edition shows that disbursement and
project development influence one another a late
disbursement can be both the cause and consequence of
delayed project implementation Regardless of where in
the project implementation process disbursement delays
occur they affect the overall project and therefore the
delivery of energy and related co-benefits on the ground
The same five barriers to disbursement as identified in Energizing Finance Missing the Mark 2017 prevail in Energizing Finance Missing the Mark 2020
1 weak institutional structures and capacity
2 regulatory and policy barriers
3 limited access to and maturity of local financial
services
4 technical barriersproject design flaws
5 public awareness
However the main barrier identified in Missing the Mark
2017 (time-consuming and difficult foreign currency
requirements) was not seen as a major barrier in the
2020 analysis
What was interesting to note during the research was
the influence of project-specific factors on disbursement
delays While the importance of external factors causing
delays remains (ie political economic technological
and regulatory factors) survey respondents emphasized
the significance of project-related factors in low
disbursement rates That is burdensome administrative
processes lack of capacity limited coordination between
implementing agencies and unclear and unfeasible
project design
Taking all of these findings into consideration it is clear that sharpening project design streamlining administrative processes facilitating stakeholder interaction removing regulatory barriers and improving local financial services are all essential to increasing disbursement rates and unleashing the full potential of development finance Without this there
will not be sustainable energy for all
Finally it is important to note that the energy ecosystem
has significantly evolved in the last decade but
the current analytical framework has not Energy is
generated and delivered differently today with off-grid
and decentralized private sector-led options expanding
but this is not always reflected in the available data The
prevailing data representation is still dominated by data
from large donor-funded energy projects With the
OECD CRS codes used there was a lack of consistent
and reliable data on development finance for off-grid
electricity and clean cooking solutions In addition
the analysis could not fully capture new disbursement
barriers as these are linked to an emerging market
structure that is not fully visible in the datasets and
research papers
The barriers identified in this report that hinder timely
fund disbursement to energy access projects across the
five deep-dive countries and recommended solutions
are summarized in Table 2 below
CHAPTER 6 ANALYSIS OF DISBURSEMENT CONSTRAINTS AND SOLUTIONS
45ENERGIZING FINANCE MISSING THE MARK 2020
29 This recommendation was mentioned numerous times by respondents This does not necessarily contradict the findings from Section 611 since the RISE regression analysis did not focus on a specific technology and did not study possible medium- to long-term relationships
TYPE OF BARRIER POLICY RECOMMENDATIONRegulatory and policy barriers
Weak and unclear legal frameworks and regulations
Governments should provide a balanced and stable regulatory and investment environment for the energy sector29
Improve data quality and availability
Improve banking and investment policies and regulations to help bring local financial sector to maturity
Institutional structure and public sector capacity
Limited buy-in and support from the implementing agency
Create a country support office or subcontract project management to local organizations with sectoral expertise
Lack of coordination between government donor and other relevant stakeholdersbeneficiaries
Implement a clear and defined strategy for inter-agency communication
Conduct regular meetings
Time-consuming processes with local governments
Streamline decision-making and procurement procedures to improve efficiency
Lack of flexibility in fund transfer between donor and government implementing agency
Establish flexible and transparent contracting arrangements
Make a checklist before signing contracts to ensure that disbursement conditions are identified and can be met
Limited access to finance and markets
Poor householdersrsquo lack of access to finance to purchase energy solutions resulting in delays to project implementation and disbursement
Structure tailored financial solutions for example payment by instalment models for poor households who cannot afford large up front payments
Develop pay-as-you-go financing schemes
Offer use of mobile money to facilitate repayments
Raise consumer awareness of financing schemes for example through targeted campaigns
Limited access to credit facilities across the HICs for SMEs delaying project implementation and disbursements
Identify relevant financial institutions and SMEs during the project design phase
Offer technical assistance at several levels (end users SMEs and financial institutions)
Provide clear guidelines easy-to-access services (eg toll-free hotlines) and a variety of payment options
Reluctance of local financial institutions to provide loans to households and SMEs due to low risk appetite
Deploy financial risk-sharing mechanisms between donors and governments to reduce risk and increase affordability of finance for end users
Roll out capacity building and awareness programmes for local financial institutions
TABLE 2 Summary of disbursement constraints and policy recommendations
CHAPTER 6 ANALYSIS OF DISBURSEMENT CONSTRAINTS AND SOLUTIONS
46ENERGIZING FINANCE MISSING THE MARK 2020
TYPE OF BARRIER POLICY RECOMMENDATIONTechnical barriersflaws in project design
Unrealistic project timeframes andor scope Design project with realistic and appropriate timeframe
Select economically viable technology solutions with the highest potential for adoption and scale-up which are not substantially supported by other programmes
Identify local technology manufacturers and service providers to which technology will be transferred
Develop pilot projects with locally manufactured equipment
Structure projects based on early implementation experience
Poor market assessments Thoroughly assess requirements for adaptation of previous successful projects to new markets through pre-feasibility studies that includebull an assessment of available resourcesbull identification of suitable technology and beneficiariesbull identification of key stakeholders bull identification of viable distribution channelsbull qualitative and quantitative studies that describe the target
populationrsquos behaviour and practices in electricity and clean cooking usage
Inadequate andor inappropriate pricing (eg introduction of innovative technologies that are not competitive with highly subsidized grid tariffs)
Clearly identify local tariffs and pricing mechanisms for different energy solutions
Analyse the relevance of each energy solution according to local tariffs and subsidies
Promote projectrsquos energy solutions with technical assistance and awareness campaigns
Public awareness
Lack of awareness of existing financial support schemes for energy access targeting SMEs and households (if any)
Conduct consumer awareness campaigns on existing support schemes especially for clean cooking projects to stimulate demand
Limited public awareness of the benefits of improved cookstoves (ICS) compared to traditional stoves
Conduct awareness campaigns for consumers on the benefits of using LPG and ICS improve marketing techniques
Source South Pole 2020
CHAPTER 6 ANALYSIS OF DISBURSEMENT CONSTRAINTS AND SOLUTIONS
ANNEX
48ENERGIZING FINANCE MISSING THE MARK 2020
ANNEX
ANNEX I METHODOLOGY
The following section provides a more detailed overview
of both the quantitative and qualitative research
methodologies
The quantitative research was based on a statistical
analysis of the data for energy sector development
finance commitments and disbursements The research
included the World Bankrsquos Regulatory Indicators for
Sustainable Energy (RISE) scores which are indicators
of a countryrsquos policies and regulations in the energy
sector The analysis combined this to explore potential
links between RISE scores and disbursement rates
This section provides an overview of the scope the
data sources and data selection and the nature of the
analysis as well as analytical considerations definitions
and data constraints
Scope
The data selection focused on 20 HICs In contrast to
Energizing Finance Missing the Mark 2020 the list
of countries has been updated to correspond with
the countries included in Tracking SDG7 The Energy
Progress Report 2020
The list of countries selected for the quantitative analysis
is as follows
bull Electricity access Angola Bangladesh Burkina
Faso Chad Congo (DR) Ethiopia India Kenya
Korea (DPR) Madagascar Malawi Mozambique
Myanmar Niger Nigeria Pakistan Sudan
Tanzania Uganda and Yemen
bull Clean cooking access Afghanistan Bangladesh
China Congo (DR) Ethiopia Ghana India
Indonesia Kenya Korea (DPR) Madagascar
Mozambique Myanmar Nigeria Pakistan
Philippines Sudan Tanzania Uganda and Vietnam
The Energizing Finance Missing the Mark 2020
quantitative analysis covers the period 2013 to 2018
Data sources and selection
The key data sources identified for the quantitative
analysis are summarized as follows
DATA SOURCE DESCRIPTION ACCESSIBLE ATCommitment and disbursement data
OECD The data come from the publicly accessible Creditor Reporting System (CRS) This repository houses development finance commitment and disbursement data from OECD countries and multilateral donor organizations
httpsstatsoecdorg
RISE scores World Bank RISE scores provide a reflection of a countryrsquos policies and regulations in the energy sector organized by the three pillars of the SEforALL initiative Energy Access Energy Efficiency and Renewable Energy
httpsriseworldbankorgscores
TABLE 3 Key data sources for the quantitative analysis
Source South Pole 2020
49ENERGIZING FINANCE MISSING THE MARK 2020
Concerning commitment and disbursements the key
data fields from the CRS database that were required
for the analysis are donor country recipient country
project purpose commitments disbursement schedule
schemes actual disbursements and project start and
end dates
Regarding the RISE scores this study proposed to
incorporate them to assess whether (and if so to
what extent) there are parallels between RISE scores
(or their evolution over time) and the commitment
disbursement gap
Regarding data selection for energy the data selected
in the CRS database were under the sector labelled
lsquo230 II3 Energy Totalrsquo For clean cooking projects the
data were extracted from the entire database because
clean cooking projects are not neatly classified into one
single category
Matching transactions to projects
The CRS data report development finance flows
at the transaction level but do not provide high-
quality project identifiers to group transactions into
projects As a result the grouping can be done either
manually which is both labour-intensive and lacking
in replicability or with an algorithm tailored to the
CRS data The procedure developed for this report
runs on the statistical software Stata but can be easily
replicated on other statistical software
The algorithm groups transactions into projects in a
multi-step process First transactions with the same
donor donor agency and recipient are grouped
Second within each of these groups of transactions the
number of unique project titles project numbers and
CRSid identifiers is calculated Third the initial groups
are broken up into subgroups based on the variable
with the fewest unique values among the project title
project number and CRSid This yields a high-quality
initial grouping
To improve this initial grouping two additional steps are
taken First projects from the International Development
Association (IDA) and the International Bank for
Reconstruction and Development (IBRD) are re-grouped
according to their project number a high-quality
identifier for those donors Second transactions from
Japan that have a project number but have an empty
project title or a project title that groups many unrelated
projects are grouped according to their project number
This improves the quality of the transaction-project
grouping for Japanese development finance
Data analysis
This section presents the different types of data analyses
that were conducted as part of the quantitative analysis
The first stage of the analysis consisted of conducting
general statistical analysis related to commitment and
disbursement data for energy and clean cooking For
commitment and disbursement levels the results are
presented in absolute terms (USD) and in relative terms
(as a percentage of total commitments worldwide)
Similar statistics are presented for the commitment
disbursement gap All results are summarized as totals
but can also be disaggregated by various data fields
such as sector donor or recipient country The second
stage of the analysis consisted of conducting a trend
analysis of the data over the time period 2013ndash2018
This study also proposed a comparison of commitment
and disbursement trends with the evolution in RISE
scores over time even though it was unlikely to be
possible to demonstrate causality Finally an important
aspect of the analysis related to exploring delays in
disbursements The aim was to identify whether there
are delays in disbursements in energy and clean cooking
access projects and if so to calculate the magnitude of
those delays The possible reasons behind these delays
were investigated in the qualitative analysis
The disbursement delay analysis relies on an agreed
definition of what constitutes a delay and how to
differentiate between different levels of delays Similar
to to Missing the Mark 2017 it was proposed to use a
binary and a non-binary indicator to classify and calculate
project delays The binary indicator established whether
a project was on time or late while the non-binary
indicator revealed the level of the delay
ANNEX
50ENERGIZING FINANCE MISSING THE MARK 2020
Donor Total commitment (USD million)
Percentage of financing with missing data ()
Percentage of projects with missing data ()
Percentage of overall financing with missing data ()
Asian Development Bank 18159 15 67 20
International Development Association
17234 23 37 19
Japan 12054 7 67 13
International Bank for Reconstruction and Development
8973 9 45 10
Germany 6439 3 58 7
International Finance Corporation 3642 100 100 4
Islamic Development Bank 3295 100 100 4
France 3023 3 75 3
United States 2931 37 53 3
EU Institutions 2751 19 92 3
African Development Fund (ADF) 2553 100 100 3
African Development Bank 1976 100 100 2
Climate Investment Funds 1056 100 100 1
Korea 1014 20 44 1
Asian Infrastructure Investment Bank 908 100 100 1
Arab Fund for Economic and Social Development (AFESD)
900 100 100 1
United Kingdom 751 12 50 1
Norway 731 8 31 1
OPEC Fund for International Development
643 100 100 1
Kuwait 475 100 100 1
Sweden 432 20 79 0
United Arab Emirates 390 100 100 0
Italy 357 12 56 0
TABLE 4 Missing data for disbursement constraint analysis by donor
Missing information for disbursement constraints analysis 2002ndash2018
ANNEX
51ENERGIZING FINANCE MISSING THE MARK 2020
Recipient Total commitment
Percentage of financing with missing data ()
Percentage of projects with missing data ()
Percentage of overall financing with missing data ()
India 30096 21 65 33
Bangladesh 14628 28 62 16
Pakistan 14034 21 62 15
Kenya 6041 32 61 7
Ethiopia 4010 34 56 4
Tanzania 3631 39 57 4
Nigeria 2935 66 56 3
Uganda 2679 38 55 3
Myanmar 2570 5 40 3
Mozambique 2068 29 63 2
Yemen 1672 48 86 2
Congo (DR) 1656 23 63 2
Angola 1351 93 70 1
Burkina Faso 1311 53 71 1
Sudan 1102 99 82 1
Niger 1041 61 81 1
Malawi 616 5 47 1
Madagascar 357 34 79 0
Chad 173 68 81 0
Democratic Peoples Republic of Korea 134 99 80 0
Donor Total commitment (USD million)
Percentage of financing with missing data ()
Percentage of projects with missing data ()
Percentage of overall financing with missing data ()
Denmark 233 0 51 0
Belgium 193 76 96 0
Green Climate Fund 177 26 50 0
Global Environment Facility 157 51 78 0
Netherlands 140 20 58 0
Finland 108 3 33 0
Others 410 NA NA 0
Source South Pole 2020 based on OECD CRS data
Source South Pole 2020 based on OECD CRS data
TABLE 5 Missing data for disbursement constraint analysis by recipient
ANNEX
52ENERGIZING FINANCE MISSING THE MARK 2020
Flow types Total commitment
Percentage of financing with missing data ()
Percentage of projects with missing data ()
Percentage of overall financing with missing data ()
ODA Loans 46563 21 71 51
Other Official Flows (non-export credit) 35093 39 77 38
ODA Grants 9945 31 58 11
Equity Investment 431 65 52 0
Private Development Finance 73 10 33 0
Number of transactions per project
Total commitment Number of projects Share of overall financing with missing data ()
1 10340 1169 11
2 10132 557 11
3 8555 252 9
4 7251 140 8
5 5057 93 5
6 4395 57 5
7 3985 47 4
8 2505 38 3
9 2987 42 3
10 2710 27 3
10+ 7234 116 8
TABLE 6 Missing data for disbursement constraint analysis by flow type
TABLE 7 Missing data for disbursement constraint analysis by number of transactions per project
Source South Pole 2020 based on OECD CRS data
Source South Pole 2020 based on OECD CRS data
ANNEX
53ENERGIZING FINANCE MISSING THE MARK 2020
Description of the clean cooking keyword search methodology
A multi-step keyword search analysis was used to
identify clean cooking transactions in the CRS data First
an initial list of clean cooking transactions for 2018 was
identified with a preliminary list of keywords consisting
of cook cooker cooking stove(s) pellet(s) biomass
biogas LPG kerosene indoor briquette liquefied
The analysis shows that some keywords such as
pellet(s) reliably identify clean cooking transactions
but identify few transactions Other keywords such as
stove(s) reliably identify clean cooking transactions and
identify many transactions Others such as cook and
cooking identify many transactions but are somewhat
less reliable in identifying clean cooking transactions
wood ethanol digester manure and cylinder(s) Both
the project titles and descriptions were automatically
examined with the statistical software Stata
Second each of these 240 transactions was manually
checked to verify whether it was in fact clean cooking
related Third the accuracy of each of the individual
keywords was then assessed from this manual check and
reported in Table 8 (see below)
The top seven keywords based on these criteria were
chosen for the definitive keyword text search that was
used to identify the final list of clean cooking transactions
for all years
Keywords Transactions flagged (2018) Number of true positive (manual check)
Percentage of true positives ()
All keywords 240 51 21Pellet 1 1 100
Pellets 1 1 100
Digester 1 1 100
Stoves 25 24 96
Stove 31 28 90
Cook 55 30 55
Cooking 36 18 50
Liquefied 8 3 38
Ethanol 3 1 33
Biogas 23 5 22
Biomass 49 7 14
Wood 60 7 12
Indoor 40 0 0
LPG 12 0 0
Cooker 6 0 0
Kerosene 5 0 0
Manure 5 0 0
Cylinder 2 0 0
Briquette 1 0 0
Cylinders 1 0 0
TABLE 8 Keywords ranked by quality
Source South Pole 2020 based on OECD CRS data
ANNEX
54ENERGIZING FINANCE MISSING THE MARK 2020
ANNEX II
DETAILED METHODOLOGY FOR THE RISE CORRELATION ANALYSIS
To address the omitted variable bias inherent in probing
the relationship between regulatory improvements and
aid activity a fixed effects regression specification was
important Country-fixed effects explain the variation in
development finance commitments and disbursements
that are associated with country-specific factors that
do not vary over time such as geography or language
Time-fixed effects capture the variation in commitments
and disbursements that is associated with specific years
and does not vary across countries such as years when
governments have more fiscal space for development
finance The remaining variation therefore depends on
factors that vary within countries and across time ndash such
as the regulatory and policy changes captured by the
RISE
The correlation analysis is observational (ie non-
experimental) so results must be interpreted with
caution Although fixed effects capture a significant
share of bias stemming from key variables omitted
they cannot capture omitted variable bias from time-
varying country-varying changes Moreover the true
relationships between the variables analyzed (and
those that are omitted) may be complex non-linear and
interactive which may not match the linear regression
specification As a result the results presented below
should be interpreted as suggestive
The RISE data span eight years from 2010 to 2017 and
cover all high-impact countries (HICs) for electricity
access energy efficiency and renewable energy (RE)
except Korea (DPR) and Yemen Therefore the regression
has a relatively small sample of 144 data points With
the 18 country fixed effect dummies and the eight-year
fixed effect dummies there are 118 remaining degrees
of freedom The small size of the sample results from the
fact that the RISE do not cover the period prior to 2010
The independent variable in the regressions mdash the
variable to be explained mdash is commitments and
disbursements per capita to the energy sector The
data were normalized by population so that they are
comparable across countries and so that the units in the
regressions are appropriate
Key co-variates from the World Development Indicators
(WDI) data include real purchasing power parity-
adjusted per capita income which serves as a proxy
for living standards the share of the population that is
electrified which serves as a proxy for the electrification
gap and the share of the ruralurban population that is
electrified which can be used to compute the gap in
electrification across sectors Other variables contained
in the WDI data such as the megawatts of generation
capacity per inhabitant could not be included in the
analysis due to limited coverage
DETAILED RESULTS
The RISE for electricity access energy efficiency and
RE do not appear to be strongly correlated with overall
energy sector development finance commitments per
capita in HICs
In the baseline regression with no dependent variables
the fixed effects capture 30 percent of the variation
in overall energy-sector commitments per inhabitant
(regression A1) Adding the RISE for electricity access
increases the R2 to 35 percent (A2) and adding in
the one-year change in the RISE increases the R2 to
31 percent (A3) Adding both the indicator and the
change increases the R2 to 33 percent (A4) For each of
these regression specifications the increase in the R2
over the baseline is small and none of the coefficients
is statistically significant As a result changes in the
electricity-access regulations and policies that the RISE
measure do not appear to have much explanatory power
over development finance commitments to the energy
sector in HICs in the short term
ANNEX
55ENERGIZING FINANCE MISSING THE MARK 2020
Adding the RISE for energy efficiency to the baseline
regression increases the R2 to 35 percent (A5) adding
the change in the RISE for energy efficiency increases
the R2 to 31 percent (A6) and adding both increases the
R2 to 31 percent (A7) As is the case with the electricity
access indicators the energy efficiency indicators are
not statistically significant and do not materially increase
the share of the variation in commitments explained by
the regression Similarly adding the RISE for RE to the
baseline regression increases the R2 to 34 percent (A8)
adding the change in the RISE for renewable energy
increases the R2 to 33 percent (A9) and adding both
increases the R2 to 33 percent (A10) Like with the other
two indicators the coefficients for the RE indicator are
not statistically significant and do not materially increase
the share of the variation in commitments explained by
the regression Therefore the changes in the energy
efficiency and RE regulation and policies that the RISE
measure appear to have limited explanatory power over
total energy-sector development finance commitments
in HICs
Other variables in the WDI data do appear to be
strongly correlated with energy-sector development
finance commitments For example a regression that
includes the share of populations with electrification
the difference between urban and rural electrification
rates and per capita income increases the R2 to 47
percent (model A11) and yields statistically significant
coefficients for the first two variables The negative sign
for the coefficient for the share of electrified persons
in the country and the gap between urban and rural
electrification rates is consistent with the notion that
countries in greater need should be the recipients of
more development finance
VARIABLES (1)A1
(2)A2
(3)A3
(4)A4
(5)A5
(6)A6
(7)A7
(8)A8
(9)A9
(10)A10
(11)A11
RISE_ea00952(00772)
0146(0113)
RISE_re00445(00714)
00187(00795)
RISE_ee-0108(0123)
-00895(0164)
RISE_ea_chg00244(00862)
-00785(0119)
RISE_ee_chg00821(0162)
0130(0202)
RISE_re_chg0177
(00965)0168
(00966)
ea pct-3707(1497)
ea_gap_urb_ru-3025
(9352)
gdp_pc-0000130(000439)
Constant4235(3832)
2253(3972)
4843(4817)
0364(4305)
5329(4236)
4916(4769)
5162(4803)
4496(4264)
4552(4705)
4276(4737)
4942(2007)
Observations R-squaredCountry FEYear FEStandard Errors
1710296YesYes
Robust
1440353YesYes
Robust
1260311YesYes
Robust
1260328YesYes
Robust
1440347YesYes
Robust
1260312YesYes
Robust
1260314YesYes
Robust
1440344YesYes
Robust
1260326YesYes
Robust
1260326YesYes
Robust
1430465YesYes
RobustRobust standard errors in parentheses
plt001 plt005 plt01
FIGURE 20Energy sector commitments per capita and RISE scores HICs 2013-2018
Source South Pole 2020
ANNEX
56ENERGIZING FINANCE MISSING THE MARK 2020
RISE for electricity access energy efficiency and RE also
do not appear to be strongly correlated with energy-
sector finance disbursements in HICs The baseline
regression with no covariates (regression B1) explains 46
percent of the variation in disbursements per capita The
R2 increases to 49 percent when the RISE for electricity
access is added (B2) increases to 52 percent when the
The increases in R2 are modest (less than seven
percentage points) and none of the coefficients is
statistically significant which again suggests that
changes in the policies and regulations for electricity
access and energy efficiency captured by the RISE are
not strong predictors of energy-sector development
finance disbursements in the short term
However the coefficient for the RE indicator significantly
statistically predicts per capita energy disbursements
change in the indicator is added (B3) and increases to
52 percent when both the indicator and the change
are added (B4) Similarly the R2 increases to 49 percent
when the RISE for energy efficiency is added (B5)
increases to 52 percent when the change in the indicator
is added (B6) and increases to 52 percent when both
the indicator and the change are added (B7)
in HICs at the 10 percent significance level Every
additional point in the RE indicator is associated on
average with USD 005 in additional disbursements
(B8) and its inclusion improves the share of the variation
explained by about three percentage points The other
two regression specifications with RE covariates (B9 and
B10) do not have statistically significant coefficients and
increase the R2 to 52 percent from the baseline of 46
percent
VARIABLES (1)B1
(2)B2
(3)B3
(4)B4
(5)B5
(6)B6
(7)B7
(8)B8
(9)B9
(10)B10
(11)B11
RISE_ea00308(00281)
00476(00430)
RISE_re00504(00276)
00506(00307)
RISE_ee00275(00530)
-00102(00698)
RISE_ea_chg-00296(00408)
-00632(00566)
RISE_ee_chg00584(00397)
00639(00530)
RISE_re_chg-000815(00405)
-00312(00442)
ea pct-8367(6638)
ea_gap_urb_ru-9012(4258)
gdp_pc-000473
(000164)
Constant3542(2546)
3431(2610)
4852(3130)
3389(2826)
4286(2844)
4831(3156)
4859(3190)
3675(2824)
4821(3138)
4077(3158)
3816(8655)
Observations R-squaredCountry FEYear FEStandard Errors
1710457YesYes
Robust
1440491YesYes
Robust
1260518YesYes
Robust
1260524YesYes
Robust
1440488YesYes
Robust
1260518YesYes
Robust
1260519YesYes
Robust
1440494YesYes
Robust
1260516YesYes
Robust
1260521YesYes
Robust
1430712YesYes
RobustRobust standard errors in parentheses
plt001 plt005 plt01
FIGURE 21Energy sector disbursements per capita and RISE scores HICs 2013-2018
Source South Pole 2020
ANNEX
57ENERGIZING FINANCE MISSING THE MARK 2020
Development finance commitments and disbursements
specifically for RE in HICs are significantly smaller than
overall energy sector development finance In the
2010ndash2017 period where RISE scores are available
for example only 45 percent of the country-year
observations have new RE commitments and only 74
percent have disbursements
Puzzlingly RISE scores for quality of policies and
regulations for RE are associated with lower RE
development finance in the case of both commitments
and disbursements (regressions C2-C4 D2-D4)
Moreover for disbursements the negative coefficients
are statistically significant This implies that on average
HICs that improve their RISE score for RE tend to
receive less RE development finance One possible
interpretation is that alternative sources of financing
become more viable and increase as RISE scores (and
therefore policies and regulation) improve thus reducing
the need for development finance
VARIABLES (1)Model C1
(2)Model C2
(3)Model C3
(4)Model C4
RISE_re-000130(00246)
-000184(00285)
RISE_re_chg00479(00383)
00485(00385)
Constant-0492(0246)
-0408(0435)
-0371(0295)
-0343(0496)
Observations R-squaredCountry FEYear FEStandard Errors
1640235YesYes
Robust
1380247YesYes
Robust
1200280YesYes
Robust
1200280YesYes
Robust
VARIABLES (1)Model D1
(2)Model D2
(3)Model D3
(4)Model D4
RISE_re-00167(000867)
-00266(00121)
RISE_re_chg000152(000766)
00109(000923)
Constant-0322(0206)
00755(0164)
-0209(0122)
0196(0200)
Observations R-squaredCountry FEYear FEStandard Errors
1640484YesYes
Robust
1380467YesYes
Robust
1200504YesYes
Robust
1200536YesYes
Robust
Robust standard errors in parentheses plt001 plt005 plt01
Robust standard errors in parentheses plt001 plt005 plt01
FIGURE 22RE commitments per capita and RISE scores
FIGURE 23RE disbursements per capita and RISE scores
Source South Pole 2020
Source South Pole 2020
ANNEX
58ENERGIZING FINANCE MISSING THE MARK 2020
ANNEX III
REVIEW OF EVALUATION REPORTS
Information contained in the available literature was
reviewed In order to do this in a structured and organized
manner information capture has been recorded in a grid
to easily store classify and refer to information that is
linked to disbursement constraints identified barriers
and recommendations for improvement
This classification of information has helped to determine
the various reasons that are most often referenced as
causing delays in disbursements for energy-access
projects in a structured manner This also helped to
identify interesting case studies that could add valuable
insights and a narrative to the analysis Where possible
the reasons behind delays or gaps in disbursements will
be cross-referenced with the results from the quantitative
analysis The analysis grid is detailed in Table 9
Information is then inserted into a matrix that allowed us to summarize and synthesize the different types of
disbursement constraints (regulatory institutional technical) that were faced in the panel of projects studied and the
potential solutions implemented to overcome these barriers The analysis criteria are presented in the table below
Finally a case study was extracted for each deep-dive country ie a project with its characteristics highlighting
disbursement difficulties and mechanisms used to mitigate these challenges if any
Data fields of interest for the qualitative analysis
Type of source (multilateral and bilateral donorsdevelopment partners national actorsacademia)
Name of the organization
Name of the report
Name of the deep-dive country (Ethiopia India Myanmar Madagascar Nigeria Rwanda)
Report description
Sector concerned (electricityclean cookingboth)
Financial instrument(s) mentioned in the report
Recommendations for improvementslessons learnt (if any)
Ethanol
Type of disbursement constraints underlying challenges
Sub-sector Proposed solutions
Regulatory and policy barriers
Institutional structure and public sector capacity
Limited access to finance and local market
Technical barriersflaws in project design
Public awareness
TABLE 9 Analysis grid for review of reports
TABLE 10 Report review matrix
Source South Pole 2020
Source South Pole 2020
ANNEX
59ENERGIZING FINANCE MISSING THE MARK 2020
ADB Asian Development Bank
AFDB African Development Bank
ADF African Development Fund (window of the AFDB)
APD average project delay
BOI Nigerian Bank of Industry
CRS Creditor Reporting System
DAC Development Assistance Committee
DFI development finance institution
DRC Democratic Republic of Congo
DPR Democratic Peoplersquos Republic
GEF Global Environmental Fund
GHG greenhouse gas
HIC high-impact country
IBRD International Bank for Reconstruction and Development (member of the World Bank Group)
ICS improved cooking stove
IDA International Development Association (member of the World Bank Group)
IEA International Energy Agency
IFC International Finance Corporation (member of the World Bank Group)
LPG liquified petroleum gas
ODA Official Development Assistance
OECD Organization for Economic Cooperation and Development
OOF Other Official Flows
PMU project management unit
PREP Promoting Renewable Energy Program
PV photovoltaic
QUODA Quality of Official Development Assistance
RE renewable energy
RISE Regulatory Indicators for Sustainable Energy
SDG Sustainable Development Goal
SEforALL Sustainable Energy for All
SMEs small and medium-sized enterprises
UNDP United Nations Development Programme
UNIDO United Nations Industrial Development Organization
WDI World Development Indicators
ABBREVIATIONS
GLOSSARYAverage Project Delay (APD) ndash an indicative measure
of the severity of disbursement constraints The
minimum value of -100 indicates that the project
timeline has elapsed with no disbursements A value of
zero indicates that disbursements are on schedule The
maximum value of 100 indicates that all commitments
have been disbursed on or before the project start date
Beneficiary ndash a recipient of development finance
including intermediaries
Commitment ndash a firm written obligation by means of
a board decision on investment closure of a financing
contract or similar actions and backed by the necessary
funds to provide specified assistancefinancing to
a project recipient country or any other partner
organization
Development finance ndash Finance tracked in the Creditor
Reporting System32 (CRS) database of the Organisation
for Economic Co-operation and Development (OECD)
including both Official Development Assistance (ODA)
and Other Official Flows (OOF) The donor categories
include Development Assistance Committee (DAC)
countries other non-DAC countries (though not
including China India and Russia) private foundations
(such as the Hewlett Foundation and the Bill and
Melinda Gates Foundation) bilateral and multilateral
development agencies (such as the United States
Agency for International Development (USAID))
development finance institutions (such as the World
Bank) and United Nations agencies
Disbursement ndash the placement of resources at the
disposal of a recipient country or agency or in the
case of internal development-related expenditures the
outlay of funds by the public sector
Disbursement constraint ndash the difficulty that
development partners and beneficiaries face to meet a
32 The objective of the CRS Aid Activity database is to provide a set of readily-available basic data that enable analysis on where aid goes what purposes it serves and what policies it aims to implement on a comparable basis for all Development Assistance Committee members More information on httpswwwoecd-ilibraryorgdevelopmentdatacreditor-reporting-system_dev-cred-data-en33 Between 2013 and 2018 clean cooking transactions classified as energy projects in the OECD CRS database amounted to less than USD 60 million in commitments (011 percent of total) and USD 17 million (005 percent of total) in disbursements
commitment either in terms of the amount of financing
disbursed or the timeframe for disbursement Pre-
commitment delays are excluded from this analysis
Donor ndash a government or official agency making a
commitment to provide development finance
Energy ndash in the OECD CRS database energy projects
encompass energy policy energy generation (renewable
sources) energy generation (non-renewable sources)
hybrid energy plants nuclear energy and energy
distribution Energy projects include off-grid and some
clean cooking projects33 these may not include all such
projects tracked in the OECD CRS database due to data
limitations as detailed in Annex I
High-impact countries ndash the 20 countries with the
highest absolute gaps in access to electricity andor
clean fuels and technologies for cooking measured
by population as identified in Tracking SDG7 The
Energy Progress Report 2020 For electricity access
the countries are Angola Bangladesh Burkina Faso
Chad Congo (DR) Ethiopia India Kenya Korea (DPR)
Madagascar Malawi Mozambique Myanmar Niger
Nigeria Pakistan Sudan Tanzania Uganda and Yemen
For clean cooking access the countries are Afghanistan
Bangladesh China Congo (DR) Ethiopia Ghana
India Indonesia Kenya Korea (DPR) Madagascar
Mozambique Myanmar Nigeria Pakistan Philippines
Sudan Tanzania Uganda and Vietnam The Energizing
Finance Missing the Mark 2017 report utilized a slightly
different list of countries drawn from the Global Tracking
Framework 2015 (International Energy Association (IEA)
and the World Bank 2015)
Renewable energy (RE) projects ndash in line with the
OECD CRS database renewable energy sources include
hydro-electric power plants solar energy wind marine
geothermal and biofuel-fired power plants
61ENERGIZING FINANCE MISSING THE MARK 2020
BIBLIOGRAPHYADB (2016) Myanmar Energy Sector Assessment Strategy and Road Map Retrieved from ADB httpswwwadb
orgdocumentsmyanmar-energy-assessment-strategy-road-map
ADB (2016) Performance Evaluation report Asian Development Bank India Dahanu Solar Power Project Retrieved
from ADB httpswwwadborgsitesdefaultfilesevaluation-document237636filespper-dahanupdf
ADB (2019) Corporate evaluation ADBrsquos Multitranche Financing Facility 2005ndash2018 Performance and Results
Delivered Retrieved from ADB httpswwwadborgsitesdefaultfilesevaluation-document470651filesin367-
19pdf
ADF PARSE Project Completion Report (2018) Retrieved from African Development Bank httpswwwafdborg
endocumentsmadagascar-energy-sector-reform-support-programme-parse-project-completion-report
AFDB (2019) Project Completion Report Multinational-Interconnection of the Electric Grids of The Nile Equatorial
Lakes Countries Retrieved from AFDB httpswwwafdborgendocumentsmultinational-interconnection-ot-
electric-grids-nile-equatorial-lakes-countries-project-completion-report
Butin V Cladiegravere T Scotney R and Levet J (2019) Les Enjeux de lrsquoUniversalisation de lrsquoEacutelectrification Eacutetat des
Lieux amp Recommandations European Union
Center for Global Development (2018) Quality of Official Development Assistance QuODA 2018
Methodology Retrieved from Center for Global Development httpswwwcgdevorgsitesdefaultfilesquoda-
methodology-2018pdf
Clasp (2017) Transforming the Cookstoves Market through Standards amp Labels in Nigeria Retrieved from Clasp
httpsclaspngopublicationstransforming-the-cookstoves-market-through-standards-labels-in-nigeria
Clean Cooking Alliance (2019) Clean Cooking Industry Snapshot an inaugural report on sector investment and
innovation Retrieved from Clean Cooking Alliance httpswwwcleancookingallianceorgreports2019-Clean-
Cooking-Industry-Snapshot2019-Clean-Cooking-Industry-Snapshothtmlpage=1
Dorkenooo K (2018) Clean and Improved Cookstoves and End User Finance Solutions for Clean Energy Solutions
in Adamawa State Nigeria ndash Household survey analysis
Dorman D and Ciplet D (2020) Bridging the Gap Finance for Energy Access in the Green Climate Fund SEI
Report May 2020 Stockholm Environment Institute Stockholm
ESMAP (2018) Annual Report 2018 Retrieved from ESMAP httpswwwesmaporgnode174807
ESMAP (nd) Rethinking Power Sector Reforming the Developing World Retrieved from ESMAP httpwww
esmaporgrethinking_power_sector_reform
62ENERGIZING FINANCE MISSING THE MARK 2020
GIZ (2018) Results-based Financing for Energy Access - how to design and implement project - lessons from the
field Retrieved from ENDEV httpsendevinfoimagesee4EnDev_-_Results-based_Financing_for_Energy_
Access2C_Lessons_reportpdf
Grittner A M (2013) Results-based Financing Evidence from performance-based financing in the health sector
German Development Institute Bonn
Gualberti G Martin FL and Bazilian M (2013) An Econometric Analysis of the Effectiveness of Development
Finance for the Energy Sector Retrieved from SSRN httpspapersssrncomsol3paperscfmabstract_id=2202048
IEA International Renewable Energy Agency United Nations Statistics Division World Bank WHO (2020) Tracking
SDG 7 The Energy Progress Report World Bank Washington DC
IEA (2019) World Energy Investment 2019 Retrieved from IEA httpswebstoreieaorgdownload
direct2738fileName=WEI2019pdf
IISD (2016) Providing Clean Cooking Fuel in India Challenges and Solutions Retrieved from IISD httpswwwiisd
orgsitesdefaultfilespublicationsclean-cooking-india-challenges-solutions_0pdf
International Renewable Energy Agency (2018) Policies and regulation for renewable energy mini-grid Retrieved
from IRENA httpswwwirenaorg-mediaFilesIRENAAgencyPublication2018OctIRENA_mini-grid_
policies_2018pdf
Kar A et al (2019) Using sales data to assess cooking gas adoption and the impact of Indiarsquos Ujjwala programme
in rural Karnataka Nature Energy 4(1) Page 806ndash814 Retrieved from Nature httpswwwnaturecomarticles
s41560-019-0429-8epdfshared_access_token=QJjuDDH1-pUFOKlilynB6NRgN0jAjWel9jnR3ZoTv0OZ3dJZMjvM
Ds8p9tlGZdwXQZs0K3Zx6blm5KFd6AemQgY2GqgAiOvHboVHKYnicJKX6WG8W3IoJm-xHIeyq_9yc5QFhj33B5A-
HmglX6VE02A3D3D
McKee C Blampied C Mitchell I and Rogerson A (2019) Revisiting Aid Effectiveness A New Framework and
Set of Measures for Assessing Aid ldquoQualityrdquo Washington DC The Center for Global Development
Ministry of Agriculture Livestock and Irrigation Myanmar (2016) Myanmar Energy Assessment Retrieved from
Research Gate httpswwwresearchgatenetpublication329266993_Myanmar_Energy_Assessment_Rethinking_
Electrification
Ministry of Foreign Affairs the Netherlands (2014) IOB Evaluation Access to Energy in Rwanda Impact evaluation
of activities supported by the Dutch Promoting Renewable Energy Programme Retrieved from Government of
Netherlands httpswwwgovernmentnldocumentsreports20150428iob-access-to-energy-in-rwanda-impact-
evaluation-of-activities-supported-by-the-dutch-promoting-renewable-energy-programme
Musgrove P (2010) Rewards for good performance or results a short glossary Washington DC World Bank
Retrieved from RBF Health httpwwwrbfhealthorg
Oil Change International (2018) Shortchanging Energy Access A Progress Report on Multilateral Development
Bank Finance Retrieved from the Price of Oil httppriceofoilorg20181010shortchanging-energy-access-
report-mdb-finance
63ENERGIZING FINANCE MISSING THE MARK 2020
Patnaik S S Dethier S Tripathi and A Jain (2017) Access to Clean Cooking Energy in India Beyond
Connections Towards Sustained Use New Delhi Council on Energy Environment and Water
Raitzer DA Bloumlnde N and Sibal J (2019) Impact Evaluation of Energy Interventions A Review of the Evidence
Retrieved from ADB httpswwwadborgsitesdefaultfilespublication502271impact-evaluation-energy-
interventionspdf
SEforALL (2019) Energizing Finance Taking the Pulse 2019 Retrieved from SEforALL httpswwwseforallorg
publicationsenergizing-finance-taking-the-pulse-2019
SEforALL (2017) Energizing Finance Missing the Mark 2017 Retrieved from SEforALL httpswwwseforallorg
publicationsenergizing-finance-missing-the-mark-gaps-and-lags-in-disbursement-of-development
ESMAP (2020) The State of Access to Modern Energy Cooking Services Washington DC World Bank Group
httpdocumentsworldbankorgcurateden937141600195758792The-State-of-Access-to-Modern-Energy-
Cooking-Services
The Asia Foundation (2019) DECENTRALIZING POWER The Role of State and Region Governments in Myanmarrsquos
Energy Sector Retrieved from the Asia Foundation httpsasiafoundationorgwp-contentuploads201904
Myanmar_Decentralizing-Power_Exec-Summarypdf
Transform Global (2019) Portfolio Learnings | Myanmar Stoves Campaign is bringing clean cookstoves to
Myanmar Retrieved from Transform Global httpswwwtransformglobalmodulesContentNewsDetail
aspxappId=2ampNewsId=2779c509-e633-4dea-9c74-08b4ffcd0171
UNDP (2019) Mid-term Review Scale Up of Access to Clean Energy for Rural Productive Uses Retrieved from
UNDP httpsercundporgevaluationevaluationsdetail9598
UNDP (2018) Solar Energy Programme in Nigeria
UNDP India (2019) Mid-term Review Market Transformation and Removal of Barriers for Effective Implementation
of the State Level Climate Change Action Plans
UNIDO (2016) Independent Terminal Evaluation Promoting Ultra low-head Micro Hydropower Technology to
Increase Access to Renewable Energy for Productive Uses in Rural India Retrieved from UNIDO httpswwwunido
orgsitesdefaultfiles2016-12IND-120182_Promoting_ultra_low_head_hydropower_techn_TE_report-2016_0pdf
UNIDO (2018) Independent Mid-term evaluation Promoting energy efficiency and renewable energy in selected
micro small and medium enterprises (MSME) clusters in India Retrieved from UNIDO httpswwwunidoorgsites
defaultfilesfiles2018-09103029-Ind20MTE_Energy20Efficieny20MSME_0pdf
UNIDO (2019) Independent Terminal Evaluation GEF-UNIDO Cleantech programme for small and medium
enterprises in India Retrieved from UNIDO httpswwwunidoorgsitesdefaultfilesfiles2018-0912034520
GEF20UNIDO20Cleantech20Programme20for20SMEs20in20India_0pdf
Vigolo V Sallaku R and Testa F (2018) Drivers and Barriers to Clean Cooking A Systematic Literature Review
from a Consumer Behavior Perspective Sustainability 10(4322) Verona MDPI
World Bank (2018) Incentivizing a Sustainable Clean Cooking Market Lessons from a results-based financing pilot
in Indonesia Retrieved from World Bank httpdocuments1worldbankorgcurateden173331531226135009
pdf128162-WP-P144213-PUBLIC-WBIndonesiaRBFWEBpdf
copy 2020 SUSTAINABLE ENERGY FOR ALL
Vienna (Headquarters)Andromeda Tower 15th Floor
Donau City Strasse 6
1220 Vienna Austria
Telephone +43 676 846 727 200
Washington DC1750 Pennsylvania Ave NW
Washington DC 20006 USA
Telephone +1 202 390 0078
New York420 5th Ave
New York NY 10018 USA
Website wwwSEforALLorg
RIGHTS AND PERMISSIONSThe material in this work is subject to copyright Because SEforALL encourages dissemination of its knowledge this
work may be reproduced in whole or in part for noncommercial purposes if full attribution to this work is given to
Sustainable Energy for All (SEforALL) SEforALL does not guarantee the accuracy of the data included in this work
COPYRIGHT AND DISCLAIMER
ENERGIZING FINANCEENERGIZING FINANCE
MISSING THE MARK
ACKNOWLEDGEMENT
The report was commissioned by Sustainable Energy for All (SEforALL) The SEforALL team composed of Christine
Eibs Singer Olivia Coldrey Annette Aharonian and Tamojit Chatterjee worked in close collaboration with the South
Pole team who researched and wrote the report Martin Stadelmann Gaetan Hinojosa Isabel Hagbrink Marion
Allimant Frank Muci Yannick Pape Nata Tavonvunchai and Umdatul Mujahidah
We are grateful for substantive inputs received from the Steering Committee as this research effort evolved from
inception through publication Lyndree Malang (ADB) Kee-Yung Nam (ADB) Grace Yeneza (ADB) Monojeet Pal
(AfDB) Daniel Scroth (AfDB) Cyril Renault (AFD) Roberta Bove (CCA) Peter George (CCA) Michael Franz (GET
Invest) Regine Dietz (GIZ) Monika Rammelt (GIZ) Alex Evans (GLPGP) Silvia Francioso (GOGLA) Katrina Pielli
(Independent Consultant) Giorgio Gualberti (OECD) Jens Sedemund (OECD) Mark Correnti (Shine) Rianne Teule
(SNV) Wim van Nes (SNV) Usha Rao (UNDP) and Juliette Besnard (World Bank)
The report also benefitted from information and data received from numerous colleagues and survey respondents
We would to especially like thank Giorgio Gualberti and Jens Sedemund (OECD) for advice regarding data Valuable
guidance and oversight were provided by Damilola Ogunbiyi Chief Executive Officer and Special Representative of
the UN Secretary-General for Sustainable Energy for All
SEforALL is grateful to the IKEA Foundation the Austrian Development Agency the Ministry of Foreign Affairs of
Denmark the Ministry for Foreign Affairs of Iceland and the Charles Stewart Mott Foundation for their institutional
support to our work that has enabled the production of this report For a full list of SEforALL supporters please visit
our website at wwwSEforALLorg
FOREWORD 5EXECUTIVE SUMMARY 7INTRODUCTION 11 11 Background 12
12 Scope of the report 12
APPROACH 13 21 Statistical analysis 14
22 Limitations of the analysis 15
TRENDS IN DEVELOPMENT FINANCE FOR ENERGY 16 31 Overall trends 2013ndash2018 17
32 Trends from 2013ndash2018 for HICs for energy finance
commitments and disbursements 18
33 Trends from 2013ndash2018 by sub-sector 20
Commitments 20
Disbursements 21
34 Trends from 2013ndash2018 by donor 22
TRENDS IN DEVELOPMENT FINANCE FOR CLEAN COOKING 23DISBURSEMENT EFFICIENCY 26 51 Methodology 27
52 Data 27
53 Indicators 28
54 Results 29
ANALYSIS OF DISBURSEMENT CONSTRAINTS AND SOLUTIONS 35 61 Quantitative analysis of connection to Regulatory Indicators
for Sustainable Energy 36
62 Review of evaluation reports 37
63 Surveys 41
64 Summary of qualitative insights 44
ANNEX 47 Annex I Methodology 48
Annex II 54
Detailed methodology for the RISE correlation analysis 54
Detailed results 54
Annex III Review of evaluation reports 58
ABBREVIATIONS 59GLOSSARY 60BIBLIOGRAPHY 61
TABLE OF CONTENTS
1
2
3
4
5
6
TABLE 1 Survey respondentsrsquo recommendations to improve
disbursement efficiency 43
TABLE 2 Summary of disbursement constraints and policy recommendations 45
TABLE 3 Key data sources for the quantitative analysis 48
TABLE 4 Missing data for disbursement constraint analysis by donor 50
TABLE 5 Missing data for disbursement constraint analysis by recipient 51
TABLE 6 Missing data for disbursement constraint analysis by flow type 52
TABLE 7 Missing data for disbursement constraint analysis by number
of transactions per project 52
TABLE 8 Keywords ranked by quality 53
TABLE 9 Analysis grid for reports review 58
TABLE 10 Report review matrix 58
LIST OF TABLES
FIGURE 1 Growth of energy finance disbursements in HICs compared
to overall development finance disbursements 2013-2018 8
FIGURE 2 Energy finance commitments and disbursements for HICs 2013-2018 9
FIGURE 3 Energy projects delayed and financing delayed by recipient
2002-2018 9
FIGURE 4 Annual commitments and disbursements to energy and
overall development projects 17
FIGURE 5 Energy finance commitments and disbursements 2013-2018 18
FIGURE 6 Treemap of volume of energy finance disbursements
(in USD billion) to HICs by country 2013ndash2018 19
FIGURE 7 Share of energy finance commitments in HICs
by sub-sector 2013-2018 20
FIGURE 8 Energy finance disbursements to HICs per sub-sector 21
FIGURE 9 Clean cooking finance commitments and disbursements
to HICs 2013-2018 24
FIGURE 10 Improvements in clean cooking access and
clean cooking disbursements 2000-2016 25
FIGURE 11 Graphical interpretation of average project delay (APD) 28
FIGURE 12 Delays in energy sector financing and project implementation
2002-2018 29
LIST OF FIGURES
FIGURE 13 Projects delayed financing delayed
and APD by sub-sector 2002-2018 30
FIGURE 14 Percentage of projects delayed financing delayed
and APD by HIC 2002-2018 31
FIGURE 15 Projects delayed financing delayed and APD by
financing instrument 2002-2018 32
FIGURE 16 APD by project size for renewable generation projects 33
FIGURE 17 APD by project size for non-renewable generation projects 33
FIGURE 18 APD by project size for energy policy projects 34
FIGURE 19 APD by project size for energy distribution projects 34
FIGURE 20 Energy sector commitments per capita
and RISE scores HICs 2013-2018 55
FIGURE 21 Energy sector disbursements per capita
and RISE scores HICs 2013-2018 56
FIGURE 22 RE commitments per capita and RISE scores 57
FIGURE 23 RE disbursements per capita and RISE scores 57
FOREWORD
We know that 789 million people lack access to electricity
and 28 billion lack access to clean cooking These
access gaps translate into a poor individual quality of
life a deepening climate crisis and countriesrsquo inability to
protect their citizens and economies from the COVID-19
pandemic The stakes are high for immediate progress
on Sustainable Development Goal 7 (SDG7) which calls
for affordable reliable sustainable and modern energy
for all by 2030
There are two sides to the financing challenge of
closing energy access gaps First we need financial
commitments made to programmes designed to close
the gaps Second we need these funds to be disbursed
Until disbursements occur there is no positive impact
on the ground
Energizing Finance Missing the Mark 2020 identifies
gaps between commitments and disbursements of
development finance for energy in 20 countries in Africa
and Asia with the largest electricity and clean cooking
access deficits referred to as the high-impact countries
(HICs) There are many reports that focus on the finance
needed or committed to energy access this report
provides much-needed evidence on how efficiently
committed energy finance is disbursed
It shows that already insufficient levels of finance
commitments for energy access are suffering from
woeful lags in disbursement This inhibits progress on
SDG7 which as we know enables all other SDGs While
USD 52 billion in energy finance was committed to
these countries between 2013 and 2018 disbursements
totalled only USD 32 billion over the same period
The cumulative effect of disbursement lags combined with
continuing shortfalls in commitments to financing energy
access in the HICs as identified in Energizing Finance
Understanding the Landscape 2020 means the world is
on track to miss the 2030 SDG7 deadline by decades
5ENERGIZING FINANCE MISSING THE MARK 2020
Photo by Asian Development Bank
6ENERGIZING FINANCE MISSING THE MARK 2020
This report finds that while investment delays have
declined overall since 2002 fully 58 percent of planned
financing to the energy sector and 49 percent of projects
in HICs were delayed from 2002 to 2018 This is both
astonishing and unacceptable and should galvanise a
full range of stakeholders to devise solutions to ensure
critical energy access initiatives receive the financing
they need ndash on schedule ndash to proceed
The true value of Energizing Finance Missing the
Mark 2020 is not that it unearths disbursement lags
It also identifies the causes of these lags which exist
throughout the entire energy access ecosystem By
examining the experiences of projects and programmes
in India Madagascar Myanmar Nigeria and Rwanda the
report brings to light how factors such as a strong local
financial services sector well-organized administrative
processes robust institutions and regulations and good
coordination underpin efficient disbursement These
are valuable insights for policymakers development
financiers donors and project developers alike
This report gives these stakeholders a series of
recommendations to act on including improving initial
project design simplifying administrative processes
facilitating stakeholder interaction and creating an
enabling environment to fast-track disbursements It
also stresses the need for stakeholders to collaborate
on building standardized tracking indicators for energy
finance disbursement so that constraints can be
identified and addressed swiftly
The findings and advice contained in Energizing Finance
Missing the Mark 2020 could not come at a more critical
time for the international community grappling as it is
with strategies for how to best-respond to COVID-19 to
ensure developing countries do not fall further behind
economically Increased access to sustainable energy
should be a central part of those strategies and access
can only increase if we address current bottlenecks that
delay the disbursement of energy access finance
DAMILOLA OGUNBIYICEO and Special Representative of the UN Secretary-General for Sustainable
Energy for All and Co-Chair of UN-Energy
RENAT HEUBERGERCEO and Founding Partner
South Pole
7ENERGIZING FINANCE MISSING THE MARK 2020
EXECUTIVE SUMMARY
Access to affordable reliable clean safe and sustainable
energy is critical to improving the living conditions of
people around the world Today an estimated 789
million people still do not have access to affordable and
reliable electricity sources and 28 billion people1 are
without clean cooking facilities2 greatly affecting their
quality of life International climate and development finance can help reduce energy finance deficits for both electricity and clean cooking but what happens if the funds are pledged but never disbursed
This report identifies the gaps between commitments
and disbursements of development finance for
energy3 as tracked in the OECD Creditor Reporting
System (CRS) database This database consists of
official development finance and private development
finance from philanthropies It assesses the efficiency
of disbursement both in terms of the percentage of
financial commitments that suffer disbursement delays
and the number of projects that experience delayed
implementation Through a qualitative lens the report
also identifies reasons why development finance
disbursement constraints occur
Monitoring the disbursement gap is important because while commitments reflect ambition only disbursements actually deliver impact on the ground Since Sustainable Development Goal 7 (SDG7) is heavily
linked to finance mdash specifically the disbursement of
funds mdash it is vital to examine the efficiency with which
finance is actually disbursed to achieve energy targets
This Energizing Finance Missing the Mark 2020 report
is a new edition of the Energizing Finance Missing the
Mark 2017 report and focuses on 20 countries in Africa
and Asia that are classified as high-impact countries4
(HICs) by Sustainable Energy for All (SEforALL) HICs
are the countries with the most significant electricity
and clean cooking access deficits and therefore
need substantial international and national support
Energizing Finance Missing the Mark 2020 numbers
are not directly comparable to the findings from the
Energizing Finance Understanding the Landscape 2020
report which tracks finance commitments to energy
from a broader group of data sources including private
investment5
1 ESMAPrsquos State of Access to Modern Energy Cooking Services 2020 report released in September 2020 finds that four billion people around the world still lack access to clean efficient convenient safe reliable and affordable cooking energy with 125 billion considered in transition and the other 275 billion facing significantly higher barriers to access2 ldquoAccess to affordable reliable sustainable and modern energy for all ndash Access to clean cookingrdquo SDG7 ndash Data and projections International Energy Agency (IEA) 18 May 2020 httpswwwieaorgreportssdg7-data-and-projectionsaccess-to-clean-cooking3 A clear and reliable distinction between electricity and clean cooking data was not possible due to CRS data classification constraints As such the report refers to energy rather than solely electricity4 For electricity the countries are Angola Bangladesh Burkina Faso Chad Congo (DR) Ethiopia India Kenya Korea (DPR) Madagascar Malawi Mozambique Myanmar Niger Nigeria Pakistan Sudan Tanzania Uganda and Yemen For clean cooking the countries are Afghanistan Bangladesh China Congo (DR) Ethiopia Ghana India Indonesia Kenya Korea (DPR) Madagascar Mozambique Myanmar Nigeria Pakistan Philippines Sudan Tanzania Uganda and Vietnam5 Energizing Finance Missing the Mark 2020 includes only the OECDrsquos CRS data due to the reportrsquos focus on disbursement numbers which only the CRS database provides As a result the energy sector commitment statistics from both reports are not directly comparable
MAIN FINDING 1 Disbursements for energy in HICs have increased much faster than overall development finance disbursements Disbursements for energy projects in HICs increased by more than 61 percent between 2013 and 2018 This is much faster than overall
development finance disbursements over the same period in the same
countries which was about a 12 percent increase (see Figure 1)
EXECUTIVE SUMMARY
8ENERGIZING FINANCE MISSING THE MARK 2020
Energy finance disbursements continue to significantly lag behind commitmentsDespite a trend in growing energy finance disbursements disbursements (USD 32 billion) still substantially lagged commitments (USD 52 billion) in the period 2013 to 2018 (see Figure 2) Given
the continued low levels of commitments for energy finance the lag
in disbursements only compounds the lack of finance flowing to the
sector leaving many HICs further and further behind The message is
clear significantly increased disbursements at approximately USD 45
billion per year6 between 2020 and 2030 are urgently needed to meet
SDG7 energy access targets Aggregate disbursements from 2013-2018
(USD 32 billion) were insufficient to cover even one year of the annual
investment need of USD 45 billion
6 IEA International Renewable Energy Agency United Nations Statistics Division World Bank WHO (2020) Tracking SDG 7 The Energy Progress Report World Bank Washington DC
EXECUTIVE SUMMARY
FIGURE 1Growth of energy finance disbursements in HICs compared to overall development finance disbursements 2013-2018
Source South Pole 2020 based on OECD CRS data
Gro
wth
rate
(100
=201
3 ba
selin
e)
170
160
150
140
130
120
110
100
2013 2014 2015 2016 2017 2018
Energy finance disbursements in HICs Overall development finance disbursements
90
80
MAIN FINDING 2
9ENERGIZING FINANCE MISSING THE MARK 2020
FIGURE 3Energy projects delayed and financing delayed by recipient 2002-2018
Finance Delayed () Projects Delayed ()
Madag
ascar
Yemen
Banglad
esh
Tanzan
ia
Uganda
India
Congo (D
R)
Pakist
anKen
ya
Mozambique
Ethiopia
Malawi
Myanmar
3337 37
574849 50 49 48
4051 53 49
4155 55 5256 6057
67 70 7381
94 96
0
100
50
Source South Pole 2020 based on OECD CRS dataNote Six of the 20 HIC countries are not shown here as incomplete data on commitments accounted for more than 50 percent of total commitments
On average disbursement delays have declined since 2002 Project delays and delayed disbursements were often seen as interlinked
While there has been a slight decline in disbursement delays they remain substantial 58 percent of planned disbursements to the energy sector and 49 percent of projects in HICs were delayed in the period 2002ndash2018 This is a slight improvement on the findings
in Energizing Finance Missing the Mark 2017 which reported that 69
percent of planned disbursements were delayed and 52 percent of
projects were affected by disbursement delays
FIGURE 2Energy finance commitments and disbursements for HICs 2013-2018
Source South Pole 2020 based on OECD CRS data
USD
(bill
ions
)
12
10
8
6
4
2
02013 2014 2015 2016 2017 2018
Commitments Disbursements
EXECUTIVE SUMMARY
These delays seem pervasive as they do not stem only from a few large projects almost half of all energy sector projects (49 percent) in HICs since 2002 were delayed In the 13 countries with sufficient data Myanmar had the
longest average delay and Madagascar had the shortest (see Figure 3)
MAIN FINDING 3
10ENERGIZING FINANCE MISSING THE MARK 2020
Project-specific factors such as sound project design including consideration for limited local financial services and good coordination among key actors are crucial to efficient disbursementTo understand disbursement delays better this study looked at evaluation
reports and databases and conducted interviews and surveys as part of
deep-dives in five countries (India Madagascar Myanmar Nigeria and
Rwanda) These countries were selected for their geographic diversity
different stages of development and different income and energy access
levels
EXECUTIVE SUMMARY
MAIN FINDING 4
Survey respondents highlighted the significance of project-related factors for low disbursements including
bull Cumbersome administrative processes and lack of capacity among donors and implementing entities For example a Global Environment Facility (GEF)-UNDP project aimed at reducing greenhouse
gas (GHG) emissions in the Indian states of Jharkhand and Manipur was not as successful as
expected because of significant delays due to administrative processes (delayed clearance) at
the federal level notably from the Department of Economic Affairs
bull Design flaws that hinder project execution For example the Promoting Renewable
Energy Programme (PREP) in Rwanda and particularly its sub-project on biodigesters faced
disbursement delays because the initial project design was not adapted to local end usersrsquo capacity
and consumption habits Failing to consider potentially limited local access to financial and banking
services in project design may also present disbursement and implementation constraints
In summary insufficient committed investment coupled with continued disbursement delays and project-specific
weaknesses jeopardize achievement of SDG7 targets and the provision of energy for the most vulnerable in society
Not only is there a pressing need to significantly increase finance commitments to the energy sector as set out in
SEforALLrsquos report Energizing Finance Understanding the Landscape 2020 it is also imperative to increase the speed of disbursing energy finance It bears repeating that only disbursed money can have an impact on the ground
POLICY RECOMMENDATIONS
This report recommends that national policymakers bilateral and multilateral development agencies and financial
institutions take the following steps to accelerate the disbursement of energy finance
bull It is imperative that national policymakers improve the country-level factors that can accelerate disbursements for energy projects including policies and programmes that improve access to local finance
bull Donors and development finance institutions (DFIs) should combine investment programmes with technical assistance and capacity building for recipient countries and institutions to increase the efficiency of
disbursement at country level
bull Donors and their agencies and DFIs and recipient countries should invest more in sound project feasibility assessment and design and simplify administrative processes to make them more efficient
bull The OECD and its members particularly multilateral development banks should introduce more precise and standardized tracking indicators for energy access finance disbursements to better measure progress
This will help the global community identify underlying reasons for inefficient disbursement and will inform
mitigation actions
11
1CHAPTER
INTRODUCTION
Phot
o by
Asi
an D
evel
opm
ent B
ank
12ENERGIZING FINANCE MISSING THE MARK 2020
BACKGROUND
Access to affordable reliable clean safe and sustainable
energy is an integral component of the UN Sustainable
Development Goals (SDGs) In 2020 it is estimated that
789 million people do not have access to an affordable
and reliable electricity source and 28 billion people are
without clean cooking facilities7 There is an urgent need
to address this critical lack of access to electricity and
clean cooking to improve living conditions for people
around the world and meet the targets set out in SDG7
The flow of international climate and development
finance targeting electricity and clean cooking access in
developing countries is a key component in supporting
action toward SDG7
In this context SEforALL and its partners produce a
series of reports under the auspices of the Energizing
Finance research series which provide a systematic
analysis of finance flows and market trends in developing
countries The reports include
Understanding the Landscape (Tracking Finance
for Electricity and Clean Cooking in High-Impact
Countries)
Missing the Mark (Identifying Gaps and Lags in
Disbursement of Development Finance for the
Energy Sector)
Taking the Pulse (Understanding Energy Access
Market Needs in Five High-Impact Countries)
These reports were first published in 2017 New editions
of Energizing Finance Understanding the Landscape
have been published annually since 2017 and a second
edition of Taking the Pulse was published in 2019 This
is the second edition of the Energizing Finance Missing
the Mark report
The reports focus on 20 countries in Sub-Saharan Africa
and Asia with the highest energy access deficits (referred
to as high-impact countries (HICs) These countries are
facing important difficulties in accessing electricity and
clean cooking solutions and are consequently those most
in need of international and national development finance
SCOPE OF THE REPORT
In this context Energizing Finance Missing the Mark
2020 provides an updated understanding of the
gaps between public sector development finance
commitments and disbursements relating to energy
projects in HICs while also identifying the barriers that
prevent efficient disbursements based on a six-year
period of analysis (2013ndash2018) The ultimate goal is to inform policy and finance decision-makers to enable them to take action to improve disbursement efficiency and thereby accelerate the deployment of funds for energy projects
This report builds on Energizing Finance Missing the
Mark 2017 Section 2 summarizes the approach and
methodology then Sections 3 and 4 present energy and
clean cooking commitment and disbursement trends
Section 5 investigates disbursement delays and how
they differ by country sector and recipient
Finally Section 6 examines additional quantitative
and qualitative inputs to aid the understanding
of disbursement gaps and provides policy
recommendations to facilitate disbursements
Specifically the analysis tests the strength of the
correlation between the World Bankrsquos Regulatory
Indicators for Sustainable Energy (RISE) scores and
disbursement rates and reviews disbursement
efficiency through an analysis of evaluation reports
databases and the results of semi-structured interviews
and surveys
7 Tracking SDG7 The Energy Progress Report 2020 Accessible at httpstrackingsdg7esmaporgdownloads
CHAPTER 1 INTRODUCTION
bull
bull
bull
13
2CHAPTER
APPROACH
Phot
o by
Asi
an D
evel
opm
ent B
ank
14ENERGIZING FINANCE MISSING THE MARK 2020
CHAPTER 2 APPROACH
STATISTICAL ANALYSIS
This reportrsquos statistical analysis is based on data from the
OECDrsquos Creditor Reporting System (CRS) database which
contains data on development finance commitments
and disbursements for energy and energy access
projects While the Energizing Finance Understanding
the Landscape report considers additional data sources
Energizing Finance Missing the Mark analyses only CRS
data due to the reportrsquos focus on disbursement data
which only the CRS database provides This means
that for the purposes of this report commitment
and disbursement data only include data from donor
countries multilateral institutions and multilateral and
bilateral development finance institutions (DFIs) as
reported in the OECD CRS database This does not
include finance from corporates impact investors or
overseas development finance from China India or
Russia This means that figures in this report relating
to finance commitments cannot be directly compared
with those in the Energizing Finance Understanding
the Landscape 2020 report as that report draws from a
broader set of data sources
The trend analysis uses the most recent available data
and covers the six-year period between 2013 and 2018
The disbursement constraints analysis examines a longer
period from 2002 to 2018 to account for the fact that
disbursement of funds for a project may be scheduled
over several years
The CRS database categorizes projects by their
purpose through a code system For energy projects
only the projects coded under lsquo230 II3 Energy Totalrsquo
were considered As the CRS data do not provide a
categorization of clean cooking projects such projects
were identified in the entire dataset by a keyword
search algorithm Data collection includes financial
flows concerning commitments disbursements
disbursement schedules transaction dates project start
and completion dates and basic flow characteristics
(donor recipient country and project purpose) Key
terms are described in the Glossary
The trend analysis assesses close to 45000 energy
sector transactions8 and over 1700 transactions for
clean cooking between 2013 and 2018 for all recipient
countries (not just HICs) For the disbursement
constraints analysis between 2002 and 2018 nearly
7000 projects were analysed All data are presented in
2018 USD
The analysis also includes a review of the World Bankrsquos
Regulatory Indicators for Sustainable Energy (RISE)
RISE scores reflect a countryrsquos policies and regulations
in the energy sector and act as a reference point for
policymakers to develop policies and regulations that
advance sustainable energy goals This analysis attempts
to assess whether (and if so to what extent) there are
parallels between RISE scores (or their evolution over
time) and the commitmentdisbursement gap
Details of the methodology used for the statistical
analysis are provided in Annex I
8 Transactions are individual record lines in the CRS database that describe either a commitment or a disbursement a single project could have multiple transactions
15ENERGIZING FINANCE MISSING THE MARK 2020
LIMITATIONS OF THE ANALYSIS
The analysis is limited by the completeness and quality
of the data notably the availability in the CRS database
of a projectrsquos characteristics eg commitment amount
disbursement amount dates of transactions and
expected end date In addition disbursement transaction
data are recorded only on a yearly basis which limits
the lsquoresolutionrsquo and accuracy of disbursement delays
Recording and reporting transaction data on a quarterly
or monthly basis would increase the accuracy of the
analysis
As the CRS database classification is not well suited to
researching clean cooking projects (ie there is no lsquoclean
cookingrsquo category) a multi-step keyword search was used
to identify clean cooking projects in the database As a
result the data selectioncollection may be imperfect
as there is the risk of incorrectly excluding projects that
are clean cooking related and incorrectly including
projects that are not clean cooking related or only
have a minor clean cooking component For example
Energizing Finance Understanding the Landscape 2019
reported an estimated public finance commitment of
USD 108 million for residential clean cooking access
for 2015ndash2016 This is far higher than the clean cooking
commitment figures from the CRS database discussed
in Section 4 This difference highlights the challenge of
capturing all clean cooking data in the CRS database
without a lsquoclean cookingrsquo category See Annex I for
more details Finally as was also noted in the Energizing
Finance Missing the Mark 2017 analysis the CRS
coding system is also less suited to distinguishing and
tracking off-grid disbursements Nonetheless the CRS
remains the most complete database of information for
development finance for the energy sector The ability
to track successful disbursement of commitments to
clean cooking and off-grid projects would benefit from
a database that specifically categorizes such projects
As a result of recommendations arising from Energizing
Finance in 2017 and following consultations with the
OECD a clean cooking isolated grids and standalone
systems category will be implemented for data from
2019 onwards to facilitate such analysis
CHAPTER 2 APPROACH
16
3CHAPTER
TRENDS IN DEVELOPMENT FINANCE
FOR ENERGY
17ENERGIZING FINANCE MISSING THE MARK 2020
This section presents the findings of trend characteristics for development finance for energy between 2013 and 2018
which mainly includes electricity but also some clean cooking projects9 A clear and reliable distinction between electricity and clean cooking data was not possible due to Creditor Reporting System (CRS) data classification constraints As such this section refers to development finance for energy rather than electricity
The share of commitments to the energy sector as a
proportion of overall development finance commitments
globally also rose from 8 percent in 2013 to 9 percent
in 2018 This share peaked at 12 percent in 2016 when
overall annual development finance commitments
stood at USD 303 billion and annual energy-specific
commitments at USD 36 billion However these annual
differences reflect a natural variation in project-based
finance rather than a broader market trend
CHAPTER 3 TRENDS IN DEVELOPMENT FINANCE FOR ENERGY
FIGURE 4Annual commitments and disbursements to energy and overall development projects
Amou
nt U
SD (m
illio
n)
350000
300000
250000
200000
150000
100000
50000
0
40000
35000
30000
25000
20000
15000
10000
5000
02013 2014 2015 2016 2017 2018
Overall development commitments (Left hand side) Overall development disbursements (Left hand side)
Energy commitments (Right hand side) Energy disbursements (Right hand side)
9 See Glossary for more details
Source South Pole 2020 based on OECD CRS data
OVERALL TRENDS 2013ndash2018
Between 2013 and 2018 globally both overall
development finance commitments and energy
commitments increased (see Figure 4) Overall
development finance commitments and disbursements
increased steadily over this period In 2018 overall
development finance commitments to all recipient
countries stood at USD 324 billion up from USD 249
billion in 2013
18ENERGIZING FINANCE MISSING THE MARK 2020
10 Disbursement data do not allow for a distinction between funds being applied to implementation or pending in the beneficiaryrsquos bank accounts11 A non-HIC is a recipient country that is not considered an HIC for either energy transactions or clean cooking transactions There are 152 non-HICs for energy and 115 non-HICs for clean cooking
Energy sector finance commitments also increased
between 2013 and 2018 These grew at a higher rate (43
percent) than overall development finance (30 percent)
This report notes that energy development finance
commitments have been steadily decreasing since
2016 While this may not indicate a longer-term trend
it is important to monitor in the context of achieving
SDG7 particularly in high-impact countries (HICs) with
significant electricity and clean cooking access deficits
where substantial international and national finance to
help increase access is required most
For disbursements10 the difference in growth between
overall and energy-specific finance is even more
significant Between 2013 and 2018 disbursements
increased by 28 percent for overall development
finance and by 55 percent for development finance for
the energy sector This shows that disbursements for
energy related development finance increased not only
at a faster rate than commitments but also faster than
overall development finance disbursements
TRENDS FROM 2013ndash2018 FOR HICS FOR ENERGY FINANCE COMMITMENTS AND DISBURSEMENTS
More energy development finance commitments and
disbursements reach non-HICs11 than HICs (Figure 5) This
can be expected since there are many more non-HICs
than HICs for energy and clean cooking Figure 5 gives
a sense of the evolution of the share of commitments for
HICs and non-HICs In 2013 only 25 percent of energy
related development finance commitments went to HICs
with 75 percent going to non-HICs However there are
signs that suggest HICsrsquo share of total development
finance commitments for energy has been gradually
increasing rising to 34 percent in 2018 This represents
an increase of USD 49 billion over the 2013ndash2018 period
FIGURE 5Energy finance commitments and disbursements 2013-2018
Source South Pole 2020 based on OECD CRS data
Commitments to non-HICsCommitments to HICs
Disbursements to non-HICsDisbursements to HICs
Am
ount
USD
(bill
ions
) 30
35
40
25
25
20
20
15
15
10
10
55
0 0
2013 20132014 20142015 20152016 20162017 20172018 2018
53
156185
224 222196
265
10778
97 88 102
39
93103
152 158142 142
50 53 56 64 64
CHAPTER 3 TRENDS IN DEVELOPMENT FINANCE FOR ENERGY
19ENERGIZING FINANCE MISSING THE MARK 2020
In terms of disbursement the report also observes
a positive growth trend between 2013 and 2018
Disbursements for energy projects to HICs have
grown at a more rapid rate (61 percent growth) than
disbursements to non-HICs (52 percent growth) While
the share of disbursements for energy projects going to
HICs has stagnated at around 30 percent disbursements
still increased by USD 24 billion in absolute terms over
the 2013ndash2018 period
India Pakistan and Bangladesh recorded the largest
volumes of disbursements for development finance
relating to energy out of all HICs These three countries
accounted for 61 percent of the disbursements to all
HICs in the 2013ndash2018 period with 30 percent 16
percent and 15 percent respectively (see Figure 6)
Comparing the volume of disbursements for each
country between 2013 and 2018 against their respective
commitment figures allows for the calculation of a
disbursement-to-commitment ratio for development
finance over the 2013ndash2018 period For India the
disbursement-to-commitment ratio from 2013 to 2018
was 67 percent suggesting that 67 percent of recorded
commitments were disbursed For Pakistan and
Bangladesh this ratio was 60 percent and 52 percent
respectively
The average disbursement-to-commitment ratio for
HICs between 2013 to 2018 was 62 percent First this
result suggests a welcome improvement in disbursement
efficiency since 2017 given the data from Energizing
Finance Missing the Mark 2017 resulted in a ratio of 53
percent Second it was found that non-HICs disbursed
63 percent of development finance for energy which
would suggest that HICs and non-HICs are on average
equally efficient at disbursing such finance However
this disbursement-to-commitment ratio has significant
limitations given it does not allow for intertemporal
comparisons For instance it includes disbursements
of commitments recorded between 2013 and 2018 but
not for commitments that were announced before 2013
as well as commitments that may have disbursements
scheduled after 2018 Consequently this metric needs
to be interpreted with caution Disbursement efficiencies
are further explored in Section 5 of this report
CHAPTER 3 TRENDS IN DEVELOPMENT FINANCE FOR ENERGY
FIGURE 6Treemap of volume of energy finance disbursements (in USD billion) to HICs by country 2013ndash2018
Source South Pole 2020 based on OECD CRS data
India9644
Bangladesh5048
Pakistan5323
Kenya2361
Angola1254
Yemen1136
Mozambique 795
Tanzania1355
Nigeria 1066
Ethiopia1116
Uganda719
Sudan 267
Myanmar458
Malawi404
Burkina Faso388
Niger199
Madagascar137
Congo (DR) 936
20ENERGIZING FINANCE MISSING THE MARK 2020
TRENDS FROM 2013ndash2018 BY SUB-SECTOR
The analysis of commitment and disbursement data per
energy sub-sector13 in the OECD CRS database shows
the following trends for renewable energy (RE) and non-
RE generation in the period 2013ndash2018
bull Disbursements for non-RE generation have steadily increased since 2013 However finance
commitments for non-RE generation have not
increased in the same way and only saw a net
marginal increase of USD 150 million between
2013 and 2018
bull The growth in commitments for RE generation between 2013 and 2018 (133 percent) is not in sync with the far more modest growth in disbursements in the same period (12 percent)
though this may generally be explained by the
delay between commitment and disbursements
After a steady increase since 2014 disbursements
for RE generation actually decreased in 2018
The following section analyses the commitment and
disbursement figures in more detail
Commitments
Between 2013 and 2018 45 percent of all new energy
finance commitments in HICs were directed toward
distribution projects followed by 26 percent for RE
generation and 16 percent for energy policy and
administrative management New commitments to
non-RE generation totalled only 13 percent of new
commitments for the 2013ndash2018 period down from 23
percent in 2013
FIGURE 7Share of energy finance commitments in HICs by sub-sector 2013-2018
Source South Pole 2020 based on OECD CRS data
13 The data are split by energy policy (includes education training research conservation) energy generation mdash renewable sources (includes wind marine geothermal solar for centralized grids or hydro) energy generation mdash non-renewable sources (includes coal-fired electric power plants oil-fired electric power plants natural gas-fired electric power plants or non-renewable waste power plants) and energy distribution (includes heat plants district heating and cooling centralized transmission and distribution retail gas distribution) The OECD CRS categorization did not allow for a detailed segmentation for off-grid projects Newly introduced OECD CRS purpose codes for 2019 data will include a category specific to isolated grids and standalone systems
Energydistribution
45
Energy policy16
Energy generationrenewable sources26
Energy generationnon-renewable sources13
CHAPTER 3 TRENDS IN DEVELOPMENT FINANCE FOR ENERGY
21ENERGIZING FINANCE MISSING THE MARK 2020
Disbursements
On the disbursements side non-RE generation saw a
steady increase from 2013ndash2018 and overtook energy
policy disbursements Between 2013 and 2018 annual
commitments for non-RE generation in HICs rose by
just USD 150 million while disbursements rose by USD
800 million (Figure 8) This may reflect the realization
of numerous multilateral development bank and
development finance institution (DFI) policies moving
away from new coal-fired project commitments14 as
well as a likely indication of a multi-year time lag
between commitments and disbursements which is
consistent with past data For instance it was found
that the median duration of World Bank energy sector
project investments was nine years which provides
insights to the disconnect between commitments and
disbursements as well as affecting the potential for
improving energy access15 This is further explored in
Section 5
14 httpsurgewaldorgenmedienworld-bank-annual-meeting-bank-invested-over-105-billion-fossil-fuels-paris-agreement15 World Bank Group Support to Electricity Access FY2000ndashFY2014 httpsiegworldbankgrouporgsitesdefaultfilesDatareportsElectricity_Accesspdfnt
FIGURE 8Energy finance disbursements to HICs per sub-sector
Energy Policy
Energy generation non-renewable sources
Energy generation renewable sources
Energy distribution
Amou
nt U
SD (m
illio
n)
3500
3000
2500
2000
1500
1000
500
-2013 2014 2015 2016 2017 2018
Source South Pole 2020 based on OECD CRS data
CHAPTER 3 TRENDS IN DEVELOPMENT FINANCE FOR ENERGY
22ENERGIZING FINANCE MISSING THE MARK 2020
TRENDS FROM 2013ndash2018 BY DONOR
International institutions and multilateral development
organizations account for a greater share of development
finance commitments for the energy sector than nation
states Six of the ten highest contributing funders to
energy projects in HICs between 2013 and 2018 were
multilateral development banks and international
finance institutions including members of the World
Bank Group The top contributing funders to HICs
included the Asian Development Bank (ADB) (20
percent) and the World Bank Group members
International Development Association (IDA) (18
percent) International Finance Corporation (IFC)
and the International Bank for Reconstruction and
Development (IBRD) (both 6 percent) Among nation
states the top donors included Japan (13 percent)
Germany (8 percent) and France (4 percent)
In terms of disbursements the ADB was also top of
the list accounting for 21 percent (USD 68 billion) of
disbursements between 2013 and 2018 This is likely
due to the high share of finance flowing into three Asian
HICs Bangladesh India and Pakistan as mentioned in
the previous section The IDA was the second highest
funder (USD 58 billion) in terms of disbursements
between 2013 and 2018 It has vastly increased its
share of commitments to HICs since 2016 more than
doubling its contribution share from 2017 (15 percent)
to 2018 (31 percent)
While major disbursement trends could not be identified
due to the high annual variability of data this report
notes the following observations The United Arab
Emirates disbursed only USD 2 million in 2013 and 2014
combined but disbursed as much as USD 187 million in
2015 and was the 11th largest donor in terms of total
disbursements between 2013 to 2018 Within the top
10 the biggest consistent increases in disbursements
between 2013 and 2018 came from Japan and France
CHAPTER 3 TRENDS IN DEVELOPMENT FINANCE FOR ENERGY
4CHAPTER
TRENDS IN DEVELOPMENT FINANCE
FOR CLEAN COOKING
23
Phot
o by
Cle
an C
ooki
ng A
llian
ce
24ENERGIZING FINANCE MISSING THE MARK 2020
As noted earlier in this report the identification of clean
cooking transactions in the Creditor Reporting System
(CRS) data poses challenges With these limitations in
mind the analysis shows that only USD 148 million was
committed to 144 clean cooking projects16 to clean
cooking projects in high-impact countries (HICs) in the
2013ndash2018 period with disbursements of USD 177
million (Figure 9)
Current clean cooking investments with around USD 30
million of development finance disbursements per year
(2013ndash2018 average) are still orders of magnitude far
below the USD 45 billion annual investment required17
to achieve universal clean cooking access by 2030 These
numbers highlight that a radical uptake in clean cooking
commitments and disbursements is urgently required to
cover past and current investment shortfalls as well as
to meet future investment needs to achieve SDG7 The
woefully small volume of commitments and disbursements
suggests that clean cooking continues to be a low priority
issue for development partners and donors
Disbursements exceeded commitments in 2016 and
2017 which is indicative of a multi-year time lag between
commitments and disbursements As countries fall
further behind in attracting the volume of finance they
require for SDG7 the cumulative lag in disbursements
further amplifies the reality of low commitments and
exacerbates an already dire situation This issue is all
the more significant as the State of Access to Modern
Energy Cooking Services18 report finds that four billion
people around the world still lack access to clean
efficient convenient safe reliable and affordable
cooking solutions
CHAPTER 4 TRENDS IN DEVELOPMENT FINANCE FOR CLEAN COOKING
FIGURE 9Clean cooking finance commitments and disbursements to HICs 2013-2018
Amou
nt in
USD
(mill
ion)
60
70
80
90
100
50
40
30
20
10
02013 2014 2015 2016 2017 2018
Commitments Disbursements
16 This figure cannot be directly compared to the Energizing Finance Understanding the Landscape findings as Missing the Mark looks only at OECD CRS data for disbursement data purposes 17 World Energy Investment IEA 201918 The State of Access to Modern Energy Cooking Services report 2020
Source South Pole 2020 based on OECD CRS data
25ENERGIZING FINANCE MISSING THE MARK 2020
Lack of data precludes a rigorous trend analysis of
development finance disbursements for clean cooking
Yet as Figure 10 below shows countries such as
Vietnam and Indonesia have managed to increase the
share of their populations with clean cooking access
by 50 percentage points between 2000 and 2016 with
less than USD 020 in clean cooking disbursements
per inhabitant19 while Uganda did not improve clean
cooking access at all despite receiving close to USD
1 per inhabitant in the same period Figure 10 even
suggests graphically at least that there is no strong
positive correlation between the disbursement amount
per inhabitant and an increase in the share of the
population with access to clean cooking This challenges
the hypothesis that increased disbursements of clean
cooking finance alone directly lead to increased access
However this observation needs to be interpreted with
great caution until a dedicated econometric analysis is
conducted
CHAPTER 4
19 Data on clean cooking access are from the World Bankrsquos World Development Indicators The 2000ndash2016 period is considered to capture a greater share of clean cooking development assistance in the CRS data The clean cooking access variable has no coverage beyond 2016
TRENDS IN DEVELOPMENT FINANCE FOR CLEAN COOKING
Source South Pole 2020 based on the World Bankrsquos World Development Indicators
FIGURE 10Improvements in clean cooking access and clean cooking disbursements 2000-2016
Total Clean Cooking Disbursements per Inhabitant (USD per person)
00 05 10 15 20 25
Change in Population Share with Clean Cooking Access (
)0
10
20
30
40
50
60
Indonesia
Vietnam
Sudan
India
PakistanGhana
MyanmarChinaBangladesh
PhilippinesNigeria
Congo (DR)Madagascar
Kenya
UgandaEthiopia Tanzania
Afghanistan
5CHAPTER
DISBURSEMENT EFFICIENCY
26
27ENERGIZING FINANCE MISSING THE MARK 2020
CHAPTER 5 DISBURSEMENT EFFICIENCY
METHODOLOGY
Development interventions in the energy sector have
historically been large and are typically scheduled
over multiple years after an initial commitment As a
result project-level data are required to assess the
extent to which disbursements are made on time after
funds are initially committed and payments scheduled
To that end transactions from the OECD Creditor
Reporting System (CRS) database were grouped into
projects using a matching algorithm The algorithm
was designed to group transactions into projects in a
multi-step process that included donor name project
title and CRS transaction ID This yielded a high-quality
initial grouping (see Annex I for a full presentation of
the methodology) The database was then transformed
from a series of transactions to project-level information
to perform the disbursement constraints analysis
DATA
Over 19000 energy transactions from the CRS database
were assessed for high-impact countries (HICs) in the
2002ndash2018 period Through the matching algorithm
these transactions were grouped into 6700 projects
with USD 92 billion in commitments Around 2500
projects (37 percent of the total) with USD 65 billion
in commitments (71 percent of the total) had sufficient
information20 to be meaningfully analysed in terms of
disbursement efficiency
As a result some donor countries institutions
recipients and transaction types are under-represented
in the analysis The analysis found that 20 percent of the
commitments that were without sufficient information
and were therefore excluded from the analysis came
from the Asian Development Bank (ADB) followed by
the International Development Association (IDA) (19
percent) and Japan (13 percent) (see Table 5 Annex I)
Some donors also systematically reported transactions
to the CRS database in a way that made them
unsuitable for a disbursement constraints analysis This
is the case for instance with the International Finance
Corporation (IFC) and the ADB where 100 percent of
their commitments had insufficient information to be
meaningfully analysed for disbursement efficiency As
a result some donors are not represented at all which
affects the completeness of the analysis Finally around
half of the commitments excluded are loans while just
over a third are Other Official Flows (OOF) and the rest
are grants (see Table 7 Annex I) Some country-level
results cannot be interpreted due to data limitations
In Angola Korea (DPR) and Sudan for example over
90 percent of energy sector development finance
commitments lack sufficient data to be analysed so
the results mdash which are based on the remaining 10
percent of commitments that can be analysed mdash are not
meaningful See Table 5 Annex I for more details
As a recommendation future analyses of the OECD CRS
data would benefit from more complete and consistent
transaction-level information for key variables21 to
allow for a higher-quality grouping of transactions into
projects and to minimize the exclusion of projects from
project-level analyses Incomplete data hampered the
assessment of disbursement efficiencies and affected
the pertinence of observations and recommendations
Further the CRS data would benefit from recording
transaction data on a quarterly or monthly basis (rather
than yearly) to improve the accuracy of the disbursement
efficiency assessment
Bangladesh India and Pakistan received the most
development finance that could not be considered in the
analysis due to missing data with 28 percent 21 percent
and 21 percent respectively of the commitments to those
countries excluded and 62 percent 65 percent and 62
percent respectively of projects excluded Together
Bangladesh India and Pakistan account for over half of
the development finance that does not contain enough
information to be subjected to the disbursements
constraints analysis (see Table 6 Annex I)
20 Over 90 percent of projects that were excluded are missing either an expected start date an expected end date or both21 These include but are not limited to project number CRS ID project title project purpose and flow type
28ENERGIZING FINANCE MISSING THE MARK 2020
INDICATORS
To assess disbursement delays two indicators were
constructed as in the 2017 edition of Energizing
Finance Missing the Mark
The first indicator is a binary variable that identifies projects that are delayed This variable simply records
whether a project is delayed and does not capture the
severity of the delay
The indicator identifies projects as late if any one of the
following three conditions is met
The projectrsquos last disbursement occurs after the
expected project end date
The projectrsquos last disbursement22 takes place
during the expected end year but cumulative
disbursements are less than 95 percent of
commitments
The projectrsquos last disbursement takes place
before the expected end year but the difference
between the percentage of time passed and
cumulative disbursements as a percentage of
project commitments is greater than 10 percent
For example if 50 percent of a project timeline
has elapsed but only 30 percent of commitments
have been disbursed the project is considered
late because the difference (20 percent) is larger
than the 10 percent threshold
The second indicator is a non-binary variable that measures the average project delay (APD) This
indicator measures the extent to which a project is
delayed (or ahead of schedule) The ADP ranges from
-100 which indicates the project timeline has elapsed
with no disbursements and thus has experienced
significant delay or possibly cancellation to +100 which
signifies that all disbursements were made during the
first year of the project An APD of 0 suggests that the
project is on schedule as the share of disbursements is
equal to the share of time elapsed In rare cases where
disbursements exceed initial commitments the APD is
given a value of 100 A graphical indicative illustration to
interpret the results is provided in Figure 11
1
2
3
FIGURE 11Graphical interpretation of average project delay (APD)
Indicative interpretation (not real examples)A No disbursements recorded project possibly cancelledB Some disbursements are delayed suggesting project delayC Disbursement in line with project advancement suggesting project on scheduleD All disbursements are advanced suggesting project ahead of schedule
22 The data do not allow for distinguishing between late disbursement and projects where finance was ultimately under-utilized or cancelled
Source South Pole 2020 based on OECD CRS data
CHAPTER 5 DISBURSEMENT EFFICIENCY
Size
of p
roje
ct (U
SD)
APD
A
B
C
D
-100 0 100
29ENERGIZING FINANCE MISSING THE MARK 2020
RESULTS
Looking at both the volume of finance and the number
of projects that are affected by delays may give an
indication of the average size of delayed projects Figure
12 shows the share of projects and finance considered
late or on time as well as the share for which missing
data do not allow for this evaluation Ignoring missing
data a majority of the finance committed to the energy
sector (58 percent) and almost half of all energy sector
projects (49 percent) were delayed in the 2500 projects
The differences in disbursement delays across the four
main sub-sectors (distribution including transmission
renewable generation non-renewable generation
and energy policy) are not large However energy
distribution projects are slightly more prone to delay
with complete data from the 2002ndash2018 period This
result suggests that on average larger projects are
delayed more often than smaller projects
The APD for all projects (weighted by size) is -23
suggesting that the average-sized project is delayed
Projects that are on time have an average commitment
of USD 21 million while delayed projects have a larger
average commitment of USD 30 million This observation
reinforces the idea that delays are more likely to affect
projects associated with larger commitments
with 63 percent of projects and 61 percent of the
financing behind schedule and an APD of -26 Non-
renewable generation projects are slightly less prone to
delay with 48 percent of projects and 48 percent of the
financing late and an APD of -23 (see Figure 13)
FIGURE 12Delays in energy sector financing and project implementation 2002-2018
Late On Time Missing Data
Projects
Finance Committed
185
412 296 293
192 624
Source South Pole 2020 based on OECD CRS data
CHAPTER 5 DISBURSEMENT EFFICIENCY
30ENERGIZING FINANCE MISSING THE MARK 2020
FIGURE 13Projects delayed financing delayed and APD by sub-sector 2002-2018
Energy distribution Energy policyEnergy generationrenewable sources
Energy generationnon-renewable sources
Projects Delayed () Financing Delayed () APD
63
47
58
48 48 515961
-26-21 -23
-19
Source South Pole 2020 based on OECD data
Figure 14 shows the share of financing delayed the share
of projects delayed and the APD for the 13 countries23
where complete data on commitments account for more
than 50 percent of total commitments In Malawi and
Myanmar for example over three quarters of funds
committed for energy sector projects were delayed of
all the HICs Madagascar is the only country where a
third or less of the financing was delayed This figure
also shows the variation between countries particularly
in terms of delayed financing which ranges from 33
percent for Madagascar to 96 percent for Myanmar
23 Angola Burkina Faso Chad Korea (DPR) Niger Nigeria and Sudan were not included in this figure since incomplete data on commitments accounted for more than 50 percent of total commitments
CHAPTER 5 DISBURSEMENT EFFICIENCY
31ENERGIZING FINANCE MISSING THE MARK 2020
FIGURE 14Percentage of projects delayed financing delayed and APD by HIC 2002-2018
Source South Pole 2020 based on OECD CRS dataNote Number of projects included in the analysis displayed in brackets amount of financing across the top
Projects Delayed () Financing Delayed () APD
57
37 37
6073
4948 515040 41
57
94
4953 5670
4855 5567
49
81
52
96
33
-4-14 -15 -15 -15 -20 -23 -26 -26
-34 -38-45
3
Yemen
(N=23
)
Madag
ascar
(N=38
)
Mozambique
(N=17
2)
Banglad
esh (N
=199)
Tanzan
ia (N
=283)
Congo (D
R) (N=53
)
Malawi (N
=79)
Uganda (
N=207)
Kenya
(N=19
3)
India
(N=50
7)
Pakist
an (N
=197)
Ethiopia
(N=15
0)
Myanmar
(N=11
2)
In terms of the share of projects delayed the Congo
(DR) Madagascar and Malawi were the countries with
the fewest delays while Mozambique and Yemen had
the lowest APD scores
In terms of the share of financing delayed Madagascar
and Yemen had a more positive disbursement
efficiency while Malawi and Myanmar had the most
disappointing scores In terms of the APD Madagascar
and Yemen experienced the shortest delays (with
faster disbursements than anticipated on average)
while Ethiopia and Myanmar had the longest delays
The positive results from Madagascar and Yemen may
be due to the relatively number of projects that could
be included compared to other countries For future
editions of Energizing Finance Missing the Mark it
may be relevant to compare the APD for HICs with that
for non-HICs in order to compare the disbursement
efficiencies of the two sets of countries
The analysis also shows that grant financing is overall
more prone to delay than loan financing (in terms
of percentage of financing delayed) although fewer
projects financed by grants were delayed (see Figure
15) This may be because the administrative tasks and
requirements associated with grants are less onerous
resulting in fewer grant-funded projects being delayed
while it may be more difficult to disburse larger grants
(that would have to flow to a range of projects) than
to disburse large loans that tend to flow to fewer
large infrastructure projects In addition energy
sector development finance that is classified as OOF
which is mostly loans that are not highly concessional
appeared to face the most serious disbursement
constraints with an average project delay of -32 and
64 percent of OOF-funded projects delayed This may
reflect the fact that OOFs tend to flow to larger more
complex infrastructure projects with more demanding
commercial requirements and safeguards which can
affect disbursement schedules
CHAPTER 5 DISBURSEMENT EFFICIENCY
32ENERGIZING FINANCE MISSING THE MARK 2020
FIGURE 15Projects delayed financing delayed and APD by financing instrument 2002-2018
ODA Loans Other Official Flows(non Export Credit)
ODA Grants
Projects Delayed () Financing Delayed () APD
58 56
-18
-32-26
6458
47
72
Source South Pole 2020 based on OECD CRS data
Figures 16ndash20 depict the relationship between project
size and APD by sector in a scatterplot where each dot
represents an individual project Since commitments
for energy-sector projects can span several orders of
magnitude from a few thousand US dollars to almost
a billion the data are presented on a logarithmic scale
The top-left quadrant of Figure 19 (energy distribution
projects) has a higher density than the top right
quadrant highlighting that large projects were more
likely to be delayed The distribution seems to be more
homogenous in the top left and lower left quadrants for
renewable energy (RE) projects From visual observation
this suggests that RE projects were equally delayed
regardless of project size
In general it can clearly be seen that many projects
cluster at an APD of -100 (ie where no disbursements
have been made24) and at an APD of 0 (ie exactly on
time) This is particularly the case for RE generation and
energy policy projects (see Figure 16 and Figure 18
respectively)
24 This could be due to cancellation delay misreporting or a host of other reasons
CHAPTER 5 DISBURSEMENT EFFICIENCY
33ENERGIZING FINANCE MISSING THE MARK 2020
FIGURE 16APD by project size for renewable generation projects
Number of Projects 818 Average Commitment Size $19M Weighted Average Project Delay -21Source South Pole 2020 based on OECD CRS data
FIGURE 17APD by project size for non-renewable generation projects
Number of Projects 131 Average Commitment Size $57M Weighted Average Project Delay -19Source South Pole 2020 based on OECD CRS data
PRO
JECT
CO
MM
ITM
ENTS
(201
8 US
D)
AVERAGE PROJECT DELAY
10000
100000
1000000
10000000
100000000
1000000000
-100 100-80 80-60 60-50 40-20 200
PRO
JECT
CO
MM
ITM
ENTS
(201
8 US
D)
AVERAGE PROJECT DELAY
10000
100000
1000000
10000000
100000000
1000000000
-100 100-80 80-60 60-50 40-20 200
CHAPTER 5 DISBURSEMENT EFFICIENCY
34ENERGIZING FINANCE MISSING THE MARK 2020
FIGURE 18APD by project size for energy policy projects
FIGURE 19APD by project size for energy distribution projects
Number of Projects 730 Average Commitment Size $14M Weighted Average Project Delay -23Source South Pole 2020 based on OECD CRS data
Number of Projects 462 Average Commitment Size $68M Weighted Average Project Delay -26Source South Pole 2020 based on OECD CRS data
PRO
JECT
CO
MM
ITM
ENTS
(201
8 US
D)
AVERAGE PROJECT DELAY
10000
100000
1000000
10000000
100000000
1000000000
-100 100-80 80-60 60-50 40-20 200
PRO
JECT
CO
MM
ITM
ENTS
(201
8 US
D)
AVERAGE PROJECT DELAY
10000
100000
1000000
10000000
100000000
1000000000
-100 100-80 80-60 60-50 40-20 200
CHAPTER 5 DISBURSEMENT EFFICIENCY
6CHAPTER
ANALYSIS OF DISBURSEMENT
CONSTRAINTS AND SOLUTIONS
35
36ENERGIZING FINANCE MISSING THE MARK 2020
CHAPTER 6 ANALYSIS OF DISBURSEMENT CONSTRAINTS AND SOLUTIONS
This section presents findings from both an additional
quantitative assessment and a qualitative review to shed
light on disbursement constraints These findings were
gathered through evaluation reports and responses to
surveys sent to donors private sector stakeholders and
institutions operating in the energy ecosystem
Section 61 provides a quantitative analysis of the
relationship between development finance for the
energy sector and regulatory indicators From Section
62 onward the analysis studies energy access projects
specifically rather than the energy sector in general this
is rendered possible through the analysis of evaluation
reports and primary data obtained through surveys and
interviews with stakeholders Section 62 provides insights
from project reports Section 63 highlights findings from
surveys and interviews and draws recommendations for
improving disbursement efficiency and Section 64 offers
conclusions to this analysis
QUANTITATIVE ANALYSIS OF THE CONNECTION TO REGULATORY INDICATORS FOR SUSTAINABLE ENERGY
To seek a clearer understanding of the extent to which
disbursement efficiency may relate to the quality of
a countryrsquos energy sector policies and regulations
the report looked to the World Bankrsquos Regulatory
Indicators for Sustainable Energy (RISE) RISE scores
assess countries on the quality of their electricity access
energy efficiency and renewable energy (RE) policies25
and are constructed as the average of several sub-
indices The energy index for example depends on the
existence and monitoring of an official electrification
plan the scope of such a plan and the framework for
grid electrification among other sub-indicators
The objective of this analysis is to test the strength of the
correlation between RISE scores and disbursement rates
and therefore whether disbursements may be linked to
an improvement in the quality of energy sector policies
or regulations The data show that while there have
been significant and steady improvements in the quality
of the policies and regulations measured by RISE the
same steady improvement pattern has not generally
followed for disbursements
While there is no statistically significant correlation between overall development finance disbursements for energy and the RISE scores for Electricity Access and Energy Efficiency there is a statistically significant relation with the RISE RE indicator even if the practical significance of the coefficient is small On average in
high-impact countries (HICs) every additional point in
the RISE score for RE is associated with an additional
USD 005 per capita additional development finance
disbursed for the energy sector The results imply that the
changes in regulations and policies measured by RISE do
not appear to have a material short-term relationship with
energy sector development finance disbursements in
HICs This result does not rule out a medium- or long-term
impact from regulatory improvements on energy sector
disbursements and may also differ when only analysing
specific technologies It also does not rule out a positive
impact on overall finance commitments including private
finance as has been observed in Rwanda which is the
subject of a more detailed review in Energizing Finance
Understanding the Landscape 2020
For more details on methodology and results see
Annex II
25 This analysis of RISE does not include the indicatorsresults on clean cooking
37ENERGIZING FINANCE MISSING THE MARK 2020
REVIEW OF EVALUATION REPORTS
To obtain additional country-specific insights on the
reasons behind disbursement delays and to test these
against trends found in the quantitative analysis 36
reports from the deep-dive countries26 were reviewed
This review included project evaluation reports single
and multi-country market assessment reports and
papers on development finance effectiveness to gain
a better understanding of individual country contexts
About two thirds of the reports analysed pertained to
energy access while one third focused on clean cooking
The main points extracted from the reports relate to
disbursement challenges and the context encountered
in specific countries as well as solutions implemented
successfully or not to overcome project disbursement
constraints More details are provided in Annex III
It is essential that best practices are adopted when
designing and implementing energy access projects to
ensure and maintain efficient and timely disbursement
processes Recommendations developed in this section
notably align with the four dimensions (prioritization
ownership transparency learning) of the Quality of
Official Development Assistance tool27 an important
instrument developed by the Center for Global
Development and the Brookings Institution that
supports donors to improve the quality of their own aid
Several types of barriers hinder disbursement in energy
access projects the following subsections provide
more detail
Poor institutional and coordination structures and constrained public sector capacity
Insufficient staff capacity and a lack of coordination among stakeholders (funders government private sector andor civil society implementing partners) combined with inadequate institutional structures and administrative requirements can threaten the timely disbursement of finance for energy projectsThe main barriers to efficient disbursement of finance
for electricity and clean cooking access as identified
through the desk review and survey responses are
primarily administrative in nature insufficient human
resources such as understaffing or limited number of
experts in project management units (PMUs) and time-
intensive processes These two factors are linked as
insufficient human resources exacerbate the barrier of
time-intensive processes due to limited organizational
capacity to cope with complex bureaucratic procedures
(eg due diligence compliance with procurement
processes and reporting requirements)
To overcome these challenges some suggestions
include streamlining staff recruitment processes and
shifting implementation responsibilities to entities
with more knowledge of the local context (ie country
offices) or technical capacity as they may be better
positioned to provide direct support Increased human
capacity can pave the way for other proposed solutions
namely improving communication and decision-making
strategies and establishing more flexible and tailored
contractual arrangements
An additional disbursement barrier mentioned by
survey respondents is the lack of coordination between
project stakeholders The importance of coordination
is notably supported by key takeaways from the GEF-
UNDP India project (Box 1) where administrative
processes and project implementation delays were cited
as a contributing factor to disbursement delays Limited
coordination among stakeholders and limited support
from national institutions further affected disbursements
a constraint that could be improved by shifting to sub-
national entities with improved stakeholder interactions
Conversely the evaluation report on the Madagascar
Energy Sector Reform Support Programme (PARSE)
evidenced the importance of continuous coordination
between the donor and its implementing partners in
contributing to success The programme aimed to remove
the barriers that hinder the development of Madagascarrsquos
electricity sector and showed that a continuous dialogue
with local authorities and development partners was
essential to ensure the programme was aligned with the
governmentrsquos priorities complemented programmes
supported by other donors and created buy-in and
ownership for the programmersquos creditor
26 India Madagascar Myanmar Nigeria and Rwanda27 Center for Global Development (2018) Quality of Official Development Assistance QuODA 2018 Methodology online httpswwwcgdevorgsitesdefaultfilesquoda-methodology-2018pdf
CHAPTER 6 ANALYSIS OF DISBURSEMENT CONSTRAINTS AND SOLUTIONS
38ENERGIZING FINANCE MISSING THE MARK 2020
Additional efforts are urgently needed to build in better
coordination mechanisms among public entities donors
and beneficiaries and reinforce human resources to
fulfill project requirements This could be facilitated by
public entities and ministries playing a role in supporting
project activities for instance by promoting stakeholder
coordination through the organization of meetings or
workshops
Limited access to local finance
Lack of access to matching finance often results in energy end users and small and medium-sized enterprises (SMEs) finding themselves at an impasse when procuring funding which can delay project disbursement
Access to local finance can be a pre-condition for
intended beneficiariesrsquo participation in projects as
they often need loans to purchase electricity or clean
cooking equipment If beneficiaries engaged in energy
access projects have limited access to finance they
are prevented from participating in project activities
resulting in disbursement delays This is especially
important for results-based finance projects where
incentives are set for an entity to deliver predefined
outputs and reward the achievement of these results
upon verification29 With limited access to finance
beneficiaries are not able to provide the expected
outputs and are ineligible to receive incentives linked to
pre-agreed results which delays projectsrsquo disbursement
processes
For example in one project in Rwanda the high upfront
costs of RE equipment not only exposed the need for
strong project design (further discussed in 613) and
marketing strategies (see 614) but also highlighted the
critical importance of local credit opportunities for high
disbursement rates (Box 2)
28 UNDP India (2019) Mid-term Review Market Transformation and Removal of Barriers for Effective Implementation of the State Level Climate Change Action Plans29 Musgrove P (2010) Rewards for good performance or results a short glossary online httpwww rbfhealthorg Washington DC World Bank
This project co-financed by the GEF UNDP and the Government of India aimed to reduce greenhouse
gas (GHG) emissions in the states of Jharkhand and Manipur by removing barriers to the successful
implementation of GHG reduction measures identified in the State-Level Action Plans on Climate Change
The project faced significant delays in its implementation phase especially in kick-starting activities in the
state of Manipur These delays were mainly due to a lack of clearance from the Department of Economic Affairs as well as limited support from national institutions at the federal level Because of this at the time
of the projectrsquos mid-term review (2019) activities in the state of Manipur had not fully started
Disbursement delays were attributed to the delayed start in Manipur late approval in the state of Janipur
and the slow PMU hiring processes
Despite these challenges the project team managed to redefine priorities and carry out their activities by focusing on the state of Jharkhand where progress was faster This was due to the higher number of active partners involved including the state government community and livelihood groups industry
associations research institutes NGOs and private sector entities
Market Transformation and Removal of Barriers for Effective Implementation of the State-Level Climate Change Action Plans 2016ndash2019 (independent review)28
INDIA
BOX 1
CHAPTER 6 ANALYSIS OF DISBURSEMENT CONSTRAINTS AND SOLUTIONS
39ENERGIZING FINANCE MISSING THE MARK 2020
To overcome this challenge it is imperative that a market
assessment is conducted during the project design
phase to identify available financial tools and their
characteristics (eg interest rates terms and collateral
requirements) This includes assessing the type of
household that will be targeted by the project (eg low-
income vulnerable living in remote areas etc) It is also
crucial that technical assistance services are integrated
within the project These services should target end users
(eg awareness campaigns and budget training) SMEs
(eg technical assistance on cash-flow management
business plan creation) and financial institutions
(eg training on risk management digitalization and
development of innovative financial products according
to the financial needs of end users and SMEs) Finally the
role of blended finance should not be underestimated it
can prevent disbursement delays by developing public
financial incentives (eg guarantee schemes) that de-risk
investments for local banks and thus improve access to
local finance Financial institutions are then less reluctant
to offer the required local finance which has the potential
to significantly decrease disbursement delays arising
from financial institutionsrsquo risk aversion Planning for
such financial tools and incentives can also be related to
adequate project design as discussed in the next section
Technical barriers and flaws in project design
Sound initial project design is of the utmost importance for project success and timely disbursements
Flaws in initial project design appear to be a cause of
disbursement delays in both electricity access and clean
cooking projects as inappropriate project design prevents
uptake and threatens timely and complete disbursements
Design deficiencies in electricity projects often relate
to short timeframes overly broad and unclear scopes
of work limited local relevance due to the use of
inappropriate imported donor solutions and lack of
market knowledge For example implementing an
off-grid electricity project in a country where there
are already low tariffs for grid-connected electricity
or generous government subsidies could be risky as
there is little room for competition and end users will
continue to wait for a grid extension instead of investing
in off-grid solutions To address this issue it is essential
for the host country government to have and provide
clear data on electricity access and grid arrival targets
so that project developers and funders can adapt their
project designs accordingly
The total budget allocated for the programme was EUR 106358000 but only 80 percent of this was
disbursed in the period 2008ndash2013 The two components with low disbursement were the biodigester and
pico-photovoltaic (PV) system components
The low uptake of biodigesters was caused by high initial investment costs a long payback period (~nine years) and limited credit opportunities for potential purchasers Only 23 percent of the initial
biodigester installation target was completed
Another disbursement shortfall came from the pico-PV systems component only 50 percent of funds
committed were disbursed and only 8000 of the envisaged 166200 units of the pico-PV system component
were sold The poor performance of the pico-PV sales was attributed to unsatisfactory project design and a poor marketing strategy Modifications in project design and strong promotion by the Government of Rwanda
were unsuccessful in encouraging increased uptake of the systems Similar to the biodigesters the targeted beneficiaries struggled to buy the pico-PV system as they could not afford to do so without access to credit
RWANDA
BOX 2
Promoting Renewable Energy Programme (PREP) 2008ndash2013 (internal review)30
CHAPTER 6 ANALYSIS OF DISBURSEMENT CONSTRAINTS AND SOLUTIONS
30 Ministry of Foreign Affairs the Netherlands (2014) IOB Evaluation Access to Energy in Rwanda Impact evaluation of activities supported by the Dutch Promoting Renewable Energy Programme Retrieved from Government of Netherlands httpswwwgovernmentnldocumentsreports20150428iob-access-to-energy-in-rwanda-impactevaluation-of-activities-supported-by-the-dutch-promoting-renewable-energy-programme
40ENERGIZING FINANCE MISSING THE MARK 2020
suppliers financial institutions etc)
qualified and as far as possible local experts
coordination mechanisms included in the initial
project structure
As mentioned in the previous section a mismatch
between demand and supply of local finance can be a
barrier to timely disbursement To reduce this risk it is
critical that programme and project design account for
the operational realities of the local market and local
financial institutions In fact careful design considerations
also extend to financial arrangements and guarantees
between banks project developers and suppliers In
Nigeria the late signing of agreements and contractual
requirements between the guaranteeing bank project
developers and their suppliers in one project compromised
timely disbursement and delayed completion (Box 3)
While the outcome in this example may result from a
combination of several factors it still reflects how the
suboptimal design of financial guarantees among actors
can exacerbate disbursement delays
bull
bull
bull
bull
The Solar Energy Programme in Nigeria financed by UNDP and Nigeriarsquos Bank of Industry (BOI) aimed to
promote and support the expansion of RE services for micro businesses that represent almost 80 percent of
total businesses in the country
Two project developers (GVE Project Ltd and Arnergy Solar Ltd) were selected The BOI loan was offered
through a guaranteeing bank (Zenith Bank) to facilitate the latter bank refinancing the project developersrsquo
activities and developing public-private partnerships
The public-private partnership structure was intended to reinforce successful project implementation
but its complexity slowed the disbursement of funds To manage its risk Zenith Bank required additional
documents and confirmations from the BOI before disbursing funds to GVE Project Ltd The BOI thus had to conduct inspection visits to verify the procurement of equipment and confirm appropriate use of funds to reassure Zenith Bank and justify the release of further funds Delays were caused by this last-minute
requirement and by the fact that BOI had not anticipated this situation
One recommendation proposed to mitigate the risk was to secure disbursement of funds to the project
developerrsquos suppliers through the provision of Advance Payment Guarantees (APGs) or Letters of Comfort from the BOI in favour of the local suppliers instead of the project developer
NIGERIA
BOX 3
Solar Energy Programme 2017ndash2018 (independent evaluation)31
Regarding clean cooking projects it is critical to
ensure that there are sufficient and appropriate natural
resources to use the clean cooking technologies funded
by the project Such issues can be minimized during
a robust project design phase that also demands
the availability of qualified experts and incorporates
their technical understanding When projects involve
technology transfer funders should identify the local
technology manufacturers and service providers to
which the technology will be transferred the duration of
the transfer and prioritize the technology applications
with the highest potential for upscaling This process
needs to be clearly designed with monitoring tools
determined staff roles and periodic reporting
Overall for an electricity or clean cooking project
design to be lsquodisbursement-friendlyrsquo the following key
elements are essential
transparent data on energy planning (ie grid
arrival targets)
solid technical understanding of the local
market notably key stakeholders (manufacturers
CHAPTER 6 ANALYSIS OF DISBURSEMENT CONSTRAINTS AND SOLUTIONS
31 UNDP (2018) Solar Energy Programme in Nigeria
41ENERGIZING FINANCE MISSING THE MARK 2020
At the project design stage it is crucial for developers
to identify and engage with financial institutions
bankable SMEs and beneficiaries that have an interest
in energy access projects and companies As mentioned
previously adequate technical assistance services must
also be integrated at several levels (end users SMEs
and financial institutions) especially when targeting
vulnerable populations Developing business plan
training for SMEs or supporting financial institutions in
using digital services such as mobile money may allow
financial institutions to reduce their transaction costs
(eg from not having to visit remote areas to collect
credit repayments) thus increasing access to finance
for remote households From the public sector side tax
incentive programmes and reducing the retail prices of
improved cookstoves (ICS) could also encourage more
manufacturers to participate for instance in voluntary
standards and labelling programmes
Lack of public awareness
Lack of awareness of modern energy access solutions and their benefits hinders project implementation and threatens timely disbursement Awareness campaigns must be built in to energy access projects and should be at the centre of clean cooking project design
Lack of public awareness about new energy access
solutions is a barrier to energy access disbursements
particularly for clean cooking technologies Weak public
awareness limits demand which prevents project uptake
and delays disbursements especially in a results-based
financing scheme Clean cooking solutions particularly
suffer from a lack of public awareness and are thus
often sidelined by decision-makers To overcome this
awareness campaigns particularly around existing
support schemes and knowledge sharing of the benefits
of clean fuels and technologies for cooking should be
at the centre of clean cooking project design
The lack of end user awareness of the multiple co-
benefits of energy access is a serious barrier to
disbursement and a major topic that goes beyond the
scope of this report Further references can be found in
the Bibliography
SURVEYS
Surveys targeting both public and private sector
stakeholders were conducted in parallel with review
of evaluation reports Interviews were conducted
virtually through targeted phone consultations and
supplemented by online questionnaires Both of these
surveys were sent through SEforALL and its partnersrsquo
networks
Questionnaires combined targeted open and structured
multiple-choice questions and the objective was
to explore the impact of exogenous (ie political
economic technological social environmental)
and endogenous (ie internal delays behavioural
barriers human resources cultural factors) factors
as well as any other relevant elements Responses
were collected from 34 entities seven governmental
entities implementing energy-access projects or
participating in the implementation of those projects
18 private entities and nine donorsinvestors Of the
deep-dive countries Madagascar was most frequently
referenced by respondents as a country they operated
in (16 responses) followed by Nigeria (11 responses)
India (eight responses) Rwanda (eight responses) and
Myanmar (four responses)
Disbursement delays and associated causes
The majority of respondents surveyed cited gaps
between the expected and actual disbursement dates
with some respondents noting delays or cancellations
of disbursement after contractsagreements had
been signed This was experienced by 17 out of
30 respondents across all stakeholder groups (ie
donors private sector stakeholders and institutions)
Respondents frequently noted how the delay in some
project-related activities such as pre-disbursement
studies specific milestones associated with tranche-
based financing and administrative procedures
particularly amongst contractors and suppliers directly
affected disbursement schedules
CHAPTER 6 ANALYSIS OF DISBURSEMENT CONSTRAINTS AND SOLUTIONS
42ENERGIZING FINANCE MISSING THE MARK 2020
Administrative factors were the most frequently cited
internal factor responsible for disbursement delays
Administrative processes such as extensive time-
consuming paperwork and reporting requirements
in addition to old internal management tools and
requirements to seek tax and legal advice were cited
as slowing down the process This was exacerbated by
the previously highlighted human capital constraints
on carrying out these activities Other examples noted
were cumbersome due diligence and procurement
processes Private companies in particular mentioned
difficulties in complying with donor procurement
requirements without proper guidance and a lack of
clarity on local processes for example obtaining long-
term land permits when those are preconditions to
disbursement by donors
External factors referred to by survey respondents
included political factors (eg changes in political
priorities) underdeveloped financial markets and long
implementation delays when subcontracting was required
The current COVID-19 crisis was mentioned as the most
significant risk factor for timely disbursement in 2020
Regulation was also mentioned as a potential factor
affecting disbursements On this topic feedback
on the links between regulation and disbursements
was more mixed particularly in responses provided
by respondents from donor organizations which is
consistent with results from the Regulatory Indicators
for Sustainable Energy (RISE) analysis However in
general there was agreement that balanced attractive
and stable investment regulations (ie tax incentive
programmes) reduce disbursement delays as do
facilitating mechanisms such as technical assistance for
financial institutions and SMEs
On the relationship between specific energy solutions
and disbursement constraints some respondents
believed that it was not the solution type itself that
hindered fund disbursement but rather the end users
associated with that solution For instance demand
for off-grid solutions tends to be from remote areas
Due to high transaction costs associated with visiting
remote areas there is more room for delay in the
implementation of project activities and consequently
in projectsrsquo disbursements One donor mentioned that
the size of the project plays a role and that difficulties
in disbursement are mostly faced when managing
large engineering procurement and construction (EPC)
projects for electrification a trend that was already
noted in Missing the Mark 2017 Mini-grid projects
were mentioned several times as being riskier in
terms of disbursement delays On the other hand no
respondents mentioned any particular link between
types of clean cooking solutions or solar home systems
and disbursement constraints
Disbursement barriers and financial tools
No specific links were drawn by survey respondents
between delays in disbursements and funding tools (eg
debt grants equity etc) other than in large projects It
was stated that large projects are often associated with
loans disbursed in stages where payments are dependent
on achievement of milestones in project delivery which
can delay disbursements if they are not met
Several respondents mentioned lack of bankability and
integration with viable business models as a reason
behind disbursement delays which in fact reflects flaws
in initial project design ndash notably a mismatch between
project objectives and underlying financial instruments
offered through the project andor local financial market
Disbursement barriers and type of recipients
According to respondents national development
banks are the type of recipient with which there is a
higher risk of disbursement delay because overall
they tend to lack experience in energy access projects
and thus their involvement requires engagement and
assistance Survey respondents also noted that national
development banks can be slow-moving strongly risk-
averse and impose long due-diligence processes
CHAPTER 6 ANALYSIS OF DISBURSEMENT CONSTRAINTS AND SOLUTIONS
43ENERGIZING FINANCE MISSING THE MARK 2020
Stakeholder Main action(s) to undertake
Government bull Create an attractive investment environmentbull Increase transparency and communicate energy plans provide information through intuitive tools
and softwarebull Support local financial institutions to access funds for energy access projectsbull Assess needs and strengthen capacity of local SMEs to help them become bankable and create
viable business models
Private sector bull Share new managerial skillsbull Bring capital (loans and equity)
Donors bull Consider blended finance structures mixing a variety of instruments (grants loans risk-sharing instruments) from public and private sources
bull Offer technical assistance and capacity building to recipients during project implementationbull Implement an efficient monitoring system while a project is on footbull Conduct project evaluations and communicate findings through reports
Respondentsrsquo proposed recommendations
Respondents offered several recommendations to
reduce disbursement delays as summarized in Table 1
The main recommendations from the institutions private
sector and funders were that donors and institutional
recipients of funds should streamline project team
recruitment processes shift implementation to local
offices and more technically capable entities andor
bring greater technical assistance and capacity building
to bear on project implementation to help build local
skills In addition project design should include a market
assessment (especially for technology transfer projects)
and regular monitoring Increased human capacity can
pave the way for other proposed solutions namely in
improving communication stakeholder coordination
and decision-making
According to respondents government support is key
to improving disbursement efficiency Governments
need to provide and maintain a stable investment
environment that does not hinder timely disbursement
of funds It can do this by working to eliminate
corruption promoting financial schemes to fund the
purchase of energy solutions and publishing relevant
up to date information The latter could include for
example the progress of central grid expansion or data
about locally available energy solutions It was also
mentioned that seeking quick disbursement especially
of large commitments should not come at the expense
of the quality of the disbursement too much pressure
to disburse quickly may affect the long-term quality and
adequacy of the products and services procured for the
project
Funders (ie donors and investors) also have a role to
play in providing technical assistance and capacity
building to help build local skills and support local
entities in absorbing funds which help respect the
timeline of project implementation ndash and thus fosters
timely disbursement Respondents also noted that
funders should keep the disbursement process simple
and flexible and adapt quickly to new financing
business models emerging technologies and changing
market conditions The integration of robust monitoring
and evaluation systems is also crucial to ensure smooth
project implementation and timely disbursement
Relevant evaluation reports can help draw lessons from
project design planning and implementation However
the analysis revealed that evaluation reports could give
greater attention to the evaluation of disbursement
records and delays particularly to describe underlying
factors that caused disbursement delays and
inefficiencies in more detail as well as associated
recommendations for mitigating these in the future
Finally the private sector has a significant role to play in
bringing new managerial skills and facilitating dialogue
and decision-making processes between donor and
recipient countries Transparent communication (ie
between suppliers and contractors) is also a key element
to prevent disbursement delays
TABLE 1 Survey respondentsrsquo recommendations to improve disbursement efficiency
Source South Pole 2020
CHAPTER 6 ANALYSIS OF DISBURSEMENT CONSTRAINTS AND SOLUTIONS
44ENERGIZING FINANCE MISSING THE MARK 2020
SUMMARY OF QUALITATIVE INSIGHTS
As in Energizing Finance Missing the Mark 2017 this
updated 2020 edition shows that disbursement and
project development influence one another a late
disbursement can be both the cause and consequence of
delayed project implementation Regardless of where in
the project implementation process disbursement delays
occur they affect the overall project and therefore the
delivery of energy and related co-benefits on the ground
The same five barriers to disbursement as identified in Energizing Finance Missing the Mark 2017 prevail in Energizing Finance Missing the Mark 2020
1 weak institutional structures and capacity
2 regulatory and policy barriers
3 limited access to and maturity of local financial
services
4 technical barriersproject design flaws
5 public awareness
However the main barrier identified in Missing the Mark
2017 (time-consuming and difficult foreign currency
requirements) was not seen as a major barrier in the
2020 analysis
What was interesting to note during the research was
the influence of project-specific factors on disbursement
delays While the importance of external factors causing
delays remains (ie political economic technological
and regulatory factors) survey respondents emphasized
the significance of project-related factors in low
disbursement rates That is burdensome administrative
processes lack of capacity limited coordination between
implementing agencies and unclear and unfeasible
project design
Taking all of these findings into consideration it is clear that sharpening project design streamlining administrative processes facilitating stakeholder interaction removing regulatory barriers and improving local financial services are all essential to increasing disbursement rates and unleashing the full potential of development finance Without this there
will not be sustainable energy for all
Finally it is important to note that the energy ecosystem
has significantly evolved in the last decade but
the current analytical framework has not Energy is
generated and delivered differently today with off-grid
and decentralized private sector-led options expanding
but this is not always reflected in the available data The
prevailing data representation is still dominated by data
from large donor-funded energy projects With the
OECD CRS codes used there was a lack of consistent
and reliable data on development finance for off-grid
electricity and clean cooking solutions In addition
the analysis could not fully capture new disbursement
barriers as these are linked to an emerging market
structure that is not fully visible in the datasets and
research papers
The barriers identified in this report that hinder timely
fund disbursement to energy access projects across the
five deep-dive countries and recommended solutions
are summarized in Table 2 below
CHAPTER 6 ANALYSIS OF DISBURSEMENT CONSTRAINTS AND SOLUTIONS
45ENERGIZING FINANCE MISSING THE MARK 2020
29 This recommendation was mentioned numerous times by respondents This does not necessarily contradict the findings from Section 611 since the RISE regression analysis did not focus on a specific technology and did not study possible medium- to long-term relationships
TYPE OF BARRIER POLICY RECOMMENDATIONRegulatory and policy barriers
Weak and unclear legal frameworks and regulations
Governments should provide a balanced and stable regulatory and investment environment for the energy sector29
Improve data quality and availability
Improve banking and investment policies and regulations to help bring local financial sector to maturity
Institutional structure and public sector capacity
Limited buy-in and support from the implementing agency
Create a country support office or subcontract project management to local organizations with sectoral expertise
Lack of coordination between government donor and other relevant stakeholdersbeneficiaries
Implement a clear and defined strategy for inter-agency communication
Conduct regular meetings
Time-consuming processes with local governments
Streamline decision-making and procurement procedures to improve efficiency
Lack of flexibility in fund transfer between donor and government implementing agency
Establish flexible and transparent contracting arrangements
Make a checklist before signing contracts to ensure that disbursement conditions are identified and can be met
Limited access to finance and markets
Poor householdersrsquo lack of access to finance to purchase energy solutions resulting in delays to project implementation and disbursement
Structure tailored financial solutions for example payment by instalment models for poor households who cannot afford large up front payments
Develop pay-as-you-go financing schemes
Offer use of mobile money to facilitate repayments
Raise consumer awareness of financing schemes for example through targeted campaigns
Limited access to credit facilities across the HICs for SMEs delaying project implementation and disbursements
Identify relevant financial institutions and SMEs during the project design phase
Offer technical assistance at several levels (end users SMEs and financial institutions)
Provide clear guidelines easy-to-access services (eg toll-free hotlines) and a variety of payment options
Reluctance of local financial institutions to provide loans to households and SMEs due to low risk appetite
Deploy financial risk-sharing mechanisms between donors and governments to reduce risk and increase affordability of finance for end users
Roll out capacity building and awareness programmes for local financial institutions
TABLE 2 Summary of disbursement constraints and policy recommendations
CHAPTER 6 ANALYSIS OF DISBURSEMENT CONSTRAINTS AND SOLUTIONS
46ENERGIZING FINANCE MISSING THE MARK 2020
TYPE OF BARRIER POLICY RECOMMENDATIONTechnical barriersflaws in project design
Unrealistic project timeframes andor scope Design project with realistic and appropriate timeframe
Select economically viable technology solutions with the highest potential for adoption and scale-up which are not substantially supported by other programmes
Identify local technology manufacturers and service providers to which technology will be transferred
Develop pilot projects with locally manufactured equipment
Structure projects based on early implementation experience
Poor market assessments Thoroughly assess requirements for adaptation of previous successful projects to new markets through pre-feasibility studies that includebull an assessment of available resourcesbull identification of suitable technology and beneficiariesbull identification of key stakeholders bull identification of viable distribution channelsbull qualitative and quantitative studies that describe the target
populationrsquos behaviour and practices in electricity and clean cooking usage
Inadequate andor inappropriate pricing (eg introduction of innovative technologies that are not competitive with highly subsidized grid tariffs)
Clearly identify local tariffs and pricing mechanisms for different energy solutions
Analyse the relevance of each energy solution according to local tariffs and subsidies
Promote projectrsquos energy solutions with technical assistance and awareness campaigns
Public awareness
Lack of awareness of existing financial support schemes for energy access targeting SMEs and households (if any)
Conduct consumer awareness campaigns on existing support schemes especially for clean cooking projects to stimulate demand
Limited public awareness of the benefits of improved cookstoves (ICS) compared to traditional stoves
Conduct awareness campaigns for consumers on the benefits of using LPG and ICS improve marketing techniques
Source South Pole 2020
CHAPTER 6 ANALYSIS OF DISBURSEMENT CONSTRAINTS AND SOLUTIONS
ANNEX
48ENERGIZING FINANCE MISSING THE MARK 2020
ANNEX
ANNEX I METHODOLOGY
The following section provides a more detailed overview
of both the quantitative and qualitative research
methodologies
The quantitative research was based on a statistical
analysis of the data for energy sector development
finance commitments and disbursements The research
included the World Bankrsquos Regulatory Indicators for
Sustainable Energy (RISE) scores which are indicators
of a countryrsquos policies and regulations in the energy
sector The analysis combined this to explore potential
links between RISE scores and disbursement rates
This section provides an overview of the scope the
data sources and data selection and the nature of the
analysis as well as analytical considerations definitions
and data constraints
Scope
The data selection focused on 20 HICs In contrast to
Energizing Finance Missing the Mark 2020 the list
of countries has been updated to correspond with
the countries included in Tracking SDG7 The Energy
Progress Report 2020
The list of countries selected for the quantitative analysis
is as follows
bull Electricity access Angola Bangladesh Burkina
Faso Chad Congo (DR) Ethiopia India Kenya
Korea (DPR) Madagascar Malawi Mozambique
Myanmar Niger Nigeria Pakistan Sudan
Tanzania Uganda and Yemen
bull Clean cooking access Afghanistan Bangladesh
China Congo (DR) Ethiopia Ghana India
Indonesia Kenya Korea (DPR) Madagascar
Mozambique Myanmar Nigeria Pakistan
Philippines Sudan Tanzania Uganda and Vietnam
The Energizing Finance Missing the Mark 2020
quantitative analysis covers the period 2013 to 2018
Data sources and selection
The key data sources identified for the quantitative
analysis are summarized as follows
DATA SOURCE DESCRIPTION ACCESSIBLE ATCommitment and disbursement data
OECD The data come from the publicly accessible Creditor Reporting System (CRS) This repository houses development finance commitment and disbursement data from OECD countries and multilateral donor organizations
httpsstatsoecdorg
RISE scores World Bank RISE scores provide a reflection of a countryrsquos policies and regulations in the energy sector organized by the three pillars of the SEforALL initiative Energy Access Energy Efficiency and Renewable Energy
httpsriseworldbankorgscores
TABLE 3 Key data sources for the quantitative analysis
Source South Pole 2020
49ENERGIZING FINANCE MISSING THE MARK 2020
Concerning commitment and disbursements the key
data fields from the CRS database that were required
for the analysis are donor country recipient country
project purpose commitments disbursement schedule
schemes actual disbursements and project start and
end dates
Regarding the RISE scores this study proposed to
incorporate them to assess whether (and if so to
what extent) there are parallels between RISE scores
(or their evolution over time) and the commitment
disbursement gap
Regarding data selection for energy the data selected
in the CRS database were under the sector labelled
lsquo230 II3 Energy Totalrsquo For clean cooking projects the
data were extracted from the entire database because
clean cooking projects are not neatly classified into one
single category
Matching transactions to projects
The CRS data report development finance flows
at the transaction level but do not provide high-
quality project identifiers to group transactions into
projects As a result the grouping can be done either
manually which is both labour-intensive and lacking
in replicability or with an algorithm tailored to the
CRS data The procedure developed for this report
runs on the statistical software Stata but can be easily
replicated on other statistical software
The algorithm groups transactions into projects in a
multi-step process First transactions with the same
donor donor agency and recipient are grouped
Second within each of these groups of transactions the
number of unique project titles project numbers and
CRSid identifiers is calculated Third the initial groups
are broken up into subgroups based on the variable
with the fewest unique values among the project title
project number and CRSid This yields a high-quality
initial grouping
To improve this initial grouping two additional steps are
taken First projects from the International Development
Association (IDA) and the International Bank for
Reconstruction and Development (IBRD) are re-grouped
according to their project number a high-quality
identifier for those donors Second transactions from
Japan that have a project number but have an empty
project title or a project title that groups many unrelated
projects are grouped according to their project number
This improves the quality of the transaction-project
grouping for Japanese development finance
Data analysis
This section presents the different types of data analyses
that were conducted as part of the quantitative analysis
The first stage of the analysis consisted of conducting
general statistical analysis related to commitment and
disbursement data for energy and clean cooking For
commitment and disbursement levels the results are
presented in absolute terms (USD) and in relative terms
(as a percentage of total commitments worldwide)
Similar statistics are presented for the commitment
disbursement gap All results are summarized as totals
but can also be disaggregated by various data fields
such as sector donor or recipient country The second
stage of the analysis consisted of conducting a trend
analysis of the data over the time period 2013ndash2018
This study also proposed a comparison of commitment
and disbursement trends with the evolution in RISE
scores over time even though it was unlikely to be
possible to demonstrate causality Finally an important
aspect of the analysis related to exploring delays in
disbursements The aim was to identify whether there
are delays in disbursements in energy and clean cooking
access projects and if so to calculate the magnitude of
those delays The possible reasons behind these delays
were investigated in the qualitative analysis
The disbursement delay analysis relies on an agreed
definition of what constitutes a delay and how to
differentiate between different levels of delays Similar
to to Missing the Mark 2017 it was proposed to use a
binary and a non-binary indicator to classify and calculate
project delays The binary indicator established whether
a project was on time or late while the non-binary
indicator revealed the level of the delay
ANNEX
50ENERGIZING FINANCE MISSING THE MARK 2020
Donor Total commitment (USD million)
Percentage of financing with missing data ()
Percentage of projects with missing data ()
Percentage of overall financing with missing data ()
Asian Development Bank 18159 15 67 20
International Development Association
17234 23 37 19
Japan 12054 7 67 13
International Bank for Reconstruction and Development
8973 9 45 10
Germany 6439 3 58 7
International Finance Corporation 3642 100 100 4
Islamic Development Bank 3295 100 100 4
France 3023 3 75 3
United States 2931 37 53 3
EU Institutions 2751 19 92 3
African Development Fund (ADF) 2553 100 100 3
African Development Bank 1976 100 100 2
Climate Investment Funds 1056 100 100 1
Korea 1014 20 44 1
Asian Infrastructure Investment Bank 908 100 100 1
Arab Fund for Economic and Social Development (AFESD)
900 100 100 1
United Kingdom 751 12 50 1
Norway 731 8 31 1
OPEC Fund for International Development
643 100 100 1
Kuwait 475 100 100 1
Sweden 432 20 79 0
United Arab Emirates 390 100 100 0
Italy 357 12 56 0
TABLE 4 Missing data for disbursement constraint analysis by donor
Missing information for disbursement constraints analysis 2002ndash2018
ANNEX
51ENERGIZING FINANCE MISSING THE MARK 2020
Recipient Total commitment
Percentage of financing with missing data ()
Percentage of projects with missing data ()
Percentage of overall financing with missing data ()
India 30096 21 65 33
Bangladesh 14628 28 62 16
Pakistan 14034 21 62 15
Kenya 6041 32 61 7
Ethiopia 4010 34 56 4
Tanzania 3631 39 57 4
Nigeria 2935 66 56 3
Uganda 2679 38 55 3
Myanmar 2570 5 40 3
Mozambique 2068 29 63 2
Yemen 1672 48 86 2
Congo (DR) 1656 23 63 2
Angola 1351 93 70 1
Burkina Faso 1311 53 71 1
Sudan 1102 99 82 1
Niger 1041 61 81 1
Malawi 616 5 47 1
Madagascar 357 34 79 0
Chad 173 68 81 0
Democratic Peoples Republic of Korea 134 99 80 0
Donor Total commitment (USD million)
Percentage of financing with missing data ()
Percentage of projects with missing data ()
Percentage of overall financing with missing data ()
Denmark 233 0 51 0
Belgium 193 76 96 0
Green Climate Fund 177 26 50 0
Global Environment Facility 157 51 78 0
Netherlands 140 20 58 0
Finland 108 3 33 0
Others 410 NA NA 0
Source South Pole 2020 based on OECD CRS data
Source South Pole 2020 based on OECD CRS data
TABLE 5 Missing data for disbursement constraint analysis by recipient
ANNEX
52ENERGIZING FINANCE MISSING THE MARK 2020
Flow types Total commitment
Percentage of financing with missing data ()
Percentage of projects with missing data ()
Percentage of overall financing with missing data ()
ODA Loans 46563 21 71 51
Other Official Flows (non-export credit) 35093 39 77 38
ODA Grants 9945 31 58 11
Equity Investment 431 65 52 0
Private Development Finance 73 10 33 0
Number of transactions per project
Total commitment Number of projects Share of overall financing with missing data ()
1 10340 1169 11
2 10132 557 11
3 8555 252 9
4 7251 140 8
5 5057 93 5
6 4395 57 5
7 3985 47 4
8 2505 38 3
9 2987 42 3
10 2710 27 3
10+ 7234 116 8
TABLE 6 Missing data for disbursement constraint analysis by flow type
TABLE 7 Missing data for disbursement constraint analysis by number of transactions per project
Source South Pole 2020 based on OECD CRS data
Source South Pole 2020 based on OECD CRS data
ANNEX
53ENERGIZING FINANCE MISSING THE MARK 2020
Description of the clean cooking keyword search methodology
A multi-step keyword search analysis was used to
identify clean cooking transactions in the CRS data First
an initial list of clean cooking transactions for 2018 was
identified with a preliminary list of keywords consisting
of cook cooker cooking stove(s) pellet(s) biomass
biogas LPG kerosene indoor briquette liquefied
The analysis shows that some keywords such as
pellet(s) reliably identify clean cooking transactions
but identify few transactions Other keywords such as
stove(s) reliably identify clean cooking transactions and
identify many transactions Others such as cook and
cooking identify many transactions but are somewhat
less reliable in identifying clean cooking transactions
wood ethanol digester manure and cylinder(s) Both
the project titles and descriptions were automatically
examined with the statistical software Stata
Second each of these 240 transactions was manually
checked to verify whether it was in fact clean cooking
related Third the accuracy of each of the individual
keywords was then assessed from this manual check and
reported in Table 8 (see below)
The top seven keywords based on these criteria were
chosen for the definitive keyword text search that was
used to identify the final list of clean cooking transactions
for all years
Keywords Transactions flagged (2018) Number of true positive (manual check)
Percentage of true positives ()
All keywords 240 51 21Pellet 1 1 100
Pellets 1 1 100
Digester 1 1 100
Stoves 25 24 96
Stove 31 28 90
Cook 55 30 55
Cooking 36 18 50
Liquefied 8 3 38
Ethanol 3 1 33
Biogas 23 5 22
Biomass 49 7 14
Wood 60 7 12
Indoor 40 0 0
LPG 12 0 0
Cooker 6 0 0
Kerosene 5 0 0
Manure 5 0 0
Cylinder 2 0 0
Briquette 1 0 0
Cylinders 1 0 0
TABLE 8 Keywords ranked by quality
Source South Pole 2020 based on OECD CRS data
ANNEX
54ENERGIZING FINANCE MISSING THE MARK 2020
ANNEX II
DETAILED METHODOLOGY FOR THE RISE CORRELATION ANALYSIS
To address the omitted variable bias inherent in probing
the relationship between regulatory improvements and
aid activity a fixed effects regression specification was
important Country-fixed effects explain the variation in
development finance commitments and disbursements
that are associated with country-specific factors that
do not vary over time such as geography or language
Time-fixed effects capture the variation in commitments
and disbursements that is associated with specific years
and does not vary across countries such as years when
governments have more fiscal space for development
finance The remaining variation therefore depends on
factors that vary within countries and across time ndash such
as the regulatory and policy changes captured by the
RISE
The correlation analysis is observational (ie non-
experimental) so results must be interpreted with
caution Although fixed effects capture a significant
share of bias stemming from key variables omitted
they cannot capture omitted variable bias from time-
varying country-varying changes Moreover the true
relationships between the variables analyzed (and
those that are omitted) may be complex non-linear and
interactive which may not match the linear regression
specification As a result the results presented below
should be interpreted as suggestive
The RISE data span eight years from 2010 to 2017 and
cover all high-impact countries (HICs) for electricity
access energy efficiency and renewable energy (RE)
except Korea (DPR) and Yemen Therefore the regression
has a relatively small sample of 144 data points With
the 18 country fixed effect dummies and the eight-year
fixed effect dummies there are 118 remaining degrees
of freedom The small size of the sample results from the
fact that the RISE do not cover the period prior to 2010
The independent variable in the regressions mdash the
variable to be explained mdash is commitments and
disbursements per capita to the energy sector The
data were normalized by population so that they are
comparable across countries and so that the units in the
regressions are appropriate
Key co-variates from the World Development Indicators
(WDI) data include real purchasing power parity-
adjusted per capita income which serves as a proxy
for living standards the share of the population that is
electrified which serves as a proxy for the electrification
gap and the share of the ruralurban population that is
electrified which can be used to compute the gap in
electrification across sectors Other variables contained
in the WDI data such as the megawatts of generation
capacity per inhabitant could not be included in the
analysis due to limited coverage
DETAILED RESULTS
The RISE for electricity access energy efficiency and
RE do not appear to be strongly correlated with overall
energy sector development finance commitments per
capita in HICs
In the baseline regression with no dependent variables
the fixed effects capture 30 percent of the variation
in overall energy-sector commitments per inhabitant
(regression A1) Adding the RISE for electricity access
increases the R2 to 35 percent (A2) and adding in
the one-year change in the RISE increases the R2 to
31 percent (A3) Adding both the indicator and the
change increases the R2 to 33 percent (A4) For each of
these regression specifications the increase in the R2
over the baseline is small and none of the coefficients
is statistically significant As a result changes in the
electricity-access regulations and policies that the RISE
measure do not appear to have much explanatory power
over development finance commitments to the energy
sector in HICs in the short term
ANNEX
55ENERGIZING FINANCE MISSING THE MARK 2020
Adding the RISE for energy efficiency to the baseline
regression increases the R2 to 35 percent (A5) adding
the change in the RISE for energy efficiency increases
the R2 to 31 percent (A6) and adding both increases the
R2 to 31 percent (A7) As is the case with the electricity
access indicators the energy efficiency indicators are
not statistically significant and do not materially increase
the share of the variation in commitments explained by
the regression Similarly adding the RISE for RE to the
baseline regression increases the R2 to 34 percent (A8)
adding the change in the RISE for renewable energy
increases the R2 to 33 percent (A9) and adding both
increases the R2 to 33 percent (A10) Like with the other
two indicators the coefficients for the RE indicator are
not statistically significant and do not materially increase
the share of the variation in commitments explained by
the regression Therefore the changes in the energy
efficiency and RE regulation and policies that the RISE
measure appear to have limited explanatory power over
total energy-sector development finance commitments
in HICs
Other variables in the WDI data do appear to be
strongly correlated with energy-sector development
finance commitments For example a regression that
includes the share of populations with electrification
the difference between urban and rural electrification
rates and per capita income increases the R2 to 47
percent (model A11) and yields statistically significant
coefficients for the first two variables The negative sign
for the coefficient for the share of electrified persons
in the country and the gap between urban and rural
electrification rates is consistent with the notion that
countries in greater need should be the recipients of
more development finance
VARIABLES (1)A1
(2)A2
(3)A3
(4)A4
(5)A5
(6)A6
(7)A7
(8)A8
(9)A9
(10)A10
(11)A11
RISE_ea00952(00772)
0146(0113)
RISE_re00445(00714)
00187(00795)
RISE_ee-0108(0123)
-00895(0164)
RISE_ea_chg00244(00862)
-00785(0119)
RISE_ee_chg00821(0162)
0130(0202)
RISE_re_chg0177
(00965)0168
(00966)
ea pct-3707(1497)
ea_gap_urb_ru-3025
(9352)
gdp_pc-0000130(000439)
Constant4235(3832)
2253(3972)
4843(4817)
0364(4305)
5329(4236)
4916(4769)
5162(4803)
4496(4264)
4552(4705)
4276(4737)
4942(2007)
Observations R-squaredCountry FEYear FEStandard Errors
1710296YesYes
Robust
1440353YesYes
Robust
1260311YesYes
Robust
1260328YesYes
Robust
1440347YesYes
Robust
1260312YesYes
Robust
1260314YesYes
Robust
1440344YesYes
Robust
1260326YesYes
Robust
1260326YesYes
Robust
1430465YesYes
RobustRobust standard errors in parentheses
plt001 plt005 plt01
FIGURE 20Energy sector commitments per capita and RISE scores HICs 2013-2018
Source South Pole 2020
ANNEX
56ENERGIZING FINANCE MISSING THE MARK 2020
RISE for electricity access energy efficiency and RE also
do not appear to be strongly correlated with energy-
sector finance disbursements in HICs The baseline
regression with no covariates (regression B1) explains 46
percent of the variation in disbursements per capita The
R2 increases to 49 percent when the RISE for electricity
access is added (B2) increases to 52 percent when the
The increases in R2 are modest (less than seven
percentage points) and none of the coefficients is
statistically significant which again suggests that
changes in the policies and regulations for electricity
access and energy efficiency captured by the RISE are
not strong predictors of energy-sector development
finance disbursements in the short term
However the coefficient for the RE indicator significantly
statistically predicts per capita energy disbursements
change in the indicator is added (B3) and increases to
52 percent when both the indicator and the change
are added (B4) Similarly the R2 increases to 49 percent
when the RISE for energy efficiency is added (B5)
increases to 52 percent when the change in the indicator
is added (B6) and increases to 52 percent when both
the indicator and the change are added (B7)
in HICs at the 10 percent significance level Every
additional point in the RE indicator is associated on
average with USD 005 in additional disbursements
(B8) and its inclusion improves the share of the variation
explained by about three percentage points The other
two regression specifications with RE covariates (B9 and
B10) do not have statistically significant coefficients and
increase the R2 to 52 percent from the baseline of 46
percent
VARIABLES (1)B1
(2)B2
(3)B3
(4)B4
(5)B5
(6)B6
(7)B7
(8)B8
(9)B9
(10)B10
(11)B11
RISE_ea00308(00281)
00476(00430)
RISE_re00504(00276)
00506(00307)
RISE_ee00275(00530)
-00102(00698)
RISE_ea_chg-00296(00408)
-00632(00566)
RISE_ee_chg00584(00397)
00639(00530)
RISE_re_chg-000815(00405)
-00312(00442)
ea pct-8367(6638)
ea_gap_urb_ru-9012(4258)
gdp_pc-000473
(000164)
Constant3542(2546)
3431(2610)
4852(3130)
3389(2826)
4286(2844)
4831(3156)
4859(3190)
3675(2824)
4821(3138)
4077(3158)
3816(8655)
Observations R-squaredCountry FEYear FEStandard Errors
1710457YesYes
Robust
1440491YesYes
Robust
1260518YesYes
Robust
1260524YesYes
Robust
1440488YesYes
Robust
1260518YesYes
Robust
1260519YesYes
Robust
1440494YesYes
Robust
1260516YesYes
Robust
1260521YesYes
Robust
1430712YesYes
RobustRobust standard errors in parentheses
plt001 plt005 plt01
FIGURE 21Energy sector disbursements per capita and RISE scores HICs 2013-2018
Source South Pole 2020
ANNEX
57ENERGIZING FINANCE MISSING THE MARK 2020
Development finance commitments and disbursements
specifically for RE in HICs are significantly smaller than
overall energy sector development finance In the
2010ndash2017 period where RISE scores are available
for example only 45 percent of the country-year
observations have new RE commitments and only 74
percent have disbursements
Puzzlingly RISE scores for quality of policies and
regulations for RE are associated with lower RE
development finance in the case of both commitments
and disbursements (regressions C2-C4 D2-D4)
Moreover for disbursements the negative coefficients
are statistically significant This implies that on average
HICs that improve their RISE score for RE tend to
receive less RE development finance One possible
interpretation is that alternative sources of financing
become more viable and increase as RISE scores (and
therefore policies and regulation) improve thus reducing
the need for development finance
VARIABLES (1)Model C1
(2)Model C2
(3)Model C3
(4)Model C4
RISE_re-000130(00246)
-000184(00285)
RISE_re_chg00479(00383)
00485(00385)
Constant-0492(0246)
-0408(0435)
-0371(0295)
-0343(0496)
Observations R-squaredCountry FEYear FEStandard Errors
1640235YesYes
Robust
1380247YesYes
Robust
1200280YesYes
Robust
1200280YesYes
Robust
VARIABLES (1)Model D1
(2)Model D2
(3)Model D3
(4)Model D4
RISE_re-00167(000867)
-00266(00121)
RISE_re_chg000152(000766)
00109(000923)
Constant-0322(0206)
00755(0164)
-0209(0122)
0196(0200)
Observations R-squaredCountry FEYear FEStandard Errors
1640484YesYes
Robust
1380467YesYes
Robust
1200504YesYes
Robust
1200536YesYes
Robust
Robust standard errors in parentheses plt001 plt005 plt01
Robust standard errors in parentheses plt001 plt005 plt01
FIGURE 22RE commitments per capita and RISE scores
FIGURE 23RE disbursements per capita and RISE scores
Source South Pole 2020
Source South Pole 2020
ANNEX
58ENERGIZING FINANCE MISSING THE MARK 2020
ANNEX III
REVIEW OF EVALUATION REPORTS
Information contained in the available literature was
reviewed In order to do this in a structured and organized
manner information capture has been recorded in a grid
to easily store classify and refer to information that is
linked to disbursement constraints identified barriers
and recommendations for improvement
This classification of information has helped to determine
the various reasons that are most often referenced as
causing delays in disbursements for energy-access
projects in a structured manner This also helped to
identify interesting case studies that could add valuable
insights and a narrative to the analysis Where possible
the reasons behind delays or gaps in disbursements will
be cross-referenced with the results from the quantitative
analysis The analysis grid is detailed in Table 9
Information is then inserted into a matrix that allowed us to summarize and synthesize the different types of
disbursement constraints (regulatory institutional technical) that were faced in the panel of projects studied and the
potential solutions implemented to overcome these barriers The analysis criteria are presented in the table below
Finally a case study was extracted for each deep-dive country ie a project with its characteristics highlighting
disbursement difficulties and mechanisms used to mitigate these challenges if any
Data fields of interest for the qualitative analysis
Type of source (multilateral and bilateral donorsdevelopment partners national actorsacademia)
Name of the organization
Name of the report
Name of the deep-dive country (Ethiopia India Myanmar Madagascar Nigeria Rwanda)
Report description
Sector concerned (electricityclean cookingboth)
Financial instrument(s) mentioned in the report
Recommendations for improvementslessons learnt (if any)
Ethanol
Type of disbursement constraints underlying challenges
Sub-sector Proposed solutions
Regulatory and policy barriers
Institutional structure and public sector capacity
Limited access to finance and local market
Technical barriersflaws in project design
Public awareness
TABLE 9 Analysis grid for review of reports
TABLE 10 Report review matrix
Source South Pole 2020
Source South Pole 2020
ANNEX
59ENERGIZING FINANCE MISSING THE MARK 2020
ADB Asian Development Bank
AFDB African Development Bank
ADF African Development Fund (window of the AFDB)
APD average project delay
BOI Nigerian Bank of Industry
CRS Creditor Reporting System
DAC Development Assistance Committee
DFI development finance institution
DRC Democratic Republic of Congo
DPR Democratic Peoplersquos Republic
GEF Global Environmental Fund
GHG greenhouse gas
HIC high-impact country
IBRD International Bank for Reconstruction and Development (member of the World Bank Group)
ICS improved cooking stove
IDA International Development Association (member of the World Bank Group)
IEA International Energy Agency
IFC International Finance Corporation (member of the World Bank Group)
LPG liquified petroleum gas
ODA Official Development Assistance
OECD Organization for Economic Cooperation and Development
OOF Other Official Flows
PMU project management unit
PREP Promoting Renewable Energy Program
PV photovoltaic
QUODA Quality of Official Development Assistance
RE renewable energy
RISE Regulatory Indicators for Sustainable Energy
SDG Sustainable Development Goal
SEforALL Sustainable Energy for All
SMEs small and medium-sized enterprises
UNDP United Nations Development Programme
UNIDO United Nations Industrial Development Organization
WDI World Development Indicators
ABBREVIATIONS
GLOSSARYAverage Project Delay (APD) ndash an indicative measure
of the severity of disbursement constraints The
minimum value of -100 indicates that the project
timeline has elapsed with no disbursements A value of
zero indicates that disbursements are on schedule The
maximum value of 100 indicates that all commitments
have been disbursed on or before the project start date
Beneficiary ndash a recipient of development finance
including intermediaries
Commitment ndash a firm written obligation by means of
a board decision on investment closure of a financing
contract or similar actions and backed by the necessary
funds to provide specified assistancefinancing to
a project recipient country or any other partner
organization
Development finance ndash Finance tracked in the Creditor
Reporting System32 (CRS) database of the Organisation
for Economic Co-operation and Development (OECD)
including both Official Development Assistance (ODA)
and Other Official Flows (OOF) The donor categories
include Development Assistance Committee (DAC)
countries other non-DAC countries (though not
including China India and Russia) private foundations
(such as the Hewlett Foundation and the Bill and
Melinda Gates Foundation) bilateral and multilateral
development agencies (such as the United States
Agency for International Development (USAID))
development finance institutions (such as the World
Bank) and United Nations agencies
Disbursement ndash the placement of resources at the
disposal of a recipient country or agency or in the
case of internal development-related expenditures the
outlay of funds by the public sector
Disbursement constraint ndash the difficulty that
development partners and beneficiaries face to meet a
32 The objective of the CRS Aid Activity database is to provide a set of readily-available basic data that enable analysis on where aid goes what purposes it serves and what policies it aims to implement on a comparable basis for all Development Assistance Committee members More information on httpswwwoecd-ilibraryorgdevelopmentdatacreditor-reporting-system_dev-cred-data-en33 Between 2013 and 2018 clean cooking transactions classified as energy projects in the OECD CRS database amounted to less than USD 60 million in commitments (011 percent of total) and USD 17 million (005 percent of total) in disbursements
commitment either in terms of the amount of financing
disbursed or the timeframe for disbursement Pre-
commitment delays are excluded from this analysis
Donor ndash a government or official agency making a
commitment to provide development finance
Energy ndash in the OECD CRS database energy projects
encompass energy policy energy generation (renewable
sources) energy generation (non-renewable sources)
hybrid energy plants nuclear energy and energy
distribution Energy projects include off-grid and some
clean cooking projects33 these may not include all such
projects tracked in the OECD CRS database due to data
limitations as detailed in Annex I
High-impact countries ndash the 20 countries with the
highest absolute gaps in access to electricity andor
clean fuels and technologies for cooking measured
by population as identified in Tracking SDG7 The
Energy Progress Report 2020 For electricity access
the countries are Angola Bangladesh Burkina Faso
Chad Congo (DR) Ethiopia India Kenya Korea (DPR)
Madagascar Malawi Mozambique Myanmar Niger
Nigeria Pakistan Sudan Tanzania Uganda and Yemen
For clean cooking access the countries are Afghanistan
Bangladesh China Congo (DR) Ethiopia Ghana
India Indonesia Kenya Korea (DPR) Madagascar
Mozambique Myanmar Nigeria Pakistan Philippines
Sudan Tanzania Uganda and Vietnam The Energizing
Finance Missing the Mark 2017 report utilized a slightly
different list of countries drawn from the Global Tracking
Framework 2015 (International Energy Association (IEA)
and the World Bank 2015)
Renewable energy (RE) projects ndash in line with the
OECD CRS database renewable energy sources include
hydro-electric power plants solar energy wind marine
geothermal and biofuel-fired power plants
61ENERGIZING FINANCE MISSING THE MARK 2020
BIBLIOGRAPHYADB (2016) Myanmar Energy Sector Assessment Strategy and Road Map Retrieved from ADB httpswwwadb
orgdocumentsmyanmar-energy-assessment-strategy-road-map
ADB (2016) Performance Evaluation report Asian Development Bank India Dahanu Solar Power Project Retrieved
from ADB httpswwwadborgsitesdefaultfilesevaluation-document237636filespper-dahanupdf
ADB (2019) Corporate evaluation ADBrsquos Multitranche Financing Facility 2005ndash2018 Performance and Results
Delivered Retrieved from ADB httpswwwadborgsitesdefaultfilesevaluation-document470651filesin367-
19pdf
ADF PARSE Project Completion Report (2018) Retrieved from African Development Bank httpswwwafdborg
endocumentsmadagascar-energy-sector-reform-support-programme-parse-project-completion-report
AFDB (2019) Project Completion Report Multinational-Interconnection of the Electric Grids of The Nile Equatorial
Lakes Countries Retrieved from AFDB httpswwwafdborgendocumentsmultinational-interconnection-ot-
electric-grids-nile-equatorial-lakes-countries-project-completion-report
Butin V Cladiegravere T Scotney R and Levet J (2019) Les Enjeux de lrsquoUniversalisation de lrsquoEacutelectrification Eacutetat des
Lieux amp Recommandations European Union
Center for Global Development (2018) Quality of Official Development Assistance QuODA 2018
Methodology Retrieved from Center for Global Development httpswwwcgdevorgsitesdefaultfilesquoda-
methodology-2018pdf
Clasp (2017) Transforming the Cookstoves Market through Standards amp Labels in Nigeria Retrieved from Clasp
httpsclaspngopublicationstransforming-the-cookstoves-market-through-standards-labels-in-nigeria
Clean Cooking Alliance (2019) Clean Cooking Industry Snapshot an inaugural report on sector investment and
innovation Retrieved from Clean Cooking Alliance httpswwwcleancookingallianceorgreports2019-Clean-
Cooking-Industry-Snapshot2019-Clean-Cooking-Industry-Snapshothtmlpage=1
Dorkenooo K (2018) Clean and Improved Cookstoves and End User Finance Solutions for Clean Energy Solutions
in Adamawa State Nigeria ndash Household survey analysis
Dorman D and Ciplet D (2020) Bridging the Gap Finance for Energy Access in the Green Climate Fund SEI
Report May 2020 Stockholm Environment Institute Stockholm
ESMAP (2018) Annual Report 2018 Retrieved from ESMAP httpswwwesmaporgnode174807
ESMAP (nd) Rethinking Power Sector Reforming the Developing World Retrieved from ESMAP httpwww
esmaporgrethinking_power_sector_reform
62ENERGIZING FINANCE MISSING THE MARK 2020
GIZ (2018) Results-based Financing for Energy Access - how to design and implement project - lessons from the
field Retrieved from ENDEV httpsendevinfoimagesee4EnDev_-_Results-based_Financing_for_Energy_
Access2C_Lessons_reportpdf
Grittner A M (2013) Results-based Financing Evidence from performance-based financing in the health sector
German Development Institute Bonn
Gualberti G Martin FL and Bazilian M (2013) An Econometric Analysis of the Effectiveness of Development
Finance for the Energy Sector Retrieved from SSRN httpspapersssrncomsol3paperscfmabstract_id=2202048
IEA International Renewable Energy Agency United Nations Statistics Division World Bank WHO (2020) Tracking
SDG 7 The Energy Progress Report World Bank Washington DC
IEA (2019) World Energy Investment 2019 Retrieved from IEA httpswebstoreieaorgdownload
direct2738fileName=WEI2019pdf
IISD (2016) Providing Clean Cooking Fuel in India Challenges and Solutions Retrieved from IISD httpswwwiisd
orgsitesdefaultfilespublicationsclean-cooking-india-challenges-solutions_0pdf
International Renewable Energy Agency (2018) Policies and regulation for renewable energy mini-grid Retrieved
from IRENA httpswwwirenaorg-mediaFilesIRENAAgencyPublication2018OctIRENA_mini-grid_
policies_2018pdf
Kar A et al (2019) Using sales data to assess cooking gas adoption and the impact of Indiarsquos Ujjwala programme
in rural Karnataka Nature Energy 4(1) Page 806ndash814 Retrieved from Nature httpswwwnaturecomarticles
s41560-019-0429-8epdfshared_access_token=QJjuDDH1-pUFOKlilynB6NRgN0jAjWel9jnR3ZoTv0OZ3dJZMjvM
Ds8p9tlGZdwXQZs0K3Zx6blm5KFd6AemQgY2GqgAiOvHboVHKYnicJKX6WG8W3IoJm-xHIeyq_9yc5QFhj33B5A-
HmglX6VE02A3D3D
McKee C Blampied C Mitchell I and Rogerson A (2019) Revisiting Aid Effectiveness A New Framework and
Set of Measures for Assessing Aid ldquoQualityrdquo Washington DC The Center for Global Development
Ministry of Agriculture Livestock and Irrigation Myanmar (2016) Myanmar Energy Assessment Retrieved from
Research Gate httpswwwresearchgatenetpublication329266993_Myanmar_Energy_Assessment_Rethinking_
Electrification
Ministry of Foreign Affairs the Netherlands (2014) IOB Evaluation Access to Energy in Rwanda Impact evaluation
of activities supported by the Dutch Promoting Renewable Energy Programme Retrieved from Government of
Netherlands httpswwwgovernmentnldocumentsreports20150428iob-access-to-energy-in-rwanda-impact-
evaluation-of-activities-supported-by-the-dutch-promoting-renewable-energy-programme
Musgrove P (2010) Rewards for good performance or results a short glossary Washington DC World Bank
Retrieved from RBF Health httpwwwrbfhealthorg
Oil Change International (2018) Shortchanging Energy Access A Progress Report on Multilateral Development
Bank Finance Retrieved from the Price of Oil httppriceofoilorg20181010shortchanging-energy-access-
report-mdb-finance
63ENERGIZING FINANCE MISSING THE MARK 2020
Patnaik S S Dethier S Tripathi and A Jain (2017) Access to Clean Cooking Energy in India Beyond
Connections Towards Sustained Use New Delhi Council on Energy Environment and Water
Raitzer DA Bloumlnde N and Sibal J (2019) Impact Evaluation of Energy Interventions A Review of the Evidence
Retrieved from ADB httpswwwadborgsitesdefaultfilespublication502271impact-evaluation-energy-
interventionspdf
SEforALL (2019) Energizing Finance Taking the Pulse 2019 Retrieved from SEforALL httpswwwseforallorg
publicationsenergizing-finance-taking-the-pulse-2019
SEforALL (2017) Energizing Finance Missing the Mark 2017 Retrieved from SEforALL httpswwwseforallorg
publicationsenergizing-finance-missing-the-mark-gaps-and-lags-in-disbursement-of-development
ESMAP (2020) The State of Access to Modern Energy Cooking Services Washington DC World Bank Group
httpdocumentsworldbankorgcurateden937141600195758792The-State-of-Access-to-Modern-Energy-
Cooking-Services
The Asia Foundation (2019) DECENTRALIZING POWER The Role of State and Region Governments in Myanmarrsquos
Energy Sector Retrieved from the Asia Foundation httpsasiafoundationorgwp-contentuploads201904
Myanmar_Decentralizing-Power_Exec-Summarypdf
Transform Global (2019) Portfolio Learnings | Myanmar Stoves Campaign is bringing clean cookstoves to
Myanmar Retrieved from Transform Global httpswwwtransformglobalmodulesContentNewsDetail
aspxappId=2ampNewsId=2779c509-e633-4dea-9c74-08b4ffcd0171
UNDP (2019) Mid-term Review Scale Up of Access to Clean Energy for Rural Productive Uses Retrieved from
UNDP httpsercundporgevaluationevaluationsdetail9598
UNDP (2018) Solar Energy Programme in Nigeria
UNDP India (2019) Mid-term Review Market Transformation and Removal of Barriers for Effective Implementation
of the State Level Climate Change Action Plans
UNIDO (2016) Independent Terminal Evaluation Promoting Ultra low-head Micro Hydropower Technology to
Increase Access to Renewable Energy for Productive Uses in Rural India Retrieved from UNIDO httpswwwunido
orgsitesdefaultfiles2016-12IND-120182_Promoting_ultra_low_head_hydropower_techn_TE_report-2016_0pdf
UNIDO (2018) Independent Mid-term evaluation Promoting energy efficiency and renewable energy in selected
micro small and medium enterprises (MSME) clusters in India Retrieved from UNIDO httpswwwunidoorgsites
defaultfilesfiles2018-09103029-Ind20MTE_Energy20Efficieny20MSME_0pdf
UNIDO (2019) Independent Terminal Evaluation GEF-UNIDO Cleantech programme for small and medium
enterprises in India Retrieved from UNIDO httpswwwunidoorgsitesdefaultfilesfiles2018-0912034520
GEF20UNIDO20Cleantech20Programme20for20SMEs20in20India_0pdf
Vigolo V Sallaku R and Testa F (2018) Drivers and Barriers to Clean Cooking A Systematic Literature Review
from a Consumer Behavior Perspective Sustainability 10(4322) Verona MDPI
World Bank (2018) Incentivizing a Sustainable Clean Cooking Market Lessons from a results-based financing pilot
in Indonesia Retrieved from World Bank httpdocuments1worldbankorgcurateden173331531226135009
pdf128162-WP-P144213-PUBLIC-WBIndonesiaRBFWEBpdf
copy 2020 SUSTAINABLE ENERGY FOR ALL
Vienna (Headquarters)Andromeda Tower 15th Floor
Donau City Strasse 6
1220 Vienna Austria
Telephone +43 676 846 727 200
Washington DC1750 Pennsylvania Ave NW
Washington DC 20006 USA
Telephone +1 202 390 0078
New York420 5th Ave
New York NY 10018 USA
Website wwwSEforALLorg
RIGHTS AND PERMISSIONSThe material in this work is subject to copyright Because SEforALL encourages dissemination of its knowledge this
work may be reproduced in whole or in part for noncommercial purposes if full attribution to this work is given to
Sustainable Energy for All (SEforALL) SEforALL does not guarantee the accuracy of the data included in this work
COPYRIGHT AND DISCLAIMER
ENERGIZING FINANCEENERGIZING FINANCE
MISSING THE MARK
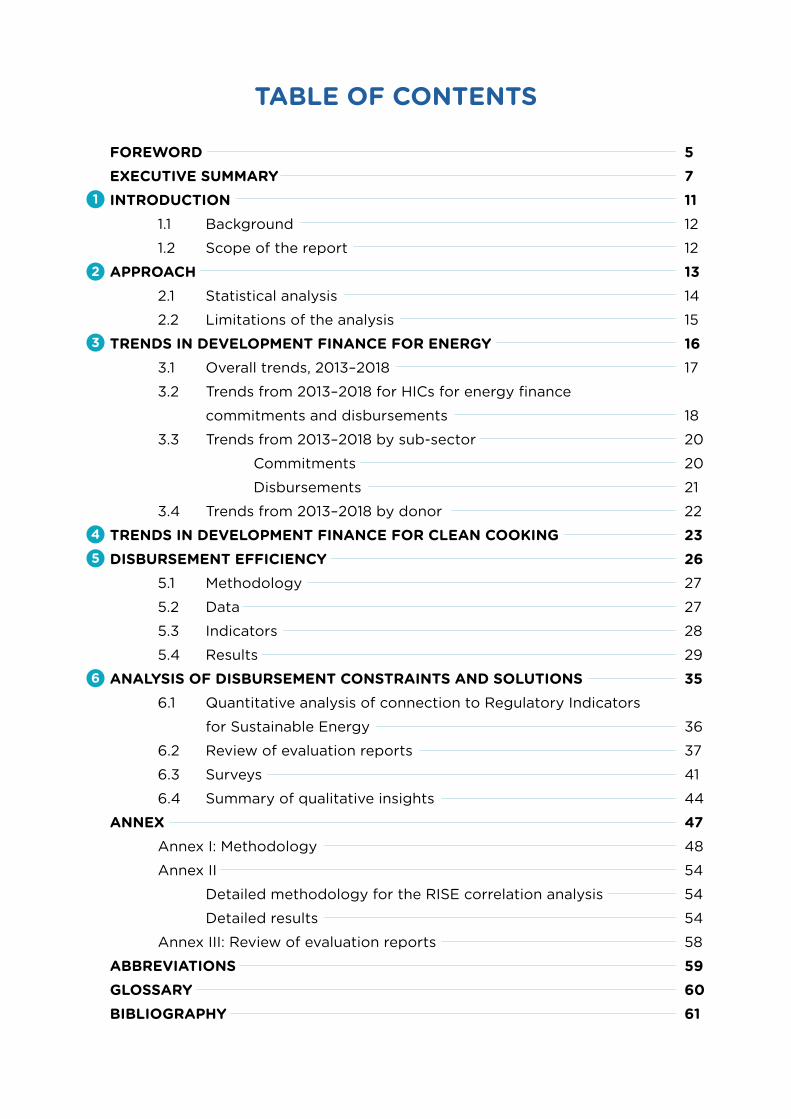
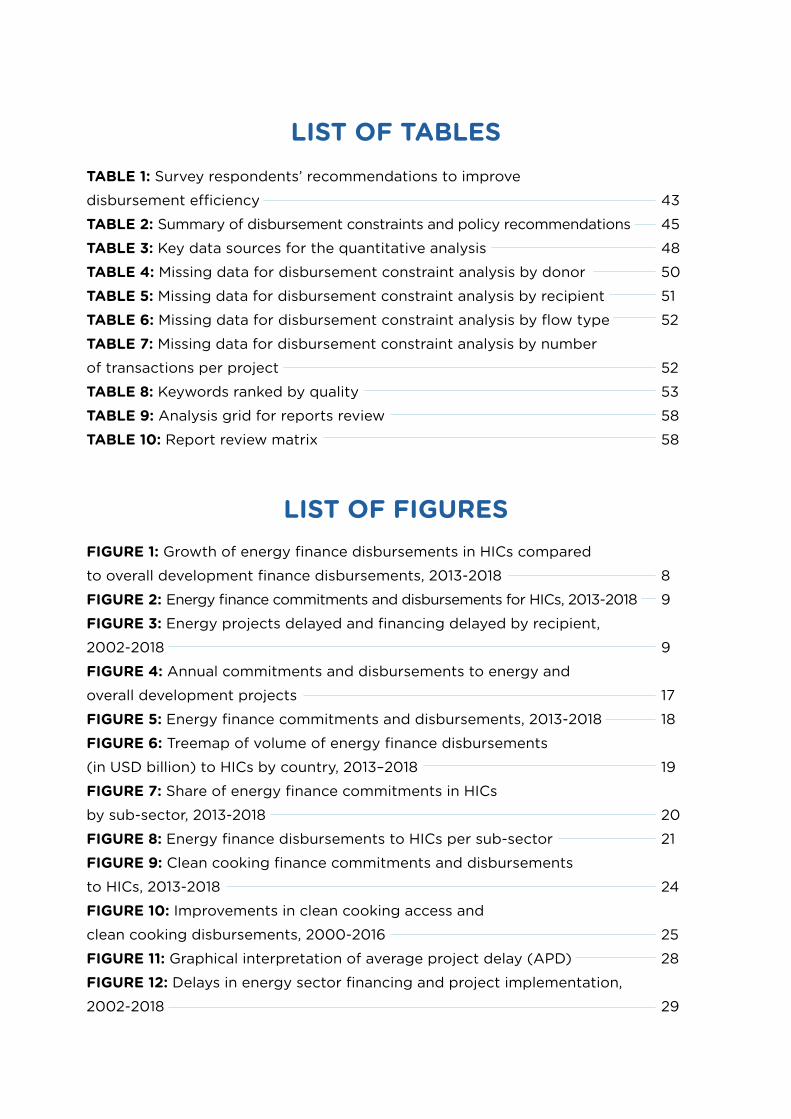
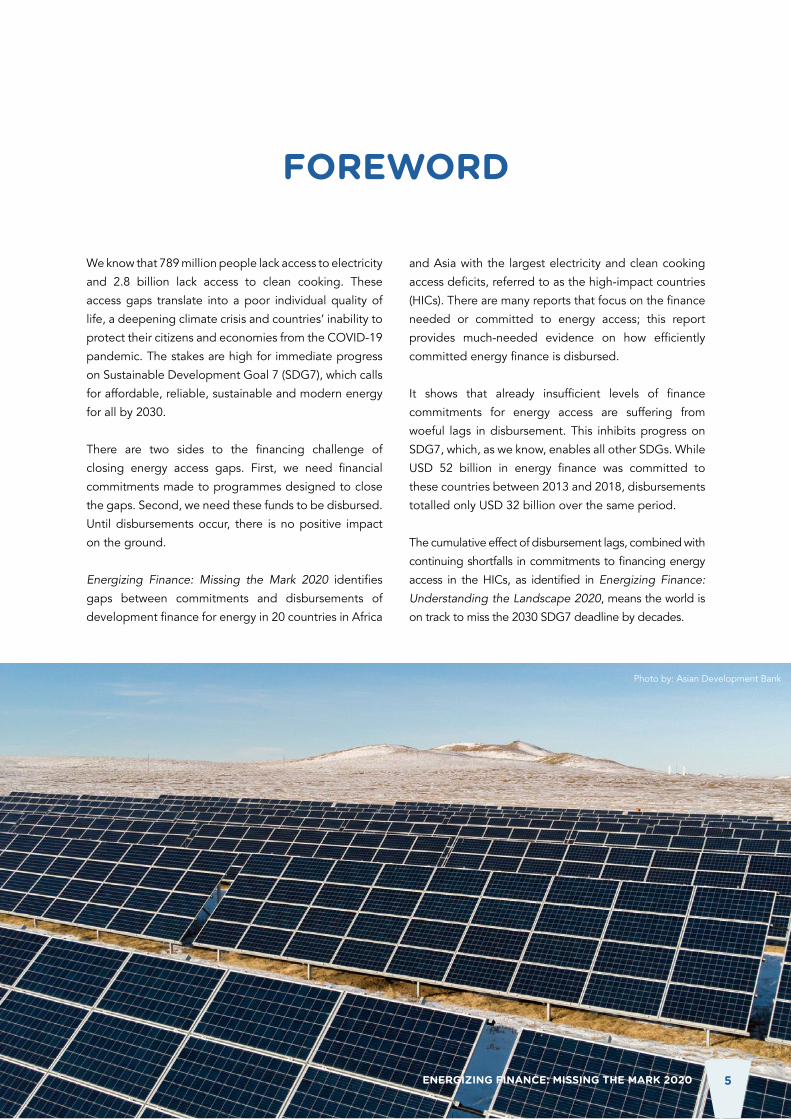
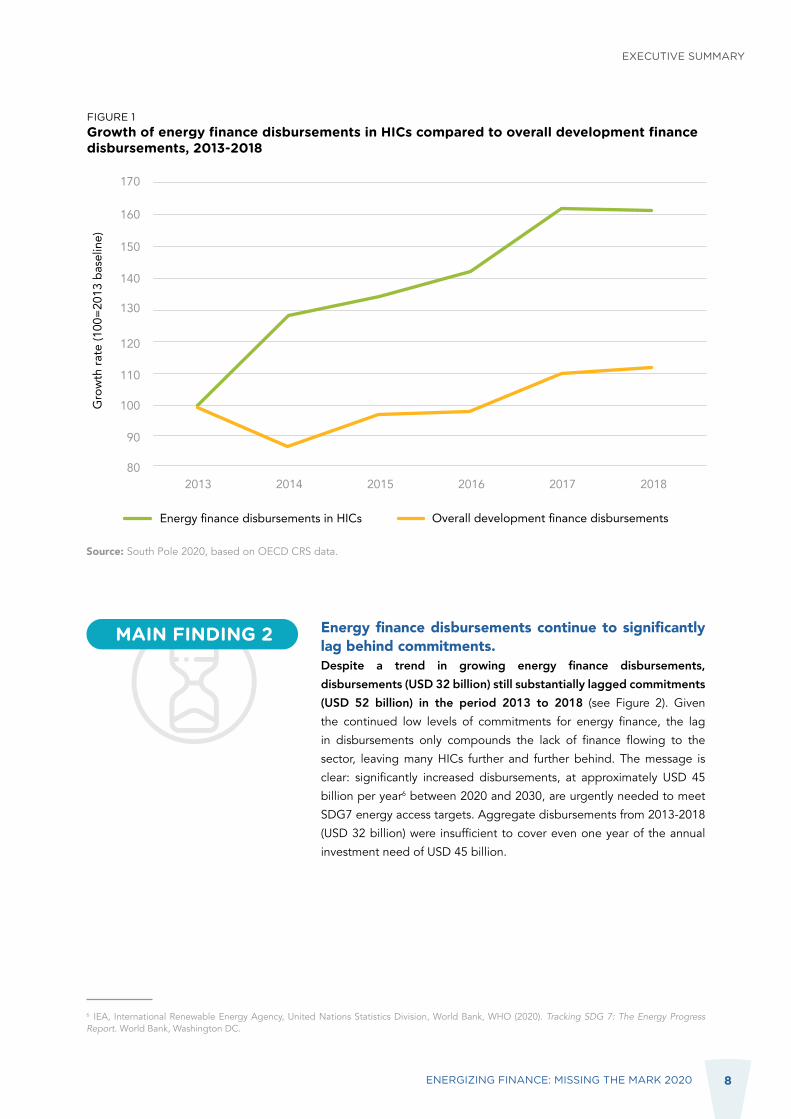
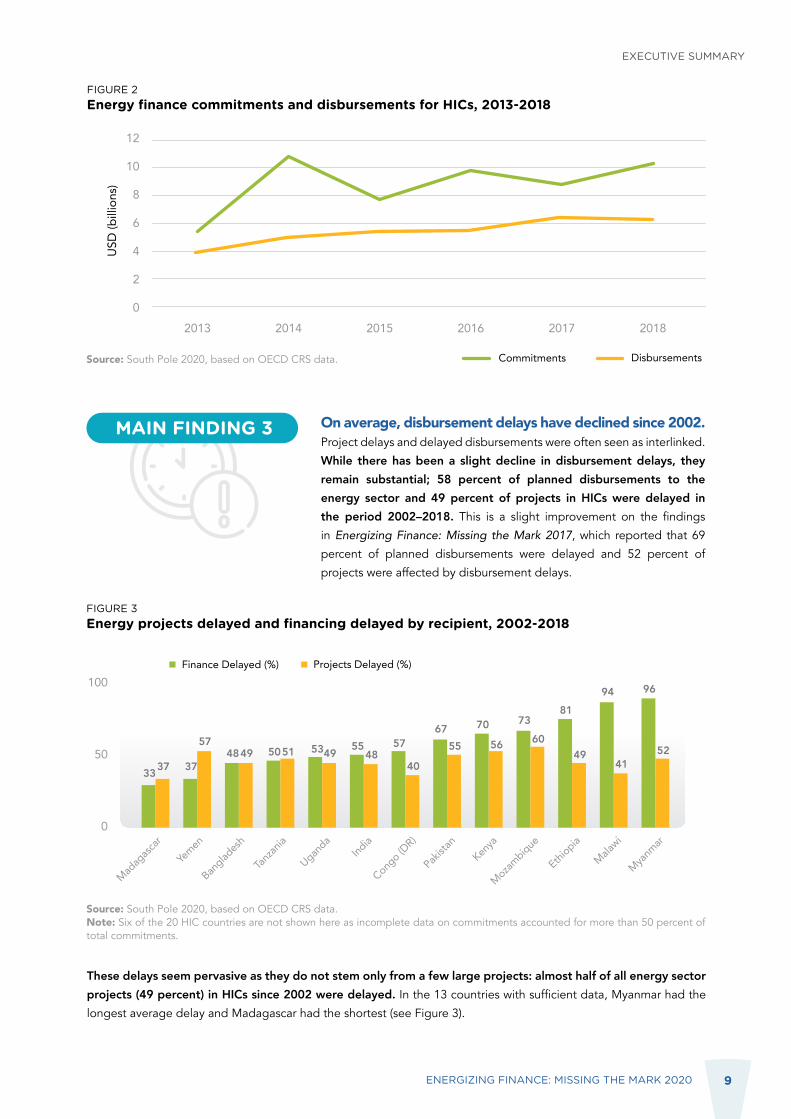
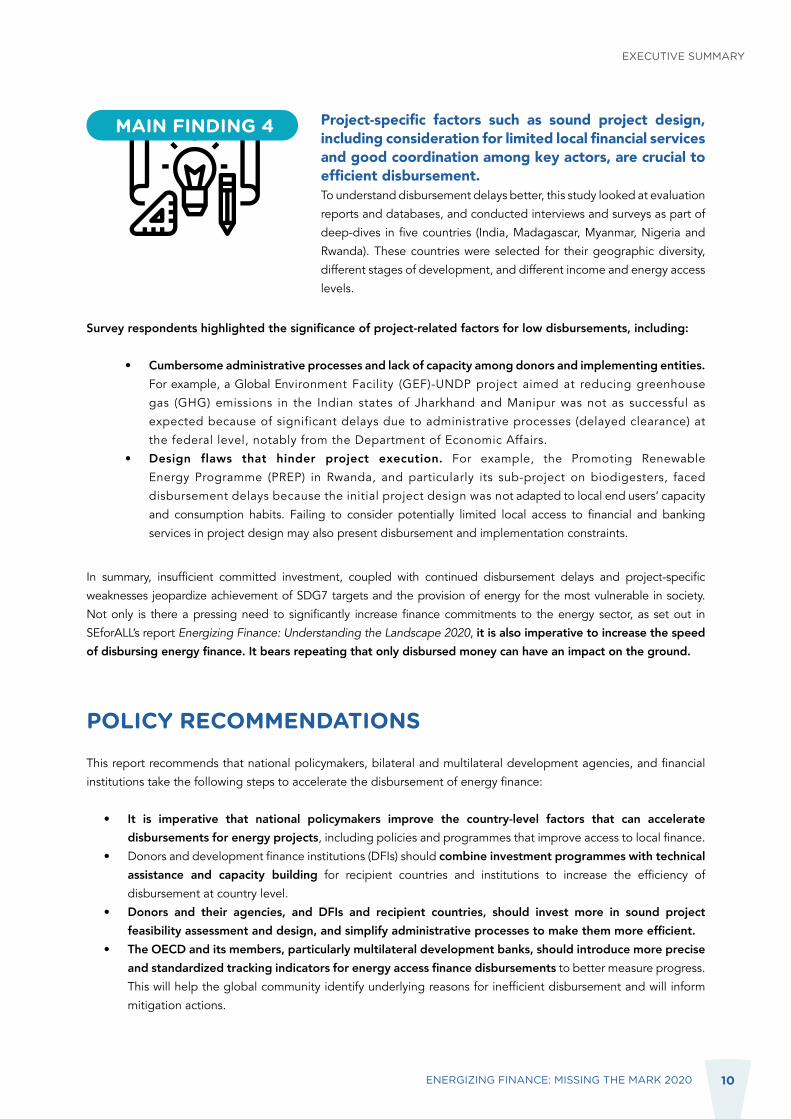