energex regulatory proposal 2020-25 - 1.003 regulatory proposal 2020-25... · energex regulatory...
TRANSCRIPT

Energex Regulatory Proposal 2020-25 1
Energex Regulatory Proposal
2020-25 January 2019

Energex Regulatory Proposal 2020-25 1
__________________________________
Copyright
© Energex Limited (ABN 40 078 849 055) and Energy Queensland Limited (ABN 612 535 583) This material is copyright. No part of this material may be copied, reproduced, adapted or transmitted in any form without the prior written consent of the copyright owner/s, except as permitted under the Copyright Act 1968 (Cth). If consent is provided, it will be subject to the requirement that there is due acknowledgement of the copyright owner/s as the source. Requests and enquiries concerning reproduction and rights should be addressed to: General Manager Customer, Brand & External Relations 11 Enterprise Street BUNDABERG QLD 4670 Or via [email protected]

Energex Regulatory Proposal 2020-25 2
Contents
Executive Summary ........................................................................................................................ 6
Part A – Introduction ....................................................................................................................... 1
1. About us and this Regulatory Proposal ..................................................................................... 2
1.1 Our electricity distribution service area ............................................................................ 2
1.2 Managing our network in a time of change ...................................................................... 5
1.3 Our Regulatory Proposal ................................................................................................. 6
1.4 Next steps and on-going consultation .............................................................................. 6
1.5 Supporting documentation ............................................................................................... 7
2. Listening and responding to our customers .............................................................................. 8
2.1 Our engagement program ............................................................................................... 8
2.2 Safety ............................................................................................................................ 12
2.3 Affordability ................................................................................................................... 12
2.4 Security ......................................................................................................................... 15
2.5 Sustainability ................................................................................................................. 16
2.6 Supporting documentation ............................................................................................. 19
3. What we have delivered in the 2015-20 regulatory control period ........................................... 20
3.1 Network bill impacts ...................................................................................................... 22
3.2 Our financial performance ............................................................................................. 22
3.3 Our service performance ............................................................................................... 25
3.4 Other customer performance ......................................................................................... 27
4. Our response to AER’s framework and approach paper ......................................................... 30
4.1 Overview ....................................................................................................................... 30
4.2 Service classification ..................................................................................................... 31
4.3 Control mechanisms ...................................................................................................... 33
4.4 Incentive schemes......................................................................................................... 34
4.5 Expenditure forecast assessment guideline .................................................................. 34
4.6 Depreciation .................................................................................................................. 34
4.7 Supporting documentation ............................................................................................. 34
Part B – Standard Control Services .............................................................................................. 35
5. Demand Forecast ................................................................................................................... 36
5.1 Overview ....................................................................................................................... 36
5.2 Our customer numbers forecasting approach ................................................................ 37
5.3 Our peak demand forecasting methodology .................................................................. 38
5.4 Our electricity delivered forecasting methodology ......................................................... 39
5.5 Supporting documentation ............................................................................................. 40

Energex Regulatory Proposal 2020-25 3
6. Operating Expenditure forecasts ............................................................................................ 41
6.1 Overview ....................................................................................................................... 41
6.2 What we have heard from our customers ...................................................................... 43
6.3 The nature and drivers of our opex ................................................................................ 43
6.4 Key opex assumptions .................................................................................................. 45
6.5 AER requirements and approach .................................................................................. 45
6.6 Our opex forecasting approach ..................................................................................... 46
6.7 Base year ...................................................................................................................... 47
6.8 Rate of change – price .................................................................................................. 51
6.9 Rate of change – outputs .............................................................................................. 52
6.10 Rate of change – productivity ........................................................................................ 53
6.11 Specific or category forecasts ....................................................................................... 53
6.12 Our opex forecast .......................................................................................................... 54
6.13 Supporting documentation ............................................................................................. 54
7. Capital expenditure forecasts ................................................................................................. 56
7.1 Overview ....................................................................................................................... 57
7.2 The nature and drivers of our capex .............................................................................. 60
7.3 What we have heard from our customers ...................................................................... 61
7.4 Key capex assumptions ................................................................................................ 62
7.5 Our expenditure forecasting methods ............................................................................ 63
7.6 Our forecast capex ........................................................................................................ 64
7.7 Replacement capex ....................................................................................................... 65
7.8 Augmentation capex ...................................................................................................... 70
7.9 Connections capex and customer contributions ............................................................ 74
7.10 Non-Network capex ....................................................................................................... 75
7.11 Capitalised overheads ................................................................................................... 80
7.12 Supporting documentation ............................................................................................. 82
8. Regulatory asset base and depreciation ................................................................................. 90
8.1 Overview ....................................................................................................................... 90
8.2 Establishing the opening RAB ....................................................................................... 91
8.3 Forecast RAB ................................................................................................................ 92
8.4 Forecast depreciation .................................................................................................... 93
8.5 Supporting documentation ............................................................................................. 96
9. Rate of return ......................................................................................................................... 97
9.1 Overview ....................................................................................................................... 97
9.2 Rate of return ................................................................................................................ 97
9.3 Debt and equity raising costs ........................................................................................ 99

Energex Regulatory Proposal 2020-25 4
9.4 Expected inflation ........................................................................................................ 100
9.5 Supporting documentation ........................................................................................... 101
10. Estimated cost of corporate income tax ................................................................................ 102
10.1 Overview ..................................................................................................................... 102
10.2 Forecast corporate tax allowance ................................................................................ 102
10.3 Forecast tax depreciation ............................................................................................ 103
11. Incentive schemes ................................................................................................................ 105
11.1 Overview ..................................................................................................................... 105
11.2 Efficiency Benefit Sharing Scheme .............................................................................. 106
11.3 Capital Expenditure Sharing Scheme .......................................................................... 107
11.4 Service Target Performance Incentive Scheme ........................................................... 108
11.5 Demand Management Incentive Scheme and Innovation Allowance Mechanism ........ 108
11.6 Supporting documentation ........................................................................................... 109
12. Pass through events and contingent projects ....................................................................... 110
12.1 Overview ..................................................................................................................... 110
12.2 Proposed nominated pass through events .................................................................. 110
12.3 Application of pass through to SCS and ACS .............................................................. 113
12.4 Contingent projects ..................................................................................................... 113
13. Annual revenue requirements and X-factors ......................................................................... 114
13.1 Overview ..................................................................................................................... 114
13.2 Annual revenue requirements ..................................................................................... 116
13.3 Revenue adjustments .................................................................................................. 118
13.4 Shared assets ............................................................................................................. 119
13.5 X Factors ..................................................................................................................... 119
14. Indicative distribution network charges and bill impacts ........................................................ 120
14.1 Our Network Pricing Principles .................................................................................... 120
14.2 Customer Distribution Network Charges Impacts ........................................................ 121
14.3 Supporting documentation ........................................................................................... 122
Part C - Alternative Control Services........................................................................................... 123
15. Alternative Control services .................................................................................................. 124
15.1 Overview ..................................................................................................................... 124
15.2 Type 6 Metering services ............................................................................................ 124
15.3 Public Lighting Services .............................................................................................. 126
15.4 Other Alternative Control Services .............................................................................. 129
15.5 Supporting documentation ........................................................................................... 130
Part D – Other Matters ................................................................................................................ 131
16. Other Matters ....................................................................................................................... 132

Energex Regulatory Proposal 2020-25 5
16.1 Negotiating framework ................................................................................................ 132
16.2 Jurisdictional Schemes ................................................................................................ 132
16.3 Confidential information ............................................................................................... 132
16.4 Governance, assurance and certifications ................................................................... 133
16.5 Supporting documentation ........................................................................................... 133
16.6 Abbreviations .............................................................................................................. 134
Energex Regulatory Proposal 2020-25 6
Executive Summary
We exist to provide electricity distribution services to our fellow Queenslanders. Over the past year,
we have engaged our community stakeholders, our customers, and our industry partners to better
understand what they need, value and expect from us. We have heard loud and clear that our
customers want us to ‘safely deliver affordable, secure and sustainable energy solutions’. This
Regulatory Proposal details how we will deliver these outcomes from 1 July 2020.
In parallel, we have engaged the Australian Energy Regulator (AER) on how it regulates our
distribution services. This Regulatory Proposal broadly accepts and applies the AER’s Framework
and Approach paper and its Guidelines for how it sets our revenues, including for determining the
rate of return we can earn on the assets we use to provide our distribution services.
Safety
Safety continues to be the priority for Energex. We prioritise the safety of our communities,
customers and employees above all else. Many of our proposed investments focus on maintaining
or, where relevant, improving our safety outcomes. Since Our Draft Plans, a more detailed risk
assessment has driven an increase to the Ergon Energy replacement capital expenditure forecast for
safety driven projects in 2020-25. Looking further ahead, we see real opportunities from our
technology investment program to deliver on our commitment to continuously improve the safety of
the community and our people while driving down costs.
Affordability
Affordability is our customers’ primary concern. Our distribution network charges make up around
one-third of a typical retail electricity bill in Queensland. This Regulatory Proposal commits us to
doing everything we can to reduce our distribution network charges and, in turn, customers’ bills.
Building on the savings we proposed in Our Draft Plans, This means that the average residential
customer in Queensland will receive 10.3% real reduction in distribution network charges from 2019-
20 to 2020-21 on their legacy default network tariffs. For a small business customer, this reduction
will be 11.4%. These reductions are in addition to the on average 7% annual reductions we have
delivered residential and small business customers every year since 2015. This does not account for
jurisdictional schemes which may factor into customer network charges1. Customers may see further
savings should they choose to opt-in to one of our new cost reflective tariffs, some of which may
require a digital meter.
We will also deliver network tariff reforms that are equitable and offer additional savings, value and
choice to reward customers for their role in the energy transformation underway in Queensland. We
will make changes while managing potential impacts on our customers, especially the most
vulnerable in our society.
Security
1 Total network charges comprise distribution network charges, transmission network charges and jurisdictional
schemes.

Energex Regulatory Proposal 2020-25 7
Our customers have told us that they are generally satisfied with the power reliability we deliver. We
will maintain our recent improvements in reliability, while targeting expenditure savings and improving
outcomes where network outages are outside of our service standards. We will:
deliver sustainable investment that avoids a boom-bust cycle and manages our aging assets
through maintenance and targeted replacement
continue to ‘be there after the storm’ so that our communities can recover quickly after any
disruptive storms or natural disasters, and
promote community and staff safety, by leveraging innovative solutions to continue the
transition to an intelligent grid, enabling and leveraging the growth of distributed energy
resources – including grid-scale and small solar generators, and energy storage solutions.
Sustainability
Our customers have told us they want greater choice and control over their energy solutions so that
they can better manage their individual usage and associated costs, and better support action on
climate change.
We will work more closely with our customers to enable them to realise the potential value emerging
from today’s transforming energy world, and to ensure the whole community benefits from today’s
and tomorrow’s technologies.
Over time, we are gradually transforming our network into an intelligent grid so that our communities
and customers can leverage the many benefits of digital transformation, distributed energy resources
and emerging technologies, like solar, battery storage and electric vehicles, as well as the next
generation of home and commercial energy management systems. This means we will no longer
simply manage network costs; we will also work hard to provide communities and customers with the
ability to adopt technologies, while saving money and delivering digitally smarter and more resilient
networks that are safe by design.
Snapshot of our proposal
The key aspects of Energex’s Regulatory Proposal for the 2020-2025 regulatory control period are
summarised below.
Table 1 Forecast summary 2020-21 to 2024-25
2020-21 2021-22 2022-23 2023-24 2024-25
Standard control services
Forecast expenditures ($M, Real $2020)
Net capital expenditure (capex) 422.26 409.45 417.51 413.04 397.34
Opex (including debt raising costs) 365.11 362.86 360.99 359.44 357.38
Opening RAB ($M, Nominal) 12,916.65 13,206.73 13,501.60 13,795.26 14,070.88
Revenue Requirements ($M, Nominal)
Return on Capital (WACC 5.46%) 705.09 716.97 728.93 740.64 751.22
Regulatory Depreciation 140.04 131.37 153.21 177.02 202.40
Incentive Schemes and other Revenue Adjustments 1.13 1.16 1.20 1.24 1.28
Corporate Tax Allowance (Gamma 0.585) 14.15 32.51 33.86 35.58 37.27
Annual Revenue Requirements (smoothed) 1,246.43 1,276.59 1,307.49 1,339.13 1,371.53
X Factor (note – positive value reduces revenue) (%) 10.25% 0.00% 0.00% 0.00% 0.00%
Demand - Forecast 50POE (MW) 5,010 5,041 5,006 5,010 5,037
Customer numbers 1,535,196 1,559,289 1,583,127 1,606,743 1,628,812
Energex Regulatory Proposal 2020-25 8
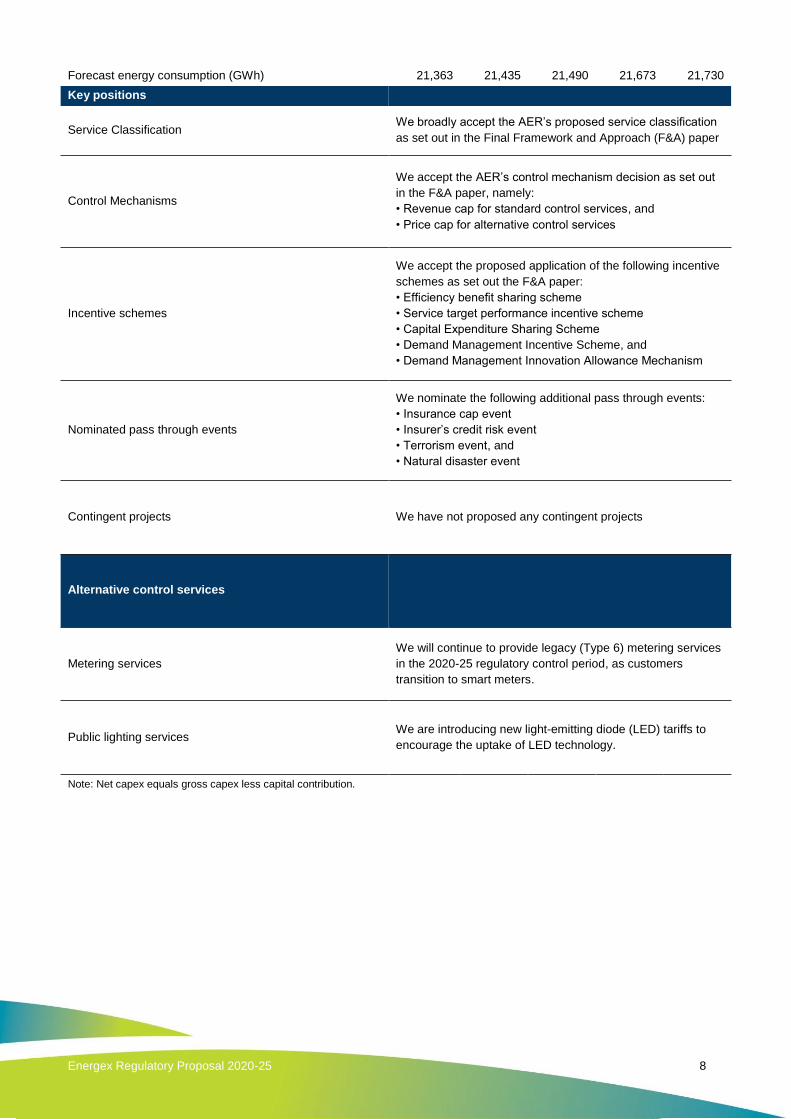
Forecast energy consumption (GWh) 21,363 21,435 21,490 21,673 21,730
Key positions
Service Classification We broadly accept the AER’s proposed service classification
as set out in the Final Framework and Approach (F&A) paper
Control Mechanisms
We accept the AER’s control mechanism decision as set out
in the F&A paper, namely:
• Revenue cap for standard control services, and
• Price cap for alternative control services
Incentive schemes
We accept the proposed application of the following incentive
schemes as set out the F&A paper:
• Efficiency benefit sharing scheme
• Service target performance incentive scheme
• Capital Expenditure Sharing Scheme
• Demand Management Incentive Scheme, and
• Demand Management Innovation Allowance Mechanism
Nominated pass through events
We nominate the following additional pass through events:
• Insurance cap event
• Insurer’s credit risk event
• Terrorism event, and
• Natural disaster event
Contingent projects We have not proposed any contingent projects
Alternative control services
Metering services
We will continue to provide legacy (Type 6) metering services
in the 2020-25 regulatory control period, as customers
transition to smart meters.
Public lighting services We are introducing new light-emitting diode (LED) tariffs to
encourage the uptake of LED technology.
Note: Net capex equals gross capex less capital contribution.

Energex Regulatory Proposal 2020-25 1
Part A – Introduction
The communities we serve, our customers and other stakeholders, want an
affordable, secure and sustainable electricity supply today, and into the
future.
To deliver this for South East Queensland, we are committed to listening and
acting on their feedback and continuing to engage as we move forward.
Energex’s distribution network of over 52,000 kilometres of lines services the
growing South East Queensland region – we provide distribution services to
1,463,494 domestic and business connections.
To ensure we get it right, we welcome feedback on our Regulatory Proposal.
This proposal has been presented to assist the AER to determine the revenue
we can recover from our customers for using our network from July 2020.
Customer Commitments
Our plans are being guided by our overarching Customer Commitments to
realise significant reductions in distribution network charges, continue to
ensure the safety of our distribution network, and modernise the network in
order to realise the potential value of emerging technologies.
The electricity industry is transforming as we and our customers embrace new
technologies to manage energy use and costs, and support action on climate
change. This requires us to redefine customer value, while proactively driving
digital transformation that will bring down costs and offer new services to
customers.
We have achieved a lot, but we know there is still a way to go on the journey.
We are being as transparent as possible and are clearly justifying how we
spend the money that ultimately comes from customers for using our
distribution networks.
We trust you can see your feedback in our plans and we look forward to
hearing more from you as the AER reviews our proposal.

Energex Regulatory Proposal 2020-25 2
1. About us and this Regulatory Proposal
We provide electricity distribution services to households and businesses throughout South-East
Queensland. We are proudly part of Energy Queensland, a Queensland Government owned
company.
We are the only provider of many distribution services in our service area. Because of this, the
revenues and prices that we charge as a distribution network service provider (DNSP) are regulated
by the AER to ensure that we provide our distribution services efficiently.
The AER is the economic regulator of electricity distribution services in all Australian states and
territories, other than Western Australia. It regulates in accordance with the National Electricity Law
(NEL) and National Electricity Rules (NER). Its role is to set the revenues we can recover from our
customers for providing our distribution services and to approve the manner in which we can recover
those revenues through our charges.
The AER does this by making Distribution Determinations that typically cover five-year periods. In
April 2015, the AER made its Distribution Determination for our current regulatory control period,
1 July 2015 to 30 June 2020 (2015-20 regulatory control period).
This is Energex’s Regulatory Proposal for our next regulatory control period, 1 July 2020 to 30 June
2025 (2020-25 regulatory control period). It has been deeply informed by the views and preferences
of our communities and customers through our extensive engagement program. The AER will make
its Distribution Determination for this period in April 2020.
1.1 Our electricity distribution service area
Our distribution network is in the growing region of South East Queensland, which includes the major
urban areas of Brisbane, Gold Coast, Sunshine Coast, Logan, Ipswich, Redlands and Moreton Bay.
Our electricity distribution area runs from the NSW border north to Gympie and west to the base of
the Great Dividing Range.
We provide our distribution services to 1,463,494 households and businesses, comprising a
population base of around 3.4 million people. We must maintain enough capacity in our distribution
network to supply every household and business on the days when electricity demand is at its
maximum, no matter where they are.
Key Messages
We provide our distribution services to 1,463,494 households and businesses, comprising a
population base of around 3.4 million people in south-east Queensland.
This Regulatory Proposal details our proposed revenues for our next regulatory control
period, 1 July 2020 to 30 June 2025. It has been deeply informed by the views and preferences
of our communities and customers.
We welcome our customers and other stakeholders’ feedback on this Regulatory Proposal to
inform our future plans and the Australian Energy Regulator’s decision-making.

Energex Regulatory Proposal 2020-25 3
Figure 1 – Geographic coverage

Energex Regulatory Proposal 2020-25 4
We operate in a challenging environment. Some of the distinguishing features of our operating
environment compared with other Australian electricity DNSPs are that we have:
a high probability of severe weather and extended storm seasons
stringent vegetation management requirements, and
high uptake of photovoltaic (PV) solar systems.
Figure 2 Scope of services
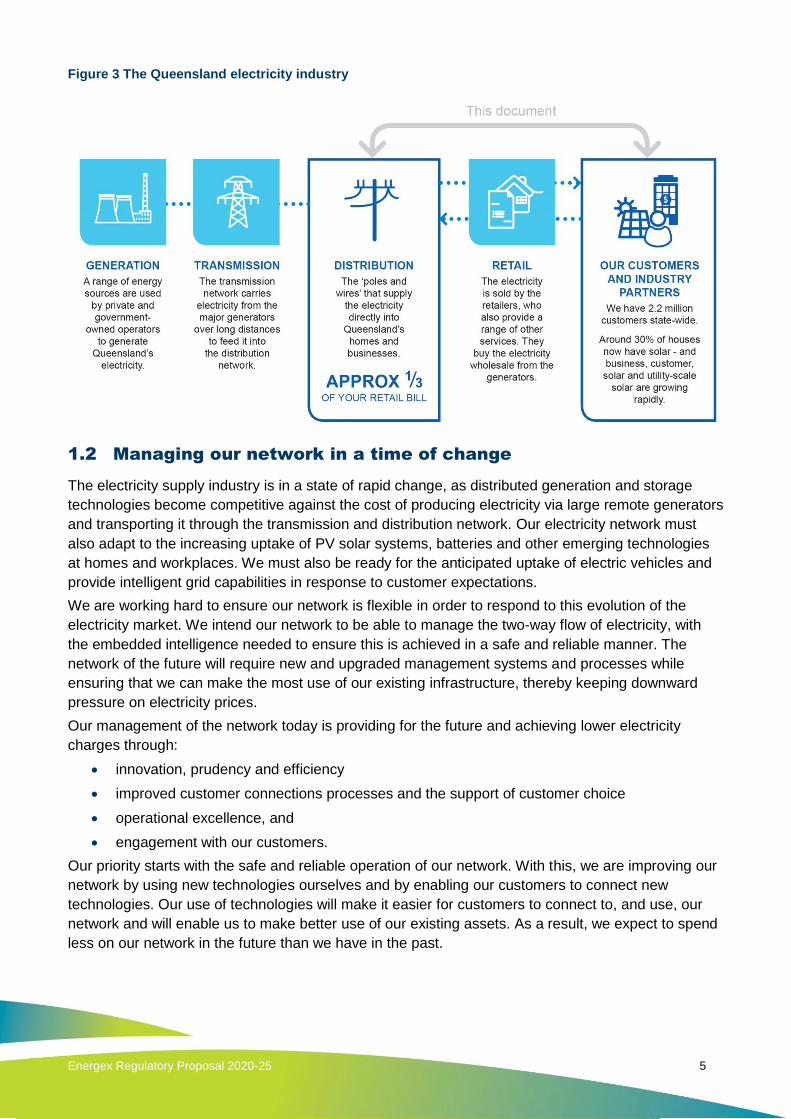
Our distribution network charges make up about one third of the typical retail ‘price’ of electricity in
Queensland – the other bill components include generation, transmission and retail costs.
Energex Regulatory Proposal 2020-25 5
Figure 3 The Queensland electricity industry
1.2 Managing our network in a time of change
The electricity supply industry is in a state of rapid change, as distributed generation and storage
technologies become competitive against the cost of producing electricity via large remote generators
and transporting it through the transmission and distribution network. Our electricity network must
also adapt to the increasing uptake of PV solar systems, batteries and other emerging technologies
at homes and workplaces. We must also be ready for the anticipated uptake of electric vehicles and
provide intelligent grid capabilities in response to customer expectations.
We are working hard to ensure our network is flexible in order to respond to this evolution of the
electricity market. We intend our network to be able to manage the two-way flow of electricity, with
the embedded intelligence needed to ensure this is achieved in a safe and reliable manner. The
network of the future will require new and upgraded management systems and processes while
ensuring that we can make the most use of our existing infrastructure, thereby keeping downward
pressure on electricity prices.
Our management of the network today is providing for the future and achieving lower electricity
charges through:
innovation, prudency and efficiency
improved customer connections processes and the support of customer choice
operational excellence, and
engagement with our customers.
Our priority starts with the safe and reliable operation of our network. With this, we are improving our
network by using new technologies ourselves and by enabling our customers to connect new
technologies. Our use of technologies will make it easier for customers to connect to, and use, our
network and will enable us to make better use of our existing assets. As a result, we expect to spend
less on our network in the future than we have in the past.

Energex Regulatory Proposal 2020-25 6
1.3 Our Regulatory Proposal
This Regulatory Proposal is structured as follows:
Part A – Introduction covers the journey we have been on to prepare this Regulatory
Proposal, including our engagement with customers and other stakeholders and our
acceptance of the AER’s positions in its Framework and Approach (F&A) paper.
Part B – Standard Control Services (SCS) explains our proposed building blocks, which
form the AER’s decision making framework to determine our annual revenue allowance for
our SCS for 2020 to 2025. It also details:
o the AER’s incentive schemes which encourage us to deliver our services efficiently
o how we would recover the costs of particular uncertain events that may occur in the
2020-25 regulatory control period, and
o our indicative distribution network charges and typical customer bill changes between
the 2015-20 and 2020-25 regulatory control periods.
Part C – Alternative Control Services (ACS) outlines our proposals for our metering, public
lighting and ancillary services.
Part D – Other matters provides information on several related matters, including our
approach to confidential information and the assurance and certification we must provide,
including the key assumptions supporting our expenditure forecasts.
Further information about our future investment plans is available in supporting documents we have
submitted to the AER with this Regulatory Proposal.
After considering this Regulatory Proposal and public submissions, the AER will publish its draft
Distribution Determination. This will enable further consultation before the AER makes its Final
Determination, which will set the basis of our charges for our distribution services for the five years
from 1 July 2020.
1.4 Next steps and on-going consultation
The AER will consult on our Regulatory Proposal and will publish its draft Distribution Determination
by September 2019. We will then submit a Revised Regulatory Proposal to the AER by December
2019. The AER will also consult on its draft Distribution Determination and our Revised Regulatory
Proposal before publishing its final Distribution Determination by April 2020. We encourage our
communities and customers to make submissions to the AER as part of its consultation processes.
After the AER publishes its Distribution Determination, we will prepare our distribution network
charges for the 2020-21 regulatory year, commencing 1 July 2020.
In the meantime, we will continue to engage with our customers and other stakeholders on this
Regulatory Proposal, including through our Customer Council and our website,
www.talkingenergy.com.au, where all of our existing consultation material is available. Questions can
also be directed to us via [email protected]

Energex Regulatory Proposal 2020-25 7
Figure 4 Next steps
1.5 Supporting documentation
The following documents supporting this chapter accompany our Regulatory Proposal:
Name Ref File name
Corporate strategy 1.001 EGX ERG 1.001 Corporate strategy
JAN19 PUBLIC
2020-25 Regulatory Proposals highlights 1.002 EGX ERG 1.002 2020-25 Regulatory
Proposals highlights JAN19 PUBLIC
2020-25 Regulatory Proposal 1.003 EGX 1.003 2020-25 Regulatory
Proposal JAN19 PUBLIC
An Overview Our Regulatory Proposals
2020-25 1.005
EGX ERG 1.005 An Overview Our
Regulatory Proposals 2020-25 JAN19
PUBLIC
Capex and Opex Objectives, Criteria, and
Factors in Chap 6 of NER 1.006
EGX ERG 1.006 Capex and Opex
Objectives, Criteria, and Factors in
Chap 6 of NER JAN19 PUBLIC
Document Register 1.008 EGX ERG1.008 Document Register
JAN19 PUBLIC
Talkingenergy.com.au content (e.g.
factsheets)

Energex Regulatory Proposal 2020-25 8
2. Listening and responding to our customers
2.1 Our engagement program
2.1.1 What we have done
Over the past year, we have actively listened to our community stakeholders, our customers, and our
industry partners to better understand what matters to them as we plan our distribution services for
the 2020-25 regulatory control period. Our engagement program has included Customer Council
Working Group meetings, regional Community Leader Forums, extensive qualitative and quantitative
residential and business customer research, an online engagement capability through
www.talkingenergy.com.au, and a significant schedule of business-as-usual engagement activities.
Our engagement program delivered rich and constructive feedback around all elements of our
service offering, and our future challenges in providing our distribution services. The insights gained
have informed our strategic direction, our asset management approach, our investment priorities, our
proposed network tariff reforms and a range of other considerations in this Regulatory Proposal and
our Tariff Structure Statement (TSS).
Further information on our engagement program is available in our 2020 and Beyond Community and
Customer Engagement Report.
Key Messages
Our customers want us to listen to and act on their feedback and clearly show how their
feedback has informed our decisions.
Our customers want us to provide affordable, secure and sustainable electricity.
We will continue to engage our customers and other stakeholders throughout 2019 and 2020 as
the AER finalises its decision for our distribution services for the 2020-25 regulatory control
period.

Energex Regulatory Proposal 2020-25 9
Figure 5 An overview of our engagement program

Energex Regulatory Proposal 2020-25 10
2.1.2 What we have heard
Our customers, communities and other stakeholders expect us to engage regularly with them in a
transparent and meaningful manner. They want us to listen to and to act on their feedback and to
show how it has informed our decisions. We involved our stakeholders in developing our approach to
these documents and have continued through to submission to the AER.
We published ‘Our Draft Plans 2020-25’ for public consultation in September 2018. We subsequently
published the additional submissions and feedback that we received. We have reflected this
feedback in our approach to preparing this Regulatory Proposal and our TSS.
We remain committed to engaging and evolving our approach up to, and beyond, the AER’s
Distribution Determination in April 2020.
We heard a clear message through our engagement process that our customers want us to ‘safely
deliver affordable, secure and sustainable energy solutions’. This is our purpose and the central
driver of this Regulatory Proposal and our TSS.
Figure 6 Our purpose
We have reflected these elements into a set of customer commitments.

Energex Regulatory Proposal 2020-25 11
2.1.3 What we will deliver

Energex Regulatory Proposal 2020-25 12
2.2 Safety
Safety is our overarching commitment to our communities, customers and employees. This is a non-
negotiable element of our investment plans and how we work. New technology will help to improve
safety and performance, while managing affordability.
2.2.1 What our customers want
Our engagement program highlighted that stakeholders recognise the importance of safety and they:
recognise the dangers of electricity and that, if it is not managed appropriately, our distribution
network presents a physical risk to our staff and the public
are generally happy with the current safety of the network as well as our approach to
maintaining safety for our communities, customers and staff, and
recognise the value of investing in new technologies, such as low voltage monitoring devices,
which can enhance customer safety.
2.3 Affordability
The cornerstone of this Regulatory Proposal is a commitment to do all we can to take the pressure
off electricity prices by continuing to drive down our cost of distributing electricity. We understand the
impact of retail electricity prices on the cost of living and of doing business.
2.3.1 What our customers want
Our engagement program highlighted that affordability remains a core concern for many customers:
Our customers generally do not consider distribution charges separately to their retail
electricity bill. They want the industry as a whole to deliver electricity price relief, without
compromising the safety, security and reliability of supply they receive or customer service
standards
In general our customers are looking for price relief in order to reduce the cost of living and
improve business competitiveness. Affordability is particularly important for customers facing
financial hardship
Our customers want price relief to be front ended in the early years of the 2020-25 regulatory
control period
For some customers, the rise in the cost of electricity in recent years has increased
expectations around their electricity supply and the service experience we deliver
Our stakeholders want us to demonstrate how our expenditure is prudent and efficient,
including by:
o showing what efficiencies and customer benefits have been achieved to date and what
is planned as part of our ongoing business transformation program
o ensuring our programs and contracts deliver best value, and
o recovering costs over the lifetime of our assets’ use, rather than in the year we incur
the costs.
Our stakeholders support tariff reform and greater cost reflectivity but are concerned about
customer impacts and transition issues. They expect us to ensure equity of access to
electricity, and
Our customers want a trusted advisor to provide independent impartial advice, electricity
usage data and tools to help them make informed choices in their energy use, behaviours and
pricing plans. Stakeholders understand that we have a role to play here.

Energex Regulatory Proposal 2020-25 13
2.3.2 What we will deliver
In direct response to clear feedback received around the impact of retail
electricity prices on the cost of living, our Regulatory Proposal will deliver a
10% reduction in revenue from 2019-20 to 2020-21. Compared to the
current regulatory control period (2015-20), the next regulatory control
period (2020-25) will see an 11% reduction ($783 million in real $2019-20)
in our overall smoothed revenue requirement.
This translates into at least a 10.3% real reduction in distribution network charges for the average
residential customers from 2019-20 to 2020-21 on their existing tariff. This does not account for
jurisdictional schemes which may factor into customer network charges2. Customers may see further
savings should they choose to opt-in to our cost reflective network tariffs, some of which may require
a digital meter. For the average small business customer, in order to help address the impact of price
rises on business competitiveness, it will deliver at least a 11.4% real reduction from 2019-20 to
2020-21. An average residential customer in Energex’s region is a household who consumes 5,000
kWh of energy per annum. Similarly an average small business customer is a small business in
South East Queensland who consumes around 8,000 kWh of energy per annum.
Table 2 details the proposed reduction in distribution network charges for residential and small
business customers. The legacy tariffs (which are the existing default tariffs) are the Flat Residential
Tariffs and the Flat Small Business Tariff. These savings are in addition to an average 7% annual
reduction in network charges we have delivered since 2015.
Table 2 Forecast reduction in distribution network charges between 2019-20 to 2020-213
Tariff Average Residential Customer Average Business Small Customer
Real $2020 Real $2020
Legacy 10.3% 11.4%
Figure 7 shows the indicative contribution of distribution network charges to an annual South East
Queensland residential electricity bill. It shows that this contribution has been falling since 2015-16
and that we propose a further reduction from 2020.
2 Total network charges comprise distribution network charges, transmission network charges and jurisdictional
schemes. 3 The real figure represents 2020 dollars, adjusted to incorporate an allowance for inflation.
10.3% average residential customer on legacy default network tariff

Energex Regulatory Proposal 2020-25 14
Figure 7 Indicative proportion of distribution network charge of an annual residential South East
Queensland electricity bill
In addition to these savings, we are proposing network tariff reforms to offer customers additional
choices and savings. We explain these reforms in our TSS.
2.3.3 How we will deliver it
Key initiatives in this Regulatory Proposal that will reduce distribution network charges and increase
customer affordability include:
Reflecting the underspend against the AER’s capex allowance in the 2015-20 regulatory
control period into our opening regulatory asset base (RAB) in 2020. This is discussed in
section 3.2.3
Reducing our total capex on SCS from $2,846 million in the 2015-20 regulatory control period
to $2,327 million in the 2020-25 regulatory control period, and our total operating expenditure
(opex) on SCS from $1,899 million to $1,806 million (inclusive of debt raising costs)
Making greater use of distributed energy resources (DER) and demand side initiatives, with
transparent pricing for when these investments can reduce the need for investment in our
network
Applying the AER’s 2018 Rate of Return Instrument to derive a rate of return estimate of
5.46% in 2020-21, compared with a forecast 5.98% in 2019-20
Applying a revenue reduction in year one of the 2020-25 regulatory control period, with
annual increases thereafter based on inflation, and
Delivering network tariff reforms that are equitable and offer additional savings, value and
choice that will reward customers for their role in Queensland’s energy transformation.

Energex Regulatory Proposal 2020-25 15
2.4 Security
2.4.1 What our customers want
Our engagement program highlighted that stakeholders recognise the importance of security of
supply. They:
value how we keep the lights on and restore services after severe weather events. Overall,
our customers want us to maintain, but not to improve, reliability performance. The exception
is for the mainly rural and remote customers currently who are currently receiving below
standard service
are generally happy with the resilience of our distribution network, our operational readiness
and our timely restoration of services after storms and other emergencies
want better communication around power outage notifications – both planned and unplanned
(e.g. text communication), and
want us to continue insuring our assets cost effectively, particularly for major events (e.g.
storms).
2.4.2 What we will deliver
We will ensure our distribution network remains secure and reliable, so that electricity is there when
our customers need it. We will maintain the recent improvements in power reliability, while targeting
expenditure savings and improving outcomes where network outages are outside of our service
standards. Table 3 shows that we have out-performed our network reliability standards in 2017-18 –
the most recent year where data is available at the time of submitting this Regulatory Proposal.
Section 3.3 provides further information about the trend in our reliability service performance in the
2015-20 regulatory control period and compares it to earlier periods.
Table 3 Network performances standards
2017-18
(Overall)
Minimum Service
Standards
2017-18
(Unplanned)
STPIS Targets*
Average length of outages – minutes (System Average Interruption Duration Index)
CBD Distribution 4.80min ≤15min 0.357 3.897
Urban Distribution 73.09min ≤106min 48.147 60.118
Short Rural Distribution 187.38min ≤218min 116.083 144.475
Average number of outages per customer (System Average Interruption Frequency Index)
CBD Distribution 0.04 ≤0.15 0.0018 0.0352
Urban Distribution 0.67 ≤1.26 0.5742 0.9081
Short Rural Distribution 1.46 ≤2.46 1.1872 1.8747
* STPIS = Service Target Performance Incentive Scheme as detailed in section 11.
2.4.3 How we will deliver it
Our proposed expenditure program will maintain our safety and security performance while:
delivering sustainable investment that avoids a boom-bust cycle and manages our aging
assets through maintenance and targeted replacement, and

Energex Regulatory Proposal 2020-25 16
achieving improved community and staff safety, by leveraging innovative solutions to continue
the transition to an intelligent grid, enabling and leveraging the growth of DER – including
grid-scale and small solar generators, and energy storage solutions.
Key safety and security initiatives in this Regulatory Proposal include:
implementing new network monitoring technologies to improve safety related to low voltage
shocks associated with service lines. We will also ensure safety by design with improved
capability to sense and predict safety issues. This will improve power quality, outage
management and identification and network operation in a high DER future
meeting discrete areas of strong growth across our network, including from solar and other
emerging technologies. An example is reinforcing supply to Caloundra South through key
augmentation (augex) projects to meet pockets of demand growth
focussing our replacement expenditure (repex) program on 33kV conductors, substation
secondary systems and our distribution replacement program
maintaining the resilience of our network and response capability, while targeting expenditure
savings
addressing increasing risks around cyber security and data privacy
continuing to improve outcomes where network outages are outside the standard
evaluating further communications about planned and unplanned outages
making better use of data and analytics, and providing digital services to our customers; such
as by providing more transparent information on load growth and network reliability impacts to
ensure our network continue to meet customer expectations, and
maintaining our insurance and self-insurance policies.
2.5 Sustainability
The ways our customers source and use energy, and monitor their energy needs, are all rapidly
changing. Our customers want greater choice and control over their energy solutions. This is
transforming the industry as new technologies are embraced to manage energy use and costs, and
support action on climate change.
At the same time, new technologies are available to us in providing our network services. Demand
management and embedded generation options continue to be a primary consideration when
optimising investment.
2.5.1 What our customers want
Our engagement program highlighted the importance of sustainability to our customers. They:
recognise that new technology is important to a modern distribution network. They expect us
to explain how we use new technology and how they benefit from it
want us to be an enabler of new customer technologies but not necessarily a leader (e.g. in
the adoption of electric vehicles)
want us to protect legacy load under control to manage network demand
expect us to partner with the market in devising customer solutions to manage network
demand into the future
expect us to collaborate with, and provide incentives to, customers and the supply chain to
assist in demand management delivery and uptake
want connections to be timely and simple and for us to align our service offering across
Queensland
want greater choice, equity and user-pays outcomes for connections
Energex Regulatory Proposal 2020-25 17
expect us to facilitate the integration of renewables into our distribution network, and
want us to enable energy efficiency options and new technologies - including in public spaces
(e.g. Light Emitting Diode (LED) and smart public lighting).
2.5.2 What we will deliver
Our goal is to enable our network to facilitate the interconnection of new technology for the benefit of
our customers and communities. This will enable our communities and customers to leverage the
many benefits of digital transformation, DER and emerging technologies, such as solar, battery
storage and electric vehicles, as well as the next generation of energy management systems. We will
do this by:
continuing to collaborate and leverage customer-side investment, both to offset network
expenditure and to improve overall service outcomes
making it easier and quicker to connect to the network with an aligned state-wide service
offering and further system improvements
continuing to transform our network into an intelligent grid to leverage digital transformation
and effectively integrate the growing range of DER
evolving our network to best support customer choice in electricity supply solutions by
integrating solar, batteries and other technologies into the network in a cost effective and
sustainable way, and
ensuring safety by design with improved capability to sense and predict safety issues, such
as broken neutrals4. Greater levels of visibility of our network will improve power quality,
outage management and identification and network operation in a high DER future.
Our task ahead is to work with our customers to realise the network value in the energy
transformation and to ensure the whole community benefits from today’s and tomorrow’s emerging
technology. We are committed to deliver on what really matters so that no one is left behind, and our
communities grow stronger.
Figure 8 represents the journey that we are undertaking, building from the 2015-20 regulatory control
period to position ourselves to have the capability to continue to serve customers effectively in a
world of growing renewables, while addressing the increasing digitalisation of energy technology
solutions with increased information being made available to our communities and customers.
4 Broken neutral: A broken wire in a customer’s service cable which results in unsafe voltages on earthed
metallic objects in the customer’s premises

Energex Regulatory Proposal 2020-25 18
Figure 8 Redefining customer value
2.5.3 How we will deliver it
We will continue to work with our stakeholders in the 2020-25 regulatory control period to realise the
value emerging from today’s transforming energy technology. Key sustainability initiatives in this
Regulatory Proposal include:
supporting and enabling emerging technologies and devices
supporting load control as a tool to manage network demand
collaborating with customers and partners to assist with demand management and delivery.
We anticipate continuing these activities in the 2020-25 regulatory control period
refining and aligning our proposed connection policies as far as is practicable to provide
greater consistency in the provision of connection services across Queensland
supporting and enabling the integration of renewables into the network, particularly where it
makes prudent financial and delivery improvements for customers and communities, and
Energex Regulatory Proposal 2020-25 19
working with our customers to develop a strategy to enable transition to LED technology and
smart controllers. This includes new tariffs, funding arrangements and standards.
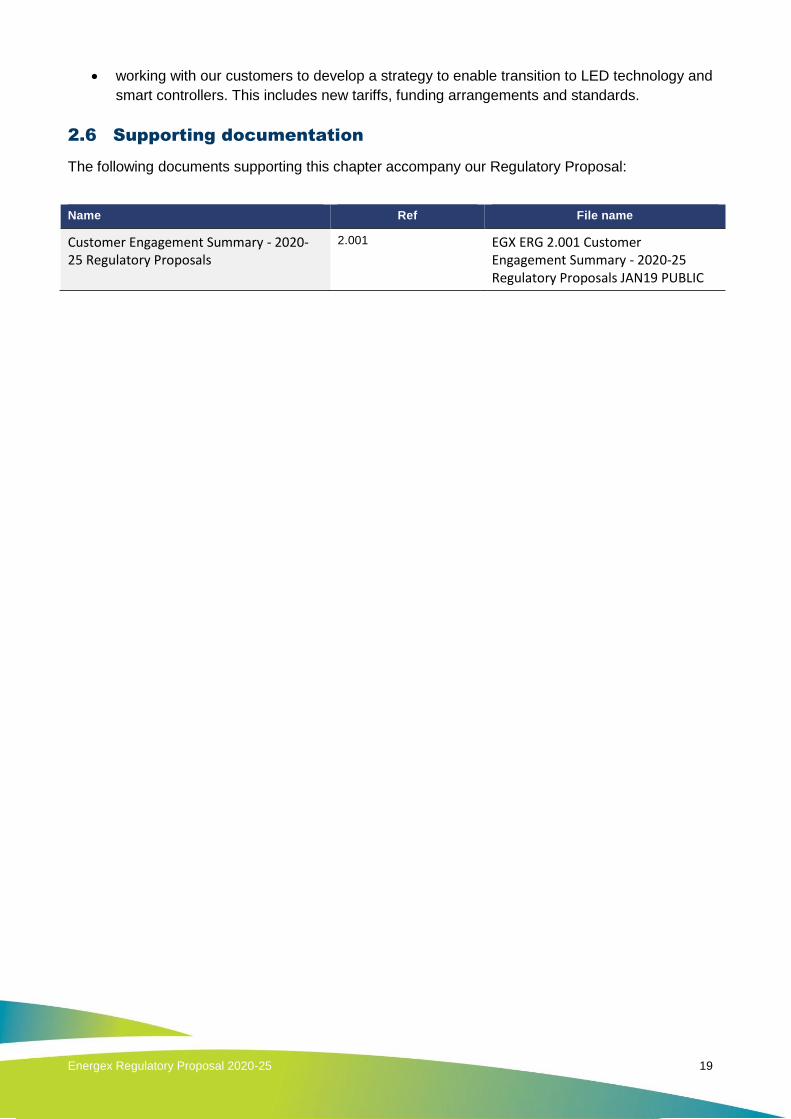
2.6 Supporting documentation
The following documents supporting this chapter accompany our Regulatory Proposal:
Name Ref File name
Customer Engagement Summary - 2020-25 Regulatory Proposals
2.001 EGX ERG 2.001 Customer Engagement Summary - 2020-25 Regulatory Proposals JAN19 PUBLIC

Energex Regulatory Proposal 2020-25 20
3. What we have delivered in the 2015-20 regulatory control
period
Figure 9 details what we have delivered in the 2015-20 regulatory control period, against the three
key outcomes that customers most value – affordability, safety and security, and sustainability.
Key Messages
In the 2015-20 regulatory control period, we:
delivered on annual average a real reduction in network charges of 7% for residential and
small business customers
maintained a secure electricity network so that we continue to be there ‘after the storm’
promoted greater energy choice and control over energy solutions
better understood customers’ requirements and future needs and subsequently instituted
initiatives to improve customers’ experience
are projecting to underspend our total capex and opex allowances by $320 million, or 6.2%,
while continuing to meet reliability and customer service performance outcomes
implemented safety enhancements through new technologies such as LiDAR and online
condition monitoring
leveraged a range of low-cost options to support renewables across 30% of detached
houses across Queensland
used our demand management expertise to support the way our customers are using our
network.

Energex Regulatory Proposal 2020-25 21
Figure 9 What we have delivered in the 2015-20 regulatory control period5
5 The underspend is expressed in real 2020 dollars which incorporates inflation and real escalation up to 2020.

Energex Regulatory Proposal 2020-25 22
3.1 Network bill impacts
We have focussed on reducing the distribution component of our customers’ electricity bills in the
2015-20 regulatory control period. Our network charges have reduced by an average of 7% per year
in real terms since 1 July 2015 for residential customers and small business customers.
Since the commencement of our first TSS on 1 July 2017, we have begun introducing cost-reflective
network tariffs to our suite of network tariffs. These tariffs include time of use consumption and time
of use demand tariff structures that more accurately signal customers’ usage of the network at times
of peak network usage. We have also continued to listen to customer feedback on our existing
network tariffs and the new cost reflective network tariffs. This feedback has been valuable in
informing the suite of network tariffs in our TSS for the 2020-25 regulatory control period.
3.2 Our financial performance
3.2.1 Energy Queensland’s joint savings
In the 2015-16 Mid-Year Fiscal and Economic Review, the Queensland Government announced our
merger with Ergon Energy under the banner of Energy Queensland. The merger was accompanied
by a clear intent to achieve cost reductions and efficiencies in opex and capex (totex) in the two
regulated network businesses to the benefit of customers. The merger took effect from 1 July 2016.
Notwithstanding the reductions already targeted for the two businesses in their 2015-20 Regulatory
Proposals and the AER’s associated Distribution Determinations, in order to improve further on the
baseline an additional totex target of $562 million net of implementation costs in nominal terms over
four years (2016-17 to 2019-20) was formalised for the two business. These further targeted savings
were against the forward estimates at that time, which approximated the regulatory expenditure
allowance over the period to 2019-20.
We refer to the reductions achieved in these four years as “post-merger” savings to distinguish them
from those already achieved by the two businesses in 2015-16.
The combined entity has been successful in achieving the savings’ target through a combination of
approaches, including:
scale benefits
re-negotiations with suppliers
selection of, and adoption of, best practice across the two entities
reconsideration of work practices and scheduling, and
a general re-examination of planned spend to ensure it is prudent and efficient.
Some of these savings were envisaged and planned through formal savings’ initiatives (which we call
roadmaps) while other opportunities presented themselves after the merger. The external
environment was also not static, and the businesses had to respond to changing requirements to
ensure the continued safe and reliable operation of the network, some of which reduced and some of
which increased the actual cost base.
It is not practical, and in some instances may be misleading, to attribute cost reductions to any of
these individual internal or environmental factors, actions or decisions outlined above in isolation. In
order to measure the achievement of the reduction target as objectively as possible against a stable
baseline, we use the AER’s 2015-20 totex allowance to monitor our progress. The reduction in cost
compared to the AER’s allowance is partially offset by implementation costs, and we use the term
“net” savings to describe this measure.
In 2018-19, Energy Queensland expects to achieve approximately $93 million in nominal terms of
post-merger net savings across its two network businesses. For ourselves and Ergon Energy, Energy

Energex Regulatory Proposal 2020-25 23
Queensland expects to achieve cumulative post-merger net savings of $579 million by the end of
2019-20, which exceeds the initial estimate of $562 million.
In addition, we and Ergon Energy achieved reductions before the merger. Energy Queensland
expects to achieve totex savings against the regulatory allowances for the 2015-20 regulatory control
period of over $735 million across the two businesses, net of implementation costs. Achieving these
savings ambitions is a fundamental element of Energy Queensland’s financial strategy. Table 4
provides a summary of the post-merger savings during the current regulatory control period.
Table 4 Energex and Ergon Energy post-merger net savings over the 2015-20 regulatory control period
Consolidated Group ($M, Nominal) Target
2017-18
Estimated
Actuals
2018-19 Plan 2019-20 Plan Total
AER SCS Totex Allowance
1,913.0 1,939.0 1,979.0 7,789.0
SCS Totex Actual / Target
1,707.0 1,795.7 1,798.8 7,022.5
Total Savings
206.0 143.3 180.2 766.5
Opex savings
35.0 53.3 71.4 189.7
Capex savings
171.0 90.0 108.8 576.8
Implementation and Redundancy costs
39.0 50.6 54.3 187.9
EQL net savings compared to AER 562.0 167.0 92.7 125.9 578.6
Note: Totals may not add due to rounding.
Achieving these savings enables us to operate and maintain our electricity distribution network in a
manner that is efficient while delivering on safety and reliability standards. The savings achieved
through the merger have flowed predominantly to capex, whereas the associated restructuring costs
have reduced the profit of the organisation.
Savings in capex will flow into the next regulatory control period via an opening Regulatory Asset
Base (RAB) that will be lower than it would be otherwise, which in turn lowers network prices.
Customers will also benefit from us having a lower opex base year and through the expected
adjustments made under various regulatory incentive schemes. We expect the merger savings to be
sustained throughout the 2020-25 regulatory control period, although we are reflecting further
savings into this Regulatory Proposal.
Table 5 details the post-merger savings that we have made, or expect to make, across Energex and
Ergon Energy against the AER approved opex and capex allowances over the 2015-20 regulatory
control period.
We have achieved the post-merger opex savings through:
reducing spending on building new network assets or replacing old network assets by
adopting enhanced network technologies and asset management strategies
unit rate improvement for the delivery of projects through optimising crew size, work program,
depot management, resources and productivity improvements
better procurement price outcomes in network equipment, field service contract, corporate
service contract corporate real estate consolidation and sublease
improving asset strategies and standards and balancing network risk and customer outcomes
removing the duplication in the corporate overhead functions, and
process and labour utilisation improvements.

Energex Regulatory Proposal 2020-25 24
3.2.2 Energex’s opex
Table 5 details our actual opex performance against the AER’s allowance (excluding debt raising
costs) for the 2015-20 regulatory control period.
Table 5 Actual opex compared with AER allowance
$M, Real $2020 2015-16 2016-17 2017-18 2018-19 2019-20 Total
AER opex allowance 375.53 372.03 377.23 389.19 391.58 1,905.56
Actual / estimated opex 376.06 378.50 379.37 374.45 374.16 1,882.54
Variance from allowance 0.53 6.48 2.13 -14.74 -17.42 -23.02
We are projecting to underspend the AER’s opex allowance for the 2015-20 regulatory control period
by $23.0 million in real 2019-20 terms. Significantly, in this financial year (2018-19) and the next
(2019-20) financial year we will underspend the allowance by $32.2 million. This means that our base
year opex that we use to forecast our opex for the 2020-25 regulatory control period will be lower
than it would have been if we spent up to the AER’s allowance. This is discussed further in chapter 6.
The main drivers of our opex performance over the 2015-20 regulatory control period, and the above
variances, are the:
Savings from our merger with Ergon Energy, discussed above
Introduction of new rapid inspection technologies for overhead and ground plant to cover the
complete network which reduces “traditional” inspection techniques, needs and costs.
Examples include:
o Thermal imaging of low voltage pillars, and
o LIDAR analysis of overhead conductors
Reduction in the program units of aerial inspections through better use of data to target
specific assets and environmental conditions
Collaborative engagement with councils on removal of inappropriate trees, and
Alignment of condition assessments, delivery timeframes and process improvements in
inspection and defect management areas.
3.2.3 Energex’s network capex
Table 6 details our actual network capex performance against the AER’s allowance for the 2015-20
regulatory control period.
Table 6 Actual network capex compared with AER allowance
$M, Real $2020 2015-16 2016-17 2017-18 2018-19 2019-20 Total
AER capex allowance (network) 596.27 615.72 578.06 576.11 565.67 2,931.84
Actual / estimated capex (network) 616.88 562.69 532.49 503.83 478.34 2,694.23
Variance from allowance 20.61 -53.03 -45.57 -72.28 -87.33 -237.61

Energex Regulatory Proposal 2020-25 25
We are projecting to underspend the AER’s network capex allowance for the current period by
$237.6 million. This means that we will start the 2020-25 regulatory control period with a lower RAB
than if we spent to the AER’s allowance. The main drivers for our network capex performance over
the 2015-20 regulatory control period, and the above variances, are:
savings from our merger with Ergon Energy, discussed above
reduced connections capex due to lower than forecast volumes and costs of customer-
initiated work, and
lower augmentation capex due to lower than forecast peak demand growth.
We are committed to continuing to build on the improvements throughout the 2015-20 regulatory
control period through:
internal labour improvements in field delivery
materials and contract savings due to merger savings
contract renegotiations
economies of scale, and
continuing demand management activities.
These improvements are included in our opex and capex forecasts in chapters 6 and 0 respectively.
3.2.4 Energex’s non-network capex
Table 7 details our actual non-network capex performance against the AER allowances. We are
projecting to underspend the AER’s non-network capital allowance for the current period by $59.1
million. This means that we start the 2020-25 regulatory control period with a lower RAB than if we
spent to the AER’s allowance. The main drivers for our non-network capex performance over the
2015-20 regulatory control period, and the above variances, are:
lower fleet and equipment capex through life-extension strategies of light and commercial
vehicles
life extension of plant refurbishment to Australian Standard guidelines
significant reductions in Information Communication Technology (ICT) storage costs
life extension of end user hardware, and
opex leasing of mobile in-field devices.
Table 7 Actual non-network capex compared with AER allowances
$M, Real $2020 2015-16 2016-17 2017-18 2018-19 2019-20 Total
AER capex allowance (non-network) 65.53 68.76 52.77 49.84 52.88 289.79
Actual / estimated capex (non-network) 46.91 52.14 39.05 42.59 49.97 230.66
Variance from allowance -18.62 -16.62 -13.72 -7.26 -2.91 -59.13
3.3 Our service performance
We deliver our services to meet regulated target levels of electricity reliability (frequency of outages),
responsiveness to restore power when outages occur (duration of outages), and customer call centre
performance. We have two types of targets:
Total outages/interruptions (planned and unplanned) or system minimum service
standards (MSS) that we are required under our Distribution Authority to use our reasonable

Energex Regulatory Proposal 2020-25 26
endeavours to meet. The MSS are set and administered by the Queensland Government’s
Department of Natural Resources, Mines and Energy (DNRME).
Unplanned outages/interruptions or Service Target Performance Incentive Scheme
targets that incentivise us to maintain or improve our service performance where customers
are willing to pay. We either earn financial rewards or pay penalties based on our
performance relative to average historical levels. The AER sets the STPIS targets based on
our five-year historical performance, with the reward or penalty being applied annually as
tariffs are established.
Table 8 shows our STPIS performance over the 2015-20 regulatory control period.
Table 8 Actual and Forecast Service Performance (STPIS)
2015-16 2016-17 2017-18 2018-19 2019-20
Unplanned SAIDI (minutes)
CBD 2.38 0.50 0.36 1.56 1.56
Urban 52.42 46.05 48.15 53.55 53.55
Short rural 130.64 103.58 116.08 120.12 120.12
Unplanned SAIFI (Interruptions)
CBD 0.01 0.00 0.00 0.03 0.04
Urban 0.67 0.57 0.57 0.65 0.64
Short rural 1.38 1.21 1.19 1.32 1.31
Customer service (% answered in 30 seconds)
Telephone answering 91.50 88.50 88.09 87.10 87.10
* SAIDI = System Average Interruption Duration Index, * SAIFI = System Average Interruption Frequency Index
Since the inception of MSS in 2005-06, as shown in Figure 10, our overall average outage duration
and frequency (SAIDI and SAIFI) have improved between 32% and 52% (depending on the feeder
type).

Energex Regulatory Proposal 2020-25 27
Figure 10 Improvement of SAIDI and SAIFI since the inception of MSS targets
3.4 Other customer performance
Following the 2004 Electricity Distribution and Service Delivery Review’s recommendations, the
Queensland Government introduced a Guaranteed Service Level (GSL) scheme initially under our
Distribution Authority and later through the Queensland Electricity Industry Code (now the
Queensland Electricity Distribution Network Code).
GSLs are a means of providing some financial recompense for poor service and reliability
experienced by individual customers. The GSLs are intended to work in combination with the MSS

Energex Regulatory Proposal 2020-25 28
targets to ensure that a minimum level of average network reliability is maintained, while recognising
instances when individual customers receive poor service outcomes.
The current GSL scheme came into effect on 1 January 2005 and requires us to pay customers when
the level of service that they receive for defined measures falls below specified levels. The GSL
measures relate to:
wrongful disconnections
late connections
late reconnections
late attendance for hot water supply failure
late attendance for appointment
insufficient notice of planned interruption
long interruptions, and
frequent interruptions.
.
We continue to use our best endeavours to automatically make GSL payments where service levels
are not met. For the 2014-15 to 2017-18 financial years, 62,869 GSLs were paid out at a cost of
$6,701,424. Table 9 shows our GSL volumes and payments between 2014-15 and 2017-18.
Table 9 GSL 2014-15 to 2017-18
$M, Nominal 2014-15 2015-16 2016-17 2017-18 Average
Appointments Vol 238 252 207 170 217
$ 12,376 14,254 11,799 9,690 12,030
Connection Vol 32 36 383 391 211
$ 3,484 4,322 120,897 79,179 51,971
Hot Water Vol - 1 - - 1
$ - 171 - - 43
Planned Interruption Vol 1,792 1,592 1,149 1,321 1,464
$ 53,621 50,317 34,697 42,105 45,185
Reconnection Vol 312 138 75 58 146
$ 28,704 14,534 6,741 6,667 14,162
Reliability – Duration Vol 3,897 6,110 2,415 41,910 13,583
$ 405,288 696,500 275,310 4,777,740 1,538,710
Reliability - Frequency Vol - - - - -
$ - - - - -
Wrongful
Disconnection
Vol 179 109 65 37 98
$ 23,270 15,274 9,230 5,254 13,257
The significant increase in the volume of reliability-duration GSLs in 2017-18 is as a result of a
severe storm which affected large parts of South-East Queensland on 11 February 2018. The storm
caused significant damage to network infrastructure and left 135,000 customers in six local
Government areas without power. The severe weather event did not trigger the Natural Disaster
Relief and Recovery Arrangements, so we were liable for $2,665,232 in GSL payments.

Energex Regulatory Proposal 2020-25 29
Major weather events are a common occurrence in Queensland, and often cause significant damage
to electricity network infrastructure and/or extended interruptions to supply for some customers.
Despite our best efforts to plan and maintain the electricity network cost-effectively to meet
customers’ expectations for high levels of reliability, such extreme events and their consequences
are outside our control. The MSS recognises this by excluding them from assessment of
performance interruptions which commence on Major Event Days (MEDs). This is also recognised in
the STPIS, which accounts for the impacts of MEDs in reliability indices used by the AER to assess
network performance.
The Queensland Competition Authority (QCA) is currently consulting on the GSLs to apply for the
2020-25 regulatory control period. In this Regulatory Proposal we have assumed the current GSLs
apply. To the extent the QCA makes amendments to the scheme, this will be reflected in our Revised
Regulatory Proposal in December 2019.

Energex Regulatory Proposal 2020-25 30
4. Our response to AER’s framework and approach paper
4.1 Overview
On 30 July 2018, the AER published its final F&A paper for Energex and Ergon Energy for the
regulatory control period commencing 1 July 2020. This is the first step in the Distribution
Determination process and sets out the AER’s proposed approach on the:
classification of distribution services
application of incentive schemes
application of the Expenditure Forecast Assessment Guideline, and
calculation of regulatory depreciation.
The F&A paper also sets out the AER’s decision on control mechanisms.
We were broadly supportive of the AER’s preliminary F&A paper, and we also support the final F&A
paper given that it is in large part consistent with the preliminary F&A paper. Our primary concern in
our response to the preliminary F&A paper was the proposed increase in STPIS revenue at risk from
±2 per cent to ±5 per cent. The final F&A paper for the 2020-25 regulatory control period accepts our
position that a high-powered STPIS is not required in Queensland at the present time, and retains the
current ±2 per cent revenue at risk.
The F&A paper was finalised during the consultation on the AER’s Service Classification Guideline
and revised STPIS, which were subsequently published in September and November 2018,
respectively. Both mechanisms necessitate adjustments to the service classification and the formulae
which give effect to control mechanisms in the F&A paper. Indeed, we note that the AER indicated in
the F&A paper that the publication of the Service Classification Guideline would constitute a material
change in circumstances necessitating adjustments to the service classification in the F&A paper.
We outline below our response to the F&A paper together with our consideration of the Service
Classification Guideline and the revised STPIS.
Key Messages
We broadly accept the AER’s final F&A paper, including its proposed:
service classification
control mechanisms for SCS and ACS, and
application of the Efficiency Benefit Sharing Scheme (EBSS), the Capital Expenditure
Sharing Scheme (CESS), the Demand Management Incentive Scheme (DMIS), STPIS and the
Demand Management Innovation Allowance Mechanism (DMIAM) for SCS.
We note the AER’s intention to apply:
its Expenditure Forecast Assessment Guideline to assess our capex and opex forecasts for
the 2020-25 regulatory control period, and
forecast depreciation to determine the RAB at the start of the subsequent regulatory control
period.

Energex Regulatory Proposal 2020-25 31
4.2 Service classification
Service classification determines which of our distribution services will be subject to regulation, how
we will recover our costs, and our ring-fencing obligations, over the regulatory control period. For
these reasons, it is one of the central decisions made by the AER in a Distribution Determination.
Under the NER, the AER may:
classify our distribution services as direct control services, and further as SCS or ACS. These
services are subject to direct regulatory oversight by the AER through revenue and/or price
controls
classify distribution services as a negotiated distribution service. These services are subject
to a more light-handed form of regulatory oversight through a negotiating framework, and
not classify a distribution service. These services are not subject to regulatory oversight.
Figure 11 summarises our service classification proposal for the 2020-25 regulatory control period.
Attachment 4.004 provides our detailed proposed 2020-25 Queensland distribution service list.
Figure 11 Our proposed classification of Queensland distribution services
4.2.1 Application of the Service Classification Guideline
In developing our service classification proposal, we have had regard to the F&A paper and the
Service Classification Guideline. The F&A paper sets out, amongst other things, the AER’s proposed
service groupings, descriptions and classifications for the 2020-25 regulatory control period. The
Service Classification Guideline also sets out the AER’s proposed approach to service classification
in a Distribution Determination. It is a new instrument introduced in the NER in December 2017 to
improve the clarity, transparency and predictability of the distribution service classification process.
Ideally the Service Classification Guideline would have been applied during the F&A process,
ensuring alignment between the two mechanisms. But, as noted previously, when the AER finalised
the F&A paper for the 2020-25 regulatory control period, it was still in the process of developing the
Service Classification Guideline. While the F&A paper incorporates many aspects of the AER’s
proposed approach to service classification set out in the Service Classification Guideline, there are
differences between the two mechanisms, the most significant being in connection services.
The Service Classification Guideline proposes a fundamentally different classification framework for
connections to that in the F&A paper, to improve clarity and consistency. We consider that the AER’s

Energex Regulatory Proposal 2020-25 32
connections framework outlined in the Service Classification Guideline is practical and will promote
clarity and consistency in connection services across all jurisdictions. However, it triggers service
classification changes from the F&A paper particularly for our small customer connections. These are
currently classified as SCS in Queensland and as such our small customers do not typically pay
upfront charges for their connections. By contrast, the Service Classification Guideline reclassifies
these connections as ACS.
We acknowledge that the proposed service classifications in the F&A paper and the Service
Classification Guideline are not binding on us in preparing our Regulatory Proposal or on the AER in
making its Distribution Determination. Nevertheless, we submit that the proposed service
classifications in the F&A paper must be given primacy. The F&A paper process is an important step
in the Distribution Determination process and the service classification considerations during this
process significantly shaped the development of our Regulatory Proposal and engagement with our
customers. This is because the service classification affects many other aspects of our Regulatory
Proposal, for example, our forecast RAB, opex, capex and our annual revenue requirements.
When the Service Classification Guideline was finalised, we were in the process of finalising our
Regulatory Proposal based on the service classification in the F&A paper. More importantly, our
customer engagement on Our Draft Plans (and connection policies) applied the service
classifications in the F&A paper. Therefore, our service classification proposal adopts the service
classifications of connection services in the F&A paper and we assume that the current regulatory
arrangements will continue in the 2020-25 regulatory control period. However, we have endeavoured
to apply the service groupings and descriptions provided in the Service Classification Guideline. The
remainder of this section summarises our proposal for each of the other service groups.
4.2.2 Common distribution service
This is the bundled distribution service provided to customers that use the shared distribution
network. The activities included under the common distribution service grouping in the Service
Classification Guideline are largely consistent with the F&A paper, except for bulk supply point
metering. In the Service Classification Guideline, bulk supply point metering is included in the
common distribution service group but is a separate service under the metering services group in the
F&A paper. We support the Service Classification Guideline decision and have adopted it in our
proposed service list.
Further, we support the classification of common distribution services as direct control services and
additionally as SCS because these are monopoly activities which benefit all customers. This is
consistent with the Service Classification Guideline and the F&A paper.
4.2.3 Network ancillary services
These are services that are closely related to the common distribution service which are typically
requested by specific customers and therefore attract customer specific charges. The services and
descriptions/activities in the service classification guideline and F&A paper are largely consistent. We
have adopted the Service Classification Guideline groupings and descriptions with the following
exception:
Inspection and auditing services: In relation to this service group, we retained the activities
listed in the F&A paper, which included two additional activities relating to our requirements
under sections 219 and 220 of the Electrical Safety Regulation 2013 (Qld) for after-hours
examination of consumer mains, mains switchboard, and electrical installations.
We support the classification of network ancillary services as direct control services and additionally
as ACS because these are customer specific services and we can attribute the costs to the

Energex Regulatory Proposal 2020-25 33
customers requesting the services. This is consistent with the Service Classification Guideline and
the F&A paper.
4.2.4 Metering services
The metering services grouping involves activities relating to the measurement of electricity supplied
to and from customers through the shared distribution system. We support the services and
descriptions/activities under the metering services group in the Service Classification Guideline,
which are in part consistent with the F&A paper. The Service Classification Guideline only includes a
subset of the services included in the F&A paper, so in addition to adopting the Service Classification
Guideline service groups, we propose to retain the following additional services provided in the F&A
paper:
Type 5 and 6 meter installation and provision (prior to 1 December 2017). This service
reflects that we will continue to recover the capital costs associated with our legacy meters
installed prior to 1 December 2017 in the 2020-25 regulatory control period
Emergency maintenance of failed metering equipment not owned by the distributor
(contestable meters). This service relates to power outages caused by an external metering
provider's metering equipment, and
Third party requested outage for purposes of replacing meter. This service relates to requests
from a retailer or metering coordinator to isolate power at a customer’s premises to facilitate
the replacement of the existing metering installation by an external metering provider.
We support the service classification in the service classification guideline and F&A paper:
Type 1 to 4 metering activities being unregulated
Type 5 to 6 metering installation related services being classified as ACS, and
Type 7 metering services being classified as SCS.
4.2.5 Public lighting services
These services relate to the provision of public lighting typically to local government councils and
road operators. We support the Service Classification Guideline service description of public lighting,
which is consistent with the F&A paper. We also support the ACS classification for public lighting.
This is a continuation of current regulatory arrangements in the 2020-25 regulatory control period.
4.3 Control mechanisms
4.3.1 Forms of control
Control mechanisms impose constraints on the revenues we earn or the prices that we charge (or
both), in the provision of direct control services (i.e. SCS or ACS). They ensure that we only earn
what the AER has allowed. The NER provide for several control mechanisms including revenue caps
and price caps. In its F&A paper, the AER decided to retain the following control mechanisms in the
2020-25 regulatory control period:
revenue cap for SCS, and
caps on the prices of individual services for ACS.
We accept the AER’s decision in the F&A paper.

Energex Regulatory Proposal 2020-25 34
4.3.2 Formulae for control mechanisms
Under the NER, in making a Distribution Determination, the formulae that give effect to the control
mechanisms must be as set out in the F&A paper unless the considers that a material change in
circumstances justify departing from the formulae in the F&A paper. As noted above, the publication
of the revised STPIS necessitates changes to formulae that give effect to the revenue cap for SCS
which are set out in the F&A paper. Therefore, we propose to vary from F&A paper’s control formulae
for SCS. Our proposed formulae are outlined in Attachment 4.003.
4.4 Incentive schemes
The NER provides several incentive schemes designed to encourage us to maintain and improve
service levels, pursue capex and opex efficiencies and demand management. We accept the
application of the STPIS, EBSS, CESS, DMIS and DMIAM over the 2020-25 regulatory control
period, as proposed in the F&A paper. We have had regard to incentive schemes in chapter 11 and
Attachment 11.001.
4.5 Expenditure forecast assessment guideline
We note the AER’s intention to apply its Expenditure Forecast Assessment Guideline to assess our
capex and opex forecasts for the 2020-25 regulatory control period. We have had regard to this
guideline in preparing our opex and capex forecasts in chapters 6 and 0 respectively.
4.6 Depreciation
We note and support the AER’s intention to apply forecast depreciation to determine our RAB at the
start of the subsequent regulatory control period, commencing on 1 July 2025. We agree that, in
combination with the proposed application of the CESS, this approach will maintain incentives for us
to pursue capex efficiencies.
4.7 Supporting documentation
The following documents supporting this chapter accompany our Regulatory Proposal:
Name Ref File name
Control mechanisms 4.001 EGX ERG 4.001 Control mechanisms
JAN19 PUBLIC
Expenditure forecasting method 4.002 EGX ERG 4.002 Expenditure
forecasting method JUN18 PUBLIC
Response to Preliminary Framework and
Approach 4.003
EGX ERG 4.003 Response to
Preliminary Framework and
Approach MAY18 PUBLIC
Service Classification 4.004 EGX ERG 4.004 Service Classification
JAN19 PUBLIC

Energex Regulatory Proposal 2020-25 35
Part B – Standard Control Services

Energex Regulatory Proposal 2020-25 36
5. Demand Forecast
5.1 Overview
We expect our customer numbers to increase by 7.8% over the 2020-25 regulatory control period,
based on connecting about 117,000 new customers. This steady growth is illustrated in Figure 12.
Figure 12 Customer numbers
While customer growth remains strong, we expect our peak demand growth to be considerably below
our historical highs. We expect average annual peak demand growth of 0.29%. Figure 13 illustrates
our flat demand forecast. This is a key driver of the capacity that our network must safely and reliably
deliver. Consequently, we expect augmentation expenditure to be relatively low for the 2020-25
regulatory control period.
We use temperature corrected demand forecasts at 10% and 50% Probability of Exceedance (POE),
depending on whether we are assessing our network under system normal conditions or with
elements of plant out of service (N-1) respectively. This helps use the appropriate level of risk to the
Key Messages
We expect our customer numbers to increase by 7.8% over the 2020-25 regulatory control
period, based on connecting more than 117,000 new customers.
Our network experienced record levels of peak demand in the summers of 2017 and 2018.
We expect our average annual growth in peak demand to be 0.29% in the 2020-25 regulatory
control period – this is relatively flat compared with our recent history, although we expect
localised areas of the network will continue to experience higher growth. Consequently, we
expect augmentation capex to be relatively low for the 2020-25 regulatory control period.
Our modelling approach is being improved. In 2018, ACIL Allen identified several
improvements to our modelling methodology. We have engaged Energeia to assist us with
the recommendations.
We are managing the uncertainty associated with new and emerging DER and their impact
on our network and peak demand.
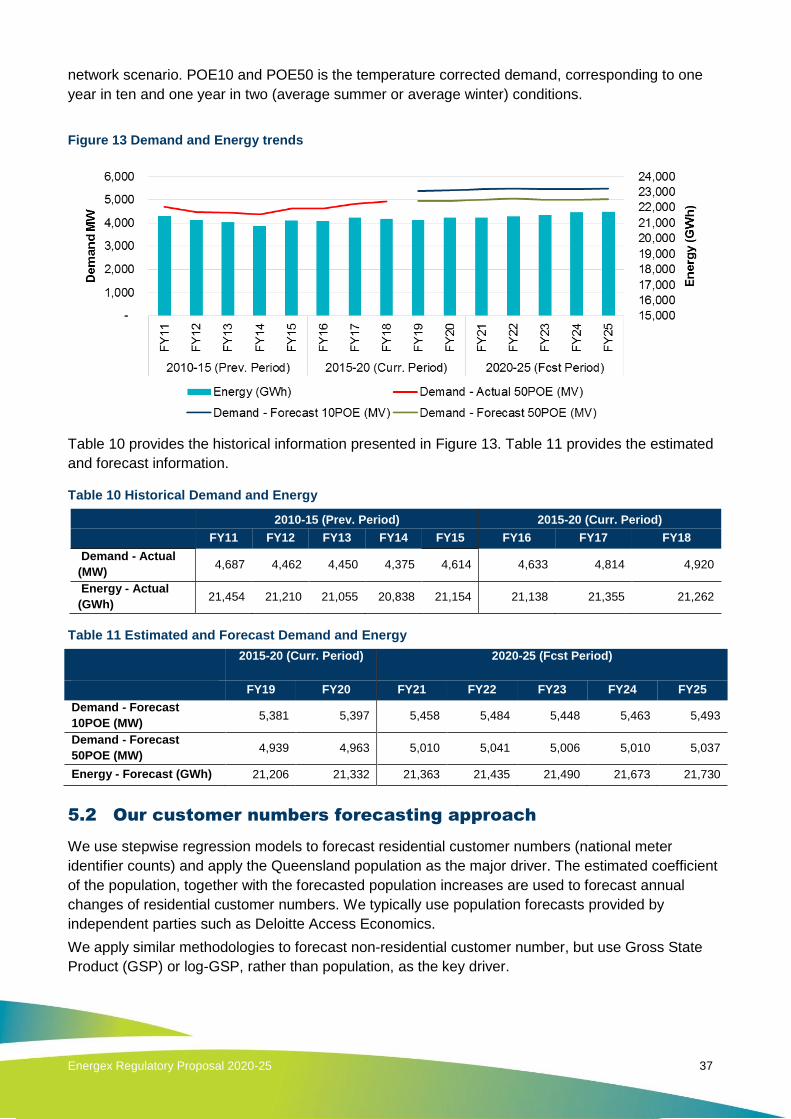
Energex Regulatory Proposal 2020-25 37
network scenario. POE10 and POE50 is the temperature corrected demand, corresponding to one
year in ten and one year in two (average summer or average winter) conditions.
Figure 13 Demand and Energy trends
Table 10 provides the historical information presented in Figure 13. Table 11 provides the estimated
and forecast information.
Table 10 Historical Demand and Energy
2010-15 (Prev. Period) 2015-20 (Curr. Period)
FY11 FY12 FY13 FY14 FY15 FY16 FY17 FY18
Demand - Actual
(MW) 4,687 4,462 4,450 4,375 4,614 4,633 4,814 4,920
Energy - Actual
(GWh) 21,454 21,210 21,055 20,838 21,154 21,138 21,355 21,262
Table 11 Estimated and Forecast Demand and Energy
2015-20 (Curr. Period)
2020-25 (Fcst Period)
FY19 FY20 FY21 FY22 FY23 FY24 FY25
Demand - Forecast
10POE (MW) 5,381 5,397 5,458 5,484 5,448 5,463 5,493
Demand - Forecast
50POE (MW) 4,939 4,963 5,010 5,041 5,006 5,010 5,037
Energy - Forecast (GWh) 21,206 21,332 21,363 21,435 21,490 21,673 21,730
5.2 Our customer numbers forecasting approach
We use stepwise regression models to forecast residential customer numbers (national meter
identifier counts) and apply the Queensland population as the major driver. The estimated coefficient
of the population, together with the forecasted population increases are used to forecast annual
changes of residential customer numbers. We typically use population forecasts provided by
independent parties such as Deloitte Access Economics.
We apply similar methodologies to forecast non-residential customer number, but use Gross State
Product (GSP) or log-GSP, rather than population, as the key driver.

Energex Regulatory Proposal 2020-25 38
5.3 Our peak demand forecasting methodology
We employ a bottom-up approach reconciled to a top-down evaluation, to develop the ten-year zone
substation peak demand forecasts. Our forecasts use validated historical peak demands and
expected load growth based on demographic and appliance information in small area grids. Demand
reductions, delivered via load control tariffs, are included in these forecasts. This provides us with
accurate forecasts on which to plan.
At the end of each summer, we review and update the temperature-corrected system summer peak
demand forecasts and each new forecast is used to identify emerging network limitations in the
sub-transmission and distribution network. For consistency, the system level peak demand forecast
is reconciled with the bottom-up substation peak demand forecast after allowances for network
losses and diversity of peak loads. It is the bottom-up substation and feeder demand that drives
distribution network investment.
We engage with our regional planning engineers to review, discuss and agree upon growth rates and
temperature-corrected starting points for each forecast. We incorporate non-network alternative
solutions and other known and anticipated changes in local demand and supply of electricity. It is the
local knowledge of planners in the absence of well-defined economic and demographic drivers that
ensure the best forecast outcomes at the level of individual zone substations.
For forecasting and network impact analysis, we are currently increasing the granularity of inputs to
improve our spatial modelling of zone substation and feeder level demand. We are introducing a tariff
scenario simulation, allowing improved accuracy at the localised network level of customer load
patterns, tariff selection, and DER adoption. These outputs, in particular the DER spatial forecasts,
will be incorporated into the annual zone substation peak demand forecast from next year, which will
in turn flow into expenditure decisions.
Greater detail about the methodology applied to peak demand forecasting at all levels of the network,
from transmission to sub-transmission to zone-substations to distribution feeders, can be found in the
Distribution Annual Planning Report, chapter 5 (Network Forecasting), section 5.3 (Substation and
Feeder Maximum Demand Forecasts). Figure 14 shows our actual annual peak demands for the past
7 years along with our 50% and 10% probability of exceedance forecasts for the period through to
2025.
Figure 14 Actual and Forecast Demand

Energex Regulatory Proposal 2020-25 39
In 2018, we engaged ACIL Allen to review our adoption of their forecasting methodology, from which
they made a number of recommendations. Subsequently, we engaged Energeia to develop a
strategic implementation roadmap of these recommendations. Seven recommendations were
grouped into three priority areas:
regionalisation of the existing forecasting solution to match the zones in place for asset
planning
improvement of the method by which DER impacts are modelled in the forecasting process,
and
improvement of the method for weather normalisation and sensitivity of forecasts.
While implementation of these recommendations will take some time, they do not impact the validity
of our current forecasting methodology as used for this Regulatory Proposal.
5.4 Our electricity delivered forecasting methodology
Our approach for forecasting electricity delivered is a combination of statistically-based time series
analysis, multi-factor regression analysis, and the application of extensive customer knowledge and
industry experience. Regression models and consultant reviews are used to substantiate the
forecasts, which are separately formulated for residential and non-residential customers, in alignment
with their respective network tariffs.
For each of the network tariffs, forecasts are produced for the total customer numbers and the
amount of electricity usage per connection or customer. The forecasts of customer numbers and
average usage per customer are then multiplied together to obtain total electricity consumption for
each segment. Total system electricity delivered is the summation of each of the components. This is
a market category or bottom-up approach and provides a reasonable basis for constructing forecasts
for total system electricity use.
Each category is affected by different underlying drivers for growth. For example, population and
income growth are generally of greater significance in driving electricity use in the residential
category, whereas growth is more important in the commercial category. Given these sensitivities, we
treat the different categories independently, rather than taking a more generalised approach that
results in some loss of useful information. Our methodology results in a more robust forecast.
We use electricity delivered forecasts based on network tariff classes to assist with electricity pricing
decisions. This approach follows a similar methodology where average consumption is modelled and
multiplied by the number of customers with that tariff. It uses multiple regression techniques with the
advantage being that weather, pricing and solar PV information drivers can be modelled separately
giving greater insight into electricity delivered values.
In addition, we have developed an econometric electricity purchases model that is used at a total
system level. This forecast is used to review and compare the bottom-up electricity delivered forecast
after accounting for network losses.
Forecasts for consumption growth are related to expected changes in GSP and the trend in changing
average consumption. Electricity delivered is predicted to grow at an average of 0.4% per annum
over the 2020-25 regulatory control period. Figure 15 provides a graphical representation of this
electricity growth.

Energex Regulatory Proposal 2020-25 40
Figure 15 Total Electricity Delivered
5.5 Supporting documentation
The following documents supporting this chapter accompany our Regulatory Proposal:
Name Ref File name
Demand Review Energy Queensland 5.001
EGX ERG 5.001 ACIL ALLEN Demand
Review Energy Queensland APR18
PUBLIC
Demand Forecast Summary
Recommendations 5.002
EGX ERG 5.002 Demand Forecast
Summary Recommendations JAN19
PUBLIC
20,000
20,200
20,400
20,600
20,800
21,000
21,200
21,400
21,600
21,800
22,000
FY
11
FY
12
FY
13
FY
14
FY
15
FY
16
FY
17
FY
18
FY
19
FY
20
FY
21
FY
22
FY
23
FY
24
FY
25
Previous Regulatory Period Current Regulatory Period Forecast Regulatory Period
Ele
ctr
icit
y d
eliv
ere
d b
y c
ate
go
ry
(GW
h)
Historical Energy Forecast Energy

Energex Regulatory Proposal 2020-25 41
6. Operating Expenditure forecasts
6.1 Overview
Our opex associated with managing the network includes inspections, maintenance and vegetation
management, emergency response and other non-network costs, such as customer service/call
centres, fuel and technical trade training that we need to deliver our distribution services.
We forecast the opex required to deliver our SCS as an input to our revenue requirements for the
2020-25 regulatory control period using the AER-preferred BST approach.
Our opex forecast must comply with the NER requirement for us to submit a prudent and efficient
opex forecast that is consistent with maintaining the quality, reliability and safety of the network and
network services. We must meet the service obligations in our Distribution Authority and the
Queensland Electricity Distribution Network Code as well as our customers’ reasonable expectations
that we should maintain the safety and reliability of our distribution services.
Our actual and forecast opex for each year of the 2010-15, 2015-20 and 2020-25 regulatory control
periods are shown in Figure 16.
Key Messages
Our forecast total opex for the 2020-25 regulatory control period is $1,806 million. This is
$4.78 million higher than what we included in Our Draft Plans ($1,801 million) that we
published in September 2018.
We have adopted the AER’s preferred Base-Step-Trend (BST) approach to developing our
forecast opex, other than for debt raising costs where we have adopted category specific
forecasts.
Our proposed base year is 2018-19 – we have estimated this amount for use in this
Regulatory Proposal. We forecast our opex will be $14.7 million below the AER’s
allowance for this year, reflecting the cost reductions achieved since the merger of
Energex and Ergon Energy under the Energy Queensland banner.
Even before making adjustments for restructuring costs, ongoing post-merger savings,
and the application of our AER-approved Cost Allocation Method (CAM), our base year is
efficient when tested against the econometric models considered in the AER’s 2018
Annual Benchmarking Report.
We recognise that we can achieve further cost reductions. We are proposing a
productivity saving of 9% over the regulatory control period, or 1.72% per annum, based
on a top-down management initiative targeting a 10% saving in Energy Queensland
indirect costs, and a 3% improvement in our program or works over the 2020-25
regulatory control period. Together, our management-led savings equates to $201 million
of cost savings over the 2020-25 regulatory control period.
We are not proposing any step changes.
We have applied the EBSS for the 2020-25 regulatory control period.

Energex Regulatory Proposal 2020-25 42
Figure 16 Historical and forecast opex (includes debt raising costs)
Note: Previous and current period data is presented on a like for like basis (adjustments for CAM, classification of services and reporting) with forecast period,
so AER allowance is not comparable.
Table 12 compares our Regulatory Proposal opex with the opex included in our Draft Plans, and
outcomes from the previous (2010-15) and current (2015-20) regulatory control periods.
Table 12 Opex comparison (includes debt raising costs)
$M, Real $2020 2010-15 2015-20 2020-25
Regulatory Proposal 1,905.56 1,805.77
AER Final Decision Allowance 2,010.26 1,905.56
Actual/forecast 2,930.19 1,882.54
Draft Plan 1,800.99
% change over 2015-20 forecast -4%
We expect our actual and estimated opex to be under the AER’s opex allowance for the 2015-20
regulatory control period by $23 million (inclusive of debt raising costs). In addition, we expect our
opex to continue to trend downwards in the 2020-25 regulatory control period, as we set ambitious
targets following our merger with Ergon Energy to further reduce our distribution network charges for
the benefit of our customers. Figure 17 highlights the significant actual and planned reduction in our
opex costs on a per customer basis.
375 407
432 403
436
380 375 376 384 384 365 363 361 359 357
0
50
100
150
200
250
300
350
400
450
500
FY
11
FY
12
FY
13
FY
14
FY
15
FY
16
FY
17
FY
18
FY
19
FY
20
FY
21
FY
22
FY
23
FY
24
FY
25
2010-15 (Prev. Period) 2015-20 (Curr. Period) 2020-25 (Fcst Period)
#R
EF
!
Previous Period Current Period
Forecast Period Period Average Opex

Energex Regulatory Proposal 2020-25 43
Figure 17 Opex per customer
6.2 What we have heard from our customers
In developing our opex plans for the 2020-25 regulatory control period, we have considered how best
to address the feedback we have received from our customers outlined in chapter 2 and explained
further in our 2020 and Beyond Community and Customer Engagement Report. In particular:
customers recognise the value of investing in new technology and that it is important to have
a modern network that enables customer technology solutions
overall, our customers want us to maintain, but not to improve, reliability performance. The
exception is for the mainly rural and remote customers currently who are currently receiving
below standard service
customers want better communication around power outage notifications – both planned and
unplanned (e.g. text communication), and
our future opex will include expenditure on demand management capabilities and
collaboration with the market on new solutions seen to better manage the network into the
future.
6.3 The nature and drivers of our opex
Our Expenditure Forecasting Methodology that we submitted to the AER in June 2018 explained that
we have six opex categories, which are described in Figure 18 below.

Energex Regulatory Proposal 2020-25 44
Figure 18 Categories of opex
The key drivers of our opex include:
security, performance and reliability needs of customers
inspecting and maintaining assets to ensure that they are operating safely and efficiently over
their lifetimes
meeting legislative requirements
responding to storm and severe weather events to restore supply
meeting growth in our network as measured by the number of connected customers, line
length and the ratcheted maximum demand of our customers
actively managing vegetation near our assets, and
addressing aging infrastructure and asset-related safety hazards.
Our opex forecast is our response to these drivers so that, together with our capex forecast, we
manage our overall network risk and deliver the service performance outcomes that our customers
expect and value.
Energex’s expenditure forecasting process systematically consider the trade-offs between opex and
capex through various ways including design and maintenance standards, equipment specification,
options analysis of replacement capex and demand management programs. This approach ensures

Energex Regulatory Proposal 2020-25 45
that the efficient trade-off between opex and capex has been considered at both an individual
component level (e.g. equipment specification), a project level (e.g. replacement decisions) and a
network level (e.g. our demand management programs). Details of the opex-capex trade-offs are set
out in Attachment 4.002.
6.4 Key opex assumptions
Table 13 details the key assumptions underpinning our opex forecasts. These have been endorsed
by our Directors.
Table 13 Key opex assumptions
Issue Assumption
1. Structure and
ownership
Our opex forecasts are based on our current company structure and ownership
arrangements.
2. Legislative and
regulatory obligations
Our opex forecasts are based on our current legislative and regulatory obligations and our
Distribution Authority.
3. Service classification
and ring-fencing
We will apply the service classification in the AER’s F&A paper and the current ring-fencing
arrangements will not change materially.
4. Customer preferences
and expectations
The preferences and expectations of participants revealed through our stakeholder
engagement program accurately reflect those of our customers generally.
5. Addressing customer
concerns about
affordability
Our opex forecasts have particular regard for the affordability of electricity supply and
appropriately respond to our customers’ concerns.
6. Service outcomes We will maintain, but not improve, our average system-wide service outcomes, consistent
with clause 6.5.6(a) of the NER.
7. Forecast opex Our opex forecasts are required to deliver the safety, reliability and customer outcomes set
out in our Regulatory Proposal.
8. Customer numbers Our customer numbers forecast provides an appropriate approach for determining our opex
rate of change.
9. Cost allocation Our CAM provides an appropriate basis for attributing and allocating costs to, and between,
our distribution services.
10. Inflation Our forecast inflation is reasonable and reflects the inflation-related costs that we will incur.
11. Opex base year
The financial year 2018-19 is an appropriate base year for our opex forecast and, subject to
our proposed adjustments, is reasonably representative of our recurrent prudent and efficient
future opex requirements.
12. Opex trend
assumptions
Our forecast changes in input costs, output growth and productivity are reasonable and
appropriately reflect the trend in our future opex, given our (adjusted) opex base year.
13. Cost pass through and
contingent projects
The AER will approve our nominated pass through events and we will not have any
contingent projects.
Our Directors have certified the reasonableness of these key assumptions in accordance with clause
S6.2.1(6) of the NER, as discussed in section 16.4 of this Regulatory Proposal.
6.5 AER requirements and approach
Under the NER, the AER must either accept or not accept our forecast opex for the 2020-25
regulatory control period in this Regulatory Proposal. The AER must accept our forecast opex if it is
satisfied that the forecast reasonably reflects the opex criteria in clause 6.5.6 of the NER.
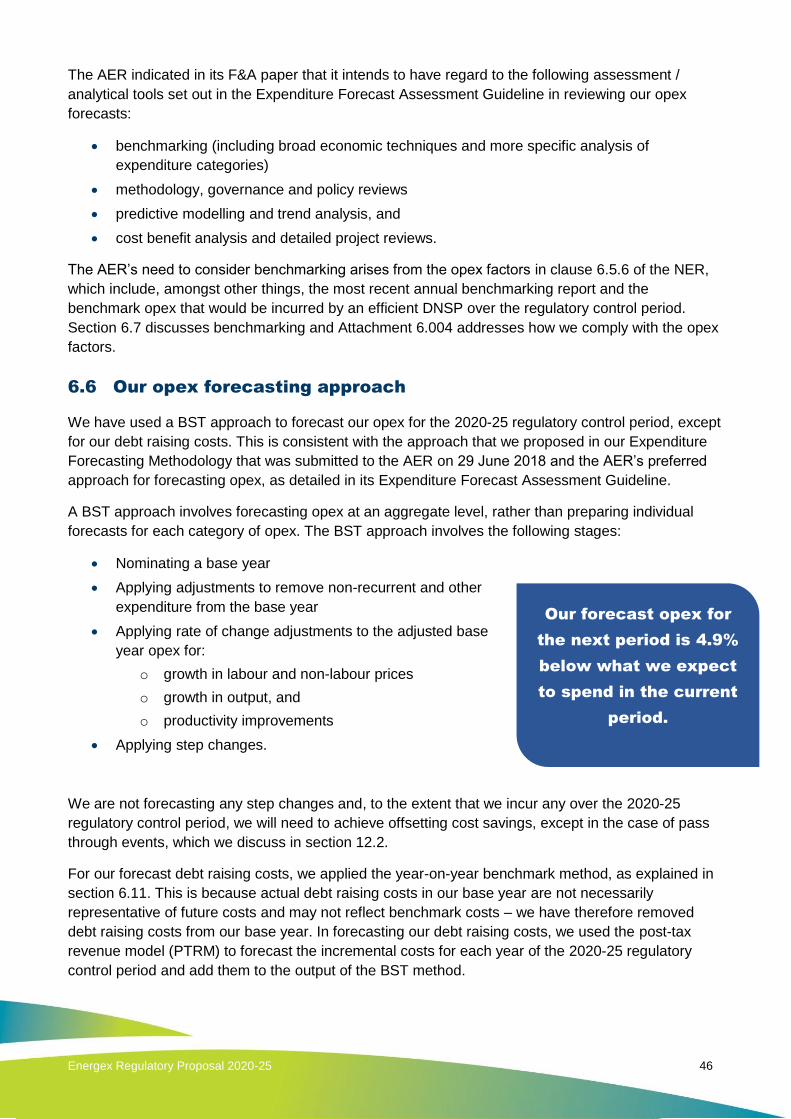
Energex Regulatory Proposal 2020-25 46
The AER indicated in its F&A paper that it intends to have regard to the following assessment /
analytical tools set out in the Expenditure Forecast Assessment Guideline in reviewing our opex
forecasts:
benchmarking (including broad economic techniques and more specific analysis of
expenditure categories)
methodology, governance and policy reviews
predictive modelling and trend analysis, and
cost benefit analysis and detailed project reviews.
The AER’s need to consider benchmarking arises from the opex factors in clause 6.5.6 of the NER,
which include, amongst other things, the most recent annual benchmarking report and the
benchmark opex that would be incurred by an efficient DNSP over the regulatory control period.
Section 6.7 discusses benchmarking and Attachment 6.004 addresses how we comply with the opex
factors.
6.6 Our opex forecasting approach
We have used a BST approach to forecast our opex for the 2020-25 regulatory control period, except
for our debt raising costs. This is consistent with the approach that we proposed in our Expenditure
Forecasting Methodology that was submitted to the AER on 29 June 2018 and the AER’s preferred
approach for forecasting opex, as detailed in its Expenditure Forecast Assessment Guideline.
A BST approach involves forecasting opex at an aggregate level, rather than preparing individual
forecasts for each category of opex. The BST approach involves the following stages:
Nominating a base year
Applying adjustments to remove non-recurrent and other
expenditure from the base year
Applying rate of change adjustments to the adjusted base
year opex for:
o growth in labour and non-labour prices
o growth in output, and
o productivity improvements
Applying step changes.
We are not forecasting any step changes and, to the extent that we incur any over the 2020-25
regulatory control period, we will need to achieve offsetting cost savings, except in the case of pass
through events, which we discuss in section 12.2.
For our forecast debt raising costs, we applied the year-on-year benchmark method, as explained in
section 6.11. This is because actual debt raising costs in our base year are not necessarily
representative of future costs and may not reflect benchmark costs – we have therefore removed
debt raising costs from our base year. In forecasting our debt raising costs, we used the post-tax
revenue model (PTRM) to forecast the incremental costs for each year of the 2020-25 regulatory
control period and add them to the output of the BST method.
Our forecast opex for
the next period is 4.9%
below what we expect
to spend in the current
period.

Energex Regulatory Proposal 2020-25 47
Figure 19 illustrates the build-up of our opex forecast for the 2020-25 regulatory control period, which
shows that our opex will continue to trend down over the 2020-25 regulatory control period. Table 16
in section 6.12 provides a detailed numerical breakdown of our opex forecast.
Figure 19 Forecast opex
6.7 Base year
6.7.1 Choice of base year and base year adjustments
We selected 2018-19 as our base year because it represents a realistic expectation of the efficient
and sustainable on-going opex that is required to provide our SCS in the 2020-25 regulatory control
period. We chose 2018-19 because:
It continues the well-accepted regulatory practice of using the most recent year for which
audited data is available by the time of the final Distribution Determination. Choosing a prior
year would require significant adjustments to ensure that it reflects our current and future
expected base opex. This would include removing merger and other efficiency savings
realised since the prior year and the 2018-19 year
It is the first year where our operations – and associated costs – largely reflect a harmonised
approach following the establishment of Energy Queensland and our merger with Ergon
Energy. Choosing a prior year would require significant adjustments to reflect the incomplete
nature of the business merger savings. We have incorporated expected 2019-20 savings into
our forecast to ensure that they are passed on to our customers, and
We have achieved efficiencies over the 2015-20 regulatory control period through the merger
savings achieved in Energy Queensland. Therefore, our 2018-19 opex base year estimate is
below the efficient opex forecast determined by the AER for the 2015-20 regulatory control
period.
We note that the AER deemed that it was appropriate to use revealed costs to set our opex
allowances for the 2015-20 regulatory control period, which meant that it was appropriate also to
apply the EBSS to this period. Our underspend against the AER’s allowance shows that we have
responded appropriately to the incentives under the AER’s EBSS.
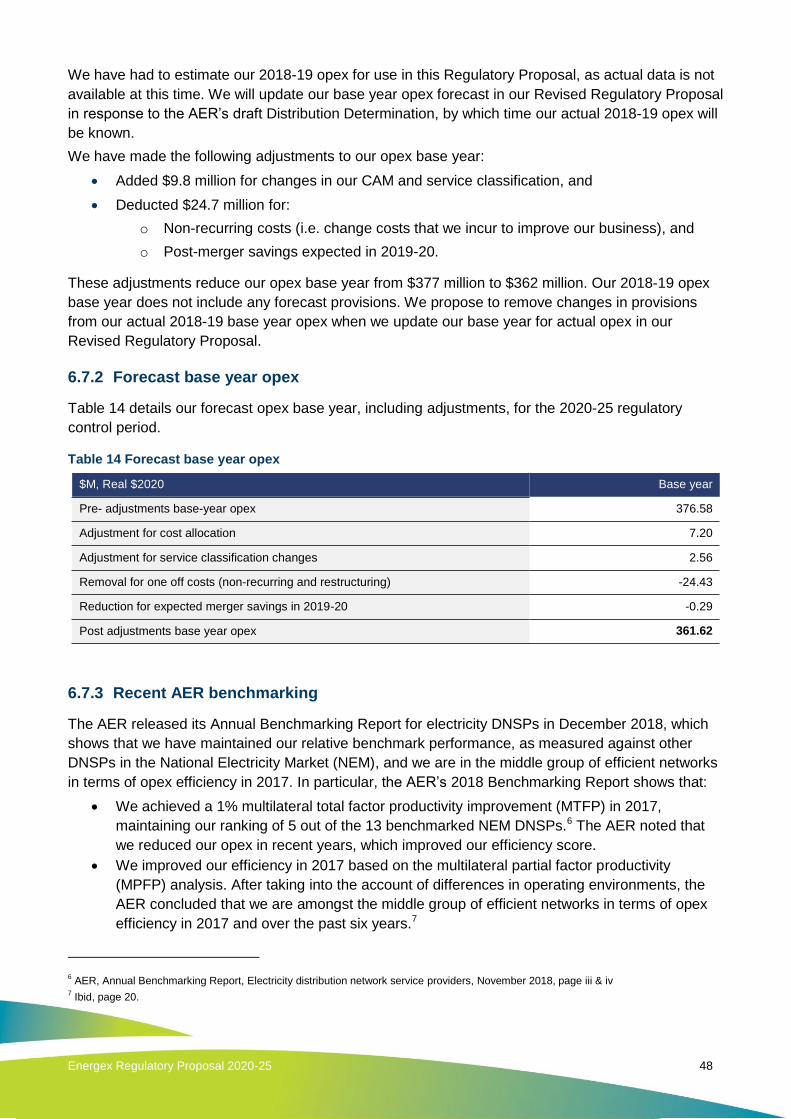
Energex Regulatory Proposal 2020-25 48
We have had to estimate our 2018-19 opex for use in this Regulatory Proposal, as actual data is not
available at this time. We will update our base year opex forecast in our Revised Regulatory Proposal
in response to the AER’s draft Distribution Determination, by which time our actual 2018-19 opex will
be known.
We have made the following adjustments to our opex base year:
Added $9.8 million for changes in our CAM and service classification, and
Deducted $24.7 million for:
o Non-recurring costs (i.e. change costs that we incur to improve our business), and
o Post-merger savings expected in 2019-20.
These adjustments reduce our opex base year from $377 million to $362 million. Our 2018-19 opex
base year does not include any forecast provisions. We propose to remove changes in provisions
from our actual 2018-19 base year opex when we update our base year for actual opex in our
Revised Regulatory Proposal.
6.7.2 Forecast base year opex
Table 14 details our forecast opex base year, including adjustments, for the 2020-25 regulatory
control period.
Table 14 Forecast base year opex
$M, Real $2020 Base year
Pre- adjustments base-year opex 376.58
Adjustment for cost allocation 7.20
Adjustment for service classification changes 2.56
Removal for one off costs (non-recurring and restructuring) -24.43
Reduction for expected merger savings in 2019-20 -0.29
Post adjustments base year opex 361.62
6.7.3 Recent AER benchmarking
The AER released its Annual Benchmarking Report for electricity DNSPs in December 2018, which
shows that we have maintained our relative benchmark performance, as measured against other
DNSPs in the National Electricity Market (NEM), and we are in the middle group of efficient networks
in terms of opex efficiency in 2017. In particular, the AER’s 2018 Benchmarking Report shows that:
We achieved a 1% multilateral total factor productivity improvement (MTFP) in 2017,
maintaining our ranking of 5 out of the 13 benchmarked NEM DNSPs.6 The AER noted that
we reduced our opex in recent years, which improved our efficiency score.
We improved our efficiency in 2017 based on the multilateral partial factor productivity
(MPFP) analysis. After taking into the account of differences in operating environments, the
AER concluded that we are amongst the middle group of efficient networks in terms of opex
efficiency in 2017 and over the past six years.7
6 AER, Annual Benchmarking Report, Electricity distribution network service providers, November 2018, page iii & iv
7 Ibid, page 20.

Energex Regulatory Proposal 2020-25 49
The AER’s 2018 benchmarking report provides limited guidance on how it intends to use
benchmarking in assessing our opex forecasts. However, in its November 2018 draft Distribution
Determination for the NSW DNSPs, the AER’s assessment of base year opex was based on the
results of the following economic benchmarking models — Cobb-Douglas stochastic frontier analysis,
Cobb-Douglas least squares econometrics, Translog stochastic frontier analysis and Translog least
square econometrics. These are presented in Figure 5.1 of page 31 of the AER’s 2018 Annual
Benchmarking Report. We welcome the AER’s latest approach of relying on a broad range of
evidence, which we consider to be preferable to the AER’s previous approach of relying solely on the
results of its Cobb-Douglas stochastic frontier analysis model.
As we have a challenging operating environment, the assessment of Operating Environment Factors
(OEFs) will play an important role in the AER’s benchmarking. The AER’s 2018 benchmarking report
provides limited guidance on how it intends to account for OEFs in its benchmarking models.
However, we understand from its approach for the NSW DNSPs that the AER will apply an OEF
adjustment for us consistent with its Distribution Determination for our 2015-20 regulatory control
period. On this basis, our OEF adjustment would be 17.1%.
A 17.1% OEF adjustment would account for OEFs that are relevant to us but are excluded from the
economic benchmarking models presented in the latest annual benchmarking report, such as sub-
transmission, division of responsibility for vegetation management, severe weather events, taxes and
levies and termite exposure. Other factors accounted for in this 17.1% OEF adjustment include
building regulations, capitalisation practices, corrosive environments, cultural heritage, environmental
regulations, fire ants, grounding conditions, occupational health and safety regulations, planning
conditions, proportion of 11kV and 22kV lines, rainfall and humidity, skills required by different
DNSPs, solar uptake, termite exposure, topography, traffic management, asset age, bushfires,
environmental variability, private power poles, and transformer capacity owned by customers.
The AER is currently consulting further on how OEFs can be quantified. It published a report by
Sapere-Merz in September 2018, which assesses three OEFs that are relevant to us – being sub-
transmission, taxes and levies and termite exposure. We note that this is a limited subset of the
OEFs previously considered by the AER in 2015. The illustrative OEF adjustment proposed for these
three OEFs is 3.5%.
In our view, Sapere-Merz’s report significantly underestimates the OEFs adjustments that are
necessary to explain the vast differences in the operating environment of the different DNSPs in the
NEM. We were therefore pleased to see that the AER is using its 2015 assessment of OEFs as the
basis of its draft Distribution Determination for NSW distributors, rather than the OEF adjustments
presented by Sapere-Merz. However, we understand it may be because Sapere-Merz’s work
includes only a limited subset of relevant OEFs and is too preliminary and illustrative at present. Our
view is confirmed by recent work undertaken for us by Frontier Economics (Attachment 6.009) that
sets out a framework for assessing OEFs and highlights some of the limitations with the Sapere-
Merz’s work.
We have cross-checked our pre-adjustments base year opex of $376.6 million with the AER’s latest
economic benchmarking models described above to see if there is any evidence that our opex is
materially inefficient. Our cross-check used both the AER’s 2015 OEF adjustment of 17.1% as well
as the preliminary and conservative Sapere-Merz OEF adjustment of 3.5%.
Figure 20 shows, the AER’s most recent economic benchmarking analysis indicates that our pre-
adjustments base year opex of $376.6 million is efficient, and that there is no justification for the AER
to make a further base year efficiency adjustment. This is true even under the highly conservative
OEF adjustment of 3.5%, which covers only three of our many relevant OEFs.

Energex Regulatory Proposal 2020-25 50
Figure 20 Cross-check of Energex’s proposed base year opex with the AER’s latest economic
benchmarking models
Note: The horizontal blue line shows Energex’s pre-adjusted Base Year Opex expressed in FY2020 (mid-year) dollars of
$371 million. Converted to year end dollars and adding the expected change from 2018-19 to 2019-20 gives the $376.6
million shown in Table 14. A description of each econometric model specification is included in the Frontier Economics
report. Source: Frontier Economics benchmarking report at Attachment 6.002.
Figure 20 shows that the range of estimated efficient opex from the AER’s four economic
benchmarking models for various model specifications is:
between $437m and $475m, when an OEF adjustment of 17.1% is used; and
between $387m and $420m, when a conservative OEF adjustment of 3.5% is used.
In summary, this analysis indicates that our proposed 2018-19 base year opex is prudent and
efficient for the safe and reliable provision of our SCS.
Further detail on how our base year opex compares to economic benchmarks is included in the
Frontier Economics report at Attachment 6.002 and discussed in Attachment 6.003.
6.7.4 Category analysis benchmarking
We note that our initial category analysis benchmarking indicates:
indirect costs and maintenance costs are not materially inefficient compared to other
Australian DNSPs, and lower than some
emergency response costs appear higher than for some DNSPs, primarily because of the
severe weather that we can face across a broad network coverage area and subsequent
mobilisation of resources to respond to our customers restoration expectations
vegetation management expenditure costs have appeared to be higher than industry peers.
However, our base year opex includes a reduction in overall vegetation costs due to recent
negotiations of vegetation management contracts. The new contracts will sustainably reduce

Energex Regulatory Proposal 2020-25 51
vegetation management costs through a variety of means including data capture and
analysis, improving corridor condition through removal of problematic vegetation, and through
a larger contractual arrangement achieved as Energy Queensland.
Attachment 6.003 provides more details on our economic and category analysis benchmarking and
why our opex base year is efficient.
6.8 Rate of change – price
Our base year opex reflects the current prices of our cost inputs. The BST approach adjusts this
base year opex to account for forecast real changes in input costs over the 2020-25 regulatory
control period.
Our trend adjustments have taken the average of the real labour escalator forecasts from BIS Oxford
and Deloitte Access Economics (DAE), being 0.85% on average per year over the 2020-25
regulatory control period. We commissioned BIS Oxford to provide us with real labour escalator
forecasts and adopted the DAE forecasts used by the AER in its draft Distribution Determination for
the NSW distributors, expecting that the AER will commission DAE labour forecasts for Queensland
in due course.8
We have applied a labour cost escalator of 0.26% on average per annum to reflect our management
commitment to improve our program of works by 3% over the 2020-25 regulatory control period. This
will be achieved by the digitisation of our business processes, delivering improved work scheduling
and improved corporate processes.
As recognised in past AER decisions, using a labour (or wage) price index as we propose builds in
some assumed labour productivity. We have not sought to quantify this but it adds to our proposed
top down management savings.
We have not included any real material cost escalators in our forecast.
Table 15 details the forecast average annual change in cost for each year of the 2020-25 regulatory
control period.
Table 15 Forecast price growth 2020-21 to 2024-25
Per cent 2020-21 2021-22 2022-23 2023-24 2024-25
BIS Oxford real labour forecast 0.50% 0.80% 1.30% 1.40% 1.40%
Deloitte Access Economic real labour forecast 0.06% 0.57% 0.83% 0.84% 0.84%
Average real labour forecast 0.28% 0.68% 1.07% 1.12% 1.12%
Less 3% management commitment (productivity) 0.59% 0.59% 0.59% 0.59% 0.59%
Adjusted real labour forecast (59.7% weight) -0.31% 0.09% 0.47% 0.52% 0.52%
Real other forecast (40.3% weight) 0.00% 0.00% 0.00% 0.00% 0.00%
Price growth -0.19% 0.05% 0.28% 0.31% 0.31%
8 AER – NSW DETERMINATIONS – Draft Decision – opex model – September 2018_0 - Excel, Input | rate of change.

Energex Regulatory Proposal 2020-25 52
6.9 Rate of change – outputs
Our base year opex reflects our current outputs. The BST approach adjusts this base year opex to
account for forecast output levels over the 2020-25 regulatory control period.
We have included an allowance in our opex forecast for the impact of output growth in the 2020-25
regulatory control period, consistent with the AER’s standard approach. This reflects the fact that
delivering greater outputs costs more to operate and maintain.
We have applied the output change measures and respective weightings in the Economic Insights
report[1] released with the AER’s 2018 benchmarking report, including for the impact of economies of
scale. The four output growth measures are set out in Table 16. These are weighted to calculate the
average output growth shown (in bold) in the same table. The weights used to calculate that average
are shown in Table 17.
Table 16 Forecast output growth 2020-21 to 2024-25
Per cent 2020-21 2021-22 2022-23 2023-24 2024-25
Output Measures
Customer numbers 1.55% 1.56% 1.52% 1.48% 1.36%
Circuit length 0.50% 0.50% 0.50% 0.50% 0.50%
Ratcheted maximum demand 0.90% 0.44% 0.00% 0.26% 0.00%
Energy 0.15% 0.34% 0.26% 0.85% 0.26%
Average Output Growth (using the average
weights in Table 17) 1.17% 1.06% 0.93% 0.99% 0.85%
Table 17 Output weights by economic model
Per cent SFA CD LSE CD LSE TLG MPFP Average
Output Measures
Customer numbers 70.80% 67.56% 51.48% 31.00% 55.21%
Circuit length 16.80% 11.81% 13.86% 29.00% 17.87%
Ratcheted maximum demand 12.40% 20.63% 34.66% 28.00% 23.92%
Energy 0.00% 0.00% 0.00% 12.00% 3.00%
Total 100.00% 100.00% 100.00% 100.00% 100.00%
Note: The labels for the four models shown are abbreviated: ‘SFA’ means Stochastic Frontier Analysis; ‘CD’ means Cobb Douglas; ‘LSE’ means Least
Squares; ‘TLG’ means Translog; and ‘MPFP’ means Multilateral Partial Factor Productivity. These terms are explained further in the Economic Insights report.
[1]
Economic Benchmarking Results for the Australian Energy Regulator’s 2018 DNSP Annual Benchmarking Report, 10 August 2018

Energex Regulatory Proposal 2020-25 53
6.10 Rate of change – productivity
We have delivered significant efficiencies in our opex over the 2015-20 regulatory control period, as
we discussed in section 3.2, and are committed to pursuing further savings in the 2020-25 regulatory
control period. We have also removed expected incremental merger savings from 2018-19 to 2019-
20 from our base opex (as shown in Table 14) even though we have not benefited from these yet.
We are proposing a positive productivity saving based on the Energy Queensland top-down
management initiative of 10% total indirect cost savings, and other targeted cost reductions, which
results in an overall productivity saving of 9% over the 2020-25 regulatory control period, or 1.72%
per annum, as set out in Table 18.
In this way, the savings will be progressively achieved through a structured program delivered
throughout 2020-25. We expect that, because of our targeted productivity savings, we will at least
maintain our relative performance as benchmarked against our peers, with an aspiration to improve.
Table 18 Forecast productivity 2020-21 to 2024-25
Per cent 2020-21 2021-22 2022-23 2023-24 2024-25
Productivity saving 1.72% 1.72% 1.72% 1.72% 1.72%
In its recent decisions, the AER has applied a zero per cent productivity factor based on recent
productivity trends and advice from Economic Insights. However, we note that in its November 2018
draft decision paper on “Forecasting productivity growth for electricity distributors”, the AER
foreshadowed its intention to use an opex productivity growth forecast of 1% for its next Distribution
Determinations for each DNSP. Our proposed productivity savings over the regulatory control period
should be considered instead of (rather than additional) to that considered by the AER. Our targeted
productivity assumption of 9% over the regulatory control period is based on our assessment of being
able to achieve the resulting level of opex and continue to deliver services that our customers expect
which meets our regulatory obligations. That assumption is based on information available to us at
the time we submit this Regulatory Proposal, including the status of the AER’s review of productivity
which is not expected to be completed until after we submit.
If circumstances change between the dates of this Regulatory Proposal and when we submit our
Revised Regulatory Proposal – including following the AER’s findings on productivity and its draft
determination – we reserve the right to reassess whether our proposed productivity assumption
enables us to deliver the services that our customers expect from us while meeting our regulatory
obligations, and if necessary, amend our targeted productivity assumption in our Revised Regulatory
Proposal. Our assessment will also include the impact of the AER’s Draft Decision on other aspects
of our Regulatory Proposal including whether we are able to make the investments necessary to
achieve these productivity improvements. Our views on how the AER should determine the
productivity factor are set out in our submission to the AER on this matter.
6.11 Specific or category forecasts
Debt raising costs are the costs of issuing debt, including the costs of maintaining an investment
credit rating needed to issue this debt. We estimated the debt raising costs using the method
adopted by the AER in its recent Distribution Determinations, as set out in the PTRM. We propose a
debt raising cost unit rate of 8.05 basis points.
The calculation of our debt raising costs is set out in section 9.3.1. Table 19 sets out our forecast
debt raising costs based on 8.05 basis points.

Energex Regulatory Proposal 2020-25 54
Table 19 Forecast debt raising costs 2020-21 to 2024-25
$M, Real 2020 2020-21 2021-22 2022-23 2023-24 2024-25
Debt raising costs 6.24 6.23 6.21 6.20 6.17
6.12 Our opex forecast
Table 20 details our BST forecast opex over the 2020-25 regulatory control period, which is a
summation of the above components.
Table 20 Forecast opex, 2020-21 to 2024-25
$M, Real 2020 2020-21 2021-22 2022-23 2023-24 2024-25 Total
Base 376.58 376.58 376.58 376.58 376.58 1,882.89
Net Base Year Adjustments -14.96 -14.96 -14.96 -14.96 -14.96 -74.81
Output Growth 4.33 8.58 12.68 17.52 21.93 65.04
Price Growth -0.69 -0.51 0.59 1.92 3.34 4.64
Productivity Growth -6.38 -13.05 -20.11 -27.81 -35.68 -103.04
Step Changes
Debt raising costs 6.24 6.23 6.21 6.20 6.17 31.05
Total 365.11 362.86 360.99 359.44 357.38 1,805.77
6.13 Supporting documentation
The following documents supporting this chapter accompany our Regulatory Proposal:
Name Ref File name
Demand Management Plan 6.001
EGX ERG 6.001 Demand
Management Plan JUN18 PUBLIC
Benchmarking independent expert report
6.002
EGX ERG 6.002 Frontier Economics
Benchmarking independent expert
report JAN19 PUBLIC
Base Year Opex Overview 6.003
EGX ERG 6.003 Base Year Opex
Overview JAN19 PUBLIC
Cost allocation method 6.004 EGX ERG 6.004 Cost allocation
method NOV18 PUBLIC
Escalations independent expert report 6.005
EGX ERG 6.005 BIS Oxford Economics
Escalations independent expert
report JUN18 PUBLIC
Escalations independent expert report 6.006
EGX ERG 6.006 Deloitte Access
Economics Escalations independent
expert report JUL18 PUBLIC
Opex forecast – SCS 6.007 EGX 6.007 Opex forecast – SCS

Energex Regulatory Proposal 2020-25 55
Name Ref File name
JAN19 PUBLIC
OEFs independent expert report
6.009
EGX ERG 6.009 Frontier Economics
OEFs independent expert report
JAN19 PUBLIC

Energex Regulatory Proposal 2020-25 56
7. Capital expenditure forecasts
Key Messages
We propose to decrease our capex for the 2020-25 regulatory control period to $2,327
million, compared with an estimated net capex of $2,846 million in the current
regulatory control period. This is also $56.2 million lower than what we included in Our
Draft Plans that we published in September 2018.
We are committed to investing capital prudently and efficiently on behalf of customers.
Our capex focus for the 2020-25 regulatory control period is to deliver:
o A no-compromise approach to community and staff safety, leveraging innovative
solutions that enable continuous improvement
o Sustainable investment to avoid the historical boom-bust cycle and associated
future bill shocks, appropriately manage aged assets, and maintain our reliability
and security standards while continuing to find cost efficiencies in investments
o Investments which support the transition to the future by evolving the network to
best enable customer choice in their electricity supply solutions, such that we
can integrate solar, batteries and other technologies with the network in a way
that is cost effective and sustainable, while incorporating non-network
alternatives, and
o Prudent investment in fit-for-purpose non-network assets to support our staff in
efficiently delivering services to our customers.
Our replacement capex (repex) will form the largest share of our proposed system
capex as we continue to responsibly replace and upgrade assets, informed by a mature
risk management approach.
Our connections capex forecast reflects our most recent lower expenditure levels. We
expect that connections capex levels will remain at these levels for the foreseeable
future as we unwind from the boom in apartment developments in South East
Queensland.
Our augmentation capex (augex) forecast reflects the changing nature of our network,
with an overall reduction in expenditure, despite ongoing peak demand and customer
growth. We are focussing on augmenting key localised growth areas, such as
Caloundra South, and investing to support the transition to an intelligent grid through
network control and monitoring.
Our non-network ICT investment will enable the continued transformation of our
business and support the delivery of opex savings. We will benefit from the increased
functionality embedded within new software packages.
Our investment in fleet and property assets enables us to deliver services to our
customers in line with community and customer expectations of value for investment
through targeted programs to support optimal lifecycle, asset risk and functional
operations.
We have forecast our capitalised overheads using the BST approach applied to opex.

Energex Regulatory Proposal 2020-25 57
7.1 Overview
Figure 21 details our forecast capex over the 2020-25 regulatory control period. Figure 22 shows
trends in our gross capex by category over the 2010-15, 2015-20 and 2020-25 regulatory control
periods.
Figure 21 Forecast capex category proportions
Note: Totals may not sum to 100% due to rounding
Figure 22 Capex trends compared to AER allowance
Note: Previous and current period data is presented on a like for like basis (adjustments for CAM, COS and reporting) with forecast period, so AER allowance
is not comparable.
The data supporting Figure 22 is provided in Table 21 and Table 22.
Replacements, 28%
Augmentations, 13%
Connections, 20%
Non-Network, 16%
Capitalised Overheads, 22%
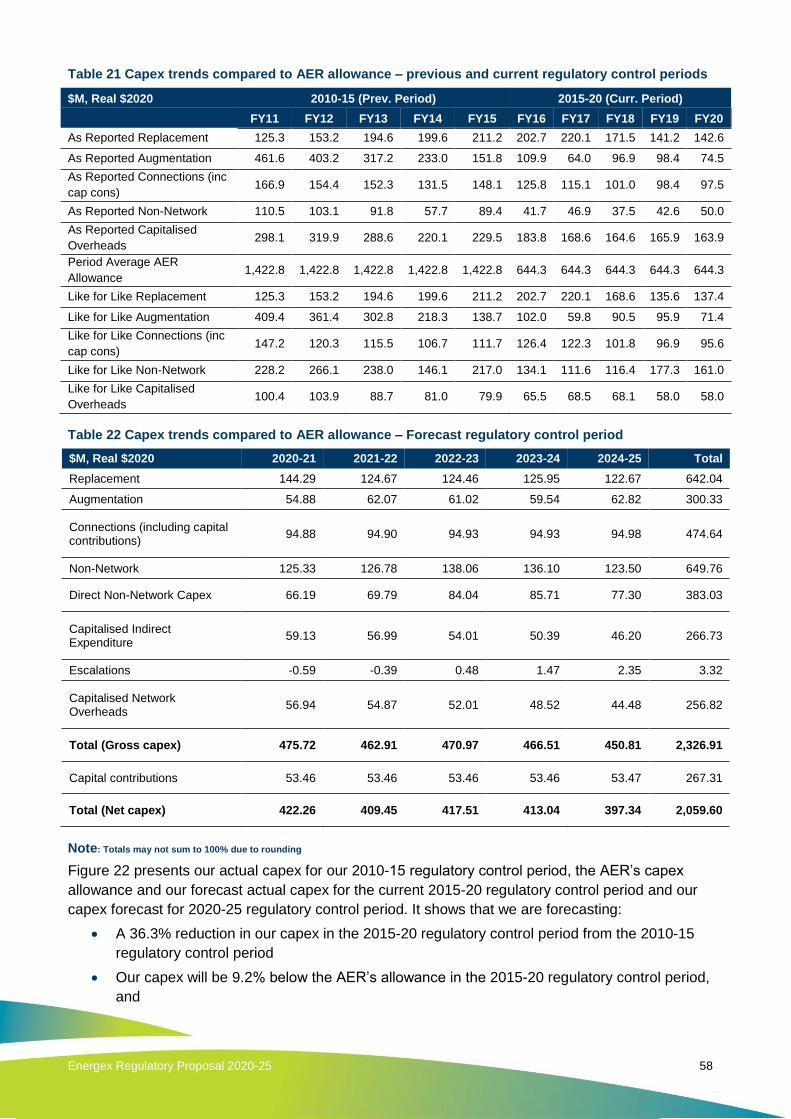
Energex Regulatory Proposal 2020-25 58
Table 21 Capex trends compared to AER allowance – previous and current regulatory control periods
$M, Real $2020 2010-15 (Prev. Period) 2015-20 (Curr. Period)
FY11 FY12 FY13 FY14 FY15 FY16 FY17 FY18 FY19 FY20
As Reported Replacement 125.3 153.2 194.6 199.6 211.2 202.7 220.1 171.5 141.2 142.6
As Reported Augmentation 461.6 403.2 317.2 233.0 151.8 109.9 64.0 96.9 98.4 74.5
As Reported Connections (inc
cap cons) 166.9 154.4 152.3 131.5 148.1 125.8 115.1 101.0 98.4 97.5
As Reported Non-Network 110.5 103.1 91.8 57.7 89.4 41.7 46.9 37.5 42.6 50.0
As Reported Capitalised
Overheads 298.1 319.9 288.6 220.1 229.5 183.8 168.6 164.6 165.9 163.9
Period Average AER
Allowance 1,422.8 1,422.8 1,422.8 1,422.8 1,422.8 644.3 644.3 644.3 644.3 644.3
Like for Like Replacement 125.3 153.2 194.6 199.6 211.2 202.7 220.1 168.6 135.6 137.4
Like for Like Augmentation 409.4 361.4 302.8 218.3 138.7 102.0 59.8 90.5 95.9 71.4
Like for Like Connections (inc
cap cons) 147.2 120.3 115.5 106.7 111.7 126.4 122.3 101.8 96.9 95.6
Like for Like Non-Network 228.2 266.1 238.0 146.1 217.0 134.1 111.6 116.4 177.3 161.0
Like for Like Capitalised
Overheads 100.4 103.9 88.7 81.0 79.9 65.5 68.5 68.1 58.0 58.0
Table 22 Capex trends compared to AER allowance – Forecast regulatory control period
$M, Real $2020 2020-21 2021-22 2022-23 2023-24 2024-25 Total
Replacement 144.29 124.67 124.46 125.95 122.67 642.04
Augmentation 54.88 62.07 61.02 59.54 62.82 300.33
Connections (including capital contributions)
94.88 94.90 94.93 94.93 94.98 474.64
Non-Network 125.33 126.78 138.06 136.10 123.50 649.76
Direct Non-Network Capex 66.19 69.79 84.04 85.71 77.30 383.03
Capitalised Indirect Expenditure
59.13 56.99 54.01 50.39 46.20 266.73
Escalations -0.59 -0.39 0.48 1.47 2.35 3.32
Capitalised Network Overheads
56.94 54.87 52.01 48.52 44.48 256.82
Total (Gross capex) 475.72 462.91 470.97 466.51 450.81 2,326.91
Capital contributions 53.46 53.46 53.46 53.46 53.47 267.31
Total (Net capex) 422.26 409.45 417.51 413.04 397.34 2,059.60
Note: Totals may not sum to 100% due to rounding
Figure 22 presents our actual capex for our 2010-15 regulatory control period, the AER’s capex
allowance and our forecast actual capex for the current 2015-20 regulatory control period and our
capex forecast for 2020-25 regulatory control period. It shows that we are forecasting:
A 36.3% reduction in our capex in the 2015-20 regulatory control period from the 2010-15
regulatory control period
Our capex will be 9.2% below the AER’s allowance in the 2015-20 regulatory control period,
and

Energex Regulatory Proposal 2020-25 59
Our capex in the 2020-25 regulatory control period will be:
o 18.2% below our estimated capex in the current period
o 27.8% below the AER’s allowance in the current period, and
o 47.9% below our actual capex in the 2010-15 regulatory control period.
These trends reflect the fact that we had sustained real growth in our capex between 2005 and 2015,
largely in response to increased reliability standards, which contributed to strong growth in our RAB.
Since 2015, we have had a real reduction in our SCS RAB, as our capex has dramatically reduced
(even after the adjustments such as the reclassification of metering services from SCS to ACS). The
reduction in capex spend is shown in Table 23.
Table 23 Capex trends by category
$M, Real $2020 2010-15 2015-20 2020-25
Replacement 883.95 864.41 643.44
Connections (incl capital contributions) 601.43 542.97 475.05
Augmentation (incl Reliability) 1,430.72 436.56 301.07
Capitalised Overheads 453.93 318.24 256.82
Total System 3,370.03 2,162.19 1,676.38
ICT 336.03 306.96 294.23
ICT - Direct Capex 217.43 187.26 192.98
ICT- Capitalised Indirect Expenditure 118.61 119.70 101.25
Fleet & Equipment 324.11 197.36 182.19
Fleet & Equipment - Direct Capex - - 110.23
Fleet & Equipment - Capitalised Indirect Expenditure - - 71.97
Property 435.28 196.02 174.10
Property - Direct Capex - - 80.59
Property - Capitalised Indirect Expenditure - - 93.51
Total Non-network 1,095.42 700.34 650.53
Total Gross Capex 4,465.45 2,862.53 2,326.91
Totals may not add due to rounding. Previous and current period data is presented on a like for like basis (adjustments for CAM, classification of services and
reporting) with forecast period, so AER allowance is not comparable.
We are forecasting large reductions in all of our capex categories in the 2020-25 regulatory control
period, except for ICT, with the biggest contributors to this decline being a dramatic reduction in our
replacement, augmentation and reliability capex. The increase in ICT is explained by our new ICT
service delivery model, which is discussed in section 7.10.1.
Our capex performance has been compared against our peers in many studies, including by the
AER’s annual benchmarking reports. These reports show that our capex in 2017 has reduced by
more than any other DNSP (except for Ausgrid) over this last 10 years. We have also had the largest
underspend of any DNSP over its most recently completed regulatory control period. The AER’s
2018 Annual Benchmarking Report examines the capital MPFP of electricity DNSPs over the period
2006 - 2017. This considers the productivity of the DNSP’s use of overhead lines and underground
cables (split into distribution and sub-transmission) and transformers. The AER’s analysis shows that
we have remained relatively stable in the middle band of DNSPs over this period.

Energex Regulatory Proposal 2020-25 60
Our capex trend reflects our long-term commitment to reducing our capex in a sustainable manner
for the benefit of our customers. Our merger with Ergon Energy has made an important contribution
to this trend.
7.2 The nature and drivers of our capex
Our main categories of capex from our June 2018 Expenditure Forecasting Methodology that support
the delivery of our network services are shown in Figure 23.
Figure 23 Categories of capex
Repex – driven by:
o the need to maintain and where relevant improve safety outcomes for our
communities, customers and employees
o equipment replacement due to age and condition where maintenance or repair is no
longer practical, or cost effective and the asset is at end of life
o overhead distribution network (these are the ‘poles and wires’ you can see, rather than
the ones that are underground) where the greatest network risk exposure resides
o addressing poor condition assets and emerging asset related safety hazards, and

Energex Regulatory Proposal 2020-25 61
o transitioning to a more proactive replacement approach for sustainable asset
management and safety outcomes.
Connection expenditure (connex) – driven by:
o customer connections performed in accordance with our Connection Policy and capital
contributions framework
Augex – driven by:
o network expansions or additions i.e. a new substation or feeder to support new
customer growth
o innovative technology investment to enable an intelligent grid and improved asset
utilisation while meeting customers’ increasing network capacity needs through choice
in solutions such as solar energy, batteries, and electric vehicles
o obligations to address reliability of worst performing feeders, and
o obligation to maintain power quality and supply voltages.
Non-network expenditure (Property, ICT, Fleet and Equipment) – driven by:
o business needs to deliver our program of work, and
o investing in appropriate systems and tools to efficiently run our business and deliver
services to our customers.
Overheads – comprising capitalised corporate overheads and network overheads
o corporate overheads cover the provision of corporate support and management
services by the corporate office that cannot be directly attributed to specific services,
and
o network overheads cover the provision of network, control and management services
that cannot be directly attributed to specific services.
Our capex forecast is our response to these drivers so that, together with our opex forecast, we
manage our overall network risk and deliver the service performance outcomes that our customers
expect.
7.3 What we have heard from our customers
In developing our capex plans for the 2020-25 regulatory control period, we have considered how
best to address the feedback we have received from our customers. As discussed in chapter 2, we
heard that we need to:
manage asset, staff and community safety as an expectation of our role
ensure investment is prudent to minimise increases to the RAB, particularly in an uncertain
energy future
prioritise collaboration with our customers, communities and other market participants in
developing solutions
continue to transform our network to enable new technology and customer choice
ensure that we manage a sustainable program to avoid boom and bust cycles and
subsequent customer impacts, and
continue to use new technology to deliver efficiencies.
We have sought additional ways to expand our demand management plans in light of the positive
customer feedback on these initiatives and the desire to see more of them. We have also provided
additional clarity about where we are investing in demand management and where it has been used
in project outcomes.

Energex Regulatory Proposal 2020-25 62
We presented our high-level investment drivers and forecasts as part of our customer engagement
program, in order to provide information and invite feedback on our thinking so far. In these
presentations, we included a number of case studies including:
replacement of end-of-life network assets at Clayfield Substation, where alternative
configurations resulted in lower expenditure than would otherwise have been forecast,
demonstrating our approach to repex project planning
the Bromelton generator, as an example of our approach to non-network solutions
the Bells Creek/Caloundra South project, as an example of where we are required to upgrade
the network to continue to support community growth, and
a low voltage safety monitoring device, which explores technologies to provide real-time
network information in order to improve the management of safety risks to the community,
customers and the network.
Customers supported our proposed approaches. More detail on these and other specific investment
activity we are proposing is available in our supporting documentation.
7.4 Key capex assumptions
The key assumptions underpinning our capex forecasts are detailed in Table 24.
Table 24 Key capex assumptions
Issue Assumption
1. Structure and ownership Our capex forecasts are based on our current company structure and ownership
arrangements.
2. Legislative and regulatory
obligations
Our capex forecasts are based on our current legislative and regulatory obligations and
our Distribution Authority.
3. Service classification and
ring-fencing
We will apply the service classification in the AER’s F&A paper and the current ring-
fencing arrangements will not change materially.
4. Customer preferences
and expectations
The preferences and expectations of participants revealed through our stakeholder
engagement program accurately reflect those of our customers generally.
5. Addressing customer
concerns about
affordability
Our capex forecasts have particular regard for the affordability of electricity supply and
appropriately respond to our customers’ concerns.
6. Service outcomes We will maintain, but not improve, our average system-wide service outcomes, consistent
with clause 6.5.7(a) of the NER.
7. Forecast capex Our capex forecasts are required to deliver the safety, reliability and customer outcomes
set out in our Regulatory Proposal.
8. Demand Our base case network peak demand forecast provides an appropriate basis for our
network augmentation forecast.
9. Customer numbers Our customer numbers forecast provides an appropriate approach for determining our
capex rate of change.
10. Cost allocation Our CAM provides an appropriate basis for attributing and allocating costs to, and
between, our distribution services.
11. Unit rates/standard
estimates
Unit rates/standard estimates are used in the development of our bottom up forecasts
where appropriate.
12. Real cost escalations for
capex
Our real cost escalations used for our capex forecasts are reasonable and reflect prudent
and efficient costs.
13. Inflation Our forecast inflation is reasonable and reflects the inflation-related costs that we will

Energex Regulatory Proposal 2020-25 63
Issue Assumption
incur.
14. Current period capex We will deliver our forecast capex in the remainder of the current period, which will
provide an appropriate basis for our capex program in the next period.
15. New Connection Policy We will apply our new Connection Policy.
16. Cost pass through and
contingent projects
The AER will approve our nominated pass through events and we will not have any
contingent projects.
Our Directors have certified the reasonableness of these key assumptions in accordance with clause
S6.2.1(6) of the NER. We are not submitting any restricted assets applications under c6.4(b).2 of the
NER. We have not included any expenditure for a restricted asset as per c6.5.7(b)(5) of the NER.
7.5 Our expenditure forecasting methods
Our capex forecasting methodology that was detailed in our June 2018 Expenditure Forecasting
Methodology was used to develop a capex program on a project by project basis that meets our
network requirements, customer expectations and community needs. We assessed individual
projects for non-network alternatives (NNA). Where we have identified an efficient NNA project,
network projects have been deferred, cancelled or reconsidered. We have reconciled our forecast
against NER requirements and network risk profile tolerances to ensure prudent and efficient
investment.
This general approach is illustrated in Figure 24 and includes the following steps:
Needs Analysis – establish network performance outcomes to deliver organisational targets,
including in areas such as safety performance, responsibilities to the environment, financial
outcomes and commitments to customers, as well as obligations to the community
Demand Analysis – critically review key inputs such as asset condition information, network
demand growth and new technology against established performance outcomes to determine
area requiring intervention
Needs Solutions – prepare capital projects and programs that address the identified needs.
This step includes capex opex trade-offs and investigations of non-network solutions with the
potential to defer the timing of major projects
Portfolio Optimisation – reconcile projects and programs against top-down expenditure
targets and optimise having regard for a tolerable network risk profile.

Energex Regulatory Proposal 2020-25 64
Figure 24 Capex forecasting process
7.6 Our forecast capex
Figure 25 shows our capex trend over the 2010-15, 2015-20 and 2020-25 regulatory control periods
in order to provide context for our capex forecast – it shows gross capex (i.e. including assets that
are funded by customers through capital contributions) and net capex (i.e. excluding capital
contributions). In the following sections we explain and justify our forecasts for each capex category.
Figure 25 Capex trends

Energex Regulatory Proposal 2020-25 65
The data supporting Figure 25 is provided in Table 25 and Table 26.
Table 25 Capex trends compared to AER allowance – past and current regulatory control periods
$M, Real $2020 2010-15 (Prev. Period) 2015-20 (Curr. Period)
FY11 FY12 FY13 FY14 FY15 FY16 FY17 FY18 FY19 FY20
As Reported
Capital
Contributions
77.9 72.5 54.5 39.8 66.9 86.9 67.2 59.4 54.5 54.3
As Reported Capex 1,084.5 1,061.4 990.1 802.0 763.1 576.9 547.6 512.1 491.9 474.0
Period Average
AER Allowance
(gross capex)
1,422.8 1,422.8 1,422.8 1,422.8 1,422.8 644.3 644.3 644.3 644.3 644.3
Like for Like Capital
Contributions 77.7 72.4 54.5 39.8 66.9 86.8 74.1 59.3 54.5 54.3
Like for Like Capex 932.8 932.6 885.2 711.9 691.6 543.9 508.2 486.1 509.2 469.2
Table 26 Capex trends compared to AER allowance – past and current regulatory control periods
7.7 Replacement capex
During the 2010-15 regulatory control period, we gradually increased our repex as our augex and
network demand drivers decreased. We replaced many aged assets in the 2005-10 and 2010-15
regulatory control periods, primarily as part of augex projects, where we were replacing and
upgrading older substation and lines’ assets due to growth in network demand.
In the 2015-20 regulatory control period, we have focused on the sustainable removal of aged, poor-
condition assets to maintain expected network performance for our customers and safety to the
community. We have also, amongst other things, implemented initiatives following our merger with
Ergon Energy to reduce costs.
Our repex forecast plateaus from the end of the 2015-20 regulatory control period, which will mean it
will form a large component of our proposed system capex program during the 2020-25 regulatory
control period, as other capex categories reduce.
Figure 26 presents our repex trends and between 2010 and 2025. Table 27 reflects the sub-
categories of forecast repex for the 2020-25 regulatory control period.
$M, Real $2020 2020-25 (Forecast Period)
FY21 FY22 FY23 FY24 FY25
Like for Like Capital Contributions 53.5 53.5 53.5 53.5 53.5
Like for Like Capex 422.3 409.4 417.5 413.0 397.3

Energex Regulatory Proposal 2020-25 66
Figure 26 repex trends compared to allowance
We determined the average AER allowance by apportioning the AER’s allowance across all capex
categories based on our estimate of expected capex.
Table 27 Forecast repex sub-categories
$M, Real $2020 2020-21 2021-22 2022-23 2023-24 2024-25 Total
Sub-transmission repex – condition & risk 55.30 30.57 25.31 24.04 21.87 157.10
Distribution repex – condition & risk 60.79 64.09 70.90 71.54 73.40 340.73
Distribution repex – Reactive 15.01 16.60 17.36 17.66 18.05 84.67
Network Control & Communication repex 12.89 13.23 11.08 13.34 10.39 60.94
Repex Total 144.00 124.49 124.66 126.58 123.72 643.44
Totals may not add due to rounding
Figure 27 Forecast repex sub-categories proportions
Note: Totals may not sum to 100% due to rounding

Energex Regulatory Proposal 2020-25 67
Our forecast repex for the 2020-25 regulatory control period is mainly driven by asset management
objectives outlined in our Strategic Asset Management Plan at Attachment 7.090, as well as specific
performance targets outlined in strategies and asset management plans included in Attachments
7.026-7.044. These include meeting our reliability and security of supply targets in our Distribution
Authority, as well as safety, environmental, and regulatory obligations. As discussed in chapter 2, our
no-compromise approach to community and staff safety has been well supported by customers.
Our repex programs are developed based on analysis of the condition and performance of assets
(i.e. Condition and Risk), as well as historical demand driven from inspection and in-service failure
(i.e. Reactive). We do not pursue like-for-like replacement of assets, but rather undertake condition
and risk programs that are proactive in nature and target high-risk assets that are approaching the
end of their lifecycle.
Reactive replacement programs are predominately driven by well-established inspection programs,
which are used to identify assets at imminent risk of in-service failure and to manage asset condition
where proactive replacement is not economical. The Reactive programs also include a small
allocation for the cost of asset replacement due to in-service failures, which are typical in a
distribution network.
Our proposed repex represents a balance of Condition and Risk, and Reactive, programs to provide
a prudent means of achieving the asset management objectives.
7.7.1 Sub-transmission Replacement Expenditure – Condition & Risk
Most of our asset replacement programs for sub-transmission have been developed beginning with
an analysis of the condition and health of assets in accordance with the Condition Based Risk
Management (CBRM) methodology to identify individual assets nearing the end of their lifecycle. The
scope and timing of replacement or refurbishment (life extension) is typically informed by risk
assessments conducted to document risks associated with asset failure and to establish when it is no
longer viable to retain these assets in service.
Replacing assets is considered based on network security standards and obligations. We also
consider alignment with other network drivers, such as augex and connex, to ensure the final option
is the most cost effective. We do not pursue like-for-like replacement, but test each investment
decision against the future needs of the network. NNA options for replacement are investigated
through the Regulatory Investment Test for Distribution (RIT-D) process, where the project exceeds
the RIT-D investment threshold. RIT-D processes will be performed for these projects.
The highest proportion of expenditure in this category is driven by major substation asset
replacement with the bulk of this being 33/11kV transformers and 33kV circuit breakers.
7.7.2 Distribution Replacement Expenditure – Condition & Risk
We have developed the Condition and Risk distribution replacement programs based on our analysis
of asset performance and risk. The major component of this capex is in the distribution line
refurbishment programs, which include replacement of overhead conductor, poles and pole top
structures that are approaching end of life. Assets that are identified as approaching end of life are
prioritised according to risk and are bundled into logical packages of work to provide efficient
delivery. Volumes of replacement works are determined based on the overall network risk exposure
and considering the aging network trends. This ensures programs are prudent and continue to meet
asset management objectives, particularly for community and staff safety and legislative obligations.

Energex Regulatory Proposal 2020-25 68
The other major component of the Condition and Risk distribution replacement program is the
proposal to establish a capability in low voltage safety monitoring. This program utilises technology to
provide near real-time network information to improve the management of safety risks to the
community, maximise useful asset life and defer repex.
We presented our high-level repex drivers and forecasts to customer groups as part of our customer
engagement program to provide information and invite feedback on our thinking so far. As part of
those presentations, we included a number of case studies, including for:
Overhead Conductor Replacement programs
Pole Replacement program, and
Low Voltage Safety Monitoring program.
Customer groups broadly supported this approach to deliver community safety outcomes. Our
strategic proposals for these initiatives are contained in the attachments listed at the end of this
chapter.
7.7.3 Distribution Replacement Expenditure - Reactive
Our proposed Reactive distribution repex is driven primarily by the replacement of assets identified
as being at end of life through routine inspection programs. Volumes of replacement under these
programs are forecast based on historical demand, considering population trends such as age and
asset quantity. Defects identified through inspection are prioritised based on risk and are bundled into
efficient programs of delivery to minimise customer outages during rectification. The major drivers for
capex in this category include replacement of wood poles, pole mounted plant and overhead services
that are identified in our five-year cycle of overhead line inspection.
The Reactive distribution programs also include a demand-based allocation to replace assets as a
result of in-service failure. Volumes of asset replacement in this category are forecast based on
historical requirements and trends.
7.7.4 Network Control & Communication
Network control and communication replacement expenditure requirements are developed based on
a combination of reactive, condition and risk driven programs.
Reactive replacement programs are predominately driven by in-service failures detected via
continuous monitoring or inspection programs. These programs identify assets that have stopped
operating, are no longer performing to specification, or are at imminent risk of failure. For some low
risk asset classes, such as distribution transformer monitoring units, certain intelligent electronic
devices used in the Supervisory Control and Data Acquisition (SCADA) system and many
telecommunications line driver and switch units, only reactive replacement on a like-for-like
replacement is used.
Condition and risk-based programs consider the condition, performance and risk of assets (including
obsolescence) to identify assets approaching the end of life. Planning assessments are undertaken
to determine the most appropriate solution to meet network requirements, including non-network
alternatives. Due to the rapid pace of technology development, network solutions will often be based
around modern equivalent assets. This includes replacing:
analogue and electromechanical with digital (numerical) protection relays
copper pilot wire for protection communication with fibre optic cables, and
the Plesiochronous Digital Hierarchy (PDH) for the transportation of digital data on our
networks with more efficient and robust Multiprotocol Label Switching (MPLS) network
equipment.

Energex Regulatory Proposal 2020-25 69
7.7.5 AER repex model comparison
The AER indicated in its Expenditure Forecast Assessment Guidelines for electricity distribution and
transmission that it intends to use its repex model to help determine the efficient costs of asset
replacement (capital) expenditure over the forthcoming regulatory control period. We understand the
AER uses its repex model as a threshold test to identify areas of potential difference from DNSP
forecasts to inform areas for additional review. We also use the AER repex model as one tool for top-
down challenge and check of repex forecast requirements, both at an overall repex level and at an
asset category group level where applicable.
As optimal timing for asset replacement is not solely reliant on age, other factors such as safety,
environment, changes in defect rates, and obsolesce issues must also be considered. We have a
number of proactive asset replacement programs driven by emerging issues unrelated to the age of
the assets that will not be fully captured in the AER repex modelling. Where differences are material
they are noted and discussed in the justification statements for modelled asset classes which are
included in Attachments 7.057-7.068.
The AER assess repex based on 2 broad categories of assets:
Assets that are capable of being modelled based on the AER Repex model. This includes 6
asset classes (poles, overhead conductor, underground cables, switchgear, transformers, and
services). Often referred to as modelled repex these 6 categories make up 67% of the total
Energex repex.
Assets that are not well suited to the AER Repex model which comprises all remaining asset
classes (e.g. network communication, control, and protection system assets, pole-top
structure assets, and other miscellaneous items such as battery systems, fire systems, and
fences).
Energex has engaged with the AER on several occasions to understand their application of repex
modelling, such that Energex considers the same scenarios and utilises repex modelling in a similar
manner. Figure 28 compares our optimised repex forecast for modelled assets (the six asset
categories outlined above) with repex modelling outputs. It demonstrates that our repex forecast for
modelled assets in the 2020-25 regulatory control period is lower than the threshold scenario. This
supports our view that our modelled repex forecast represents a sustainable, prudent and efficient
level of repex given the age and condition of our assets.

Energex Regulatory Proposal 2020-25 70
Figure 28 Modelled repex trends
Similar to modelled repex assets, the repex forecast for un-modelled asset classes has been
prepared in line with asset strategies and plans; and consistent with the Energex risk frameworks and
risk appetite. Energex is therefore confident the un-modelled portion of forecast repex also
represents sustainable, prudent and efficient expenditure.
The proposed program is reflective of the commitment to constrain customer price impacts and
continue to look for efficiencies in program delivery. It reflects a risk position which balances the
achievement of asset management objectives and customer service levels.
Our repex Model Supporting Information in Attachment 17.029 outlines our response to repex model
related requirements of Schedule 1 of the Regulatory Information Notice (RIN) and provides further
details of the repex modelling scenarios we considered in comparison to our repex forecasts.
7.8 Augmentation capex
Our augex requirements have reduced significantly from our 2010-15 regulatory control period,
following our investment to meet previous strict N-1 security criteria requirements established as part
of the Electricity Distribution Service Delivery (EDSD) Review, and as revised through the 2011
Electricity Network Capital Program review. Augex in this period was driven by strong demand
growth and economic development experienced in south-east Queensland, including network
demand due to air-conditioning uptake.
Reduced security and reliability requirements following the move from deterministic to probabilistic
security criteria as part of the 2014 Independent Review Panel, along with cost reductions following
the merger and lower than forecast demand growth, resulted in reductions to augex requirements in
the 2015-20 regulatory control period. This trend will continue in the 2020-25 regulatory control
period. Augex is required to:
address key areas of community development, population and demand growth
support the continued connection of residential and commercial solar PV systems to the
distribution network
maintain network statutory and standard requirements and address our obligations outlined in
our Distribution Authority pertaining to our safety net security criteria, minimum service
standards and worst performing feeder requirements, and

Energex Regulatory Proposal 2020-25 71
provide additional functionality to support an intelligent grid through a range of network control
and monitoring initiatives.
Figure 29 shows our augex trend over the 2010-15, 2015-20 and 2020-25 regulatory control periods,
including against the AER’s allowances. Table 28 provides a breakdown of our augex forecast for the
2020-25 regulatory control period and Figure 30 illustrates the shares of each sub-category for the
period.
Figure 29 augex trends compared to allowance
Table 28 Forecast augex expenditure sub-categories
$M, Real $2020 2020-21 2021-22 2022-23 2023-24 2024-25 Total
Growth (sub-transmission) 11.64 8.60 14.55 11.82 20.06 66.66
Growth (distribution) 16.08 23.03 22.02 21.41 21.92 104.47
Power Quality 8.21 8.36 8.66 8.54 8.62 42.39
Worst Performing Feeders (reliability) 4.31 4.65 4.63 4.53 4.50 22.62
Network Control/Communication 14.53 17.37 11.27 13.53 8.23 64.93
Augex Total 54.78 62.00 61.12 59.84 63.33 301.07
Totals may not add due to rounding

Energex Regulatory Proposal 2020-25 72
Figure 30 Forecast augex sub-categories proportions
Note: Totals may not sum to 100% due to rounding
In order to reduce our augex and to improve customer outcomes, we proactively seek demand
management solutions by deploying initiatives to reduce peak demand and defer network investment.
The successful use of demand management has resulted in us reducing our augex in the 2015-20
regulatory control period and we are forecasting this to continue in the 2020-25 regulatory control
period. This has included us considering non-network solutions as a part of the routine planning
process. However, where we are seeing community development and growth beyond our ability to
defer load, network augmentation will be required in some instances.
The growth components of our augex (i.e. sub-transmission and distribution) are based on normal
network condition demand forecasts and include a variety of network and non-network scenarios.
Areas of high growth are included as part of demand management initiatives and all major
investments are subject to a RIT-D and market test of alternative solutions. Documentation to support
our major sub-transmission investment is provided with this Regulatory Proposal to show the need
and benefits of the proposed solution.
We presented our high-level augex drivers and forecasts as part of the customer engagement
program for information and feedback. As part of these presentations, we included several case
studies, including:
a decision on continuation of a non-network solution at Bromelton compared with establishing
a second 110kV sub-transmission line, and
establishing a zone substation at Bells Creek on the sunshine coast to cater to significant
forecast residential real estate development, subject to a prior assessment of demand
management solutions.
As a result of customer support and feedback, the Bromelton non-network solution will be funded
from forecast opex in the 2020-25 regulatory control period, and the establishment of the Bells Creek
zone substation is also included in our augex forecast.
Growth (sub-transmission), 22%
Growth (distribution) , 35%
Power Quality , 14%
Worst Performing Feeders
(reliability), 8%
Network Control / Communication,
22%
Energex Regulatory Proposal 2020-25 73
Only a small number of larger, growth-related sub-transmission augex projects are forecast over the
2020-25 regulatory control period. The RIT-D process will be undertaken for each of these projects to
canvass the market for an efficient non-network solution. Those of significance included in the
forecast to meet security of supply requirements under safety net provisions of the Distribution
Authority include the establishment of the Bells Creek zone substation.
Our distribution growth category contains augex driven by capacity, voltage and protection limitations
on the distribution network and includes programs such as bushfire mitigation. As we have reduced
the number of large sub-transmission investments, we have increasingly utilised distribution
augmentation to help support areas of localised demand growth. Distribution growth-related augex
requirements are forecast by referencing expenditure and demand to the 2015-20 regulatory control
period and by assessing the continuation of programs such as bushfire mitigation, clearance defects
and back-up protection. Efficient non-network solutions identified through the RIT-D process will be
funded by a capex/opex trade-off.
For smaller sub-transmission augex projects, targeted demand management programs will be
operated over the 2020-25 regulatory control period, where prudent and efficient.
A significant decrease has been applied to forecast distribution augex, based on delivering targeted
demand management reductions to defer specific augex projects
More detail on the distribution growth component of the submission is included in the supporting
strategic proposal for distribution feeder augmentation (Attachment 7.091).
7.8.1 Worst Performing Feeders (reliability)
We must meet MSS targets set out in our Distribution Authority, which outlines feeder category-
based reliability performance targets and also includes obligations to improve the reliability of the
worst performing 11 kV feeders, in order to address the impact on these customers. We have
assumed that the MSS for 2020-25 will continue to be flat-lined and, as such, the augex forecast for
the 2020-25 regulatory control period has been based solely on addressing worst performing feeder
obligations set out in the Distribution Authority. As the current MSS expires on 30 June 2020, the
Government may set new targets with a consequential need for us to update our forecasts in our
Revised Regulatory Proposal.
Our proposed worst performing feeder improvement program is also based on performance
improvement on our network in the last ten years and customer feedback about their network
reliability expectations. Our augex forecast for the worst performing feeder improvement program has
remained in line with the 2015-20 regulatory control period.
More detail regarding our approach to network reliability is outlined in the Customer Reliability
Strategy provided in Attachment 7.048, and the Worst Performing Feeder Strategic Proposal
provided in Attachment 7.097.
7.8.2 Power Quality
Our proposed Power Quality and Solar Program seeks to maintain and improve the monitoring and
reporting programs established during the 2015-20 regulatory control period. Addressing the power
quality statutory obligations, this program is a key enabler of the increased penetration of solar PV
and new technology connections. This program also includes remediation activities to address
voltage non-compliances from solar or other customer or network issues. The forecast for 2020-25
has been developed by forecasting augex from the 2015-20 regulatory control period and considering
the impact of strategies around enabling an intelligent grid and the efficiencies achieved from existing
programs such as the 230V transition. The Customer Quality of Supply Strategy (Attachment 7.047)
and the Strategic Proposal - Power Quality (Attachment 7.094) contain more detail on this category.
Energex Regulatory Proposal 2020-25 74
7.9 Connections capex and customer contributions
We have an obligation to provide connection services to residential and commercial and industrial
customers, real estate developments, unmetered supplies and embedded generators in our
distribution area. Connection services comprise a range of activities required to connect new
customers to the distribution network or modify connection assets and/or the network for existing
customers. The activities may include the establishment or modification of assets dedicated to a
customer (premises connection assets), extensions to, or augmentation of, the shared distribution
network.
In providing connection services, we incur the costs of some connection activities and require
customers to pay upfront or contribute to the costs for some connection activities. For this reason,
our connections capex is made up of two parts:
costs that we incur or fund (net connections capex). We roll these costs into our RAB and
recover the costs through time via our network charges. Our net connection capex represents
the investment required to connect new small customers (residential and small businesses
customers) and to extend and augment the shared network to facilitate connections for all our
customers.
costs incurred by customers (capital contributions). Under our proposed connection
policy and service classification, customers may be required to fund aspects of connections
services either as cash contributions or gifted assets, depending on the size or type of
customer (small or major) and/or aspect of the connections service (premises connections,
extension or augmentation). In general, capital contributions are required from small
customers – where their connections are uneconomic; and from major customers (including
real estate developments, large embedded generators etc) who are required to fully fund their
dedicated connection assets as ACS.
Both net connections capex and capital contributions are purely customer driven. They depend on
the actions of our customers making decisions to either connect to our network or request services to
modify their connections and/or the shared network. It is therefore inherently difficult to accurately
forecast connections related capex.
Nonetheless, we consider that there is a strong correlation between connection works and economic
activity. Our connections capex was materially higher in the early part of this decade reflecting the
high level of economic activity in South-East Queensland. We have experienced a boom in
apartment developments, especially in the inner city areas of Brisbane, as well as large businesses
investing in new manufacturing sites in areas such as Yatala, Wacol and Carol Park.
Going forward, we have some significant projects such as the Cross River Rail and Queen’s Wharf in
the Brisbane Central Business District (CBD), but overall we expect a steadying in economic activity.
We consider that customer driven works will not vary significantly from what we have experienced in
the last year. As such, our best indication of connections capex for 2020-25 regulatory control period
is our most recent observed expenditure levels. Figure 31 provides our historical and forecast
connections capex and customer contributions.
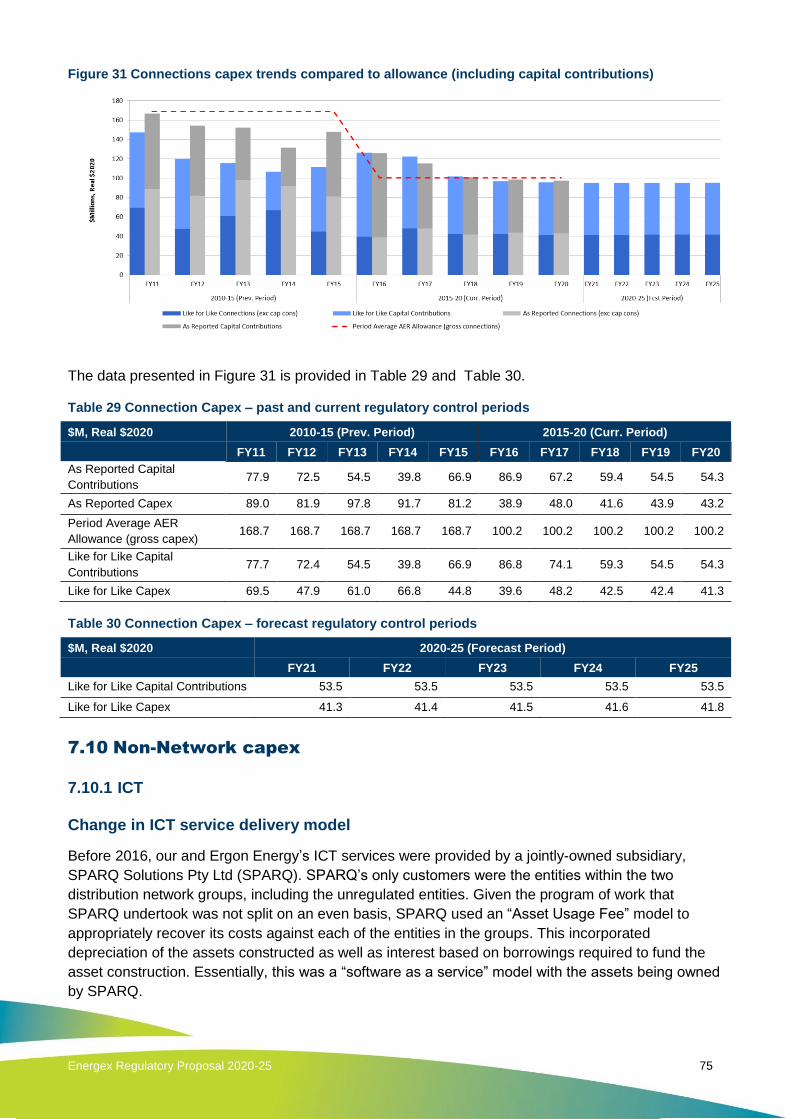
Energex Regulatory Proposal 2020-25 75
Figure 31 Connections capex trends compared to allowance (including capital contributions)
The data presented in Figure 31 is provided in Table 29 and Table 30.
Table 29 Connection Capex – past and current regulatory control periods
$M, Real $2020 2010-15 (Prev. Period) 2015-20 (Curr. Period)
FY11 FY12 FY13 FY14 FY15 FY16 FY17 FY18 FY19 FY20
As Reported Capital
Contributions 77.9 72.5 54.5 39.8 66.9 86.9 67.2 59.4 54.5 54.3
As Reported Capex 89.0 81.9 97.8 91.7 81.2 38.9 48.0 41.6 43.9 43.2
Period Average AER
Allowance (gross capex) 168.7 168.7 168.7 168.7 168.7 100.2 100.2 100.2 100.2 100.2
Like for Like Capital
Contributions 77.7 72.4 54.5 39.8 66.9 86.8 74.1 59.3 54.5 54.3
Like for Like Capex 69.5 47.9 61.0 66.8 44.8 39.6 48.2 42.5 42.4 41.3
Table 30 Connection Capex – forecast regulatory control periods
$M, Real $2020 2020-25 (Forecast Period)
FY21 FY22 FY23 FY24 FY25
Like for Like Capital Contributions 53.5 53.5 53.5 53.5 53.5
Like for Like Capex 41.3 41.4 41.5 41.6 41.8
7.10 Non-Network capex
7.10.1 ICT
Change in ICT service delivery model
Before 2016, our and Ergon Energy’s ICT services were provided by a jointly-owned subsidiary,
SPARQ Solutions Pty Ltd (SPARQ). SPARQ’s only customers were the entities within the two
distribution network groups, including the unregulated entities. Given the program of work that
SPARQ undertook was not split on an even basis, SPARQ used an “Asset Usage Fee” model to
appropriately recover its costs against each of the entities in the groups. This incorporated
depreciation of the assets constructed as well as interest based on borrowings required to fund the
asset construction. Essentially, this was a “software as a service” model with the assets being owned
by SPARQ.

Energex Regulatory Proposal 2020-25 76
Following the creation of Energy Queensland, SPARQ ceased being owned by the two DNSPs and
became a 100% subsidiary of Energy Queensland. As part of this transition, the employees of
SPARQ became employees of Energy Queensland.
Energy Queensland continues to use the Asset Usage Fee established by SPARQ for the current
regulatory control period (2015-20). This treats ICT costs as an overhead in the DNSP businesses,
and results in these costs being allocated across capex and opex projects. These costs are allocated
without margin.
From the 2020-25 regulatory control period, Energy Queensland will allocate the assets in SPARQ at
1 July 2020 (and for new assets constructed after that date) to the fixed asset register, and RABs, of
the appropriate entities in the group to which the relevant asset applies. Where assets are “shared”
(i.e. they cannot be specifically assigned to one entity) the costs will be allocated through the CAM.
Assigning these assets means that the effective life is more accurately reflected in the accounts of
the DNSP as the asset usage fee is not treated as an overhead and then, in some instances, is
depreciated over a 40-year life. We consulted on this matter through our customer engagement
program. There was support for assigning a useful life of ten years for those assets brought over at 1
July 2020, rather than five year as is normal for most ICT assets, as a way of lessening the impact on
distribution network charges.
The major systems included in the assets being transferred into our RAB include the Unified
Enterprise Resource Planning and Enterprise Asset Management (Unified ERP EAM) and the ICT &
Digital Enterprise Building Blocks (DEBBs) Capital Works in Progress programs. These systems
support sustainable and secure core systems and consistent work practices across several key
business functions, and support Power of Choice (POC) and other market-based reforms.
Our ICT capex for the 2020-25 regulatory control period
Figure 32 provides our historical ICT capex against allowance and our forecast for the 2020-2025
regulatory control period.
Figure 32 ICT capex trends compared to allowance
Note: As reported ICT only includes end user devices
The data presented in Figure 32 is provided in Table 31 and Table 32.

Energex Regulatory Proposal 2020-25 77
Table 31 ICT Capex – past and current regulatory control periods
$M, Real $2020 2010-15 (Prev. Period) 2015-20 (Curr. Period)
FY11 FY12 FY13 FY14 FY15 FY16 FY17 FY18 FY19 FY20
As Reported ICT (End
User Devices 8.8 10.5 5.1 2.2 2.3 2.4 2.4 2.3 2.2 3.5
Period Average AER
Allowance (End User
Devices)
3.0 3.0 3.0 3.0 3.0 1.9 1.9 1.9 1.9 1.9
Like for Like Capitalised
Indirects 20.2 25.3 25.3 24.5 23.4 23.4 25.2 26.1 22.5 22.5
Like for Like ICT (Direct) 41.1 66.4 56.0 22.3 31.5 25.9 12.8 23.8 74.9 49.9
Table 32 ICT Capex – forecast regulatory control period
$M, Real $2020 2020-25 (Forecast Period)
FY21 FY22 FY23 FY24 FY25
Like for Like Capitalised
Indirects 22.1 21.7 20.8 19.2 17.5
Like for Like ICT (Direct) 37.0 36.8 42.5 38.5 38.2
We rely on efficient ICT systems and services to deliver our distribution services. We will focus on
ICT as an enabler of business performance consistent with the following ICT strategic themes:
1. maintain systems for sustainability, security and operational safety
2. leverage ICT renewals for digital transformation, enabling joint productivity improvement
targets
3. maintain efficient ICT performance in a rapidly changing technology environment, and
4. leverage innovative technologies and techniques for efficiency and customer service.
Energy Queensland will continue to maintain our ICT systems and capability consistent with
established ICT asset lifecycle management practices. Upon renewal of key systems, we and Ergon
Energy will consolidate and rationalise legacy applications with consistent best-practice business
processes across the service regions.
This digital transformation will enable realisation of Energy Queensland’s forecast 10% reduction in
indirect costs and 3% improvement in program of work labour costs. This outcome will be achieved
through process and capability optimisation, including:
simplifying workflows and accuracy of data capture at source, reducing the need for rework
improving data mastering, with reduced duplication and data synchronisation complexity
aggregating workload across our and Ergon Energy’s service areas for improved work
throughput, consistency and resource utilisation
improving analysis of network and non-network data for improved forecasting and planning
continuously improving asset management through ISO55000 practices, with combined
insights and network intelligence
tailoring asset management and works program delivery to the local requirements of
particular network segments
reducing or deferring capex through better analysis of energy usage, targeting of demand
management programs and use of non-network alternatives, and

Energex Regulatory Proposal 2020-25 78
reducing complexity associated with support of highly aged, custom developed applications
requiring specialist skills.
The planned ICT program will also enable a series of key non-financial outcomes, including:
sustaining our and Ergon Energy’s business systems and technology infrastructure for
ongoing supportability, serviceability and security
undertaking safety risk mitigation, including during emergency events, through accurate
network data and consistent work practices across our and Ergon Energy’s regions
improving network operational resilience and continuity through Operational Control Centre
fail-over capability between our and Ergon Energy’s regions
continuing to apply necessary security controls for access to information related to critical
infrastructure and privacy of customer data
meeting the community’s “open data” expectations for access to accurate and timely spatial
data regarding the corporations’ assets
being able to respond to ongoing regulatory, compliance and technology changes, building
upon the existing information intelligence architecture, and
complying with all legislative and regulatory obligations, including market obligations,
reporting obligations, safety requirements and conformance with prescribed standards.
We and Ergon Energy have reintegrated the ICT functions previously by SPARQ into the operational
business functions in order to maintain efficient ICT performance. This efficiency is also enhanced
through the prudent use of market services, cloud software and as-a-service hosting.
While ensuring the efficiency of ICT service delivery, we are maintaining our focus on the electronic
security of our and Ergon Energy’s ICT systems, information and infrastructure in an environment of
increasing cyber risk.
Our proposed ICT investment is essential to support the transformation of our business and supports
the delivery of our forecast opex and capex savings as we take advantage of new functionality that
comes standard with the replacement systems shown in Table 33. . This lower cost base flows
through to lower revenue requirements and has enabled us to propose our real reductions in
distribution network charges for our customers. We have provided supporting documentation for the
material items in Attachments 7.006-7.011.
Table 33 List of systems planned for replacement in the 2020-25 regulatory control period
Category Current System/Capability
Geo Spatial Support Capability Smallworld/NFM
Operational Technology Feederstat/Scada
Operational Technology Ventyx Suite and Field Smart Systems
Data Management PEACE
Tools Network Design Tools
Tools Distribution Forecasting
Customer Support Customer Contact Technology
Knowledge Management Consolidation of Information Storage Repositories
Customer Support Customer Interaction Portals
Data Management TOHT

Energex Regulatory Proposal 2020-25 79
Category Current System/Capability
Tools Asset Inspection and Planning
Content Management Document and Enterprise Content Management
Tools Content Management and Collaboration
Customer Support Customer Relationship Management
Tools Network Management and Planning Support
Tools Process Management Support
Security Cyber Security Platform Consolidation
Tools Internet Website Replacement
7.10.2 Fleet and Equipment
Investing in fleet assets enables us to deliver distribution services in line with community and
customer expectations. We are forecasting stable fleet and equipment capex for the 2020-25
regulatory control period against the AER’s allowance for the 2015-20 regulatory control period. This
is due to a large proportion of the mobile elevated work platform and mobile generator fleets being
due for replacement in the 2020-2025 regulatory control period. However, this is offset by an
increased replacement cycle for light and light commercial vehicles, and life extension of plant
through refurbishment to Australian Standard guidelines. Fleet standardisation and improved
optimisation has also led to fewer fleet and equipment assets.
We have provided our Fleet and Equipment Asset Management Strategies to the AER in support of
our fleet and equipment forecasts. The aim of these strategies are to identify fleet and equipment
assets which meet business requirements based on the principle of fit-for-purpose design
considering safety, industry standards, business priorities and cost efficiency.
Replacement criteria for fleet and equipment assets are determined by considering the initial
economical life expectancy (benchmarked to industry peers), asset condition at end of life and its
potential to be economically and safely extended, industry safety and technology improvements, and
Regulatory constraints. Our targeted fleet and equipment investment supports the efficient delivery of
our network program of work. Figure 33 shows the trend in our fleet and equipment capex over the
2010-15, 2015-20 and 2020-25 regulatory control periods, referenced against the AER’s allowances.

Energex Regulatory Proposal 2020-25 80
Figure 33 Fleet capex trends compared to allowance
7.10.3 Property
We have provided our Property Strategy to the AER in support of our property forecast. The aim of
this strategy is to deliver a safe and efficient, fit-for-purpose and customer-centric property portfolio.
The property portfolio will support Queensland communities and customers by ensuring we have
facilities in the right locations to enable the operation of a safe and efficient network.
After being well below the AER allowance for most of the current period, our property capex forecast
will slightly exceeds the AER allowance in 2019-20. We plan to bring forward initiatives that will drive
business benefits and lower costs in the long term. Figure 33 shows the trend in our property capex
for the 2010-15, 2015-20 and 2020-25 regulatory control periods, referenced against the AER
allowances.
Figure 34 Property capex trends compared to allowance
7.11 Capitalised overheads
Consistent with our CAM, Energy Queensland categorises its overhead costs as follows:

Energex Regulatory Proposal 2020-25 81
Non-regulated overheads relate to Energy Queensland’s non-regulated services and are
allocated to the non-regulated businesses, Retail and Yurika (that is, they are not included in
our or Ergon Energy’s costs).
Corporate overheads include expenditure incurred for the following functions provided by
Energy Queensland: finance, strategy and regulation and people and culture. These costs are
allocated between the non-regulated businesses, ourselves and Ergon Energy.
Network overheads are indirect costs incurred by ourselves and Ergon Energy, including the
functions of network planning and project governance, quality and standards, network control
and operational switching, and field support.
Non-network overheads are indirect costs incurred by ourselves and Ergon Energy,
including expenditure incurred to operate and maintain vehicles owned or leased (e.g. fuel,
registration, vehicle maintenance), costs for property occupancy and facility management,
and information communication and technology costs (e.g. major systems, software
applications, data management, infrastructure services).
Once the indirect costs (being Network, Non-Network and Corporate overheads) have been allocated
to ourselves and Ergon Energy, they are then further allocated to the different services types (being
SCS, ACS and unregulated services) based on a proportional allocation of direct spending consistent
with our AER-approved CAM. The Opex Base Year Attachment 6.003 provides more detail on the
allocation methods applied.
It is necessary to charge direct costs and indirect costs (overheads) that are directly attributable to
constructing or readying an asset for use to ensure the value of constructed assets correctly reflects
all costs incurred. Therefore, a portion of indirect costs allocated to SCS are capitalised based on our
Capitalisation Policy and Capitalisation Manual.
This results in approximately 47-48% of our overhead costs being capitalised. We understand that
there is a wide range of capitalisation approaches and outcomes across DNSPs in the NEM, with the
amount of overheads capitalised ranging up to 50 per cent of overheads.
In developing our capitalised overhead forecasts for the 2020-25 regulatory control period, we have
adopted the BST approach. This involves the following stages:
nominating a base year
applying adjustments to remove non-recurrent and other expenditure and expected post-
merger savings to be delivered in 2018-19
applying rate of change adjustments to the adjusted base year opex for:
o Growth in labour and non-labour prices
o Growth in output
o Productivity improvements, and
applying step changes.
Consistent with our opex forecast, we have:
adopted 2018-19 as our base year capitalised overheads for the reasons set out in chapter 6
removed from our 2018-19 capitalised overheads base year change fund and redundancies
which are not part of the capitalised overheads. We have also removed expected savings to
be delivered in 2019-20
applied the same output growth and price growth that we applied to our opex forecasts as set
out in chapter 6 but applied a slightly different productivity improvement factor to reflect
targeted savings of 10% in Energy Queensland overheads over the 2020-25 regulatory
control period, and

Energex Regulatory Proposal 2020-25 82
not proposed any step changes.
Figure 35 compares our forecast capitalised overheads for the 2020-25 regulatory control period with
our actual overheads and AER allowances over the 2010-15 and 2015-20 regulatory control periods.
Figure 35 Capitalised overheads trend compared to allowance
7.12 Supporting documentation
The following documents supporting this chapter accompany our Regulatory Proposal:
Name Ref File name
Equipment Asset Management Strategy 7.001 EGX ERG 7.001 Equipment Asset
Management Strategy JAN19 PUBLIC
Fleet Asset Management Strategy 7.002 EGX ERG 7.002 Fleet Asset
Management Strategy JAN19 PUBLIC
External Unit Rates Review 7.003 EGX 7.003 GHD External Unit Rates
Review DEC18 PUBLIC
Unit Cost Methodology and Estimation
Approach 7.005
EGX ERG 7.005 Unit Cost
Methodology and Estimation
Approach JAN19 PUBLIC
Cyber Security Strategy 7.006 EGX ERG 7.006 Cyber Security
Strategy JAN19 PUBLIC
ICT Plan 7.007 EGX ERG 7.007 ICT Plan JAN19
PUBLIC
ID01 GIS Consolidation and Replacement 7.008
EGX ERG 7.008 ID01 GIS
Consolidation and Replacement
JAN19 PUBLIC
ID02 Network Operations Consolidation
and Replacement 7.009
EGX ERG 7.009 ID02 Network
Operations Consolidation and
Replacement JAN19 PUBLIC

Energex Regulatory Proposal 2020-25 83
Name Ref File name
ID03 Field Force Systems 7.010 EGX ERG 7.010 ID03 Field Force
Systems JAN19 PUBLIC
ID04 Customer Market Systems 7.011 EGX ERG 7.011 ID04 Customer
Market Systems JAN19 PUBLIC
ID05 Design Tools 7.012 EGX ERG 7.012 ID05 Design Tools
JAN19 PUBLIC
ID06 Distribution Forecasting Tools 7.013 EGX ERG 7.013 ID06 Distribution
Forecasting Tools JAN19 PUBLIC
ID07 Customer Contact Technology 7.014 EGX ERG 7.014 ID07 Customer
Contact Technology JAN19 PUBLIC
ID08 Information Repositories 7.015 EGX ERG 7.015 ID08 Information
Repositories JAN19 PUBLIC
ID09 Service Interaction Portal 7.016 EGX ERG 7.016 ID09 Service
Interaction Portal JAN19 PUBLIC
ID10 MDM 7.017 EGX ERG 7.017 ID10 MDM JAN19
PUBLIC
ID11 Asset Inspections and Planning 7.018
EGX ERG 7.018 ID11 Asset
Inspections and Planning JAN19
PUBLIC
ID12 Document Management System 7.019 EGX ERG 7.019 ID12 Document
Management System JAN19 PUBLIC
ID13ICT Mgt systems 7.020 EGX ERG 7.020 ID13 ICT Mgt systems
JAN19 PUBLIC
ID14 ICT customer mgt 7.021 EGX ERG 7.021 ID14 ICT customer
mgt JAN19 PUBLIC
ID15 Network Planning Tools 7.022 EGX ERG 7.022 ID15 Network
Planning Tools JAN19 PUBLIC
ID16 Process Management System 7.023 EGX ERG 7.023 ID16 Process
Management System JAN19 PUBLIC
ID17 Cyber Security System 7.024 EGX ERG 7.024 ID17 Cyber Security
System JAN19 PUBLIC
ID18 Internet Websites 7.025 EGX ERG 7.025 ID18 Internet
Websites JAN19 PUBLIC
Asset Management Overview, Risk and
Optimisation Strategy 7.026
EGX ERG 7.026 Asset Management
Overview, Risk and Optimisation
Strategy JAN19 PUBLIC
Asset Management Plan - AFLC 7.027 EGX ERG 7.027 Asset Management

Energex Regulatory Proposal 2020-25 84
Name Ref File name
Plan - AFLC JAN19 PUBLIC
Asset Management Plan - Circuit Breakers
and reclosers 7.028
EGX ERG 7.028 Asset Management
Plan - Circuit Breakers and reclosers
JAN19 PUBLIC
Asset Management Plan -
Communications Linear Assets 7.029
EGX ERG 7.029 Asset Management
Plan - Communications Linear Assets
JAN19 PUBLIC
Asset Management Plan - Control Systems 7.030 EGX ERG 7.030 Asset Management
Plan - Control Systems JAN19 PUBLIC
Asset Management Plan - DC Supply
Systems 7.031
EGX ERG 7.031 Asset Management
Plan - DC Supply Systems JAN19
PUBLIC
Asset Management Plan - Distribution
Transformers 7.032
EGX ERG 7.032 Asset Management
Plan - Distribution Transformers
JAN19 PUBLIC
Asset Management Plan - Instrument
Transformers 7.033
EGX ERG 7.033 Asset Management
Plan - Instrument Transformers
JAN19 PUBLIC
Asset Management Plan - Operational
Tech Environment 7.034
EGX ERG 7.034 Asset Management
Plan - Operational Tech Environment
JAN19 PUBLIC
Asset Management Plan - Overhead
conductors 7.035
EGX ERG 7.035 Asset Management
Plan - Overhead conductors JAN19
PUBLIC
Asset Management Plan - Pole Top
Structures 7.036
EGX ERG 7.036 Asset Management
Plan - Pole Top Structures JAN19
PUBLIC
Asset Management Plan - Poles and
Lattice Towers 7.037
EGX ERG 7.037 Asset Management
Plan - Poles and Lattice Towers
JAN19 PUBLIC
Asset Management Plan - Protection
Relays 7.038
EGX ERG 7.038 Asset Management
Plan - Protection Relays JAN19
PUBLIC
Asset Management Plan - Ring Main Units 7.039 EGX ERG 7.039 Asset Management
Plan - Ring Main Units JAN19 PUBLIC
Asset Management Plan - Services 7.040 EGX ERG 7.040 Asset Management
Plan - Services JAN19 PUBLIC
Asset Management Plan - Substation
Transformers 7.041
EGX ERG 7.041 Asset Management
Plan - Substation Transformers

Energex Regulatory Proposal 2020-25 85
Name Ref File name
JAN19 PUBLIC
Asset Management Plan - Switches 7.042 EGX ERG 7.042 Asset Management
Plan - Switches JAN19 PUBLIC
Asset Management Plan -
Telecommunications 7.043
EGX ERG 7.043 Asset Management
Plan - Telecommunications JAN19
PUBLIC
Asset Management Plan - Underground
cables 7.044
EGX ERG 7.044 Asset Management
Plan - Underground cables JAN19
PUBLIC
Asset Management Policy 7.045 EGX ERG 7.045 Asset Management
Policy JAN19 PUBLIC
Customer Quality of Supply Strategy 7.047 EGX ERG 7.047 Customer Quality of
Supply Strategy JAN19 PUBLIC
Customer Reliability Strategy 7.048 EGX ERG 7.048 Customer Reliability
Strategy JAN19 PUBLIC
Distribution Annual Planning Report 7.049 EGX 7.049 Distribution Annual
Planning Report DEC18 PUBLIC
Demand Management Strategy and Plan
2020-25 7.051
EGX ERG 7.051 Demand
Management Strategy and Plan
2020-25 JAN19 PUBLIC
DM Customer Engagement Outcomes 7.052
EGX ERG 7.052 DM Customer
Engagement Outcomes JAN19
PUBLIC
DM Outcomes 2015-20 7.053 EGX ERG 7.053 DM Outcomes 2015-
20 JAN19 PUBLIC
Future Grid Roadmap 7.054 EGX ERG 7.054 Future Grid Roadmap
JAN19 PUBLIC
Intelligent Grid Enablement Strategic
Proposal 7.055
EGX ERG 7.055 Intelligent Grid
Enablement Strategic Proposal
JAN19 PUBLIC
Intelligent Grid Technology Plan 7.056 EGX ERG 7.056 Intelligent Grid
Technology Plan JAN19 PUBLIC
Justification Statement - Circuit Breakers
and Reclosers 7.057
EGX 7.057 Justification Statement -
Circuit Breakers and Reclosers JAN19
PUBLIC
Justification Statement - DC Systems 7.059 EGX 7.059 Justification Statement -
DC Systems JAN19 PUBLIC
Justification Statement - Distribution 7.060 EGX 7.060 Justification Statement -
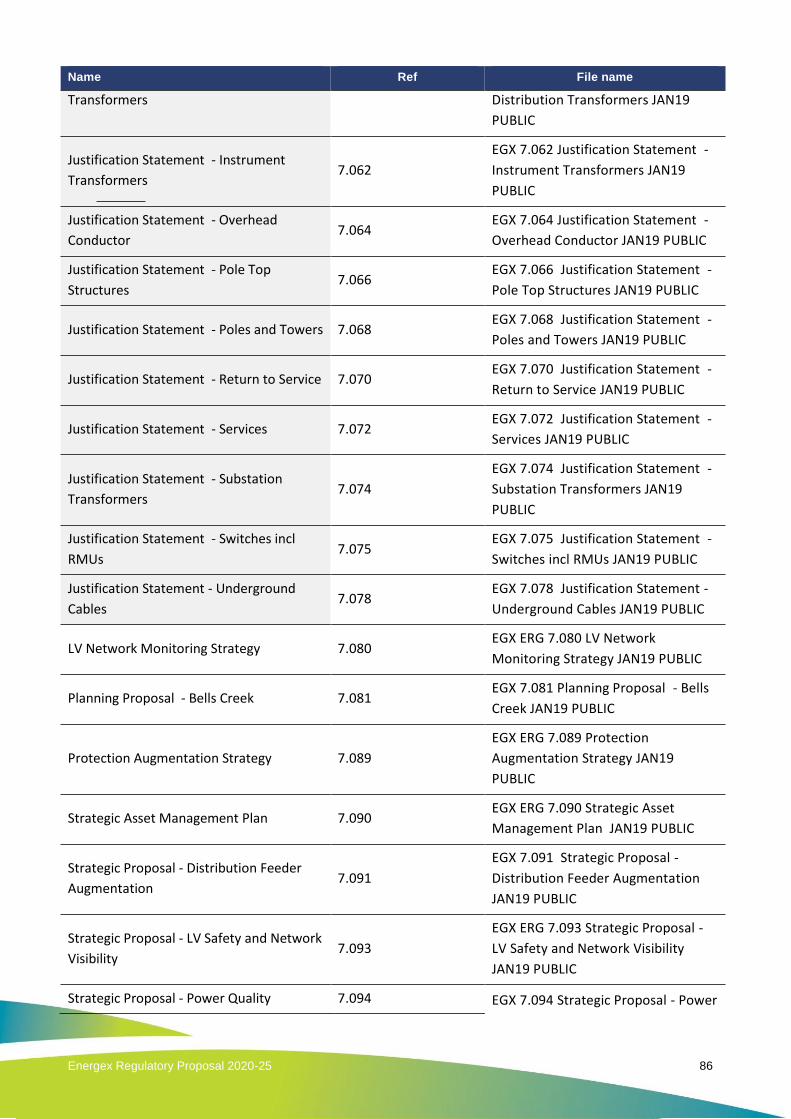
Energex Regulatory Proposal 2020-25 86
Name Ref File name
Transformers Distribution Transformers JAN19
PUBLIC
Justification Statement - Instrument
Transformers 7.062
EGX 7.062 Justification Statement -
Instrument Transformers JAN19
PUBLIC
Justification Statement - Overhead
Conductor 7.064
EGX 7.064 Justification Statement -
Overhead Conductor JAN19 PUBLIC
Justification Statement - Pole Top
Structures 7.066
EGX 7.066 Justification Statement -
Pole Top Structures JAN19 PUBLIC
Justification Statement - Poles and Towers 7.068 EGX 7.068 Justification Statement -
Poles and Towers JAN19 PUBLIC
Justification Statement - Return to Service 7.070 EGX 7.070 Justification Statement -
Return to Service JAN19 PUBLIC
Justification Statement - Services 7.072 EGX 7.072 Justification Statement -
Services JAN19 PUBLIC
Justification Statement - Substation
Transformers 7.074
EGX 7.074 Justification Statement -
Substation Transformers JAN19
PUBLIC
Justification Statement - Switches incl
RMUs 7.075
EGX 7.075 Justification Statement -
Switches incl RMUs JAN19 PUBLIC
Justification Statement - Underground
Cables 7.078
EGX 7.078 Justification Statement -
Underground Cables JAN19 PUBLIC
LV Network Monitoring Strategy 7.080 EGX ERG 7.080 LV Network
Monitoring Strategy JAN19 PUBLIC
Planning Proposal - Bells Creek 7.081 EGX 7.081 Planning Proposal - Bells
Creek JAN19 PUBLIC
Protection Augmentation Strategy 7.089
EGX ERG 7.089 Protection
Augmentation Strategy JAN19
PUBLIC
Strategic Asset Management Plan 7.090 EGX ERG 7.090 Strategic Asset
Management Plan JAN19 PUBLIC
Strategic Proposal - Distribution Feeder
Augmentation 7.091
EGX 7.091 Strategic Proposal -
Distribution Feeder Augmentation
JAN19 PUBLIC
Strategic Proposal - LV Safety and Network
Visibility 7.093
EGX ERG 7.093 Strategic Proposal -
LV Safety and Network Visibility
JAN19 PUBLIC
Strategic Proposal - Power Quality 7.094 EGX 7.094 Strategic Proposal - Power

Energex Regulatory Proposal 2020-25 87
Name Ref File name
Quality JAN19 PUBLIC
Strategic Proposal - Protection Schemes 7.096 EGX ERG 7.096 Strategic Proposal -
Protection Schemes JAN19 PUBLIC
Strategic Proposal - Worst Performing
Feeder Program 7.097
EGX 7.097 Strategic Proposal - Worst
Performing Feeder Program JAN19
PUBLIC
Strategic Scope - Core IP 7.100 EGX 7.100 Strategic Scope - Core IP
JAN19 PUBLIC
Strategic Scope - Distribution Systems
SCADA 7.101
EGX 7.101 Strategic Scope -
Distribution Systems SCADA JAN19
PUBLIC
Strategic Scope - Protection Relays 7.102 EGX 7.102 Strategic Scope -
Protection Relays JAN19 PUBLIC
Strategic Scope - Back Up Reach Program 7.104 EGX 7.104 Strategic Scope - Back Up
Reach Program JAN19 PUBLIC
Strategic Scope - Control Room
Enhancement 7.109
EGX ERG 7.109 Strategic Scope -
Control Room Enhancement JAN19
PUBLIC
Strategic Scope - Controller Boards 7.110 EGX 7.110 Strategic Scope -
Controller Boards JAN19 PUBLIC
Strategic Scope - DC Supplies Duplication 7.111 EGX ERG 7.111 Strategic Scope - DC
Supplies Duplication JAN19 PUBLIC
Strategic Scope - Demand Management
Development 7.112
EGX ERG 7.112 Strategic Scope -
Demand Management Development
JAN19 PUBLIC
Strategic Scope - DMIA 7.113 EGX ERG 7.113 Strategic Scope -
DMIA JAN19 PUBLIC
Strategic Scope - Initiatives Broad Based 7.115
EGX ERG 7.115 Strategic Scope -
Initiatives Broad Based JAN19
PUBLIC
Strategic Scope - Initiatives Targeted 7.116 EGX ERG 7.116 Strategic Scope -
Initiatives Targeted JAN19 PUBLIC
Strategic Scope - Non-Network
Alternatives 7.119
EGX ERG 7.119 Strategic Scope -
Non-Network Alternatives JAN19
PUBLIC
Strategic Scope - Obsolete Telecoms 7.120 EGX 7.120 Strategic Scope - Obsolete
Telecoms JAN19 PUBLIC
Strategic Scope - Operational Tech 7.121 EGX 7.121 Strategic Scope -

Energex Regulatory Proposal 2020-25 88
Name Ref File name
Environment Operational Tech Environment
JAN19 PUBLIC
Strategic Scope - OT Environment
enhancements 7.123
EGX ERG 7.123 Strategic Scope - OT
Environment enhancements JAN19
PUBLIC
Strategic Scope - OT Meter Management 7.124 EGX ERG 7.124 Strategic Scope - OT
Meter Management JAN19 PUBLIC
Strategic Scope - Pilot cable 7.126 EGX 7.126 Strategic Scope - Pilot
cable JAN19 PUBLIC
Strategic Scope - Remote Engineering
switch 7.127
EGX 7.127 Strategic Scope - Remote
Engineering switch JAN19 PUBLIC
Strategic Scope - Remote Terminal Units 7.128 EGX 7.128 Strategic Scope - Remote
Terminal Units JAN19 PUBLIC
Strategic Scope - RTU Security and
functional enhancements rollout 7.130
EGX 7.130 Strategic Scope - RTU
Security and functional
enhancements rollout JAN19 PUBLIC
Strategic Scope - Secure Data Zone 7.131 EGX ERG 7.131 Strategic Scope -
Secure Data Zone JAN19 PUBLIC
Strategic Scope - OT Security Environment
Enhance 7.133
EGX ERG 7.133 Strategic Scope - OT
Security Environment Enhance
JAN19 PUBLIC
Sub Transmission Major Project List 7.135 EGX 7.135 Sub Transmission Major
Project List JAN19 PUBLIC
Business Case Property - Banyo Workshop 7.137
EGX ERG 7.137 Business Case
Property - Banyo Workshop JAN19
PUBLIC
Business Case Property - Brisbane Office 7.138
EGX ERG 7.138 Business Case
Property - Brisbane Office JAN19
PUBLIC
Business Case Property - Brisbane Training
Facilities 7.139
EGX ERG 7.139 Business Case
Property - Brisbane Training Facilities
JAN19 PUBLIC
Business Case Property - Data Centre 7.140 EGX ERG 7.140 Business Case
Property- Data Centre JAN19 PUBLIC
Business Case Property - Maryborough 7.141
EGX ERG 7.141 Business Case
Property - Maryborough JAN19
PUBLIC
Business Case Property - Townsville 7.142 EGX ERG 7.142 Business Case
Property - Townsville Training Centre

Energex Regulatory Proposal 2020-25 89
Name Ref File name
Training Centre JAN19 PUBLIC
Property Services Strategy 7.143 EGX ERG 7.143 Property Services
Strategy JAN19 PUBLIC
Property Strategic Asset Management Plan 7.144
EGX ERG 7.144 Property Strategic
Asset Management Plan JAN19
PUBLIC
Capitalisation policy 7.145 EGX 7.145 Capitalisation policy
MAR17 PUBLIC
Connection policy 7.147 EGX 7.147 Connection policy JAN19
PUBLIC
Connection Policy Overview 7.149 EGX 7.149 Connection Policy
Overview JAN19 PUBLIC
Forecast Capex Model(s) and
Methodology 7.153
EGX 7.153 Forecast Capex Model(s)
and Methodology JAN19 PUBLIC
Justification Statement - CTG/CTS 7.155 EGX 7.155 Justification Statement -
CTG CTS JAN19 PUBLIC
EQL Repex Model Supporting Information
17.029 EGX ERG 17.029 EQL Repex Model
Supporting Information JAN19
PUBLIC

Energex Regulatory Proposal 2020-25 90
8. Regulatory asset base and depreciation
8.1 Overview
8.1.1 Regulatory asset base
Our RAB reflects the value of the investments we have made to provide SCS but are yet to recover.
It comprises assets of various economic lives – ranging from short life assets, such as ICT assets
(with 5 to 10 year lives), to long-life assets such, as transformers and power lines (with 50 year lives).
Under the NER, our RAB is updated annually by adjusting the RAB value from the previous year for:
inflation (indexation), which increases the RAB
new capex, which increases the RAB
depreciation, which reduces the RAB, and
asset disposals, which reduce the RAB.
The RAB is used to calculate two of the building blocks that make up our revenues – the return on
capital (financing costs) and regulatory depreciation (payback of investments). Thus, it has a
significant effect on customer charges.
We acknowledge that our RAB has increased significantly since 2005. This has been driven, in part,
by our investment in the network to meet demand growth, replace aging assets and augment the
network to meet mandated security standards. However, in recent years we have been reducing our
capex as demand growth has slowed and security standards have changed. Our RAB is forecast to
increase over the current and forthcoming regulatory control periods, but at a much slower rate than
in the past.
8.1.2 Regulatory depreciation
Regulatory depreciation is an allowance through which we recover our network investments over the
economic lives of our assets. When calculating the depreciation on existing assets at the
commencement of the 2020-25 regulatory control period, we note that the AER considers that two
approaches meet the requirements of the NER, namely:
The weighted average remaining life (WARL) approach. This is the standard approach
employed in the AER’s PTRM. The approach pools or groups all past expenditure within an
Key Messages
We are committed to placing downward pressure on the size of our RAB as part of our focus
on continuing to make our electricity distribution services as affordable as possible for our
customers.
We propose an opening RAB as at 1 July 2020 of $12,917 million (nominal), calculated using
the AER’s roll forward model (RFM).
We propose retaining our approach of applying real straight-line depreciation but changing to
the “year-on-year tracking” method which the AER has accepted for other DNSPs. This
aligns the return of capital (i.e. depreciation) with the economic lives of our assets.
We propose to use forecast depreciation to roll-forward the RAB at the start of the
subsequent regulatory control period, consistent with the AER’s F&A paper.

Energex Regulatory Proposal 2020-25 91
asset class and estimates a single WARL for the entire asset class. Straight-line depreciation
is then calculated by dividing the pooled value by the WARL.
The year-by-year or period-by-period approach. This is a novel method that was first
adopted in the 2015-20 Distribution Determinations for SA Power Networks and Ergon
Energy. Unlike the WARL approach, the tracking approach does not pool all past capex within
an asset class. Instead, capex for each year of a regulatory control period is ‘tracked’ and
depreciated separately – either on a year-by-year basis or alternatively on a period-by-period
basis. Remaining asset lives are irrelevant under this approach (except for the opening RAB
values when the approach is first used – i.e. 1 July 2015). The approach is more complex but
also more accurate than the WARL.
In the 2010-15 and 2015-20 regulatory control periods, we adopted the AER’s preferred WARL
approach. However, starting from the 2020-25 regulatory control period, we are proposing to switch
to the year-by-year tracking approach – amongst other things, this has the benefit of aligning our
approach with Ergon Energy. We consider that the WARL approach unnecessarily extends the lives
of our old assets. This has the effect, at least in the short term, of deferring the recovery of old assets
to future periods. We believe that this has partly contributed to our RAB remaining relatively high.
8.2 Establishing the opening RAB
Under the NER, the value of our RAB as at the commencement of the 2020-25 regulatory control
period is a constituent element of the AER’s Distribution Determination. We calculated the opening
value in accordance with clause 6.5.1 and schedule 6.2 of the NER and using the AER’s RFM. In
summary, we have calculated the opening value at 1 July 2020 by rolling forward the value at the
start of the 2015-20 regulatory control period, 1 July 2015, set by the AER in the 2015-20 Distribution
Determination. The completed RFM is provided as Attachment 8.007. Table 34 summarises the
calculations.
Table 34 Opening RAB as at 1 July 2020
$M, Nominal 2015-16 2016-17 2017-18 2018-19 2019-20 2020-21
Opening RAB 11,172.52 11,541.31 11,853.71 12,176.86 12,452.41
Straight-line depreciation -348.56 -370.73 -391.86 -407.38 -429.21
Indexation 188.65 170.35 226.30 213.10 280.18
Capex 528.69 512.78 488.71 469.83 464.71
Closing RAB 11,541.31 11,853.71 12,176.86 12,452.41 12,768.09
Adjustment for previous regulatory
control period 1.88
Legacy ICT assets 146.68
Opening value as at 1 July 2020 12,916.65
Note: Totals may not add due to rounding.
Capex
In deriving the opening RAB, we used:
our actual capex for the first three years of the 2015-20 regulatory control period as reported
in our annual RINs, and
forecast capex for the last two years of the 2015-20 regulatory control period. We will provide
actual capex for the penultimate year, 2018-19, in our Revised Regulatory Proposal.

Energex Regulatory Proposal 2020-25 92
Under the NER, in deciding on the value of our opening RAB, the AER must produce a statement on
the prudency and efficiency of capex rolled into RAB. The AER may exclude capex from being added
to the RAB if we have:
inefficiently overspent our capex allowances
paid inflated margins to our related parties, and
capitalised expenditure previously classified as opex.
Furthermore, the NER provides that the review period for such exclusions is the last two years of the
2010-15 regulatory control period and the first three years of the 2015-20 regulatory control period
(i.e. 2013-14 to 2017-18). However, since the AER’s Capital Expenditure Incentive Guideline was
published in November 2013, the relevant review period for us is the four-year period from 2014-15
to 2017-18. Thus, we have used this four-year period to assess whether a reduction is required for
our opening RAB. We note that over this period we:
underspent our capex allowances
did not include related party margins in our capex, and
did not change our capitalisation policies to capitalise more expenditure.
For these reasons, we do not consider that our opening RAB should be reduced.
Indexation
Consistent with the approach used in our control mechanism, we calculated indexation of our RAB
for each year by applying the actual annual December to December All Groups CPI, Weighted
Average of Eight State Capital Cities (published by the Australian Bureau of Statistics).
Depreciation
Consistent with the 2015-20 Distribution Determination, we roll-forward the RAB using the forecast
depreciation approved by the AER for the 2015-20 regulatory control period.
Legacy ICT assets
As discussed in section 7.10.1, in the 2010-15 and 2015-20 regulatory control periods, our ICT
services were provided by SPARQ which then formed part of Energy Queensland. We note that in
the 2015-20 Distribution Determination the AER expressed concerns regarding our treatment of ICT
costs particularly our ‘off-balance sheet treatment’ of ICT assets. The AER considered that it lacked
transparency and made it difficult to assess our ICT costs against other DNSPs.
In light of the merger and the AER’s previous concerns, commencing from 1 July 2020, we are
proposing to capture all our ICT assets within our RAB. In transitioning to this approach, we propose
to add our legacy ICT assets projected to be valued at $147 million into the RAB as at 1 July 2020.
As per customer feedback, we also propose to assign an asset life of 10 years to these assets, which
is longer than our 5 year standard life for our ICT assets. We consider that this will smooth the
recovery of these legacy assets and limit distribution network charge shocks. Attachment 8.001
details how we derived the value of legacy ICT assets.
8.3 Forecast RAB
Our forecast RAB over the 2020-25 regulatory control period is set out in Table 35. We have derived
the RAB values in accordance with the NER and using the AER’s PTRM. In summary, we have taken
the opening RAB value outlined in the previous section and:
added forecast indexation (as discussed in section 8.4.2)

Energex Regulatory Proposal 2020-25 93
added forecast capex (which is discussed in chapter 9)
deducted straight-line depreciation (as discussed in section 8.4), and
deducted forecast disposals.
Table 35 Forecast RAB over the 2020-25 regulatory control period
$M, Nominal 2020-21 2021-22 2022-23 2023-24 2024-25
Opening RAB 12,916.65 13,206.73 13,501.60 13,795.26 14,070.88
Capex 430.13 426.24 446.87 452.64 445.57
Straight-line depreciation -452.63 -450.97 -479.94 -510.87 -542.92
Indexation 312.58 319.60 326.74 333.85 340.52
Closing RAB 13,206.73 13,501.60 13,795.26 14,070.88 14,314.05
Figure 36 demonstrates the efforts made by Energex to improve the efficiency of its capital
employed, resulting in a reduced RAB per customer.
Figure 36 RAB per customer trends
8.4 Forecast depreciation
Depreciation is the mechanism through which we recover our network investments typically over the
economic lives of the assets. The current approach of the AER is to net off straight-line depreciation
(which reduces the RAB) and indexation (which increases the RAB) and to refer to the net value as
‘regulatory depreciation’.
Our forecast regulatory depreciation schedules are provided as Attachments 8.005. Table 36
summarises the calculations.

Energex Regulatory Proposal 2020-25 94
Table 36 Forecast regulatory depreciation
$M, Nominal 2020-21 2021-22 2022-23 2023-24 2024-25
Straight-line
depreciation 452.63 450.97 479.94 510.87 542.92
Indexation 312.58 319.60 326.74 333.85 340.52
Regulation
depreciation 140.04 131.37 153.21 177.02 202.40
8.4.1 Depreciation methodology
The NER does not prescribe a method for calculating depreciation. Rather, clause 6.5.5 of the NER
provides that the AER must use the depreciation schedules proposed by the DNSP to the extent that
they conform to the following key requirements:
the schedules must depreciate using a profile that reflects the nature of the assets or category
of assets over the economic life of that asset or category of assets.
the sum of the real value of the depreciation that is attributable to any asset or category of
assets must be equivalent to the value at which that category of assets was first included in
the RAB for the relevant distribution system.
The AER’s PTRM is configured to use the straight-line method as the default method for calculating
depreciation. We have used this method in conformance with clause 6.5.5(b)(1) of the NER. We
recognise that this approach may change in the future.
In calculating depreciation, the approach taken in the PTRM is to derive the total straight-line
depreciation as the sum of:
the depreciation on existing assets at the commencement of the regulatory control period
(opening asset value) – based on their remaining asset lives, and
the depreciation on forecast capex (new additions) over the regulatory control period – based
on their standard asset lives.
As previously mentioned, we are proposing to transition from the WARL approach to the year-by-year
tracking approach in calculating the depreciation on existing assets at the commencement of the
regulatory control period. Therefore, our depreciation proposal for the 2020-25 regulatory control
period is to:
depreciate existing assets at the commencement of the 2015-20 regulatory control period
(1 July 2015) using the remaining asset lives approved by the AER for the 2015-20 regulatory
control period
depreciate actual and forecast capex for the 2015-20 regulatory control period separately
using standard asset lives, and
depreciate forecast capex for the 2020-25 regulatory control period using standard asset
lives.
Table 37 sets out our proposed standard asset lives. We propose to use the same asset lives as
approved by the AER in the 2015-20 Distribution Determination. We have reviewed the asset lives
and do not consider that any changes are warranted at this stage.

Energex Regulatory Proposal 2020-25 95
Table 37 Standard asset lives
Asset Class Remaining asset lives in years
(at 1 July 2015)
Standard asset life in years
OH Sub-transmission lines 37.49 50.54
UG Sub-transmission cables 32.79 45.00
OH Distribution Lines 32.04 45.00
UG Distribution Cables 46.94 60.00
Distribution Equipment 29.26 35.00
Substation Bays 30.07 45.00
Substation Establishment 35.15 57.57
Distribution Substation Switchgear 38.94 45.00
Zone Transformers 40.73 50.00
Distribution Transformers 28.57 40.58
Low Voltage Services 28.59 35.00
Metering 12.42 15.00
Communications - Pilot Wires 23.42 29.28
Public lighting (Residual Rate 2 Assets) 5.84 20.00
Systems Buildings 56.60 60.00
Systems Easements n/a n/a
System Land n/a n/a
Communications 1.00 7.00
Control Centre - SCADA 4.60 12.00
IT Systems 2.85 4.96
Office Equipment & Furniture 2.86 7.00
Motor Vehicles 5.99 9.02
Plant & Equipment 5.06 6.76
Research & Development 1.00 5.00
Buildings 34.14 40.00
Easements n/a n/a
Land n/a n/a
Legacy ICT 10.00
Equity raising costs 42.10 46.10
8.4.2 Forecast inflation
We have calculated forecast inflation using the AER’s preferred Reserve Bank of Australia (RBA)
method. Our calculation is discussed in section 9.4.
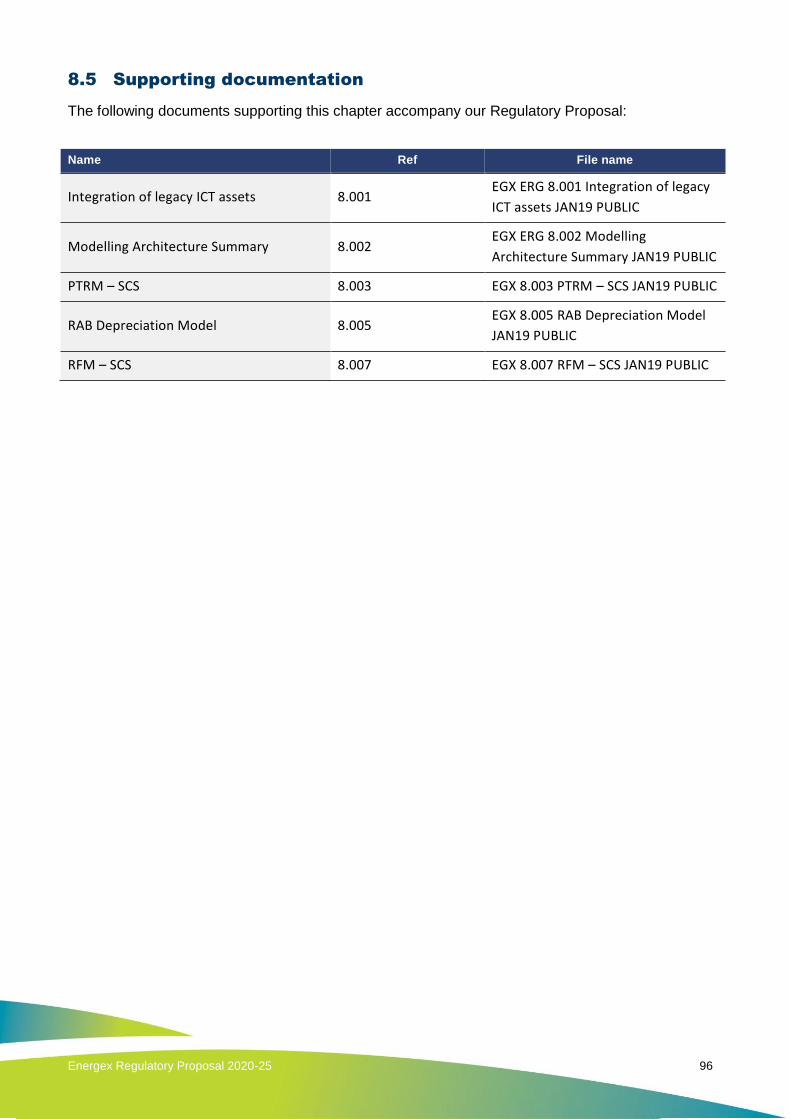
Energex Regulatory Proposal 2020-25 96
8.5 Supporting documentation
The following documents supporting this chapter accompany our Regulatory Proposal:
Name Ref File name
Integration of legacy ICT assets 8.001 EGX ERG 8.001 Integration of legacy
ICT assets JAN19 PUBLIC
Modelling Architecture Summary 8.002 EGX ERG 8.002 Modelling
Architecture Summary JAN19 PUBLIC
PTRM – SCS 8.003 EGX 8.003 PTRM – SCS JAN19 PUBLIC
RAB Depreciation Model 8.005 EGX 8.005 RAB Depreciation Model
JAN19 PUBLIC
RFM – SCS 8.007 EGX 8.007 RFM – SCS JAN19 PUBLIC

Energex Regulatory Proposal 2020-25 97
9. Rate of return
9.1 Overview
The rate of return is an estimate of the financing costs that we face to attract the funds we require to
invest in the network. It is estimated as a weighted average of the return on equity and the return on
debt as we generally acquire funds from two sources: equity from shareholders and debt from
lenders.
As a capital-intensive business, the rate of return is a significant driver of our revenues (and
customer charges). The return of capital building block, which is calculated by multiplying the rate of
return and the value of the RAB, makes up more than 55% of our revenues.
Under the NEL, the AER’s Rate of Return Instrument sets out how the AER calculates the rate of
return and value of imputation credits. The Rate of Return Instrument is binding on the AER and
network service providers in a regulatory determination. In December 2018, after an 18-month
consultation process, the AER published its final 2018 Rate of Return Instrument, which applies to
our Distribution Determination. We accept the outcomes of the development of the Rate of Return
Instrument.
We have applied the Rate of Return Instrument to derive a rate of return estimate of 5.46%. This is a
placeholder estimate that will be updated by the AER in its Final Distribution determination to reflect
our nominated averaging periods that are used to estimate the risk free rate (for the return on equity)
and the return on debt. Further, the rate of return will be updated annually during the 2020-25
regulatory control period as a result of the annual update of the return on debt under the trailing
average approach.
9.2 Rate of return
As mentioned above, consistent with the Rate of Return Instrument, we propose a rate of return of
5.46% for this Regulatory Proposal. We have calculated this value using the formula in Clause 3 of
the Rate of Return Instrument, which calculates the allowed rate of return as:
𝑟𝑒𝑡𝑢𝑟𝑛 𝑜𝑛 𝑒𝑞𝑢𝑖𝑡𝑦 × (1 − 𝑔𝑒𝑎𝑟𝑖𝑛𝑔 𝑟𝑎𝑡𝑖𝑜) + 𝑟𝑒𝑡𝑢𝑟𝑛 𝑜𝑛 𝑑𝑒𝑏𝑡 × 𝑔𝑒𝑎𝑟𝑖𝑛𝑔 𝑟𝑎𝑡𝑖𝑜
Table 38 summarises the parameters used in our calculations.
Table 38 Rate of return
Parameter Value
Return on equity 6.26%
Return on debt 4.92%
Gearing ratio 0.60
Rate of return 5.46%
Key Messages
We accept the outcomes of the AER’s 2018 Rate of Return Instrument.
We propose a rate of return of 5.46% for this Regulatory Proposal.
We have applied the AER’s preferred RBA method to forecast inflation.
We have applied the AER’s methodology for forecasting debt and equity raising costs.

Energex Regulatory Proposal 2020-25 98
9.2.1 Return on equity
We propose a return on equity of 6.26% for this Regulatory Proposal, consistent with the Rate of
Return Instrument. In estimating the proposed value, we used the formula contained in Clause 4 of
the Rate of Return Instrument, which estimates the allowed return of equity as:
𝑟𝑖𝑠𝑘 𝑓𝑟𝑒𝑒 𝑟𝑎𝑡𝑒 + 𝑒𝑞𝑢𝑖𝑡𝑦 𝑏𝑒𝑡𝑎 × 𝑚𝑎𝑟𝑘𝑒𝑡 𝑟𝑖𝑠𝑘 𝑝𝑟𝑒𝑚𝑖𝑢𝑚
Table 39 summarises the parameters used in our calculations.
Table 39 Return on equity
Parameter Value Basis
Risk free rate 2.60% This is a placeholder estimate of the risk-free rate for the purpose of
this Regulatory Proposal. The AER will calculate our actual risk-free
rate using the method outlined in Clause 4 of the Rate of Return
Instrument and the nominated averaging period we have proposed in
Attachment 9.002.
Equity beta 0.60 As set in the Rate of Return Instrument
Market risk premium 6.10% As set in the Rate of Return Instrument
Return on equity 6.26%
9.2.2 Return on debt
The Rate of Return Instrument sets out that the return on debt is to be calculated using a trailing
average portfolio approach following a 10 year transition from the on-the-day approach. We
commenced our transition to the trailing average approach in the 2015-16 regulatory year, and we
are therefore part way through the 10 year transition. Under the transition approach, the on-the-day
return on debt estimated shortly prior to the commencement of the 2015-16 regulatory year is applied
to:
100 per cent of the debt portfolio for the 2015–16 regulatory year
90 per cent of the debt portfolio for the 2016–17 regulatory year, with the remaining 10 per
cent based on prevailing interest rates during the averaging period for 2016–17
80 per cent of the debt portfolio for the 2017–18 regulatory year, with 10 per cent based on
prevailing interest rates during the averaging period for 2016–17, and 10 per cent based on
prevailing interest rates during the averaging period for 2017–18
70 per cent of the debt portfolio for the 2018-19 regulatory year, with 10 per cent based on the
prevailing interest rates during the averaging period for 2016-17, 10 per cent based on the
prevailing interest rates during the averaging period for 2017-18, and 10 per cent based on
the prevailing interest rates during the averaging period for 2018-19, and
so on for the subsequent regulatory years.
Following the transition period, the return on debt will be calculated as simple average of the
prevailing interest rates during our averaging periods over the previous 10 years.
Up to now, the AER has updated the return on debt for the first four years of transition period – 2015-
16 to 2018-19. Therefore, we have forecast the return on debt applying to each regulatory year of the
remainder of the transition period by applying the approach outlined above and also assuming that
the prevailing interest rates estimated during the most recent averaging period, for the current 2018-
19 regulatory year, apply for the remainder of the transition period. The following table sets out our
actual return on debt estimates as determined by the AER to date and our proposed forecast return
on debt estimates to 2024-25. Our calculations are set out in Attachment 9.002.

Energex Regulatory Proposal 2020-25 99
Table 40 Return on debt
Regulatory year Prevailing interest
rates during
averaging period
Trailing return on
debt
Basis
2015-16 5.01% 5.01% Actuals as determined by the AER
2016-17 5.53% 5.06% Actuals as determined by the AER
2017-18 5.11% 5.07% Actuals as determined by the AER
2018-19 4.51% 5.02% Actuals as determined by the AER
2019-20 4.51% 4.97% Forecast
2020-21 4.51% 4.92% Forecast
2021-22 4.51% 4.87% Forecast
2022-23 4.51% 4.82% Forecast
2023-24 4.51% 4.77% Forecast
2024-25 4.51% 4.72% Forecast
We anticipate that the AER’s draft Distribution Determination will be updated to reflect the annual
return on debt update for the 2019-20 regulatory year, and the AER’s final Distribution Determination
will reflect the annual return on debt update for the 2020-21 regulatory year, which is the first year of
the 2020-25 regulatory control period.
Consistent with the Rate of Return Instrument, we accept that the rate of return will be updated
annually over the 2020-25 regulatory control period. Furthermore, we accept the Rate of Return
Instrument’s proposed approach to estimating the annual prevailing interest rates in each year of the
2020-25 regulatory control period, particularly based on the following:
a 10-year benchmark tenor
BBB+ benchmark credit rating, which is implemented by adopting a weighted average of 1/3
A-rated and 2/3 BBB-rated curves
Bloomberg, RBA, and Thomson Reuters curves as third party data sources
extrapolation and interpolation methodologies for third party data sources, and
the conditions for nominating averaging periods. Our nominated averaging periods for the
2020-25 regulatory control period are set out in a confidential Attachment 9.001.
9.3 Debt and equity raising costs
9.3.1 Debt raising costs
Debt raising costs are transaction costs incurred in raising and/or refinancing debt. These costs may
include arrangement fees, legal fees, company credit rating fees and other transaction costs. The
Rate of Return Instrument does not deal with the calculation of debt raising costs. However, the AER
has, over successive regulatory determinations, consistently applied a forecasting approach based
on the Allen Consulting Group report, commissioned by the Australian Competition and Consumer
Commission in 2004. We propose to adopt this same approach, which involves:
Calculating the benchmark bond size – currently set at $250 million, based on recent AER
decisions

Energex Regulatory Proposal 2020-25 100
Calculating the number of bond issues required to rollover the benchmark debt share (60%)
of the RAB. Our opening RAB for the 2020-25 regulatory control period is approximately $13
billion. This implies that 31 bond issues are required to rollover the assumed debt share of
$7.75 billion
Amortising the upfront debt issuance costs incurred using our nominal vanilla weighted
average cost of capital (WACC) over a ten-year period. Our Regulatory Proposal uses the
upfront costs adopted by the AER in several recent decisions and our proposed rate of return
of 5.46%
Expressing the debt issuance costs in basis points per annum (bppa) as an input into the
PTRM, and
Multiplying the rate by our projected RAB to determine the debt raising cost allowance.
Our proposed estimate of debt raising costs is 8.05 bppa, as set out in Table 41.
Table 41 Debt raising costs
Number of bonds Value 1 bond issued 31 bonds issued
Amount raised - 250.00 7,750.00
Arrangement fee 8.50 6.92 6.92
Bond Master Program (per
program) 56,250.00 0.30 0.01
Issuer's legal counsel 15,625.00 0.08 0.08
Company credit rating 77,500.00 0.41 0.01
Annual surveillance fee 35,500.00 0.14 0.00
Up-front issuance fee 5.20 0.69 0.69
Registration up-front (per
program) 20,850.00 0.11 0.00
Registration- annual 7,825.00 0.31 0.31
Agents’ out-of-pockets 3,000.00 0.02 0.02
Total (bppa) - 8.98 8.05
9.3.2 Equity raising costs
Equity raising costs are the transaction costs associated with raising new equity. These include legal
fees, marketing costs and other transaction costs incurred in this process. The Rate of Return
Instrument does not cover the estimation of equity raising costs. However, the AER has, over
successive regulatory determinations, developed a well-accepted cash flow analysis approach to
estimating equity raising costs. The estimated equity raising cost allowance (if any) is amortised over
the weighted average standard life new capex added to the RAB over the 2020-25 regulatory control
period.
We have applied this approach and, based on our projected capex and cash flows, we do not
forecast any equity raising costs.
9.4 Expected inflation
We propose to adopt the AER’s preferred method for forecasting expected inflation – the RBA
method. Clause 6.4.2(b)(1) of the NER requires the AER to specify in the PTRM a methodology that
is likely to result in the best estimate of expected inflation. The AER’s preferred method for estimating

Energex Regulatory Proposal 2020-25 101
expected inflation is the RBA method, which is the 10-year geometric annualised average of the
RBA’s forecast headline rate for the two years ahead and the mid-point of the RBA target inflation
band of 2% to 3% for eight years.
For the purpose of this Regulatory Proposal, we used a forecast of 2.42% based on the August 2018,
RBA Statement of Monetary Policy as summarised in Table 42.
Table 42 Forecast inflation
Per cent 2018-19 2019-20 2020-21 to 2027-28 Geometric mean
Forecast inflation 2.00% 2.25% 2.50% 2.42%
9.5 Supporting documentation
The following documents supporting this chapter accompany our Regulatory Proposal:
Name Ref File name
Averaging periods – rate of return 9.001 EGX ERG 9.001 Averaging periods –
rate of return JAN19 CONFID
Rate of return 9.002 EGX ERG 9.002 Rate of return JAN19
PUBLIC

Energex Regulatory Proposal 2020-25 102
10. Estimated cost of corporate income tax
10.1 Overview
Our allowed revenues include a notional corporate income tax allowance. This represents an
estimate of the cost of corporate income tax faced by a benchmark firm operating our business.
The corporate tax allowance is forecast using a standard tax calculation that considers our forecast
taxable revenue and taxable expenses (depreciation, interest and opex), as well as the statutory
corporate tax rate and the value of imputation credits (gamma).
Under the NEL, the AER’s Rate of Return Instrument sets out the value of imputation credits. On
17 December 2018, the AER published its 2018 Rate of Return Instrument which applies in our
Distribution Determination. We accept the value of 0.585 set out in the AER’s Rate of Return
Instrument.
We note that the AER recently reviewed its regulatory tax approach and published a final report on
17 December 2018. The final report recommends changes to the AER’s approach. The changes that
impact us (immediate expensing of certain capex and use of diminishing value method) require
formal model changes to the AER’s RFM and PTRM. Given that the AER is required to run a
consultation process before amending the RFM and PTRM and the consultation will not be
completed by the time our proposal is due, we have not accounted for the potential changes to the
AER’s tax approach in this Regulatory Proposal. Although we have not accounted for the potential
changes, we expect that they will likely reduce the tax allowance forecasts – which will benefit our
customers through lower prices. We will work with the AER as part of its consultation and the
Distribution Determination as it looks to give effect to those changes.
10.2 Forecast corporate tax allowance
We have forecast our proposed corporate income tax allowance using the AER’s PTRM. Our
completed PTRM is provided as Attachment 8.003 and summarised in Table 43 below. The PTRM’s
corporate income tax allowance calculations are governed by Clause 6.5.3 of the NER, which
specifies the following formula:
𝐸𝑇𝐶𝑡 = (𝐸𝑇𝐼𝑡 × 𝑟𝑡)(1 − 𝛾)
Where:
𝐸𝑇𝐶𝑡 is the estimated corporate income tax allowance for each regulatory year.
𝐸𝑇𝐼𝑡 is an estimate of the taxable income for each regulatory year that would be earned by a
benchmark firm operating our business (and providing SCS). This is calculated using the
AER’s PTRM.
𝑟𝑡is the expected statutory tax rate. We adopt the statutory tax rate of 30%.
𝛾 is the value of imputation credits. We adopt the AER’s rate of return instrument value of
0.585.
Key Messages
We accept the AER’s Rate of Return Instrument value of imputation credits (gamma).
Our forecast tax allowances set out in this Regulatory Proposal will likely reduce as a result of
the AER’s recently completed review of its regulatory tax approach.

Energex Regulatory Proposal 2020-25 103
Table 43 Forecast tax allowance
$M, Nominal 2020-21 2021-22 2022-23 2023-24 2024-25 Total
Tax payable 34.09 78.33 81.60 85.74 89.81 369.58
Less: value of imputation credits 19.94 45.82 47.73 50.16 52.54 216.20
Net corporate income tax allowance 14.15 32.51 33.86 35.58 37.27 153.37
10.3 Forecast tax depreciation
Forecast tax depreciation is a key input in the estimating of our corporate income tax allowances.
Under the Australian tax system, depreciation is a deductible expense. The regulatory calculation of
tax depreciation depends on:
The value of the regulatory tax asset base as at the commencement of the 2020-25
regulatory control period, i.e. 1 July 2020. We used the AER’s RFM to derive the opening tax
asset base as at 1 July 2020. Our completed RFM is provided as Attachment 8.007 and
summarised in Table 44. We rolled forward the value of the tax asset base at 1 July 2015 set
by the AER in the 2015-20 Distribution Determination. As outlined in chapter 7.10, we are
proposing to add our legacy ICT assets into the RAB at 1 July 2020. Therefore we have
added a corresponding value to the tax asset base.
The tax remaining asset lives used to calculate tax depreciation of on our opening tax base.
We have adopted the weighted average remaining asset lives derived in the RFM. These are
outlined in Table 45.
The tax standard asset lives used to calculate tax depreciation on our new investments. We
adopted the values provided in our 2017-18 Annual RIN. These values are consistent with the
Australian Taxation Office’s (ATO) approved lives.
Table 44 Opening tax asset base as at 1 July 2020
$M, Nominal 2015-16 2016-17 2017-18 2018-19 2019-20 Total
Opening tax asset base 6,674.28 7,050.13 7,380.92 7,665.46 7,914.15
Capital expenditure 595.20 562.98 532.37 510.74 505.63
Less: Tax depreciation - 219.34 - 232.19 - 247.83 - 262.05 - 272.39
Closing tax asset base 7,050.13 7,380.92 7,665.46 7,914.15 8,147.39
Adjustment for legacy ICT assets 146.68
Opening tax asset base as at 1
July 2020 8,294.07

Energex Regulatory Proposal 2020-25 104
Table 45 Tax asset lives
Asset Class Standard asset lives in years Remaining asset lives in years at 1 July
2020
OH Sub-transmission lines 45.00 31.85
UG Sub-transmission cables 50.00 34.98
OH Distribution Lines 45.00 35.88
UG Distribution Cables 50.00 35.01
Distribution Equipment 45.00 36.60
Substation Bays 40.00 29.63
Substation Establishment 40.00 32.51
Distribution Substation Switchgear 40.00 31.06
Zone Transformers 40.00 28.70
Distribution Transformers 45.00 34.02
Low Voltage Services 40.00 30.14
Metering 25.00 21.40
Communications - Pilot Wires 10.00 7.57
Public lighting (Residual Rate 2 Assets) 15.00 1.25
Systems Buildings 40.00 33.56
Systems Easements n/a n/a
System Land n/a n/a
Communications 10.00 -
Control Centre - SCADA 10.00 9.52
IT Systems 3.80 3.03
Office Equipment & Furniture 13.10 5.39
Motor Vehicles 12.90 8.27
Plant & Equipment 5.20 3.28
Research & Development n/a n/a
Buildings 40.00 30.60
Easements n/a n/a
Land n/a n/a
Legacy ICT 10.00 -
Equity raising costs 5.00 -

Energex Regulatory Proposal 2020-25 105
11. Incentive schemes
11.1 Overview
We operate under an incentive-based regulatory framework where we are encouraged to
continuously improve efficiency. A key feature of this framework is that the AER sets the maximum
revenue that we can recover from our customers over the course of the regulatory control period,
thus encouraging us to provide our services at a lower cost than forecast by the AER.
In addition, the NER stipulates that the AER may, or must, develop a suite of incentive schemes to
compliment the incentive-based regulatory framework. The incentive schemes encourage us to
continuously improve our service performance, cost efficiency, and demand management. They
include an EBSS, CESS, STPIS, DMIS, DMIAM, and the Small Scale Incentive Scheme (SSIS).
In the F&A paper for our regulatory control period commencing 1 July 2020, the AER proposed to
apply the EBSS, CESS, STPIS, DMIS and DMIAM. We support the application of these schemes as
we consider that they align our incentives with the long-term interests of our customers, thus
promoting the National Electricity Objective. The AER did not specify
a SSIS in the F&A paper; we support the AER’s position.
We note that we are responding to incentives by outperforming our
service performance targets, projecting capex and opex efficiencies
and continuing to pursue demand management solutions in the
current regulatory control period. We are entitled to revenue
increments in the 2020-25 regulatory control period under the CESS
and EBSS for efficiencies achieved in the current 2015-20 regulatory
control period. However, we are currently proposing, subject to the
AER’s acceptance of our Regulatory Proposal, to not claim the
potential revenue adjustment associated with these efficiency schemes in this Regulatory Proposal.
In doing so, we believe we are presenting a balanced proposal focussed on our customer’s key
concerns of safety, affordability and security and sustainability. In the event the AER has any material
concerns with our Regulatory Proposal in its Draft Determination, we will reassess our approach to
efficiency schemes to ensure our Revised Regulatory Proposal continues to provide a balanced
approach in the long term interests of our customers
Attachment 11.001 outlines in detail our proposed approach to the application of each incentive
scheme, while the remainder of this chapter summarises our acceptance of the application of the
schemes in the 2020-25 regulatory control period.
Key Messages
We are responding to incentives to improve our service performance and cost efficiency
We are entitled to revenue increments under the CESS and EBSS for efficiencies achieved in
the current 2015-20 regulatory control period. However, we are currently proposing, subject to
the AER’s acceptance of our Regulatory Proposal, to not claim the potential revenue
adjustment associated with these efficiency schemes in this Regulatory Proposal
We welcome the AER’s proposal to continue to apply the EBSS, CESS, STPIS, DMIS, and
DMIAM in the 2020-25 regulatory control period
We only benefit
under these
incentive schemes if
customers also
benefit
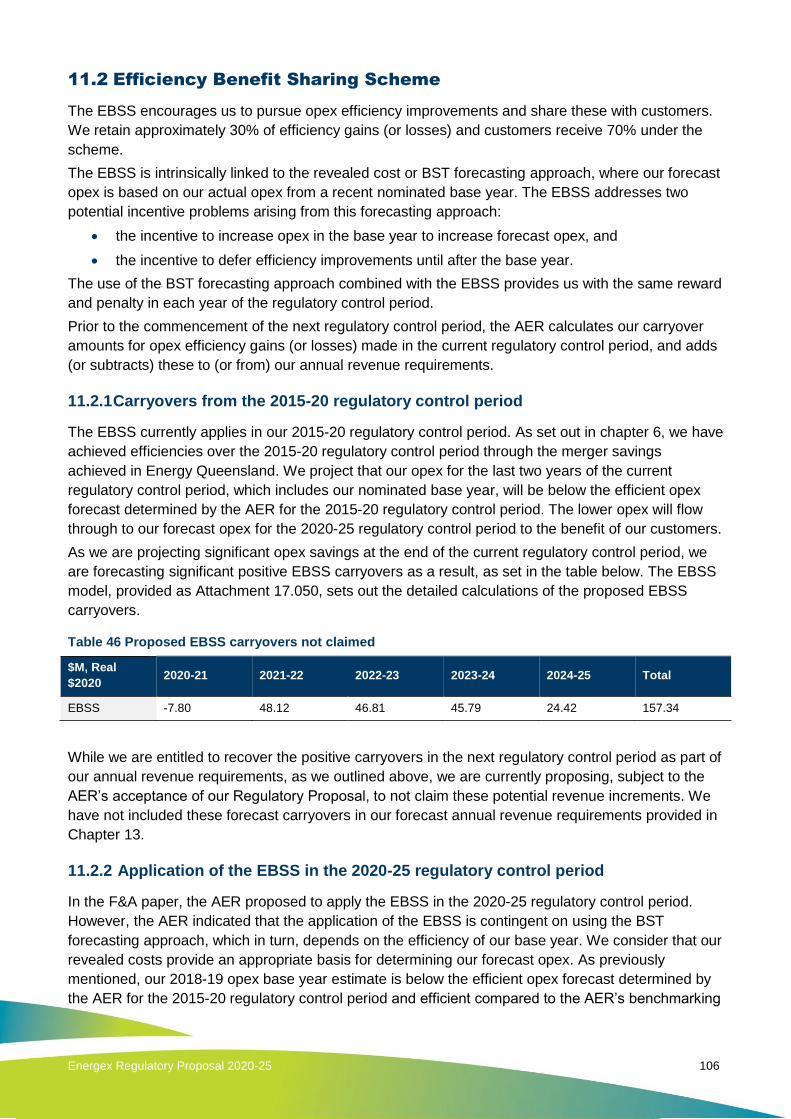
Energex Regulatory Proposal 2020-25 106
11.2 Efficiency Benefit Sharing Scheme
The EBSS encourages us to pursue opex efficiency improvements and share these with customers.
We retain approximately 30% of efficiency gains (or losses) and customers receive 70% under the
scheme.
The EBSS is intrinsically linked to the revealed cost or BST forecasting approach, where our forecast
opex is based on our actual opex from a recent nominated base year. The EBSS addresses two
potential incentive problems arising from this forecasting approach:
the incentive to increase opex in the base year to increase forecast opex, and
the incentive to defer efficiency improvements until after the base year.
The use of the BST forecasting approach combined with the EBSS provides us with the same reward
and penalty in each year of the regulatory control period.
Prior to the commencement of the next regulatory control period, the AER calculates our carryover
amounts for opex efficiency gains (or losses) made in the current regulatory control period, and adds
(or subtracts) these to (or from) our annual revenue requirements.
11.2.1 Carryovers from the 2015-20 regulatory control period
The EBSS currently applies in our 2015-20 regulatory control period. As set out in chapter 6, we have
achieved efficiencies over the 2015-20 regulatory control period through the merger savings
achieved in Energy Queensland. We project that our opex for the last two years of the current
regulatory control period, which includes our nominated base year, will be below the efficient opex
forecast determined by the AER for the 2015-20 regulatory control period. The lower opex will flow
through to our forecast opex for the 2020-25 regulatory control period to the benefit of our customers.
As we are projecting significant opex savings at the end of the current regulatory control period, we
are forecasting significant positive EBSS carryovers as a result, as set in the table below. The EBSS
model, provided as Attachment 17.050, sets out the detailed calculations of the proposed EBSS
carryovers.
Table 46 Proposed EBSS carryovers not claimed
$M, Real
$2020 2020-21 2021-22 2022-23 2023-24 2024-25 Total
EBSS -7.80 48.12 46.81 45.79 24.42 157.34
While we are entitled to recover the positive carryovers in the next regulatory control period as part of
our annual revenue requirements, as we outlined above, we are currently proposing, subject to the
AER’s acceptance of our Regulatory Proposal, to not claim these potential revenue increments. We
have not included these forecast carryovers in our forecast annual revenue requirements provided in
Chapter 13.
11.2.2 Application of the EBSS in the 2020-25 regulatory control period
In the F&A paper, the AER proposed to apply the EBSS in the 2020-25 regulatory control period.
However, the AER indicated that the application of the EBSS is contingent on using the BST
forecasting approach, which in turn, depends on the efficiency of our base year. We consider that our
revealed costs provide an appropriate basis for determining our forecast opex. As previously
mentioned, our 2018-19 opex base year estimate is below the efficient opex forecast determined by
the AER for the 2015-20 regulatory control period and efficient compared to the AER’s benchmarking

Energex Regulatory Proposal 2020-25 107
models. We consider that we are responding appropriately to the incentives to reduce opex.
Therefore, we support the continued application of the EBSS in the 2020-25 regulatory control
period.
We also support the opex adjustments allowed under version 2 of EBSS, namely adjustments for:
approved pass through amounts or opex for contingent projects
capitalisation policy changes
categories of opex not forecast using a single year revealed cost approach for the regulatory
control period. For the 2020-25 regulatory control period, we propose to exclude debt raising
costs and DMIA, and
inflation.
The table below sets out our proposed opex for the EBSS.
Table 47 Proposed EBSS opex for the 2020-25 regulatory control period
$M, Real $2020 2020-21 2021-22 2022-23 2023-24 2024-25 Total
Adjusted forecast
opex 358.87 356.64 354.77 353.24 351.21 1774.72
Note: Totals may not add due to rounding.
11.3 Capital Expenditure Sharing Scheme
The CESS encourages us to spend capex efficiently over the regulatory control period by rewarding
or penalising us for capex efficiency gains or losses respectively. Similar to the EBSS, we retain 30%
of underspends (or overspends) and customers receive 70%. The AER’s forecast capex is used as a
proxy for efficient capex, and differences between forecast and actual capex approximate efficiency
gains and losses.
11.3.1 CESS outcomes from the 2015-20 regulatory control period
The CESS currently applies in our 2015-20 regulatory control period. As we outlined in Chapter 0, we
are reducing our capex. We are projecting substantial capex savings in the 2015-20 regulatory
control period and are forecasting even lower capex in the 2020-25 regulatory control period. The
capex savings and reductions will ultimately limit our RAB growth and lower network charges over
time.
The CESS revenue increments resulting from our capex savings are provided in following table. The
CESS model, provided as Attachment 17.050, sets out the detailed calculations of the proposed
CESS rewards.
Table 48 Proposed CESS payments not claimed
$M, Real
$2020 2020-21 2021-22 2022-23 2023-24 2024-25 Total
CESS 21.39 21.39 21.39 21.39 21.39 106.97
While we are entitled to recover the positive carryovers in the next regulatory control period as part of
our annual revenue requirements, as we outlined above, we are currently proposing, subject to the
AER’s acceptance of our Regulatory Proposal, to not claim these potential revenue increments. We
have not included these forecast rewards in our forecast annual revenue requirements provided in
Chapter 13.

Energex Regulatory Proposal 2020-25 108
11.3.2 Application of the CESS in the 2020-25 regulatory control period
In the F&A paper, the AER proposed to apply the CESS in the 2020-25 regulatory control period. We
support the continued application of the CESS, together with the use of forecast depreciation in the
2020-25 regulatory control period.
11.4 Service Target Performance Incentive Scheme
The STPIS encourages us to maintain and improve service performance where customers are willing
to pay. The AER’s STPIS comprises two mechanisms:
a service incentive factor (s-factor) where we are rewarded and penalised for better or worse
performance against set targets via annual adjustments to our approved revenues, and
a GSL payments scheme that provides payments directly to customers where certain levels of
service are not met.
Currently, as a result of the operation of the Queensland GSL scheme, which is administered by the
QCA, only the s-factor component of the STPIS applies to us.
In the F&A paper, the AER proposed to apply to continue to apply the STPIS in the 2020-25
regulatory control period. The STPIS has applied in Queensland since 2010 and we have
consistently delivered great service performance for our customers as evidenced by our
outperformance of STPIS targets. We therefore support the AER’s proposal including the following
aspects of the STPIS:
retaining a revenue at risk of ±2%
segmenting our network as CBD, urban and short-rural
applying the following s-factor parameters:
o reliability component: SAIDI and SAIFI
o customer service component: telephone answering
setting our performance targets based on our average performance over the past 5 years
applying the methodology indicated in the national STPIS for excluding certain events from
the s-factor calculations
applying the methodology indicated in the national STPIS and the Australian Energy Market
Operator’s (AEMO) 2014 Value of Customer Reliability (VCR) study for calculating incentive
rates, and
excluding the GSL component of the STPIS.
Lastly, we note that on 14 November 2018, the AER published its revised STPIS. We support the
application of the revised STPIS and have developed our STPIS targets and incentive rates largely
consistent with revised STPIS as outlined in Attachment 11.007.
11.5 Demand Management Incentive Scheme and Innovation
Allowance Mechanism
The NER provides for a demand management incentive framework to encourage us to pursue
demand management (i.e. non-network solutions). In December 2017, the AER published the:
new Demand Management Incentive Scheme, which is designed to encourage us to
undertake efficient expenditure on relevant non-network options relating to demand
management. The new scheme has three key elements:

Energex Regulatory Proposal 2020-25 109
o a cost uplift (of up to 50 per cent) on expected costs of efficient demand management
projects
o a net benefit constraint, which ensures that incentive payments for any project do not
exceed the project’s expected net benefit
o an overall incentive constraint, which limits the total incentive in any year to 1 per cent of
our annual revenues.
revised Demand Management Innovation Allowance Mechanism (DMIAM), which provide us
with funding for research and development (R&D) in demand management projects that have
the potential to reduce long term network costs. The revised DMIAM is similar in design to the
AER’s current DMIA. It provides an ex-ante R&D allowance and any underspend of the
allowance is returned to customers in the following regulatory control period.
In the F&A paper, the AER proposed to apply the new DMIS and the revised DMIAM. We support the
AER’s position. Further, consistent the revised DMIAM approach, we propose the following DMIAM
allowances for the 2020-25 regulatory control period. The calculations are set out in the PTRM
provided as Attachment 8.001.
Table 49 Proposed DMIAM allowances for the 2020-25 regulatory control period
$M, Real
$2020 2020-21 2021-22 2022-23 2023-24 2024-25 Total
DMIAM 1.11 1.11 1.11 1.12 1.13 5.58
11.6 Supporting documentation
The following documents supporting this chapter accompany our Regulatory Proposal:
Name Ref File name
Application of Incentive Schemes 11.001 EGX 11.001 Application of Incentive
Schemes JAN19 PUBLIC
STPIS Targets and Incentive Rates 11.007 EGX 11.007 STPIS Targets and
Incentive Rates JAN19 PUBLIC
2020-25 Efficiency Benefit Sharing Scheme RIN template
17.050 EGX 17.050 2020-25 Efficiency Benefit Sharing Scheme RIN template JAN19 PUBLIC

Energex Regulatory Proposal 2020-25 110
12. Pass through events and contingent projects
12.1 Overview
We operate in an uncertain environment where events outside of our control can materially change
our costs over the 2020-25 regulatory control period. It is virtually impossible for us to estimate now
the efficient costs of responding to such events; therefore, we exclude them from our forecasts.
However, in limited circumstances, the NER allows for our revenues to be adjusted if and when such
events occur over the course of the 2020-25 regulatory control period. The AER tests these
applications and reviews our efficient costs at that time.
This ensures that customers only pay for costly events that actually occur and when the efficient
costs can be estimated with reasonable certainty.
The mechanisms in the NER used to manage uncertainty comprise:
Pass through events – which enable us to recover (or pass through) costs of defined,
unpredictable, high costs events not provided for in the Distribution Determination. The NER
prescribe the following events as pass through events for a regulatory control period:
o a regulatory change event
o a service standard event
o a tax change event, and
o a retailer insolvency event.
In addition, we are allowed to nominate additional events as pass through events as part of
our Regulatory Proposal. For the 2020-25 regulatory control period, we propose the following
four nominated pass through events:
o insurance cap event
o insurer credit risk event
o terrorism event, and
o natural disaster event.
Contingent projects – which enable us to recover the costs of significant network projects only
after pre-defined trigger events occur. We have not identified any contingent projects for the
2020-25 regulatory control period.
Capex reopeners – which enable us to seek a reopening of the Distribution Determination
where an event occurs during a regulatory control period which requires us to undertake
additional capex equivalent to five per cent or more of the RAB for the first year of the
regulatory control period.
12.2 Proposed nominated pass through events
Key Messages
In addition to the prescribed pass through events in the NER, we are nominating the following
pass through events and definitions that have been previously accepted by the AER for other
DNSPs: an insurance cap event; an insurer’s credit risk event; a terrorism event; and a natural
disaster event.
We are not proposing any contingent projects.

Energex Regulatory Proposal 2020-25 111
Table 50 below outlines our proposed nominated pass through events and their respective definitions
for the 2020-25 regulatory control period. These events are consistent with the nominated pass
through events approved by the AER in the current 2015-20 Distribution Determination. However, we
have updated the definitions to be consistent with the AER’s most recent regulatory determinations.
Table 50 Proposed nominated pass through events for 2020-25 regulatory control period
Proposed nominated event Proposed definition for the 2020-25 regulatory control period
Insurance cap An insurance cap event occurs if:
Energex make a claim or claims and receives the benefit of a payment or
payments under a relevant insurance policy,
Energex incur costs beyond the relevant policy limit, and
the costs beyond the relevant policy limit increase the costs to Energex in
providing direct control services
For this Insurance Cap Event:
o a relevant insurance policy is an insurance policy held during the 2020-25
regulatory control period or a previous regulatory control period in which
Energex was regulated, and
o Energex will be deemed to have made a claim on a relevant insurance
policy if the claim is made by a related body corporate of Energex in
relation to any aspects of the network or Energex’s business.
Note for the avoidance of doubt, in assessing an insurance cap event through
application under rule 6.6.1(i), the AER will have regard to:
o the relevant insurance policy for the event, and
o the level of insurance that an efficient and prudent NSP would obtain in
respect of the event.
Insurer credit risk An insurer’s credit risk event occurs if:
An insurer of Energex becomes insolvent, and as a result, in respect of an
existing or potential insurance claim for a risk that was insured by the
insolvent insurer, Energex:
o is subject to a higher or lower claim limit or a higher or lower deductible
than would have otherwise applied under the insolvent insurer’s policy; or
o incurs additional costs associated with self-funding an insurance claim,
which would otherwise have been covered by the insolvent insurer.
Note: In assessing an insurer's credit risk event pass through application, the AER will
have regard to, amongst other things,
Energex's attempts to mitigate and prevent the event from occurring by
reviewing and considering the insurer’s track record, size, credit rating and
reputation.
in the event that a claim would have been made after the insurance provider
became insolvent, whether Energex had reasonable opportunity to insure the
risk with a different provider.
Terrorism Terrorism event means an act (including, but not limited to, the use of force or violence
or the threat of force or violence) of any person or group of persons (whether acting
alone or on behalf of or in connection with any organisation or government), which:
from its nature or context is done for, or in connection with, political, religious,
ideological, ethnic or similar purposes or reasons (including the intention to
influence or intimidate any government and/or put the public, or any section of
the public, in fear), and
increases the costs to Energex in providing direct control services.
Note: In assessing a terrorism event pass through application, the AER will have
regard to, amongst other things:

Energex Regulatory Proposal 2020-25 112
whether Energex has insurance against the event,
the level of insurance that an efficient and prudent NSP would obtain in
respect of the event, and
whether a declaration has been made by a relevant government authority that
an act of terrorism has occurred.
Natural disaster Natural Disaster Event means any natural disaster including but not limited to fire,
flood or earthquake that occurs during the 2020-25 regulatory control period that
increases the costs to Energex in providing direct control services, provided the fire,
flood or other event was not a consequence of the acts or omissions of the service
provider.
Note: In assessing a Natural Disaster Event pass through application, the AER will
have regard to, amongst other things:
whether Energex has insurance against the event,
the level of insurance that an efficient and prudent NSP would obtain in
respect of the event, and
whether a relevant government authority has made a declaration that a
natural disaster has occurred.
In proposing our nominated pass through events, the NER requires us to consider the nominated
pass through events considerations, which are defined in Chapter 10. 9 Furthermore, under the NER,
the AER must consider these considerations in deciding whether or not to accept our proposal.10 In
summary, these considerations are:
whether the event proposed is an event covered by the category of prescribed events in the
NER
whether the nature or type of event can be clearly identified at the time of the Distribution
Determination
whether a prudent service provider could reasonably prevent an event of that nature or type
from occurring or substantially mitigate the cost impact of such an event
whether the relevant service provider could insure against the event, having regard to:
o the availability (including the extent of availability in terms of liability limits) of insurance
against the event on reasonable commercial terms, or
o whether the event can be self-insured on the basis that:
it is possible to calculate the self-insurance premium, and
the potential cost to the relevant service provider would not have a significant
impact on the service provider’s ability to provide network services.
any other matter the AER considers relevant.
We note that, in successive determinations, the AER has sought greater consistency in relation to
nominated pass through events and their respective definitions. In this regard, we consider that the
AER’s reasons for approving our four nominated events above remain appropriate for our 2020-25
regulatory control period, namely that:
the events are not covered by the prescribed events specified in the NER
the nature and type of these events can be clearly identified at the time of the determination
and
9 NER clause 6.5.10(a)
10 NER clause 6.5.10(b)
Energex Regulatory Proposal 2020-25 113
while a prudent service provider could take steps to reduce the likelihood and cost impacts of
these events and could insure or self-insure against them, expenditure beyond a certain level
aimed at completely eliminating the risk is likely to be imprudent or inefficient.
12.3 Application of pass through to SCS and ACS
We propose that the prescribed and nominated pass through events set out above apply to both SCS
and ACS. We consider that this is consistent with the NER, which refers to the provision of direct
control services (i.e. both SCS and ACS) in relation to pass through events.
12.4 Contingent projects
As mentioned above, we do not propose any contingent projects over the 2020-25 regulatory control
period.

Energex Regulatory Proposal 2020-25 114
13. Annual revenue requirements and X-factors
13.1 Overview
Under the NER, our annual revenue requirement (ARR) is calculated using a building block
approach, which estimates our ARR as a build-up of the efficient costs that we face annually in
providing SCS. The building blocks include:
a return on capital allowance which represents benchmark financing costs of investing in our
network. The return on capital is calculated as the rate of return (discussed in chapter 9)
multiplied by our forecast RAB (discussed in chapter 0).
a regulatory depreciation allowance which represents the payback of our investment in the
network (discussed in chapter 0)
an opex allowance, which represents the estimating costs of operating and managing the
network (discussed in chapter 6)
a corporate income tax allowance which represents an estimate of the cost of corporate
income tax faced by a benchmark firm operating our business (discussed in chapter 10), and
revenue adjustments which include adjustments for incentive schemes, shared assets etc.
The ARR is calculated using the AER’s PTRM. After calculating the ARR for each year of the
regulatory control period, the ARRs are ‘smoothed’ to reduce significant variations in revenues (and
ultimately network charges) from year to year. The smoothing of the ARRs is done via the X-factors,
which equalise (in net present value terms) the unsmoothed ARRs and smoothed ARRs.
Key Messages
Our proposed ‘smoothed’ annual revenue requirements (or maximum allowed revenues) and
X-factors, which include a reduction in our revenues and average distribution network
charges in 2020-21, minimise any adverse impacts of the proposed changes and reflect our
customers’ feedback to front-end reductions.
Our proposed ‘smoothed’ total revenue requirement for the 2020-25 regulatory control
period, for the five years 1 July 2020 to 30 June 2025, is $6,541 million (nominal). This
amount reflects the efficient costs of providing our SCS and meeting the safety and service
levels our customers expect and value. It prudently balances cost and price pressures in
future regulatory control periods.
This is $150 million below the Total Revenue in Our Draft Plans that we published in
September 2018.
We are proposing to not claim $264.30 million (real $2020) resulting from our projected
outperformance under the EBSS and CESS in the current 2015-20 regulatory control period.

Energex Regulatory Proposal 2020-25 115
Figure 37 Regulatory building blocks
Figure 38 illustrates the approximate contribution each building block makes to one dollar of our
revenue.

Energex Regulatory Proposal 2020-25 116
Figure 38 Contribution of each building block to SCS revenue
Totals may not add due to rounding
Table 51 shows our proposed ARRs and X factors for our SCS for the 2020-25 regulatory control
period, which are the summation of the building blocks in Table 52. Our proposed X-factors show that
we are proposing a real reduction of 10.25% in our revenues for the first year of the 2020-25
regulatory control period when compared to our expected revenues for the last year of the 2015-20
regulatory control period. Overall, we are proposing to recover $6,541 million over the 2020-25
regulatory control period.
Table 51 Forecast SCS revenue, 2020-21 to 2024-25
$M, Nominal 2020-21 2021-22 2022-23 2023-24 2024-25 Total
Annual revenue requirement
(unsmoothed) 1,233.62 1,262.64 1,305.03 1,349.99 1,394.93 6,546.22
X factors 10.25% 0.00% 0.00% 0.00% 0.00% N/A
Maximum allowed revenue
requirement (smoothed) 1,246.43 1,276.59 1,307.49 1,339.13 1,371.53 6,541.17
Totals may not add due to rounding
Importantly, our proposed X factors mean that forecast smoothed and unsmoothed revenue are
within 3% of each other, which helps reduce any price distortions that may otherwise occur heading
into the 2025-30 regulatory control period.
The detailed calculations are provided in our completed PTRM, which is provided as Attachment
8.001.
13.2 Annual revenue requirements
Table 52shows the building blocks that make up our proposed ARRs and X factors for our SCS for
the 2020-25 regulatory control period. Figure 39 shows the trends in our revenues over the 2015-20
and 2020-25 regulatory control periods, while Figure 40 shows this trend on a per customer basis.

Energex Regulatory Proposal 2020-25 117
Table 52 Forecast SCS revenue by building block, 2020-21 to 2024-25
$M, Nominal 2020-21 2021-22 2022-23 2023-24 2024-25 Total
Return on capital 705.09 716.97 728.93 740.64 751.22 3,642.85
Regulatory depreciation 140.04 131.37 153.21 177.02 202.40 804.04
Opex (including Debt
Raising) 373.20 380.64 387.83 395.51 402.77 1,939.95
Revenue adjustment 1.13 1.16 1.20 1.24 1.28 6.00
Corporate income tax 14.15 32.51 33.86 35.58 37.27 153.37
Annual revenue
requirement (unsmoothed) 1,233.62 1,262.64 1,305.03 1,349.99 1,394.93 6,546.22
X factors 10.25% 0.00% 0.00% 0.00% 0.00% N/A
Maximum allowed revenue
requirement (smoothed) 1,246.43 1,276.59 1,307.49 1,339.13 1,371.53 6,541.17
Totals may not add due to rounding
Figure 39 SCS revenue trend
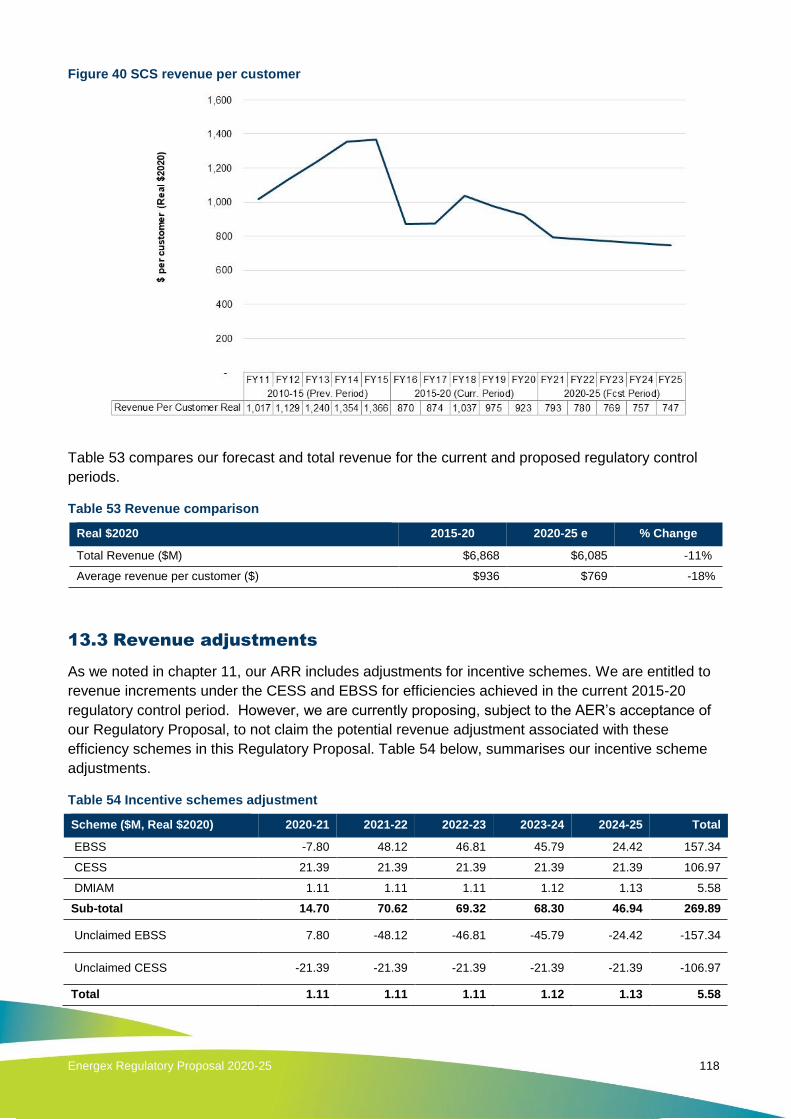
Energex Regulatory Proposal 2020-25 118
Figure 40 SCS revenue per customer
Table 53 compares our forecast and total revenue for the current and proposed regulatory control
periods.
Table 53 Revenue comparison
Real $2020 2015-20 2020-25 e % Change
Total Revenue ($M) $6,868 $6,085 -11%
Average revenue per customer ($) $936 $769 -18%
13.3 Revenue adjustments
As we noted in chapter 11, our ARR includes adjustments for incentive schemes. We are entitled to
revenue increments under the CESS and EBSS for efficiencies achieved in the current 2015-20
regulatory control period. However, we are currently proposing, subject to the AER’s acceptance of
our Regulatory Proposal, to not claim the potential revenue adjustment associated with these
efficiency schemes in this Regulatory Proposal. Table 54 below, summarises our incentive scheme
adjustments.
Table 54 Incentive schemes adjustment
Scheme ($M, Real $2020) 2020-21 2021-22 2022-23 2023-24 2024-25 Total
EBSS -7.80 48.12 46.81 45.79 24.42 157.34
CESS 21.39 21.39 21.39 21.39 21.39 106.97
DMIAM 1.11 1.11 1.11 1.12 1.13 5.58
Sub-total 14.70 70.62 69.32 68.30 46.94 269.89
Unclaimed EBSS 7.80 -48.12 -46.81 -45.79 -24.42 -157.34
Unclaimed CESS -21.39 -21.39 -21.39 -21.39 -21.39 -106.97
Total 1.11 1.11 1.11 1.12 1.13 5.58

Energex Regulatory Proposal 2020-25 119
We have no revenue adjustments arising from control mechanisms this period as per c6.4.3(a)(6) of
the NER, but acknowledge that the AERs F&A paper provides for this.
13.4 Shared assets
The ARR must be reduced when annual unregulated revenues from the use of shared assets (i.e.
those assets in the RAB that are earning both regulated and unregulated revenues) are expected to
be greater than 1% of the total smoothed annual revenue requirement for that regulatory year.
The information provided in our RIN response demonstrates that the materiality threshold was not
reached – the current forecast is 0.6%. As a result, no revenue reductions have been included for
shared assets during the 2020-25 regulatory control period.
13.5 X Factors
In proposing our X-factors, we considered the requirement in the NER that the unsmoothed and
smoothed ARR must be reasonably close. We note that in previous regulatory determinations the
AER has considered a difference of about 3 per cent or less to be reasonable, and that during our
customer consultations we received a clear message from customers seeking the front-loading of
any tariff reductions. We have implemented the approach favoured by our customers and note that
the forecast revenue difference of 1.68% is within the AER threshold.

Energex Regulatory Proposal 2020-25 120
14. Indicative distribution network charges and bill impacts
14.1 Our Network Pricing Principles
We understand how critical distribution network bill impacts are for customers and we have
established clear principles by which we set network tariffs for our customers. These include:
Affordability – ensuring we continue to put downward pressure on our component of
customers’ electricity bills through network tariffs that represent value for money
Economic efficiency – our tariffs signal the economic costs of providing distribution services
to the market
Customer impacts – we manage changes that are expected to affect customer bills for
example progressive deployment of changes to avoid bill shock
Simplicity and transparency – we offer customers a clear and simple tariff structure
Flexibility – we provide innovative tariffs that support customer choice and control
Fairness – similar customers pay similar distribution network charges and charges reflect the
impact of customer usage and technology decisions on network costs
Stability – bills should remain reasonably predictable and avoid price shocks
Sustainability – supports the energy trilemma strategy, and
Compliance – our tariffs comply with all relevant regulations and the NER.
Following consultation with our customers discussed in chapter 2, we have prepared a set of
indicative network tariffs that conform to the pricing principles in the NER and are based on the
revenues set out in chapter 13 of this Regulatory Proposal. Our TSS sets out how we have complied
with the pricing principles in the NER. Our indicative network tariffs embody the above principles and
the clear feedback provided by customers on our proposed network tariffs and tariff structures for the
2020-25 regulatory control period. As discussed in chapter 2, this feedback was received through:
a series of customer forums held throughout 2018,
a formal customer survey, and
feedback received via www.talkingenergy.com.au
Key Messages
Our planned tariff designs respond to customer specific feedback and incorporate:
Fairer price structures that emphasis simplicity and clarity
Greater customer choice and control in tariff selection
Efficient tariffs leading to efficient investment – more affordable outcomes and downward
pressure on network charges
Awareness of customer impact when introducing new cost reflective tariffs
The introduction of TEDI (Tariffs, Education, Dynamic Incentives and Information) to ensure a
smooth transition
Reduced and eventually eliminate cross-subsidies between and within customer classes
Tariffs that fairly and equitably represent the cost accessing our network services.
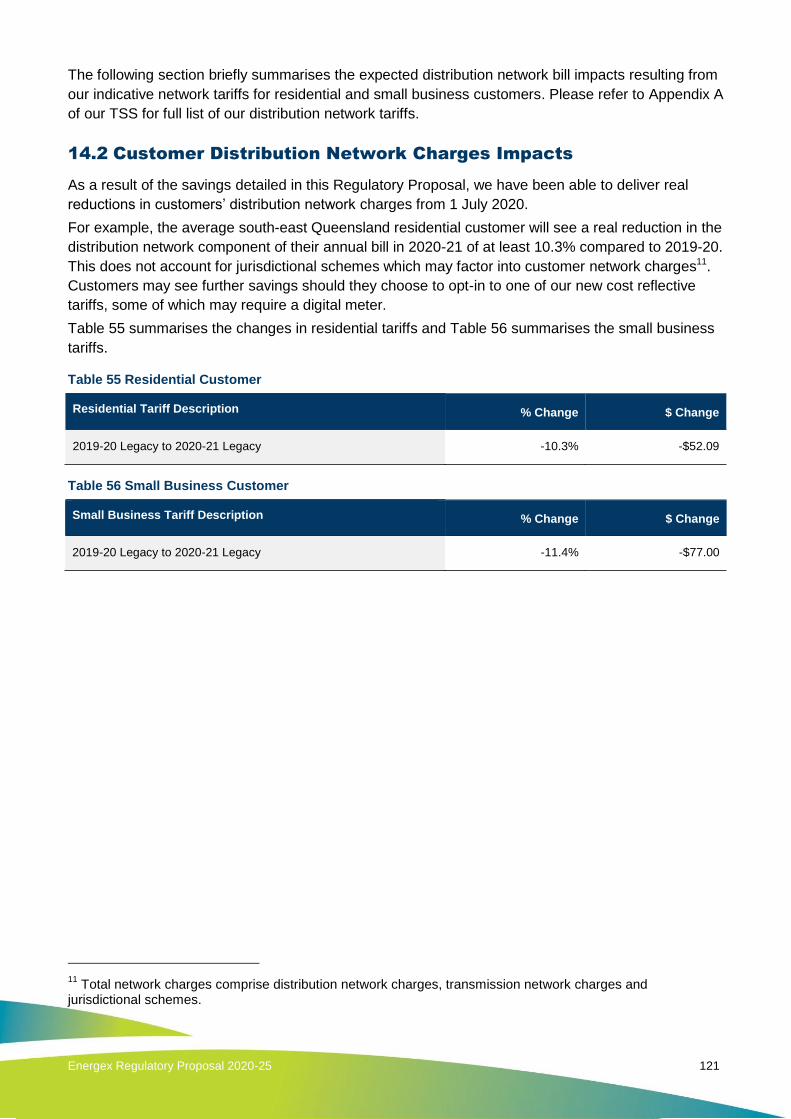
Energex Regulatory Proposal 2020-25 121
The following section briefly summarises the expected distribution network bill impacts resulting from
our indicative network tariffs for residential and small business customers. Please refer to Appendix A
of our TSS for full list of our distribution network tariffs.
14.2 Customer Distribution Network Charges Impacts
As a result of the savings detailed in this Regulatory Proposal, we have been able to deliver real
reductions in customers’ distribution network charges from 1 July 2020.
For example, the average south-east Queensland residential customer will see a real reduction in the
distribution network component of their annual bill in 2020-21 of at least 10.3% compared to 2019-20.
This does not account for jurisdictional schemes which may factor into customer network charges11.
Customers may see further savings should they choose to opt-in to one of our new cost reflective
tariffs, some of which may require a digital meter.
Table 55 summarises the changes in residential tariffs and Table 56 summarises the small business
tariffs.
Table 55 Residential Customer
Residential Tariff Description % Change $ Change
2019-20 Legacy to 2020-21 Legacy -10.3% -$52.09
Table 56 Small Business Customer
Small Business Tariff Description % Change $ Change
2019-20 Legacy to 2020-21 Legacy -11.4% -$77.00
11
Total network charges comprise distribution network charges, transmission network charges and jurisdictional schemes.

Energex Regulatory Proposal 2020-25 122
14.3 Supporting documentation
The following documents supporting this chapter accompany our Regulatory Proposal:
Name Ref File name
2020-25 Tariff Structure Statement 14.001 EGX 14.001 2020-25 Tariff Structure
Statement JAN19 PUBLIC
2020-25 TSS Explanatory Notes 14.003 EGX 14.003 2020-25 TSS Explanatory
Notes JAN19 PUBLIC
2020-25 TSS Overview 14.006 EGX 14.006 2020-25 TSS Overview
JAN19 PUBLIC
2020-25 LRMC Model 14.008 EGX 14.008 2020-25 LRMC Model
JAN19 PUBLIC
Tariff Structure Statement 2020-25
Engagement Summary 14.010
EGX ERG 14.010 2020-25 TSS
Engagement Summary JAN19 PUBLIC

Energex Regulatory Proposal 2020-25 123
Part C - Alternative Control Services

Energex Regulatory Proposal 2020-25 124
15. Alternative Control services
15.1 Overview
ACS are customer specific or customer requested services. In its F&A paper, the AER classified the
following customer specific services / services group as ACS:
Public lighting
Type 6 Metering services
Auxiliary metering services
Connection management services
Enhanced connection services, and
Network ancillary services.
As discussed in chapter 6, we accept the AER’s service classification of the above services as ACS.
This chapter summarises our proposal for ACS as follows:
Limited building block Type 6 metering services
Limited building block public lighting services, and
Fee-based and quoted services for the remaining ACS.
Our detailed proposals for ACS are provided in Attachment 15.005
15.2 Type 6 Metering services
Under the AEMC’s POC reforms, metering contestability came into full effect on 1 December 2017.
This reform transferred the responsibility for the provision of meters to a Metering Coordinator (MC).
New and replacement meters are now provided by competitive MCs and are chosen by customers in
conjunction with their electricity retailer.
Metering Services - Key Messages
Under the AEMC’s Power of Choice (POC), the provision of new and replacement
meters is fully contestable and is facilitated by retailers on behalf of customers. We
no longer install new or replacement meters. The POC Reforms cover most of
Queensland including all areas under the NER metering rules. There are some
areas not covered by the NER and these areas are therefore designated as POC-
exempt areas.
We continue to provide Type 6 legacy metering services (i.e. the maintenance,
reading and data services associated with the legacy meters) and to recover the
capital costs of metering equipment installed prior to 1 December 2017.
Our proposed ‘unsmoothed’ total revenue requirement for metering services for the
2020-25 regulatory control period is $326.33 million (Nominal).

Energex Regulatory Proposal 2020-25 125
As the Responsible Person12 as at 1 December 2017, we inherited the role of MC for customers with
Type 6 meters and will continue to provide the following metering services:
recovery of capital costs of Type 6 meters installed prior to 1 December 2017
meter maintenance – works to inspect, test, maintain, repair and replace meters
meter reading – quarterly or other regular reading of the meter, and
meter data services – collection, processing, storage, delivery and management of metering
data, remote or self-reading at difficult to access sites, provision of metering data from
previous two years and ongoing provision of metering data.
We prepared our Meter Asset Management Plan (MAMP) in accordance with AEMO’s requirements.
This sets out our plan for the installation, replacement, testing and inspection of metering installations
for which we are responsible. A copy of our MAMP is provided in Attachment 15.001.
We forecast that over the 2020-25 regulatory control period, there will be a churn or roll-off of 3% per
annum of our Type 6 customers to contestable providers. However, the displaced meters remain part
of our metering asset base.
We have adopted a limited building block approach to determine the revenue requirement for our
metering services. We have applied the same rate of return for metering services as for SCS and we
have adopted the AER’s PTRM straight-line depreciation approach. Our forecast revenue for the
2020-25 regulatory control period is shown in Table 57.
Table 57 Forecast Metering Service Revenue
$M, Nominal 2020-21 2021-22 2022-23 2023-24 2024-25 Total
Return on capital 18.50 17.14 15.71 14.23 12.68 78.26
Regulatory depreciation 24.61 26.16 27.79 29.52 30.62 138.70
Opex (including Debt Raising) 19.68 19.62 19.60 19.58 19.58 98.06
Revenue adjustment - - - - - -
Corporate income tax 1.94 2.04 2.15 2.35 2.40 10.89
Annual revenue requirement
(unsmoothed) 64.73 64.96 65.25 65.69 65.28 325.91
X factors (Non-Capital) -8.01% 0.00% 0.00% 0.00% 0.00% 0.00%
X factors (Capital) 7.46% 0.00% 0.00% 0.00% 0.00% 0.00%
Maximum allowed revenue
requirement (smoothed) 63.37 64.29 65.24 66.21 67.22 326.33
Totals may not add due to rounding.
We apply a price cap control mechanism for our ACS metering services, in the form of a daily
metering services charge for each tariff. As for the 2015-20 regulatory control period, metering
services’ revenue will be recovered through the following tariffs:
Primary tariffs
Controlled load tariffs, and
Solar tariffs.
12
Clause 11.86.7 - On and from the effective date, a Local Network Service Provider that was the responsible person for a type 5 or 6 metering installation connected to, or proposed to be connected to, the Local Network Service Provider's network under clause 7.2.3(a)(2) of old Chapter 7 or clause 9.9C.3 immediately before the effective date must be appointed as the Metering Coordinator by the financially responsible Market Participant.

Energex Regulatory Proposal 2020-25 126
Further, we have established separate price for capital and non-capital components of the metering
services costs. This allows flexibility for separate service components to be removed when a
customer appoints an alternative provider to deliver part of the Type 6 metering service. Metering
services revenue will be recovered across the applicable tariffs in Table 58. Further information on
the tariffs is set out in our TSS.
Table 58 Metering service tariffs
Cent per day, Nominal 2020-21 2021-22 2022-23 2023-24 2024-25
Primary Tariff - Non- Capital Charge 3.358 3.439 3.522 3.607 3.695
Primary Tariff - Capital Charge 6.587 6.746 6.909 7.077 7.248
Controlled Load Tariff - Non- Capital Charge 1.007 1.032 1.057 1.082 1.108
Controlled Load Tariff - Capital Charge 1.976 2.024 2.073 2.123 2.174
Solar PV Tariff - Non- Capital Charge 2.350 2.407 2.466 2.525 2.586
Solar PV Tariff - Capital Charge 4.611 4.722 4.837 4.954 5.074
15.3 Public Lighting Services
We have approximately 372,000 public lights connected to our distribution network in south-east
Queensland. Our major customers for public lighting are the 12 local government authorities in our
distribution area, the Department of Transport and Main Roads and other Government entities, such
as Queensland Rail.
The key issue for the 2020-25 regulatory control period is the rate of roll out of LEDs in south-east
Queensland. Based on feedback from customers, we are proposing a moderate acceleration of our
LED replacement program to achieve a target of 47% LED penetration by 2020. For the 2020-25
regulatory control period, we will introduce LED specific tariffs to encourage the conversion to this
Public Lighting Services - Key Messages
With customer support, we are forecasting 47% of our total public lighting portfolio
to be LEDs by the end of the 2020-25 regulatory control period.
We are proposing to introduce LED-specific public lighting tariffs for each of the
four public lighting categories and a new public lighting tariff category (NPL4) for
customer funding of NPL1 upgrades to LED luminaire and lamps.
We are aligning the approach of NPL2 tariffs to the methodology used by Ergon
Energy, whereby a modest allocation of capital is included in the NPL2 tariffs.
Our proposed total revenue requirement for public lighting services for the 2020-25
regulatory control period is $210.11 million (nominal). This is 9.8% lower than the
revenue we expect to recover from public lighting services in the current regulatory
control period.

Energex Regulatory Proposal 2020-25 127
new energy efficient technology. Combined with communication capabilities and smart city
applications, public lights have the potential to be smarter, more environmentally friendly and can
provide opportunities for customers to make savings in energy and network costs.
We have used a limited building block approach to determine annual revenue requirements.
Consistent with our proposal to introduce separate tariffs for LEDs, we have prepared two separate
PTRMs:
a conventional public lighting PTRM covering the conventional Public Lighting Asset Base
(PLAB), used to calculate the conventional public lighting tariffs, and
a LED public lighting PTRM covering the LED PLAB, used to calculate the LED public lighting
tariffs.
We have applied the same rate of return for public lighting services as for our SCS and have adopted
the AER’s PTRM straight-line depreciation. The tax allowance for public lighting is spread across
both PTRMs.
Our total forecast public lighting revenue for the 2020-25 regulatory control period is provided in
Table 59 for conventional lights and Table 60 for LEDs.
Table 59 Forecast Conventional Public Lighting Revenue
$M, Nominal 2020-21 2021-22 2022-23 2023-24 2024-25 Total
Return on capital 8.07 7.62 7.08 6.46 5.75 34.96
Regulatory depreciation 9.76 10.26 10.66 10.92 10.44 52.03
Opex (including Debt
Raising) 16.89 16.64 15.68 14.39 12.71 76.31
Revenue adjustment - - - - - -
Corporate income tax - - - - - -
Annual revenue
requirement
(unsmoothed)
34.71 34.52 33.42 31.77 28.89 163.31
X factors 0.00% 0.00% 0.00% 0.00% 0.00% n/a
Maximum allowed
revenue requirement
(smoothed)
38.02 37.47 35.41 32.71 29.28 172.89
Table 60 Forecast LED Public Lighting Revenue
$M, Nominal 2020-21 2021-22 2022-23 2023-24 2024-25 Total
Return on capital 0.43 1.24 2.02 2.86 3.76 10.30
Regulatory depreciation 0.52 1.18 2.07 3.20 4.44 11.42
Opex (including Debt
Raising) 0.74 1.32 2.25 3.49 4.97 12.77
Revenue adjustment - - - - - -
Corporate income tax 2.41 2.42 2.50 2.58 2.68 12.59
Annual revenue
requirement
(unsmoothed)
4.10 6.16 8.84 12.12 15.84 47.07
X factors 0.00% 0.00% 0.00% 0.00% 0.00% n/a
Maximum allowed
revenue requirement
(smoothed)
1.87 3.61 6.68 10.35 14.71 37.22
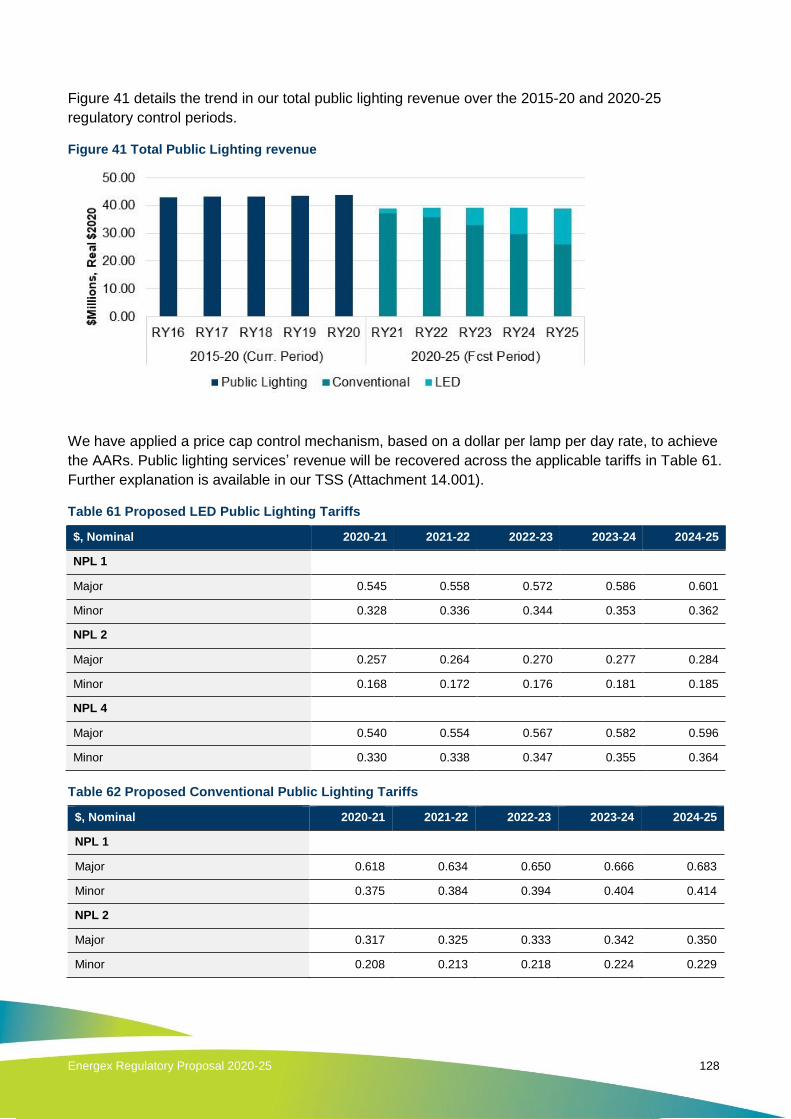
Energex Regulatory Proposal 2020-25 128
Figure 41 details the trend in our total public lighting revenue over the 2015-20 and 2020-25
regulatory control periods.
Figure 41 Total Public Lighting revenue
We have applied a price cap control mechanism, based on a dollar per lamp per day rate, to achieve
the AARs. Public lighting services’ revenue will be recovered across the applicable tariffs in Table 61.
Further explanation is available in our TSS (Attachment 14.001).
Table 61 Proposed LED Public Lighting Tariffs
$, Nominal 2020-21 2021-22 2022-23 2023-24 2024-25
NPL 1
Major 0.545 0.558 0.572 0.586 0.601
Minor 0.328 0.336 0.344 0.353 0.362
NPL 2
Major 0.257 0.264 0.270 0.277 0.284
Minor 0.168 0.172 0.176 0.181 0.185
NPL 4
Major 0.540 0.554 0.567 0.582 0.596
Minor 0.330 0.338 0.347 0.355 0.364
Table 62 Proposed Conventional Public Lighting Tariffs
$, Nominal 2020-21 2021-22 2022-23 2023-24 2024-25
NPL 1
Major 0.618 0.634 0.650 0.666 0.683
Minor 0.375 0.384 0.394 0.404 0.414
NPL 2
Major 0.317 0.325 0.333 0.342 0.350
Minor 0.208 0.213 0.218 0.224 0.229

Energex Regulatory Proposal 2020-25 129
15.4 Other Alternative Control Services
In addition to the Type 6 metering services and public lighting services, we accept the AER’s
proposal to classify the following other services as ACS:
auxiliary metering services
ancillary public lighting services
connection management services
enhanced connection services, and
ancillary network services.
These services share the common characteristic of being non-routine services provided to an
individual customer on an ‘as needs’ basis.
It is noted that the AER, has reclassified a number of specific network ancillary services from
unregulated to ACS, including:
network related property services
provision of training to third party for network related access, and
provision of security lights.
Unlike Type 6 metering services and public lighting services, where annual revenue requirements
can be calculated using the limited building block, these other ACS will be based on a cost build-up
approach.
The cost build-up approach used to determine the prices for these ACS is specified by the formula
below:
Price = Labour + Contractor Services + Materials + Capital Allowance
Pricing arrangements will be fee-based, or quoted, depending on the characteristics of the service.
Full details of the proposed fee and quoted services and indicative prices are as set out in our
Proposed 2020-25 TSS and the accompanying Explanatory Notes at Attachment 14.001 and
Attachment 14.003.
Other ACS - Key Messages
Fee based services are generally predictable in scope and do not vary greatly between
customers or retailers, whereas quoted services depend on the scope of a customer or
retailer’s request. Prices can be set for fee-based services, but It is not practical to set
individual fees for quoted services as the costs vary significantly on a project-by-project
basis.
We are proposing changes to our service descriptions for our other ACS to improve clarity
and consistency with Ergon Energy.
We have based our prices on:
o internal labour rates approved by the AER for the current regulatory control period and
escalated to 2020-21
o 2020-21 costs for contractor costs, overheads and materials, and
o task time, crew size and labour type derived from historical practice and internal
assessments.
o

Energex Regulatory Proposal 2020-25 130
15.5 Supporting documentation
The following documents supporting this chapter accompany our Regulatory Proposal:
Name Ref File name
Meter Asset Management Plan 15.001 EGX 15.001 Meter Asset Management Plan OCT18 PUBLIC
Asset Management Plan Public Lighting 15.003 EGX ERG 15.003 Asset Management Plan Public Lighting OCT18 PUBLIC
Public Lighting Strategy 15.004 EGX ERG 15.004 Public Lighting Strategy OCT18 PUBLIC
Alternative Control Services 15.005 EGX 15.005 Alternative Control Services JAN19 PUBLIC
Capex forecast – ACS metering 15.007 EGX 15.007 Capex forecast – ACS metering JAN19 PUBLIC
Fee-based and quoted services model – ACS
15.009
EGX ERG 15.009 Fee-based and quoted services model – ACS JAN19 PUBLIC
Opex forecast – ACS metering 15.010 EGX 15.010 Opex forecast – ACS metering JAN19 PUBLIC
Opex forecast – ACS public lighting CON 15.012 EGX 15.012 Opex forecast – ACS public lighting CON JAN19 PUBLIC
Opex forecast – ACS public lighting LED 15.014 EGX 15.014 Opex forecast – ACS public lighting LED JAN19 PUBLIC
PTRM – ACS metering 15.016 EGX 15.016 PTRM – ACS metering JAN19 PUBLIC
PTRM – ACS public lighting CON 15.018 EGX 15.018 PTRM – ACS public lighting CON JAN19 PUBLIC
PTRM – ACS public lighting LED 15.020 EGX 15.020 PTRM – ACS public lighting LED JAN19 PUBLIC
RFM – ACS metering 15.022 EGX 15.022 RFM – ACS metering JAN19 PUBLIC
RFM – ACS public lighting CON 15.024 EGX 15.024 RFM – ACS public lighting CON JAN19 PUBLIC
RFM – ACS public lighting LED 15.026 EGX 15.026 RFM – ACS public lighting LED JAN19 PUBLIC
Metering pricing model - ACS 15.028 EGX ERG 15.028 Metering pricing model - ACS JAN19 PUBLIC
Public lighting LED and Conventional Pricing model - ACS
15.029
EGX 15.029 Public lighting LED and Conventional Pricing model - ACS JAN19 PUBLIC

Energex Regulatory Proposal 2020-25 131
Part D – Other Matters

Energex Regulatory Proposal 2020-25 132
16. Other Matters
16.1 Negotiating framework
The AER’s F&A paper did not propose any negotiated distribution services. We agree with the AER
that none of our current services are suited to being classified as negotiated distribution services.
Nevertheless, in accordance with clauses 6.7.5 and 6.8.2(c)(5) of the NER, we are required to
provide a negotiating framework outlining the process that we would follow in negotiating the terms
and conditions of any prospective negotiated distribution services with other parties.
Our negotiating framework for the 2020-25 regulatory control period is provided in Attachment
16.005.
16.2 Jurisdictional Schemes
In accordance with the AER, we have excluded the costs of jurisdictional schemes from our forecasts
as they do not form part of our ARR or distribution network charges.
16.3 Confidential information
In accordance with clause 6.14 of the NER and the AER’s Confidentiality Guideline, we have
completed a confidentiality template at Attachment 16.001 of this Regulatory Proposal that details the
matters for which we are claiming confidentiality.
Key Messages
We support the AER’s decision not to classify any distribution services as negotiated
distribution services, as outlined in its F&A paper.
Regardless, clause 6.8.2(c)(5) of the NER requires us to submit a negotiating framework as
part of our Regulatory Proposal. Should the AER depart from the F&A paper and classify
certain services as negotiated distribution services in the final determination, then the
negotiating framework provided in Attachment 16.005 will apply.
Our objective is to maximise the transparency of our Regulatory Proposal. We have
therefore minimised the number of confidential documents that we have submitted to the
AER.
We have addressed the requirements of the AER’s Confidentiality Guideline for the matters
for which we are claiming confidentiality.
Our directors have provided a certification statement for our key assumptions for capex and
opex.
Our Chief Executive has made a statutory declaration attesting to the information provided
in our response to the AER’s RIN.

Energex Regulatory Proposal 2020-25 133
16.4 Governance, assurance and certifications
16.4.1 Certification statement
Schedules 6.1.1(5) and 6.1.2(6) of the NER require our directors to certify the key assumptions that
underlie our capex and opex forecasts. Our key assumptions for:
opex are set out in section 6.4, and
capex are set out in section 7.4.
Our certification statement is provided as Attachment 16.003 to this Regulatory Proposal.
16.4.2 Statutory declaration by Chief Executive
The AER’s Reset RIN requires an officer of Energex to make a statutory declaration attesting to the
information provided in response to that notice.
The statutory declaration made by our Chief Executive is provided as Attachment 17.019 to this
Regulatory Proposal.
16.4.3 Compliance checklist
We have completed a compliance checklist, which demonstrates how we have complied with the
requirements of the NER and the RIN. This is provided at Attachment 16.004.
16.5 Supporting documentation
The following documents supporting this chapter accompany our Regulatory Proposal:
Name Ref File name
Confidentiality template 16.001 EGX 16.001 Confidentiality template
JAN19 PUBLIC
Key capex and opex assumptions
certification 16.003
EGX ERG 16.003 Key capex and opex
assumptions certification JAN19
PUBLIC
NER cross-reference compliance checklist 16.004
EGX ERG 16.004 NER cross-
reference compliance checklist
JAN19 PUBLIC
Negotiating framework 16.005 EGX 16.005 Negotiating framework
JAN19 PUBLIC
Regulation and Legislation foreseen
changes summary 16.007
EGX ERG 16.007 Regulation and
Legislation foreseen changes
summary JAN19 PUBLIC

Energex Regulatory Proposal 2020-25 134
16.6 Abbreviations
The following abbreviations are used in this Regulatory Proposal:
Acronym/Abbreviation Meaning
$, nominal These are nominal dollars of the day
$real2019-20 These are dollar terms as at 30 June 2020
2020-25 regulatory control period The regulatory control period commencing 1 July 2020 and ending 30 Jun 2025
ACCC Australian Competition and Consumer Commission
ACS Alternative Control Service
AEMC Australian Energy Market Commission
AEMO Australian Energy Market Operator
AER Australian Energy Regulator
ARR Annual Revenue Requirement
ATO Australian Taxation Office
Augex Augmentation capital expenditure
Bppa Basis points per annum
BST Base Step Trend
CAM Cost allocation method
Capex Capital expenditure
CBD Central business district
CBRM Condition Based Risk Management
CESS Capital efficiency sharing scheme
Connex Connections expenditure
CPI Consumer Price Index
Current regulatory control period
or current period Regulatory control period 1 July 2015 to 30 June 2020
CWIP capital works in progress
DAE Deloitte Access Economics
DAPR Distribution Annual Planning Report
DEBBS ICT & Digital Enterprise Building Blocks
DER Distributed energy resources
DMIA Demand management incentive allowance
DMIAM Demand management innovation allowance mechanism
DMIS Demand management incentive scheme
DNRME Department of Natural Resources, Mines and Energy
DNSP Distribution Network Service Provider
EBSS Efficiency benefits sharing scheme

Energex Regulatory Proposal 2020-25 135
Acronym/Abbreviation Meaning
EDSD Electricity Distribution Service Delivery
EG Embedded generator
ENA Energy Networks Australia
ENCAP Electricity Network Capital Program
EV Electric vehicles
F&A Framework and Approach
FiT Feed-in Tariff (Solar FiT) under the Queensland Solar Bonus Scheme
GSL Guaranteed service level
GSP Gross State Product
GWH gigawatt hours
HV High voltage
ICT Information communication technology
JMTC Joint Energex and Ergon Energy Market Transaction Centre
kV kilovolt
kVA Kilovolt ampere
kW Kilowatt
kWh kilowatt hour
LCC Large Customer Connection
LED Light emitting diode
LV Low voltage
MAMP Meter Asset Management Plan
MAR Maximum allowed revenue
MC Metering coordinator
MED Major event day
MPFP Multilateral partial factor productivity
MPLS Multiprotocol Label Switching
MSS Minimum Service Standard
MTFP Multilateral total factor productivity
MW megawatt
MYFER Mid-year fiscal and economic review
NECF National Energy Customer Framework
NEL National Electricity Law
NEM National Electricity Market
NEO National Electricity Objective

Energex Regulatory Proposal 2020-25 136
Acronym/Abbreviation Meaning
NER National Electricity Rules (or Rules)
Next regulatory control period or
forecast period The regulatory control period commencing 1 July 2020 and ending 30 Jun 2025
NMI National Metering Identifier
NNA Non-network alternatives
NPL Network Public Lighting
NSP Network Service Provider
O&M Operating and Maintenance Allowance (Opex)
OEF Operating environment factor
Opex Operating and Maintenance Expenditure
PDH Plesiochronous Digital Hierarchy
PLAB Public lighting asset base
POC Power of Choice
POE Probability of exceedance
Previous regulatory control
period or previous period Regulatory control period 1 July 2010 to 30 June 2015
PTRM Post-tax revenue model
PV Photovoltaic (Solar PV)
QCA Queensland Competition Authority
R&D Research and development
RAB Regulatory Asset Base
RBA Reserve Bank of Australia
Regulatory Proposal Energex or Ergon Energy's proposal for the next regulatory control period
submitted under clause 6.8 of the NER
Repex Replacement capital expenditure
RFM Roll forward model
RIN Regulatory Information Notice
RIT-D Regulatory Investment Test - Distribution
RP-TSS Working Group Regulatory Proposal - Tariff Structure Statement Working Group
SAC Standard Asset Customers
SAIDI System Average Interruption Duration Index
SAIFI System Average Interruption Frequency Index
SBS Solar Bonus Scheme
SCADA Supervisory Control and Data Acquisition
SCS Standard Control Service
SPARQ SPARQ Solutions

Energex Regulatory Proposal 2020-25 137
Acronym/Abbreviation Meaning
SSIS Small Scale Incentive Scheme
STPIS Service target performance incentive scheme
TEDI Tariffs, Education, Dynamic Incentives and Information
Totex Total expenditure
TSS Tariff Structure Statement
UDMS Unified distribution management system
Unified ERM EAM Unified Enterprise Resource Planning and Enterprise Asset Management system
VCR Value of customer reliability
WACC Weighted average cost of capital
WARL Weighted average remaining life