enel chile 2019-2021 strategic plan
TRANSCRIPT
Enel ChileStrategic Plan 2019-21
Paolo PallottiCEO
Marcelo De JesusCFO

Paolo Pallotti (CEO)
2018 Enel Chile Today
2019-21 Our Pillars
Marcelo De Jesus (CFO)
Financial management
Earnings & targets
Capital allocation
2016-18 Our Journey
Paolo Pallotti (CEO)
Closing Remarks
2019-21 Our Plan
Agenda
2

Enel Chile Today

We are the largest private utility in Chile with a strong and unique
portfolio of assets to capture the coming opportunities
16.9 GWh energy distributed
1.9 mn end users
~300k digital meters
Indefinite concession
in the capital city
15.9 TWh regulated customers
11.4 TWh free customers
Better positioned to face the
liberalization of Chilean market
4.7 GW capacity
63% emission free
14.0 TWh generation
74% emission free
2.8 GW capacity
4.9 TWh generation
Highly flexible & efficient
Electric mobility
+ 100 electric buses
Growth through new services,
products and solutions
En
el C
hile
to
da
y
EBITDA
US$ 1.4 bn
* Attributable Net Income to shareholders
2018E
4
EBITDA (US$ bn) 1.4
Capex (US$ bn) 0.6
Net Income* (US$ bn) 0.6
Net Debt (US$ bn) 3.3
Net Debt/EBITDA 2.3x
Payout Ratio (%) 60%
Dividend Yield (%) 4.9%
EPS (Ch$/Sh) 5.7

2016-2018Our Journey
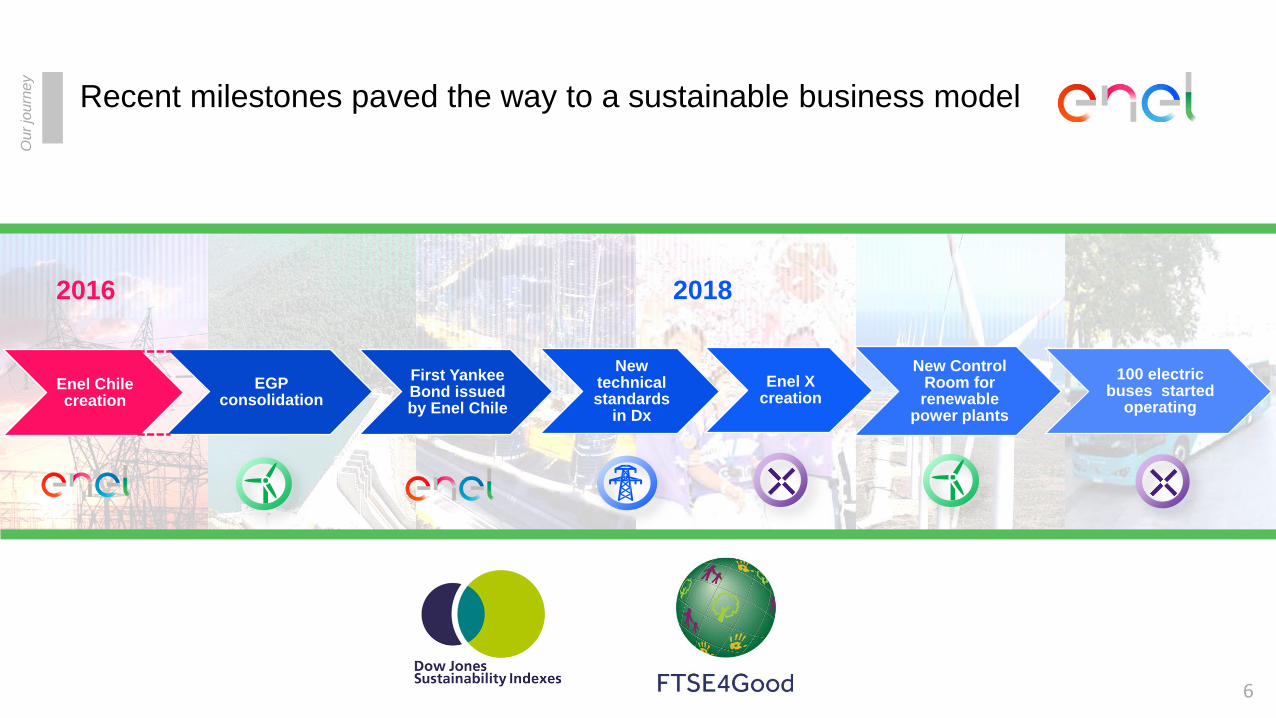
Recent milestones paved the way to a sustainable business model
Enel Chile creation
EGP consolidation
First Yankee Bond issued by Enel Chile
New technical standards
in Dx
Enel X creation
New Control Room for renewable
power plants
100 electric buses started
operating
2016 2018
Ou
r jo
urn
ey
6
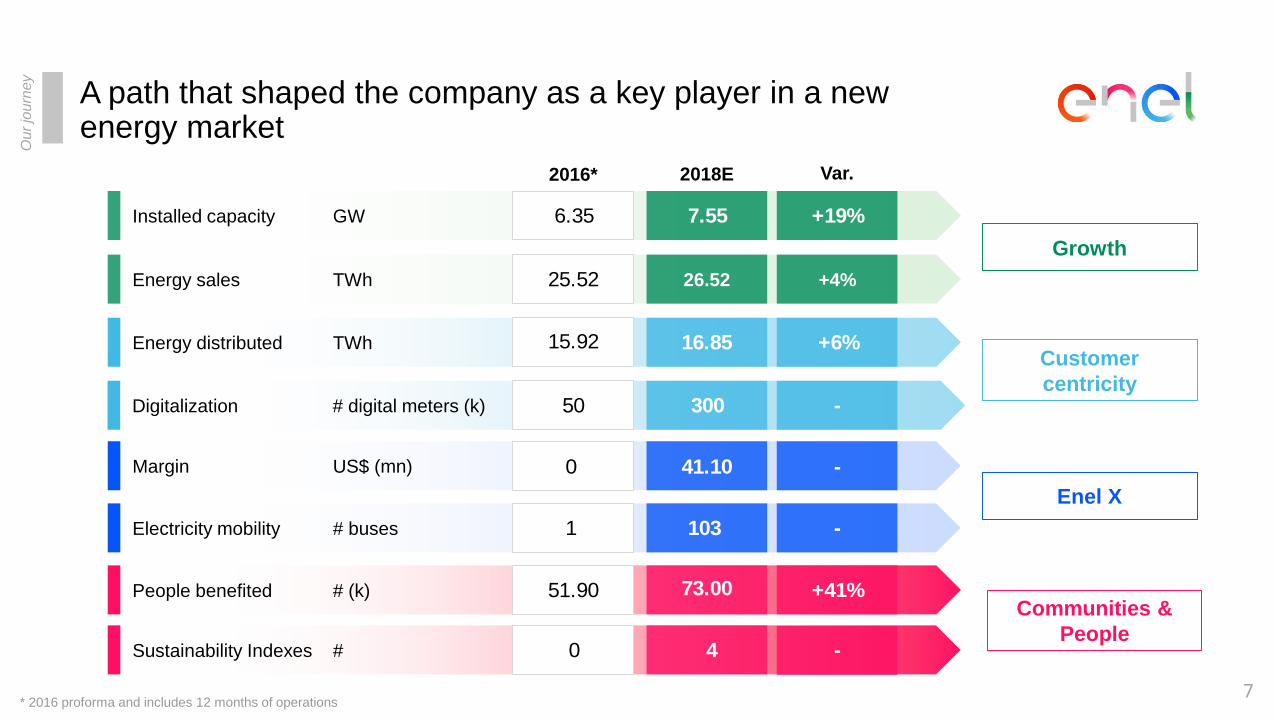
A path that shaped the company as a key player in a new energy market
Ou
r jo
urn
ey
Installed capacity GW
Sustainability Indexes #
Margin US$ (mn)
Energy distributed TWh
Electricity mobility # buses
People benefited # (k)
Digitalization # digital meters (k)
Energy sales TWh
Growth
Customer
centricity
Enel X
Communities &
People
2016* 2018E
26.52
6.35 7.55
25.52
30050
73.0051.90
40
16.8515.92
1031
Var.
+4%
+19%
-
+41%
-
+6%
-
7* 2016 proforma and includes 12 months of operations
-41.100

0.370.58
2016 2018E
+58%
0.681.06
2016 2018E
+54%
FFO/EBITDA 74% 73%
0.390.6550%
60%
2016 2018E
+67%
Dividend Yield
4.3% 4.9%
Pay out
0.931.44
2016 2018E
+55%
Strategy delivered with solid cash flow, sustainable investment
and value creation to all shareholders
Net Income* (US$ bn)
EBITDA (US$ bn)
FFO (US$ bn)
Ou
r jo
urn
ey
Gross Capex (US$ bn)
8*Ordinary Net Income excluding one-off effects

Enel Chile Our Pillars 2019-2021

New opportunities arising from the energy transition
Ou
r p
illa
rs
10
Market Competition
Urbanization Decarbonization
Political Context
EN
ER
GY
TR
AN
SIT
ION
Concentration in capital cities
Energy needs
Interconnections
Renewable
Electric mobility
Liberalization
CompetitionReliable investment environment
Stable regulatory framework

Sustainable value creation to all stakeholders over the long term
Ou
r p
illa
rs
Operational
Efficiency
Digitalization &
innovation to
support operational
efficiencies
Renewable
Growth
Additional
renewable capacity
Free customers
sale increase
Infrastructure
& networksEnel X
Electric mobility
New products,
services & solutions
Communities & People
Sustainable long-term value creation
Digitalization
Performance
improvement
11
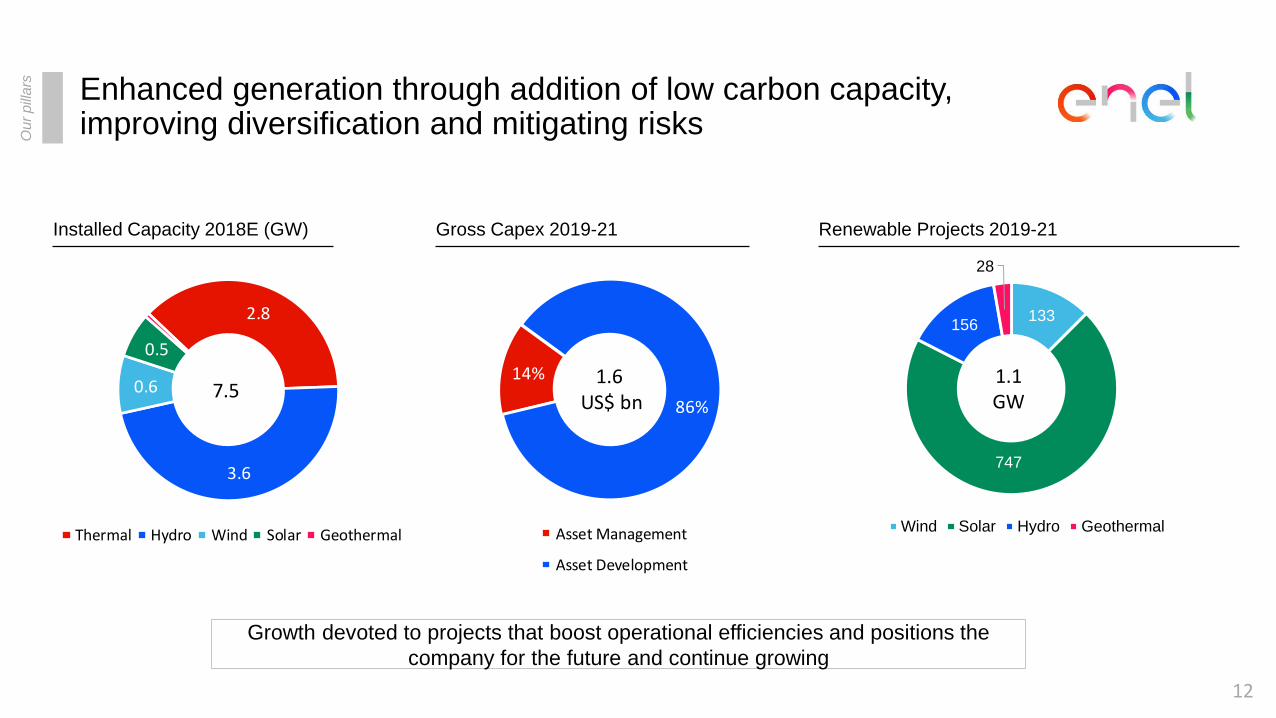
Enhanced generation through addition of low carbon capacity, improving diversification and mitigating risks
Ou
r p
illa
rs
Growth devoted to projects that boost operational efficiencies and positions the
company for the future and continue growing
Renewable Projects 2019-21Installed Capacity 2018E (GW)
2.8
3.6
0.6
0.5
Thermal Hydro Wind Solar Geothermal
7.5
Gross Capex 2019-21
12
133
747
156
28
Wind Solar Hydro Geothermal
1.1GW
14%
86%
Asset Management
Asset Development
1.6US$ bn

Ou
r p
illa
rs
Capturing opportunities from energy demand and free market growth
Energy Sales (TWh) EBITDA (US$ bn) - Generation Business
13
1.16
1.60
2018E 2021
+39%
15.910.6
9.7 17.6
0.90.426.5
28.6
2018E 2021
Regulated Free market Spot
+8%

Ou
r p
illa
rs Recent technical regulation enhances new opportunities for Infrastructure & Networks
40%
80%100%
2021 2023 2024
% of clients with smart meters
Smart Meters Requirements
Implementation of “Smart
Meters” systems in a
maximum period of 7 years
Minimum functionalities:
• Remote measurement of consumption
• Warning of lack of supply (required from 2022)
• Remote connection / disconnection
EBITDA (US$ bn) - Distribution Business Gross Capex 2019-21
0.32 0.34
2018E 2021
+7%
Energy Distributed (TWh)
16.9
18.6
2018E 2021
+10%
14
40%
30%
30%
Asset Development Asset Management
Customers
0.5US$ bn

Ou
r p
illa
rs
Opex evolution (US$ bn)
Operational efficiencies and digitalization to support growth
0.500.04 0.02 0.56 (0.04) 0.52
2018E CPI & FX Growth AdjustedOpex
Efficiency 2021
-7%
Smart meters
Telecontrol
Network resilience
Control room
Predictive maintenance
15
Digitalization main driver
Support activities
Robot process automation

Enel X addresses customers needs with new services and
electric mobilityOu
r p
illa
rs
16
13 412Charging points
(#)
- 93Demand response*
(MW)
2018E 2021
253 347Public lighting
(k points)
8 30Major appliances
(k)
2 7PV*
(MWp)
Develop a large and
distributed infrastructural
network to leverage on
electrification of uses by
offering tailored solutions
to cities and communities
Enable the electrification
of transportation through
the development of
widespread and easy-to-
use private and public
infrastructure
Leverage on digital platforms
to provide energy efficiency,
advisory and distributed
energy services to
commercial and industrial
clients
Empower customers to exploit
clean and cost effective energy
solutions (air conditioning, PV)
while providing support services
(i.e, maintenance & repair,
insurance services)
Urbanization
Electrification of uses
E-mobility
Flexibility
* Accumulated figures

Strong commitment to our SDG targets
Ou
r p
illa
rs
17
20201
2020
Access to affordable and clean energy mainly in Africa, Asia and Latin America
2.22
2018E1
Employment and sustainable and inclusive economic growth 1.8
Engaging local communities (mn beneficiaries)
High-quality, inclusive and fair education 0.9
Reduction of CO2 specific emissions (kg/kWheq)
0.39
Climate change 2018E
3.0
3.0
0.8
<0.35
0.16
2018E1
0.35
0.03
0.19
2018E
Enel
ChileEnel Spa
7%
% Enel
Chile/Group
20%
4%
1. Cumulated figures since 2015
2. In the whole Group perimeter, 4.9 mn beneficiaries were reached
Target already achieved before 2020

Our Plan2019-2021

Gross Capex 2019-21 Asset management (US$ bn)Asset development (US$ bn)
Capex allocation to shape our portfolio of assets and
improve marginsOu
r p
lan
0.190.05
0.180.38
0.060.080.430.51
2019 2021
Enel Gx Chile EGP Enel Dx Chile
+20%
0.08 0.06
0.010.01
0.060.05
0.000.00
0.150.13
2019 2021
Enel Gx Chile EGP Enel Dx Chile Holding
-16%
19
18%75%
7%
Asset Management Asset DevelopmentCustomers
2.2US$ bn

Business model positioning allows to capture opportunities from energy demand and free market growth
EBITDA (US$ bn)
New servicesE-City, E-Mobility, E-Home, E-
Industries
Efficiencies
Efficiency plan allows an increased
EBITDA, in a stable regulatory
environment.
Free market
development
Ambitious plan to capture new
clients also outside our concession
area.
Ou
r p
lan
CapacityNew renewable capacity improving
margin.
20
Main drivers
1.44
0.45 0.04 1.93
2018E Margin growth Efficiencies 2021
+34%
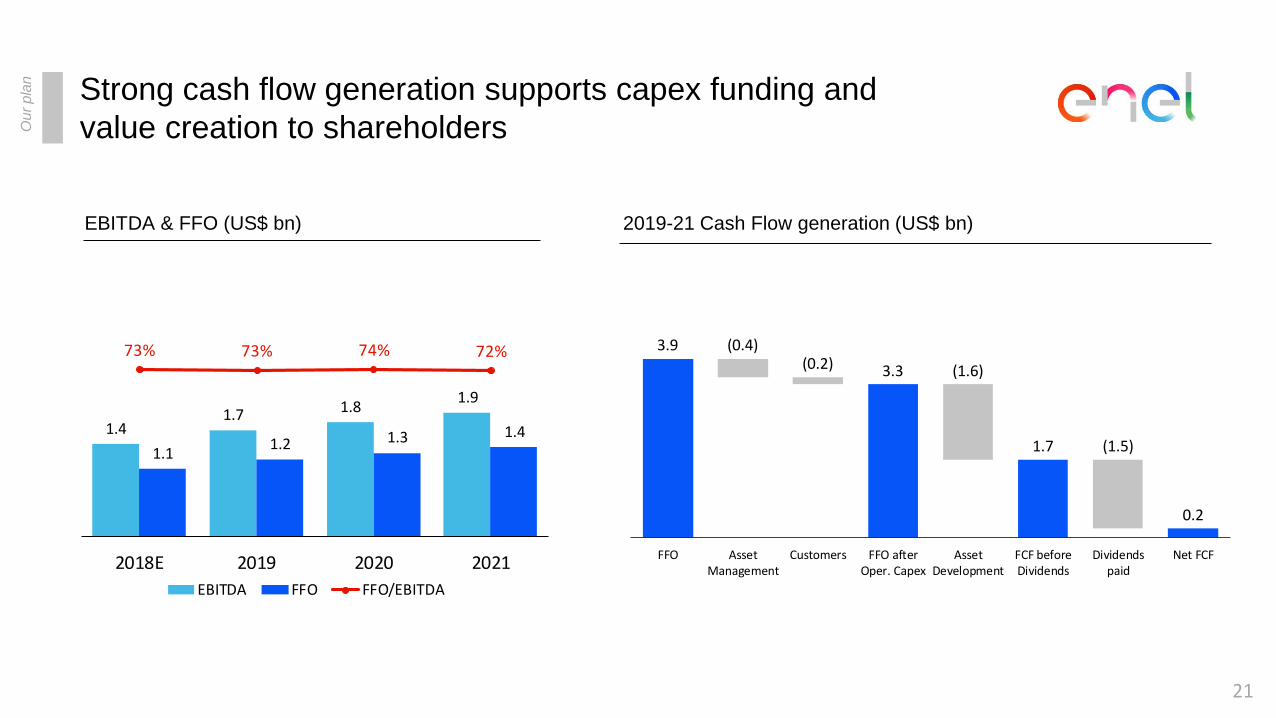
Strong cash flow generation supports capex funding and
value creation to shareholders
EBITDA & FFO (US$ bn) 2019-21 Cash Flow generation (US$ bn)
Ou
r p
lan
1.41.7 1.8
1.9
1.11.2 1.3 1.4
73% 73% 74% 72%
2018E 2019 2020 2021
EBITDA FFO FFO/EBITDA
3.9 (0.4)(0.2) 3.3 (1.6)
1.7 (1.5)
0.2
FFO AssetManagement
Customers FFO afterOper. Capex
AssetDevelopment
FCF beforeDividends
Dividendspaid
Net FCF
21

3.2 3.0
0.6 0.8
3.8 3.8
2018E 2021Net Debt Cash
2.3x 1.6x
-0%
Deleveraging over the period of plan will sustain strategy of continuing growth
Gross and Net Debt (US$ bn)
ND/EBITDA:
Financial Expenses (US$ bn)
Long term credit rating
Ou
r p
lan
0.2 0.2 0.2
5.7% 5.6% 5.6%
2019 2020 2021
Financial expenses Cost of debt
22
BBB+ Stable Baa2 Stable BBB+ Stable
Standard & Poors Moody's Fitch

Net income evolution supported by business growth drivers
Net Ordinary Income* (US$ bn) 2018E-21 Net Ordinary Income evolution* (US$ bn)
0.60.8 0.8 0.9
45% 46% 45% 45%
2018E 2019 2020 2021
Net Income Net Income/EBITDA
+35%
0.6
0.5 (0.1)(0.1) (0.1)
0.0 0.9
2018E EBITDA D&A FinancialCharges
Taxes Minorities 2021
+35%
Ou
r p
lan
23* Attributable Net Income to shareholders

Continuous business growth supports improvement in shareholders value creationO
ur
pla
n
Earnings growth 2018E 2019 2020 2021 CAGR 18-21
Ordinary EBITDA (US$ bn) 1.4 1.7 1.8 1.9 +8%
Net Ordinary Income (US$ bn) 0.6 0.8 0.8 0.9 +8%
Value creation
Pay-out ratio 60% 65% 70% 70% +4%
Implicit DPS (Ch$/Sh) 3.4 4.4 5.0 5.4 +12%
Implicit EPS (Ch$/Sh) 5.7 6.8 7.2 7.7 +8%
24

Closing Remarks

26
Unique portfolio of assets in Chile
Growth focused on renewable capacity
Digitalization in all business lines
Enel X as an agent of the energy transition
Shareholder value creation improvement in a sustainable business model
Closing remarks

Susana Rey
Head of IR Enel Chile
+56 2 2630 9606
[email protected] further information, visit our IR site at:
www.enelchile.cl
Catalina González
Head of IR Enel Generación Chile
+56 2 2630 9603
Gonzalo Juarez
IR New York Office
+1 (212) 520 1025
Claudio Ortiz
Investor Relations Associate
+56 2 2630 9506
Pablo Contreras
Investor Relations Associate
+56 2 2630 9585
27

This presentation contains statements that could constitute forward-looking statements within the meaning of the Private Securities Litigation
Reform Act of 1995. These statements appear in a number of places in this announcement and include statements regarding the intent,
belief or current expectations of Enel Chile and its management with respect to, among other things: (1) Enel Chile's business plans; (2) Enel
Chile's cost-reduction plans; (3) trends affecting Enel Chile's financial condition or results of operations, including market trends in the
electricity sector in Chile or elsewhere; (4) supervision and regulation of the electricity sector in Chile or elsewhere; and (5) the future effect
of any changes in the laws and regulations applicable to Enel or its subsidiaries. Such forward-looking statements are not guarantees of
future performance and involve risks and uncertainties. Actual results may differ materially from those in the forward-looking statements as a
result of various factors. These factors include a decline in the equity capital markets of the United States or Chile, an increase in the market
rates of interest in the United States or elsewhere, adverse decisions by government regulators in Chile or elsewhere and other factors
described in Enel Chile's Annual Report and Form 20-F. Readers are cautioned not to place undue reliance on those forward-looking
statements, which state only as of their dates. Enel Chile undertakes no obligation to release publicly the result of any revisions to these
forward-looking statements.
28