endogenous -h2ax-atm-chk2checkpointactivation …...g-h2ax, ps1981atm, and pt68chk2, suggesting...
TRANSCRIPT

Endogenous ;-H2AX-ATM-Chk2 Checkpoint Activationin Bloom’s Syndrome Helicase–Deficient Cells IsRelated to DNA Replication Arrested Forks
V. Ashutosh Rao,1 Chiara Conti,1,2 Josee Guirouilh-Barbat,1 Asako Nakamura,1
Ze-Hong Miao,1 Sally L. Davies,3 Barbara Sacca,2 Ian D. Hickson,3
Aaron Bensimon,2 and Yves Pommier1
1Laboratory of Molecular Pharmacology, Center for Cancer Research, National Cancer Institute,U.S. Department of Health and Human Services, Bethesda, Maryland; 2Genome StabilityLaboratory, Pasteur Institute, Paris, France; and 3Cancer Research UK Laboratories,Weatherall Institute of Molecular Medicine, University of Oxford, JohnRadcliffe Hospital, Oxford, United Kingdom
AbstractThe Bloom syndrome helicase (BLM) is critical for
genomic stability. A defect in BLM activity results in
the cancer-predisposing Bloom syndrome (BS). Here,
we report that BLM-deficient cell lines and primary
fibroblasts display an endogenously activated DNA
double-strand break checkpoint response with
prominent levels of phosphorylated histone H2AX
(;-H2AX), Chk2 (pT68Chk2), and ATM (pS1981ATM)
colocalizing in nuclear foci. Interestingly, the mitotic
fraction of ;-H2AX foci did not seem to be higher in
BLM-deficient cells, indicating that these lesions form
transiently during interphase. Pulse labeling with
iododeoxyuridine and immunofluorescence microscopy
showed the colocalization of ;-H2AX, ATM, and Chk2
together with replication foci. Those foci costained for
Rad51, indicating homologous recombination at these
replication sites. We therefore analyzed replication in BS
cells using a single molecule approach on combed DNA
fibers. In addition to a higher frequency of replication
fork barriers, BS cells displayed a reduced average
fork velocity and global reduction of interorigin
distances indicative of an elevated frequency of
origin firing. Because BS is one of the most penetrant
cancer-predisposing hereditary diseases, it is likely that
the lack of BLM engages the cells in a situation similar
to precancerous tissues with replication stress. To our
knowledge, this is the first report of high ATM-Chk2
kinase activation and its linkage to replication defects
in a BS model. (Mol Cancer Res 2007;5(7):713–24)
IntroductionHuman DNA helicases have five knownmembers that are part
of the RecQ family, the loss of three of which is associated with
cancer-predisposing syndromes (1). The Bloom syndrome heli-
case (BLM) is a member of the RecQ family of helicases that are
evolutionarily conserved from Escherichia coli to humans.
Hypomorphic mutation in the BLM protein (encoded by
RECQL3) results in the rare, cancer-predisposing Bloom
syndrome (BS, MIM number 210900; ref. 2). In addition to
dwarfism, immunodeficiency, sun-sensitive telangiectatic
erythma, and male infertility (3, 4), BS patients display high risk
for hematologic malignancies (3, 4) as well as carcinomas (5, 6).
Such predisposition to cancers is also observed in homozygous
BS mice (7).
The primary defect in BLM-deficient models is suggested to
be associated with theDNA replicationmachinery (8, 9), themain
hypothesis being that BLM is involved in the restart of DNA
replication-stalled forks, as recently proposed by in vitro studies
(10). In agreement with this possibility, BLM colocalizes with the
ssDNA-associated replication protein A (RPA; ref. 11) and is
phosphorylated on T99 in response to replication inhibition
induced by hydroxyurea and camptothecin, to which BS cells are
hypersensitive (12, 13). However, only indirect data exist on the
presence of stalling of replication forks in BS cells in untreated
conditions, namely, the presence of repair proteins and a reduction
in the replication fork rate (14-18). Additionally, the endogenous
checkpoint activation that would result from these abnormal
structures had not been examined until the current study.
The common cytogenetic feature of BS cells is an elevated
level of sister chromatid exchanges and chromosome breaks
that can be rescued by transfection with wild-type BLM cDNA
(19-21). Because of this elevated inherent genomic instability
of BS cells, BLM is considered a caretaker of the genome and
essential for maintaining stability by repressing recombinational
processes (18, 22-24). In agreement with this concept, elevated
levels of Rad51 and Ku86 are observed in the absence of BLM,
thus indicating increased homologous recombination and error-
prone nonhomologous end-joining, respectively (18, 25, 26).
Received 1/17/07; revised 3/30/07; accepted 4/17/07.Grant support: Intramural Research Program of the National Cancer Institute,Center for Cancer Research, NIH.The costs of publication of this article were defrayed in part by the payment ofpage charges. This article must therefore be hereby marked advertisement inaccordance with 18 U.S.C. Section 1734 solely to indicate this fact.Note: Supplementary data for this article are available at Molecular CancerResearch Online (http://mcr.aacrjournals.org/).V.A. Rao and C. Conti contributed equally to the research in this manuscript.Competing financial interests: The authors declare that they have no competingfinancial interests.Requests for reprints: Yves Pommier, 37 Convent Drive, 37-5068, NIH,Bethesda, MD 20892. Phone: 301-496-5944; Fax: 301-402-0752. E-mail:[email protected] D 2007 American Association for Cancer Research.doi:10.1158/1541-7786.MCR-07-0028
Mol Cancer Res 2007;5(7). July 2007 713
Research. on August 10, 2020. © 2007 American Association for Cancermcr.aacrjournals.org Downloaded from

Previous studies showed the molecular impact of BLM
deficiency on DNA replication. Using bromodeoxyuridine
(BrdUrd) incorporation detected under nondenaturing condi-
tions, which reveals sites of ssDNA at aberrant replication
foci, Rassool et al. (18) showed coincidence of replicating
ssDNA regions with Rad51 and Ku86 foci in BS cells. BLM
was also shown to colocalize with the ssDNA binding proteins,
RPA (11). Such single-stranded regions can be generated by
DNA replication fork stalling that results in Holliday junction
intermediates. Resolution of such Holliday junctions prevents
the replication forks from collapsing, which would otherwise
result in illegitimate recombination (27-33). BLM also localizes
in the promyelocytic leukemia nuclear bodies (34). It suppresses
recombination through direct association with either Rad51 or
topoisomerase IIIa (Top3a; refs. 34-37). In association with
Top3a, BLM binds to and catalyzes branch migration of
Holliday junctions in an ATP-dependent manner (35, 38-42).
Direct interaction of BLM with Rad51 can also catalyze branch
migration of the Holliday junction recombination intermediates,
thus promoting double-Holliday junction dissolution by BLM-
Top3a and preventing illegitimate recombinations and double-
strand breaks (DSB; refs. 11, 18, 31, 34, 43).
Stalled replication forks generate DSBs and activate the intra-
S checkpoint, which triggers cell cycle arrest until the damage is
repaired. One of the earliest knownmarkers of DSBs is the serine
139 phosphorylated form of the histone H2AX, called g-H2AX(44). g-H2AX forms macromolecular foci and marks the
chromatin domain around the broken chromosomal DNA
ends, thus allowing the recruitment of repair factors (45-50).
Phosphoinositide-3-kinase– related kinase (PI3KK) family
members ATM, ATR, and DNA-PK are responsible for the
phosphorylation of H2AX (51). DNA damage promotes the
phosphorylation of ATM on serine 1981 (52), which causes
the dissociation of ATM dimers and the consequent activation of
ATM (52, 53). Activated ATM (pS1981ATM), in turn, phosphor-
ylates the downstream kinases Chk1 and Chk2, which regulate
fundamental cellular functions, such as DNA replication, cell
cycle progression, and apoptosis (54-56). Chk2 is activated by
ATM following its phosphorylation on T68. Chk2 then under-
goes a cascade of autophosphorylation in a positive feedback
loop that initiates its full activation (56-59). Growing evidence
indicates functional overlap between the ATM and ATR
pathways. Although ATM is considered the primary mediator
of the DSB checkpoint response to ionizing radiation and
radiomimetic drugs via Chk2, ATR signals after DNA replica-
tion–dependent damage by phosphorylating Chk1 (54, 55). As a
consequence, one would expect activation of the ATR-Chk1
pathway in BS cells. However, previous work on the genomic
instability in BSmodels and our own unpublished results showed
no endogenous defect in basal Chk1 phosphorylation (60-62).
Constitutive phosphorylation of H2AX, ATM, and Chk2 has
recently been found in human cancerous tissue samples and has
also been found to be amarker of early tumorigenesis specifically
in precancerous lesions (63-65). Signs of endogenous DNA
damage, marked by Chk2 phosphorylation (pT68Chk2) and
g-H2AX, were found in cancerous portions of the histologic
sections, whereas adjoining normal tissue stained negative.
In the present study, we investigated whether the chromo-
somal instability caused by the absence of BLM would activate
an endogenous checkpoint response. We found that BLM-
deficient cells contain elevated g-H2AX foci that colocalize
with pS1981ATM and pT68Chk2. To address whether the
endogenous checkpoint activation in unstressed BS cells is
associated with DNA replication defects, we analyzed replica-
tion in BS cells using a single-molecule approach based on
molecular combing and DNA analysis. Replicating DNA can
be visualized following pulse-labeling with two short consec-
utive pulses of iododeoxyuridine (IdUrd) and chlorodeoxyur-
idine (CldUrd). This approach (66) allowed us to study and
compare the fork length, velocity, and the interorigin distance
on individual combed DNA molecules in normal and BS cells.
Because the stretching factor of the combed DNA fibers is
constant, we were able to convert the length of the fluorescent
tracks into base pair units (67, 68). By measuring replication
fork velocity and interorigin distances, we provide direct
evidence for spontaneously arrested replication forks and
decreased interorigin distance in BLM-deficient cells, and we
show that the phosphorylated H2AX, ATM, and Chk2 coloc-
alize with these abnormal replication sites.
ResultsEndogenous Phosphorylation and Colocalization of His-tone H2AX, ATM, and Chk2 in Transformed and PrimaryBS Cells
To examine whether the genomic instability caused by a lack
of BLM activates a checkpoint response, we tested first a pair of
human fibroblast cell lines, PSNG13 derived from a BS patient
and its derivative, PSNF5, complemented with functional BLM
(25). We also did comparative studies in untransformed BS
fibroblasts (GM01492) and fibroblasts from a healthy individ-
ual (GM00037). Confocal microscopy imaging analyses were
done using antibodies for phosphorylated histone H2AX
(g-H2AX), S1981 autophosphorylated ATM kinase (44, 52),
and phosphorylated Chk2 at T68. We confirmed the specificity
of the phosphorylated Chk2 antibody using HCT15 (Chk2
deficient) and HT29 (Chk2 proficient; ref. 69; Supplementary
Fig. S1). The elevated pT68Chk2 in BLM-deficient cells was
also confirmed using a different antibody from Rockland
Immunochemicals (Supplementary Fig. S1). All three phos-
phorylations g-H2AX, pS1981ATM, and pT68Chk2 are known
markers of DSB. Both cell types with defective BLM (PSNG13
and GM01492) showed significantly elevated levels of g-H2AX, pS1981ATM, and pT68Chk2 nuclear foci (Fig. 1A)
compared with their wild-type counterparts.
Quantitative analyses of the microscopy images were done
to determine the distribution of the elevated nuclear signals
(Fig. 1B). Foci were counted in all four cell lines from at least
30 nuclei in three independent experiments and represented as
an average number per cell. Cells with functional BLM (PSNF5
and GM00037) showed significantly less cells with foci for all
three phosphoproteins than the BLM-deficient cells. For
example, as seen in the top graphs of Fig. 1B, f31% of
PSNG13 (BLM�) cells had between one and seven g-H2AXfoci, in contrast to 12% of PSNF5 (BLM+) cells. In PSNG13
cells, 65% of cells showed discernable foci compared with 15%
in PSNF5. Similarly, 44% of GM01492 (BLM�) cells showed
discernable foci compared with 20% in GM00037 (BLM+)
Rao et al.
Mol Cancer Res 2007;5(7). July 2007
714
Research. on August 10, 2020. © 2007 American Association for Cancermcr.aacrjournals.org Downloaded from
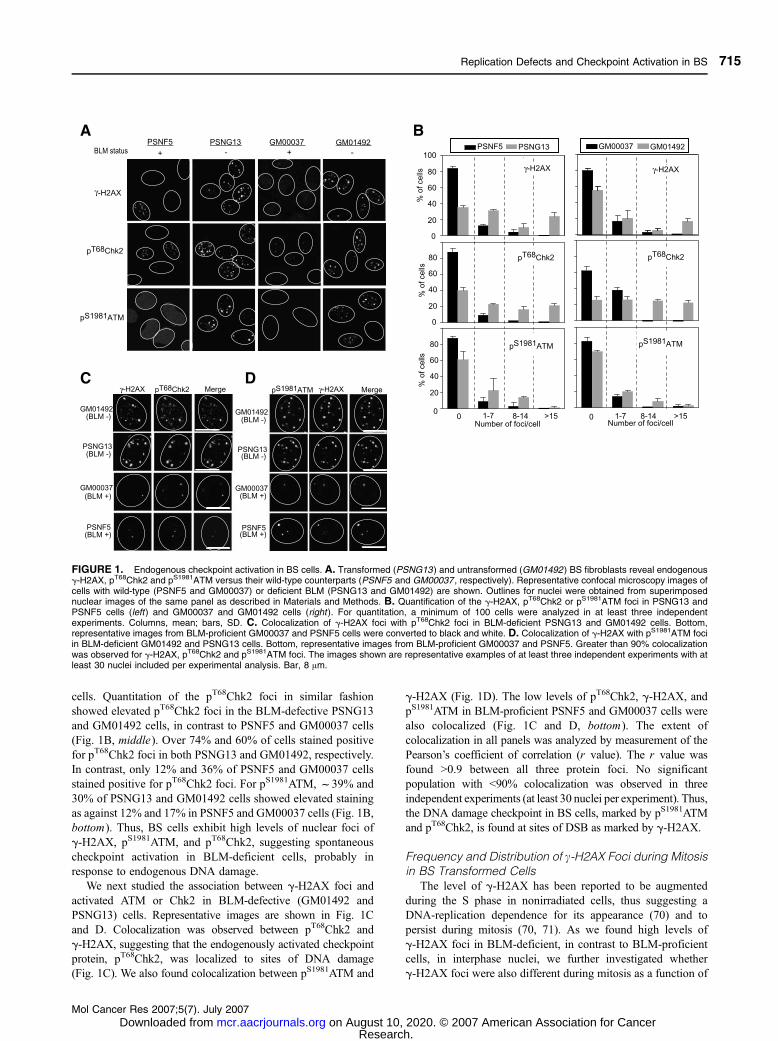
cells. Quantitation of the pT68Chk2 foci in similar fashion
showed elevated pT68Chk2 foci in the BLM-defective PSNG13
and GM01492 cells, in contrast to PSNF5 and GM00037 cells
(Fig. 1B, middle). Over 74% and 60% of cells stained positive
for pT68Chk2 foci in both PSNG13 and GM01492, respectively.
In contrast, only 12% and 36% of PSNF5 and GM00037 cells
stained positive for pT68Chk2 foci. For pS1981ATM, f39% and
30% of PSNG13 and GM01492 cells showed elevated staining
as against 12% and 17% in PSNF5 and GM00037 cells (Fig. 1B,
bottom). Thus, BS cells exhibit high levels of nuclear foci of
g-H2AX, pS1981ATM, and pT68Chk2, suggesting spontaneous
checkpoint activation in BLM-deficient cells, probably in
response to endogenous DNA damage.
We next studied the association between g-H2AX foci and
activated ATM or Chk2 in BLM-defective (GM01492 and
PSNG13) cells. Representative images are shown in Fig. 1C
and D. Colocalization was observed between pT68Chk2 and
g-H2AX, suggesting that the endogenously activated checkpoint
protein, pT68Chk2, was localized to sites of DNA damage
(Fig. 1C). We also found colocalization between pS1981ATM and
g-H2AX (Fig. 1D). The low levels of pT68Chk2, g-H2AX, andpS1981ATM in BLM-proficient PSNF5 and GM00037 cells were
also colocalized (Fig. 1C and D, bottom). The extent of
colocalization in all panels was analyzed by measurement of the
Pearson’s coefficient of correlation (r value). The r value was
found >0.9 between all three protein foci. No significant
population with <90% colocalization was observed in three
independent experiments (at least 30 nuclei per experiment). Thus,
the DNA damage checkpoint in BS cells, marked by pS1981ATM
and pT68Chk2, is found at sites of DSB as marked by g-H2AX.
Frequency and Distribution of c-H2AX Foci during Mitosisin BS Transformed Cells
The level of g-H2AX has been reported to be augmented
during the S phase in nonirradiated cells, thus suggesting a
DNA-replication dependence for its appearance (70) and to
persist during mitosis (70, 71). As we found high levels of
g-H2AX foci in BLM-deficient, in contrast to BLM-proficient
cells, in interphase nuclei, we further investigated whether
g-H2AX foci were also different during mitosis as a function of
FIGURE 1. Endogenous checkpoint activation in BS cells. A. Transformed (PSNG13 ) and untransformed (GM01492 ) BS fibroblasts reveal endogenousg-H2AX, pT68Chk2 and pS1981ATM versus their wild-type counterparts (PSNF5 and GM00037 , respectively). Representative confocal microscopy images ofcells with wild-type (PSNF5 and GM00037) or deficient BLM (PSNG13 and GM01492) are shown. Outlines for nuclei were obtained from superimposednuclear images of the same panel as described in Materials and Methods. B. Quantification of the g-H2AX, pT68Chk2 or pS1981ATM foci in PSNG13 andPSNF5 cells (left) and GM00037 and GM01492 cells (right ). For quantitation, a minimum of 100 cells were analyzed in at least three independentexperiments. Columns, mean; bars, SD. C. Colocalization of g-H2AX foci with pT68Chk2 foci in BLM-deficient PSNG13 and GM01492 cells. Bottom,representative images from BLM-proficient GM00037 and PSNF5 cells were converted to black and white. D. Colocalization of g-H2AX with pS1981ATM fociin BLM-deficient GM01492 and PSNG13 cells. Bottom, representative images from BLM-proficient GM00037 and PSNF5. Greater than 90% colocalizationwas observed for g-H2AX, pT68Chk2 and pS1981ATM foci. The images shown are representative examples of at least three independent experiments with atleast 30 nuclei included per experimental analysis. Bar, 8 Am.
Replication Defects and Checkpoint Activation in BS
Mol Cancer Res 2007;5(7). July 2007
715
Research. on August 10, 2020. © 2007 American Association for Cancermcr.aacrjournals.org Downloaded from
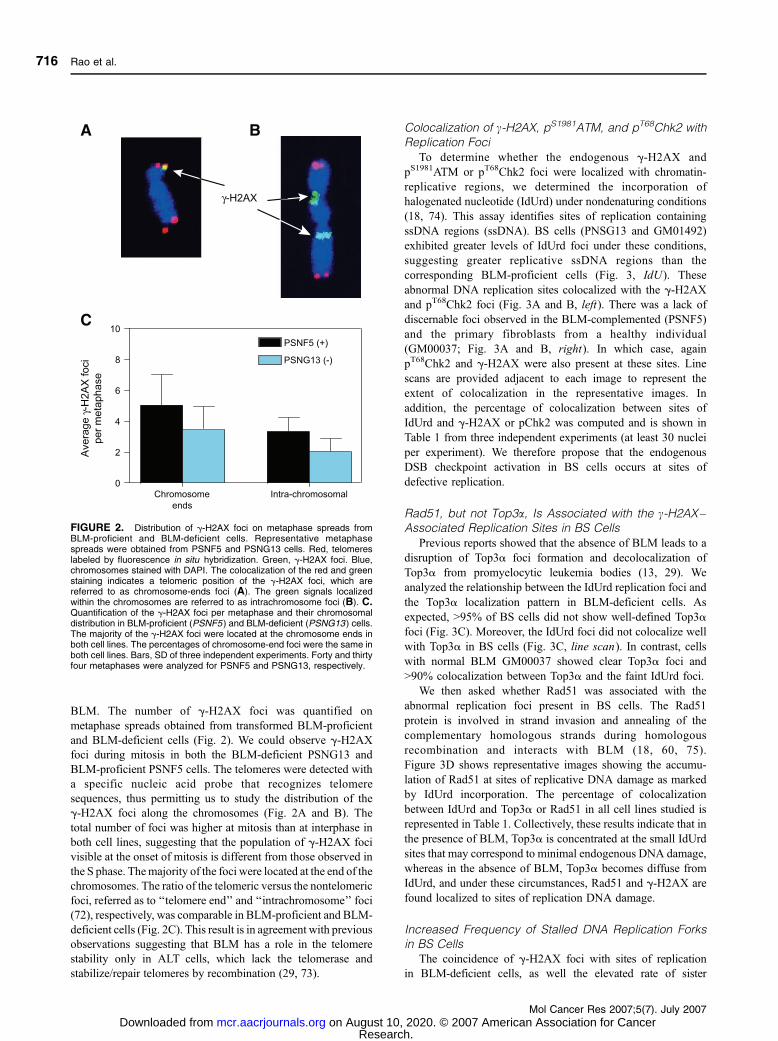
BLM. The number of g-H2AX foci was quantified on
metaphase spreads obtained from transformed BLM-proficient
and BLM-deficient cells (Fig. 2). We could observe g-H2AXfoci during mitosis in both the BLM-deficient PSNG13 and
BLM-proficient PSNF5 cells. The telomeres were detected with
a specific nucleic acid probe that recognizes telomere
sequences, thus permitting us to study the distribution of the
g-H2AX foci along the chromosomes (Fig. 2A and B). The
total number of foci was higher at mitosis than at interphase in
both cell lines, suggesting that the population of g-H2AX foci
visible at the onset of mitosis is different from those observed in
the S phase. Themajority of the foci were located at the end of the
chromosomes. The ratio of the telomeric versus the nontelomeric
foci, referred as to ‘‘telomere end’’ and ‘‘intrachromosome’’ foci
(72), respectively, was comparable in BLM-proficient and BLM-
deficient cells (Fig. 2C). This result is in agreement with previous
observations suggesting that BLM has a role in the telomere
stability only in ALT cells, which lack the telomerase and
stabilize/repair telomeres by recombination (29, 73).
Colocalization of c-H2AX, pS1981ATM, and pT68Chk2 withReplication Foci
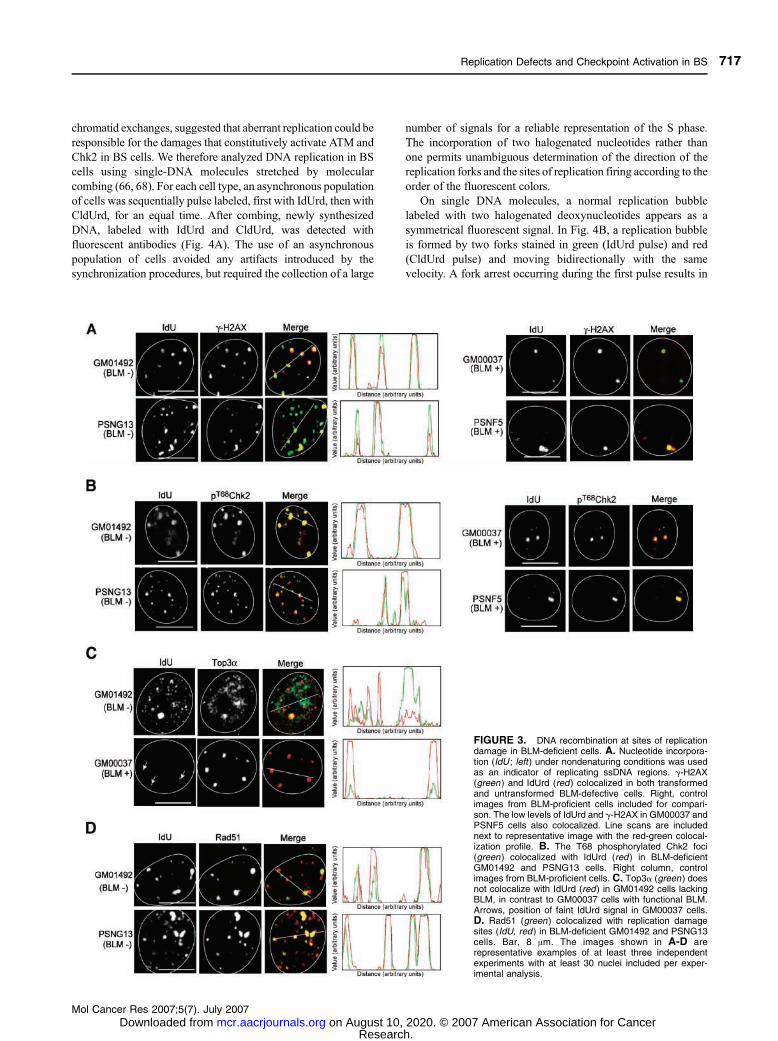
To determine whether the endogenous g-H2AX and
pS1981ATM or pT68Chk2 foci were localized with chromatin-
replicative regions, we determined the incorporation of
halogenated nucleotide (IdUrd) under nondenaturing conditions
(18, 74). This assay identifies sites of replication containing
ssDNA regions (ssDNA). BS cells (PNSG13 and GM01492)
exhibited greater levels of IdUrd foci under these conditions,
suggesting greater replicative ssDNA regions than the
corresponding BLM-proficient cells (Fig. 3, IdU). These
abnormal DNA replication sites colocalized with the g-H2AXand pT68Chk2 foci (Fig. 3A and B, left). There was a lack of
discernable foci observed in the BLM-complemented (PSNF5)
and the primary fibroblasts from a healthy individual
(GM00037; Fig. 3A and B, right). In which case, again
pT68Chk2 and g-H2AX were also present at these sites. Line
scans are provided adjacent to each image to represent the
extent of colocalization in the representative images. In
addition, the percentage of colocalization between sites of
IdUrd and g-H2AX or pChk2 was computed and is shown in
Table 1 from three independent experiments (at least 30 nuclei
per experiment). We therefore propose that the endogenous
DSB checkpoint activation in BS cells occurs at sites of
defective replication.
Rad51, but not Top3a, Is Associated with the c-H2AX–Associated Replication Sites in BS Cells
Previous reports showed that the absence of BLM leads to a
disruption of Top3a foci formation and decolocalization of
Top3a from promyelocytic leukemia bodies (13, 29). We
analyzed the relationship between the IdUrd replication foci and
the Top3a localization pattern in BLM-deficient cells. As
expected, >95% of BS cells did not show well-defined Top3afoci (Fig. 3C). Moreover, the IdUrd foci did not colocalize well
with Top3a in BS cells (Fig. 3C, line scan). In contrast, cells
with normal BLM GM00037 showed clear Top3a foci and
>90% colocalization between Top3a and the faint IdUrd foci.
We then asked whether Rad51 was associated with the
abnormal replication foci present in BS cells. The Rad51
protein is involved in strand invasion and annealing of the
complementary homologous strands during homologous
recombination and interacts with BLM (18, 60, 75).
Figure 3D shows representative images showing the accumu-
lation of Rad51 at sites of replicative DNA damage as marked
by IdUrd incorporation. The percentage of colocalization
between IdUrd and Top3a or Rad51 in all cell lines studied is
represented in Table 1. Collectively, these results indicate that in
the presence of BLM, Top3a is concentrated at the small IdUrd
sites that may correspond to minimal endogenous DNA damage,
whereas in the absence of BLM, Top3a becomes diffuse from
IdUrd, and under these circumstances, Rad51 and g-H2AX are
found localized to sites of replication DNA damage.
Increased Frequency of Stalled DNA Replication Forksin BS Cells
The coincidence of g-H2AX foci with sites of replication
in BLM-deficient cells, as well the elevated rate of sister
FIGURE 2. Distribution of g-H2AX foci on metaphase spreads fromBLM-proficient and BLM-deficient cells. Representative metaphasespreads were obtained from PSNF5 and PSNG13 cells. Red, telomereslabeled by fluorescence in situ hybridization. Green, g-H2AX foci. Blue,chromosomes stained with DAPI. The colocalization of the red and greenstaining indicates a telomeric position of the g-H2AX foci, which arereferred to as chromosome-ends foci (A). The green signals localizedwithin the chromosomes are referred to as intrachromosome foci (B). C.Quantification of the g-H2AX foci per metaphase and their chromosomaldistribution in BLM-proficient (PSNF5 ) and BLM-deficient (PSNG13 ) cells.The majority of the g-H2AX foci were located at the chromosome ends inboth cell lines. The percentages of chromosome-end foci were the same inboth cell lines. Bars, SD of three independent experiments. Forty and thirtyfour metaphases were analyzed for PSNF5 and PSNG13, respectively.
Rao et al.
Mol Cancer Res 2007;5(7). July 2007
716
Research. on August 10, 2020. © 2007 American Association for Cancermcr.aacrjournals.org Downloaded from
chromatid exchanges, suggested that aberrant replication could be
responsible for the damages that constitutively activate ATM and
Chk2 in BS cells. We therefore analyzed DNA replication in BS
cells using single-DNA molecules stretched by molecular
combing (66, 68). For each cell type, an asynchronous population
of cells was sequentially pulse labeled, first with IdUrd, then with
CldUrd, for an equal time. After combing, newly synthesized
DNA, labeled with IdUrd and CldUrd, was detected with
fluorescent antibodies (Fig. 4A). The use of an asynchronous
population of cells avoided any artifacts introduced by the
synchronization procedures, but required the collection of a large
number of signals for a reliable representation of the S phase.
The incorporation of two halogenated nucleotides rather than
one permits unambiguous determination of the direction of the
replication forks and the sites of replication firing according to the
order of the fluorescent colors.
On single DNA molecules, a normal replication bubble
labeled with two halogenated deoxynucleotides appears as a
symmetrical fluorescent signal. In Fig. 4B, a replication bubble
is formed by two forks stained in green (IdUrd pulse) and red
(CldUrd pulse) and moving bidirectionally with the same
velocity. A fork arrest occurring during the first pulse results in
FIGURE 3. DNA recombination at sites of replicationdamage in BLM-deficient cells. A. Nucleotide incorpora-tion (IdU ; left) under nondenaturing conditions was usedas an indicator of replicating ssDNA regions. g-H2AX(green ) and IdUrd (red) colocalized in both transformedand untransformed BLM-defective cells. Right, controlimages from BLM-proficient cells included for compari-son. The low levels of IdUrd and g-H2AX in GM00037 andPSNF5 cells also colocalized. Line scans are includednext to representative image with the red-green colocal-ization profile. B. The T68 phosphorylated Chk2 foci(green ) colocalized with IdUrd (red ) in BLM-deficientGM01492 and PSNG13 cells. Right column, controlimages from BLM-proficient cells. C. Top3a (green ) doesnot colocalize with IdUrd (red) in GM01492 cells lackingBLM, in contrast to GM00037 cells with functional BLM.Arrows, position of faint IdUrd signal in GM00037 cells.D. Rad51 (green ) colocalized with replication damagesites (IdU, red ) in BLM-deficient GM01492 and PSNG13cells. Bar, 8 Am. The images shown in A-D arerepresentative examples of at least three independentexperiments with at least 30 nuclei included per exper-imental analysis.
Replication Defects and Checkpoint Activation in BS
Mol Cancer Res 2007;5(7). July 2007
717
Research. on August 10, 2020. © 2007 American Association for Cancermcr.aacrjournals.org Downloaded from

an asymmetrical replication bubble where one fork fails to
incorporate the second nucleotide (Fig. 4C, red). To assess the
frequency of replication fork barriers in BS cells, we quantified
the number of asymmetrical replication bubbles normalized to
the number of total replication bubbles in BLM-proficient and
BLM-deficient cells. An elevated number of asymmetries was
observed in BS cells (Fig. 4D), confirming that BLM is
necessary to minimize replication fork stalling.
Reduced Replication Fork Velocity in BS CellsThe molecular combing-based approach allows for the
quantification of the replication fork rate by dividing the length
of each fluorescent track by the incubation time with the
halogenated nucleotide (Fig. 5A). Because of the constant
stretching factor obtained on silanized surfaces, reproducible
measurements can be obtained (68). Analyses of replication
fork velocities in BLM-deficient and BLM-proficient cells
showed that on any given slide obtained from one cellular
sample, tracks of variable lengths were consistently noticeable.
Accordingly, as shown in Fig. 5, fork velocities showed a broad
distribution of values ranging from about 0.1 up to 4 kb/min.
This result suggested that different regions of the genome
display different fork velocities. The median of the samples
does not coincide with the peak of the distribution because it is
not Gaussian. Because of this broad, non-Gaussian distribution,
histograms were plotted for comparison between BLM-
deficient (Fig. 5B and C, light blue) and BLM-proficient cells
(Fig. 5B and C, dark gray). Primary cells, irrespective of their
BLM status, displayed an overall slower fork velocity when
compared with the transformed cells. The median fork velocity
measured in the BLM-complemented transformed PSNF5 and
in the primary normal GM00037 cells was 1.34 (n = 985) and
1.05 kb/min (n = 170), respectively (Fig. 5), which is within the
range measured in other human cells (76). PSNG13 displayed a
median fork velocity of 1.16 kb/min (n = 757), and GM01492
displayed a median fork velocity of 0.76 kb/min (n = 260). A
leftward shift for the distribution of the replication velocities
was observed in BS cells, indicative of a significant reduction
of replication fork velocity in both the transformed PSNG13
and the primary GM01492 BLM-deficient cell lines compared
with the BLM-proficient cell lines (P < 0.05 by the
Kolmogorov-Smirnov test and by the Mann-Whitney test).
Shorter Interorigin Distances in BS CellsTogether with the fork velocity, origin spacing is a second
crucial parameter that must be regulated to ensure the complete
duplication of the genome within each S phase. Interorigin
distance is defined as the distance between the middle point of
two replicons. The left shift of the blue columns toward smaller
values observed in Fig. 6 indicates a shorter interorigin distance
in BS cells, corresponding to a higher number of active origins.
For each cell type, very few values could be collected for large
interorigin distances. To obtain a statistical analysis, each
sample was split into two subpopulations of interorigin distance
for comparison (Fig. 6). The Kolmogorov-Smirnov test was
used to compare values below 150 kb for the pair of transformed
cells and 120 kb for the primary cells. BS cells display a
significant shorter interorigin distance compared with their
normal counterpart (P < 0.05 by the Kolmogorov-Smirnov test).
DiscussionIn the past decade, the collective reporting on BS models
has led to the hypothesis that BLM deficiency is primarily
manifested as a DNA replication abnormality (18, 19).
Endogenous genomic instability exists in untreated BS cells,
which is marked by a high rate of sister chromatid exchanges
(1). Our study shows that the absence of BLM also gives rise to
(a) a constitutive g-H2AX/ATM/Chk2 checkpoint response, (b)
increased incidence of abnormal replicating ssDNA regions, (c)
altered DNA replication fork velocity and interorigin distance,
and (d) greater replication fork asymmetry suggestive of
replication fork stalling.
The presence of endogenous g-H2AX foci in untreated BS
cells (Fig. 1) is indicative of abnormal levels of DSBs (44, 50,
77). The colocalization of the g-H2AX foci with DNA
replication foci, visualized by IdUrd incorporation (Fig. 3),
suggests that DNA replication defects are responsible for the
chromosomal breaks. Because IdUrd was detected in non-
denaturing conditions, ssDNA regions are preferentially stained,
thus indicating aberrant replication at those foci, as shown
independently using BrdUrd incorporation (18). This endoge-
nous activation of g-H2AX is seemingly in contrast with our
recent study showing defective induction of g-H2AX focus
formation in BS cells in response to replication-mediated DSBs
induced by camptothecin treatment (13). g-H2AX formation has
also been found delayed in BS cells treated with hydroxyurea
(13, 61). After exogenous replication stress, cells are likely to
need BLMnot only to resolve recombination intermediates when
BLM functions with Top3a to resolve double-Holliday junctions
(32, 38), but also to transduce a signal for greater g-H2AXin response to DNA damage. g-H2AX has been shown to
prevent the conversion of DSBs to chromosomal breaks and
translocations during class switch recombination in B lympho-
cytes (45, 78, 79). Furthermore, cytogenetic analyses showed
that the human H2AX gene maps to chromosomal regions
(11q23) that are altered in a relatively large number of human
cancers (45). Thus, it is likely that in BS cells, under unstressed
(constitutive) conditions, g-H2AX serves to mark the sites of
disrupted replication forks and to recruit other repair factors to
corresponding DSBs. g-H2AX foci have been shown to appear
during the S phase and to persist in mitosis upon irradiation
(70, 71). To investigate the fate of the g-H2AX foci in untreated
BLM-proficient and BLM-deficient cells, we quantified those
foci and their distribution along the chromosomes of BS cells
Table 1. Percentage Colocalization of Proteins with IdUrdFoci
BLM-deficient (%) BLM-proficient (%)
GM01492 PSNG13 GM00037 PSNF5
g-H2AX 84 87 88 92pT68Chk2 90 95 93 92Rad51 77 68 76 82Top3a 28 22 95 91
NOTE: Analysis included foci from at least 90 nuclei from three independentexperiments.
Rao et al.
Mol Cancer Res 2007;5(7). July 2007
718
Research. on August 10, 2020. © 2007 American Association for Cancermcr.aacrjournals.org Downloaded from

(Fig. 2). The number of g-H2AX foci was higher in mitosis for
both the BLM-proficient and BLM-deficient cell lines, in
particular in the BLM-proficient cells, which showed very little
signal for g-H2AX during interphase. Therefore, the populations
of g-H2AX foci in S and M phases are different, suggesting that
the DSBs that appear during the S phase are likely repaired before
entry into mitosis. Because the number of g-H2AX foci at the
onset of mitosis was comparable in the control and BS cells,
BLM does not seem to be involved in the regulation and repair of
mitotic DNA damage marked by g-H2AX foci.
Both BLM-deficient PSNG13 and GM01492 cells also
displayed a clear incidence of elevated pS1981ATM and
pT68Chk2 foci above those observed in the control PSNF5
and GM00037 cells (Fig. 1A). pT68Chk2 foci were found to
colocalize with g-H2AX and IdUrd foci under nondenaturing
conditions (Fig. 3), indicating that the g-H2AX-Chk2-ATMresponses occurred at replication sites with exposed single-
stranded regions. In previous reports using ionizing radiation,
Chk2 was phosphorylated by ATM at the sites of DNA damage
(marked by g-H2AX), but is highly mobile thereafter and does
not become stably associated with the sites of DSBs (80). We
observed the colocalization of pT68Chk2 with IdUrd in BLM-
deficient cells, which suggests that the mechanism for
translocation of Chk2 might be different under exogenous
and endogenous stress conditions. In precancerous as well as
cancerous tissue samples, endogenous activation of Chk2 has
been reported recently as a mechanism associated with
replication stress in early stages of cancer, genomic instability,
and selective pressure for p53 mutations (63, 64). Because BS
is one of the most penetrant cancer-predisposing hereditary
diseases (3), it is likely that the lack of BLM engages the cells
in a situation similar to precancerous tissues with replication
stress. To our knowledge, this is the first report of high ATM-
Chk2 kinase activation in an untreated BS model.
Top3a, the BLM-associated topoisomerase, failed to show
colocalization with replicating ssDNA sites, whereas the
recombination protein Rad51 was evident at those sites in the
BS cells (Fig. 3; ref. 18). This differential assembly can be
explained by (a) the tight association between BLM and Top3aproteins in normal cells (36) and (b) the lack of localization of
Top3a to sites of promyelocytic leukemia bodies in the absence
of BLM (13, 29, 36). Therefore, in the absence of BLM, the
cells probably fail to recruit Top3a to the stalled replication
forks and are likely to rely on Rad51 as an alternate repair
pathway. Homologous recombination would then be used to
resolve aberrant DNA synthesis intermediates. The few ssDNA
replication foci in BLM-proficient cells were indeed associated
with Top3a (Fig. 3). Our results are in congruence with the
recently proposed SOS-like hypothesis in BS cells (33). BS
cells, to escape apoptotic death in the face of replication defects,
trigger an alternate mode of recombination machinery (with
Rad51) that involves the generation of chromosomal breaks and
strand invasion and restore the assembly of functional
replication forks. Such replication pauses and restarts in the
absence of BLM can be expected to lower the average
replication fork velocity and likely result in error-prone repair
(18). The phosphorylation of H2AX and activation of the ATM-
Chk2 kinase are consistent with the presence of DSBs, which
may be due to frequent and/or transient replication fork pausing
and repair/restart by homologous recombination.
Early studies carried out in the 1970s using DNA fiber
autoradiography showed a reduced fork velocity in BS cells
(14-16, 81). In the present study, we pulse labeled the cells with
FIGURE 4. Replication fork blocks in BLM-deficient cells.A. Schematicrepresentation of signals deriving from equal pulse labeling with IdUrd andCldUrd. Replication forks progress bidirectionally at the same rate from theorigin and incorporate the analogues forming a symmetrical replicationbubble. Upon detection of IdUrd and CldUrd, three types of signals may beobtained: (a) a green and red signal with a gap between the greensegments, corresponding to initiations that occurred before the beginningof the pulse; (b ) a dual-color signal with a continuous green segmentcorresponding to origins that fired during the first pulse; (c ) a single isolatedred signal corresponding to origins that fired during the second pulse. Acontinuous red signal flanked by two green ones is formed by the mergingof two forks from adjacent origins.B. Representative image and schematicdrawing of signals deriving from equal successive pulse labeling with IdUrd(green ) and CldUrd (red); Replication forks progress bidirectionally at thesame rate from the origin and incorporate the analogues forming asymmetrical replication signal. C. Representative image and schematicdrawing of a replication fork arrest, detected as an asymmetrical replicationsignal. D. Histograms showing the percentages of stalled/blockedreplication forks in BLM-proficient (black ) and BLM-deficient (blue ) cells.The number of asymmetrical replication bubbles, as shown in C, wasdivided by the total number of replication bubbles. Numbers at the top of thecolumns, number of events that have been counted.
Replication Defects and Checkpoint Activation in BS
Mol Cancer Res 2007;5(7). July 2007
719
Research. on August 10, 2020. © 2007 American Association for Cancermcr.aacrjournals.org Downloaded from

two halogenated deoxynucleotides and analyzed replication
fork speed and origin distribution using DNA fiber analysis by
molecular combing. In agreement with the published results, our
data show a reduced fork progression rate in human BLM-
deficient cells. Thus, the molecular combing can be viewed as an
improved and faster approach than the fiber autoradiography
assays. In contrast to our current and previous findings, Versini
et al. (30) showed increased fork velocity in yeast cells deficient
for sgs1 (the yeast BLM homologue) when analyzing replication
fork progression by molecular combing. Sgs1 is the only RecQ
helicase in budding yeast, whereas human cells have five RecQs,
including BLM. Additionally, Dsgs1 yeast cells display a faster
progression through the S phase, contrary to human BS cells,
which have a doubling time comparable to their counterpart with
functional BLM. All those differences may be invoked to account
for the difference in fork velocity between yeastDsgs1 and human
BLM-deficient cells. We found that, in human cells, the absence
of BLMhas a smaller effect in transformed cells, where a decrease
of 13% was observed in the fork velocity versus the 28% in the
primary cells. The transformation processes might have partially
rescued from the BS phenotype, at least in the cell lines compared
in this report (76). The reduced fork velocity appeared as a left
shift toward smaller values in the histogram where fork speeds
values are plotted (Fig. 5). This effect can be due to a real
reduction of the processivity of the replication machinery and/or
to an increased frequency of fork stalling. Previous studies
showed that, upon replication stress, BLM is relocated at the sites
of aberrant DNA replication (60, 62) and colocalizes
FIGURE 5. Reduced fork velocityin BLM-deficient cells. A. Represen-tative image of a replicon observedon a DNA fiber after a consecutivepulse labeling with IdUrd and CldUrd,detected in red and green tracks,respectively. A. Scheme showing thedirection of fork progression isinserted at the top. Double arrows,the origin of replication that fired atthe midpoint of the gap between thered IdUrd-labeled tracks. The result-ing forks progressed bidirectionally(open arrows ), thereby generating asymmetrical replicon signal. Replica-tion fork velocity, expressed in kilo-bases per minute, was obtained bymeasuring the length of each fluo-rescent track divided by the time ofthe pulse (40 min). White bar, 40 kb.B. Histogram showing replicationfork velocity distribution in trans-formed BLM-deficient PSNG13 andin the corresponding complementedPSNF5 cells. C. Histogram showingfork velocity in the primary normalGM00037 and BS GM01492 primaryuntransformed cells. Right of Band C, ranges of fork velocitycorresponding to the letters on theX-axis. The total number of fibersanalyzed for each cell line was 985for PSNF5, 757 for PSNG13, 170 forGM00037, and 260 for GM0001492.
Rao et al.
Mol Cancer Res 2007;5(7). July 2007
720
Research. on August 10, 2020. © 2007 American Association for Cancermcr.aacrjournals.org Downloaded from

with a number of repairs factors after DNA replication stress (62,
82, 83). Additionally, BLM can resolve Holliday junctions, a
structure generated by stalling replication forks, and has been
shown to promote the regression of a replication in vitro , a
mechanism commonly suggested for the restart of stalling fork
(10). However, past analysis could not assess the frequency of
stalled forks in BS cells because of technical limitations. Taking
advantage of themolecular combing-based approach, we show, in
this study, an increased frequency of arrested forks in BS cells,
which is the first direct evidence for a role of BLM in preventing
replication fork stalling in vivo.
We also found a shorter interorigin distance in BS cells
compared with the corresponding cells with functional BLM.
The difference was enhanced in primary cells, which showed a
mean peak interorigin spacing f25% shorter than BLM-
deficient cells. This higher frequency of origin firing observed
in BS cells can be viewed as a compensation mechanism for the
slower fork progression to guarantee the full duplication of the
genome without increasing the length of the S phase. Statistical
analysis was done on a subset of data obtained from each cell
type. The cutoff was established at 150 and 120 kb for the
transformed and the primary cells, respectively, after taking into
consideration the general shorter interorigin distance observed
in the primary cells (Fig. 6). Those values correspond to the
estimated length of chromatin loops that are anchored to the
nuclear matrix by the matrix attachment regions (MAR) in a
rosetta-like structure. A current model predicts that origins of
replication are positioned at the MARs, at the base of the loops,
which therefore form a structure to organize and regulate
origins of replication in clusters (84). Previous analysis done
by autoradiography of DNA fibers showed a smaller nonsig-
nificant difference between BS and normal cells (14). The
nonconstant stretching factor of the DNA molecules and
the use of a single labeling as well could have affected the
sensitivity of those approaches and their capability to detect
subtle differences. The comparison of single loci might allow
for the detection of subtle differences in the origin distribution.
However, in the whole genome–scale analysis done by Hand
et al. (14), the effect on the bulk interorigin distance could have
been insufficient to shift the population average.
In view of the experiments presented in this report, we
suggest that in the absence of BLM, cells display elevated rate
of endogenous replication fork stalling, which results in the
constitutive activation of the ATM-Chk2 checkpoint with the
formation of g-H2AX. Because such replicative lesions and
checkpoint activation slow down the average replication fork
velocity, we propose that BS cells may compensate by
activating more origins of replication to complete the full
replication of their genome in a timely manner.
Materials and MethodsCell Culture
Transformed BLM-deficient (PSNG13) and BLM-comple-
mented (PSNF5) fibroblasts (25) were grown in a-minimal
essential medium, 10% FCS, and 350 Ag/mL G418. Untrans-
formed, primary BS fibroblasts (GM01492) and fibroblasts
(GM00037) from a healthy individual were obtained from the
Coriell Cell Repository and maintained in DMEM supple-
mented with 10% FCS. Exponentially growing cells were
cultured at 37jC before experimental use.
Confocal Microscopy of Nuclear Protein Localization,Antibodies Used
Fibroblasts grown in Nunc chamber slides (Nalgene) using
0.5 mL of growth medium were fixed and permeabilized as
described previously using 4% paraformaldehyde and ice-cold
70% ethanol (13). Nonspecific binding was blocked using 8%
bovine serum albumin in PBS. Fixed cells were stained overnight
with primary antibodies (in 1% bovine serum albumin at 4jC)and tagged with fluorescent secondary antibodies (Molecular
Probes) for 2 h at room temperature. Primary antibodies for
g-H2AXwere obtained fromUpstate (anti-mouse) or gifted from
FIGURE 6. Reduced interorigin distance in BLM-deficient cells. A. Representative image and scheme of two adjacent replicons observed on individualDNA fibers. IdUrd was detected in red, and CldUrd was detected in green. The distance between the two origins (short double arrows ) corresponds to theinterorigin distance (long dashed double arrows ). The central green CldUrd-labeled track results from the merge of the forks coming from the neighboringorigins. White bar, 40 kb. B. Histogram showing interorigin distances in the transformed BLM-deficient (PSNG13) and in the complemented (PSNF5 ) celllines. C. Histogram of the interorigin distances in the primary normal (GM00037 ) and primary untransformed BS cells (GM01492 ). Line, boundary for thestatistical analysis. The Kolmogorov-Smirnov test was applied on the range of values indicated by the double-arrowed line in B and C. The total number offibers analyzed was 92 for PSNF5, 52 for PSNG13, 50 for GM00037, and 44 for GM01492.
Replication Defects and Checkpoint Activation in BS
Mol Cancer Res 2007;5(7). July 2007
721
Research. on August 10, 2020. © 2007 American Association for Cancermcr.aacrjournals.org Downloaded from

Dr. William Bonner (anti-rabbit). Antibodies for pS1981ATM and
pT68Chk2 were obtained from Cell Signaling Technologies.
Slides were mounted using Vectashield mounting liquid (Vector
Labs) and sealed. Immunofluorescence microscopy was done in
a Nikon Eclipse TE-300 confocal laser scanning microscope
system. Images were collected as .tif file and processed with
Adobe Photoshop (Adobe Systems Inc.). Nuclear boundaries
are outlined for clarity, acquired from simultaneous images
obtained after propidium iodide, 4¶,6-diamidino-2-phenylindole
(DAPI), or phase contrast images of the same panel. Before
analysis, we did control experiments confirming the specificity
of the pS1981ATM and pT68Chk2 antibodies in AT-deficient
(GM05849) and in Chk2-deficient (HCT15) cells. The anti-
bodies tested negative for the induction of nuclear foci in
response to camptothecin or IR in these cells. The pT68Chk2
antibody, from Cell Signaling Technologies, was derived using
the same immunogen as the pT68Chk2-specific antibody used by
Lukas et al. (ref. 80; Supplementary Fig. S1).
Detection of DNA Replication Foci Using IdUrd LabelingFor the detection of ssDNA regions of replication, the
incorporation of IdUrd was measured under nondenaturing
conditions (18, 74, 86). Cells were preincubated for 15 min
with 100 Amol/L IdUrd, followed by fixation with 4%
paraformaldehyde for 20 min at room temperature and
permeabilization with cold 70% ethanol at 4jC for at least
30 min. Nonspecific binding was blocked using 8% bovine
serum albumin in PBS for 1 h at room temperature. After
washings with PBS, cells were incubated with protein-targeted
or anti-IdUrd primary antibodies from BD Biosciences (in 1%
bovine serum albumin) overnight at 4jC, followed by
incubation with tagged secondary antibodies (Molecular Probes
Inc.) for 2 h at room temperature. The degree of colocalization
was represented by the Pearson’s coefficient of correlation
obtained using the Simple PCI image analysis software
(Compix, Inc.). Line scans for depiction of colocalization were
done using Image J software (NIH).
Metaphase Spreads Preparation and Immunofluores-cence Detection of Telomeres and c-H2AX Foci
Cells were treated with demecolcine solution (Sigma, D-
1925): transformed cells, 50 ng/mL of for 1.5 h at 37jC; primary
cells, 100 ng/mL for 4 h (72). The medium was aspirated, and
cells were gently rinsed with a hypotonic buffer [10 mmol/LTris-
HCl (pH, 7.4), 40 mmol/L glycerol, 20 mmol/L NaCl, 1 mmol/L
CaCl2, 0.5 mmol/L MgCl2]. The hypotonic buffer was added
to the cells for 15 min at 37jC. The amount of buffer depends
on the concentration of cells: the optimal concentration for
cytospinning is 5 � 104 cells/mL. About 200 AL of solution are
added to the cytospin funnel clamped to a regular glass slide.
Samples are cytospinned at 1800 rpm for 8 min. Slides are then
fixed with prechilled 80% ethanol, rinsed in acetone, dried, and
stored at 4jC. A hydrophobic ring is drawn around the sample
area with a PapPen. Slides are rinsed in PBS 1�. Approximately
200 AL of blocking solution (8% bovine serum albumin in Ca2+/
Mg2+-free PBS 1�) are added inside the ring, and slides are
incubated 1 h at room temperature (RT) in a humid chamber.
Slides are washed twice 5 min in Ca2+/Mg2+-free PBS 1�.
About 100 AL (0.5 AL of mouse anti g-H2AX [Upstate, 05-636]
in 100 AL 10% BSA) of the first antibody inside the ring was
incubated for 2 h at RT and was washed twice in Ca2+/Mg2+-free
PBS 1�, whereas 100 AL of the second antibody (0.5 AL of
anti-mouse Alex 488 [Molecular Probes] in 100 AL 10% BSA)
inside the ring was incubate for 1 h at RT. These were washed
thrice for 5 min in Ca2+/Mg2+-free TBS 1�. Exactly 100 AL of
50 mmol/L ethylene glycol-bis (E-3257, Sigma-Aldrich) were
added 1 min and 10 s at RT. The slides were washed twice in
Ca2+/Mg2+-free TBS 1�. From a telomere PNA FISH Kit/Cy3
(DAKO), 200 AL of pretreatment solution was added and
incubated for 10 min. The solution was washed twice in Ca2+/
Mg2+-free TBS 1�, and the slides were dehydrated in prechilled
70%-90%-100% ethanol. Slides are air-dried. The telomere
probe solution (7.5 AL) from the DAKO kit are added inside the
ring, incubated 3 min at 85jC, and incubated 1 h at RT in a
humid chamber. Slides are immersed in 1� Rinse solution from
the DAKO kit and incubated for 5 min at 65jC with the Wash
solution. Slides are then dehydrated in prechilled 70%-90%-
100% ethanol and air-dried. Slides are mounted with Vectashield
containing DAPI (Vector Labs, H-1200).
DNA Molecular Combing and Statistical AnalysisIn all cases, two independent sequential labelings, with
IdUrd and CldUrd, were done. A subconfluent asynchronous
population of cells was first labeled for 40 min with 100 Amol/L
IdUrd, washed with PBS 1�, and then labeled for another
40 min with 100 Amol/L CldUrd. PBS solution and
deoxynucleotide triphosphate–containing media were heated
at 37jC before labeling. Cells were trypsinized, pooled, and
resuspended in PBS 1� at 1% low-melting-point agarose to a
final cell concentration of 1 � 105 cells/100 AL. Cells were
embedded in pulsed-field gel electrophoresis agarose plugs that
were kept at +4jC for 30 min to prepare a protein-free solution
of high-molecular-weight genomic DNA. Agarose plugs were
resuspended in a suitable volume of EDTA (250 AL per plug)
and treated overnight at 50jC with 1% N-lauryl sarcosyl and 1
mg/mL proteinase K. Complete removal of digested proteins
and other degradation products was done by several gentle
washings in Tris-EDTA. Protein-free DNA plugs were then
stored in EDTA at 4jC or immediately used for combing. An
agarose plug was melted at 70jC for 20 min with 1.8 mL of
100 mmol/L MES (pH 6.5). The solution was kept at 42jC for
15 min and treated overnight with 2 AL h-agarase (Biolabs).
The solution was dropped into a Teflon reservoir. Silanized
coverslips were incubated into the DNA solution for 5 min to
let DNA molecules to anchor to the coverslip, and DNA was
combed using a combing apparatus (86, 87). Coverslips with
combed DNA were incubated 1.5 h at 60jC and incubated in
0.5 mol/L NaOH for 10 min with gentle shaking to denature the
DNA. After several quick washes in PBS 1�, coverslips were
incubated with the primary antibodies. All antibodies were
diluted in a 1% blocking solution (Boehringer) made in PBS
1�, incubated in a humid chamber and washed 3 � 3 min with
PBS 1�. First, 2/5 mouse anti-BrdUrd (BD PharMingen) + 2/5
rat anti-CldUrd (SeraLab) were incubated for 1 h at RT. Second,
1/25 donkey anti-mouse FITC (Jackson) + 1/25 donkey anti–
rat-594 (Molecular Probes) were incubated for 20 min at 37jCand mounted in Vectashield. The slides were scanned with an
inverted microscope using a 60� objective. Images were
Rao et al.
Mol Cancer Res 2007;5(7). July 2007
722
Research. on August 10, 2020. © 2007 American Association for Cancermcr.aacrjournals.org Downloaded from

recorded by IPLab, and fluorescent signals were measured
using either the home-made software Jmeasure (from the
Genome Stability Laboratory at the Pasteur Institute in Paris) or
ImageJ (from the National Cancer Institute). Removal of the
background was done in order to allow the reader to distinguish
more clearly the fluorescent signals.
Calibration of the software (ImageJ) for the measurements of
the fluorescent signals. E-DNA counterstained with YOYO-1, a
fluorescent intercalating molecule that emits green fluorescence,
was combed. Images of f100 molecules were captured with a
fluorescence microscope, and signals were measured in micro-
moles per liter with ImageJ after calibrating the software
according to the camera and to the objective used. According to
the known length of the E genome,? measurements showed that
1 Amol/L = 2 kb, in agreement with previous studies (68, 87).
Therefore, when combing the human genome and measuring
replication fluorescent signals, an internal control to each
experiment is not necessary: we calibrate the software according
to the objective and the camera used, and we obtained the length
in micromoles per liter that is than converted in kilobases.
Data were inserted in an Excel spreadsheet and analyzed by
KyPlot and SigmaPlot. The values of fork velocity and
interorigin distance were calculated for each single molecule
and plotted as a frequency distribution. Statistical values of
mean and median were obtained from a large set of sample data
and are therefore representative of the corresponding cell
population. The median corresponds to the most frequently
occurring measure and is usually more informative than the
mean in particular for highly skewed distributions, being less
sensitive to extreme scores. Fork velocities between the
samples were compared using the Kolmogorov-Smirnov test,
with a significance level of a = 0.05.
AcknowledgmentsWe thank Drs. Mirit Aladjem, William Bonner, Munira Amor-Gueret, JenniferSeiler, Gabriel Eichler, and Miria Ricchetti for helpful discussions and technicalassistance.
References1. Hickson ID. RecQ helicases: caretakers of the genome. Nat Rev Cancer 2003;3:169– 78.
2. German J. Bloom syndrome: a mendelian prototype of somatic mutationaldisease. Medicine (Baltimore) 1993;72:393–406.
3. German J. Bloom’s syndrome. XX. The first 100 cancers. Cancer GenetCytogenet 1997;93:100–6.
4. German J, Archibald R, Bloom D. Chromosomal breakage in a rare andprobably genetically determined syndrome of man. Science 1965;148:506 –7.
5. Gruber SB, Ellis NA, Scott KK, et al. BLM heterozygosity and the risk ofcolorectal cancer. Science 2002;297:2013.
6. Lowy AM, Kordich JJ, Gismondi V, Varesco L, Blough RI, Groden J.Numerous colonic adenomas in an individual with Bloom’s syndrome.Gastroenterology 2001;121:435–9.
7. Luo G, Santoro IM, McDaniel LD, et al. Cancer predisposition caused byelevated mitotic recombination in Bloom mice. Nat Genet 2000;26:424– 9.
8. Petkovic M, Dietschy T, Freire R, Jiao R, Stagljar I. The human Rothmund-Thomson syndrome gene product, RECQL4, localizes to distinct nuclear foci thatcoincide with proteins involved in the maintenance of genome stability. J Cell Sci2005;118:4261–9.
9. Stewart E, Chapman CR, Al-Khodairy F, Carr AM, Enoch T. rqh1+, a fissionyeast gene related to the Bloom’s and Werner’s syndrome genes, is required forreversible S phase arrest. EMBO J 1997;16:2682 –92.
10. Ralf C, Hickson ID, Wu L. The Bloom’s syndrome helicase can promote theregression of a model replication fork. J Biol Chem 2006;281:22839–46.
11. Brosh RM, Jr., Li JL, Kenny MK, et al. Replication protein A physicallyinteracts with the Bloom’s syndrome protein and stimulates its helicase activity.J Biol Chem 2000;275:23500– 8.
12. Imamura O, Fujita K, Itoh C, Takeda S, Furuichi Y, Matsumoto T. Wernerand Bloom helicases are involved in DNA repair in a complementary fashion.Oncogene 2002;21:954–63.
13. Rao VA, Fan AM, Meng L, et al. Phosphorylation of BLM, dissociation fromtopoisomerase IIIa, and colocalization with g-H2AX after topoisomerase I –induced replication damage. Mol Cell Biol 2005;25:8925 –37.
14. Hand R, German J. A retarded rate of DNA chain growth in Bloom’ssyndrome. Proc Natl Acad Sci U S A 1975;72:758–62.
15. Ockey CH. Quantitative replicon analysis of DNA synthesis in cancer-proneconditions and the defects in Bloom’s syndrome. J Cell Sci 1979;40:125–44.
16. Kapp LN, Painter RB. DNA fork displacement rates in human cells. BiochimBiophys Acta 1981;656:36–9.
17. Ockey CH, Saffhill R. Delayed DNA maturation, a possible cause of theelevated sister-chromatid exchange in Bloom’s syndrome. Carcinogenesis 1986;7:53 –7.
18. Rassool FV, North PS, Mufti GJ, Hickson ID. Constitutive DNA damage islinked to DNA replication abnormalities in Bloom’s syndrome cells. Oncogene2003;22:8749–57.
19. Ellis NA, Proytcheva M, Sanz MM, Ye TZ, German J. Transfection of BLMinto cultured bloom syndrome cells reduces the sister-chromatid exchange ratetoward normal. Am J Hum Genet 1999;65:1368 –74.
20. Schroeder TM. Sister chromatid exchanges and chromatid interchanges inBloom’s syndrome. Humangenetik 1975;30:317–23.
21. Chaganti RS, Schonberg S, German J. A manyfold increase in sisterchromatid exchanges in Bloom’s syndrome lymphocytes. Proc Natl Acad SciU S A 1974;71:4508–12.
22. Khakhar RR, Cobb JA, Bjergbaek L, Hickson ID, Gasser SM. RecQhelicases: multiple roles in genome maintenance. Trends Cell Biol 2003;13:493 –501.
23. Yankiwski V, Marciniak RA, Guarente L, Neff NF. Nuclear structure innormal and Bloom syndrome cells. Proc Natl Acad Sci U S A 2000;97:5214– 9.
24. Yankiwski V, Noonan JP, Neff NF. The C-terminal domain of the Bloomsyndrome DNA helicase is essential for genomic stability. BMC Cell Biol 2001;2:11.
25. Gaymes TJ, North PS, Brady N, Hickson ID, Mufti GJ, Rassool FV.Increased error-prone non homologous DNA end-joining—a proposed mecha-nism of chromosomal instability in Bloom’s syndrome. Oncogene 2002;21:2525– 33.
26. Runger TM, Kraemer KH. Joining of linear plasmid DNA is reduced anderror-prone in Bloom’s syndrome cells. EMBO J 1989;8:1419– 25.
27. Cheok CF, Wu L, Garcia PL, Janscak P, Hickson ID. The Bloom’s syndromehelicase promotes the annealing of complementary single-stranded DNA. NucleicAcids Res 2005;33:3932 –41.
28. Wang W, Seki M, Narita Y, et al. Possible association of BLM in decreasingDNA double strand breaks during DNA replication. EMBO J 2000;19:3428 –35.
29. Hu P, Beresten SF, van Brabant AJ, et al. Evidence for BLM andtopoisomerase IIIa interaction in genomic stability. Hum Mol Genet 2001;10:1287– 98.
30. Versini G, Comet I, Wu M, Hoopes L, Schwob E, Pasero P. The yeast Sgs1helicase is differentially required for genomic and ribosomal DNA replication.EMBO J 2003;22:1939– 49.
31. Wu L, Hickson ID. RecQ helicases and topoisomerases: components of aconserved complex for the regulation of genetic recombination. Cell Mol Life Sci2001;58:894–901.
32. Raynard S, Bussen W, Sung P. A double Holliday junction dissolvasomecomprising BLM, topoisomerase IIIa, and BLAP75. J Biol Chem 2006;281:13861 –4.
33. Amor-Gueret M. Bloom syndrome, genomic instability and cancer: the SOS-like hypothesis. Cancer Lett 2006;236:1– 12.
34. Bischof O, Kim SH, Irving J, Beresten S, Ellis NA, Campisi J. Regulationand localization of the Bloom syndrome protein in response to DNA damage.J Cell Biol 2001;153:367– 80.
35. Johnson FB, Lombard DB, Neff NF, et al. Association of the Bloomsyndrome protein with topoisomerase IIIa in somatic and meiotic cells. CancerRes 2000;60:1162– 7.
36. Wu L, Davies SL, North PS, et al. The Bloom’s syndrome gene productinteracts with topoisomerase III. J Biol Chem 2000;275:9636–44.
37. Wu L, Davies SL, Levitt NC, et al. Potential role for the BLM helicase in
Replication Defects and Checkpoint Activation in BS
Mol Cancer Res 2007;5(7). July 2007
723
Research. on August 10, 2020. © 2007 American Association for Cancermcr.aacrjournals.org Downloaded from

recombinational repair via a conserved interaction with RAD51. J Biol Chem2001;276:19375– 81.
38. Wu L, Hickson ID. The Bloom’s syndrome helicase suppresses crossing overduring homologous recombination. Nature 2003;426:870–4.
39. Cheok CF, Bachrati CZ, Chan KL, Ralf C, Wu L, Hickson ID. Roles of theBloom’s syndrome helicase in the maintenance of genome stability. Biochem SocTrans 2005;33:1456–9.
40. Lillard-Wetherell K, Machwe A, Langland GT, et al. Association andregulation of the BLM helicase by the telomere proteins TRF1 and TRF2. HumMol Genet 2004;13:1919–32.
41. Karow JK, Chakraverty RK, Hickson ID. The Bloom’s syndrome geneproduct is a 3¶-5¶ DNA helicase. J Biol Chem 1997;272:30611–4.
42. Karow JK, Constantinou A, Li JL, West SC, Hickson ID. The Bloom’ssyndrome gene product promotes branch migration of Holliday junctions. ProcNatl Acad Sci U S A 2000;97:6504–8.
43. Plank JL, Wu J, Hsieh TS. Topoisomerase IIIa and Bloom’s helicase canresolve a mobile double Holliday junction substrate through convergent branchmigration. Proc Natl Acad Sci U S A 2006;103:11118–23.
44. Rogakou EP, Pilch DR, Orr AH, Ivanova VS, Bonner WM. DNA double-stranded breaks induce histone H2AX phosphorylation on serine 139. J BiolChem 1998;273:5858– 68.
45. Bassing CH, Alt FW. H2AX may function as an anchor to hold brokenchromosomal DNA ends in close proximity. Cell Cycle 2004;3:149–53.
46. Redon C, Pilch D, Rogakou E, Sedelnikova O, Newrock K, Bonner W.Histone H2A variants H2AX and H2AZ. Curr Opin Genet Dev 2002;12:162–9.
47. Celeste A, Petersen S, Romanienko PJ, et al. Genomic instability in micelacking histone H2AX. Science 2002;296:922 –7.
48. Fernandez-Capetillo O, Lee A, Nussenzweig M, Nussenzweig A. H2AX: thehistone guardian of the genome. DNA Repair (Amst) 2004;3:959 –67.
49. Paull TT, Rogakou EP, Yamazaki V, Kirchgessner CU, Gellert M, BonnerWM. A critical role for histone H2AX in recruitment of repair factors to nuclearfoci after DNA damage. Curr Biol 2000;10:886–95.
50. Shroff R, Arbel-Eden A, Pilch D, et al. Distribution and dynamics ofchromatin modification induced by a defined DNA double-strand break. Curr Biol2004;14:1703 –11.
51. Pilch DR, Sedelnikova OA, Redon C, Celeste A, Nussenzweig A, BonnerWM. Characteristics of g-H2AX foci at DNA double-strand breaks sites.Biochem Cell Biol 2003;81:123– 9.
52. Bakkenist CJ, Kastan MB. DNA damage activates ATM throughintermolecular autophosphorylation and dimer dissociation. Nature 2003;421:499– 506.
53. Bartek J, Lukas J. DNA repair: damage alert. Nature 2003;421:486 –8.
54. Syljuasen RG, Sorensen CS, Hansen LT, et al. Inhibition of human Chk1causes increased initiation of DNA replication, phosphorylation of ATR targets,and DNA breakage. Mol Cell Biol 2005;25:3553 –62.
55. O’Driscoll M, Jeggo PA. The role of double-strand break repair—insightsfrom human genetics. Nat Rev Genet 2006;7:45–54.
56. Pommier Y, Weinstein JN, Aladjem MI, Kohn KW. Chk2 molecular inter-action map and rationale for Chk2 inhibitors. Clin Cancer Res 2006;12:2657– 61.
57. Ahn JY, Li X, Davis HL, Canman CE. Phosphorylation of threonine 68promotes oligomerization and autophosphorylation of the Chk2 protein kinase viathe forkhead-associated domain. J Biol Chem 2002;277:19389–95.
58. Schwarz JK, Lovly CM, Piwnica-Worms H. Regulation of the Chk2 proteinkinase by oligomerization-mediated cis- and trans-phosphorylation. Mol CancerRes 2003;1:598 –609.
59. Xu X, Tsvetkov LM, Stern DF. Chk2 activation and phosphorylation-dependent oligomerization. Mol Cell Biol 2002;22:4419–32.
60. Davies SL, North PS, Dart A, Lakin ND, Hickson ID. Phosphorylation of theBloom’s syndrome helicase and its role in recovery from S-phase arrest. Mol CellBiol 2004;24:1279–91.
61. Ho CC, Siu WY, Lau A, Chan WM, Arooz T, Poon RY. Stalled replicationinduces p53 accumulation through distinct mechanisms from DNA damagecheckpoint pathways. Cancer Res 2006;66:2233 –41.
62. Sengupta S, Robles AI, Linke SP, et al. Functional interaction between BLMhelicase and 53BP1 in a Chk1-mediated pathway during S-phase arrest. J CellBiol 2004;166:801 –13.
63. Bartkova J, Horejsi Z, Koed K, et al. DNA damage response as a candidateanti-cancer barrier in early human tumorigenesis. Nature 2005;434:864 –70.
64. Gorgoulis VG, Vassiliou LV, Karakaidos P, et al. Activation of the DNAdamage checkpoint and genomic instability in human precancerous lesions.Nature 2005;434:907 –13.
65. Hoglund P. DNA damage and tumor surveillance: one trigger for twopathways. Sci STKE 2006;317, pe2, 1 –3.
66. Lebofsky R, Bensimon A. DNA replication origin plasticity and perturbedfork progression in human inverted repeats. Mol Cell Biol 2005;25:6789 –97.
67. Herrick J, Bensimon A. Single molecule analysis of DNA replication.Biochimie 1999;81:859–71.
68. Bensimon AS, A. Chiffaudel, A. Croquette, V. Heslot, F. Bensimon.Alignment and sensitive detection of DNA by a moving interface. Science 1994;265:2096– 8.
69. Takemura H, Rao VA, Sordet O, et al. Defective Mre11-dependent activationof Chk2 by ataxia telangiectasia mutated in colorectal carcinoma cells in responseto replication-dependent DNA double strand breaks. J Biol Chem 2006;281:30814 –23.
70. McManus KJ, Hendzel MJ. ATM-dependent DNA damage-independentmitotic phosphorylation of H2AX in normally growing mammalian cells. MolBiol Cell 2005;16:5013 –25.
71. Ichijima Y, Sakasai R, Okita N, Asahina K, Mizutani S, Teraoka H.Phosphorylation of histone H2AX at M phase in human cells without DNAdamage response. Biochem Biophys Res Commun 2005;336:807 –12.
72. Nakamura A, Sedelnikova OA, Redon C, et al. Techniques for g-H2AXdetection. Methods Enzymol 2006;409:236 –50.
73. Mandell JG, Goodrich KJ, Bahler J, Cech TR. Expression of a RecQ helicasehomolog affects progression through crisis in fission yeast lacking telomerase.J Biol Chem 2005;280:5249–57.
74. Raderschall E, Golub EI, Haaf T. Nuclear foci of mammalian recombinationproteins are located at single-stranded DNA regions formed after DNA damage.Proc Natl Acad Sci U S A 1999;96:1921– 6.
75. Braybrooke JP, Li JL, Wu L, Caple F, Benson FE, Hickson ID. Functionalinteraction between the Bloom’s syndrome helicase and the RAD51 paralog,RAD51L3 (RAD51D). J Biol Chem 2003;278:48357 –66.
76. Conti C, Sacca B, Herrick J, Lalou C, Pommier Y, Bensimon A. Replicationfork velocities at adjacent replication origins are co-ordinately modified duringDNA replication in human cells. MBC. In press 2007.
77. Bekker-Jensen S, Lukas C, Kitagawa R, et al. Spatial organization of themammalian genome surveillance machinery in response to DNA strand breaks.J Cell Biol 2006;173:195– 206.
78. Franco S, Gostissa M, Zha S, et al. H2AX prevents DNA breaks fromprogressing to chromosome breaks and translocations. Mol Cell 2006;21:201 – 14.
79. Xie A, Puget N, Shim I, et al. Control of sister chromatid recombination byhistone H2AX. Mol Cell 2004;16:1017– 25.
80. Lukas C, Falck J, Bartkova J, Bartek J, Lukas J. Distinct spatiotemporaldynamics of mammalian checkpoint regulators induced by DNA damage. NatCell Biol 2003;5:255 –60.
81. Hand R, German J. Bloom’s syndrome: DNA replication in culturedfibroblasts and lymphocytes. Hum Genet 1977;38:297–306.
82. Wang Y, Cortez D, Yazdi P, Neff N, Elledge SJ, Qin J. BASC, a supercomplex of BRCA1-associated proteins involved in the recognition and repair ofaberrant DNA structures. Genes Dev 2000;14:927–39.
83. Pichierri P, Franchitto A, Rosselli F. BLM and the FANC proteins collaboratein a common pathway in response to stalled replication forks. EMBO J 2004;23:3154– 63.
84. Berezney R, Mortillaro MJ, Ma H, Wei X, Samarabandu J. The nuclearmatrix: a structural milieu for genomic function. Int Rev Cytol 1995;162A:1 –65.
85. Rubbi CP, Milner J. Analysis of nucleotide excision repair by detection ofsingle-stranded DNA transients. Carcinogenesis 2001;22:1789 –96.
86. Conti C, Caburet S, Bensimon A. Molecular combing. In: Robinson JP,Darzynkiewicz Z, Nolan J, et al., editors. Current protocols in cytometry. NewJersey: John Wiley & Sons; 2003. p.8.10.1 –8.10.23.
87. Michalet X, Ekong R, Fougerousse F, et al. Dynamic molecular combing:stretching the whole human genome for high-resolution studies. Science 1997;277:1518– 23.
Rao et al.
Mol Cancer Res 2007;5(7). July 2007
724
Research. on August 10, 2020. © 2007 American Association for Cancermcr.aacrjournals.org Downloaded from

2007;5:713-724. Mol Cancer Res V. Ashutosh Rao, Chiara Conti, Josee Guirouilh-Barbat, et al. DNA Replication Arrested Forks
Deficient Cells Is Related to−Bloom's Syndrome Helicase -H2AX-ATM-Chk2 Checkpoint Activation inγEndogenous
Updated version
http://mcr.aacrjournals.org/content/5/7/713
Access the most recent version of this article at:
Material
Supplementary
http://mcr.aacrjournals.org/content/suppl/2007/07/27/5.7.713.DC1
Access the most recent supplemental material at:
Cited articles
http://mcr.aacrjournals.org/content/5/7/713.full#ref-list-1
This article cites 84 articles, 41 of which you can access for free at:
Citing articles
http://mcr.aacrjournals.org/content/5/7/713.full#related-urls
This article has been cited by 24 HighWire-hosted articles. Access the articles at:
E-mail alerts related to this article or journal.Sign up to receive free email-alerts
Subscriptions
Reprints and
To order reprints of this article or to subscribe to the journal, contact the AACR Publications
Permissions
Rightslink site. (CCC)Click on "Request Permissions" which will take you to the Copyright Clearance Center's
.http://mcr.aacrjournals.org/content/5/7/713To request permission to re-use all or part of this article, use this link
Research. on August 10, 2020. © 2007 American Association for Cancermcr.aacrjournals.org Downloaded from