endocycle-related tubular cell hypertrophy and progenitor
TRANSCRIPT

Zurich Open Repository andArchiveUniversity of ZurichMain LibraryStrickhofstrasse 39CH-8057 Zurichwww.zora.uzh.ch
Year: 2018
Endocycle-related tubular cell hypertrophy and progenitor proliferationrecover renal function after acute kidney injury
Lazzeri, Elena ; Angelotti, Maria Lucia ; Peired, Anna ; Conte, Carolina ; Marschner, Julian A ; Maggi,Laura ; Mazzinghi, Benedetta ; Lombardi, Duccio ; Melica, Maria Elena ; Nardi, Sara ; Ronconi, Elisa ;
Sisti, Alessandro ; Antonelli, Giulia ; Becherucci, Francesca ; De Chiara, Letizia ; Guevara, RicardoRomero ; Burger, Alexa ; Schaefer, Beat ; Annunziato, Francesco ; Anders, Hans-Joachim ; Lasagni,
Laura ; Romagnani, Paola
Abstract: Acute kidney injury (AKI) is considered largely reversible based on the capacity of survivingtubular cells to dedifferentiate and replace lost cells via cell division. Here we show by tracking individualtubular cells in conditional Pax8/Confetti mice that kidney function is recovered after AKI despite sub-stantial tubular cell loss. Cell cycle and ploidy analysis upon AKI in conditional Pax8/FUCCI2aR miceand human biopsies identify endocycle-mediated hypertrophy of tubular cells. By contrast, a small subsetof Pax2+ tubular progenitors enriches via higher stress resistance and clonal expansion and regeneratesnecrotic tubule segments, a process that can be enhanced by suitable drugs. Thus, renal functional re-covery upon AKI involves remnant tubular cell hypertrophy via endocycle and limited progenitor-drivenregeneration that can be pharmacologically enhanced.
DOI: https://doi.org/10.1038/s41467-018-03753-4
Posted at the Zurich Open Repository and Archive, University of ZurichZORA URL: https://doi.org/10.5167/uzh-165454Journal ArticlePublished Version
The following work is licensed under a Creative Commons: Attribution 4.0 International (CC BY 4.0)License.
Originally published at:Lazzeri, Elena; Angelotti, Maria Lucia; Peired, Anna; Conte, Carolina; Marschner, Julian A; Maggi,Laura; Mazzinghi, Benedetta; Lombardi, Duccio; Melica, Maria Elena; Nardi, Sara; Ronconi, Elisa; Sisti,Alessandro; Antonelli, Giulia; Becherucci, Francesca; De Chiara, Letizia; Guevara, Ricardo Romero;Burger, Alexa; Schaefer, Beat; Annunziato, Francesco; Anders, Hans-Joachim; Lasagni, Laura; Romag-nani, Paola (2018). Endocycle-related tubular cell hypertrophy and progenitor proliferation recover renalfunction after acute kidney injury. Nature Communications, 9(1):1344.DOI: https://doi.org/10.1038/s41467-018-03753-4

ARTICLE
Endocycle-related tubular cell hypertrophy andprogenitor proliferation recover renal function afteracute kidney injuryElena Lazzeri1,2, Maria Lucia Angelotti1,2, Anna Peired 1,2, Carolina Conte1,2, Julian A. Marschner3,
Laura Maggi2, Benedetta Mazzinghi4, Duccio Lombardi 1,2, Maria Elena Melica1, Sara Nardi1,2, Elisa Ronconi1,2,
Alessandro Sisti1,4, Giulia Antonelli1,2, Francesca Becherucci4, Letizia De Chiara4, Ricardo Romero Guevara1,2,
Alexa Burger5, Beat Schaefer6, Francesco Annunziato2, Hans-Joachim Anders3, Laura Lasagni1,2
& Paola Romagnani 1,2,4
Acute kidney injury (AKI) is considered largely reversible based on the capacity of surviving
tubular cells to dedifferentiate and replace lost cells via cell division. Here we show by
tracking individual tubular cells in conditional Pax8/Confetti mice that kidney function is
recovered after AKI despite substantial tubular cell loss. Cell cycle and ploidy analysis upon
AKI in conditional Pax8/FUCCI2aR mice and human biopsies identify endocycle-mediated
hypertrophy of tubular cells. By contrast, a small subset of Pax2+ tubular progenitors enri-
ches via higher stress resistance and clonal expansion and regenerates necrotic tubule
segments, a process that can be enhanced by suitable drugs. Thus, renal functional recovery
upon AKI involves remnant tubular cell hypertrophy via endocycle and limited progenitor-
driven regeneration that can be pharmacologically enhanced.
DOI: 10.1038/s41467-018-03753-4 OPEN
1Department of Clinical and Experimental Biomedical Sciences, University of Florence, Florence, Italy. 2 Excellence Centre for Research, Transfer and High
Education for the development of DE NOVO Therapies (DENOTHE), Florence, Italy. 3Division of Nephrology, Medizinische Klinik and Poliklinik IV, Klinikum
der LMU München, Munich, Germany. 4Nephrology Unit and Meyer Children’s University Hospital, Florence, Italy. 5 Institute of Molecular Life Sciences,
University of Zurich, Zurich, Switzerland. 6Department of Oncology and Children’s Research Center, University Children’s Hospital, Zurich, Switzerland.
These authors contributed equally: Elena Lazzeri, Maria Lucia Angelotti. Correspondence and requests for materials should be addressed to
P.R. (email: [email protected])
NATURE COMMUNICATIONS | (2018) 9:1344 |DOI: 10.1038/s41467-018-03753-4 |www.nature.com/naturecommunications 1
1234567890():,;

Acute kidney injury (AKI) is a global health concernimpacting ∼13.3 million patients1 and 1.7 million deathsper year2,3. AKI is defined by an acute deterioration of
renal excretory function1–3. If not lethal in the acute phase, AKI isconsidered reversible as implied by recovery of urine productionand biomarkers of renal function3. However, even mild AKIepisodes imply a substantial risk for subsequent chronic kidneydisease (CKD)1, but the pathophysiological basis for this
phenomenon remains uncertain4. Indeed, the current patho-physiological concept involves the assumption that every tubularepithelial cell (TEC) surviving the injury phase has the potentialto dedifferentiate and proliferate to replace lost cells or even re-epithelialize denuded tubule segments5,6. This concept has beenevidenced by immunolabelling for cell cycle markers, such as Ki-67, proliferating cell nuclear antigen (PCNA) or 5-bromo-2′-deoxyuridine (BrdU) uptake7. As a second concept, tubule
a
b
i
AQP2
c
d
e f
j k l
g h
GF
R (
% o
ver
baselin
e)
No. of P
ax8+
cells
/ fie
ld
No. of P
ax8+
cells
/fie
ld
No. of P
ax8+
AQ
P2– c
ells
/fie
ld
BU
N (
mg/d
L)
GF
R (
% o
ver
baselin
e)
Clo
ne fre
quency o
f
Pax8+
AQ
P2– c
ells
(%
)
% o
f P
ax8+
AQ
P2– c
ells
% o
f P
ax8+
AQ
P2–
clo
nogenic
cells
Post-
ischem
ic A
KI
Nephro
toxic
AK
I
120
T0 IRI T30
110
100
90
80
70
60 ***
*
**
*
*
*
* *
* *
**
**
*
***
*
*
***
2010
600
T0
IRI T30
500
400
300
300 120110100
100 100
80
40
60
20
0
100
80
40
60
20
0
11 cellsNew Pax8+AQP2– cells
Pax8+AQP2– cells10 cells9 cells8 cells7 cells6 cells5 cells4 cells3 cells2 cells1 cell
95
90
85
8050
T0 T0
T30
Sham
IRI T
30
IRI T
30
IRI T
30
Gly
T30
Gly
T30
Gly
T30
908070605040302010
0
Glycerol
Healthy250
200
150
100
50
0
200
100
0
600
T0
Gly T30
T0
Gly T30
500
400
300
200
100
0
500
400
300
200
100
0
Total
cells
AQP2–
cells
AQP1+
cells
0
01 4
0 2 4 7
Days Days
14 21 30 0 2 4 7 14 21 30
7
Days
14 21 30
Cort
ex
OS
OM
ISO
M
ARTICLE NATURE COMMUNICATIONS | DOI: 10.1038/s41467-018-03753-4
2 NATURE COMMUNICATIONS | (2018) 9:1344 |DOI: 10.1038/s41467-018-03753-4 |www.nature.com/naturecommunications

regeneration may also involve a specific subset of TECs, referredto as tubular progenitors8–10. We set three hypotheses: (1) theoverall capacity of tubular regeneration after injury is largelyoverestimated; (2) cell cycle markers may not consistentlyrepresent cell division; (3) regeneration is limited to tubularprogenitors and other TECs entering the cell cycle after AKIundergo endocycle-related hypertrophy.
ResultsFunction recovery upon AKI masks a substantial TEC loss. Toevaluate TEC loss and regeneration after AKI, we applied alineage tracing approach using conditional Pax8.rtTA;TetO.Cre;R26.Confetti (Pax8/Confetti) mice11, enabling a doxycycline-induced random labeling of all TECs by permanent recombina-tion of a single-color-encoding gene (red, yellow, green, or bluefluorescent proteins, RFP, YFP, GFP, and CFP; SupplementaryFig. 1a)12. Transient unilateral ischemia reperfusion injury (IRI)was then induced as detailed in Supplementary Fig. 1b, c. Tubularnecrosis at day 2 was partially restored at day 30 and associatedwith some focal interstitial fibrosis (Supplementary Fig. 1d).Blood urea nitrogen (BUN) was unchanged, even if at day 30 asignificant loss-of-kidney weight had occurred (SupplementaryFig. 1e, f). Since BUN was too insensitive to detect the decline ofkidney function, we directly measured glomerular filtration rate(GFR). GFR strongly declined at day 1 and partially recovered atday 14 remaining stable thereafter indicating CKD after AKI(Fig. 1a). Lineage tracing up to day 30 showed the presence ofsingle-colored clones in outer stripe of the outer medulla (OSOM)(Fig. 1b, c). Therefore, all further analyses focused on this area.Quantitative analysis revealed a substantial and sustained loss-of-30.5 ± 2.8% of total Confetti-labelled TECs (Fig. 1d). Similarresults were obtained when TEC loss was evaluated afterimmunostaining for aquaporin-2 (AQP2) to exclude from thecount collecting ducts (23.8 ± 5.9%; Fig. 1d), or for aquaporin-1(AQP1), to limit the analysis to proximal TECs up to the thindescending limb of the Henle’s loop (32.5 ± 7.1%; Fig. 1d andSupplementary Fig. 1g–i). No transgene leakage was observed inhealthy or ischemic mice (Supplementary Fig. 1j, k). Similar datawere obtained in glycerol-induced AKI, a model of toxic tubulenecrosis, either when we quantified total Confetti or AQP2−Confetti TECs (Fig. 1e–h). Thus, function recovery upon AKImasks a substantial and sustained TEC loss.
A small TEC subset proliferates after AKI. To test the currentdogma of kidney regeneration via mitotic cell division of sur-viving TECs, we quantified their progeny. Administration of alower doxycycline dose to label few TECs enabled precise clone
counts at day 30 after IRI (Supplementary Fig. 1l, m). Healthymice (T0), mice that underwent a prolonged washout for 30 days(age-matched controls, T30) and sham-operated mice presented asimilar clone size frequency (Fig. 1j; NS, Eq. 1 in Methods). Ofnote, the percentage of single cell clones decreased from 92.4 ±0.9% at T0 to 78.9 ± 0.9% at day 30 after IRI. By contrast, clonesconsisting of 2 or more cells increased from 7.4 ± 0.9% at T0 (6.4± 0.7 of doublets and 1 ± 0.2% of triplets) to 21.1 ± 0.9% at T30after IRI (11.9 ± 1.5% of doublets, 4.3 ± 0.2% of triplets and 4.9 ±1.4% ≥4 cells, with single colored clones of up to 11 cells; Fig. 1i, j,Supplementary Fig. 2, Eq. 1 in Methods). Newly generated cells,had replaced only 54.1 ± 10.1% of lost AQP2− TECs (Fig. 1k,Eq. 3 in Methods). The clones observed at day 30 after IRIrepresented 21.1 ± 0.9% of those AQP2− survived, but were theprogeny of only 8.6 ± 1.6% of AQP2− TECs present at T0 (Fig. 1l,Supplementary Fig. 2, Eq. 2 in Methods). Similar results wereobtained in the nephrotoxic AKI model, where 35.4 ± 5.7% of lostcells were replaced in each kidney (Fig. 1k, Eq. 3 in Methods) andultimately derived from 3.5 ± 0.1% of AQP2− TECs present at T0(Fig. 1l, Eq. 2 in Methods). Together, these results show that uponAKI only a small TEC subset undergoes mitosis to replace nomore than ∼50% of injured cells.
Kidney tubules contain a distinct Pax2+ cell subset. Usingconditional Pax2.rtTA;TetO.Cre;R26.Confetti (Pax2/Confetti) mice(Supplementary Fig. 3a), we recently identified Pax2+ cells of theBowman’s capsule as progenitors regenerating podocytes uponglomerular injury13. These mice exhibited no leakage and Pax2promoter fidelity as showed in Supplementary Fig. 3b–e and alreadypreviously reported14,15. Pax2+ cells were also found in a scatteredpattern within tubules (Fig. 2a–h) along specific segments of thenephron (Fig. 2d). In particular, they represented 1.6 ± 0.5% ofmegalin+ TECs in S1 and S2 segments (Fig. 2h), 9.8 ± 0.9% ofAQP1+ TECs in S3 segment (Fig. 2a, e) and 12.3 ± 1.2% ofTamm–Horsfall Protein+ (THP+) distal TECs (Fig. 2b, f).
Induction of cell labeling followed by 30 days washout orcontinued doxycycline exposure for the same period of timerevealed stable numbers of Pax2 cells (Fig. 2i–l). In addition,induction of cell labeling at 12 weeks of age (Supplementary Fig. 3f)revealed a number of Pax2+ cells similar to that observed in miceinduced at 5 weeks of age (68.8 ± 4.9 vs. 62 ± 1.2; NS). Thus, Pax2+TECs are a distinct and stable cell population in mice.
Pax2+ cells show increased survival and clonogenicity afterAKI. To see if and how the Pax2+ TEC subset contribute totubule regeneration upon AKI, injured kidneys were subjected tolineage tracing over 30 days after IRI and nephrotoxic injury
Fig. 1 Only a small TEC subset proliferates after AKI and partially replaces lost TECs. a GFR in ischemic mice (n= 13) normalized on the GFR at baseline
and on sham-operated control group (n= 5). One-way ANOVA post hoc Tukey. b, c Juxtaposed images of a Pax8/Confetti mouse kidney at day 0 (T0,
n= 5) (b) and 30 after IRI (IRI T30, n= 4) (c). Arrows indicate single-colored clones. OSOM outer stripe of outer medulla; ISOM inner stripe of outer
medulla. d Number of Pax8+, Pax8+AQP2−, and Pax8+AQP1+ cells in Pax8/Confetti mice at day 0 (T0, white column, n= 5) and at day 30 after IRI (IRI
T30, gray column, n= 4). Mann–Whitney test. *p < 0.05, **p < 0.01 IRI T30 vs. T0. e BUN in healthy Pax8/Confetti mice (n= 5) and in Pax8/Confetti mice
after nephrotoxic AKI (n= 6). One-way ANOVA post hoc Tukey *p < 0.05 glycerol-treated mice vs. healthy. f GFR in Pax8/Confetti mice after nephrotoxic
AKI (n= 7) normalized on the GFR at baseline and on healthy mice (n= 5). One-way ANOVA post hoc Tukey. g Number of Pax8+ cells in Pax8/Confetti
mice at day 0 (T0, white column, n= 5) and day 30 after nephrotoxic AKI (Gly T30, gray with sparse pattern column, n= 4). Mann–Whitney test *p <
0.05 Gly T30 vs. T0. h Number of Pax8+AQP2− cells in Pax8/Confetti mice at day 0 (T0, white column, n= 5) and day 30 after nephrotoxic AKI (Gly
T30, gray with sparse pattern column, n= 4). Mann–Whitney test *p < 0.05 Gly T30 vs. T0. i Single-colored clones in AQP2− tubules in Pax8/Confetti
mice at day 30 after IRI (n= 4). AQP2 staining is white. j Clone frequency analysis of Pax8+AQP2− cells in Pax8/Confetti mice at day 0 (T0, n= 5), in
age-matched controls (T30, n= 4), in sham-operated mice (n= 4), at day 30 after IRI (IRI T30, n= 4) and at day 30 after nephrotoxic AKI (Gly T30, n=
4). Mann–Whitney test *p < 0.05 IRI T30 vs. T0, T30, sham and Gly T30 vs. T0 and T30. k Percentage of Pax8+AQP2− cells in Pax8/Confetti mice at day
0 (T0, n= 5), at day 30 after IRI (IRI T30, n= 4) and at day 30 after nephrotoxic AKI (Gly T30, n= 4). Mann–Whitney test *p < 0.05 IRI T30 and Gly T30
vs. T0. l Percentage of Pax8+AQP2− clonogenic cells (gray column) in Pax8/Confetti mice at day 30 after IRI (IRI T30, n= 4) and at day 30 after
nephrotoxic AKI (Gly T30, n= 4) vs. day 0 (n= n= 5). The white column is the percentage of Pax8+AQP2− that did not generate clones. Data are mean
± SEM. Scale bars 40 µm. Pax8+= Pax8 lineage-positive cells
NATURE COMMUNICATIONS | DOI: 10.1038/s41467-018-03753-4 ARTICLE
NATURE COMMUNICATIONS | (2018) 9:1344 |DOI: 10.1038/s41467-018-03753-4 |www.nature.com/naturecommunications 3

AQP1
a
e
j k
f g h
AQP1
AQP2 AQP2
AQP2 MegalinTHP
b cC
ort
ex
Cort
ex
OS
OM
OS
OM
ISO
M
ISO
MIn
ner
medulla
THP AQP2
T30
Nephron
AQP1
AQP2
THP
d
i l
Induction
Induction
–17 days
–17 days 0 day 30 days
–7 days 0 day 30 days
Kill
Kill
T0 T30
Kill
Doxycycline 2 mg/ml
Doxycycline 2 mg/ml Doxycycline 2 mg/ml
Doxycycline T30
Doxycycline T30
NS
T30
Doxy T
30
100
80
60
40
20
0
No. of P
ax2+
AQ
P2– c
ells
/fie
ld
Washout
Fig. 2 Kidney tubules contain a distinct, predefined Pax2 lineage-positive tubular cell subset. a–c Juxtaposed confocal images of a kidney section from
cortex to inner stripe of outer medulla in adult Pax2/Confetti mice (n= 4). Confetti reporter shows Pax2 lineage-positive single cells scattered within the
proximal tubules, distal tubules and collecting ducts as demonstrated by immunolabelling for AQP1 (a), THP (b) and AQP2 (c), respectively (white).
OSOM outer stripe of outer medulla; ISOM inner stripe of outer medulla. Scale bars 40 µm. d Schematic localization of Pax2− lineage-positive cells (red
dots) in the proximal tubule, stained by AQP1 (light gray), in the thick ascending limb and in the distal tubule, stained by THP (dark gray), of the nephron.
e–h Representative images of a kidney section in healthy Pax2/Confetti mice showing (n= 4) the distribution of Pax2 lineage-positive cells in S3 segment
of proximal tubules (AQP1+, white) (e), in thick ascending limbs and distal tubules (THP+, white) (f), in collecting ducts (AQP2+, white) (g) and in
S1–S2 segment of proximal tubules (Megalin+, white) (h). Scale bars 20 µm. i Experimental schemes. j, k Representative images of a kidney section in the
OSOM of Pax2/Confetti mice showing Pax2+AQP2− cells after 30 days of washout (T30, n= 5) (j) and after 30 days with doxycycline (doxycycline T30,
n= 4) (k). AQP2 staining is white. l Number of Pax2+AQP2− cells in OSOM of Pax2/Confetti mice at T30 (n= 5) and after 30 days with doxycycline
(doxy T30, n= 4). Mann–Whitney test NS. Data are mean ± SEM. Scale bars 20 µm. Pax2+= Pax2 lineage-positive cells
ARTICLE NATURE COMMUNICATIONS | DOI: 10.1038/s41467-018-03753-4
4 NATURE COMMUNICATIONS | (2018) 9:1344 |DOI: 10.1038/s41467-018-03753-4 |www.nature.com/naturecommunications

(Supplementary Fig. 4a). BUN and GFR measurements gavesimilar results to those obtained in Pax8/Confetti mice (Supple-mentary Fig. 4b and Fig. 3a). This study revealed single-coloredclones (Fig. 3b–d) up to 10 cells within S3 segments resulting inan increase number of Pax2+AQP2− TECs per field (Fig. 3e; p <0.05) after IRI. Clone size frequency analysis at T0, T30, and insham-operated mice showed similar percentages of clones(Fig. 3f; NS, Eq. 1 in Methods). Of note, the percentage of
single cell clones at T0 decreased from 97.7 ± 0.2% to 76.4 ± 1.8%at day 30 after IRI (Fig. 3f, Eq. 1 in Methods). By contrast, clonesconsisting of 2 or more cells increased from 2.2 ± 0.2% (onlydoublets) to 23.6 ± 1.8% (15.2 ± 0.6% of doublets, 5.1 ± 0.8% oftriplets and 3.3 ± 0.7% ≥4 cells, with single colored clones of up to10 cells; Fig. 3f, Eq. 1 in Methods section). Accordingly, 30 daysafter IRI newly generated Pax2+AQP2− TECs, appeared andsignificantly increased the total number of Pax2+AQP2− TECs
e
a
h
l m n o
i j k
f g
b
c d
GF
R (
% o
ver
ba
se
line
)
Po
st-
isch
em
ic A
KI
Ne
ph
roto
xic
AK
I
No. o
f P
ax2
+A
QP
2–
ce
lls/f
ield
Clo
ne
fre
qu
en
cy o
f
Pax2
+A
QP
2–
ce
lls (
%)
% o
f P
ax2
+A
QP
2–
ce
lls
% o
f lo
st
ce
lls a
fte
r IR
I
% o
f clo
no
ge
nic
ce
lls
% o
f va
ria
tio
n o
ver
T0
% o
f P
ax2
+A
QP
2–
ce
lls/
AQ
P2
– c
ells
GF
R (
% o
ver
ba
se
line
)
% o
f lo
st
ce
lls a
fte
r g
lyce
rol
% o
f clo
no
ge
nic
ce
lls
% o
f va
ria
tio
n o
ver
T0
Cort
ex
OS
OM
110
100
90
80
70
6020100
01
***
*
**
4 7
Days
14 21 30
100 100 160
140
120
100
80
60
40
20
0
10 cells
New Pax2+AQP2– cellsPax2+AQP2– cells
9 cells8 cells7 cells6 cells5 cells4 cells3 cells2 cells1 cell
95
90
85
80
7550
*
*
*
*
*9080706050403020100
22
110
30 1008040
20
–20
–40–80
–100
0
15
10
5
0
20
10
0
100
90
80
70
60
50
40
10
00 2
***
*
*
*
4 7
Days
14 21 30
50
Pax2+AQP2– cells
Pax2+AQP2– cells
Pax8+AQP2– cells
Pax8+AQP2– cells
25 1008040
20
–20
–40–80
–100
0
20
15
10
5
0
40
30
20
10
0
20181614121086420
T0
T0
T3
0T
30
Sh
am
IRI T
30
IRI T
30
T0 T0
T3
0
Sh
am
IRI T
30
IRI T
30
AQP2 AQP2
NATURE COMMUNICATIONS | DOI: 10.1038/s41467-018-03753-4 ARTICLE
NATURE COMMUNICATIONS | (2018) 9:1344 |DOI: 10.1038/s41467-018-03753-4 |www.nature.com/naturecommunications 5

in comparison to T0 (Fig. 3g, Eq. 3 in Methods). Following IRIand expansion of Pax2+ cells, Pax2 immunolabelling was presentalso on many TECs not expressing the Confetti reporter, implyingTECs could acquire Pax2 expression upon injury (SupplementaryFig. 4c). Consistently, many Pax2− immunolabelled cells in Pax8/Confetti mice were not found clonogenic (SupplementaryFig. 4d).
The enrichment of Pax2+ TECs labeled by the Confettireporter (Fig. 3h) was related to both an increased survivalcapacity (Fig. 3i, Eq. 4 in Methods), as well as to a higherclonogenic capacity (Fig. 3j, Eq. 2 in Methods) in comparison toother TECs. Indeed, while Pax8+ cells were significantly reduced,Pax2+ cells were expanded in comparison to day 0 (Fig. 3k, Eq. 5in Methods). Similar results were obtained in nephrotoxic AKI(Fig. 3l–o and Supplementary Fig. 4e, Eqs. 4, 2 and 5 in Methods).No transgene leakage was observed in Pax2/Confetti ischemicmice (Supplementary Fig. 4f). These results demonstrate thatduring AKI Pax2+ TECs display increased survival and capacityto undergo mitosis in comparison to other TECs.
Pax2+ cells regenerate long tubule segments. We then checkedthe distribution of Pax2+ clones in the different tubule segmentsafter immunolabelling for megalin, AQP1, THP, and AQP2(Fig. 4a–d). The great majority of Pax2-derived clones formed inthe S3 segment and less in the TAL of Henle’s loop (Fig. 4e, Eq. 7in Methods), the two tubule segments of the outer medulla wheretubule necrosis occurs. By contrast, only few clones formed in theS1–S2 segments in the cortex or in collecting ducts (Fig. 4e, Eq. 7in Methods). The percentage of clonogenic cells was not sig-nificantly different between a 2D and 3D analysis performed in40 µm thick sections (Fig. 4f, Eq. 2 in Methods). However, the 2Danalysis slightly overestimated the percentage of clonogenic cellsdue to long clones being mistakenly counted as several smallerones (Fig. 4f). Indeed, 2D assessment allowed identification ofclones of up to 10 cells, while 3D analysis revealed sin-gle colored Pax2+ clones up to 98 cells regenerating long tubulesegments (Fig. 4g–i and Supplementary Movie 1). These resultsdemonstrate that pre-existing populations of Pax2+ cells regen-erate necrotic tubule segments in the injured outer medulla.
Drugs stimulating regeneration after AKI act selectively onPax2+ TECs. We then evaluated if proliferation is limited toPax2+ cells or involves also other TECs. To this aim, we treatedPax2/Confetti mice with drugs that were previously reported toincrease TEC proliferation and to improve tissue regenerationfollowing AKI16–19, i.e., the histone deacetylase inhibitors
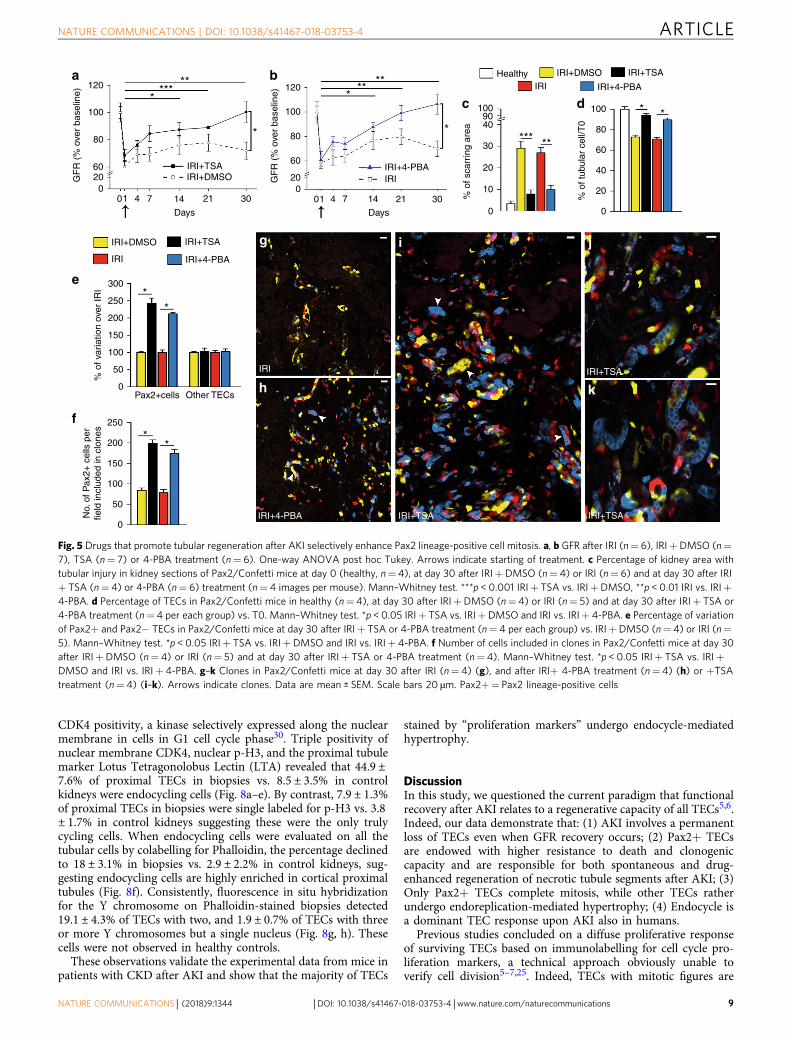
(HDACi) trichostatin (TSA) and 4-phenylbutyrate (4-PBA)(Supplementary Fig. 5a–d). Treatment starting 24 h after IRIresulted in a sustained recovery of GFR in comparison to micetreated with vehicle, which remained with persistently impairedGFR, i.e., CKD (Fig. 5a, b). A better reconstitution of tubularintegrity was also observed (Fig. 5c, Supplementary Fig. 5e–g),consistent with previous results16–19. TSA and 4-PBA bothincreased TEC number in comparison to vehicle. Of note,86.4 ± 4.5% and 64.7 ± 5.5% of TEC loss were restored in TSA-and 4-PBA- treated mice, respectively (Fig. 5d).
Strikingly, the increased TEC number was related to a selectiveexpansion of Pax2+ TECs (Fig. 5e, Eq. 6 in Methods), thatproliferated extensively, as demonstrated by the significantincrease of Pax2+ cells included in clones (Fig. 5f). By contrast,the number of other TECs was unchanged (Fig. 5e). Representa-tive images are shown (Fig. 5g–k). These results show that HDACinhibitors, that stimulate tubular regeneration after AKI, actselectively on Pax2+ cells.
Cell cycle markers do not predict cell division after AKI. Thefinding that only Pax2+ TECs divide upon IRI was in conflictwith immunolabelling for Ki-67 (expressed from late G1 tomitosis7, Fig. 6a–d), or PCNA, (expressed from late G1 to earlyG220, Fig. 6e–h). Indeed, we found diffuse tubular Ki-67 (Fig. 6b,d), as well as PCNA (Fig. 6f, h) positivity 2 days after injurysuggesting many more TECs proliferate than actually proven byclone analysis in Pax8/Confetti mice. To clarify this apparentinconsistency we crossed Pax8-, as well as Pax2.rtTA;TetO.Cre;mice with mice harboring the fluorescent ubiquitin-based cellcycle indicator (FUCCI2) Cre-dependent reporter (Supplemen-tary Fig. 6a, b), which consists of two fluorescent proteins whoseexpression alternates based on cell cycle phase: mCherry-hCdt1(red color), expressed in G1, and mVenus-hGem (green color),expressed in S/G2/M21 (Supplementary Fig. 6c). Cells can alsoappear as yellow at the G1/S boundary.22 Experimental designsare detailed in Supplementary Fig. 6d, e.
Based on Pax8/FUCCI2 mice evaluated by confocal micro-scopy (Fig. 6i–k and Supplementary Fig. 6f–h) few TECsappeared in S/G2/M (mVenus+) at day 2 after IRI despitewidespread tubular Ki-67 positivity (13.2 ± 3.4% vs. 47.1 ± 9.2%;p < 0.05 Mann–Whitney test; Fig. 6j, l vs. Fig. 6b, d). Interestingly,when Pax2/FUCCI2 mice were evaluated by confocal microscopy(Fig. 6m–o and Supplementary Fig. 6i–k), the percentage ofcycling cells over the total of Pax2+ FUCCI2+ cells was higher(40.6 ± 1.7%; Fig. 6n, p), but the number per field was comparableto that of the Pax8/FUCCI mice (10.7 ± 0.4 in Pax2/FUCCI2 mice
Fig. 3 Pax2 lineage-positive cells show increased survival and proliferative capacity in comparison to other TECs after AKI. a GFR in Pax2/Confetti mice
after ischemic AKI (n= 9) normalized on the GFR at baseline and on sham-operated control group (n= 5). One-way ANOVA post hoc Tukey. b
Juxtaposed confocal images of a kidney section in Pax2/Confetti mice at day 30 after IRI (n= 5). Arrows indicate single colored clones. Scale bars 40 µm.
c, d Single colored clones in AQP2− tubules in Pax2/Confetti mice at day 30 after IRI (n= 5). AQP2 staining is white. Scale bars 20 µm. e Number of Pax2
+AQP2− TECs in Pax2/Confetti mice at day 0 (T0, n= 4), in age-matched controls (T30; n= 5), in sham-operated mice (sham; n= 5) and at day 30 after
IRI (IRI T30, n= 5). Mann–Whitney test *p < 0.05 IRI T30 vs. T0, T30 and sham. f Clone frequency analysis of Pax2+AQP2− cells in Pax2/Confetti mice
at day 0 (T0, n= 4), in age-matched controls (T30, n= 5), in sham-operated mice (sham; n= 5) and at day 30 after IRI (IRI T30, n= 5). Mann–Whitney
test *p < 0.05 IRI T30 vs. T0, T30, and sham. g Percentage of Pax2+AQP2− cells in Pax2/Confetti mice at day 0 (T0, n= 4) and 30 after IRI (IRI T30,
n= 5). h Percentage of Pax2+AQP2− TECs vs. AQP2− TECs in Pax2/Confetti mice at day 0 (T0, n= 4), in age-matched controls (T30, n= 5), and at day
30 after IRI (IRI T30, n= 5). Mann–Whitney test *p < 0.05 IRI T30 vs. T0 and T30. i Percentage of lost Pax2+AQP2− TECs (n= 5) and Pax8+AQP2−
TECs (n= 5) at IRI T30 vs. T0. Mann–Whitney test *p < 0.05. j Percentage of Pax2+AQP2− (n= 5) and Pax8+AQP2− TECs (n= 5) that generated
clones at IRI T30 vs. T0. Mann–Whitney test *p < 0.05. k Percentage of Pax2+AQP2− (n= 5) and Pax8+AQP2− TECs (n= 5) at IRI T30 vs. T0. l GFR in
Pax2/Confetti mice after nephrotoxic AKI (n= 8) normalized on the GFR at baseline and on healthy mice (n= 5). One-way ANOVA post-hoc Tukey. m
Percentage of lost Pax2+AQP2− TECs (n= 6) in Pax2/Confetti and of lost Pax8+AQP2− (n= 4) in Pax8/Confetti mice at day 30 after nephrotoxic AKI
vs. T0. Mann–Whitney test *p < 0.05. n Percentage of Pax2+AQP2− (n= 6) and Pax8+AQP2− TECs (n= 4) that generated clones at day 30 after
nephrotoxic AKI vs. T0. Mann–Whitney test *p < 0.05. o Percentage of Pax2+AQP2− (n= 6) and Pax8+AQP2− TECs (n= 4) at day 30 after nephrotoxic
AKI vs. T0. Data are mean ± SEM. Pax2+= Pax2 lineage-positive cells, Pax8+= Pax8 lineage-positive cells. For calculation of figures i–k, m–o see
Methods section and representative calculations in Pax2/Confetti mice in Supplementary Methods
ARTICLE NATURE COMMUNICATIONS | DOI: 10.1038/s41467-018-03753-4
6 NATURE COMMUNICATIONS | (2018) 9:1344 |DOI: 10.1038/s41467-018-03753-4 |www.nature.com/naturecommunications

vs. 10.9 ± 0.3 in Pax8/FUCCI2 mice, NS) (Fig. 6n vs. Fig. 6j).These results suggested that numerous TECs entered the cell cyclebut only few progressed toward the G2/M phase, i.e., mitosis.Both in Pax8/FUCCI2 and Pax2/FUCCI2 mice TECs wereselectively labeled, as shown in Fig. 6i–k and Fig. 6m–o withPhalloidin staining and as previously reported23,24. No transgeneleakage was observed in healthy or ischemic mice (SupplementaryFig. 6l–q). We thus performed immunolabelling for a markercommonly considered to label only cells in the G2/M phase,
serine 10-phosphorylated histone H3 (p-H3)25–27. As expected, alower percentage of TECs at day 2 was p-H3+ in comparison toKi-67 (11.9 ± 1.1% vs. 47.1 ± 9.2%, p < 0.05, Supplementary Fig. 6rand Fig. 6d). P-H3+ TECs were mostly mVenus+, confirmingthat they were in G2/M (Fig. 6q, s). However, unexpectedly, alsosome Pax8+ TECs in G1 (mCherry+) were labeled (Fig. 6q). Atday 30, mCherry+p-H3+ cells strongly increased, representingabout a half of FUCCI2+p-H3+ TECs (Fig. 6r, s). By contrast, inPax2/FUCCI2 mice, p-H3 mostly co-labeled mVenus-expressing
ba
c
g h
i
d
Megalin AQP1
AQP1 THP
e
f
Fre
qu
en
cy o
f P
ax2
+ c
lon
es (
%)
% o
f clo
nogenic
cells
100
90
80
70
60
50
****
*
*40
30
20
10
0
Pax2+ cells
Pax8+ cells
25
20
15
10
5
02D 2D3D 3D
S1–S2
S3TA
L
Collecting
ducts
NATURE COMMUNICATIONS | DOI: 10.1038/s41467-018-03753-4 ARTICLE
NATURE COMMUNICATIONS | (2018) 9:1344 |DOI: 10.1038/s41467-018-03753-4 |www.nature.com/naturecommunications 7

cells (Fig. 6t–v). This implies that Pax2+p-H3+ cells were trulyin G2/M phase. These results document that Ki-67, PCNA, andp-H3 do not reliably indicate TEC proliferation after AKI.
Pax8+ TECs endocycle while Pax2+ cells complete mitosis.The aforementioned data, together with the results obtained withthe Confetti models, consistently suggested that most TECs mightundergo alternative cell cycles without cell division. Indeed suchalternative cycles, e.g., endoreplication cycles or endocycles, haverecently been reported to drive polyploidy and hypertrophy upontissue injury28. To evaluate this possibility in AKI, we combinedDNA content analysis with detection of FUCCI2 fluorescence byflow cytometry. Indeed, using this approach, G2/M diploid cells,which express mVenus and represent truly cycling cells can bedistinguished from G1 polyploid cells which express mCherryand instead represent mononucleated endoreplicating cells(Fig. 6w–z). Pax8/FUCCI2 mice 2 days after IRI showed 9.8 ±0.7% of Pax8+ TECs in S phase, but only 2 ± 0.5% in G2/M phase(Fig. 6w, y). Lineage tracing of mice for 30 days showed a con-siderable increase of Pax8+ TECs cells that expressed mCherrybut displayed a polyploid DNA content (≥4C) (2.1 ± 0.1% at day2 vs. 13.5 ± 1.4% at day 30, p < 0.05, Mann–Whitney test; Fig. 6w,y). By contrast, cells with an abnormal DNA content were notobserved in Pax2/FUCCI2 mice, either at 2 or 30 days (Fig. 6x, z).Rather, 2 days after IRI 35 ± 4.8% of Pax2+ cells were in the Sphase, suggesting a higher proliferation capacity than Pax8+ cells(Fig. 6y, z). The gating strategy used to analyse FUCCI2+ cellsand to avoid counting cell doublets as a potential source ofartifacts is shown in Supplementary Fig. 7. Given our extremelyconservative gating strategy, we certainly underestimated thepercentage of endocycling cells. Similar results were obtainedafter deleting AQP2+ cells from the analysis (SupplementaryFig. 7b–e). These results show that Pax2+ cells frequently andefficiently divide, while other TECs endocycle into polyploidmononuclear TECs.
Pax2+ cells proliferate while other TECs undergo hypertrophy.To validate these results, we used two further transgenic mouselines, based on the FUCCI2aR reporter, a recent advancement ofthe FUCCI2 which produces iso-stoichiometric quantities of bothFUCCI probes expressed during all the cell cycle, with highersensitivity and labeling of the cells during all the cell cyclephases29.
The generation of Pax8.rtTA;TetO.Cre;FUCCI2aR, as well asPax2.rtTA;TetO.Cre;FUCCI2aR transgenic mouse lines, experi-mental design and controls are detailed in Methods and inSupplementary Fig. 8. Both transgenic lines showed a percentageof induction higher than 90%.
The experimental procedure is summarized in Fig. 7a. Totalrenal cell suspensions were analysed by MacsQuant flowcytometry at time 0, day 2 and day 30 after IRI. As expected,the percentage of Pax8/FUCCI2aR-labeled tubular cells over total
renal cells was about 10 times higher than that of Pax2/FUCCI2aR cells (Fig. 7b–j and Supplementary Fig. 9). However,this was only related to a higher percentage of mCherry+ cells, asthe percentage of mVenus+ cells was similar (Fig. 7b–j andSupplementary Fig. 9), suggesting that virtually only Pax2+ cellsdivide after AKI. The MacsQuant flow cytometer also auto-matically quantified the number of cells/μl of the differentpopulations contained in the total renal cell suspensions. Countsconfirmed the massive TEC loss in Pax8/FUCCI2aR mice 2 daysafter IRI, that was only partially recovered after 30 days as foundbefore (Fig. 7k). Interestingly, the number of newly generatedcells at day 30 in comparison to day 2 in Pax8/FUCCI2aR andPax2/FUCCI2aR mice was similar (Fig. 7l). Pax2/FUCCI2aR cellnumbers at day 30 were significantly expanded in comparison today 2 (Fig. 7k), passing from 12.6 ± 1.4% of Pax8/FUCCI2aR totalcells at day 0 to 19.5 ± 2.2% at day 2 and to 28.9 ± 3.4% at day 30(Fig. 7m). Strikingly, absolute counts showed that the number ofproliferating cells (mVenus+ and mCherry+mVenus+) in Pax8/FUCCI2aR and in Pax2/FUCCI2aR mice was virtually identicalat all time points analysed (Fig. 7n), demonstrating that only Pax2+ cells divide after AKI. Confocal microscopy showed expressionof KIM-1 protein at day 30 by 71.7 ± 4.7% of Pax8+mCherry+TECs, vs. only 2 ± 1.2% of Pax2+mCherry+ TECs, furtherunderlining the different survival capacity of Pax2+ cells incomparison to other TECs (Supplementary Fig. 8i, m).
We then analysed the occurrence and distribution of endo-cycle. Consistent with results obtained in FUCCI2 mice,endocycling cells were only observed in Pax8/FUCCI2aR mice(Fig. 7o–q). In addition, 27.9 ± 4.6% of LTA+ proximal tubularcells in S1–S2 segments were p-H3+ mCherry+, representingendocycling cells, in comparison to 1.8 ± 0.8 of LTA+ proximaltubular cells that were mVenus+, the only truly dividing cells(Fig. 7r–t). Immunolabelling for AQP2 showed that the greatmajority of endocycling cells localized in the cortex (22.3 ± 3.4%in the cortex vs. 7.8 ± 2.2% in the OSOM), while the majority oftruly proliferating cells localized in the OSOM (9.2 ± 1.6% in theOSOM vs. 3.1 ± 1.1% in the cortex, Fig. 7u). Endocycling cells inG1 (Pax8+mCherry+p-H3+TECs) displayed an increased size incomparison to cycling cells in G1 (Pax8+mCherry+p-H3−TECs) as confirmed by comparing their cell surface area byconfocal microscopy (Fig. 7v, w).
Taken together, Pax2+ cells in the OSOM are the cells thatregenerate injured tubules after AKI by mitotic cell division, whileother TECs of the S1 and S2 segments rather enter endocycles toundergo hypertrophy. Both mechanisms may compensate for theirreversible loss-of-TECs occurring during AKI.
Endocycle is detected in kidneys of patients with CKD afterAKI. To verify the presence of endocycling cells in human, weexamined kidney biopsies from 10 cases of CKD after AKI and 5healthy controls (Table 1). To detect endocycling cells in human,we applied the same strategy previously validated in the mouse,and searched for p-H3+ cells in G1 phase, the latter identified by
Fig. 4 Pax2 lineage-positive cells regenerate long tubule segments. a Representative image of a kidney section showing single-colored clones in
S1–S2 segments of proximal tubule as demonstrated by staining with anti-megalin antibody (white) in Pax2/Confetti mice at day 30 after IRI (n= 5). Scale
bar 20 µm. b, c Representative images of a kidney section showing single-colored clones in S3 segment of proximal tubule as demonstrated by staining with
anti-AQP1 antibody (white) in OSOM of Pax2/Confetti mice at day 30 after IRI (n= 5). Scale bars 20 µm. d Representative image of a kidney section
showing single-colored clones in thick ascending limb as demonstrated by staining with anti-THP antibody (white) in Pax2/Confetti mice at day 30 after IRI
(n= 5). Scale bar 20 µm. e Frequency of Pax2+ clones in S1–S2 segment of proximal tubules (Pax2+ Megalin+ clones, n= 5), in S3 segment of proximal
tubules (Pax2+AQP1+ clones, n= 7), in thick ascending limbs (TAL, Pax2+THP+ clones, n= 7) and in the collecting ducts (Pax2+AQP2+ clones, n= 7)
at day 30 after IRI. Mann–Whitney test. **p < 0.01 S3 vs. S1–S2 and collecting ducts, *p < 0.05 S3 vs. TAL and TAL vs. collecting ducts. f Percentage of
clonogenic cells per field in 2D vs. 3D analysis in Pax2/Confetti and in Pax8/Confetti mice at day 30 after IRI vs. T0. (n= 5 Pax2/Confetti mice and n= 5
Pax8/Confetti mice). Mann–Whitney test NS. g–i 3D reconstruction of single-colored clones in Pax2/Confetti mice at day 30 after IRI (n= 5). DAPI
counterstains nuclei (white). Scale bars 50 µm. Data are mean ± SEM. Pax2+= Pax2 lineage-positive cells, Pax8+= Pax8 lineage-positive cells
ARTICLE NATURE COMMUNICATIONS | DOI: 10.1038/s41467-018-03753-4
8 NATURE COMMUNICATIONS | (2018) 9:1344 |DOI: 10.1038/s41467-018-03753-4 |www.nature.com/naturecommunications
CDK4 positivity, a kinase selectively expressed along the nuclearmembrane in cells in G1 cell cycle phase30. Triple positivity ofnuclear membrane CDK4, nuclear p-H3, and the proximal tubulemarker Lotus Tetragonolobus Lectin (LTA) revealed that 44.9 ±7.6% of proximal TECs in biopsies vs. 8.5 ± 3.5% in controlkidneys were endocycling cells (Fig. 8a–e). By contrast, 7.9 ± 1.3%of proximal TECs in biopsies were single labeled for p-H3 vs. 3.8± 1.7% in control kidneys suggesting these were the only trulycycling cells. When endocycling cells were evaluated on all thetubular cells by colabelling for Phalloidin, the percentage declinedto 18 ± 3.1% in biopsies vs. 2.9 ± 2.2% in control kidneys, sug-gesting endocycling cells are highly enriched in cortical proximaltubules (Fig. 8f). Consistently, fluorescence in situ hybridizationfor the Y chromosome on Phalloidin-stained biopsies detected19.1 ± 4.3% of TECs with two, and 1.9 ± 0.7% of TECs with threeor more Y chromosomes but a single nucleus (Fig. 8g, h). Thesecells were not observed in healthy controls.
These observations validate the experimental data from mice inpatients with CKD after AKI and show that the majority of TECs
stained by “proliferation markers” undergo endocycle-mediatedhypertrophy.
DiscussionIn this study, we questioned the current paradigm that functionalrecovery after AKI relates to a regenerative capacity of all TECs5,6.Indeed, our data demonstrate that: (1) AKI involves a permanentloss of TECs even when GFR recovery occurs; (2) Pax2+ TECsare endowed with higher resistance to death and clonogeniccapacity and are responsible for both spontaneous and drug-enhanced regeneration of necrotic tubule segments after AKI; (3)Only Pax2+ TECs complete mitosis, while other TECs ratherundergo endoreplication-mediated hypertrophy; (4) Endocycle isa dominant TEC response upon AKI also in humans.
Previous studies concluded on a diffuse proliferative responseof surviving TECs based on immunolabelling for cell cycle pro-liferation markers, a technical approach obviously unable toverify cell division5–7,25. Indeed, TECs with mitotic figures are
a
e
g i j
kh
IRI IRI+TSA
IRI+4-PBA IRI+TSA IRI+TSA
f
b
c d
GF
R (
% o
ver
ba
se
line
)
% o
f va
ria
tio
n o
ver
IRI
No. of
Pax2+
cells
per
field
inclu
ded in c
lones
GF
R (
% o
ver
ba
se
line
)
% o
f sca
rrin
g a
rea
% o
f tu
bu
lar
ce
ll/T
0
120
100 100
80
60
40
20
0
9040
30
20
10
0
100
120
80
60
20
0
** **
*****
* *
***
**
****
100
80
6020
0
300*
*
**
250
200
150
100
50
250
200
150
100
50
0
0Pax2+cells Other TECs
01 4 7
Days Days
14 21
IRI+TSA IRI+4-PBA
Healthy IRI+DMSO
IRI+DMSO IRI+TSA
IRI+4-PBAIRI
IRI+TSA
IRI+4-PBAIRI
IRIIRI+DMSO
30 01 4 7 14 21 30
Fig. 5 Drugs that promote tubular regeneration after AKI selectively enhance Pax2 lineage-positive cell mitosis. a, b GFR after IRI (n= 6), IRI+DMSO (n=
7), TSA (n= 7) or 4-PBA treatment (n= 6). One-way ANOVA post hoc Tukey. Arrows indicate starting of treatment. c Percentage of kidney area with
tubular injury in kidney sections of Pax2/Confetti mice at day 0 (healthy, n= 4), at day 30 after IRI+DMSO (n= 4) or IRI (n= 6) and at day 30 after IRI
+ TSA (n= 4) or 4-PBA (n= 6) treatment (n= 4 images per mouse). Mann–Whitney test. ***p < 0.001 IRI+ TSA vs. IRI+DMSO, **p < 0.01 IRI vs. IRI+
4-PBA. d Percentage of TECs in Pax2/Confetti mice in healthy (n= 4), at day 30 after IRI+DMSO (n= 4) or IRI (n= 5) and at day 30 after IRI+ TSA or
4-PBA treatment (n= 4 per each group) vs. T0. Mann–Whitney test. *p < 0.05 IRI+ TSA vs. IRI+DMSO and IRI vs. IRI+ 4-PBA. e Percentage of variation
of Pax2+ and Pax2− TECs in Pax2/Confetti mice at day 30 after IRI+ TSA or 4-PBA treatment (n= 4 per each group) vs. IRI+DMSO (n= 4) or IRI (n=
5). Mann–Whitney test. *p < 0.05 IRI+ TSA vs. IRI+DMSO and IRI vs. IRI+ 4-PBA. f Number of cells included in clones in Pax2/Confetti mice at day 30
after IRI+DMSO (n= 4) or IRI (n= 5) and at day 30 after IRI+ TSA or 4-PBA treatment (n= 4). Mann–Whitney test. *p < 0.05 IRI+ TSA vs. IRI+
DMSO and IRI vs. IRI+ 4-PBA. g–k Clones in Pax2/Confetti mice at day 30 after IRI (n= 4) (g), and after IRI+ 4-PBA treatment (n= 4) (h) or +TSA
treatment (n= 4) (i–k). Arrows indicate clones. Data are mean ± SEM. Scale bars 20 µm. Pax2+= Pax2 lineage-positive cells
NATURE COMMUNICATIONS | DOI: 10.1038/s41467-018-03753-4 ARTICLE
NATURE COMMUNICATIONS | (2018) 9:1344 |DOI: 10.1038/s41467-018-03753-4 |www.nature.com/naturecommunications 9

rarely found in AKI kidneys31. Using three independent techni-ques, we found that only a small subset of TECs undergos mitosisand contributes to kidney regeneration. To address the dis-crepancy between widespread positivity of proliferation markersand limited clonal cell division, we first evaluated the possibilitythat the tubule contains a progenitor population deputed to
replacement of lost TECs using lineage tracing of Pax2+ cells, aputative intratubular progenitor population. Pax2+ cells aremostly located in the S3 segment and the distal tubule, the tubulesegments injured in ischemic or toxic AKI32, reminiscent ofanother subset of possible tubular progenitors characterized bySox9 expression33,34. Our lineage tracing strategy unambiguously
T0
Pax8/F
UC
CI2
mic
eP
ax2
/FU
CC
I2 m
ice
Pa
x8
/FU
CC
I2 m
ice
Pax8/F
UC
CI2
mic
e
% o
ver
tota
l
Pax8/F
UC
CI2
cells
% o
ver
tota
l
Pax2/F
UC
CI2
cells
Pa
x2
/FU
CC
I2 m
ice
Count
Count
Count
Count
Pax2/F
UC
CI2
mic
e
IRI T30IRI T2
100
80
60
40
20
0
100
80
60
40
20
0
T0 IRI T2 IRI T30
T0 IRI T2
IRI T2
IRI T2
IRI T30
IRIT 30
IRI T30
100
mCherry+ cells
mVenus+ cells
mCherry+ mVenus+ cells
mCherry+ cellsmVenus+ cells
mCherry+ mVenus+ cells
p-H3+ mCherry+ cells
p-H3+ mVenus+ cells
p-H3+ mCherry+ cells
p-H3+ mVenus+ cells
80
60
40
20
0
100
80
60
40
20
0
100
80
60
40
20
0
100
100 10095908580757065605550100
2.1 ± 0.1% 2.7 ± 0.4% 2.8 ± 0.4%
3 ± 0.2%
28 ± 2.6%
1.3 ± 0.8
65 ± 2.6%
5 ± 0.3%
35 ± 4.8%
3.8 ± 0.7
54 ± 4.4%
2 ± 0.5%
13.5 ± 1.4%
2.1 ± 0.6%
14.8 ± 4.1%
66.8 ± 5.3%
2.7 ± 1
9.8 ± 0.7%
1.2 ± 0.4
84.3 ± 1.3%
95
90
85
80
75
70
65
100
IRI T2 IRI T2IRI T30 IRI T30
80
60
800 450400350300250200150100500
250
200
150
100
50
0
700
600
500
400
300
200
100
100
75
50
25
0
050 100 150 50 100 150
(×1000)
50 100 150(×1000)
(×1000)
40
20
0
T0 IRI T2 IRI T30
T0 IRI T2 IRI T30
% o
f K
i-6
7+
ce
lls/
Ph
allo
idin
+tu
bu
lar
ce
lls%
of P
CN
A+
ce
lls/
tota
l tu
bu
lar
ce
lls%
ove
r P
ax8
/FU
CC
I2
ce
lls
% o
ver
Pa
x2
/FU
CC
I2
ce
lls%
of
p-H
3+
FU
CC
I2
ce
lls
% o
f p-H
3+
FU
CC
I2
cells
d
h
l
p
s
w
x
y z
v
a
e
i
n om
q
t
r
u
q′
t′ u′
r′
j k
f g
b c
Ki-67+Phalloidin+DAPI
PCNA
mVenus+mCherry+Phalloidin
mVenus+mCherry+Phalloidin
mVenus+mCherry+p-H3+DAPI
mVenus+mCherry+p-H3+DAPI mVenus+mCherry+p-H3+DAPI
mVenus+mCherry+p-H3+DAPImCherry
mCherry mCherry
mCherrymVenus
mVenus mVenus
mVenus
DAPI
DAPI DAPI
DAPIp-H3
p-H3 p-H3
p-H3
mVenus+mCherry+Phalloidin mVenus+mCherry+Phalloidin
mVenus+mCherry+Phalloidin mVenus+mCherry+Phalloidin
PCNA PCNA
Ki-67+Phalloidin+DAPI Ki-67+Phalloidin+DAPI
IRI T2
mCherry+ cells
IRI T2
DNA content DNA content
DNA content
50 100 150(×1000)DNA content
IRI T30
mVenus+ cells mCherry+ mVenus+ cells
mCherry+ cells with 2C DNA content
mCherry+ cells with ≥4C DNA content
mVenus+ cells with <4C DNA content
mVenus+ cells with ≥4C DNA content
mCherry+ mVenus+ cells with 2C DNA content
IRI T30
ARTICLE NATURE COMMUNICATIONS | DOI: 10.1038/s41467-018-03753-4
10 NATURE COMMUNICATIONS | (2018) 9:1344 |DOI: 10.1038/s41467-018-03753-4 |www.nature.com/naturecommunications

excluded upregulation of Pax2 expression upon AKI as a con-founding factor. Rather, Pax2+ cells represented a distinct tub-ular cell subpopulation and were more resistant to death,explaining why some TECs survive an injury killing most of theother TECs. This was further highlighted by their lack ofexpression of the TEC injury marker KIM-1 that was insteadlargely upregulated by other TECs upon IRI. Moreover, Pax2+cells displayed high clonogenic activity, and were the only TECsto efficiently complete mitosis after AKI, regenerating even longtubule segments. Indeed, 3D evaluation of regenerated tubule seg-ments revealed very long Pax2+ clones that were not visible withthe classical 2D analysis that underestimated the length of clones.Interestingly, being unable to detect long clones, the 2D analysisslightly overestimated the percentage of dividing TECs, even if thedifference was not statistically significant when 40 µm thick 3Dsections were compared with 2D images. This suggests that thepercentage of dividing TECs would likely even be lower whenanalyzing the whole organ. Taken together these results indicatethat new tubular cells arise exclusively from pre-existing labeledPax2+ cells that expand regenerating the entire S3 or distal tubulesegment and therefore behaving as progenitor cells35.
Our results may appear in conflict with those of other studiesreporting widespread TEC proliferation with lineage tracingtechniques upon IRI36,37. However, although we report a per-centage of dividing TECs after IRI of only 8.3%, the clone fre-quency observed in our study in the IRI model at the end of thelineage tracing period is comparable to the one reported byKusaba et al.36 for the 26 min IRI model (21.1 ± 0.9% vs. 27.4%).The difference in our conclusions is related to our demonstrationfor the first time that in addition to proliferation, two morephenomena occur after AKI: massive tubular cell loss andendoreplication. Indeed persistent cell loss, enriching dividingclones when calculated over the total number of TECs remainedat the end of the lineage tracing period, leads to a profoundoverestimation of dividing cell number. This phenomenon isexplained in detail in Supplementary Fig. 2. In addition, endo-cycling cells are labeled by cell cycle activation markers such asPCNA or KI-67, representing a further cause of overestimation.Refering to these markers inappropriately as "proliferation mar-kers" now appears as a major reason for invalid conclusions.Indeed, the detection of irreversible TEC loss and endocycle ofsurviving TECs requires the combination of clonal lineage tra-cing, as well as cell cycle plus DNA content analysis, as done inthis study. Endoreplication cycles (endocycles) are cell cyclevariants repeatedly proceeding from G1 to S without passingmitosis and that can occur in differentiated cells28. For example,during liver homeostasis, hepatocyte progenitors remain diploid,while differentiated hepatocytes become polyploid via endor-eplication35. However, polyploid hepatocytes are multinucleated,
while after injury polyploid TECs remain mononucleatedand hence cannot be detected with standard tools38,39. CombiningFUCCI2 transgenic labeling of cell cycle phase with analysis ofDNA content by flow cytometry, as reported by Ganem et al.39, wediscovered that upon AKI the majority of TECs undergoesendocycle-mediated hypertrophy. These results challenge the cur-rent paradigm of widespread TEC proliferation contributing tokidney regeneration after AKI and rather imply that TECendocycle-mediated hypertrophy enhances kidney function recov-ery after injury. Consistently, in Drosophila melanogaster, com-pensatory cellular hypertrophy involves endoreplication40. Indeed,the increased DNA content allows a higher transcription capacitythat can facilitate an increase in cell size28,40, as observed in our AKImodels.
Thus, the results of this study rather suggest that the majorityof TECs entering the cell cycle after AKI undergoes hypertrophyfollowing TEC loss, conceptually similar to hypertrophy ofremaining podocytes upon podocyte loss41. Kidney regenerationoccurs only via a limited clonal response from TEC progenitorsresulting in a net TEC loss, implying irreversible nephron lossand subsequent CKD. The more cells are lost, the earlier CKDbecomes clinically apparent. Since TEC hypertrophy sustainsonly function but not tissue regeneration, the presence of endo-cycling TECs can serve as an indirect indicator of irreversibleTEC loss and potentially as a prognostic indicator of the risk forCKD progression, as suggested by their detection in biopsies ofpatients that developed CKD after an AKI episode.
Finally, the results of this study propose tubular progenitors asa target for treatment of AKI. Indeed, treatment of mice withdrugs that were previously reported to improve tissue regenera-tion following AKI16–19, showed that their effect resulted fromPax2+ progenitor proliferation that avoids development of tissuefibrosis and CKD.
In conclusion, the renal response to AKI involves two crucialmechanisms: (1) endocycle-mediated hypertrophy of survivingTECs that contributes to recover renal function despite significantloss of renal mass; (2) survival and mitosis of tubular progenitorsthat provide TEC regeneration. These data challenge the currentparadigm of kidney regeneration upon AKI and identify Pax2+progenitors as the cellular source of a limited intrinsic regen-erative capacity of kidney tubules. Instead, endocycle-mediatedhypertrophy and persistent tubular cell loss are the predominantfeatures after AKI. Therapeutic targeting of tubule progenitorscould be a valuable strategy to improve long-term AKI outcomes.
MethodsPax8/Confetti mice and Pax2/Confetti mice. The Pax8.rtTA;TetO.Cre;R26.Confetti (Pax8/Confetti) mice or the Pax2.rtTA;TetO.Cre;R26.Confetti (Pax2/Confetti) mice were developed on a full C57BL/6 background by crossing the
Fig. 6 Cell cycle markers misrepresent proliferation after AKI because numerous TEC endocycle. a–c Ki-67+ (blue) Phalloidin+ (purple) tubules at day 0
(a), 2 (b) and 30 after IRI (c) (n= 3 per group). d Percentage of Ki-67+ cells over Phalloidin+ TECs at T0, IRI T2, and IRI T30 (n= 3 per group). e–g PCNA
+ cells at T0 (e), IRI T2 (f), and IRI T30 (g) (n= 5 per group). h Percentage of PCNA+ cells over TECs at T0, IRI T2, and IRI T30 (n= 5 per group). i–k
mCherry+ cells (red) and mVenus+ cells (green) in Pax8/FUCCI2 mice at T0 (i), IRI T2 (j), and IRI T30 (k) (n= 4 per group). Phalloidin staining is white.
l Percentage of mCherry+ cells, mVenus+ cells and mCherry+mVenus+ cells in Pax8/FUCCI2 mice at T0, IRI T2, and IRI T30. (n= 4 per group). m–o
mCherry+ cells (red) and mVenus+ cells (green) in Pax2/FUCCI2 mice at T0 (m), IRI T2 (n) and IRI T30 (o) (n= 4 per group). Phalloidin staining is
white. p Percentage of mCherry+ cells, mVenus+ cells and mCherry+mVenus+ cells in Pax2/FUCCI2 mice at T0, IRI T2, and IRI T30. (n= 4 per group).
q, r mCherry+ cells (red), mVenus+ cells (green) and p-H3+ cells (blue) in Pax8/FUCCI2 mice at IRI T2 (q) and IRI T30 (r) (n= 4 per group). q′, r′
Details indicated by arrowheads and asterisks in q and r. s Percentage of p-H3+mCherry+ cells and p-H3+mVenus+ cells in Pax8/FUCCI2 mice at IRI T2
and IRI T30. (n= 4 per group). t, u mCherry+ cells (red), mVenus+ cells (green) and p-H3+ cells (blue) in Pax2/FUCCI2 mice at IRI T2 (t) and IRI T30
(u) (n= 4 per group). t′, u′ Details indicated by arrowheads in t and u. v Percentage of p-H3+mCherry+ cells and p-H3+mVenus+ cells in Pax2/FUCCI2
mice at IRI T2 and IRI T30. (n= 4 per group). w, x Cell cycle distribution of mCherry+, mVenus+, and mCherry+mVenus+ cells in Pax8/FUCCI2 mice (w)
and Pax2/FUCCI2 mice (x) at IRI T2 (n= 4, left) and at IRI T30 (n= 5, right). Representative experiments are shown. y, z Percentage of cells over total
Pax8/FUCCI2 cells (y) and over total Pax2/FUCCI2 cells (z) at IRI T2 (n= 4) and IRI T30 (n= 5). Data are mean ± SEM. Scale bars 20 µm. DAPI (white)
counterstains nuclei. T0= day 0, IRI T2= day 2 after IRI, IRI T30= day 30 after IRI
NATURE COMMUNICATIONS | DOI: 10.1038/s41467-018-03753-4 ARTICLE
NATURE COMMUNICATIONS | (2018) 9:1344 |DOI: 10.1038/s41467-018-03753-4 |www.nature.com/naturecommunications 11

Confetti strain Gt(ROSA)26Sortm1(CAG-Brainbow2.1)Cle/J with the TetO.Cre strain B6.Cg-Tg(TetO-Cre)1Jaw/J, both purchased from the Jackson Laboratory (Bar Harbor,ME, USA). Double transgenic mice were then crossed with a Pax8.rtTA mouse (B6.Cg-Tg(Pax8-rtTA2S*M2)1Koes/J, Jackson Laboratory) or with a Pax2.rtTAmouse14, to obtain a triple transgenic inducible mouse model. Mice were geno-typed and only triple hemizygous mice were used in this study.
Reporter transgene recombination was induced at 5 weeks of age byadministration of 2 mg/ml or 0.25 mg/ml doxycycline hyclate (Sigma-Aldrich, St.Louis, MO, USA) for Pax8/Confetti mice and 2 mg/ml doxycycline hyclate for
Pax2/Confetti mice in drinking water additioned with 2.5% sucrose (Sigma-Aldrich) for 10 days. Doxycycline administration induces a permanentrecombination of a single color encoding gene (red, yellow, green, or bluefluorescent proteins, RFP, YFP, GFP, and CFP), with GFP cells occurring at lowerfrequency than other colors12. Further recombination outcome may also result inno fluorescent reporter labeling in Cre-expressing cells. Following the induction,mice were kept in a washout period of 1 week and were then killed (day 0, T0, n=5 for Pax8/Confetti mice induced with 2 mg/ml doxycycline hyclate, n= 5 forPax8/Confetti mice induced with 0.25 mg/ml doxycycline hyclate and n= 4 for
a b
d g
i
j
e hT0 IRI T2 IRI T30
17.8%
2.1% 0.1%
0.8%
0.5% 11.7% 0.1% 14.1% 1.8%
2.1%0.5%
0.6% 2.7% 0.2%
3%0.7%
0.7%
c
k
o
r sr′
p
u v w
q
t
l m n
f
mCherry+ cells mCherry+ mVenus+ cells mVenus+ cells
Mesh
Immunostaining
250,000 80,000
Pax8/FUCCI2aR Pax2/FUCCI2aR
100 250,000
200,000
150,000
50,00040,00030,00020,00010,000
0
90
80
40 *30
20
10
0
70,000
60,000
50,000
40,000
30,000
20,000
10,000
0
NS
*
*
*200,000
150,000
50,00040,00030,00020,00010,000
0
900 50014
12
10
8
6
4
2
35*
30
25
20
15
35 mCherry+p-H3+ cellsmVenus+ cells30
*
*
25
20
15
120 μm
80 μm
10
5
160 ***140
120
100
80
60
40
20
00
Cor
tex
Cor
tex
OSO
M
OSO
M
10
5
0
0
400
300
200
100
0
IRI T30 IRI T30
*
mCherry+ cells mCherry+ mVenus+ cells mVenus+ cells
Pax2/FUCCI2aR
mCherry+p-H3+ cells
mCherry+p-H3– cellsmCherry+p-H3+ cells
mVenus+ cells
Pax8/FUCCI2aR
700
500
300
1000
150
(×1000)
50 100
DNA content
mCherry+p-H3+LTA
p-H3+mCherry+Phalloidin
mCherry+mVenus+LTALTA
p-H3
mCherry
150
(×1000)
50 100
DNA content
T0 T0T2
IRI IRI
T2T30 T30 T0 T0
NSNS
NS
IRI
T2 IRI T2 IRI T30T30
Cellular
suspension
No. of
cells
/μL
No. of
FU
CC
I2aR
cells
No. of
new
FU
CC
I2aR
cells
at IR
I T
30
Pax8/F
UC
CI2
aR
mic
eP
ax8/F
UC
CI2
aR
mic
e
Pax2/F
UC
CI2
aR
mic
e
% o
f P
ax8/F
UC
CI2
aR
LTA
+ c
ells
% o
f P
ax8/F
UC
CI2
aR
AQ
P2– c
ells
/
AQ
P2– c
ells
Pax8+
cells
surf
ace a
rea (
μm
2)
% o
f endocyclin
g c
ells
/
tota
l F
UC
CI2
aR
Count
Count
% o
f P
ax2+
FU
CC
I2aR
/
Pax8+
FU
CC
I2aR
+
tota
l cells
No. of
mV
enus+
cells
+
mC
herr
y+
mV
enus+
cells
MacsQuant flow cytometry
Mechanical and enzymatic
digestion
Kidney isolation
1e3
1e3
1e2
2220181614121086420
2220181614121086420
mVenus
2220181614121086420
Pax8
Pax2
Pax8
Pax2
Pax8Pax
2
1e2
1e1
1e1
1e0
1e0
1e–1
1e3
1e2
1e1
1e0
1e–1
1e3
1e2
1e1
1e0
1e–1
1e3
1e2
1e1
1e0
1e–1
1e3
1e2
1e1
1e0
1e–1
1e3
1e2
1e1
1e0
1e–1
1e–1
1e3
1e2
1e1
1e0
1e–1
1e3
1e2
1e1
1e0
1e–1
1e3
1e2
1e1
1e0
1e–1
1e3
1e2
1e1
1e0
1e–1
1e3
1e2
1e1
1e0
1e–1
Pa
x8
/FU
CC
I2a
R m
ice
% o
f F
UC
CI2
aR
ce
lls
% o
f F
UC
CI2
aR
ce
lls
% o
f F
UC
CI2
aR
ce
lls
mC
he
rry
Pax2/F
UC
CI2
aR
mic
e
ARTICLE NATURE COMMUNICATIONS | DOI: 10.1038/s41467-018-03753-4
12 NATURE COMMUNICATIONS | (2018) 9:1344 |DOI: 10.1038/s41467-018-03753-4 |www.nature.com/naturecommunications

Pax2/Confetti mice) while another group was held in washout for an additional30 days (T30) and then mice were killed (n= 5 for Pax2/Confetti mice, n= 4 Pax8/Confetti mice induced with 0.25 mg/ml doxycycline hyclate). An additional groupwas induced with doxycycline for 10 days and was maintained for an additional37 days in continuous induction (doxycycline T30) (Pax2/Confetti mice n= 4).Another group of Pax2/Confetti mice (n= 3) was induced at 12 weeks of age for10 days, then it was kept in a washout period of 1 week and then it was killed. In allthese groups the number of male and female mice was equally distributed. Anotherexperimental group, following the induction and the washout period, underwent aunilateral IRI of 30′ or an intramuscular injection with hypertonic glycerol and wasthen killed at day 30 (n= 16 for Pax8/Confetti, n= 11 for Pax2/Confetti). Sham-operated mice (n= 5 Pax2/Confetti, n= 4 Pax8/Confetti mice) underwent thesame surgical procedure of ischemic mice, but did not experienced left renal arteryclamping and did not suffered of ischemia.
An additional group of Pax2/Confetti mice were induced with doxycycline for10 days and after the washout period mice underwent a unilateral IRI of 30′.Twenty-four hour after injury, mice were treated with HDACi, trichostatin (TSA,Sigma-Aldrich) 0.5 mg/Kg/day in 40 µL DMSO for 3 weeks i.p. (n= 4) or 4-phenylbutyrate (4-PBA, Sigma-Aldrich) 1 gr/Kg/day for 3 weeks in drinking water(n= 4). In a control group (n= 4), mice were treated with DMSO for 3 weeks.Mice were killed at day 30. Animals with identical genotype and similar age, wereassigned to experimental groups in a blinded manner.
To verify if the transgenic system exhibited any type of leakage or non-specifictransgene expression, Pax8/Confetti and Pax2/Confetti mice without inductionwere killed at T0 and at day 30 after IRI (n= 3 for each transgenic mouse at eachtime point).
All animals were killed by CO2 chamber and kidneys were collected, incubatedin 4% paraformaldehyde (PFA, Sigma-Aldrich) in PBS (Sigma-Aldrich) for 2 h at 4°C followed by immersion in a 15% sucrose solution in PBS for 2 h at 4 °C and,subsequently, in a 30% sucrose solution in PBS overnight at 4 °C, then frozen.
Pax8/FUCCI2 mice and Pax2/FUCCI2 mice. To visualize the cell cycle pro-gression of Pax2+ and Pax8+ cells, Pax2.rtTA;TetO.Cre;R26.FUCCI2 (Pax2/FUCCI2) or Pax8.rtTA;TetO.Cre;R26.FUCCI2 (Pax8/FUCCI2) mouse models wereemployed. To create the two strains, we crossed Pax2.rtTA;TetO.Cre or Pax8.rtTA;TetO.Cre mice with both R26R-mCherry-hCdt1(30/120) (CDB0229K) and R26R-mVenus-hGem(1/110) (CDB0230K) mice (both obtained from CDB Laboratory forAnimal Resources and Genetic Engineering, RIKEN Kobe, Japan, http://www.cdb.riken.jp/arg/reporter_mice.html), which combined constitute the FUCCI2 system.We thus obtained quadruple transgenic mice in a full C57BL/6 background thatwere genotyped as reported in “Genotyping” paragraph.
In the resulting mice, following doxycycline administration, Pax2 or Pax8promoter drives the expression of the fluorescent protein mCherry-hCdt1 (30/120)(red) in nuclei of cells in G1 phase, and of the fluorescent protein mVenus-hGem(1/110) (green) in nuclei of cells in S/G2/M phase. Cells can also appear as yellow atthe G1/S boundary, but this is a very short event and thus yellow cells are rare. Toinduce reporter expression, at 5 weeks of age male mice were treated with 2 mg/mlof doxycycline in 2.5% sucrose water ad libidum, then were kept in a washoutperiod of 1 week (T0, Pax2/FUCCI2 n= 4, Pax8/FUCCI2 n= 4). The percentage ofinduction was defined in healthy mice as the number of Pax8-lineage-positive cellsexpressing mCherry or mVenus on the total number of tubular cells per field. Afterthe washout period mice underwent a unilateral IRI of 30 min (same procedureperformed in Confetti mice), and were then killed at day 2 (Pax2/FUCCI2 n= 8,Pax8/FUCCI2 n= 8) and at day 30 (Pax2/FUCCI2 n= 9, Pax8/FUCCI2 n= 12).Animals with identical genotype and similar age were assigned to experimentalgroups in a blinded manner. To verify if the transgenic system exhibited any typeof leakage or non-specific transgene expression, Pax8/FUCCI2 and Pax2/FUCCI2
mice without induction were killed at T0 and at day 30 after IRI (n= 3 for eachtransgenic mouse at each time point).
All animals were killed by CO2 chamber and kidneys were collected andevaluated by the confocal microscopy or by flow cytometry. To perform confocalanalysis, kidneys were processed as described for Confetti mice.
Pax8/FUCCI2aR mice and Pax2/FUCCI2aR mice. The FUCCI2aR represents asignificant advancement on the FUCCI model, since it produces iso-stoichiometricquantities of both FUCCI probes without the existence of the “dark phase”at theend of each cell cycle. This newer model has the advantage that both probes arealways expressed in the same ratio, simplifying the detection of green–red transi-tion and making it possible to directly trace and quantify the number of labeledcells by flow cytometry using the MACSQuant software (Miltenyi Biotec S.r.l.,Bologna, Italy). For this reason, we crossed Pax8.rtTA;TetO.Cre; as well as Pax2.rtTA;TetO.Cre; mice with mice harboring the Fluorescent Ubiquitin-based Cellcycle Indicator (FUCCI2aR) Cre-dependent reporter (European Mouse MutantArchive (EMMA), INFRAFRONTIER-I3, Neuherberg-München, Germany), whichconsists of a bicistronic Cre-activable reporter of two fluorescent proteins whoseexpression alternates based on cell cycle phase: mCherry-hCdt1 (30/120) (red),expressed in nuclei of cells in G1 phase, and mVenus-hGem (1/110) (green),expressed in nuclei of cells in S/G2/M. We thus obtained triple transgenic mice in afull C57BL/6 background that were genotyped as reported in “Genotyping”paragraph.
In the resulting mice, following doxycycline administration, Pax2 or Pax8promoter drives the expression of the fluorescent protein mCherry-hCdt1 (30/120)(red) in nuclei of cells in G1 phase, and of the fluorescent protein mVenus-hGem(1/110) (green) in nuclei of cells in S/G2/M phase. Cells can also appear as yellow atthe G1/S boundary, but this is a very short event and thus yellow cells are rare.
To induce reporter expression, at 5 weeks of age male mice were treated with 2mg/ml of doxycycline in 2.5% sucrose water ad libidum, then were kept in awashout period of 1 week (T0, Pax2/FUCCI2aR n= 4, Pax8/FUCCI2aR n= 4).The percentage of induction was defined in healthy mice as the number of Pax8-lineage-positive cells expressing mCherry or mVenus on the total number oftubular cells per field. After the washout period male mice underwent a unilateralIRI of 30 min (same procedure performed in Confetti mice), and were then killed atday 2 (Pax2/FUCCI2aR n= 4, Pax8/FUCCI2aR n= 4) and at day 30 (Pax2/FUCCI2aR n= 9, Pax8/FUCCI2aR n= 9). Animals with identical genotype andsimilar age were assigned to experimental groups in a blinded manner. To verify ifthe transgenic system exhibited any type of leakage or non-specific transgeneexpression, Pax8/FUCCI2aR and Pax2/FUCCI2aR mice without induction werekilled at T0 and at day 30 after IRI (n= 3 for each transgenic mouse at each timepoint).
All animals were killed by CO2 chamber and kidneys were collected andevaluated by confocal microscopy or by flow cytometry. To perform confocalanalysis kidneys were processed as described for Confetti mice.
Genotyping. Tail biopsies were incubated overnight at 55 °C in lysis reagent (1MTris-HCl, pH 8.5; 0.5 M EDTA, 20% SDS, 4M NaCl, 0.1 mg/ml proteinase Kneutralized with 40 mM Tris-HCl, all from Sigma-Aldrich), centrifuged and DNAextracted using isopropanol (Sigma-Aldrich). To distinguish transgene homo-zygosity from heterozygosity, qRT-PCR were performed by using 5 ng/µl ofgenomic DNA with LightCycler® 480 SYBR Green I Master (Roche Diagnostics,Rotkreuz, Switzerland). The reactions were performed using a LightCycler® 480(Roche Diagnostics) with a program consisting of 40 cycles each constituted of aninitiation phase at 95 °C for 15 min, annealing phase at 60 °C for 45 min andamplification phase at 72 °C for 60 min. The following primers were used:
Fig. 7 Pax2 lineage-positive cells proliferate, while other TEC endocycle and are persistently lost after AKI. a Schematic procedure. b–j FACS analysis shows
mCherry+ and mVenus+ cells in total renal cells of Pax8/FUCCI2aR (b, d) and Pax2/FUCCI2aR mice (c, d) at T0, of Pax8/FUCCI2aR (e, g) and Pax2/
FUCCI2aR mice (f, g) at IRI T2 and of Pax8/FUCCI2aR (h, j) and Pax2/FUCCI2aR mice (i, j) at IRI T30. A representative experiment out of 4 is shown. k
Number of total FUCCI2aR cells in Pax8/FUCCI2aR and Pax2/FUCCI2aR mice at T0, IRI T2, IRI T30 (n= 4 in each group). Mann–Whitney test *p < 0.05. l
Number of new FUCCI2aR cells in Pax8/FUCCI2aR and Pax2/FUCCI2aR mice at IRI T30 in comparison to IRI T2 (n= 4 in each group). Mann–Whitney test
NS.m Percentage of Pax2/FUCCI2aR over Pax8/FUCCI2aR total cells at T0, IRI T2, IRI T30 (n= 4 in each group). Mann–Whitney test *p < 0.05. n Number
of total mVenus+ cells mCherry+mVenus+ cells in Pax8/FUCCI2aR and Pax2/FUCCI2aR mice at T0, IRI T2, IRI T30 (n= 4 in each group).
Mann–Whitney test NS. o, p Cell cycle distribution of mCherry+, mVenus+, and mCherry+mVenus+ cells in Pax8/FUCCI2aR (o) and Pax2/FUCCI2aR
mice (p) at IRI T30. A representative experiment out of 4 is shown. q Percentage of endocycling cells in Pax2/FUCCI2aR (black column) and Pax8/
FUCCI2aR mice (light gray column) at IRI T30 (n= 4 in each group). Mann–Whitney test *p < 0.05. r mCherry+ cells (red) and p-H3+ cells (blue) in LTA
+ tubules in the cortex (white) of Pax8/FUCCI2aR mice at IRI T30 (n= 5). Arrows show mCherry+p-H3+ cells. r′ Detail of r. s mCherry+ cells (red) and
mVenus+ cells (green) in LTA+ tubules in the cortex (white) of Pax8/FUCCI2aR mice at IRI T30 (n= 5). Arrow shows mVenus+ cell. t Percentage of
endocycling cells (mCherry+p-H3+ cells) and cycling cells (mVenus+ cells) in the cortex of Pax8/FUCCI2aR mice at IRI T30 (n= 5). Mann–Whitney test
*p < 0.05. u Percentage of endocycling (mCherry+p-H3+ cells) and cycling (mVenus+ cells) AQP2− cells in the cortex and in OSOM of Pax8/FUCCI2aR
mice at IRI T30 (n= 5). Mann–Whitney test *p < 0.05. v Measurement of the cell surface area of mCherry+p-H3+ cells and of mCherry+p-H3− cells
after staining with Phalloidin (white) with Image J software in Pax8/FUCCI2aR mice at IRI T30 (n= 4). w Cell surface area of mCherry+p-H3+ cells and of
mCherry+p-H3− cells in Pax8/FUCCI2aR mice at IRI T30. n= at least 20 cells for each mouse (n= 4), Mann–Whitney test ***p < 0.001. Data are mean ±
SEM. Scale bars 20 µm. T0= day 0, IRI T2= day 2 after IRI, IRI T30= day 30 after IRI
NATURE COMMUNICATIONS | DOI: 10.1038/s41467-018-03753-4 ARTICLE
NATURE COMMUNICATIONS | (2018) 9:1344 |DOI: 10.1038/s41467-018-03753-4 |www.nature.com/naturecommunications 13

a
c d
g
h
d′
g′
b
CDK4+p-H3+LTA+DAPI
CDK4+p-H3+LTA+DAPI CDK4+p-H3+LTA+DAPI
Y-probe + Phalloidin Y-probe + Phalloidin
DAPILTA
p-H3CDK4
CDK4+p-H3+LTA+DAPI
e f
% o
f C
DK
4+
p-H
3+
LTA
+/L
TA
+ c
ells
% o
f C
DK
4+
p-H
3+
/to
tal tu
bu
lar
ce
lls
55
Healthy
CKD after AKI
*
*
50
45
40
35
30
25
20
15
10
5
0
55
50
45
40
35
30
25
20
15
10
5
0
Fig. 8 High percentage of endocycling TECs in the kidney of patients that developed CKD after AKI. a A healthy kidney section showing the expression of
CDK4 (green) and p-H3 (red) in LTA+ proximal tubular cells (blue) (n= 4). b–d A renal biopsy section from a patient that developed CKD after AKI (n=
7) showing CDK4+p-H3+ (green and red cells, arrows) and CDK4−p-H3+ (red cells, arrowheads) or CDK4+p-H3− (green cells, arrowheads) in
proximal tubular LTA+ cells (blue). d′ Split images of the tubule shown in d. e Percentage of CDK4+p-H3+LTA+ cells over total proximal TECs (LTA+) in
healthy kidneys (n= 4) and in renal biopsies from patients that developed CKD after AKI (n= 7). Mann–Whitney test *p < 0.05. f Percentage of CDK4+p-
H3+ cells over total TECs in healthy kidneys (n= 4) and in renal biopsies from patients that developed CKD after AKI (n= 7). Mann–Whitney test *p <
0.05. g, g′ A renal biopsy section from a patient that developed CKD after AKI (n= 8) showing the presence of two or three Y chromosome-probe (green)
in TECs labeled with Phalloidin (red), at different magnifications. Arrowheads indicate doubled dots for Y chromosome in a nucleus. h High magnification of
another biopsy field. Arrowhead indicates triple dots for Y chromosome in a nucleus. DAPI counterstains nuclei. Data are mean ± SEM. Scale bars 20 µm
ARTICLE NATURE COMMUNICATIONS | DOI: 10.1038/s41467-018-03753-4
14 NATURE COMMUNICATIONS | (2018) 9:1344 |DOI: 10.1038/s41467-018-03753-4 |www.nature.com/naturecommunications

Pax2.rtTA and Pax8.rtTA forward 5′-AACGCACTGTACGCTCTGTC-3′ andreverse 5′-GAATCGGTGGTAGGTGTCTC-3′; TetO.Cre forward 5′-TCGCTGCATTACCGGTCGATGC-3′ and reverse 5′-CCATGAGTGAACGAACCTGGTCG-3′. TCRα genomic DNA was used as genehousekeeping for relative quantification and was amplified by using the forward 5′-CAAATGTTGCTTGTCTGGTG-3′ and the reverse 5′-GTCAGTCGAGTGCACAGTTT-3′ primers.
To distinguish FUCCI2aR and Confetti homozygosity from heterozygosity,PCR were performed with the following primers and parameters: Confetti forward5′-GAATTAATTCCGGTATAACTTCG-3′ and reverse 5′-AAAGTCGCTCTGAGTTGTTAT-3′, 3 min 94 °C, 35 cycles of 30 s 94 °C, 30 s 58 °C, 30 s 72 °C and, finally, 2 min 72 °C; FUCCI-P3 5′-TCCCTCGTGATCTGCAACTCCAGTC-3′, FUCCI-P4 5′-AACCCCAGATGACTACCTATCCTCC-3′ and FUCCI-P4 5′-GGGGGAGGATTGGGAAGACAATAGC-3′; 2 min 96 °C, 35 cycles of 96 °C 30 s,65 °C 30 s and, finally, 72 °C for 30 s.
Renal ischemia reperfusion injury. Male mice were anesthetized by intraper-itoneal injection of Ketamine (100 mg/kg)/Xylazine (10 mg/kg, Bio98 S.r.L, Milan,Italia), which produced short-term surgical anesthesia with good analgesia. Theanimals were kept warm in a 37 °C ventilated heating chamber before surgery andtheir body temperature was monitored constantly by a rectal probe and maintainedin the range of 36.5–37 °C. The mouse was placed on a thermostatic station layingon the right side, shaved and disinfected with Povidone-iodine and an incision of1–1.5 cm on the skin on the left side was performed, then the muscle layer belowwas cut and opened. The left kidney was then externalized pushing it out from thecut with sterile cotton swabs to expose the renal pedicle for clamping. The renalartery was clamped to block blood flow to the kidney and cause ischemia (visible bycolor change of the kidney from red to dark purple). The duration of kidneyischemia starts from the time of clamping. After verification of the color changes,the kidney was returned to the abdomen cavity and the animal returned to theventilated heating chamber. The duration of ischemia was 30 min, after which theclamp was removed to start the reperfusion, which is indicated by the change ofkidney color back to red. The muscle layer was sutured, followed by the closure ofthe skin wound with metal clips. Immediately after the wound closure, 0.5 ml warmsterile saline (0.9% NaCl) was given subcutaneously to each mouse to rehydrate it.The right contralateral kidney was maintained untouched as a control.
Sham-operated mice underwent the same surgical procedure as above, but didnot experienced left renal artery clamping and did not suffered of ischemia.
Nephrotoxic AKI. Transgenic female mice were induced for 10 days with doxycy-cline, held 1 week in washout, following which rhabdomyolysis-induced AKI wasperformed, by intramuscular injection on day 0 with hypertonic glycerol (8ml/kgbody weight of a 50% glycerol solution; Sigma-Aldrich) into the inferior hind limbs.
Transcutaneous measurement of glomerular filtration rate. Measurement ofthe glomerular filtration rate (GFR) was done as described elsewhere42. In brief,mice (n= 9 Pax2/Confetti ischemic mice, n= 13 Pax8/Confetti ischemic mice,n= 5 Pax8/Confetti sham-operated mice, n= 5 Pax2/Confetti sham-operatedmice, n= 5 Pax8/Confetti healthy mice, n= 5 Pax2/Confetti healthy mice, n= 7Pax8/Confetti glycerol-treated mice, n= 8 Pax2/Confetti glycerol-treated mice,n= 7 Pax2/Confetti ischemic mice treated with DMSO, n= 6 treated with PBS,n= 7 treated with TSA, n= 6 treated with PBA) where anesthetized with
isoflurane and a miniaturized imager device built from two light-emitting diodes, aphotodiode and a battery (Mannheim Pharma and Diagnostics GmbH, Mannheim,Germany) were mounted via a double-sided adhesive tape onto the shaved animals’neck. For the duration of recording (~1.5 h) each animal was conscious and kept ina single cage. Prior to the intravenous injection of 150 mg/kg FITC-sinistrin(Mannheim Pharma and Diagnostics GmbH), the skin’s background signal wasrecorded for 5 min. After removing the imager device, the data were analyzed usingMPD Studio software ver.RC6 (MediBeacon GmbH Cubex41, Mannheim, Ger-many)43. The GFR [µl/min] was calculated from the decrease of fluorescenceintensity over time (i.e., plasma half-life of FITC-sinistrin) using a two-compartment model, the animals body weight and an empirical conversion factor.For each time point, GFR value was normalized on the value at baseline and on thesham (for ischemic mice) or healthy mice of comparable age and weight (forglycerol-treated mice) value. Based on the results obtained in preliminary experi-ments to assess GFR measurement variability, only mice showing a drop of GFRafter AKI of at least 20% over baseline were included in the study.
Estimation of blood urea nitrogen. Renal function was assessed by collecting asmall amount of blood from mice (n= 5 Pax8/Confetti ischemic mice, n= 5 Pax8/Confetti sham-operated mice, n= 6 Pax8/Confetti glycerol-treated mice, n= 5Pax8/Confetti healthy mice, n= 8 Pax2/Confetti glycerol-treated mice, n= 5 Pax2/Confetti healthy mice) with a metal lancet from submandibular plexus at differenttime points in order to measure BUN levels. Blood parameters were measured inEDTA anticoagulated plasma samples using Urea FS kit (DiaSys Diagnostic Sys-tems, Holzheim, Germany), according to the manufacturer’s protocols.
Assessment of renal injury. Healthy and ischemic kidneys stored in 4% bufferedformalin were embedded in paraffin and 2–4 µm sections were prepared for per-iodic acid–Schiff (PAS) staining. Ischemic tubular injury and scaring were eval-uated by assessing the percentage of tubules in the outer stripe of outer medullathat displayed cell necrosis, tubular dilatation or cast formation (injury), atubularsections with abundant unorganized parenchyma cells and cell infiltrates (scar-ring). Twenty-four kidneys from Pax2/Confetti mice and 4 fields (20×) per kidneywere analyzed. All assessments were performed by a blinded observer.
Immunofluorescence and confocal microscopy. Confocal microscopy was per-formed on 10 μm sections of renal tissues by using a Leica SP5 AOBS confocalmicroscope (Leica, Wetzlar, Germany) equipped with a Chameleon Ultra-II two-photon laser (Coherent, Milan, Italy).
The following antibodies were used: anti-aquaporin-1 (AQP1, AB2219, dilution1:100, Millipore, Darmstadt, Germany), anti-Tamm-Horsfall (THP, CL1032A,dilution 1:20, Cederlane, Burlington, Ontario, Canada), anti-aquaporin-2 (AQP2,C-17, SC-9882, diluition 1:25, Santa Cruz Biotechnology, Saint Louis, USA), anti-megalin (P-20, sc-16478, diluition 1:25, Santa Cruz Biotechnology), biotinylatedLotus Lectin, LTA (B-1325, dilution 1:50, Vector Laboratories, Burlingame, USA),anti-KIM-1 (AF1817, dilution 1:40, R&D Systems, Inc., Minneapolis, USA), anti-Pax2 (71–6000, dilution 1:25, Zymed, Thermo Fisher Scientific, MA USA) anti-Ki-67 (ab15580, dilution 1:50, Abcam, Cambridge, UK), anti-GFP-488 (A21311,dilution 1:100, Life Technologies, Monza, Italy), anti-phosphorylated Histone 3 (p-H3, ab14955, dilution 1:2000, Abcam), anti-cyclin dependent kinase 4 (CDK4, SC-601, dilution 1:50, Santa Cruz Biotechnology) and Phalloidin-633 (A22284,dilution 1:40, Life Technologies). Alexa-Fluor secondary antibodies were obtained
Table 1 List of patients with CKD after AKI analyzed in this study
Patient Gender Age (years) Diagnosis Number and severity of AKI
episode(s)
CKD stage Time since last AKI episode(s) and
biopsy (days)
1. M 10 TIN 1× AKIN3 CKD2 45
2. M 5 IRI 2× AKIN3 CKD3 180
3. M 59 IRI 3× AKIN1 CKD4 365
4. M 56 Sepsis 1× AKIN3 CKD4 30
5. M 73 Light chain ATN 1× AKIN1, 1× AKIN2 CKD4 365
6. M 57 IRI 1× AKIN3 CKD4 730
7. F 55 IRI 1× AKIN1, 2× AKIN2 CKD4 270
8. F 30 IRI 1× AKIN3 CKD3 1460
9. M 56 IRI 1× AKIN3 CKD4 45
10. M 38 IRI 1× AKIN2 CKD3 30
11. M 44 RCC-normal tissue None None
12. M 86 RCC-normal tissue None None
13. M 26 RCC-normal tissue None None
14. M 74 RCC-normal tissue None None
15. F 51 RCC-normal tissue None None
TIN tubulointerstitial nephritis, IRI ischemia reperfusion injury, ATN acute tubular necrosis, AKIN Acute Kidney Injury Network criteria, number indicates stage, CKD chronic kidney disease, number
indicates stage, RCC renal cell carcinoma
NATURE COMMUNICATIONS | DOI: 10.1038/s41467-018-03753-4 ARTICLE
NATURE COMMUNICATIONS | (2018) 9:1344 |DOI: 10.1038/s41467-018-03753-4 |www.nature.com/naturecommunications 15

from Molecular Probes (Life Technologies). For the detection of tubules, stainingwith Alexa Fluor 546 Phalloidin (A22283, dilution 1:40, Molecular Probes, LifeTechnologies) was performed. For the Pax8/Confetti mice and for Pax2/Confettimice the acquisition was set in the cyan, green, yellow, and red wavelengths using405, 488, 514, and 543 nm wavelength excitation, respectively. For Pax8/FUCCI2mice, Pax2/FUCCI2, Pax8/FUCCI2aR, and Pax2/FUCCI2aR mice the acquisitionwas set in green and red wavelengths using 488, and 543 nm excitation,respectively. mCherry emission was collected through 570/620 nm BP. Nuclei werecounterstained with DAPI (62248, dilution 1:1000, Life Technologies) excited withChameleon Ultra-II two-photon laser at 800 nm.
Cell surface area of at least 20 mCherry+p-H3− cells and 20 mCherry+p-H3+cells for each Pax8/FUCCI2aR mouse were measured using Image J software. Onefield is: 620 × 620 µm.
3D reconstruction. To generate 3D images (Fig. 4g–i) and SupplementaryMovie 1, an image processing software from Leica Microsystems “Leica Applica-tion Suite X” was used. Z-series stacks were obtained from 40 µm kidney slices,being this thickness the limit to stain all the nuclei with DAPI, permitting cellcounting. Images were collected at 1 µm intervals. Clones were observed in everycolor, but for 3D reconstruction, we chose mostly the yellow ones cause the YFP isdistributed in all the cell, making the 3D reconstruction easier to build andappreciate.
To compare 2D with 3D analysis, two blinded observers counted the number ofclones in 2D images and in 3D reconstruction. The percentage of clonogenic cellswas calculated as reported below (Eq. 2).
Immunohistochemistry. Immunohistochemistry for PCNA was performed inparaffin embedded healthy and ischemic kidney sections (n= 5 at day 0, n= 5 atday 2 and at day 30 after IRI), as detailed elsewhere44. Briefly, after removing theparaffin and rehydrating in water, the tissue sections were submerged in 3% H2O2
for 10 min to block the endogenous peroxidase activity. The target antigen wasretrived by microwaving the sections in sodium citrate buffer (10 mM, pH 6). Thesamples were heated in a microwave at 800W for 3 min and then for 7 min at 400W. The sections were cooled for 30 min at room temperature. After that, the 10-min heating procedure was repeated with fresh buffer. Sections were pre-incubatedfor 30 min in 1× PBS, 1% bovine serum albumin, 0.05% saponin and subsequentlyincubated for 15 min at 37 °C and overnight at 4 °C with mouse anti-PCNA (PC10,ab29, dilution 1:300, Abcam). Then, sections were incubated for 1 h at roomtemeperature with secondary biotynilated-anti mouse IgG antibody, followed by anincubation with avidin-biotin-peroxidase complex (Vectastain ABC kit, VectorLaboratories) for 30 min, and 3-amino-9-ethylcarbazole (AEC, Vector Labora-tories) (red color) as peroxidase substrate for 20 min. Sections were counterstainedwith Eosin G (Bioptica, Milan, Italy).
Clone frequency analysis. Single-cell clones and clones with two or more cellswere counted in AQP2− tubules of the outer stripe of outer medulla in Pax8/Confetti mice at day 0 (T0), in age-matched controls (T30), in sham operated, inischemic kidneys (IRI T30) and in nephrotoxic kidneys (Gly T30).
For each clone size, clone frequency analysis showed in Fig. 1j, was assessed asfollowed:
Clone frequency ð%Þ ¼ ðn� of clones of n cells=total n� of clonesÞ ´ 100; ð1Þ
where 1 ≤ n ≤ 11 in Pax8/Confetti mice because this is the maximum clone sizeobserved.
Same calculations were performed in Pax2/Confetti mice at T0, T30, shamoperated and IRI T30 where 2 ≤ n ≤ 10 (Fig. 3f)
Clones observed in a total of at least 30 fields of outer stripe of the outermedulla taken from at least five sections of each mouse were counted by twoindependent blinded observers. Clone size was established by counting the nucleicounterstained with DAPI.
See Supplementary Methods for a representative calculation.
Clonogenic cell analysis. To establish the percentage of clonogenic cells in Pax8/Confetti mice we performed the following calculations:
(A) n° of new clones at day 30 after IRI (IRI T30)=
X11
n¼2
clones composed of n cells at IRI T30� clones composed of n cells at T0ð Þ;
where 2 ≤ n ≤ 11 in Pax8/Confetti mice because the maximum clone size observedis 11 cells.
(B) % of clonogenic cells at IRI T30 in comparison to T0 (vs. T0) showed inFig. 1l.
A=n� of Pax8þcells at T0ð Þ ´ 100: ð2Þ
Same calculations were performed in Pax2/Confetti mice where 2 ≤ n ≤ 10(Fig. 3j).
Same calculations were performed in Pax8 and Pax2 Confetti mice 30 days afternephrotoxic AKI (Gly T30, Fig. 1l, Fig. 3n).
Same calculations were performed for 3D analysis in Pax8 and Pax2 Confettimice at IRI T30 (Fig. 4f)
All the analysis was performed in tubular cells excluding collecting ducts (AQP2immunostained) of the outer stripe of outer medulla. All counts were executed bytwo independent blinded observers.
See Supplementary Methods for a representative calculation.
Percentage of new cells after ischemic or nephrotoxic AKI. To establish thepercentage of new cells in Pax8/Confetti mice at IRI T30 we performed the fol-lowing calculations (Fig. 1k):
(C) n° of Pax8+ cells included in clones at IRI T30
X11
n¼2
½ clones composed of n cells at IRI T30� clones composed of n cells at T0ð Þ ´ n�;
where 2 ≤ n ≤ 11 in Pax8/Confetti mice because the maximum clone size observedis 11 cells.
(D) n° of new Pax8+ cells at IRI T30= n° of Pax8+ cells included in newclones–n° of cells that originated new clones*
C � A
* the n° of cells that originated new clones coincides with the n° of new clones atIRI T30 (A), because each clone is the progeny of one cell.
(E) % of new Pax8+ cells at IRI T30 in comparison to T0
ðD=n� of Pax8þcells at T0Þ ´ 100: ð3Þ
Same calculations were performed in Pax8/Confetti mice after nephrotoxic AKI(Fig. 1k) and in Pax2/Confetti mice at day 30 after IRI (Fig. 3g). In Pax2/Confettimice 2 ≤ n ≤ 10.
All the analysis was performed in tubular cells excluding collecting ducts (AQP2immunostained) of the outer stripe of outer medulla. All counts were executed bytwo independent blinded observers.
See Supplementary Methods for a representative calculation.
Percentage of lost cells after ischemic or nephrotoxic AKI. To establish thepercentage of lost cells in Pax2/Confetti mice after ischemic AKI, we performed thefollowing calculations (Fig. 3i):
100� n� of Pax2þcells at IRI T30� D=n� of Pax2þcells at T0ð Þ ´ 100½ �: ð4Þ
Same calculations were performed in Pax8/Confetti mice after ischemic AKI(Fig. 3i) and in Pax2/Confetti and Pax8/Confetti mice after nephrotoxic AKI(Fig. 3m).
All the analysis was performed in tubular cells excluding collecting ducts (AQP2immunostained) of the outer stripe of outer medulla. All counts were executed bytwo independent blinded observers.
See Supplementary Methods for a representative calculation.
Percentage of variation over T0. To establish the percentage of variation over T0in Pax2/Confetti mice after ischemic AKI, we performed the following calculations(Fig. 3k):
n� of Pax2þcells at IRI T30=n� of Pax2þcells at T0ð Þ ´ 100½ � � 100: ð5Þ
Same calculations were performed in Pax8/Confetti mice after ischemic AKI(Fig. 3k) and in Pax2/Confetti and Pax8/Confetti mice after nephrotoxic AKI(Fig. 3o).
All the analyses were performed in tubular cells excluding collecting ducts(AQP2 immunostained) of the outer stripe of outer medulla. All counts wereexecuted by two independent blinded observers.
Percentage of variation of Pax2+ cells and Pax2− cells over IRI. To establishthe percentage of variation of Pax2+ cells over IRI in Pax2/Confetti mice afterischemic AKI and treatment with TSA or 4-PBA, we performed the followingcalculations (Fig. 5e):
n� of Pax2þcells after treatment at IRI T30=n� of Pax2þcells at IRI T30ð Þ ´ 100½ �:
ð6Þ
Same calculations were performed for Pax2− cells (Fig. 5e). All counts wereexecuted by two independent blinded observers.
ARTICLE NATURE COMMUNICATIONS | DOI: 10.1038/s41467-018-03753-4
16 NATURE COMMUNICATIONS | (2018) 9:1344 |DOI: 10.1038/s41467-018-03753-4 |www.nature.com/naturecommunications

Frequency of Pax2+ clones. This analysis was performed in the cortex aftermegalin immunostaining, in the OSOM after AQP1 and THP immunostaining andin the collecting ducts after AQP2 immunostaining.
To establish the frequency of Pax2+ clones in nephron segments and incollecting ducts, we performed the following calculations (Fig. 4e):
(F) n° of total Pax2+ new clones at day 30 after IRI (IRI T30)=
n� of newmegalinþclonesþ n� of new AQP1þ clones
þn� of new THPþ clonesþ n� of new AQP2þclones:
The n° of new clones was determined based on the calculation used informula A.
(G) frequency of Pax2+ clones (%) in each nephron segment and in collectingducts=
A=Fð Þ ´ 100: ð7Þ
Cell cycle analysis by flow cytometry. Cell cycle analysis was performed on totalFUCCI2 cells and on total FUCCI2aR cells (mCherry+ and mVenus+ cells) inPax8/FUCCI2 mice, in Pax2/FUCCI2 mice, in Pax8/FUCCI2aR mice, and in Pax2/FUCCI2aR mice at 2 days and at 30 days after IRI.
Pax8/FUCCI2, Pax8/FUCCI2aR, Pax2/FUCCI2, and Pax2/FUCCI2aR kidneyswere processed in order to obtain a single cell suspension and to perform cell cycleanalysis by flow cytometry. To this aim, kidneys were minced using a scalpel. Afteraddition of 1.5 ml of digestion buffer (300 U/ml Collagenase II and 1 mg/mlPronase E, Sigma-Aldrich) they were incubated at 37 °C for 20 min. The solutionwas pipetted up and down with a cut 1000 µl pipette tip every 5 min. The digestedkidneys were gently pressed through a graded mesh screen (150 mesh, Sigma-Aldrich) and the flow through was washed extensively with HBSS (LifeTechnologies). After spinning down, the supernatants were discarded and thepellets digested again with digestion buffer at 37 °C for 20 min. During thisincubation period the suspensions were sheared with a 27-G needle. Erythrocyteswere lysed with NH4Cl 0.8%. Single-cell suspensions were fixed with 1% PFA for 1h at RT and with 70% ethanol overnight. Then cells were stained as describedelsewhere45. Incubation with anti-DsRed pAb (632496, dilution 1:25, Clontech,Mountain View, CA, USA) or isotype control was followed by incubation withAlexa Fluor 647 goat anti-rabbit as secondary antibody to detect mCherry+ cells,whereas for detection of mVenus+ cells was used an anti-GFP-488 pAb (A21311,dilution 1:100, Life Technologies). Cells were, then, incubated with DAPI toperform the DNA content analysis. In order to verify if similar results wereobtained after depletion of AQP2+ cells, Pax8/FUCCI2 mouse kidneys (n= 3)were processed as above and cells were fixed with 1% PFA for 1 h at RT. An aliquotof cells was incubated with anti-AQP2 pAb (bs-4611R, dilution 1:20, Bioss Inc.,Woburn, Massachusetts) or with isotype control and with Alexa Fluor 647 goatanti-rabbit as secondary antibody (Life Technologies). The remaining part of thecells were incubated with anti-AQP2 pAb (bs-4611R, dilution 1:20, Bioss Inc.)followed by anti-rabbit MicroBeads (Miltenyi Biotec S.r.l.), then passed throughMS columns (Miltenyi Biotec S.r.l.) accordingly with the manufacturer’s protocoland collecting the first flow-through containing unlabeled cells in order to performa magnetic cell depletion of AQP2+ cells. A small part of both the depleted- ornot-depleted AQP2 cell fractions were stained with AQP2 pAb (bs-4611R, dilution1:20, Bioss Inc.) followed by an Alexa Fluor 647 goat anti-rabbit as secondaryantibody and then analyzed by Cytoflex S instrument (Beckman Coulter, Brea, CA)with CytExpert software. AQP2-depleted cell fraction was fixed with 70% ethanolovernight and the day after was stained with anti-DsRed pAb (632496, dilution1:25, Clontech) and anti-GFP pAb (A21311, dilution 1: 100, Life Technologies) asabove to evaluate mCherry+ cells and mVenus+ cells. More than 50,000 eventswere analysed in each experiment by using a FACS LSRII instrument (BDBiosciences, San Jose, CA) with the FACSDiva software or by using Cytoflex Sinstrument (Beckman Coulter) with CytExpert software. More than 50,000 eventswere analysed in the experiments with Pax8/FUCCI2aR and Pax2/FUCCI2aR miceby using a FACS LSRII instrument (BD Biosciences) and a MacsQuant instrument(Miltenyi Biotec S.r.l.). The assessment of the total number of Pax8/FUCCI2aR andPax2/FUCCI2aR cells was performed by using a MacsQuant instrument (MiltenyiBiotec S.r.l.). Alexa Fluor 647 secondary antibody was excited by a 633 nm laserline, GFP pAb was excited by a 488 nm laser line, DAPI was excited by a UV laserat 355 nm.
Tissues. A total of 5 healthy kidneys (4 men and 1 woman, mean age 56.2 ± 11)and 10 renal biopsies from patients (mean age 43.7 ± 7.2) that developed CKD afterAKI were analyzed in agreement with the Ethical Committee on human experi-mentation of the Azienda Ospedaliero-Universitaria Careggi and of the MeyerChildren’s University Hospital, Florence, Italy. Normal kidney fragments wereobtained from the pole opposite to the tumor of patients who underwentnephrectomy for localized renal tumors. Formal consents were obtained by thedonors or relatives. The AKI stage was classified according to KDIGO Guidelines46.
The list of patients with CKD after AKI analyzed in this study is reported inTable 1.
Fluorescence in situ hybridization analysis. Fluorescence in situ hybridizationanalysis was performed using Whole Chromosome Painting Probe for Y chro-mosome (FITC) (Cytocell Ltd, Tarrytown, NY, USA) following the manufacturer’sinstructions in combination with Phalloidin-546 (A22283, dilution 1:40, LifeTechnologies).
Study approval. Animal experiments were approved by the Institutional ReviewBoard and by the Italian Ministery of Health and by the Ethical Committee of the“Regierung von Oberbayern” and performed in accordance with institutional,regional, and state guidelines and in adherence to the National Institutes of HealthGuide for the Care and Use of Laboratory Animals. Mice were housed in a specificpathogen-free facility with free access to chow and water and a 12-h day/nightcycle.
Statistical analysis. The results were expressed as mean ± SEM. Comparisonbetween groups was performed by the Mann–Whitney U-test, or through theanalysis of variance for multiple comparisons (ANOVA for repeated measures)with Tukey post hoc analysis. p < 0.05 was considered to be statisticallysignificant.
Data availability. The authors declare that all data supporting the findings of thisstudy are available within the article and its Supplementary Information Files orfrom the corresponding author upon reasonable request.
Received: 13 September 2016 Accepted: 8 March 2018
References1. Mehta, R. L. et al. International Society of Nephrology’s 0by25 initiative for
acute kidney injury (zero preventable deaths by 2025): a human rights case fornephrology. Lancet 385, 1–28 (2015).
2. Bellomo, R., Kellum, J. A. & Ronco, C. Acute kidney injury. Lancet 380,756–766 (2012).
3. Lameire, N. H. et al. Acute kidney injury: an increasing global concern. Lancet382, 170–179 (2013).
4. Chawla, L. S., Eggers, P. W., Star, R. A. & Kimmel, P. L. Acute kidney injuryand chronic kidney disease as interconnected syndromes. N. Engl. J. Med. 371,58–66 (2014).
5. Sharfuddin, A. A. & Molitoris, B. A. Pathophysiology of ischemic acute kidneyinjury. Nat. Rev. Nephrol. 7, 189–200 (2011).
6. Zuk, A. & Bonventre, J. V. Acute kidney injury. Annu. Rev. Med. 67, 293–307(2016).
7. Lombardi, D., Becherucci, F. & Romagnani, P. How much can the tubuleregenerate and who does it? An open question. Nephrol. Dial. Transplant. 13,gfv262 (2015).
8. Angelotti, M. L. et al. Characterization of renal progenitors committed towardtubular lineage and their regenerative potential in renal tubular injury. StemCells 30, 1714–1725 (2012).
9. Rinkevich, Y. et al. In vivo clonal analysis reveals lineage-restricted progenitorcharacteristics in mammalian kidney development, maintenance, andregeneration. Cell Rep. 7, 1270–1283 (2014).
10. Kang, H. M. et al. Sox9-positive progenitor cells play a key role in renal tubuleepithelial regeneration in mice. Cell Rep. 14, 861–871 (2016).
11. Traykova-Brauch, M. et al. An efficient and versatile system for acute andchronic modulation of renal tubular function in transgenic mice. Nat. Med.14, 979–984 (2008).
12. Snippert, H. J. et al. Intestinal crypt homeostasis results from neutralcompetition between symmetrically dividing Lgr5 stem cells. Cell 143,134–144 (2010).
13. Lasagni, L. et al. Podocyte regeneration driven by renal progenitors determinesglomerular disease remission and can be pharmacologically enhanced. StemCell Rep. 5, 248–263 (2015).
14. Burger, A., Koesters, R., Schäfer, B. W. & Niggli, F. K. Generation of a novelrtTA transgenic mouse to induce time-controlled, tissue-specific alterations inPax2-expressing cells. Genesis 49, 797–802 (2011).
15. Winyard, P. J., Risdon, R. A., Sams, V. R., Dressler, G. R. & Woolf, A. S. ThePAX2 tanscription factor is expressed in cystic and hyperproliferativedysplastic epithelia in human kidney malformations. J. Clin. Invest. 98,451–459 (1996).
16. Cianciolo Cosentino, C. et al. Histone deacetylase inhibitor enhances recoveryafter AKI. J. Am. Soc. Nephrol. 24, 943–953 (2013).
17. Levine, M. H. et al. Class-specific histone/protein deacetylase inhibitionprotects against renal ischemia reperfusion injury and fibrosis formation. Am.J. Transplant. 15, 965–973 (2015).
NATURE COMMUNICATIONS | DOI: 10.1038/s41467-018-03753-4 ARTICLE
NATURE COMMUNICATIONS | (2018) 9:1344 |DOI: 10.1038/s41467-018-03753-4 |www.nature.com/naturecommunications 17

18. Novitskaya, T. et al. A PTBA class small molecule enhances recovery andreduces postinjury fibrosis after aristolochic acid-induced kidney injury. Am. J.Physiol. Ren. Physiol. 306, F496–F504 (2014).
19. de Groh, E. D. et al. Inhibition of histone deacetylase expands the renalprogenitor cell population. J. Am. Soc. Nephrol. 21, 794–802 (2010).
20. Maga, G. & Hubscher, U. Proliferating cell nuclear antigen (PCNA): a dancerwith many partners. J. Cell Sci. 11, 3051–3060 (2003).
21. Sakaue-Sawano, A. et al. Visualizing spatiotemporal dynamics of multicellularcell-cycle progression. Cell 132, 487–498 (2008).
22. Roccio, M., Schmitter, D., Knobloch, M., Okawa, Y. & Sage, D. Predictingstem cell fate changes by differential cell-cycle progression patterns.Development 140, 459–470 (2013).
23. Kaminski, M. M. et al. Direct reprogramming of fibroblasts into renal tubularepithelial cells by defined transcription factors. Nat. Cell Biol. 18, 1269–1280(2016).
24. Naiman, N. et al. Repression of interstitial identity in nephron progenitor cellsby Pax2 establishes the nephron-interstitium boundary during kidneydevelopment. Dev. Cell 41, 349–365 (2017).
25. Yang, L., Besschetnova, T. Y., Brooks, C. R., Shah, J. V. & Bonventre, J. V.Epithelial cell-cycle arrest in G2/M mediates kidney fibrosis after injury. Nat.Med. 16, 535–543 (2010).
26. Lovisa, S. et al. Epithelial-to-mesenchymal transition induces cell-cycle arrestand parenchymal damage in renal fibrosis. Nat. Med. 21, 998–1009 (2015).
27. Wang, F. & Higgins, J. M. Histone modifications and mitosis: countermarks,landmarks, and bookmarks. Trends Cell Biol. 23, 175–184 (2013).
28. Edgar, B. A., Zielke, N. & Gutierrez, C. Endocycles: a recurrent evolutionaryinnovation for post-mitotic cell growth. Nat. Rev. Mol. Cell Biol. 15, 197–210(2014).
29. Mort, R. L. et al. Fucci2a: a bicistronic cell cycle reporter that allows Cremediated tissue specific expression in mice. Cell Cycle 13, 2681–2696 (2014).
30. Wang, Z. et al. Migratory localization of cyclin D2-Cdk4 complex suggests aspatial regulation of the G1-S transition. Cell Struct. Funct. 33, 171–183(2008).
31. Cuppage, F. E. & Tate, A. Repair of the nephron following injury withmercuric chloride. Am. J. Pathol. 51, 405–429 (1967).
32. Basile, D. P., Anderson, M. D. & Sutton, T. A. Pathophysiology of acutekidney injury. Compr. Physiol. 2, 1303–1353 (2012).
33. Kumar, S. et al. Sox9 activation highlights a cellular pathway of renal repair inthe acutely injured mammalian kidney. Cell Rep. 12, 1325–1338 (2015).
34. Kang, H. M. et al. Sox9-positive progenitor cells play a key role in renal tubuleepithelial regeneration in mice. Cell Rep. 14, 861–871 (2016).
35. Wang, B., Zhao, L., Fish, M., Logan, C. Y. & Nusse, R. Self-renewing diploidAxin2(+) cells fuel homeostatic renewal of the liver. Nature 524, 180–185(2015).
36. Kusaba, T., Lalli, M., Kramann, R., Kobayashi, A. & Humphreys, B. D.Differentiated kidney epithelial cells repair injured proximal tubule. Proc. NatlAcad. Sci. USA 111, 1527–1532 (2014).
37. Berger, K. et al. Origin of regenerating tubular cells after acute kidney injury.Proc. Natl Acad. Sci. USA 111, 1533–1538 (2014).
38. Romagnani, P., Rinkevich, Y. & Dekel, B. The use of lineage tracing to studykidney injury and regeneration. Nat. Rev. Nephrol. 11, 420–431 (2015).
39. Ganem, N. J. et al. Cytokinesis failure triggers hippo tumor suppressorpathway activation. Cell 158, 833–848 (2014).
40. Tamori, Y. & Deng, W. M. Tissue repair through cell competition andcompensatory cellular hypertrophy in postmitotic epithelia. Dev. Cell 25,350–363 (2013).
41. Kriz, W. & LeHir, M. Pathways to nephron loss starting from glomerulardiseases-insights from animal models. Kidney Int. 67, 404–419 (2005).
42. Mulay, S. R. et al. Oxalate-induced chronic kidney disease with its uremic andcardiovascular complications in C57BL/6 mice. Am. J. Physiol. Renal. Physiol.310, F785-F795 (2016).
43. Friedemann, J. et al. Improved kinetic model for the transcutaneousmeasurement of glomerular filtration rate in experimental animals. Kidney Int.90, 1377–1385 (2016).
44. Gu, L., Cong, J., Zhang, J., Tian, Y. Y. & Zhai, X. Y. A microwave antigenretrieval method using two heating steps for enhanced immunostaining onaldehyde-fixed paraffin-embedded tissue sections. Histochem. Cell Biol. 145,675–680 (2016).
45. Lazzeri, E. et al. Human urine-derived renal progenitors for personalizedmodeling of genetic kidney disorders. J. Am. Soc. Nephrol. 26, 1961–1974(2015).
46. KDIGO AKI Work Group. KDIGO clinical practice guideline for acute kidneyinjury. Kidney Int. Suppl. 2, 1–138 (2012).
AcknowledgementsThis project has received funding from the European Research Council (ERC) under the
European Union’s Horizon 2020 research and innovation programme (grant agreement
N° 648274) to P.R.. H.-J.A. is supported by the Deutsche Forschungsgemeinschaft
(AN372/11-2, 17-1, 23-1, and 24-1) and the BMBF (REPLACE-AKI 031L0071).
Author contributionsP.R., with the help of E.L., as well as M.L.A. conceived of the study. E.L., M.L.A., F.B. and
C.C. designed and performed immunofluorescence and confocal microscopy. E.L., A.P.,
L.M., C.C., M.E.M., L.D.C. and F.A. designed and performed flow cytometry and cell
cycle analysis. A.P., C.C., G.A., E.R., D.L., S.N. and M.E.M designed and performed
experiments in the mouse systems. B.M., R.R.G. and A.S. designed and performed
in vitro experiments. J.A.M. and H.-J.A. performed GFR analysis. A.B. and B.S. provided
the PAX2.rtTA mice. L.L., M.L.A., E.L. and P.R. analyzed the data. L.L., M.L.A., E.L. and
H.-J.A. critically revised the manuscript. P.R. wrote the paper with input from all authors.
Additional informationSupplementary Information accompanies this paper at https://doi.org/10.1038/s41467-
018-03753-4.
Competing interests: The authors declare no competing interests.
Reprints and permission information is available online at http://npg.nature.com/
reprintsandpermissions/
Publisher's note: Springer Nature remains neutral with regard to jurisdictional claims in
published maps and institutional affiliations.
Open Access This article is licensed under a Creative Commons
Attribution 4.0 International License, which permits use, sharing,
adaptation, distribution and reproduction in any medium or format, as long as you give
appropriate credit to the original author(s) and the source, provide a link to the Creative
Commons license, and indicate if changes were made. The images or other third party
material in this article are included in the article’s Creative Commons license, unless
indicated otherwise in a credit line to the material. If material is not included in the
article’s Creative Commons license and your intended use is not permitted by statutory
regulation or exceeds the permitted use, you will need to obtain permission directly from
the copyright holder. To view a copy of this license, visit http://creativecommons.org/
licenses/by/4.0/.
© The Author(s) 2018
ARTICLE NATURE COMMUNICATIONS | DOI: 10.1038/s41467-018-03753-4
18 NATURE COMMUNICATIONS | (2018) 9:1344 |DOI: 10.1038/s41467-018-03753-4 |www.nature.com/naturecommunications