ending - children's defense fund shows solutions to ending child poverty in our nation already...
TRANSCRIPT

a n CHILDREN’S DEFENSE FUND
ENDINGCH I LD POVERTY NOW

CDF MISSION STATEMENTThe Children’s Defense Fund Leave No Child Behind® mission is to ensure every child a Healthy
Start, a Head Start, a Fair Start, a Safe Start and a Moral Start in life and successful passage to
adulthood with the help of caring families and communities.
CDF provides a strong, effective and independent voice for all the children of America who
cannot vote, lobby or speak for themselves. We pay particular attention to the needs of poor
children, children of color and those with disabilities. CDF educates the nation about the needs
of children and encourages preventive investments before they get sick, drop out of school, get
into trouble or suffer family breakdown.
CDF began in 1973 and is a private, nonprofit organization supported by individual donations,
foundation, corporate and government grants.
© 2015 Children’s Defense Fund. All rights reserved.
Cover photo © Dean Alexander Photography
Inside photos © Dean Alexander Photography, Julia Cass, Steve Liss and Alison Wright Photography
ACKNOWLEDGEMENTSCDF gratefully acknowledges the generous support of the Northwest Area Foundation, which
underwrote a substantial part of this project. We also thank the Technical Advisory Committee
members Helen Blank of the National Women’s Law Center, Elizabeth Lower-Basch and Hannah
Mathews of the Center for Law and Social Policy, David Riemer of the Community Advocates
Public Policy Institute, Barbara Sard and Arloc Sherman of the Center on Budget and Policy
Priorities, and Ellen Teller of the Food Research and Action Center, for providing crucial technical
expertise and feedback.
This report draws from the results of an analysis conducted by the Urban Institute under
contract for CDF. A full technical report of the analysis is available on CDF’s website. CDF
thanks the Urban Institute staff who worked on this project, Linda Giannarelli, Kye Lippold,
Sarah Minton, Laura Wheaton and Sheila Zedlewski, for their thorough thoughtful approach to
the project.

E N D I N G C H I L D P O V E R T Y N O W 1
FOREWORD 3
OVERVIEW 7
CHAPTER 1: POVERTY HURTS CHILDREN AND OUR NATION’S FUTURE 11
CHAPTER 2: HOW TO REDUCE CHILD POVERTY RIGHT NOW 17
CHAPTER 3: COMBINED IMPACTS AND COSTS 29
TRADEOFFS: PAYING TO END CHILD POVERTY 31
CHAPTER 4: CONCLUSION AND RECOMMENDATIONS 37
APPENDICES 40
TABLE OF CONTENTS

E N D I N G C H I L D P O V E R T Y N O W 3
A Call to End Child Poverty Now
America is going to hell if we don’t use her vast resources to end poverty and make it possible for all of God’schildren to have the basic necessities of life. — Martin Luther King Jr.
They have become great and rich they have grown fat and sleek. . . . they judge not with justice the cause of their fatherless . . .and they do not defend the rights of the needy. — Jeremiah 5:27–28
Once to every man and nation comes the moment to decide,In the strife of Truth with Falsehood for the good or evil side;Some great Cause, God’s New Messiah, offering each the bloom or blight,Parts the goats upon the left hand, and the sheep upon the right,And the choice goes by forever ’twixt that darkness and that light. — James Russell Lowell
t is a national moral disgrace that there are 14.7 million poor children and 6.5 million extremely poor childrenin the United States of America — the world’s largest economy. It is also unnecessary, costly and the greatestthreat to our future national, economic and military security.
The 14.7 million poor children in our nation exceeds the populations of 12 U.S. states combined: Alaska, Hawaii,Idaho, Maine, Montana, New Hampshire, North Dakota, Rhode Island, South Dakota, Vermont, West Virginia, andWyoming and is greater than the combined populations of the countries of Sweden and Costa Rica. Our nearly 6.5 million extremely poor children (living below half the poverty line) exceeds the combined populations ofDelaware, Montana, New Hampshire, Rhode Island, South Dakota, Vermont and Wyoming and is greater than thepopulations of Denmark or Finland.
The younger children are the poorer they are during their years of greatest brain development. Every otherAmerican baby is non-White and 1 in 2 Black babies is poor, 150 years after slavery was legally abolished.
America’s poor children did not ask to be born; did not choose their parents, country, state, neighborhood, race,color, or faith. In fact if they had been born in 33 other industrialized countries they would be less likely to bepoor. Among these 35 countries, America ranks 34th in relative child poverty — ahead only of Romania whoseeconomy is 99 percent smaller than ours.
The United Kingdom, which, if it were an American state, would rank just above Mississippi in per capita GDPaccording to the Washington Post, committed to and succeeded in cutting its child poverty rate by half in 10years. It is about values and political will. Sadly, politics too often trumps good policy and moral decency andresponsibility to the next generation and the nation’s future. It is way past time for a critical mass of Americans toconfront the hypocrisy of America’s pretension to be a fair playing field while almost 15 million children languishin poverty.
This report calls for an end to child poverty in the richest nation on earth with a 60 percent reduction immediately.It shows solutions to ending child poverty in our nation already exist. For the first time this report shows how, byexpanding investments in existing policies and programs that work, we can shrink overall child poverty 60 percent,Black child poverty 72 percent, and improve economic circumstances for 97 percent of poor children at a cost of$77.2 billion a year. These policies could be pursued immediately, improving the lives and futures of millions ofchildren and eventually saving taxpayers hundreds of billions of dollars annually.
FOREWORD
I
Poverty Report 2015_FINAL_Layout 1 2/19/15 5:25 PM Page 3

C H I L D R E N ’ S D E F E N S E F U N D4
Child poverty is too expensive to continue. Every year the lost productivity and extra health and crime costs for adultswho grew up poor add up to $500 billion — six times more than the $77 billion investment we propose to reducechild poverty by 60 percent. MIT Nobel Laureate economist and 2014 Presidential Medal of Freedom recipient Dr. Robert Solow in his foreword to a 1994 CDF report Wasting America’s Future presciently wrote: “For many yearsAmericans have allowed child poverty levels to remain astonishingly high … far higher than one would think a richand ethical society would tolerate. The justification, when one is offered at all, has often been that action is expensive:‘We have more will than wallet.’ I suspect that in fact our wallets exceed our will, but in any event this concern forthe drain on our resources completely misses the other side of the equation: Inaction has its costs too … As aneconomist I believe that good things are worth paying for; and that even if curing children’s poverty were expensive,it would be hard to think of a better use in the world for money. If society cares about children, it should be willingto spend money on them.”
Not only does child poverty cost far more than eliminating it would, we have so many better choices that reflectmore just values as well as economic savings. We believe that food, shelter, quality early childhood investments toget every child ready for school and an equitable education for all children should take precedence over massivewelfare for the rich and blatantly excessive spending for military weapons that do not work. We cannot let ourleaders spend $400 billion, without offsets, to make permanent tax breaks to wealthy corporations and others andthen say we cannot afford to ensure every child is housed and fed.
Here are just a few ways we could fund the $77 billion — 2 percent of our national budget — to make a hugedown payment on ending preventable, costly and immoral child poverty in our wealthy nation:
• Closing tax loopholes that let U.S. corporations avoid $90 billion in federal income taxes each year by shifting profits to subsidiaries in tax havens.
or
• Eliminating tax breaks for the wealthy by taxing capital gains and dividends at the same rates as wages,saving more than $84 billion a year.
or
• Closing 23 tax loopholes in former House Ways and Means Chairman Dave Camp’s Tax Reform Act of2014 which would free up an average of $79.3 billion a year.
or
• Decreasing 14 percent of the nation’s FY2015 $578 billion military budget. The U.S. has less than 5 percent of the world’s population but 37 percent of the world’s military expenditures.
or
• Scrapping the F-35 fighter jet program which is several years behind schedule and 68 percent over budgetand still not producing fully functional planes. For the $1.5 trillion projected costs of this program, thenation could reduce child poverty by 60 percent for 19 years.
If we love America and love our children we must all stand against the excessive greed that tramples millions of ourchildren entrusted to our care. America’s Declaration of Independence says, “We hold these truths to be self-evident,that all men are created equal, and are endowed by their creator with certain inalienable rights.” After more thantwo centuries, it is time to make those truths evident in the lives of all poor children and to close our intolerablenational hypocrisy gap and show the world whether democratic capitalism is an oxymoron or can work. A nationthat does not stand for its children does not stand for anything and will not stand tall in the 21st century world or before God.
Marian Wright Edelman
Poverty Report 2015_FINAL_Layout 1 2/19/15 5:25 PM Page 4

E N D I N G C H I L D P O V E R T Y N O W 5
Dr. Martin Luther King Jr. visiting poor families in Greenwood, Mississippi in July 1964. (Credit: © AP Photo/Jim Bourdier)
A few months before declaring for the Presidency, Robert Kennedy pauses to talk with a migrant farm worker’s child on thebanks of a dry river in California’s Central Valley. (Credit: © 1968 George Ballis/Take Stock)

C H I L D R E N ’ S D E F E N S E F U N D6
HOW TO REDUCE CHILD POVERTY BY 60 PERCENT
606.6million
%
EITCEITC
10.1010.10Raise minimum wage
Expand child caresubsidies
Make Child and Dependent Care TaxCredit refundable
Pass throughand disregardchild support
CHILD TAXCHILD TAXC R E D I TC R E D I T
$$
Increase EarnedIncome Tax Credit
Expand housing subsidies
Increase SNAP benefits
Make ChildTax Credit fullyrefundable
Create subsidized jobs

E N D I N G C H I L D P O V E R T Y N O W 7
For the first time, this report shows that by investing an additional 2 percent of the federal budget into existingprograms and policies that increase employment, make work pay, and ensure children’s basic needs aremet, the nation could reduce child poverty by 60 percent and lift 6.6 million children out of poverty.
The United States has the second highest child poverty rate among 35 industrialized countries despite having thelargest economy in the world. A child in the United States has a 1 in 5 chance of being poor and the younger sheis the poorer she is likely to be. A child of color, who will be in the majority of U.S. children in 2020, is more thantwice as likely to be poor as a White child. This is unacceptable and unnecessary. Growing up poor has lifelongnegative consequences, decreasing the likelihood of graduating from high school and increasing the likelihood ofbecoming a poor adult, suffering from poor health, and becoming involved in the criminal justice system. Theseimpacts cost the nation at least half a trillion dollars a year in lost productivity and increased health and crimecosts. Letting a fifth of our children grow up poor prevents them from having equal opportunities to succeed inlife and robs the nation of their future contributions.
The U.S. can end child poverty by investing more in programs and policies that work. Substantial progress inreducing child poverty has been made over the past 50 years, despite worsening income inequality and increasedunemployment and low-wage work. Child poverty dropped over a third from 1967 to 2012 when income from in-kindbenefits like nutrition and housing assistance and tax credits are counted. Without these federal safety net programschild poverty would have been 68 percent higher in 2013, and 8.2 million additional children would have beenpoor. Despite this progress, 12.2 million children were poor in 2013 even after taking into account federal safetynet programs because good jobs are still too scarce and safety net programs are stretched far too thin.
Recognizing the harms child poverty causes and building on progress already made in reducing child poverty, theChildren’s Defense Fund contracted with the Urban Institute to estimate the impact on child poverty if the nationinvested more in proven poverty reduction strategies. Focusing on policies and programs that improve families’current economic well- being, CDF targeted changes in nine existing programs and policies that help make workpay, increase employment, and meet children’s basic needs.
Using the Supplemental Poverty Measure (SPM) that best accounts for the impact of government benefits and taxpolicy, and 2010 data, the most recent available when research began, the Urban Institute found that thesechanges would:
• Reduce child poverty 60 percent — lifting 6.6 million children, 0.5 million of them extremely poor,above the poverty line.
• Improve the economic circumstances of another 4 million poor children, although not enough to liftthem above the poverty line.
• Reduce child poverty among children under 3 by 64 percent.
• Reduce poverty among Black children, who suffer the highest child poverty rates, 72 percent.
• Reduce poverty among single-parent households 64 percent.
• Reduce poverty among children in non -metropolitan areas 68 percent.
In all, 97 percent of poor children would experience improvements in their family’s economic circumstances.
OVERVIEW

C H I L D R E N ’ S D E F E N S E F U N D8
Reducing child poverty 60 percent with these improvements was estimated to cost $77.2 billion in 2010, only 2 percent of U.S. government spending that year, 0.5 percent of the 2010 U.S. gross domestic product (GDP),and 15 percent of the estimated $500 billion the nation spends every year for the costs of children growing uppoor. By reducing child poverty now the nation would reduce these children’s chances of becoming poor adultsand reduce child poverty in the next generation.
Our nation can easily afford it. There are multiple ways to increase investments in children without increasing thedeficit, from reducing military spending — the U.S. accounts for less than 5 percent of the world’s population but37 percent of the world’s military spending — to closing tax breaks and loopholes that cost the nation hundredsof billions while fueling the nation’s alarming income and wealth gaps (see tradeoff details on p. 31).
The Urban Institute’s analysis for CDF is clear: by investing more in existing programs the U.S. could substantiallydecrease child poverty immediately. Shrinking child poverty by 60 percent and improving economic circumstancesfor 97 percent of poor children would improve the life chances of millions of children, bring child poverty in theU.S. in line with rates in other high-income countries, and help prevent poverty in the future. As the wealthy andpowerful nation we are, it is way past time we commit to ensuring all children’s basic needs are met. This reportshows for the first time that solutions to child poverty in our rich nation already exist if we are willing to invest inthem. Let’s create that public will and take action for our children — they cannot wait.
Policy Improvements To Reduce Child Poverty By 60 Percent
Increasing employment and making work pay more for adults with children
• Increase the Earned Income Tax Credit for lower-income families with children.
• Increase the minimum wage from $7.25 to $10.10.
• Create subsidized jobs for unemployed and underemployed individuals ages 16-64 in familieswith children.
• Make child care subsidies available to all eligible families below 150 percent of poverty.
• Make the Child and Dependent Care Tax Credit refundable with a higher reimbursement rate.
Ensuring children’s basic needs are met
• Base SNAP benefits on USDA’s Low-Cost Food Plan for families with children.
• Make the Child Tax Credit fully refundable.
• Make housing vouchers available to all households with children below 150 percent of poverty forwhom fair market rent exceeds 50 percent of their income.
• Require child support to be fully passed through to TANF families, fully disregarded for TANF benefits,and partially disregarded for SNAP benefits.

E N D I N G C H I L D P O V E R T Y N O W 9
Baby Tristan
One-year-old Tristan lived in a Detroit homeless shelter with hismother Ashante Dickens. Since childhood, his 21-year-old
mother has had a clear goal: “I want to be an elementary schoolteacher. That’s my passion.” She got good grades in school, and did well enough in high school to be allowed to take a few earlyenrollment classes at a nearby college in early childhood education.She was on the road to realizing her dream when a family problemchanged her course. After Tristan was born, they moved to a transitional living shelter for mothers and children. Ashante beganreceiving cash assistance and benefits from the SupplementalNutrition Assistance Program (SNAP). As soon as Tristan was a fewmonths old she went back to work. “I don’t think anybody wants tobe on assistance. My motivation is to work harder so I don’t need it.”Temporary Assistance for Needy Families (TANF) gave her a voucherfor day care; otherwise she would have ended up making very little. Programs like TANF, SNAP, andothers that provide a stable place to live are lifelines for Tristan and Ashante and millions of others.
Pennies and Dimes
The Nailors are better off than many.They live in a house with a yard in a
small town in Middle America — the sort ofplace that might have been featured in aNorman Rockwell painting. Beneath theveneer of the middle class image, the family struggles. In 2011, Amanda, 4, and Emily,3, wore hand-me-downs and played withsecondhand toys. Their father, John Nailor,owned a computer repair business in Evart,Michigan but made less than $22,314 ayear, the poverty level for a family of four in2011. The family was on a budget so tightthat by the end of the month they weredown to dimes and pennies. They didn’thave cable television. They never went out.“If it weren’t for food stamps and theincome tax credit, I don’t know where we’dbe,” he said. “We would be lost.”


E N D I N G C H I L D P O V E R T Y N O W 1111
Child poverty destroys dreams and opportunities.
Nearly 15 million children in America lived below the official poverty level — $23,834 for a family of four — in2013, based only on cash income. Over 40 percent of these children lived in extreme poverty, at less than halfthe poverty level. The youngest children were most likely to be poor, with more than 1 in 5 children under age 5living in poverty during the years of rapid braindevelopment.
America’s child poverty rate is one of thehighest among industrialized nations.
The United States, with the world’s largest economy,has the shameful distinction of having the secondhighest relative child poverty rate among 35industrialized nations.1 With a rate more than sixtimes higher than in Finland, the country withthe lowest child poverty rate, the U.S. beat outonly Romania, while lagging behind the rest ofEurope, Australia, Canada, Japan, and NewZealand. Many countries with fewer resourceshave lower poverty rates, including the U.K., New Zealand, the Czech Republic and Hungary,a clear indication the U.S. could do much moreto reduce child poverty.
Child poverty robs children of their future.Reducing child poverty would yield incalculablebenefits for millions of children and the countryas a whole.
Child poverty creates gaps in cognitive skillsin babies.
Poor parents have fewer financial resources andoften experience more stress, and as a resulttheir young children are less likely to be read to,spend less time talking to adults, and hear many fewer words each week than children from more affluent families.2
One study found that by age 4, high-income children had heard 30 million more words than poor children.3 Poorpreschoolers are also less likely to be able to recognize letters, count to 20, or write their first names.4 Income-related gaps in cognitive skills can be observed in babies as early as 9 months old and often widen with age.5
These disparities create an early disadvantage that is often hard to overcome.
CHAPTER 1
FinlandNetherlands
DenmarkCyprusIcelandNorway
SloveniaSwedenAustriaIreland
GermanySwitzerland
MaltaFrance
Czech RepublicHungary
United KingdomBelgiumAustralia
New ZealandLuxembourg
EstoniaSlovakia
PolandCanada
JapanPortugal
GreeceItaly
LithuaniaSpainLatvia
BulgariaUnited States
Romania
3.65.96.36.56.56.6
7.27.3
7.88.5
9.49.49.59.59.710.010.010.3
10.911.711.811.9
13.213.9
14.014.915.215.3
17.017.9
19.720.5
21.623.1
23.6
0 5 10 15 20 25
Percent of Children Aged 0-17 Living in Households with Incomes Below 50% of National Median Income
U.S. Ranks Second to Last in Child Poverty
POVERTY HURTS CHILDREN AND OUR NATION’S FUTURE
Source: Unicef, 2013

C H I L D R E N ’ S D E F E N S E F U N D1212
Childhood toxic stress can negatively impact brain functioning for life.
When children experience strong, frequent, or prolonged adversity — such as physical or emotional abuse, chronichunger and neglect, caregiver substance abuse or mental illness, exposure to violence, or the accumulated burdensof family poverty — the stressful environment can become toxic. If this so-called “toxic stress” continues and isnot mitigated by adequate adult support it can literally rewire children’s brains, disrupting their social competenceand ability to succeed in school and in life and increasing the likelihood of low educational achievement, unstableemployment, adult poverty, and involvement in the criminal justice system.6
Child hunger jeopardizes children’s health and ability to learn.
Poor children are more likely to experience hunger. In 2013, more than 45 percent of poor children lived inhomes where not everyone had enough food.7 Food insecurity is associated with lower reading and math scores,greater physical and mental health problems, higher incidence of emotional and behavioral problems, and agreater chance of obesity.8
Poor children experience worse health outcomes.
Poor children are less likely to have access to affordable quality health coverage. Nearly 1 in 6 poor children lackshealth insurance compared to about 1 in 12 non-poor children.9 Children in poor families are five times as likelyto be in fair or poor health as children in non-poor families.10 They have more severe health problems than higher-income children, and fare worse than higher-income children with the same problems. For example, a poor childwith asthma is more likely to be reported in poor health, spend more days in bed, and have more hospital episodesthan a high-income child with asthma.
No Food, No Water, No Light
“Iremember not eating sometimes. I mean, the only time thatwe actually had food is when we went to my grandmother’s,”
Carmen Griffith says bluntly. Her parents divorced when she was
five, and her school teacher mother descended into alcoholism
and depression. After one drunken episode when Carmen’s mother
was arrested for breaking and entering, she lost her teaching job.
Although she got sober and worked hard to turn her life around,
the tough economic times got worse. Carmen and her younger
sister had to go to grandma’s house to take baths, because there
was no running water at their house. Sometimes there was no
electricity. The family has struggled to eat and keep a roof overhead.
Carmen never gave up and knows education will open doors
for her future, and is pursuing her dream of becoming a child
psychiatrist so she can help children struggling to overcome
severe challenges, just as she has had to do.

E N D I N G C H I L D P O V E R T Y N O W 1313
Traumatic experiences in childhood — often called adverse childhood experiences — also impact health throughoutlife. The more adverse experiences in childhood, the greater the likelihood of health problems in adulthoodincluding heart disease, diabetes, substance abuse, and depression.11
Poor children are less likely to graduate from high school.
Poor children are less likely to enter school ready to learn and to graduate from high school than their non-poorpeers. One study found children who were poor for half their childhood were nearly 90 percent more likely to entertheir 20s without completing high school than those who had never been poor.12 And the younger the childrenwere when they experienced poverty, the worse the impacts. Poor infants and toddlers — from birth to age 2 —were nearly 30 percent less likely to complete high school than children who first experienced poverty later inchildhood.
Child poverty fuels the intergenerational cycle of poverty.
In one study, people who experienced poverty at any point during childhood were more than three times as likelyto be poor at age 30 as those who were never poor as children.13 The longer a child was poor, the greater the riskof adult poverty.
Child poverty has substantial economic costs.
According to one study, the lost productivity and extra health andcrime costs stemming from child poverty add up to roughly half atrillion dollars a year, or 3.8 percent of GDP.14 Another study foundeliminating child poverty between the prenatal years and age 5would increase lifetime earnings between $53,000 and $100,000per child, for a total lifetime benefit of $20 to $36 billion for allbabies born in a given year.15 And we can never measure the countlessinnovations and discoveries that did not occur because children’spotentials were stunted by poverty.
It doesn’t have to be this way. Child poverty can be reduced.
Child poverty is not immutable. Poverty rates change with the economy and changes in government policies. Child poverty, based just on earnings and cash benefits, declined 49 percent during the economic expansion ofthe 1960s and 29 percent during the economic boom of the late 1990s, but grew 59 percent from 1969 to1983 as the economy faltered.16
The U.S. has made substantial progress in reducing poverty over the past 50 years despite worsening inequalityand increased unemployment. Child poverty dropped over a third between 1967 and 2012 when income from taxcredits and in-kind benefits like nutrition assistance are counted.17 This is all the more remarkable given thatunemployment and income inequality more than doubled during this period.
The United Kingdom provides a modern example of how a concerted effort to reduce child poverty can succeed,even during economic recession.18 In 1999, Prime Minister Tony Blair’s government committed to ending childpoverty (see text box on p.14). Through a multi-pronged approach, the British government under Blair and hissuccessor Gordon Brown managed to reduce child poverty by more than half over 10 years, and reductions persistedduring the Great Recession. Many families with children benefited, but poorer children benefited most: Averageincomes for families with children increased $3,200, and incomes for families in the bottom fifth of the incomerange increased $7,200.
Costs of Child Poverty
Lost Productivity $170 billion
Increased Crime $170 billion
Worse Health $160 billion
$500 billion

C H I L D R E N ’ S D E F E N S E F U N D14
1 IN 5 CHILDREN LIVES IN POVERTY
14
Ending child poverty permanently first requires boosting resources of poor families with children.
A recent Washington Post article reported that if the U.K. suddenly decided to join the U.S. as a state, it wouldbe the second-poorest state, as measured by GDP per capita, behind Alabama and just ahead of Mississippi.19 Ifthe U.K. can reduce child poverty, so can the U.S. In fact, given the U.S. has the world’s largest economy and giventhe high costs the U.S. incurs from child poverty every year, the nation cannot afford not to end child poverty.
The quickest way to reduce child poverty is to improve the economic circumstances of poor children. This wouldalleviate child suffering and is a key step toward ending childhood poverty permanently, since growing up inpoverty increases the likelihood of being poor as an adult and a parent.
Current income support and safety net programs and policies help millions of children every year. Child care assistanceand the Earned Income Tax Credit (EITC) help parents work and boost the value of work. Programs like nutritionand housing assistance help ensure children eat and have a roof over their heads when jobs for their parents arescarce or do not pay enough.
The U.K.’s Three-Pronged Approach to Ending Child Poverty
1. Increased employment through a mostly voluntary welfare-to-work program, the first national minimumwage, and tax reductions and tax credits for workers and employers.
2. Increased incomes among families with children regardless of parental employment through increasesin a universal child benefit and means-tested income supports for low-income families with childrenand through a new child tax credit.
3. Reduced the intergenerational transmission of poverty through investments in early childhood and primary and secondary education including improvements to maternal and paternal leave policies, the introduction of universal preschool for 3- and 4-year-olds, and expansions of child care assistancefor working families.

E N D I N G C H I L D P O V E R T Y N O W 1515
Homeless in High School
In the summer of 2012, Craig Phillips was looking forward to his junior year at Boys and Girls High School in Brooklyn, New York.
But after Craig tried to protect his mother from his father in a violent
domestic confrontation, his father kicked them out of the house. Craig
said, “Ever since that point, life has just never been the same.” Craig,
his mother and older brother ended up in a homeless shelter for his
junior and senior years of high school. His mother continued to work
as a habilitation aide for Cerebral Palsy of New York. His brother and
Craig worked too. But their combined salaries were not sufficient to
afford an apartment in the city of New York. Finally, Craig and his
family were able to move into their own home, a state-subsidized
apartment, in the spring of 2014. Craig beat the odds of homeless
high school students by graduating from high school and entering his
freshman year of college.
Safety net investments provide long-term benefits.
Not only do these programs help ensure children are fed and housed, federal safety net programs like the EITCand the Supplemental Nutrition Assistance Program (SNAP) are investments that improve children’s long termoutcomes. Children from families receiving income boosts from the EITC or similar programs have been found to havebetter birth outcomes, higher test scores, higher graduation rates and higher college attendance.20 Such outcomestranslate into increased economic security later in life. One study found children in low-income families thatreceived an additional $3,000 dollars a year between the child’s prenatal year and fifth birthday earned on average17 percent more as adults than similar children whose families did not receive the added income.21 Studies ofthe federal nutrition programs found needy children who received food assistance before age 5 were in betterhealth as adults and were more likely to complete more schooling, earn more money, and not rely on safety netprograms as adults.22
The nation could reduce child poverty now.
Despite evidence of both short- and long-term benefits, millions of poor children do not receive the assistancethey need because of limited eligibility and benefits and lack of funding.
The Children’s Defense Fund wanted to answer a basic question: “How close could the nation get to ending povertyfor today’s children by simply investing more in approaches that work?” To answer this question, CDF contractedwith the Urban Institute, a leading nonpartisan research organization, to estimate the impact on child poverty ofchanges to nine existing federal programs and policies. The Urban Institute found the nation could reduce childpoverty by a striking 60 percent by implementing these nine policy changes, demonstrating that the nation currentlyhas the tools to significantly reduce child poverty. There can no longer be any excuse for our country not living upto its creed that all children should have the same opportunity to succeed.


E N D I N G C H I L D P O V E R T Y N O W 1717
To identify policy improvements that could reduce child poverty and alleviate its harmful impacts immediatelythe Children’s Defense Fund started from two premises. The first is that the best anti-poverty strategy is toensure parents and caregivers who are able to work can find jobs that pay enough to support a family. CDF
sought policy improvements that would increase employment and make work pay for adults with children. TheEarned Income Tax Credit (EITC), child care subsidies, and the Child and Dependent Care Tax Credit have allbeen shown to help increase employment. Increasing the reach and value of these benefits could help reducechild poverty. Similarly, increasing the availability of publicly funded jobs could reduce child poverty by providingjobs for parents who are hard to employ. However, a job does not necessarily guarantee a livable income; nearly 1 in 3 poor children lives in a family with an adult who works full-time year-round.1 No family with a parent workingfull-time year-round should live in poverty. Increasing the value of the minimum wage would reduce child povertyby increasing income for families with minimum wage workers.
The second premise is that all of society benefits if children’s basic needs are met when the economy contracts,disaster hits or parents lose their jobs. Children’s chances of reaching successful, productive adulthood are stronglyinfluenced by their experiences growing up. If children go hungry, suffer homelessness or experience prolongedstress from economic hardships, their opportunities in life will be diminished. CDF identified policy improvementsthat would ensure children’s basic needs are met when families fall on hard times. In 2013 our nation’s safetynet programs and refundable tax credits lifted 8.2 million children from poverty,2 but many children in need didnot benefit. Housing subsidies only reach 1 in 4 needy families with children.3 While the Supplemental NutritionAssistance Program (SNAP) reaches a large percent of poor families, millions of children are hungry because benefits are not enough to ensure adequate nutrition. The Child Tax Credit is a valuable benefit for many familieswith children, but the poorest families benefit the least. Finally, child support payments collected by states don’talways reach the children for whom they were intended. Increasing the reach and impact of these crucial programswould help reduce child poverty.
In seeking to strengthen the economic circumstances of poor children, CDF focused on improving existing policiesand programs that work, rather than creating new programs. CDF sought to assist poor children but did not limitimprovements to families below 100 percent of poverty for two reasons. First, CDF recognizes that families livinga few thousand dollars above the poverty line still struggle to meet their children’s needs. Second, many of theprograms included in the analysis phase out benefits to families above poverty gradually to avoid disincentives toincrease earnings.
After identifying policy improvements that could reduce child poverty, CDF contracted with the Urban Institute tomodel the effects of these changes on child poverty using the Supplemental Poverty Measure (SPM) and 2010Census and administrative data, the most recent available when this project began (for more information see“How the Urban Institute Assessed Impacts of Policy Improvements” on p. 26). This chapter describes the policyimprovements and the impact each would have had on child poverty in 2010 had it been in place for that year.The combined impact of implementing all the policy improvements at the same time is presented in Chapter 3.
CHAPTER 2
HOW TO REDUCE CHILD POVERTY RIGHT NOW

C H I L D R E N ’ S D E F E N S E F U N D1818
It is important to note that the Urban Institute’s analysis only assessed the changes to families’ resources in2010 if the policy changes had been in place for that one year. The analysis did not capture any of the longerterm impacts of increased economic resources on children’s educational and life outcomes and on child poverty infuture generations.
Increasing employment and making work pay for adults with children
Earned Income Tax Credit increase
Why this Policy — The Earned Income Tax Credit (EITC) is one of the nation’s most effective tools for reducingchild poverty among working families. This refundable tax credit kept 3.2 million children out of poverty in 2013.4
It is only available to those with earnings and it increases with higher earnings up to a maximum, providing anincentive to work and to work more hours. Expansion of the EITC has been shown to be the most important reason whyemployment among single mothers increased in the 1990s, more than the booming economy or welfare reform.5
Improvements — CDF asked the Urban Institute to model improving the EITC by increasing its value for the lowest-income families with children (see Appendix 1 for details). The analysis assumed a higher EITC made workingworthwhile for some single parents who previously did not work.6
Child Poverty Impact — The Urban Institute’s analysis found that these EITC improvements would reduce childpoverty nearly 9 percent and lift 1 million children above poverty. Nearly half of the anti-poverty impact wouldcome from 463,000 single parents starting to work, earning on average $11,761 more annually and receiving anEITC worth on average $4,699. The rest of the child poverty drop would come from 7.6 million families receivinga credit that was on average $990 larger.7 The anti-poverty effect of the EITC expansion may even have beenunderestimated because the Urban Institute’s model underestimated the number of families receiving the EITC by 26 percent compared to IRS data.8
Cost — The cost of these EITC improvements and associated secondary changes in other benefits and taxes in2010 would be $8.2 billion.9
Expansions of SNAP and Refundable Tax Credits Kept 1.55 Million Children Out of Poverty
During the recession, Congress, as part of the American Recovery and Reinvestment Act (ARRA),increased the value of the maximum SNAP benefit 13.6 percent, and expanded the reach of the ChildTax Credit (CTC) and the Earned Income Tax Credit (EITC) by lowering the CTC’s refundability incomelimit from over $12,000 to $3,000, reducing the EITC marriage penalty, and increasing the EITC forfamilies with three or more children.
The Urban Institute found these changes substantially decreased child poverty in 2010. Without theSNAP benefit boost, child SPM poverty would have been 7.6 percent higher, with 831,000 more childrenin poverty. Without the SNAP increase and the CTC and EITC changes, child poverty would have been14.2 percent higher, and 1.55 million additional children would have been poor. Despite the fact thatchild poverty in 2013 was 11 percent higher than before the recession, Congress terminated the SNAPbenefit increase in November 2013. Unless Congress takes action, the changes to the CTC and the EITCwill expire at the end of 2017.
E N D I N G C H I L D P O V E R T Y N O W 1919
Minimum wage increase
Why this Policy — A parent with two children working full time at the federal minimum wage of $7.25 an hourcurrently earns $4,700 below the poverty level. Nearly 70 percent of the 14.7 million poor children in America,according to the official poverty measure, live with an adult who works, and 30 percent live with an adult whoworks full-time year-round.10 The current federal minimum wage is worth 24 percent less in inflation-adjustedterms than at its peak in 1968.11 If it had grown at the same rate as productivity, the minimum wage would be$18.42 today.12 The Congressional Budget Office (CBO) estimated in February 2014 that increasing the minimumwage to $10.10 by 2016 would lift 900,000 people above the official poverty threshold.13
Improvements — CDF asked the Urban Institute to model an increase in the federal minimum wage from $7.25an hour to $10.10 for workers and an increase to 70 percent of that level ($7.07) for tipped workers, as proposedin the Harkin-Miller Fair Minimum Wage Act of 2013. The Urban Institute’s model assumed employers would alsoraise wages for non-covered workers earning just under the original minimum wage and for workers just above the newminimum wage to maintain relative wages — so-called “spillover effects.”14 The Urban Institute conservativelyassumed an increase in the minimum wage would lead to small job losses of the same magnitude assumed by theCBO.15 Since the Urban Institute used 2010 data for the analysis, the new minimum wages were deflated from2014 dollars to 2010 dollars, resulting in a wage of $9.30 for most workers and $6.51 for tipped workers.16
Child Poverty Impact — This minimum wage increase would reduce child poverty by 4 percent and move400,000 children out of poverty. Children living with a full-time year-round worker would see an 8.1 percentpoverty reduction. An estimated 11.4 million workers in families with children would see an average increase inearnings of $1,557, while 89,000 people would lose their jobs.17 The impacts of the minimum wage on povertywere limited by the fact that 82 percent of the 27.6 million affected workers (with and without children) would beabove the SPM poverty threshold and increased earnings would be partially offset by increased taxes and to alesser extent by decreased benefits.18
Cost — The minimum wage increase was projected to generate revenue rather than cost governments, becausefamilies with higher wages owed more in taxes and were eligible for fewer benefits.19 The total increase in new taxrevenue and savings from decreased benefits would equal $15.2 billion.
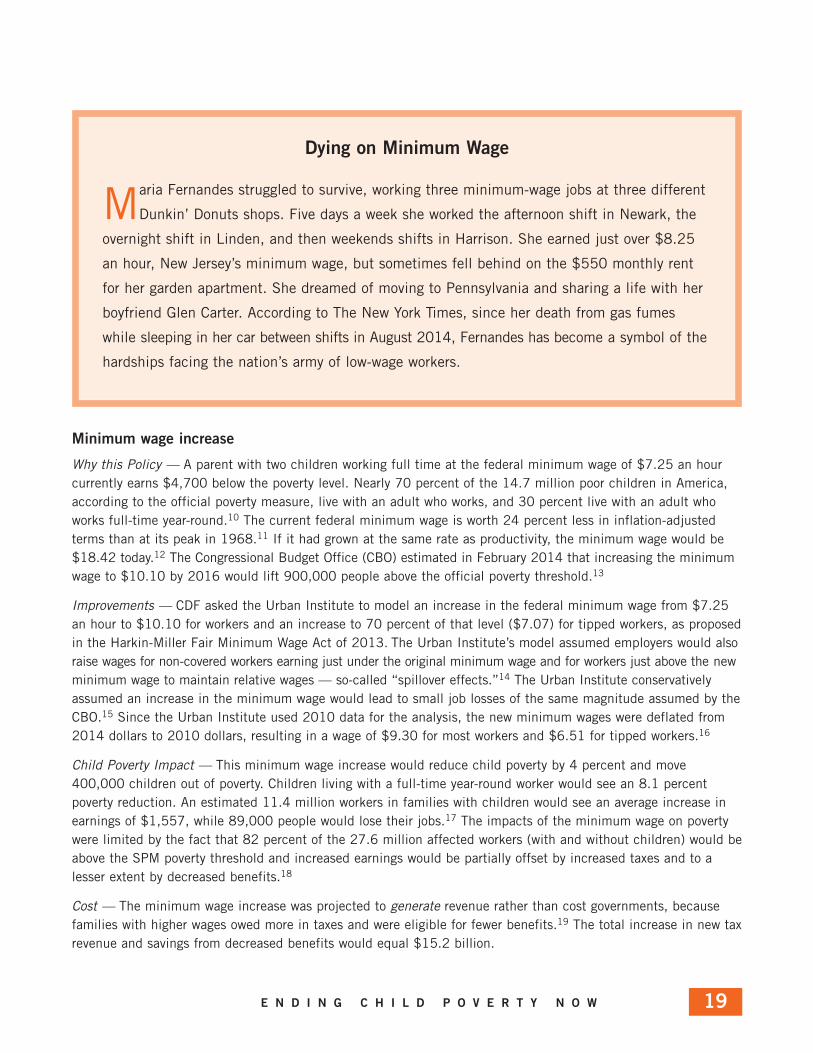
Dying on Minimum Wage
Maria Fernandes struggled to survive, working three minimum-wage jobs at three different
Dunkin’ Donuts shops. Five days a week she worked the afternoon shift in Newark, the
overnight shift in Linden, and then weekends shifts in Harrison. She earned just over $8.25
an hour, New Jersey’s minimum wage, but sometimes fell behind on the $550 monthly rent
for her garden apartment. She dreamed of moving to Pennsylvania and sharing a life with her
boyfriend Glen Carter. According to The New York Times, since her death from gas fumes
while sleeping in her car between shifts in August 2014, Fernandes has become a symbol of the
hardships facing the nation’s army of low-wage workers.

C H I L D R E N ’ S D E F E N S E F U N D2020
Subsidized jobs program
Why this Policy — Publicly funded (or subsidized) jobs are effective for providing income and building skillsamong the unemployed and underemployed.20 Subsidized jobs programs were most recently deployed during the2008-2009 Great Recession through funding from the Temporary Assistance for Needy Families Emergency Fund.These programs were shown to benefit the long-term unemployed the most and increase employment and incomeeven after participation ended.21
Improvements — CDF asked the Urban Institute to model a subsidized jobs program that would provide minimum-wagejobs to unemployed or underemployed individuals ages 16-64 in families with children for 30 weeks at a time,with a possibility of renewal after four weeks searching for unsubsidized employment.22 Since not everyoneoffered a subsidized job would take one, we assumed that at most 25 percent of those who were unemployedwould sign up.23 Take-up rates were assumed to be lower for individuals at higher income levels, working in part-timejobs, and for students, early retirees, and people with disabilities. Funds were assumed to be available to providechild care subsidies to families who became eligible because of a subsidized job.
Child Poverty Impact — This subsidized jobs program would reduce child poverty by nearly 11 percent and lift 1.2million children out of poverty. A total of 2.5 million people in families with children would work through the programand each would earn on average an additional $10,630 for the year, although some of the additional incomewould be offset by increased taxes and decreased government benefits.
One Step Forward, Two Steps Back
In Cincinnati, Ohio, Christopher Rogers, 13, sometimes used the $3 an hour he earned cutting grass and working on a candy truck
to pay the phone and electric bills when money ran short. He and his
mother, Ana Cohen, were occasional welfare recipients, with Ana
going off welfare when she finds work and then back on again when
the jobs end or the hours and pay don’t add up to a livable income.
“The way they have it now, the system is based on work but when
there isn’t any work, it doesn’t work,” Ana said.
For more than a year, she worked close to full time doing security at
a CVS store. She was paid $11 an hour. When she was laid off, she
received unemployment insurance. That lasted through March 2011.
At that point, she had no income — just food stamps and subsidized
housing — and was not able to find another job. This was when Christopher’s earnings paid some of
the bills. In 2011, Ana said that she had never “made enough money not to be on food stamps, and
I’ve had to use welfare as a fall back. There’s just not enough jobs that pay enough for me to get over
that hump.”

E N D I N G C H I L D P O V E R T Y N O W 2121
Cost — Providing 2.5 million new subsidized jobs would cost $22.9 billion after taking into account associatedchanges in benefits and taxes.
Child care subsidy expansion
Why this Policy — To work, parents need access to affordable high-qualitychild care. Center-based care for infants in 2013 cost more than in-statecollege tuition in 31 states and the District of Columbia.24 To assist low-income families with child care costs, the federal government andstates provide child care subsidies to some families with children under13 through the Child Care and Development Fund (CCDF) and related government funding streams.25 But because of limited funding, demandfor subsidies far exceeds supply. In fiscal year 2009 only 18 percent offederally eligible children benefited from child care subsidies in an average month.26
Improvements — CDF asked the Urban Institute to model expanding theCCDF child care subsidy program to provide assistance to all needy poorand near-poor families. Although eligibility varies by state, to simplify theanalysis CDF selected a uniform income limit of 150 percent of poverty.The use of 150 percent of poverty acknowledged that 100 percent ofpoverty, $23,850 for a family of four, is often far below what families and children need. Income limits in the 35 states with limits higher than 150 percent of poverty were assumed unchanged. In addition to expanding theavailability of subsidies, the analysis assumed a small fraction of adults with children would start working becauseof increased availability of subsidies.27 Not all eligible families would choose to use assistance, so only familiespaying child care expenses in 2010 were selected to begin receiving a subsidy.28
Child Poverty Impact — The child care subsidy expansion would reduce child poverty by 3 percent or 300,000 children.Three-quarters of that reduction would come from affordable child care helping 358,000 adults gain employment;child poverty in those families would be reduced by 11 percent. Overall, the number of families receiving the subsidywould nearly double from an average of 989,000 a month to 1,948,000.
Of note, the child poverty impact of this change was likely underestimated compared to the impact of housing andnutrition assistance because the Supplemental Poverty Measure only captures changes in families’ out-of-pocket childcare costs instead of the value of the subsidy. In addition, by limiting the subsidy expansion to families previouslypaying for care, the simulation may have underestimated the families who would use this subsidy if available.
Cost — This expansion and associated secondary changes in benefits and taxes would cost a total of $5.3 billion.
Child and Dependent Care Tax Credit expansion
Why this Policy — The Child and Dependent Care Tax Credit (CDCTC) is a nonrefundable tax credit that reimbursesfamilies for a portion of their child or dependent care expenses, thereby increasing families’ economic resourcesand helping them work. In 2010, 6.7 million taxpayers received a total of $3.55 billion through the CDCTC.29
Because the CDCTC is a nonrefundable credit, families with no tax liability — usually families with low earnings —cannot benefit from it. Furthermore, the credit only reimburses a maximum of 35 percent of child or dependent carecosts. As a result, in 2010, families who made $20,000 or less received less than 1 percent of CDCTC benefits.30
Fewer than 1 in 5 eligible children benefited fromchild care subsidiesin an averagemonth in fiscal year 2009 due tofunding restrictions.

C H I L D R E N ’ S D E F E N S E F U N D2222
Improvements — To increase the impact of this credit, CDF asked the Urban Institute to model two changes:
• Making the credit fully refundable to enable all families, regardless of tax liability, to benefit from it.
• Increasing the maximum percent of costs reimbursed from 35 to 50 percent for lower-income families(see Appendix 1 for details).
As with the child care subsidy expansion, the Urban Institute simulated that a small fraction of those whoreceived a larger CDCTC would start working due to lower child care costs.31
Child Poverty Impact — These improvements would reduce child poverty by 1 percent, lifting 146,500 childrenout of poverty. More than half of the impact would result from 101,000 parents who would begin to work becauseof lower child care costs. The average credit would increase by $124. The anti-poverty impact of the CDCTC is likelylimited by the fact that many poor families cannot afford to spend large amounts on child care.
Cost — These changes to the CDCTC and associated secondary changes in benefits and taxes would cost a totalof $1.6 billion.
Ensuring children’s basic needs are met when families fall on hard times
SNAP benefit increase
Why this Policy — The Supplemental Nutrition Assistance Program (SNAP) is a crucial safety net program forchildren. SNAP helped combat hunger among 20.5 million children in fiscal year 2012, over a quarter of all childrenin the nation, and kept 2.1 million children from poverty in 2013.32 However, SNAP benefits average less than
$1.40 per person per meal, which is inadequate for low-income familieswho often lack access to affordable nutritious food.33 In 2013, 54 percentof families receiving SNAP were still food insecure, clear evidence that current SNAP benefits are insufficient to meet families’ food needs.34
During the recession, Congress recognized that SNAP benefits were too lowfor many and increased the value of the maximum benefit by 13.6 percent.35
The impact was powerful: 831,000 children were kept out of poverty in2010 as a result of this change (see box on p. 18). Congress terminated thatincrease in November 2013.
Improvements — To increase the anti-poverty and anti-hunger impact ofSNAP for families with children, CDF asked the Urban Institute to modelSNAP benefits based on the U.S. Department of Agriculture’s Low-CostFood Plan, which is approximately 30 percent higher in value than theThrifty Food Plan, on which benefits are currently based.36
Child Poverty Impact — Basing the SNAP benefit on the Low-Cost Food Plan would reduce child poverty by 16percent, lifting 1.8 million children out of poverty. This change would affect the largest number of people: all of theexisting 11.1 million SNAP families with children and an additional 1.5 million families with children who wouldbegin participating because of the benefit increase, for a total of 12.6 million families. On average, householdswould receive an additional $722 each year.
Cost — The SNAP expansion would cost $23.2 billion.
SNAP benefits average less than$1.40 per person permeal — not enoughfor low-income familieswho often lack access to affordablenutritious food.

E N D I N G C H I L D P O V E R T Y N O W 2323
Child Tax Credit expansion
Why this Policy — The partially refundable Child Tax Credit (CTC) provides families a $1,000 credit for each childunder 17 to help families offset the costs of raising a child. It is an important tool for reducing child poverty,keeping 1.7 million children out of poverty in 2013.37 However, the poorest families cannot receive the fullamount of the credit because families have to earn more than $3,000 per year to qualify for a refund that is limitedto only 15 percent of what they earn above $3,000. For example, a family with two children has to earn at least$16,333 to be eligible for the full $2,000 credit.38 As a result, only 13 percent of the funds spent on the creditgo to the lowest 20 percent of earners.39
Improvements — To increase the anti-poverty impact of the CTC, CDF asked the Urban Institute to model a fullyrefundable CTC so the poorest families could benefit from the full $1,000 credit for each qualifying child regardlessof earned income.
Child Poverty Impact — Making the CTC fully refundable would reduce child poverty by nearly 12 percent and lift 1.3 million children out of poverty. A total of 4.4 million would start receiving a refund from the CTC. In all8.2 million families would each receive on average $1,497 more for their CTC.
Cost — Making the Child Tax Credit fully refundable would cost $12.4 billion.
Shoes Say It All
Shoes tell the story of the McKee family’s descent into
poverty. Those of Skyler, 10, and Zachery, 12, were
falling apart in 2011. Their sister, then 14 years old, wore
the varsity coach’s shoes when she played on her school’s
volleyball team. Less visible was hunger. The children and
their parents, Tonya and Ed McKee, of Dowagiac, Michigan,
sometimes went without food after Ed lost his job in 2009
and the unemployment insurance ran out, before the family
started receiving Supplemental Nutrition Assistance Program
benefits. Skyler said he gave the birthday money he got at
church to his mom for groceries “and I told her she didn’t
have to pay me back.” Skyler confided that sometimes his
stomach growled. “It’s hard, not easy like it was before
where we had money and could do stuff. Now we don’t
go anywhere … Sometimes we don’t have food and we just
don’t eat.”

C H I L D R E N ’ S D E F E N S E F U N D2424
Housing subsidies expansion
Why this Policy — Housing is the single largest expense for most families and is growing increasingly out of reach.The number of homeless public school students was 85 percent higher in 2012-2013 than before the recession.40
The number of families with worst-case housing needs increased from 6 million in 2007 to 8.5 million in 2011,including 3.2 million families with children.41 Homelessness and housing instability can have detrimental consequences on children’s emotional, cognitive and physical development, academic achievement and successas adults.42 Federal rental assistance, including public housing and vouchers for private rentals, help approximately5 million of the neediest low-income households afford a place to live.43 Because of funding limitations onlyabout 1 in 4 needy families with children receives assistance.44
Improvements — CDF asked the Urban Institute to model an expansion of thehousing voucher program to better meet the need among poor and near-poorfamilies with children. The expansion was limited to families below 150 percentof the official poverty guidelines who were not already receiving housing assistance and for whom the fair market rent exceeded 50 percent of theirincome.45 The analysis assumed 70 percent of eligible families would be ableto use the vouchers based on challenges families face in finding housingwithin program time limits.46
Child Poverty Impact — This housing subsidy expansion would have the largestimpact among the nine policy improvements, reducing child poverty by 20.8
percent and lifting 2.3 million children out of poverty. The number of households receiving a subsidy, worth an averageof $9,435, would increase by 2.6 million, a 53 percent increase.
Cost — The cost of this expansion and associated secondary changes in other benefits would be $23.5 billion.
Child support pass-through increase and disregard
Why this Policy — Child support payments represent on average 40 percent of income for poor custodial familieswho receive them, and kept 740,000 children out of poverty in 2013.47 For families who receive TemporaryAssistance for Needy Families (TANF), the state collects child support from non-custodial parents and keeps mostof the payments received to reimburse the cost of assistance. States have the option to pass through child supportpayments to the custodial parent and child and to disregard the child support payment when determining eligibilityfor TANF benefits and benefit value. A pass-through does not financially benefit a family unless it is also disregarded.As of July 2013, 22 states passed through and disregarded at least some of the child support collected.48 The SNAPprogram does not include a disregard for child support income.
Improvements — CDF asked the Urban Institute to model a full pass-through of all child support collected onbehalf of TANF families, along with a disregard of the child support income in the calculation of TANF benefits.In addition, up to $100 of child support collected per month per child was disregarded for SNAP eligibility andbenefit calculations.
Child Poverty Impact — These changes would have the smallest impact of the nine policy changes because of thesmall number of families affected, reducing child poverty by less than 1 percent, or approximately 89,300 children.In aggregate TANF families would receive $477 million more in passed-through child support, $97 million morein TANF benefits from the TANF disregard, and $608 million more in SNAP benefits from the SNAP disregard.
Cost — The child support pass-through improvements and associated secondary changes in benefits would cost$1.1 billion.
Because of fundinglimitations only 1 in 4 eligible families with childrenreceives housingassistance.

E N D I N G C H I L D P O V E R T Y N O W 2525
Poverty 2.0
The Barrett girls, Anjerrica, 15, Daryanna, 10, and Jaeda, 7, would have gone hungry without food
stamps, free school lunches, and a local food pantry in 2012. The Barretts’ hard times resulted
from the double whammy of disability and recession. Darryl and Jeanna Barrett are both college
graduates who together earned about $60,000 a year. Having survived Hurricane Katrina, they bought
a home in New Orleans, eager to help rebuild their city. According to Darryl, they were “on the road to
the American dream.”
Then he became disabled and Jeanna lost her job. Their income in 2012 — Darryl’s Social Security
disability and Jeanna’s unemployment insurance — placed them just barely above the official poverty
level for a family of five. In October 2011, Jeanna got what she called a “part-time part-time” job —
working at a cell phone company two days a week, three hours a day at $8 an hour. And this she says
was after filling out hundreds of applications, “Of all my applications, this was the only place that
wanted to hire me.”

C H I L D R E N ’ S D E F E N S E F U N D2626
How the Urban Institute Assessed Impacts of Policy Improvements
Child Poverty Measurement
Child poverty impacts were measured using the Supplemental Poverty Measure (SPM), an alternative
poverty measure developed by the U.S. Census Bureau and the Bureau of Labor Statistics based on a
broader range of income sources and costs than the official poverty measure. While the official poverty
measure counts only earnings and cash benefits (such as social security and unemployment benefits),
the SPM also counts in-kind benefits such as food, housing and energy assistance, and tax credits like
the Earned Income Tax Credit (EITC) and the Child Tax Credit. It also deducts expenses such as taxes
and child care, commuting and health care costs, and it takes into account variations in housing costs
in different parts of the country.49 As a result the SPM is a more comprehensive measure of poverty
that accounts for the impact of the government anti-poverty programs and policies CDF wanted to
measure (see Appendix 2 for details).
The only policy change not fully captured by the SPM is increased availability of child care subsidies.
In contrast to housing subsidies and SNAP benefits, the SPM does not count the value of child care
subsidies, but instead deducts families’ out-of-pocket costs. Child poverty impacts measured by the SPM
will therefore only be based on changes to families’ out-of-pocket child care costs and will appear
lower, relative to costs, than the impacts of housing subsidies and SNAP benefits.
Simulation Model
The Urban Institute modeled the impact of the nine policy changes using TRIM3, a validated
microsimulation model of the tax and benefits programs affecting U.S. households. TRIM3, which models
the U.S. non-institutionalized population based on U.S. Census and federal program and tax data, is a
well-respected tool used for over 40 years to assess the operation of the U.S. safety net and to estimate
the potential impacts of changes to safety net programs and policies.50
The analysis was based on data representing the U.S. in 2010, the most recent year available at the
time the project began. While the economy has improved since 2010, the number of children below 100
percent of the official poverty threshold has decreased only 10 percent from 16.2 million in 2010 to
14.7 million in 2013.51 All policies in place in 2010 were assumed to be in effect in the simulation,
including the ARRA SNAP benefit increase and the improvements to the EITC and the CTC. The only
provision that was excluded from the baseline was the temporary Making Work Pay tax credit, which
was in place only in 2009 and 2010.52

E N D I N G C H I L D P O V E R T Y N O W 27
Child SPM Poverty in 2010
Prior to the policy changes there were 10.9 million poor children in 2010 according to the Urban Institute’s
SPM calculations, resulting in a child poverty rate of 14.6 percent. This child SPM estimate is lower than
the Census’ SPM estimate of 18.2 percent because TRIM3 corrects for under-reporting of certain survey-
reported resources, including receipt of SNAP, subsidized housing, Supplemental Security Income and
TANF, and because TRIM3 uses a different methodology to impute taxes paid. Characteristics of poor
children based on Urban Institute’s model are presented in Appendix 2.
For more details about the Urban Institute’s methods please refer to the Urban Institute’s technical report
on CDF’s website.53
POVERTY HURTS
by age 4 poor children have heard 30 million fewer words than well-off children
child poverty increasesthe risk of unemploymentand adult poverty
poor children areless likely to graduatefrom high school
poor children are more likely to be hungry andless likely to have affordablequality health coverage

E N D I N G C H I L D P O V E R T Y N O W 2929
CHAPTER 3
COMBINED IMPACTS AND COSTS
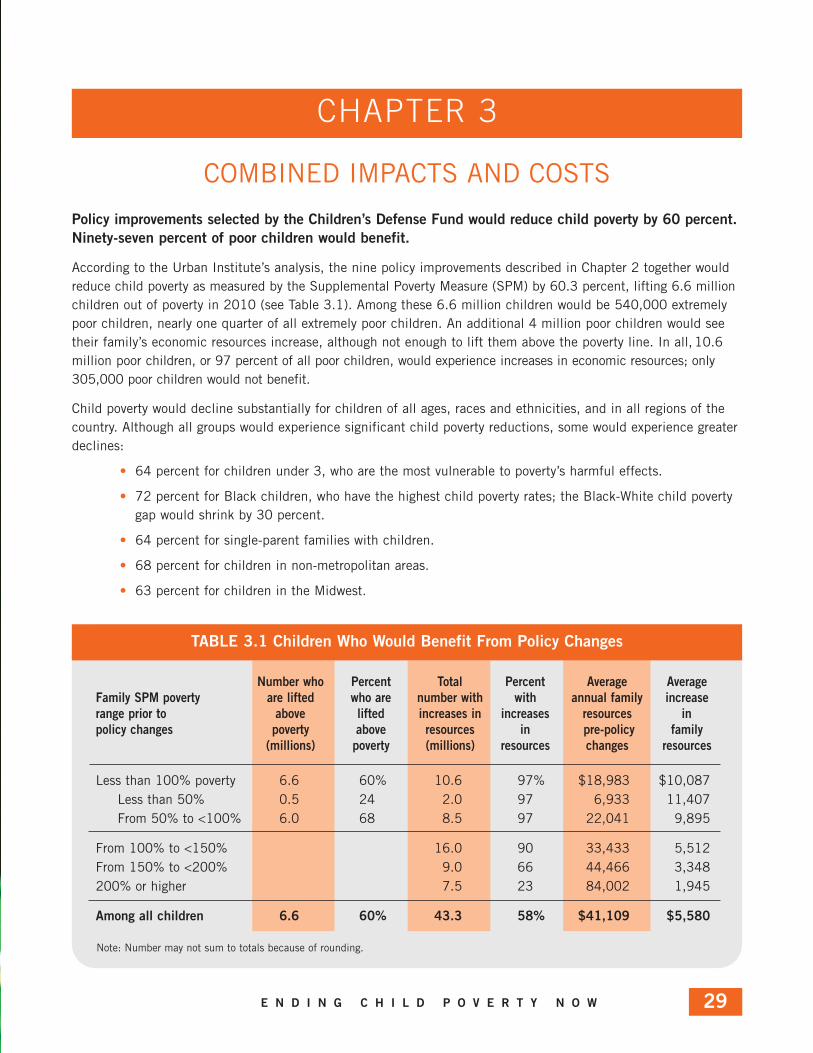
Policy improvements selected by the Children’s Defense Fund would reduce child poverty by 60 percent.Ninety-seven percent of poor children would benefit.
According to the Urban Institute’s analysis, the nine policy improvements described in Chapter 2 together wouldreduce child poverty as measured by the Supplemental Poverty Measure (SPM) by 60.3 percent, lifting 6.6 millionchildren out of poverty in 2010 (see Table 3.1). Among these 6.6 million children would be 540,000 extremelypoor children, nearly one quarter of all extremely poor children. An additional 4 million poor children would seetheir family’s economic resources increase, although not enough to lift them above the poverty line. In all, 10.6million poor children, or 97 percent of all poor children, would experience increases in economic resources; only305,000 poor children would not benefit.
Child poverty would decline substantially for children of all ages, races and ethnicities, and in all regions of thecountry. Although all groups would experience significant child poverty reductions, some would experience greaterdeclines:
• 64 percent for children under 3, who are the most vulnerable to poverty’s harmful effects.
• 72 percent for Black children, who have the highest child poverty rates; the Black-White child povertygap would shrink by 30 percent.
• 64 percent for single-parent families with children.
• 68 percent for children in non-metropolitan areas.
• 63 percent for children in the Midwest.
Number who Percent Total Percent Average AverageFamily SPM poverty are lifted who are number with with annual family increaserange prior to above lifted increases in increases resources in policy changes poverty above resources in pre-policy family
(millions) poverty (millions) resources changes resources
Less than 100% poverty 6.6 60% 10.6 97% $18,983 $10,087Less than 50% 0.5 24 2.0 97 6,933 11,407From 50% to <100% 6.0 68 8.5 97 22,041 9,895
From 100% to <150% 16.0 90 33,433 5,512From 150% to <200% 9.0 66 44,466 3,348200% or higher 7.5 23 84,002 1,945
Among all children 6.6 60% 43.3 58% $41,109 $5,580
TABLE 3.1 Children Who Would Benefit From Policy Changes
Note: Number may not sum to totals because of rounding.

C H I L D R E N ’ S D E F E N S E F U N D3030
A total of 43.3 million children would benefit.
In addition to helping poor children, the policy changes would also improve the economic well-being of 32.7 millionchildren above 100 percent of SPM poverty — half of them in families with incomes between 100 and 150 percentof poverty — but to a lesser extent than for children below poverty (see Table 3.1). Increases in family resourcesfor poor children would average $10,087 a year compared to $1,945 for children at or above 200 percent ofpoverty. A total of 43.3 million children, 58 percent of all children in America, would see their family’s economicresources increase as a result of these nine policy improvements.
Although the focus of the analysis was reducing child poverty, these policy changes would also reduce poverty amongworking-age adults by 26 percent and among the elderly by 4 percent. Overall, the proposed policy improvementswould reduce poverty in the entire population by 31.5 percent. A net total of 3.1 million people in families withchildren would gain jobs from the combined impacts of new subsidized jobs and improvements to the EarnedIncome Tax Credit, child care subsidies, minimum wage, and the Child and Dependent Care Tax Credit.1
Although 4.3 million children would remain poor despite the policy changes, 93 percent of them would still behelped by one or more of the changes, including 902,000 children who would be lifted above 50 percent of poverty.Not surprisingly, those who would remain poor started out deeper in poverty: 38 percent were extremely poor com-pared to 8 percent of the children lifted above poverty. Legal status may also explain why some children wouldremain poor. Thirty percent of these children lived in households headed by an undocumented immigrant (although89 percent of the children in these families were citizens) as compared to 14 percent of children who would belifted above poverty. Many policies and programs included in this analysis restrict benefits to citizens and authorizedimmigrants who have been in the U.S. for a minimum of five years.
Lifting 60 percent of poor children out of poverty and increasing resources for a total of 43.3 millionchildren in 2010 was estimated to cost federal and state governments $77.2 billion.2
Just over half of the $77.2 billion (54 percent) would go to families below 100 percent of SPM poverty, and 84 percent would go to families with incomes below 150 percentof poverty. Reducing child poverty by 60 percent wouldmake an enormous difference in the lives and futures ofthose children and begin to reduce the estimated half atrillion dollars the U.S. spends every year for the lost productivity and extra health and criminal justice costs ofadults who grew up poor.
The cost to reduce child poverty by 60 percent representsonly 2 percent of the $3.5 trillion spent by the federal government in 2010 and only 0.5 percent of the country’sgross domestic product (GDP) that year.3 It is only 69 percentof the $112 billion the U.S. has spent on average everyyear since 2001 on the wars in Iraq and Afghanistan.4 Ournational security depends as much on a healthy, educatedcitizenry as it does on military strength. Furthermore thisinvestment could be made without increasing the deficit by eliminating tax breaks for corporations and wealthy individuals or redirecting a small fraction of our militaryspending.
All PolicyChanges
Child Poverty
$16,000
14,000
12,000
10,000
8,000
6,000
4,000
2,000
0
$14,958b
Bill
ions
$3,457b
$500b$77b
2010Federal Spending
2010 GDP
FIGURE 3.1 – Cost of Proposed PolicyChanges Relative to Costs of Child Poverty,
Federal Spending, and GDP

E N D I N G C H I L D P O V E R T Y N O W 3131
The Nation Can Easily Afford to Invest $77.2 Billion in Children
Any one of the following could pay for a 60 percent reduction in child poverty:
• Closing tax loopholes that allow U.S. corporations to dodge $90 billion in federal income taxes eachyear by shifting profits to subsidiaries in tax havens;5
or • Eliminating tax breaks for the wealthy by taxing capital gains and dividends at the same rates aswages, saving more than $84 billion a year;6
or• Closing 23 tax loopholes included in former House Ways and Means Chairman Dave Camp’s Tax ReformAct of 2014, which would free up an average of $79.3 billion per year;7
or• Cutting only 14 percent of the nation’s FY2015 $578 billion in military spending.8 The U.S. houses lessthan 5 percent of the world’s population but accounts for 37 percent of the world’s military expenditures;or
• Scrapping the F-35 fighter jet program, already several years behind schedule and 68 percent overbudget and still not producing fully functioning planes. For the $1.5 trillion projected cost of this program,the nation could reduce child poverty by 60 percent for 19 years.9
Alternatively the nation could:Increase the value of SNAP benefits for familieswith children by 30 percent and reduce childpoverty by 16 percent (cost = $23.2 billion).
Provide housing subsidies for poor and near-poorfamilies with children, reducing child poverty by21 percent (cost = $23.5 billion) and providesubsidized jobs to unemployed or underemployedpeople in families with children, reducing childpoverty by 10.7 percent (cost = $22.9 billion).
Eliminating tax breaks for corporate meals and entertainment (savings = $14 billion);10
Ensuring high-income households don’t pay less in taxes than middle income families ($7 billion);11 and
Closing the Gingrich-Edwards S-corporation loophole that allows professionals such as lawyersand doctors who work for themselves to avoidpayroll taxes by characterizing much of theirincome as business profits rather than wages orsalaries ($2.5 billion).12
Making common sense reforms to corporateaccounting tax rules (savings = $58 billion).13
by
by
Tradeoffs: Paying to End Child Poverty

C H I L D R E N ’ S D E F E N S E F U N D3232
Make the Child Tax Credit fully refundable and reduce child poverty by 12 percent (cost = $12.4 billion).
Increase the value of the Earned Income TaxCredit and reduce child poverty by 9 percent(cost = $8.2 billion).
Provide access to child care subsidies for poorand near-poor families and reduce child povertyby 3 percent (cost = $5.3 billion).
Increase the value of the Child and DependentCare Tax Credit and reduce child poverty by 1 percent (cost = $1.6 billion).
Pass through and disregard child supportand reduce child poverty by 1 percent (cost = $1.1 billion).
Returning estate and gift taxes to 2009 levels, (savings = $13.1 billion).14
Closing tax loopholes that allow speculators whotrade risky investments called derivatives to avoid,defer, or reduce taxes (savings = $2.9 billion);15
Preventing tax-preferred retirement accounts, whichwere designed to help middle-class families save forretirement, from being used by the wealthy to shelterincome from taxes (savings = $2.8 billion);16 and
Closing the corporate stock options tax loopholethat allow companies to deduct stock optionscashed in by an employee at the inflated currentmarket value, rather than the original cost to thecorporation (savings = $2.5 billion).17
Closing the tax loophole that allows corporationsto write-off unlimited amounts of compensationfor corporate executives as long as it’s “performance based” (savings = $5 billion)18 and
Eliminating tax giveaways for corporate jets (savings = $0.37 billion).19
Closing the ‘carried interest’ tax break for hedgefund managers by requiring that their earnings be taxed as ordinary income rather than capitalgains (savings = $1.7 billion).20
Eliminating the mortgage interest deduction for vacation homes and yachts(savings = $1.5 billion).21
by
by
by
by
by
E N D I N G C H I L D P O V E R T Y N O W 3333
Number of Net new federalpoor children and state
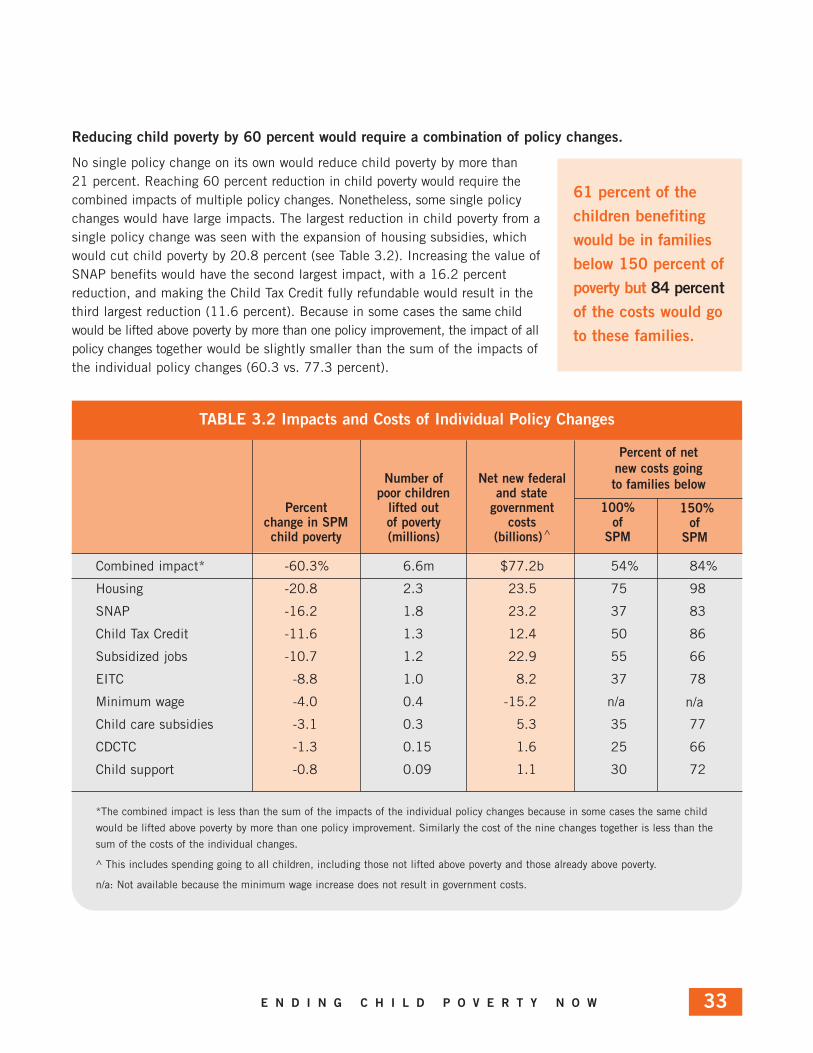
Percent lifted out government 100%change in SPM of poverty costs ofchild poverty (millions) (billions)^ SPM
Combined impact* -60.3% 6.6m $77.2b 54% 84%
Housing -20.8 2.3 23.5 75 98
SNAP -16.2 1.8 23.2 37 83
Child Tax Credit -11.6 1.3 12.4 50 86
Subsidized jobs -10.7 1.2 22.9 55 66
EITC -8.8 1.0 8.2 37 78
Minimum wage -4.0 0.4 -15.2 n/a
Child care subsidies -3.1 0.3 5.3 35 77
CDCTC -1.3 0.15 1.6 25 66
Child support -0.8 0.09 1.1 30 72
*The combined impact is less than the sum of the impacts of the individual policy changes because in some cases the same child
would be lifted above poverty by more than one policy improvement. Similarly the cost of the nine changes together is less than the
sum of the costs of the individual changes.
^ This includes spending going to all children, including those not lifted above poverty and those already above poverty.
n/a: Not available because the minimum wage increase does not result in government costs.
TABLE 3.2 Impacts and Costs of Individual Policy Changes
Percent of net new costs going to families below
150%of SPM
n/a
Reducing child poverty by 60 percent would require a combination of policy changes.
No single policy change on its own would reduce child poverty by more than 21 percent. Reaching 60 percent reduction in child poverty would require thecombined impacts of multiple policy changes. Nonetheless, some single policychanges would have large impacts. The largest reduction in child poverty from asingle policy change was seen with the expansion of housing subsidies, whichwould cut child poverty by 20.8 percent (see Table 3.2). Increasing the value ofSNAP benefits would have the second largest impact, with a 16.2 percentreduction, and making the Child Tax Credit fully refundable would result in thethird largest reduction (11.6 percent). Because in some cases the same childwould be lifted above poverty by more than one policy improvement, the impact of allpolicy changes together would be slightly smaller than the sum of the impacts ofthe individual policy changes (60.3 vs. 77.3 percent).
61 percent of the children benefitingwould be in familiesbelow 150 percent ofpoverty but 84 percentof the costs would goto these families.

C H I L D R E N ’ S D E F E N S E F U N D3434
EITC and minimum wage changes and the subsidized jobs program together reduce child poverty by nearly a quarter.
There is great interest across the political spectrum in policies that make work pay more, including pairing anincrease in the minimum wage with an improved EITC since the two policies amplify and complement eachother.22 Increasing the minimum wage would boost the value of the EITC for low-income workers, and increasingthe value of the EITC for lower-wage workers would increase incentives to work more. The anti-poverty impacts ofsubsidized jobs programs would also be amplified by minimum wage and EITC changes.
The Urban Institute examined the combined impacts of these three policy changes and found that the EITC andminimum wage increases together would decrease child poverty by 12.4 percent. Combining the EITC, minimumwage and the subsidized jobs program would reduce child poverty by 23.4 percent, at a cost of $18.5 billion (see Appendix Table A3.1 for details).
Impacts differ by race/ethnicity.
The policy improvements combined would result in a larger poverty reduction for Black children than for Whiteand Hispanic children and children of other races. Childpoverty for Black children would go from being 2.7 timesas high as for White children to 1.9 times, a 30 percentdecrease in the Black/White gap. Black children wouldexperience the largest impacts with six of the nine individualpolicy improvements (see Appendix Table A3.2).
Impacts differ by age.
The youngest children would benefit most from the childpoverty reductions. Currently this is the poorest age groupand the group poverty hurts most, as the first few years of life are crucial for healthy brain development (see Appendix Table A3.3).
Impacts differ by urbanicity, region, and state.
The policy improvements together would reduce childpoverty more in non-metropolitan than metropolitan areas,likely because of lower housing costs and therefore lowerSPM poverty thresholds in non-metropolitan areas. Sevenof the nine individual policy changes followed this pattern (see Appendix Table A3.4).
As a whole, the improvements also had slightly different impacts on child poverty in different regions of the country,with the largest reduction in the Midwest and the smallest in the West. These variations are likely due to lower housing costs, and therefore lower SPM thresholds, in the Midwest and South compared to the Northeast andWest, although not all policy changes followed the same regional pattern (see Appendix Table A3.4).
In sum, while there were small differences based on race/ethnicity and geography, child poverty would fall bymore than half in all subsets of children examined. Overall, these nine policy improvements would reduce childpoverty by 60 percent, lifting 6.6 million children out of poverty and increase economic resources for a total of43.3 million children, at a cost the nation can well afford.
Child Poverty Reductions Differ byRace, Age, Urbanicity, and Region
Race
White Hispanic Black Other
-60% -56% -72% -56%
Age
≤2 3-5 6-12 13-17
-64% -61% -61% -56%
Urbanicity
Non-Metro Metro
-68% -59%
Region
Midwest South Northeast West
-63% -61% -61% -58%

E N D I N G C H I L D P O V E R T Y N O W 35
Impacts of Policy Improvements in Select States
The Urban Institute was able to compute impacts of the policy improvements in California, Florida, New York, and Texas, which together are home to 36 percent of poor children based only on cash income.Although large reductions in child poverty would occur in all four, projected impacts were more than 20percent higher in New York than in the three other states. All policy changes except those to the minimumwage, the Child and Dependent Care Tax Credit and child support would have the largest impact in NewYork (see Appendix Table A3.5). Increasing access to housing subsidies would have a particularly largeimpact in New York, reducing child poverty by nearly 40 percent. It would also have a large impact inCalifornia, with a 30 percent reduction. The larger impacts projected for New York may be partly a result ofthe state having a lower prevalence of undocumented immigrants — who may not be eligible for benefits— compared to the three other states (3.2 percent in New York vs. 4.5 percent in Florida, 6.7 percent inTexas, and 6.8 percent in California23).
CA FL NY TX
Number and percent of poor children prior to the
2.2 million 0.8 million 0.6 million 1.2 million
policy changes23.5% 20.2% 13.7% 17.4%
Child poverty reduction -57.6% -59.7% -72.7% -57.8%

E N D I N G C H I L D P O V E R T Y N O W 3737
The results are clear. For the first time, this report shows how childpoverty in the United States could be substantially reduced. By makingwork pay more, supporting employment for those who can work, and
expanding safety net supports to ensure children’s basic needs are met, thenation could reduce child poverty by 60 percent — lifting 6.6 million childrenout of poverty immediately.
Lifting 6.6 million children above poverty for a year and improving circumstances for 97 percent of poor children through the policy changesdescribed in this report would cost $77.2 billion. That is just 2 percent of the$3.5 trillion spent by the federal government in 2010 and half of 1 percentof the country’s 2010 gross domestic product, a cost our rich nation can well afford. This investment would eventually pay for itself since protecting children against the lifelong consequences of poverty would improve theirlife incomes and outcomes and reduce child poverty in future generations. The nation would benefit from a largertax-paying and healthier workforce which would build a stronger economy and gradually reduce the half a trilliondollars our nation spends each year on child poverty.
The U.S. has long been an outlier among high-income countries for its high rates of child poverty. This reportshows this is in no way inevitable. By investing more in protecting children from poverty the U.S. could rejoin theranks of peer nations. Shrinking the U.S. relative child poverty rate by 60 percent would cut child poverty in theU.S. from 23.1 to 9.2 percent, placing the U.S. in line with countries like Germany and Switzerland.1
Most importantly, lifting 6.6 million children out of poverty would mean children like Christopher Rogers, picturedearlier, could focus on homework rather than on trying to make money to supplement their parents’ income.Ensuring children don’t go hungry in our rich nation would mean children like Skyler McKee wouldn’t have to go without the food they need to be healthy and able to learn. Making sure children have a stable place to livewould mean that children like Tristan would not be exposed to the toxic stress of growing up in a homeless shelter.Providing jobs and making work pay more would mean parents like Ana Cohen can do what they most want to do:earn enough through work to care for their children. Ultimately, protecting children from the harms of povertymeans ensuring all children have an opportunity to reach their full potential.
Although essential, improving the economic circumstances of poor families with children is not enough. To reducepoverty long-term, children also need access to affordable comprehensive health care, affordable high-quality earlydevelopment and learning opportunities, high-performing schools and colleges, families and neighborhoods freefrom violence, and economic opportunities as young adults. Ensuring today’s children are protected from povertyis only part of the nation’s obligation to its children. But as this report shows, it’s a goal the nation can achieveright now with the right investments.
CHAPTER 4
CONCLUSION AND RECOMMENDATIONS
For the first time, this
report shows how we
could reduce child
poverty in the United
States by 60 percent.

C H I L D R E N ’ S D E F E N S E F U N D3838
The nation has a choice. We can continue to let millions of children grow up in poverty, which destroys hope, robschildren of their future and fuels an intergenerational cycle of poverty. Or we can make the smart and compassionatechoice and ensure children are protected from poverty by investing more in programs and policies we already knowwork. We can let children’s opportunities be determined by the circumstances of their birth or be true to ournation’s bedrock principle that all children should have an equal opportunity to succeed.
The right choice is obvious. Our wealthy and powerful nation must commit to ensuring all children have theopportunity to reach their full potential. For the millions of children who are hungry or homeless or hopeless abouttheir future we cannot afford to wait. The future of our children and our nation depends on it.
CDF therefore recommends the following improvements, which together could reduce child poverty by 60 percentand improve economic circumstances for 43.3 million children:
1. Increase investments in housing assistance for poor families with children so all eligible families can afforda safe and stable place to raise their children. In our analysis this expansion alone would reduce childpoverty by 21 percent.
2. Increase the value of SNAP benefits to cover a larger portion of the nutrition needs of children. We foundthat increasing the value of SNAP benefits by 30 percent would decrease child poverty by 16 percent.
3. Make the Child Tax Credit fully refundable. Our analysis found this would reduce child poverty by 12 percent.
4. Expand subsidized jobs programs for older teens and adults to meet the demand for jobs. The best solutionto poverty remains a job that pays enough to raise a family. We found that subsidized minimum-wage jobswould reduce child poverty by 11 percent, and by 29 percent among children living with adults who aren’tcurrently working.
5. Increase the value of the Earned Income Tax Credit. Moderately increasing the value of the federal EITC forlow-income workers with children would reduce child poverty by 9 percent. While CDF tested an expansionof the federal EITC, expansions of state and local EITCs would likely also help reduce child poverty.
6. Raise the minimum wage to $10.10 or higher. Raising the federal minimum wage to $10.10 decreasedchild poverty by 4 percent, and by 8 percent among children living with a full-time year-round worker. The minimum wage could be increased at the federal, state or local levels.
7. Expand access to child care subsidies to all poor and near-poor families. Such an expansion would reducechild poverty by 3 percent overall. Among families without working adults, it would reduce child poverty by 11 percent by making work possible.
8. Make the Child and Dependent Care Tax Credit refundable and increase its value. This change wouldreduce child poverty by 1 percent and enable 101,000 parents to work.
9. Require a full pass-through and disregard of child support for TANF families, along with a $100 disregardfor SNAP benefit calculation. These changes would reduce child poverty just under 1 percent and helpfamilies fully benefit from child support intended to benefit their children.

E N D I N G C H I L D P O V E R T Y N O W 3939
What Advocates Can Do to Reduce Child Poverty in Their Communities
Spread the word. The evidence is here. We already know how to cut child poverty; we now need to strategicallyinvest more in what is already working.
Educate policymakers at all levels of government about the importance of the changes listed in this chapter.Don’t forget state and local officials. Many of these policies and programs have state and local counterpartsor can be influenced at the state or local level. See Appendix Table A4 for information about your state’spolicies.
Don’t let people tell you the country can’t afford to end child poverty. Closing tax loopholes for the richwould pay for these improvements without raising the deficit. And our nation would begin to reduce the halfa trillion dollar bill it pays each year for child poverty. Not only can we afford it, we can’t afford not to do it.

C H I L D R E N ’ S D E F E N S E F U N D40
APPENDICES
Appendix 1. Additional Details on Changes to the Earned IncomeTax Credit and the Child and Dependent Care Tax Credit
Further details can also be found in the Urban Institute’s technical report on CDF’s website.
Earned Income Tax Credit
To increase the anti-poverty impact of the EITC, CDF increased the rate at which the credit phases in from arange of 34-45 percent (depending on the number of children) to a range of 68-79 percent. We also increasedthe maximum credit while keeping the rate at which the credit phases out the same (to keep marginal tax ratesthe same) for nearly all filer types. These changes increase the EITC for the lowest income families and somewhatlessen the marriage penalty. The figure below shows the changes for filers with one child and Table A1.2 showsthe parameter changes for all filers.
While extending the EITC to childless adults would benefit children through higher child support payments amongother ways, CDF did not model an increase in the EITC for childless adults because the TRIM3 model had no wayto link childless adults to non-custodial children.
Earnings
Cre
dit
1,5
00
3,0
00
4,5
00
6,0
00
7,5
00
9,0
00
10
,50
0
12
,00
0
13
,50
0
15
,00
0
16
,50
0
18
,00
0
19
,50
0
21
,00
0
22
,50
0
24
,00
0
25
,50
0
27
,00
0
28
,50
0
30
,00
0
31
,50
0
33
,00
0
34
,50
0
36
,00
0
37
,50
0
39
,00
0
40
,50
0
$0
$4,500
4,000
3,500
3,000
2,500
2,000
1,500
1,000
500
0
Single – original
Single – modifiedMarried Filing Jointly – modified
Married Filing Jointly – original
EITC Values for Filer with One Child

E N D I N G C H I L D P O V E R T Y N O W 41
Filing No. ofStatus Children Actual Model Actual Model Actual Model Actual Model Actual Model
Single 0 7.65% 7.65% $5,980 $5,980 $457 $457 $7,480 $7,480 7.65% 7.65%
1 34.00 68.00 8,970 5,965 3,050 4,056 16,450 10,155 15.98 15.98
2 40.00 74.00 12,590 8,165 5,036 6,042 16,450 11,673 21.06 21.06
3+ 45.00 79.00 12,590 9,476 5,666 7,486 16,450 13,336 21.06 25.00
Joint 0 7.65 7.65 5,980 5,980 457 457 12,490 12,490 7.65 7.65
1 34.00 68.00 8,970 5,965 3,050 4,056 21,460 15,162 15.98 15.98
2 40.00 74.00 12,590 8,165 5,036 6,042 21,460 16,683 21.06 21.06
3+ 45.00 79.00 12,590 9,476 5,666 7,486 21,460 18,346 21.06 24.94
Table A1.2. Changes to EITC parameters
Phase-In Rate Plateau Begins Max Credit Plateau Ends Phase-Out Rate
Child and Dependent Care Tax Credit Expansion
The following table shows the changes to the reimbursement schedule for the Child and Development Care TaxCredit that CDF asked the Urban Institute to model.
The analysis did not change the earnings requirement or the limit on the amount of child or dependent careexpenses that can be claimed: $3,000 of expenses paid per year for one qualifying individual or $6,000 for twoor more qualifying individuals.
Table A1.3. Modeled Changes to CDCTC Reimbursement Schedule
Actual 2010 Schedule Simulated Schedule
AGI Rate AGI Rate
$0 — $15,000 35% $0 — $25,000 50%15,000 — 17,000 3417,000 — 19,000 3319,000 — 21,000 3221,000 — 23,000 3123,000 — 25,000 3025,000 — 27,000 29 25,000 — 27,000 4727,000 — 29,000 28 27,000 — 29,000 4429,000 — 31,000 27 29,000 — 31,000 4131,000 — 33,000 26 31,000 — 33,000 3833,000 — 35,000 25 33,000 — 35,000 3535,000 — 37,000 24 35,000 — 37,000 3237,000 — 39,000 23 37,000 — 39,000 2939,000 — 41,000 22 39,000 — 41,000 2641,000 — 43,000 21 41,000 — 43,000 2343,000 — No limit 20 43,000 — No limit 20

C H I L D R E N ’ S D E F E N S E F U N D42
Table A2.1. Resource and Threshold Definitions in the Official and Supplemental Poverty Measures
Resources Cash Income, composed of: Wages, salaries, and self-employment
income Interest, dividends, rent, trustsSocial Security & Railroad Retirement
PensionsDisability benefitsUnemployment compensation Child support received Veterans benefitsEducational assistance (grants)Supplemental Security IncomeTemporary Assistance for Needy
FamiliesOther cash public assistance
Thresholds National thresholds vary by age (less than 65 and 65+) and number of children and adults and are based onthe cost of food.
Cash Income — Same as componentsshown for “official” measurePlus
Food Stamps/SNAP WIC School lunch Housing subsidies LIHEAPFederal EITCState EITCState tax credits
MinusPayroll taxesFederal income taxesState income taxesChild care expensesOther work expenses Medical out-of-pocket expenses Child support paid
Thresholds vary by number of childrenand adults and by housing status (rents,owns with mortgage, or owns withoutmortgage), and are based on the cost offood, clothing, shelter, and utilities.Geographic adjustments are applied tothe housing portion of the threshold.
Appendix 2. Comparison of the Official and SupplementalPoverty MeasuresThe following table compares the official poverty measure and the Supplemental Poverty Measure (SPM) in termsof the family resources and expenses included, and how the poverty thresholds are calculated.
Concepts Official Poverty Definition Supplemental Poverty Measure (SPM)
Source: Linda Giannarelli, Kye Lippold, Sarah Minton, and Laura Wheaton. Jan. 2015. “Reducing Child Poverty in the US: Costs andImpacts of Policies Proposed by the Children’s Defense Fund.” Washington, DC: Urban Institute.

E N D I N G C H I L D P O V E R T Y N O W 43
Table A2.2. Number and Percent of Children in SPM Poverty by Selected Characteristics, 2010 (TRIM3-adjusted data)
SPM Number of Percent of poverty poor poor rate children children
All Children (under age 18)1 14.6% 10,924,000By Age
<=2 16.8 2,112,000 19%3-5 16.5 2,152,000 206-12 13.8 3,961,000 3613-17 13.0 2,699,000 25
By Race/EthnicityWhite 7.5 3,053,000 28Black 20.3 2,128,000 19Hispanic 28.1 4,937,000 45Other races 13.0 805,000 7
By Family Composition2
In families with any non-elderly or non-disabled adults 13.9 10,091,000 92At least one adult is a FY-FT worker 6.6 3,702,000 34No FY-FT adults, at least one adult is PY or PT 28.9 3,714,000 34No working adults, all adults are students 57.3 316,000 3No working adults, at least 1 non-student adult 65.4 2,359,000 22
In families with only elderly or disabled adults 38.2 690,000 6In families without adults 52.0 143,000 1.3
By Metropolitan StatusMetropolitan area 15.4 9,768,000 89Non-metropolitan area 10.0 1,156,000 11
By Region Northeast 11.4 1,405,000 13South 15.3 4,321,000 40Midwest 10.9 1,731,000 16West 18.9 3,467,000 32
1 All people under age 18 are considered to be children, even if married or living separately from parents.
2 Elderly adults are those aged 65 and over, and disabled adults are identified based on reason for not working and receipt of disabilityincome. Full-time (FT) workers are defined as working 35 or more hours per week, and full-year (FY) workers work 50 or moreweeks, while part-time (PT) and part-year (PY) workers are those working at least one week and one hour but not FT or not FY.Students are those who say they are not working because they are in school. A metropolitan area has a core urban area population of 50,000 or more and includes adjacent counties with a high degree of social and economic integration with the urban core.

C H I L D R E N ’ S D E F E N S E F U N D44
Appendix 3. Detailed Child Poverty Impacts and Costs
Table A3.1 Combined Impacts and Costs of Changes to EITC, Minimum Wage and Subsidized Jobs
Percent change Percent change in Federal and State in child SPM extreme child SPM Government poverty poverty Costs
EITC Increase -8.8% -10.3% $8.2 billion
Minimum Wage Increase -4.0 -4.9 -15.2
Subsidized Jobs -10.7 -18.6 22.9
EITC + Minimum Wage -12.4 -14.1 -8.4
EITC + Minimum Wage + Subsidized Jobs
-23.4 -30.1 18.5
Table A3.2. Reductions in Child SPM Poverty by Race
Hispanic White Black Other
All Policy Changes -56.2% -60.1% -72.1% -55.7%
Housing Subsidy Expansion -22.5 -14.7 -24.9 -22.8
SNAP Increase -12.7 -20.3 -19.5 -13.2
Child Tax Credit Increase -8.9 -14.4 -15.8 -6.4
Subsidized Jobs -8.8 -11.2 -14 -12.2
EITC Increase -6.6 -9.1 -14.2 -6.4
Minimum Wage Increase -5.0 -3.9 -2.5 -1.4
Child Care Subsidy Expansion -2.4 -3.4 -4.8 -1.4
CDCTC Increase -0.9 -1.6 -1.9 -1.6
Child Support Pass-Through Requirement -0.5 -1.7 -0.6 -0.3
Table A3.3. Reductions in Child SPM Poverty by Age
≤2 3-5 6-12 13-17 18-64 65+ All Ages
All Policy Changes -63.8% -60.7% -61.2% -56.1% -25.6% -4.0% -31.5%Housing Subsidy Expansion -23.7 -21.1 -19.9 -19.7 -7.1 -0.7 -9.7SNAP Increase -16.2 -18.8 -16.5 -13.7 -5.8 -0.9 -7.7Child Tax Credit Increase -11.4 -13.5 -13.5 -7.4 -2.9 -0.6 -4.8Subsidized Jobs -10.8 -10.4 -9.9 -12.2 -4.6 -0.7 -5.6EITC Increase -9.9 -9.9 -8.2 -7.7 -3.4 -0.5 -4.3Minimum Wage Increase -5.1 -3.1 -4.0 -3.7 -4.7 -0.7 -4.0Child Care Subsidy Expansion -3.9 -3.7 -3.0 -2.0 -0.9 -0.1 -1.3CDCTC Increase -1.5 -2.4 -1.3 -0.4 -0.4 0.0 -0.6Child Support Pass-Through Requirement -0.6 -0.6 -0.9 -1.1 -0.2 0.0 -0.3
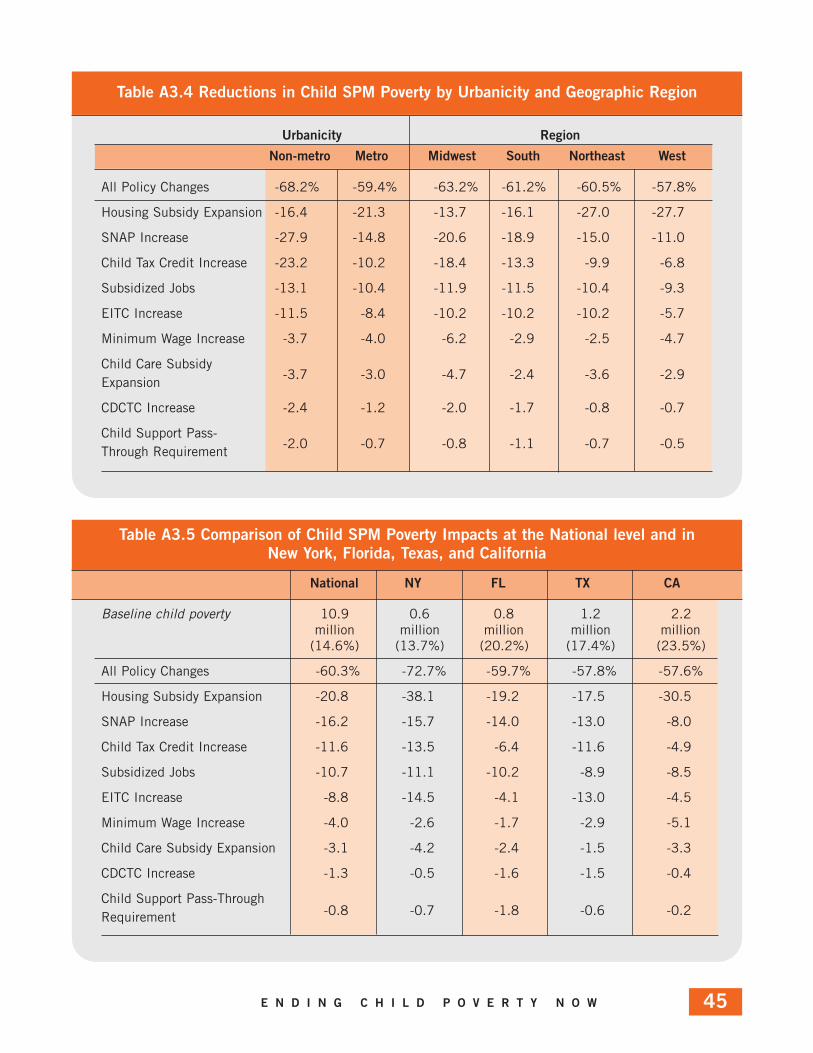
E N D I N G C H I L D P O V E R T Y N O W 45
Urbanicity Region
Table A3.4 Reductions in Child SPM Poverty by Urbanicity and Geographic Region
All Policy Changes -68.2% -59.4% -63.2% -61.2% -60.5% -57.8%
Housing Subsidy Expansion -16.4 -21.3 -13.7 -16.1 -27.0 -27.7
SNAP Increase -27.9 -14.8 -20.6 -18.9 -15.0 -11.0
Child Tax Credit Increase -23.2 -10.2 -18.4 -13.3 -9.9 -6.8
Subsidized Jobs -13.1 -10.4 -11.9 -11.5 -10.4 -9.3
EITC Increase -11.5 -8.4 -10.2 -10.2 -10.2 -5.7
Minimum Wage Increase -3.7 -4.0 -6.2 -2.9 -2.5 -4.7
Child Care Subsidy Expansion
-3.7 -3.0 -4.7 -2.4 -3.6 -2.9
CDCTC Increase -2.4 -1.2 -2.0 -1.7 -0.8 -0.7
Child Support Pass-Through Requirement
-2.0 -0.7 -0.8 -1.1 -0.7 -0.5
Non-metro Metro Midwest South Northeast West
Baseline child poverty 10.9 0.6 0.8 1.2 2.2million million million million million (14.6%) (13.7%) (20.2%) (17.4%) (23.5%)
All Policy Changes -60.3% -72.7% -59.7% -57.8% -57.6%
Housing Subsidy Expansion -20.8 -38.1 -19.2 -17.5 -30.5
SNAP Increase -16.2 -15.7 -14.0 -13.0 -8.0
Child Tax Credit Increase -11.6 -13.5 -6.4 -11.6 -4.9
Subsidized Jobs -10.7 -11.1 -10.2 -8.9 -8.5
EITC Increase -8.8 -14.5 -4.1 -13.0 -4.5
Minimum Wage Increase -4.0 -2.6 -1.7 -2.9 -5.1
Child Care Subsidy Expansion -3.1 -4.2 -2.4 -1.5 -3.3
CDCTC Increase -1.3 -0.5 -1.6 -1.5 -0.4
Child Support Pass-Through Requirement -0.8 -0.7 -1.8 -0.6 -0.2
National NY FL TX CA
Table A3.5 Comparison of Child SPM Poverty Impacts at the National level and in New York, Florida, Texas, and California

C H I L D R E N ’ S D E F E N S E F U N D46
State EITC CDCTC Child Care Child Support Minimum (% of federal Child Tax (% of federal Subsidy Income Passed ThroughWage credit) Credit credit) Limit (% of FPL) and Disregarded
Alabama 128%Alaska $7.75 274 $50Arizona 8.05 163Arkansas 7.50 20% (r) 150California 9.00 ≤$326/child 34-50% 213 $50Colorado 8.23 10% (r) ≤30% of federal credit (r) 10-50% (r) 128-305Connecticut 9.15 30% (r) 219 $50Delaware 7.75 20% 50% 197 $50+child. sup. suppl. District of Columbia 9.50 40% (r) 32% 231 $150Florida 8.05 148Georgia 5.15 30% 142 Unmet needHawaii 7.75 15-25%* (r) 238Idaho 7.25 128Illinois 8.25 10% (r) 183 $50Indiana 7.25 9% (r) 125Iowa 7.25 15% (r) 30-75% (r) 143Kansas 7.25 17% (r) Yes 183Kentucky 7.25 20% 94Louisiana 3.5% (r) 10-50% (r) 154Maine 7.50 5% 25-50% (r) 247 $50+unmet needMaryland 8.00 25%/50% (pr) ≤32.5% 152Massachusetts 9.00 15% (r) 218 $50Michigan 8.15 6% (r) 121Minnesota 8.00 25-45% (r) ≤100% (r) 174 All/none**Mississippi 177Missouri 7.65 121Montana 8.05 145Nebraska 8.00 10% (r) 25-100% (r) 123Nevada 8.25 128New Hampshire 7.25 247New Jersey 8.38 20% (r) 197 $100New Mexico 7.50 10% (r) 40%* (r) 197 $100New York 8.75 30% (r) ≤$100/ch.+ $350 (r) 20-110% (r) 197 $100-$200North Carolina 7.25 $100/child<17 213North Dakota 7.25 298Ohio 8.10 10% ≤100% 123Oklahoma 7.25 5% (r) 5% of federal credit 20% 177Oregon 9.25 8% (r) ≤30% 185 $50/child up to $200Pennsylvania 7.25 197 $100-$200Rhode Island 9.00 25% (pr) 25% 178 $50South Carolina 7%* 148 Unmet needSouth Dakota 8.50 180Tennessee 163 Unmet needTexas 7.25 173-241 <=$75/none**Utah 7.25 174Vermont 9.15 32% (r) 24-50% (r) 197 All/$50**Virginia 7.25 20% *** 148-247 $100Washington 9.47 (10% (r)) 197West Virginia 8.00 145 $100-$200Wisconsin 7.25 4%/11%/34% (r) 183 75% of CSPWyoming 5.15 185
Minimum wage as of January 2015. For EITC (r) indicates a refundable credit; (pr) a partially refundable credit. Washington’s EITC was approved in 2008 but
has not yet been funded. Wisconsin EITC differs for 1, 2 or 3+ children. FPL=federal poverty level. *as a percent of expenses. *** Virginia does not have a state
CDCTC but it does have a deduction for child care expenses equal to the amount on which the federal CDCTC is based. **Minnesota does not disregard any
pass through amount; Vermont disregards only $50. Texas adds up to $75 to the TANF payment but does not consider this a pass through; none of it is disregarded.
New York, Pennsylvania, and West Virginia pass through and disregard up to $100 for one child and $200 for more than 1 child. CSP=child support payment.
Appendix 4. State Policies Related to Report Recommendations

E N D I N G C H I L D P O V E R T Y N O W 47
CHAPTER 11 UNICEF Office of Research. 2013. “Child Well-being in Rich Countries: A Comparative Review.” Innocenti Report Card 11. http://www.unicef-irc.org/Report-Card-11/.
2 The Future of Children. 2014. “Helping Parents, Helping Children: Two-Generation Mechanisms.” Executive Summary. Vol. 24, No. 1. http://future-ofchildren.org/futureofchildren/publications/docs/24_01_Exec_Summary.pdf.
3 Hart, B. & Risley, T.R. 2003. “The Early Catastrophe:The 30 Million WordGap by Age 3” American Educator, pp.4-9.http://www.aft.org//sites/default/files/periodicals/TheEarlyCatastrophe.pdf.
4 O’Donnell, K., & Mulligan, G. Aug. 2008. “Parents’ Report of the SchoolReadiness of Young Children from the National Household Education SurveysProgram of 2007.” National Center for Education Statistics. First Lookhttp://nces.ed.gov/pubs2008/2008051.pdf.
5 Halle,T., Forry, N., Hair, E., Perper, K., Wandner, L., Wessel, J. & Vick, J.(June 2009) Executive Summary “Disparities in Early Learning andDevelopment: Lessons from the Early Childhood Longitudinal Study- BirthCohort (ECLS-B)” Child Trends. http://www.childtrends.org/wp-content/uploads/2013/05/2009-52DisparitiesELExecSumm.pdf.
6 Center on the Developing Child. Harvard University.http://developingchild.harvard.edu/key_concepts/toxic_stress_response/; Greg Duncan and Brooks-Gunn, Jeanne. 1997. Consequences of Growing upPoor. New York: Russell-Sage; Brooks-Gunn, Jeanne and Greg Duncan. 1997.“The Effects of Poverty on Children.” The Future of Children 7(2); andDuncan, Greg, W. Jean Yeung, Jeanne Brooks-Gunn, and Judith Smith. 1998.“How Much Does Childhood Poverty Affect the Life Chances of Children?”American Sociological Review 63(3): 406–23.
7 Coleman-Jensen, Alisha, Christian Gregory, and Anita Singh. HouseholdFood Security in the United States in 2013, ERR-173, U.S. Department ofAgriculture, Economic Research Service, September 2014. Table 3.http://www.ers.usda.gov/media/1565415/err173.pdf.
8 Cook, John and Karen Jeng. 2009. “Child Food Insecurity: The EconomicImpact on our Nation.” Feeding America.http://feedingamerica.org/SiteFiles/child-economy-study.pdf.
9 Mach, A.L. & Rapaport, C. Feb. 2012. “Health Insurance Coverage ofChildren.” Washington DC: Congressional Research Service.http://www.kidswellcampaign.org/docs/other-resources/health-insurance-coverage-of-children-2010.pdf?Status=Master.
10 Bloom B, Jones LI, Freeman G. 2013. “Summary health statistics for U.S.children: National Health Interview Survey, 2012.” National Center for HealthStatistics. Vital Health Stat 10(258). http://www.cdc.gov/nchs/data/series/sr_10/sr10_258.pdf.
11 Felliti, V.J., R.F. Anda, D. Nordenberg, D.F. Williamson, A.M. Spitz, V.Edwards, M.P. Moss and J.S. Marks. “Relationship of childhood abuse andhousehold dysfunction to many of the leading causes of death in adults. TheAdverse Childhood Experiences (ACE) Study.” Am J Prev Med. 1998 May;14(4):245-58. http://www.ncbi.nlm.nih.gov/pubmed/9635069?dopt=Abstract.
12 Ratcliffe Caroline and Signe-Mary McKernan. 2012. “Child Poverty and its Lasting Consequence.” Washington, DC: Urban Institute.http://www.urban.org/publications/412659.html.
13 Wagmiller Jr. Robert and Robert Adelman. 2009. “Children andIntergenerational Poverty: The Long-Term Consequences of Growing up Poor.”National Center for Children in Poverty.
14 Holzer, Harry, Diane Whitmore Schanzenbach, Greg J. Duncan, and JensLudwig. 2007. “The Economic Costs of Poverty: Subsequent Effects ofChildren Growing Up Poor.” Washington, DC: Center for American Progress.http://www.americanprogress.org/issues/2007/01/poverty_report.html.
15 Duncan, Greg, Ariel Kalil, Kathleen Ziol-Guest. Feb. 2008. “EconomicCosts of Early Childhood Poverty.” Issue Paper # 4, Partnership for America’sEconomic Success.
16 U.S. Census Bureau, Current Population Survey, Annual Social andEconomic Supplements, Historical Table 3. “Poverty Status of People, by Age,Race, and Hispanic Origin.” http://www.census.gov/hhes/www/poverty/data/his-torical/people.html
17 Wimer C, Fox L, Garfinkel I, Kaushal N, & Waldfogel J. “Trends in Povertywith an Anchored Supplemental Poverty Measure,” Columbia PopulationResearch Center, December 5, 2013.
18 Waldfogel, Jane. 2010. “Tackling Child Poverty & Improving Child Well-Being. Lessons from Britain.” First Focus and Foundation for ChildDevelopment.
19 Hunter Schwarz. August 26 2014. “If Britain were a U.S. state, it wouldbe the second-poorest, behind Alabama and before Mississippi” WashingtonPost. http://www.washingtonpost.com/blogs/govbeat/wp/2014/08/26/if-the-U.K.-was-a-u-s-state-it-would-be-the-second-poorest-behind-alabama-and-before-mississippi/.
20 Marr, C., Huang, C., & Sherman, A. 2014. “Earned Income Tax CreditPromotes Work, Encourages Children’s Success at School, Research Finds.”Center on Budget and Policy Priorities. http://www.cbpp.org/cms/index.cfm?fa=view&id=3793.
21 Greg Duncan, Kathleen Ziol-Guest, and Ariel Kalil. Jan/Feb 2010. “Early-Childhood Poverty and Adult Attainment, Behavior, and Health.” Child Development: pp. 306-325.
22 Sherman, A., Parrott, S., & Trisi, D. 2014. “Chart Book: The War onPoverty at 50, Section 3.” Center on Budget and Policy Priorities. Retrievedfrom http://www.cbpp.org/cms/index.cfm?fa=view&id=4073.
CHAPTER 21 U.S. Census Bureau, Current Population Survey, 2014 Annual Social and Economic Supplement, Table POV13 “Related Children by Number of Working Family Members and Family Structure”, http://www.census.gov/hhes/www/cpstables/032014/pov/pov13_100_1.xls.
2 Center on Budget and Policy Priorities. October 17, 2014. “New PovertyFigures Show Impact of Working-Family Tax Credits,” http://www.offthecharts-blog.org/new-poverty-figures-show-impact-of-working-family-tax-credits/.
3 Fischer, Will and Barbara Sard. 2013. “Chart Book: Federal HousingSpending is Poorly Matched to Need.” Washington, DC: Center for Budget andPolicy Priorities.
4 Center on Budget and Policy Priorities, October 17, 2014, op. cit.
5 Center for Budget and Policy Priorities. 2014. “Policy Basics: The Earned Income Tax Credit.” Washington DC,http://www.cbpp.org/cms/?fa=view&id=2505.
6 The Urban Institute assumed a roughly $1,000 increase in the maximumcredit would encourage enough single family heads to begin to work to lead toa 3.6 percentage point increase in the employment to population ratio for singlefamily heads, following the empirical results from Grogger, Jeffrey. 2003. “TheEffects of Time Limits, the EITC, and Other Policy Changes on Welfare Use,Work, and Income among Female-Headed Families.” The Review of Economicsand Statistics 85(2): 394-408. Individuals simulated to take new jobs wereassigned full-year jobs at the minimum wage, with work hours based on thecharacteristics of jobs held by workers in SPM poverty in the 2010 baseline
7 Technically this is based on tax units, however, tax units are similar enoughto families that we use the term families throughout the report when discussingthe impact of tax policy changes.
8 A large share of the shortfall is attributable to the fact that TRIM3 does notmodel noncompliance with EITC rules. The Department of Treasury estimatesthat $15.3–$18.4 billion in EITC payments were issued improperly in 2010,representing a large share of the $22.3 billion TRIM3 shortfall. Other possibleexplanations are that the model does not allocate children within complex house-holds so as to maximize tax benefits and does not capture the fact that somesurvey-reported earnings are non-taxable (thereby lowering earnings sufficient-ly for a tax unit to be eligible for the EITC).
9 Cost estimates in this report are net costs (or revenues) to the federal andstate governments based on changes in SSI, TANF, SNAP, UI, public/subsidizedhousing, LIHEAP, WIC, CCDF benefits paid to recipient and changes in tax liabilitiesand credits. The majority of costs are federal; however, state costs for UI, SSI,TANF, and CCDF are also included, as well as state tax liabilities and credits.Costs do not include any administrative costs and are in 2010 dollars.
10 U.S. Census Bureau, op. cit.
11 Cooper, David. Oct 2014. “Raising the Federal Minimum Wage to $10.10Would Save Safety Net Programs Billions and Help Ensure Businesses Are DoingTheir Fair Share.” Washington, DC: Economic Policy Institute Issue Brief #387.http://www.epi.org/publication/safety-net-savings-from-raising-minimum-wage/.
12 Ibid.
Endnotes

C H I L D R E N ’ S D E F E N S E F U N D48
13 Congressional Budget Office. 2014. “The Effects of a Minimum-WageIncrease on Employment and Family Income.” Washington, DC: CongressionalBudget Office.
14 Workers with wages as low as one dollar below the old minimum ($6.25)and as high as one dollar above the new minimum ($10.30) were assumed toreceive proportional wage adjustments, with those closest to $7.25 and $9.30receiving the largest adjustments.
15 The probability of a worker losing her or his job was estimated to be sixpercent of the change in wages.
16 This ensures that the earnings of a full-time, year-round minimum-wageworker are at approximately the same percentage of poverty in the 2010-basedanalysis as would be the case if the $10.10/$7.07 minimum wage was implemented in 2014.
17 Among all workers (with and without children) 27.6 million would experience increases in earnings of $1,644 on average and 255,000 wouldlose their jobs.
18 In aggregate, 31 percent of new earnings would be offset by increasedtaxes and 3 percent by decreased benefits.
19 This estimate is based only on earnings, taxes and benefits changes for thosewho received a wage increase or lost their job as a result of the minimumwage increase. It does not include any cost/revenue changes resulting from secondary impacts of the minimum wage such as changes to businessrevenues that could impact corporate tax revenues.
20 LaDonna Pavetti. 2014 “Subsidized Jobs: Providing Paid EmploymentOpportunities When the Labor Market Fails.” Washington, DC: Center ofBudget and Policy Priorities. http://www.pathtofullemployment.org/wp-content/uploads/2014/04/pavetti.pdf.
21 Ibid.
22 For simplicity, the analysis assumed that all participants renewed after the4 weeks searching for employment although that is unlikely to be the case.This resulted in a total of 48 weeks of subsidized employment for the year forthose selected to participate in the program.
23 This is higher than take-up rates seen for prior transitional and subsidizedjob programs, which ranged from seven to 15 percent. However, take-up rates in prior programs were constrained by limited funding. Further, giventhat the simulated program would be a national program that might be able togain wide visibility, at take-up rate of 25 percent seems attainable.
24 Child Care Aware of America. 2014. “Parents and the High Cost of ChildCare 2014 Report”, http://www.usa.childcareaware.org/costofcare.
25 Hannah Matthews and Schmit, Stephanie. February 2014. “Child CareAssistance Spending and Participation in 2012.” Washington DC: Center forLaw and Social Policy.
26 Office of the Assistant Secretary of Planning and Evaluation. 2012. “ASPEIssue Brief: Estimates of Child Care Eligibility and Receipt for Fiscal Year2009” Washington DC: Department of Health and Human Services.
27 A 10 percent decrease in the cost of child care was estimated to increaseemployment by 3 percent based on Blau, David. 2003. “Child Care SubsidyPrograms.” In Means-Tested Transfer Programs in the United States, Robert A.Moffitt, ed. Chicago: University of Chicago Press. http://www.nber.org/chapters/c10260; Ziliak, James, Charles Hokayem, and Bradley Hardy. 2008. “Child CareSubsidies and the Economic Well-Being of Recipient Families: A Survey andImplications for Kentucky.” University of Kentucky Center for Poverty Research.http://www.ukcpr.org/Publications/ChildCareSubsidies.pdf. Families who began workwere assigned jobs at minimum wage with hours based on the characteristicsof jobs held by workers in SPM poverty in the 2010 baseline data.
28 This could have led to an underestimate in the number of families whowould actually avail themselves of a subsidy if it were available since somefamilies currently using unpaid care might opt for paid care if a subsidy wereavailable. To estimate the amount that families would pay for new subsidies(the family’s co-payment) and the total value of the subsidy, families wereassigned a type of child care based on family characteristics and wereassumed to find care at the maximum rate paid by their state. Costs couldtherefore have been overestimated.
29 Urban Institute and Brookings Institution Tax Policy Center. “Quick Facts: Child and Dependent Care Tax Credit (CDCTC)”, http://www.taxpolicycenter.org/press/quickfacts_cdctc.cfm
30 Ibid.
31 A parent’s probability of taking a job was assumed to be 0.3 times the percentage reduction in the cost of child care. Since these are parents whoare not currently working (and not currently using child care), the UrbanInstitute used imputation equations to estimate if they would pay for childcare and if so, how much. They also assumed that there would be no increasein funding for CCDF subsidies to accompany the CDCTC increase, meaning nonew families would receive child care subsidies.
32 United States Department of Agriculture, Food and Nutrition Service.2014. “Characteristics of Supplemental Nutrition Assistance ProgramHouseholds: Fiscal Year 2012.” Table 3.4. http://www.fns.usda.gov/sites/default/files/2012Characteristics.pdf; and Children’s Defense Fund calculationsbased on Short, Kathleen. 2014. “The Supplemental Poverty Measure:2013.” Washington, DC: U.S. Census Bureau, Current Population Reports.http://www.census.gov/content/dam/Census/library/publications/2014/demo/p60-251.pdf.
33 Center on Budget and Policy Priorities. “Policy Basics: Introduction to theSupplemental Nutrition Assistance Program (SNAP),” updated June 4, 2014,http://www.cbpp.org/cms/index.cfm?fa=view&id=2226; and Institute ofMedicine. Jan 2013. “Supplemental Nutrition Assistance Program – Examingthe Evidence to Define Benefit Adequacy;” and Hartline-Grafton, Heather andJames Weill. 2012. “Replacing the Thrifty Food Plan in Order to ProvideAdequate Allotments for SNAP Beneficiaries.” Washington, DC: Food Researchand Action Center.
34 Coleman-Jensen, Alisha, Christian Gregory, and Anita Singh. HouseholdFood Security in the United States in 2013, ERR-173, U.S. Department ofAgriculture, Economic Research Service, September 2014, Table 8,http://www.ers.usda.gov/media/1565415/err173.pdf.
35 Because households that receive less than the maximum benefit receivedthe same fixed dollar increase, the increase to average benefits was larger inpercentage terms and equal to approximately 20 percent, according to theCenter of Budget and Policy Priorities (Stacy Dean and Dottie Rosenbaum,Aug 2013, “SNAP Benefits Will Be Cut for Neatly All Participants inNovember 2013”, http://www.cbpp.org/cms/?fa=view&id=3899.)
36 The Urban Institute simulated the SNAP benefit increase by increasing the2010 maximum allotments (including the ARRA increase) by the percentageby which the Low-Cost Food Plan exceeds the Thrifty Food Plan for a refer-ence family type. This resulted in benefit levels that are somewhat higher thanwould be paid under the Low-Cost Food Plan without the ARRA boost but thatreflect a 30 percent increase over the actual values in 2010.
37 Center on Budget and Policy Priorities, October 17, 2014, op. cit.
38 $16,333 - $3,000 = $3,333; 15 percent of $3,333 = $2,000.
39 Urban Institute and Brookings Institution Tax Policy Center. “Taxation andthe Family: What is the child tax credit,” http://www.taxpolicycenter.org/brief-ing-book/key-elements/family/ctc.cfm.
40 National Center for Homeless Education. 2014. “Education for HomelessChildren and Youth: Consolidated State Performance Report Data”http://center.serve.org/nche/downloads/data-comp-1011-1213.pdf.
41 United States Department of Housing and Urban Development. 2013.“Worst Case Housing Needs 2011: Report to Congress.”http://www.huduser.org/portal//Publications/pdf/HUD-506_WorstCase2011.pdf.Worst case housing needs are renters with incomes below half the local medi-an receiving no housing assistance and either paying more than half of theirincome for rent and utilities or living in severely substandard housing or both.
42 Marci McCoy-Roth, Bonnie B. Mackintosh and David Murphey, Feb 2012, “When the Bough Breaks: The Effects of Homelessness on YoungChildren,” Child Trends, Early Childhood Highlights, Volume 3, Issue 1.http://www.childtrends.org/?publications=when-the-bough-breaks-the-effects-of-homelessness-on-young-children. National Center on Family Homelessness.2011. “America’s Youngest Outcasts 2010.” http://www.homelesschil-drenamerica.org/media/NCFH_AmericaOutcast2010_web.pdf.
43 Fischer, Will and Barbara Sard. 2013. Op. cit.
44 Ibid.
45 This differs in two ways from current housing voucher program policies.Under current policies, households are eligible if their income is less than orequal to half of the area median income (AMI). Since the AMI varies acrossthe country, the income limit for the proposed expansion could be higher orlower than the regular program’s income limit depending on the area of thecountry. In addition, the analysis included a rent burden test, requiring thatthe fair market rent exceed 50 percent of families’ income, in order to target
Endnotes

E N D I N G C H I L D P O V E R T Y N O W 49
vouchers to families with the highest need. Most Public Housing Authoritiesdo not use such a test.
46 Finkel, Meryl and Larry Buron. 2001. “Study on Section 8 VoucherSuccess Rates: Volume I Quantitative Study of Success Rates in MetropolitanAreas.” Washington, DC: U.S. Department of Housing and UrbanDevelopment, Office of Policy Development and Research.
47 National Conference of State Legislatures. “Child Support Homepage”http://www.ncsl.org/issues-research/human-services/child-support-homepage.aspx; Short, Kathleen S. 2013. “The Research SupplementalPoverty Measure: 2012.” Washington, DC: U.S. Census Bureau.
48 Huber, Erika, David Kassabian, and Elissa Cohen. Sept 2014. “WelfareRules Databook: State TANF Policies as of July 2013.” OPRE Report 2014-52. Washington, DC: Office of Planning, Research and Evaluation,Administration for Children and Families, U.S. Department of Health andHuman Services. http://www.acf.hhs.gov/programs/opre/resource/welfare-rules-databook-state-tanf-policies-as-of-july-2013, Table IV.A.2. “Treatment of ChildSupport Income for Recipients, July 2013.”
49 The geographic adjustments can have substantial impacts on the SPMthresholds. For example, the threshold for a four-person, two-child family thatrents its home is $21,730 in Fort Wayne, Indiana and $30,925 in LosAngeles, California.
50 The maintenance of TRIM3 is funded by the Department of Health andHuman Services, Office of the Assistant Secretary for Planning and Evaluation(HHS/ASPE). HHS/ASPE holds the copyright. TRIM3 requires users to inputassumptions and/or interpretations about economic behavior and the rules governing federal programs. Therefore, the conclusions drawn from the simulations are attributable only to the authors of the report.
51 U.S. Census Bureau, Current Population Survey, 2014 and 2013 AnnualSocial and Economic Supplements, Table POV01.
52 The Making Work Pay Credit provided $400 to virtually all lower and middle-income employed individual taxpayers ($800 to couples). Removingthis temporary credit increased the child SPM by 0.7 percentage points (from 13.9 to 14.6 percent).
53 Linda Giannarelli, Kye Lippold, Sarah Minton, and Laura Wheaton. Jan.2015. “Reducing Child Poverty in the US: Costs and Impacts of PoliciesProposed by the Children’s Defense Fund.” Washington, DC: Urban Institute.
CHAPTER 31 The minimum wage would lead to job losses.
2 These cost estimates are net costs (or revenues) to the federal and state governments based on changes in SSI, TANF, SNAP, UI, public/ subsidized housing,LIHEAP, WIC, CCDF benefits paid to recipient and changes in tax liabilitiesand credits. The majority of costs are federal however state costs for UI, SSI,TANF, and CCDF are also included, as well as state tax liabilities and credits.Costs do not include any administrative costs and are in 2010 dollars.
3 White House Office of Management and Budget, Historical Tables, Table 1.1Summary of Receipts, Outlays, and Surpluses or Deficits: 1789-2019,http://www.whitehouse.gov/sites/default/files/omb/budget/fy2015/assets/hist01z1.xls, accessed Sept 2, 2014; and U.S. GDP in 2010 = $14,958.3 billion,World Bank World Development Indicators http://data.worldbank.org/indicator/NY.GDP.MKTP.CD, accessed Sept 2, 2014.
4 National Priorities Project. 2014. “Voter Guide 2014: Overseas ContingencyOperations (War Funding)” https://media.nationalpriorities.org/uploads/warspendingvg.pdf.
5 Phillips, Richard, Steve Wamhoff, and Dan Smith. June 2014. “OffshoreShell Games 2014: The Use of Offshore Tax Havens by Fortune 500Companies.” Washington, DC: U.S. PIRG Education Fund and Citizens for TaxJustice. http://ctj.org/pdf/offshoreshell2014.pdf.
6 Citizens for Tax Justice. July 8 2014. “Addressing the need for more federalrevenue.” http://www.taxjusticeblog.org/archive/2014/07/new_report_addressing_the_need_1.php#.VDQpVBa1Z8N.
7 Americans for Tax Fairness and National Women’s Law Center. May 2014.“A Good Starting Point: 23 Options from Rep. Dave Camp for Closing TaxLoopholes.” http://www.americansfortaxfairness.org/2014/05/06/tax-fairness-coalition-finds-points-of-agreement-with-house-republican-tax-reform-plan/.
8 Holland, Steve and David Alexander. Dec. 19, 2014. “Obama signs nearly$578 billion defense bill for fiscal 2015.” Reuters. http://www.reuters.com/article/2014/12/19/us-usa-defense-obama-idUSKBN0JX2IM20141219.
9 Fallows, James. Jan/Feb 2015. “The Tragedy of the American Military.” The Atlantic. http://www.theatlantic.com/features/archive/2014/12/the-tragedy-of-the-american-military/383516/.
10 Center for American Progress. June 17, 2013. “Priorities for Progressive,Pro-Growth Corporate Tax Reform.” http://www.americanprogress.org/issues/tax-reform/report/2013/06/17/66645/priorities-for-progressive-pro-growth-corpo-rate-tax-reform/.
11 Citizens for Tax Justice, July 8 2014, op. cit.
12 Harry Stein, Alexandra Thornton, and John Craig. September 2014. “TheGrowing Consensus to Improve our Tax Code.” Center for American Progress:Washington, DC. This is for eliminating the exception for performance-basedcompensation and applying the limit to all employees not just top executives.
13 Americans for Tax Fairness and National Women’s Law Center, May 2014,op. cit. This refers to repealing the last-in, first-out (LIFO) method of inventory($79.1 billion over 10 years), repealing the lower of cost or market method ofinventory ($3.8b/10), limiting the net operating cost deduction ($70.5b/10),repealing/modifying the like-kind exchange rule ($40.9b/10), amortizing certainadvertising expenses ($169b/10), amortizing research and experimentationexpenses ($192.6b/10), limiting the use of the cash method of accounting($23.6b/10), and repealing the deduction for local lobbying expenses($0.6b/10).
14 President’s Budget FY2015, Tables of Revenue Estimates, http://www.treasury.gov/resource-center/tax-policy/Documents/General-Explanations-FY2015-Tables.pdf.
15 Americans for Tax Fairness and National Women’s Law Center. August2013. The High Price of Tax Loopholes.http://www.americansfortaxfairness.org/tax-tradeoffs/.
16 President’s Budget FY2015, op. cit.
17 Americans for Tax Fairness and National Women’s Law Center, op. cit.
18 Stein et al., op. cit.
19 Americans for Tax Fairness and National Women’s Law Center, op. cit.
20 Americans for Tax Fairness and National Women’s Law Center, op. cit.
21 Committee for Responsible Federal Budget. Nov 8, 2013. “The SenateDemocrats’ list of tax breaks to axe.” http://crfb.org/blogs/senate-democrats-list-tax-breaks-axe.
22 Sawhill, Isabel and Quentin Karpilow. 2014. “Raising the Minimum Wage andRedesigning the EITC.” Center on Children and Families at the Brookings Institute.http://www.brookings.edu/~/media/research/files/papers/2014/01/30%20rais-ing%20minimum%20wage%20redesigning%20eitc%20sawhill/.
23 Passel, Jeffrey S., and D’Vera Cohn. 2011. “Unauthorized ImmigrantPopulation: National and State Trends 2010”. Washington, DC: Pew ResearchHispanic Trends Project.
CHAPTER 41Unicef, op. cit.
APPENDIX 4Minimum wage: U.S. Department of Labor, “Minimum Wage Laws in theStates – January 1, 2015,”http://www.dol.gov/whd/minwage/america.htm#content.
EITC: Tax Policy Center. 2014. State EITC Based on Federal EITC Tax Year2014. Urban Institute and Brookings Institute.http://www.taxpolicycenter.org/taxfacts/displayafact.cfm?Docid=293; and TaxCredits for Working Families, “States with EITCs,” http://www.taxcreditsfor-workingfamilies.org/earned-income-tax-credit/states-with-eitcs/.
CTC: Tax Credits for Working Families, “States with CTCs,” http://www.taxcred-itsforworkingfamilies.org/earned-income-tax-credit/states-with-eitcs/.
CDCTC: Tax Credits for Working Families, “States with CDCTCs,”http://www.taxcreditsforworkingfamilies.org/child-and-dependent-care-tax-credit/states-child-dependent-care-tax-credits/.
Child care subsidy income limit: National Women's Law Center. 2014. Turningthe Corner: State Child Care Assistance Policies 2014. http://www.nwlc.org/sites/default/files/pdfs/nwlc_2014statechildcareassistancereport-final.pdf.
Child support pass-through: Urban Institute. 2014. Welfare Rules Databook:State TANF Policies as of July 2013. http://anfdata.urban.org/databooks/Welfare%20Rules%20Databook%202013.pdf.
Endnotes

25 E Street, NW, Washington, DC 20001 (202) 628-8787 1 (800) 233-1200 www.childrensdefense.org