endeavour mining management presentation - denver … · endeavour mining management presentation...
TRANSCRIPT

INTERMEDIATE GOLD PRODUCER DELIVERING PROFITABILTY
Endeavour Mining
Management Presentation
April 2015

Disclaimer & Forward Looking Statements
INTERMEDIATE GOLD PRODUCER DELIVERING PROFITABILITY 2
This presentation contains “forward-looking statements” including
but not limited to, statements with respect to Endeavour’s plans
and operating performance, the estimation of mineral reserves
and resources, the timing and amount of estimated future
production, costs of future production, future capital expenditures,
and the success of exploration activities. Generally, these
forward-looking statements can be identified by the use of
forward-looking terminology such as “expects”, “expected”,
“budgeted”, “forecasts” and “anticipates”. Forward-looking
statements, while based on management’s best estimates and
assumptions, are subject to risks and uncertainties that may
cause actual results to be materially different from those
expressed or implied by such forward-looking statements,
including but not limited to: risks related to the successful
integration of acquisitions; risks related
to international operations; risks related to general economic
conditions and credit availability, actual results of current exploration
activities, unanticipated reclamation expenses; changes in project
parameters as plans continue to be refined; fluctuations in prices
of metals including gold; fluctuations in foreign currency exchange
rates, increases in market prices of mining consumables, possible
variations in ore reserves, grade or recovery rates; failure of
plant, equipment or processes to operate as anticipated;
accidents, labour disputes, title disputes, claims and limitations on
insurance coverage and other risks of the mining industry; delays
in the completion of development or construction activities,
changes in national and local government regulation of mining
operations, tax rules and regulations, and political and economic
developments in countries in which Endeavour operates.
Although Endeavour has attempted to identify important factors
that could cause actual results to differ materially from those
contained in forward-looking statements, there may be other
factors that cause results not to be as anticipated, estimated or
intended. There can be no assurance that such statements will
prove to be accurate, as actual results and future events could
differ materially from those anticipated in such statements.
Accordingly, readers should not place undue reliance on forward-
looking statements. Please refer to Endeavour’s most recent
Annual Information Form filed under its profile at www.sedar.com
for further information respecting the risks affecting Endeavour
and its business.

3
Business Overview
• A Canadian-based intermediate gold producer
– 4 producing mines across 4 West African countries
– Fully permitted and internally financed Houndé project
• Leading West African producer
– 2015E production of ~500,000 ozs
– Q1 2015 production of 124,000 ozs
– AISC/oz in mid-US$900 range
• Focused on
– Maximizing operating cash flow and profits
– Extending mine lives by adding reserves & resources
– Using free cash flow to repay debt
EDV EVR EDVMF
INTERMEDIATE GOLD PRODUCER DELIVERING PROFITABILITY

4
Investment Case
INTERMEDIATE GOLD PRODUCER DELIVERING PROFITABILITY
AISC/oz has declined from $1,137 in 2013 to under $1,000 in Q3+Q4 2014
2014 Exploration additions of 870,000 ozs at low cost
of $33/oz at mines and $13/oz at Houndé
Updated Houndé Feb 2015 +34% reserves to 2.1 Mozs
IRR of 31% at $1,250/oz
Extended credit facility to March 2020, ~3.5 years to first required repayment
Built Agbaou Mine under-budget and ahead of schedule
Exceeded 2014 production guidance and achieved AISC/oz cost guidance
2P Reserves increased to 4.5Mozs (Dec 2014) from
3.0Mozs (Dec 2012)
Track record of reducing costs and
generating cash flow at current gold prices
Demonstrated exploration successes that have
increased reserves and extended mine lives
Experienced management team with successful operating and project
delivery
Significant growth potential from attractive low-cost
Houndé project
Attractive valuation compared to fundamental value
and peers
Market Cap: US$200M
Enterprise Value: US$417M

5
Leading Intermediate Producer in West Africa
INTERMEDIATE GOLD PRODUCER DELIVERING PROFITABILITY
Based on Company reports. AngloGold Ashanti and IAMGOLD presented on an attributable ounce basis for JV interests, West African gold production only.
Seniors
Intermediates & Junior Producers
2014 Gold Production – West Africa

6
With Near-term Production Growth
80,000 ozs
+700,000 ozs
Youga: 1st acquisition,
now a mature mine
Nzema: 2nd acquisition,
recapitalized
Tabakoto: 3rd acquisition, mill
expanded, converted to owner mining, improved mill feed
Agbaou: FS in 2012,
construction and start up in 2013, low-cost operations
Houndé: FS in 2013, fully
permitted, potential mid-2017 productionExpect to finance from cash flow,
corporate credit facility, and leasing of mining fleet
INTERMEDIATE GOLD PRODUCER DELIVERING PROFITABILITY

7
2015 AISC Guidance and Margin at $1,200/oz
INTERMEDIATE GOLD PRODUCER DELIVERING PROFITABILITY
• 2015 guidance of 475,000 to 500,000 ozs
at AISC/oz of $930 to $980
• At $1,200 gold, approx. $100 million of free
cash flow
2015 AISC Margin and Free Cashflow (US$ million, forecast)
Revenue $585
Less: AISC Costs ($930-$980/oz) 465
All-in sustaining margin (mid-guidance) 120
Add: 2015 fuel and FX cost savings 30 to 35
All-in sustaining margin (adjusted) 150 to 155
Non-sustaining capital: Kofi C and CRF plant 5
Non-sustaining exploration 15
Free cash flow (before tax & financing) $130 to 135
Less: Interest costs -22
Less: Tax -10
2015 Free cash flow Approx. $100

AISC/ounce – Cost trend versus Medium Producer AISC
8
Sustainable Low Operating and Corporate Costs
* Mid-point of 2015 AISC/oz guidance of $930-$980, including potential FX and fuel cost savings estimated at $30-$35 million1 Source: BMO Capital Markets – Gold Pages, 30 March 2015 – Medium Producers (production in 2014 >200kozs)2 Based on company reports; Corporate G&A & share-based compensation as percentage of gross revenue amd per ounce sold, 12 months ended December 31, 2014
2014 Corporate Efficiency Ratio2
Peer
G&A + share
comp as %
of gross
revenue
$ per
ounce sold ($/Au-eq oz)
Centamin 2.5% $31
Endeavour 3.9% $49
Acacia 4.4% $58
New Gold 4.5% $56
Centerra 4.6% $56
Golden Star 5.0% $63
Oceanagold 6.1% $79
Teranga 6.3% $80
SEMAFO 7.1% $90
Aurico 8.9% $114
Alamos 9.6% $122
Dundee Prec. 10.0% $136
Perseus 10.5% $122
B2Gold 11.1% $140
Primero 13.4% $167
INTERMEDIATE GOLD PRODUCER DELIVERING PROFITABILITY
$980
2015E Guidance
$930
2015E - Significant declines in
fuel costs and FX rates lead to
savings
• Fuel cost saving of ~$60/oz
at Tabakoto
• FX savings of ~$50/oz (all
production)
Combined 2015E cost savings
of $30 to $35 million

9
Maintaining an Efficient Capital Structure
• $300 million drawn on $350 million
credit facility (“RCF”)
• Significant headroom maintained
during Agbaou construction
• The RCF plus operating cash flow
and equipment leasing, provides
expectation to internally fund
Houndé construction
• Debt maturity is long-dated to
March 2020 with no repayment for
~3.5 years
• Regardless of comfortable debt
position, we will reduce debt
during 2015 from free cash flow
Note: Actual Leverage Ratio based on bank compliance certificate values, which include adjustments such that they may not agree with ratios calculated from Financial Statement values. Forecast Leverage Ratio based on Management projections.
Agbaouconstruction
period
INTERMEDIATE GOLD PRODUCER DELIVERING PROFITABILITY
Incl. Houndé and $1,250/oz
(Q1/2016 construction)
Without Houndé and $1,100/oz
PotentialHoundé
constructionperiod

10
Share Price Since 2013 and Subsequent Accomplishments
2013 Today
# of mines3 and building Agbaou mine
4
Houndé project
FS in progress, unpermitted
Fully permitted; 2P reserve 2.1 Mozs; 10 year mine life
Production 324,275 ozs 475 – 500,000 ozs
AISC/oz (US$) $1,137 < $1,000 in Q3+Q4 2014
2P Reserves 3.0Mozs at 2.5 g/t1 4.5Mozs at 2.3 g/t2
M&I Resources 7.8Mozs at 1.9 g/t1 7.9Mozs at 2.0 g/t2
Long-termdebt
$300M drawn,July 2018 maturity, first repay Jan 2016
$300M drawn,March 2020 maturity, first repay Sept 2018
Cash flowFunding major
capex programs2015 non-sustaining capex only$20m; free cash to reduce debt
Share price $0.56 (June 28 2013) $0.58
Issued shares 412.8 million 413.1 million
• Significant valuation gap created during 2013 gold price decline
• Since June 2013, Endeavour’s share price highly correlated to the
market (S&P TSX Global Gold Index shown)
• Market yet to recognize Endeavour’s growth and accomplishmentsMarket data sourced from Bloomberg LP, rebased to 100, last data point: March 31, 2015
1 As of Dec 31, 2012, M&I resources include 2P reserves2 As of Dec 31, 2014, M&I resources include 2P reserves
INTERMEDIATE GOLD PRODUCER DELIVERING PROFITABILITY

11
Growing Mineral Reserves
MINERAL RESERVES & RESOURCES1
As of: 2P Reserves Resources (M&I)
Dec 31, 2014 4.5Mozs at 2.3 g/t 7.9Mozs at 2.0 g/t
Dec 31, 2013 4.1Mozs at 2.3 g/t 7.2Mozs at 1.9 g/t
Dec 31, 2012 3.0Mozs at 2.5 g/t 7.8Mozs at 1.9 g/t
INTERMEDIATE GOLD PRODUCER DELIVERING PROFITABILITY
MINERAL RESERVES – Mining Depletion & Reserve Additions
• Added 2.3Mozs from 2013
• 2014 exploration program:
• $2.1M at Agbaou, exploration
additions almost all oxides
• $9.2M at Tabakoto, drilling
below development is
successfully upgrading
Inferred resources
• $6.7M at Houndé, 34%
increase in reserves at only
$13 per discovered ounce
• 2015 exploration program: $15M
focused at Agbaou and Tabakoto
1 Mineral Resources and Reserves available at www.endeavourmining.com/s/reserves.asp

12
Agbaou Mine – A construction and operating success story
• Demonstrated strong, sustained performance in 2014
− Produced 146,757 ozs
− Cash cost of $523/oz
− AISC of $621/oz
− Strong cash flow generator
• Successful resource definition program
– 2014 replaced mined ounces and extended life
– Expanded West pit and identified opportunity to
southwest
– Easy-milling oxides now 50% of reserves
– Successful 2014 exploration continues in 2015
INTERMEDIATE GOLD PRODUCER DELIVERING PROFITABILITY

13
Tabakoto Mine – Investment phase completed
• Three sources of lower cost ore
• New Kofi C open pit commenced
production in January 2015
• Tabakoto plant at sustainable levels above
4,000 tonnes per day
• Demonstrating potential for steady
replacement of reserves
− 2014 net gain in 2P reserves
− Drilling below development upgrading
Inferred resources
INTERMEDIATE GOLD PRODUCER DELIVERING PROFITABILITY
Kofi Property
Underground Mining Cost per Tonne Ore
Contract mining Owner mining
14
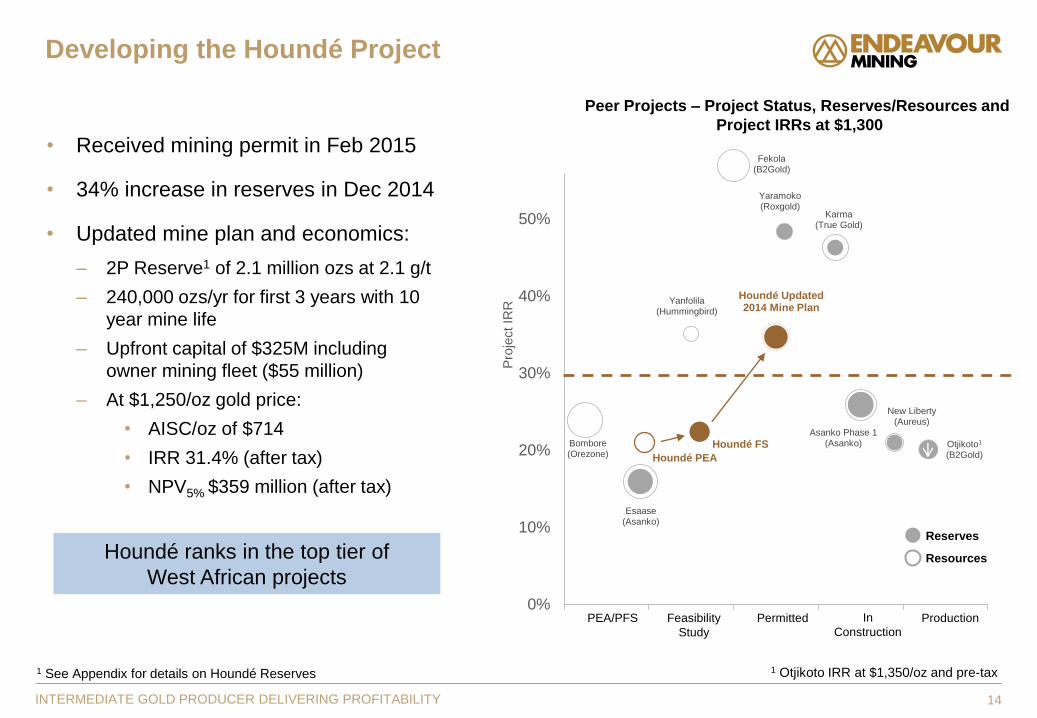
Developing the Houndé Project
• Received mining permit in Feb 2015
• 34% increase in reserves in Dec 2014
• Updated mine plan and economics:
– 2P Reserve1 of 2.1 million ozs at 2.1 g/t
– 240,000 ozs/yr for first 3 years with 10
year mine life
– Upfront capital of $325M including
owner mining fleet ($55 million)
– At $1,250/oz gold price:
• AISC/oz of $714
• IRR 31.4% (after tax)
• NPV5% $359 million (after tax)
1 See Appendix for details on Houndé Reserves
INTERMEDIATE GOLD PRODUCER DELIVERING PROFITABILITY
Houndé ranks in the top tier of
West African projects
Houndé Updated 2014 Mine Plan
Yaramoko(Roxgold)
Karma(True Gold)
Asanko Phase 1(Asanko)
New Liberty(Aureus)
Otjikoto1
(B2Gold)
Bombore(Orezone)
Esaase(Asanko)
Fekola(B2Gold)
Yanfolila (Hummingbird)
Houndé PEA
Houndé FS
0%
10%
20%
30%
40%
50%
60%
70%
Pro
ject IR
R
1 Otjikoto IRR at $1,350/oz and pre-tax
In
Construction
ProductionPermittedFeasibility
Study
PEA/PFS
Reserves
Resources
Peer Projects – Project Status, Reserves/Resources and
Project IRRs at $1,300

15
Current Valuation and Analyst Views
Analyst coverage sourced from
Bloomberg. Peel Hunt sourced by
author. This list is provided for
informational purposes only. The
opinions, estimates, forecasts or any
analysis do not represent opinions,
forecasts or analyses of Endeavour
Mining Corporation or its Management.
Endeavour Mining Corporation does not
by its reference above imply any
endorsement of or concurrence with
such opinions, estimates or forecasts.
AUD/CAD conversion rate of 1.00
Analyst Coverage (April 9, 2015)
BMO Capital Markets C$0.75
Canaccord Genuity C$1.00
CIBC World Markets C$1.70
Clarus Securities C$1.75
GMP Securities C$1.30
Haywood Securities C$1.30
Pareto Securities C$1.19
Patersons Securities A$0.88
Peel Hunt C$0.87
Raymond James C$1.00
UBS A$1.10
CONSENSUS PRICE OBJECTIVE C$1.17
INTERMEDIATE GOLD PRODUCER DELIVERING PROFITABILITY
Potential for
+100%
investment gains
Enterprise Value
Share price (April 1, 2015) C$0.61
Shares outstanding 413.1
Market capitalization1 (US$M) 200
Less: Cash2 62
Plus: Long-term debt2 300
Plus: Minority interest2 (21)
Enterprise value (US$M) 417
2014 EBITDA2 (US$M) 143
2014 AISC Margin2 (US$M) 117
EV / 2014 EBITDA 2.9 times
Peer average3 7.2 times
EV / 2P reserve ounce $93
Peer average3 $152
EV / resource ounce (M&I) $53
Peer average3 $131
1 CAD-USD exchange rate of 1.262 Cash, long-term debt, minority interest and adjusted EBITDA based on FY December 31, 2014 financial statements3 Source: BMO Capital Markets – Gold Pages, 30 March 2015 – Medium Producers (production in 2014 >200kozs)

• Produce 475,000 to 500,000 ounces
• Maintain AISC/oz improvements
• Q1 2015 at mid-point of $930-$980
• To extend mine life through exploration
success
• To be profitable
• Use free cash flow to reduce debt
16
Summary – Key objectives for 2015
INTERMEDIATE GOLD PRODUCER DELIVERING PROFITABILITY
Positioned for a value re-rating
Appendices
17
• 2015 Production and AISC/oz Guidance by Mine
• Board of Directors
• Management
• Endeavour’s Operating Mines – Summary Table
• FY 2014 Cash Cost Detail by Mine
• Resources and Reserves
• Company Profile
INTERMEDIATE GOLD PRODUCER DELIVERING PROFITABILITY

18
2015 Production and AISC/oz Guidance by Mine
INTERMEDIATE GOLD PRODUCER DELIVERING PROFITABILITY
Production
Guidance Range (ozs)
AISC/oz
Guidance Range ($/oz)
Agbaou 150,000 - 155,000 $690 - $740
Nzema 110,000 - 115,000 $1,000 - $1,050
Tabakoto 155,000 - 165,000 $950 - $1,000
Youga 60,000 - 65,000 $975 - $1,025
475,000 - 500,000 $883 - $933
Plus: Corporate G&A (~$18 million) $37
Plus: Exploration (sustaining) & Other (~$5 million) $10
$930 - $980

19
Board of Directors
Michael Beckett, Chairman
Former Chairman, Ashanti Goldfields and former MD, Consolidated Gold Fields
INTERMEDIATE GOLD PRODUCER DELIVERING PROFITABILITY
Frank Giustra
Founder: Wheaton River, Silver Wheaton and Pacific Rubiales; Former CEO, Yorkton Securities
Wayne McManus
Accounting professor: CPA, CFA, LLM in taxation
Neil Woodyer, CEO
Founded Endeavour in 1988; former mining banker/advisor
Ian Cockerill
Extensive African mining experience, Former CEO, Gold Fields
Ian Henderson
Former Managing Director and natural resources fund manager, JP Morgan
Miguel Rodriguez
Former President Venezuela Central Bank; former Governor of IMF, World Bank and IADB

20
Management
INTERMEDIATE GOLD PRODUCER DELIVERING PROFITABILITY
Neil Woodyer, CEO
• Founder of Endeavour, 30+ years experience in natural resources
• Project financed and advised on the acquisition of over 30 mines
Attie Roux, COO
• Built / commissioned Nzema processing plant
• 34 years as metallurgist at AngloGold
Ota Hally, CFO
• Chartered Accountant and Chartered Financial Analyst
• Previous experience with Pan American Silver
Doug Bowlby, EVP Corporate Development
• Chartered Financial Analyst with corporate finance and M&A background
• 19 years experience with mining transactions & growth plans
Doug Reddy, SVP Business Development
• Geologist with 30+ years exploration and mining experience
• Manages relationships with analysts and institutional investors
Jeremy Langford, EVP Construction Services
• Mechanical engineer with 10+ years experience
• Built Agbaou, Nzema and Sabodala gold mines
Richard Thomas, EVP Technical Services
• 20+ years experience in open pit and underground mining
• Previously VP Mining for Continental Africa for AngloGold

21
Endeavour’s Operating Mines – Summary Table
Agbaou Gold Mine
(85% Endeavour, 10% Côte
d’Ivoire, 5% SODEMI)
Nzema Gold Mine
(90% Endeavour, 10% Ghana)
Tabakoto Gold Mine
(80% Endeavour, 20% Mali)
(Kofi: 90% Endeavour, 10% Mali)
Youga Gold Mine
(90% Endeavour; 10% Burkina
Faso)
Resources
(incl. Reserves,
100%)
M&I: 13.9Mt @ 2.5 g/t for
1.109Moz
Inferred: 2.1Mt @ 2.3 g/t for
0.154Moz
M&I: 36.7Mt @ 1.3 g/t for
1.590Moz
Inferred: 7.6Mt @ 1.3 g/t for
0.311Moz
M&I: 19.0Mt @ 3.0 g/t for
1.839Moz
Inferred: 17.6Mt @ 2.8 g/t for
1.582Moz
Youga & Ouaré
M&I: 17.0Mt @ 1.5g/t for 0.812Moz
Inferred: 2.8Mt @ 1.6g/t for
0.141Moz
Reserves (100%) 11.5Mt @ 2.5 g/t for 0.926Moz 7.3Mt @ 2.1 g/t for 0.496Moz6.7Mt @ 3.7 g/t for 0.807Moz
(~65% U/G @ 3.9 g/t)3.5Mt @ 1.8g/t for 0.202Moz
Strip Ratio 8 to 1 (2015); 11 to 1 LOM 6.2 to 1 (2015); 5.6 to 1 LOM
Tabakoto & Segala U/G: N/A
Kofi B: 6 to 1 LOM
Kofi C: 10 to 1 LOM
4.0 to 1 (2015); 4.2 to 1 LOM
Processing RateUp to 2.2 Mtpa Gravity/CIL plant -
oxides; 1.6 Mtpa fresh ore 1.6 to 2.1 Mtpa Gravity/CIL plant 1.4 Mtpa Gravity/CIL plant 1.0 Mtpa Gravity/CIL plant
Met. RecoveryAchieving 97% at present; 92.5%
design91% to 75% depending on ore type 92% - 95% 94%
Production2014 – 146,757 ozs
2015e – 150,000 to 155,000 ozs
2013 – 103,464 ozs
2014 – 115,129 ozs
2015e – 110,000 to 115,000 ozs
2012 – 110,301 ozs
2013 – 125,231 ozs
2014 – 127,323 ozs
2015e – 155,000 to 165,000 ozs
2013 – 89,448 ozs
2014 – 76,561 ozs
2015e – 60,000 to 65,000 ozs
Cash Costs
($/oz)2014 – $523
2013 - $918
2014 - $880
2013 - $981
2014 - $1,172
2013 - $732
2014 - $742
All-in Sustaining
Costs
(Mine Level)
2014 – $621/oz
2015e $690 - $740/oz
2014 - $1,036/oz
2015e $1,000 - $1,050/oz
2014 – $1,335/oz
2015e $950 - $1,000/oz
2014 - $824/oz
2015e $975 - $1,025/oz
Expected Mine
Life7 years from current Reserves 5 years from current Reserves 5 years from current Reserves
2 years at current grade (potential
for 5 years with satellite deposits
and Ouaré)
Royalty 3% - 5% sliding scale 5% (+1% 3rd party at Adamus pits) 6% 3% - 5% sliding scale
Corporate Tax 25% (5 year corporate tax holiday) 35% 25% 17.5%
INTERMEDIATE GOLD PRODUCER DELIVERING PROFITABILITY

22
FY 2014 Cash Cost Detail by Mine
INTERMEDIATE GOLD PRODUCER DELIVERING PROFITABILITY
Agbaou Nzema Tabakoto Youga Total
Mining Physicals
Total tonnes mined - Open pit 000t 19,560 8,769 7,046 4,993
Total ore tonnes - Open pit 000t 2,741 1,366 638 1,161
Total ore tonnes - Underground 000t - - 807 -
Total tonnes milled 000t 2,241 1,587 1,485 991
Gold sold ozs 143,772 2 114,044 127,357 76,582 461,757
Unit cost analysis
Mining costs - Open pit1 $/t mined 2.61 4.56 4.55 4.98
Mining costs - Underground1 $/t ore - - 57.90 -
Processing and maintenance $/t milled 7.66 17.90 30.11 24.24
Site G&A $/t milled 3.84 7.87 17.62 10.88
Cash cost details
Mining costs - Open pit $000s $46,395 $34,821 $32,035 $24,887 $138,138
Mining costs - Underground $000s - - 40,956 - 40,956
Processing and maintenance $000s 17,175 28,410 44,696 24,022 114,303
Site G&A $000s 8,601 12,491 26,164 10,783 58,039
Purchased ore at Nzema $000s - 24,409 - - 24,409
Inventory adjustments $000s 2,999 231 5,376 (2,882) 5,725
Cash costs for ounces sold $000s $75,170 $100,362 $149,227 $56,810 $381,570
Royalties $000s $6,399 $8,014 $9,665 $4,229 $28,307
Sustaining capital $000s $7,650 $9,795 $11,078 $2,057 $30,580
Cash cost per ounce sold $/oz $523 $880 $1,172 $742 $826
Mine-level AISC per ounce sold $/oz $621 $1,036 $1,335 $824 $954
Other costs used to derive unit mining cost
Capitalized mining costs $000s $4,609 $5,147 $5,759 -
Numbers may not add due to rounding, 1Includes capitalized mining costs and partial year of lower cost owner-mining, 2 Excludes pre-commercial production

23
Mineral Reserves as at December 31, 2014
Mine / Project
Reserves
Proven Probable Proven & Probable Gold
Tonnes Grade Ounces Tonnes Grade Ounces Tonnes Grade Ounces Price
Mt g/t k Ozs Mt g/t k Ozs Mt g/t k Ozs US$/oz
Nzema1 - Total 5.2 2.0 339 2.1 2.3 156 7.3 2.1 496 US$ 1,350
Attributable - 90% 305 141 446
Youga2 - Total 2.5 1.7 139 1.0 2.0 63 3.5 1.8 202 US$ 1,250
Attributable - 90% 125 57 181
Agbaou3 - Total 2.7 2.7 236 8.8 2.4 690 11.5 2.5 926 US$ 1,350
Attributable - 85% 200 587 787
Tabakoto 4 – Total 2.3 3.3 249 4.4 4.0 558 6.7 3.7 807 US$ 1,350
Attributable – 80%-90% 202 470 672
Houndé5 – Total 3.7 2.5 295 26.9 2.1 1,780 30.6 2.1 2,073 US$ 1,300
Attributable - 90% 266 1,602 1,866
Total 1,258 3,247 4,503
Total Attributable 1,098 2,856 3,952
Note: Percent attributable at Tabakoto–Kofi is weighted by contribution to reserves.
Notes to Mineral Resources and Reserves available at www.endeavourmining.com/s/reserves.asp
INTERMEDIATE GOLD PRODUCER DELIVERING PROFITABILITY

24
Mineral Resources as at December 31, 2014
Mine / Project
Resources (including reserves) Lower
cutoffMeasured Indicated Measured & Indicated Inferred
Tonnes Grade Ounces Tonnes Grade Ounces Tonnes Grade Ounces Tonnes Grade Ounces
Mt Au g/t koz Mt Au g/t koz Mt Au g/t koz Mt Au g/t koz Au g/t
Nzema1 - Total 23.7 1.4 1,040 13.0 1.3 550 36.7 1.3 1,590 7.6 1.3 311 0.5
Attributable - 90% 936 495 1,431 280
Youga2 - Total 7.3 1.3 317 9.7 1.6 494 17.0 1.5 812 2.8 1.6 141 0.5
Attributable - 90% 285 444 730 127
Agbaou3- Total 2.9 2.8 255 11.1 2.4 854 13.9 2.5 1,109 2.1 2.3 154 0.5
Attributable - 85% 216 726 942 131
Tabakoto4 - Total 5.6 2.9 529 13.4 3.0 1,310 19.0 3.0 1,839 17.6 2.8 1,5820.5 to
1.5
Attributable – 80%-90% 433 1,110 1,543 1,315
Houndé5- Total 3.7 2.6 305 34.1 2.1 2,242 37.8 2.1 2,546 3.2 2.6 273 0.5
Attributable - 90% 274 2,017 2,291 246
Total 2,446 5,449 7,896 2,462
Total Attributable 2,146 4,792 6,938 2,099
Note: Percent attributable at Tabakoto–Kofi is weighted by contribution to resources.
Notes to Mineral Resources and Reserves available at www.endeavourmining.com/s/reserves.asp
INTERMEDIATE GOLD PRODUCER DELIVERING PROFITABILITY

25
Company Profile
Capitalization Summary (March 31, 2015)
Shares in Issue 413,143,668
Options 30,796,868
Warrants none
Fully Diluted 443,940,536
Share Price (March 31, 2015)
Recent Share PriceCDN$0.58
AUD$0.60
Market Cap CDN$240 million
Av. daily shares in March 2015
Canada TSX:EDV
Australia ASX:EVR
USA OTCQX:EDVMF
2.9 million
0.3 million
0.1 million
Shareholder Base
Institutions 60-65%
Retail 25-35%
Insiders/Management 3%
Balance Sheet (December 31, 2014)
Cash position $62 million
Drawn down from $350 million debt facility $300 million
INTERMEDIATE GOLD PRODUCER DELIVERING PROFITABILITY
Shareholder Geographic Mix

26
+1 604 609 6114
Doug Reddy, SVP Business Development
Neil Woodyer, CEO
+377 97 98 7130