encouraging inclusive growth through … · • national strategic policy aims for the government...
TRANSCRIPT

Ferry Irawan
Directorate of Regional Economic
and Real Sector Development
ENCOURAGING INCLUSIVE GROWTH
THROUGH INNOVATIVE
INFRASTRUCTURE FINANCING FOR
REGIONAL DEVELOPMENT
NATIONAL AND REGIONAL ECONOMIC UPDATE,
2nd Quarter of 2018

Executive Summary
2nd Quarter-2018 Economic Update
Economic Diversification Through Downstream Process of Agricultural/Plantation and Tourism Sector in North Sumatera
Analysis of Agricultural Sector Development inSouth Sulawesi
Policy Direction
OUTLINE
2

Executive Summary
3

• Amidst the heightened global economic uncertainty, Indonesia’s economic growth
in 2nd quarter of 2018, has increased to approximately 5,27% (y-o-y). From
expenditure side, economic activity showed increase in most of sectors except
Gross Fixed Capital Formation (PMTB) caused by the completion of most of the
infrastructure projects.
• One of Indonesia’s economic growth challenges is how to improve the growth and
to reduce inequality (within and between regions).
• By sector, the contribution of agriculture and industrial sectors need to be
optimized. Meanwhile spatially, Java Island remains as the main contributor of
national economic growth.
• Quantitatively, Bappenas Inclusive Economic Index indicated that economic
development at provincial level are very diverse, and mostly are below the national
level.
• National Strategic Policy aims for the Government Policy Packages (Paket
Kebijakan) such as infrastructure development, strengthening the competitiveness,
strengthening the economic zone, tourism zone development in all of Indonesia
regions with supported by economic equality policy.
• In order to boost economic inclusive growth, National Policy needs to be synergizedwith the program innovations and the financial sources of regional government.
4
5
Economic Update
Second Quarter-2018

5.148.71
5.26 5.87 7.7
15.17
55.43
1.21
8.5
31.15
20.35 20.87
Householdconsumption
Non profit institutionserving household
Governmentexpenditure
Gross fixed capitalformation
Export Import
Growth Share
Economic Growth 2nd Quarter - 2108
5.54 5.59 5.52 5.58
5.124.94 4.93
5.05
4.82 4.74 4.77
5.17
4.92
5.185.01 4.94 5.01 5.01 5.06
5.195.06
5.27
Q1 Q2 Q3 Q4 Q1 Q2 Q3 Q4 Q1 Q2 Q3 Q4 Q1 Q2 Q3 Q4 Q1 Q2 Q3 Q4 Q1 Q2
2013 2014 2015 2016 2017 2018
5.075.034.885.015.56 5.17
GDP based on Expenditure 2nd Quarter-2018 (%yoy)
Source : BPS (2018) 6
Amidst the heightened global economic uncertainty, the
growth of Indonesian economy increased approximately 5,27% (yoy) for Q2 2018
• Expenditure side of 2nd quarter of 2018 IndonesianEconomy was driven by the growth of HouseholdConsumption, Government Expenditure and Export.
• Household and government consumptions growth hasincreased, affected by holiday allowance (THR) andgovernment expenditure such as international sport eventpreparation (Asian Games 2018) and social assistancespending.
• The growth of export sector is positive, but lower thanimport. The increase in export occurred in Java andSumatera area due to higher CPO Price. However, the rawmaterial import also increased in order to supportmanufacture industry and infrastructure project.
• Investment performance slowed down because of:
• The completion of ongoing infrastructure projectswithout additional new projects on the pipeline
• Momentum of rising commodity price utilized bycorporation to invest in 2017 and part of 2018

12.80
13.00
13.20
13.40
13.60
13.80
0.00
1.00
2.00
3.00
4.00
5.00
2011 2012 2013 2014 2015 2016 2017 2018TW 2
Growth (C to C, %) Share (%)
Agriculture, Forestry, Fishery
18.00
19.00
20.00
21.00
22.00
0.00
2.00
4.00
6.00
8.00
2011 2012 2013 2014 2015 2016 2017 2018TW 2
Growth (C to C, %) Share (%)
Manufacture
0.95
1.00
1.05
1.10
1.15
1.20
1.25
0.00
2.00
4.00
6.00
8.00
10.00
12.00
2011 2012 2013 2014 2015 2016 2017 2018TW 2
Growth (C to C, %) Share (%)
Gas and Electricity
Construction
8.00
8.50
9.00
9.50
10.00
10.50
0.00
2.00
4.00
6.00
8.00
10.00
2011 2012 2013 2014 2015 2016 2017 2018TW 2
Growth (C to C, %) Share (%)
Source : BPS (2018)
12.60
12.80
13.00
13.20
13.40
13.60
13.80
0.00
2.00
4.00
6.00
8.00
10.00
12.00
2011 2012 2013 2014 2015 2016 2017 2018TW 2
Growth (C to C, %) Share (%)
Wholesale and Retail Trade
2.60
2.70
2.80
2.90
3.00
3.10
0.00
2.00
4.00
6.00
8.00
2011 2012 2013 2014 2015 2016 2017 2018TW 2
Growth (C to C, %) Share (%)
Food Beverage and Accommodation
The growth of accommodation, food and beverage and trade sectors in the 2nd quarter of 2018 has increased
along with holiday season (school and Eid holiday)• Meanwhile, the growth of manufacturing industries had not increase significantly
• Agriculture sector performance indicating improvement since lower commodity price era in 2014. In addition, the growth in the second quarter was resulted by harvest timethat shifted earlier and also favorable weather.
• The rising domestic demand boosted the acceleration in business activities, while, manufacturing industries and construction sector distribution had not showedimprovement yet /declined because of commodity price recovery and reducing working day during religious holiday (lebaran).
7

Inter-regional Development Discrepancy and Inequality of Income Distribution… poor population in rural area are about 13.20% while 7.02% in urban area
• Poverty in urban and rural area had different characteristics, however with different poverty
line between urban and rural area, there were more poor population in the rural area.
• Comparing inter-regional data, we found inequality of social development between west
and east area. The poverty in east area of Indonesia was higher than west area, especially
in rural area such as Bali-Nusra and Maluku-Papua.
• Gini Ratio has been increasing from 0.376 in 2007 to 0.389 in 2018.
Source: BPS 8
0.401
0.324
0.389
2007 2008 2009 2010 2011 2012 2013 2014 2015 2016 2017 2018
Indonesian Gini Ratio by Residence
Urban Rural Ur and Rural
8.656.82
4.335.83
9.18
5.037.02
11.6612.81
7.6
13.68
17.77
29.15
13.2
Sumatera Java Borneo Sulawesi Bali-Nusra Maluku-Papua Indonesia
Percentage of poor population by Island
Urban Rural

6.5
5
5.9
7
5.9
4
5.9
3
5.9
0
5.8
5
5.7
7
5.6
5
5.6
1
5.5
7
5.5
3
5.4
7
5.4
6
5.4
2
5.4
1
5.4
0
5.3
9
5.3
7
5.3
3
5.2
6
5.2
1
5.2
0
5.1
9
5.1
7
5.1
5
5.1
2
5.1
1
5.0
3
5.0
0
4.9
7
4.9
5
4.9
1
4.8
8
4.6
4
3.7
0
DK
I Jak
arta
Jaw
a Te
nga
h
DI Y
ogy
akar
ta
Bal
i
Jaw
a B
arat
Kep
ula
uan
Ria
u
Jaw
a Ti
mu
r
Sula
wes
i Uta
ra
Sum
ate
ra U
tara
Kep
ula
uan
Ban
gka…
Kal
iman
tan
Sel
atan
Ind
on
esia
Sula
wes
i Sel
atan
Sum
ate
ra B
arat
Sum
ate
ra S
elat
an
Kal
iman
tan
Tim
ur
Lam
pu
ng
Ban
ten
Kal
iman
tan
Te
nga
h
Ria
u
Kal
iman
tan
Uta
ra
Ben
gku
lu
Go
ron
talo
Sula
wes
i Ten
ggar
a
Sula
wes
i Ten
gah
Ace
h
Jam
bi
Nu
sa T
engg
ara
Bar
at
Sula
wes
i Bar
at
Kal
iman
tan
Bar
at
Mal
uku
Uta
ra
Mal
uku
Pap
ua
Bar
at
Nu
sa T
engg
gara
Tim
ur
Pap
ua
• Notes: values 1-3 are “unsatisfied” categories values 4-7 are “satisfied” categories and values 8-10 are “very satisfied”
categories. Calculation of the Inclusive Economic Development Index based on economic growth, income distribution and
poverty reduction and expansion of access and opportunity
Source: Bappenas (2018)
National Inclusive Economic Index is 5.47• Some provinces had Inclusive economic development index below the national level
• Since the number of poverty is still high it creates the low rate of Inclusive economics index.
9

Economic Diversification
through Downstream
Processing of Agriculture/
Plantation and Tourism
Sectors in North Sumatera
10

Description2017 2018 Share
Q1 Q2 Total Q1 Q2
Household Consumption 5.63 5.51 5.12 4.98 6.64 53.93
Non Profit Institution Serving Household 3.96 3.70 3.26 7.06 11.10 0.96
Government Expenditure 4.63 4.54 5.77 6.26 5.25 7.46
Gross Fixed Capital Formation 4.02 4.73 5.91 6.96 7.37 31.06
Export 1.32 -2.74 6.34 -0.08 5.38 35.51
Import 2.01 -4.92 6.65 0.88 9.95 30.59
Intraregional Net Export -135.53 -41.23 -81.72 -197.29 -52.38 0.00
GRDP 4.53 5.14 5.12 4.73 5.30 100.00
North Sumatera Economic Growth in 2nd quarter – 2018 is 5,30% (yoy), higher than previous quarter in 2017… The growth in second quarter of 2018 is driven by consumption and export performance improvement
• Non profit institution serving household grows 11,10%, increased significantlycompared to previous quarter inline with gubernatorial election in NorthSumatera.
• Export performance grows 5,38% (yoy), improved compared to the first quarterdue to the increase in chemical products (HS 38) commodity exports.
• In addition, there are market diversification of CPO commodity export (HS 15), andit can prop the sharp decline of CPO export after protectionism policy from tradingpartner like India.
• The unstable condition of world CPO Price could potentially become an obstaclefor export performance in second quarter -2018.
• Need to focus on the high rate of import especially for fuel oil. The import growthof North Sumatera could be higher than National level.
Source : BPS
GRDP based on Expenditure 2nd Quarter - 2018 (%yoy)
11
5.30
2014 2015 2016 2017 TW I-2018 TW II-2018
North Sumatera and National Economic Growth, % (yoy)
Indonesia North Sumatera
-30 -20 -10 0 10 20 30 40 50
Coffee, tea, mate and spices (09)
Organic chemicals (29)
Chemical products (38)
Rubber and articles thereof (40)
Animal or vegetables fats and oils and theircleavage products (15)
Main export commodity of North Sumatera (Jan-June 2018)
Share Growth

Description2017 2018
ShareQ1 Q2 Total Q1 Q2
Agriculture, Forestry, and Fishery 2.22 3.97 5.31 3.25 5.02 20.82
Manufacture 3.34 4.11 2.31 2.52 3.50 20.18
Construction 5.21 5.88 6.79 6.87 5.95 13.64
Wholesale and Retail Trade 7.16 6.44 5.87 5.66 6.02 18.43
Transportation and Warehousing 7.79 7.78 7.35 7.48 6.78 5.06
Gross Domestic Product 4.53 5.14 5.12 4.73 5.30 100.00
• The ongoing harvest of the food crops and horticulture sub-sectors and theend of the oil palm track season are the driving factors for improving theperformance of the agricultural sector.
• The annual plantation sub-sector has shared 45% for agricultural sector. Themain commodity in this subsector is oil palm.
• Several risk factors that need to be anticipated related to oil palm, i.e.: tariffbarriers in major export countries, non-tariff barriers such asenvironmental, health and social issues.
• It is necessary to measure the impact of these risks and its mitigation,especially the diversification of other sectors as well as tourism.
North Sumatera
Riau
South Sumatera
26%
16%
9%
On the production side, economic growth is driven by agriculture, forestry and fishery sectors’ improvement… these sectors grow 5,02% (yoy) boosted especially by increasing oil palm production
Source : Agriculture Ministry
Spread of Palm Oil Production 2017
GRDP based on Business Activity in 2nd Quarter-2018 (%yoy)
Source : BPS
12
0
1
2
3
4
5
6
7
2016 2017* 2018**
Mill
ion
s
Palm Oil Production based on Business Status (Ton)
Smallholder plantations State owned companies private companies

North Sumatera’s investment realization in 2nd quarter of 2018 declined by 22.76% and is lower compared to the previous quarter at the same time.
• In general, the realization of North Sumatra investment was thesecond largest after South Sumatra during the 2nd quarter of 2018 inthe Sumatera Island.
• However, investment growth in North Sumatra in Q2 2018 decreasedby 2.92% (qtq) compared to the previous quarter and fell to 22.76%compared to the same quarter in the previous year (yoy).
• The decline was driven by a decrease in the role of FDI in theinvestment of food, electricity, gas, and water. Foreign investmentgrowth contribution dominated the total investment in North Sumatra
• During the first semester of 2018 it was recorded the composition ofdomestic investment dominated by the food industry, while for foreigninvestment in the electricity, gas, water and mining sectors.
Source : BKPM (2018)
-
500
1,000
1,500
2,000
2,500
3,000
3,500
4,000
4,500
5,000
I II III IV I II III IV I II III IV I II
2015 2016 2017 2018
Bill
ion
s ID
R
Domestic Investment Update in North Sumatera
-
100
200
300
400
500
600
700
I II III IV I II III IV I II III IV I II
2015 2016 2017 2018
Mill
ion
s U
$
Foreign Investment Update in North Sumatera
13
Rubber industries 8%
Pulp and paper industries
7%
Basic chemical, chemical and
pharmaceutical industries
8%
Basic Metal, Metal Goods, Machinery
and Electronics Industries
6%
food industries44%
Constructions9%
Domestic Invesment (Jan-June 2018)
Mining33%
Food crops and plantations
15%Food Industries
6%
Electricity, Gas and Water34%
Foreign Invesment (Jan-June 2018)

14
5.61 5.47
DK
I Jak
arta
Jaw
a Te
nga
h
DI Y
ogy
akar
ta
Bal
i
Jaw
a B
arat
Kep
ula
uan
Ria
u
Jaw
a Ti
mu
r
Sula
wes
i Uta
ra
Sum
ater
a U
tara
Kep
ula
uan
Ban
gka…
Kal
iman
tan
Sel
atan
Ind
on
esia
Sula
wes
i Sel
atan
Sum
ater
a B
arat
Sum
ater
a Se
lata
n
Kal
iman
tan
Tim
ur
Lam
pu
ng
Ban
ten
Kal
iman
tan
Ten
gah
Ria
u
Kal
iman
tan
Uta
ra
Ben
gku
lu
Go
ron
talo
Sula
wes
i Te
ngg
ara
Sula
wes
i Te
nga
h
Ace
h
Jam
bi
Nu
sa T
en
ggar
a…
Sula
wes
i Bar
at
Kal
iman
tan
Bar
at
Mal
uku
Uta
ra
Mal
uku
Pap
ua
Bar
at
Nu
sa T
en
ggga
ra…
Pap
ua
North Sumatera’s Inclusive Economic Development Index was 5.61, higher than National which was 5,47… North Sumatera index for 1st pillar was lower than Indonesia level.
• Notes: values 1-3 are “unsatisfied” categories values 4-7 are “satisfied” categories and values 8-10 are “very satisfied” categories. Calculation of the
Inclusive Economic Development Index based on economic growth, income distribution and poverty reduction and expansion of access and opportunity
Source : Bappenas (2018)
5.17
5.12
Indonesia North Sumatera
1st Pillar : Economic Growth
6.64
6.96
Indonesia North Sumatera
2nd Pillar: Income Equality and Poverty Reduction
5.05
5.42
Indonesia North Sumatera
3rd Pillar: Improving Access and Opportunity
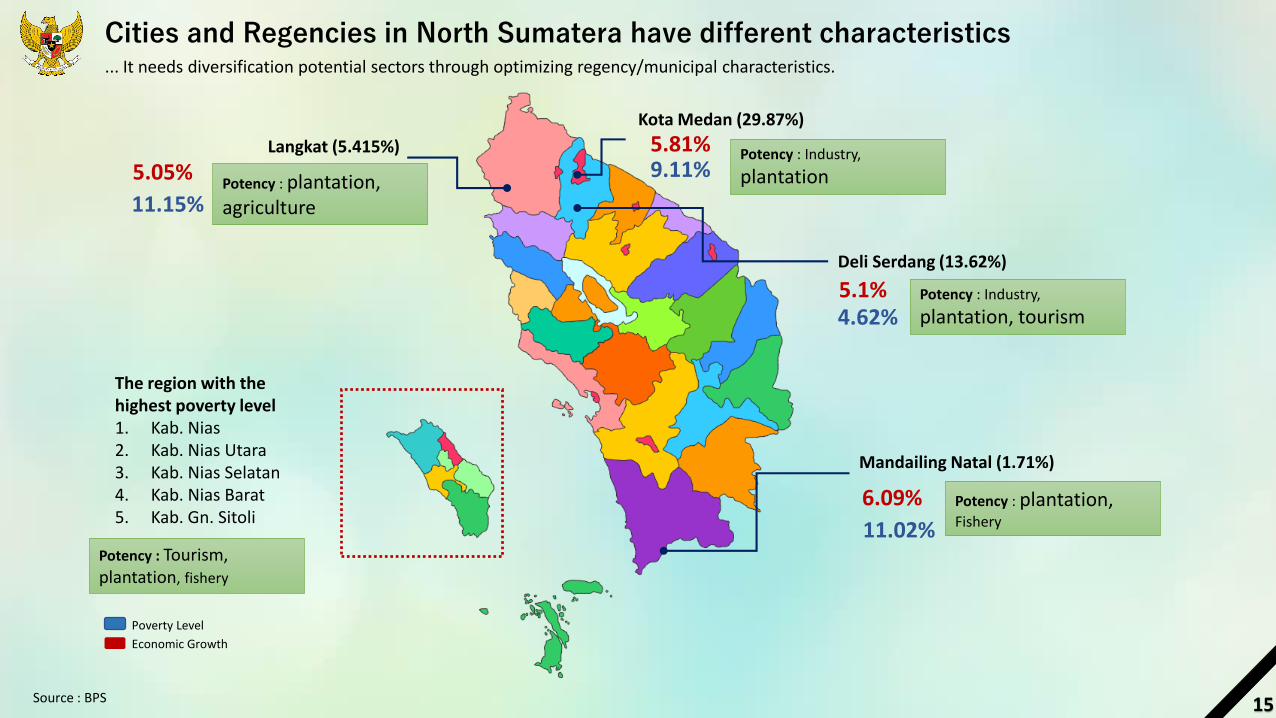
Kota Medan (29.87%)
Deli Serdang (13.62%)
Langkat (5.415%)
Mandailing Natal (1.71%)
6.09%
5.81%
5.1%
5.05%
The region with the highest poverty level1. Kab. Nias2. Kab. Nias Utara3. Kab. Nias Selatan4. Kab. Nias Barat5. Kab. Gn. Sitoli
9.11%
4.62%
11.15%
11.02%
Cities and Regencies in North Sumatera have different characteristics... It needs diversification potential sectors through optimizing regency/municipal characteristics.
Economic Growth
Poverty Level
Source : BPS
Potency : Industry,
plantation
Potency : Tourism, plantation, fishery
Potency : Industry,
plantation, tourism
Potency : plantation, agriculture
Potency : plantation, Fishery
15

Notes :
• Quadrant 1 : Commodities that include in the superior category are the commodity that have both of backward and forward linkage value more than 1.
• Industries related their development: restaurants, food and beverage industry, and construction.
• Quadrant 2 : Commodities that include in this potential category are the commodities that havebackward linkage more than 1 and forward linkage less than 1.
• This quadrant is potential input supply for the other sectors, i.e. food oil industry and rubber industry.
• Quadrant 3: Commoditites that include in this potential category are the commodities that have backward linkage less than 1 and forward linkage more than 1.
• This quadrant is output market that potential for the other sectors, i.e. CPO, trade and air transport.
The sectors that need to be continuously developed i.e. CPO and its downstream industries: food & beverage and cosmetic industries… to maintain the continuity of high growth level, North Sumatra also needs diversification, some sectors that could be developed are sectors related to Tourism such as the restaurant, accommodation and food and beverage sectors.
Restoran
Konstruksi
Ind. makananKelapa Sawit
Ind. Minyak Makan
Ind. Kimia dan kosmetik
POTENTIAL COMMODITY (3)
LEADING COMMODITY (1)
POTENTIAL COMMODITY (2)
Source : IO Table –BPS, Kompas R&D (treated, 2008)
Restaurant
Construction
Food Industry
Food Oil Industry
Chemical and Cosmetic Industry
Palm Oil
Trade
16

Ranking SectorBackward
linkageForward linkage
Multiplier
Output Income Employment
1 Rice, Grains and Flour industry 2.03 1.42 2.03 6.59 37.03
2 Food oil industry 1.91 1.23 1.91 3.26 12.85
3 Beef production, vegetables and Fruits Industry 1.88 1.41 1.88 4.25 17.97
4 Other Food Industry 1.85 1.58 1.85 2.20 5.50
5 Apparel Industry 1.85 1.13 1.85 2.20 3.03
6 Rubber and Rubber Goods Industry 1.82 1.43 1.82 4.40 21.20
7 Food from flour, sugar, chocolate and processing Industry 1.82 1.76 1.82 1.95 4.64
8 Leather tanning, footwear and leather goods industry 1.81 1.01 1.81 2.55 4.88
9 Spinning, weaving and knitting Industry 1.81 1.92 1.81 2.07 2.79
10 Oil and Gas Industry 1.79 1.26 1.79 2.28 2.70
13 Restaurant 1.73 2.43 1.73 1.67 1.70
17 Residential buildings and non-residential buildings 1.69 2.08 1.69 1.56 2.08
38 Hospitality 1.44 1.13 1.44 1.33 1.23
45 Palm oil 1.33 1.56 1.33 1.30 1.08
Output, income and employment multiplier for leading and potential
sectors
• Sectors related to CPO and its derivatives have an output multiplier of 1.62, better than the overall sector average1.47.
• Meanwhile, sectors related to the tourism industry have a multiplier output reaching 1.67, higher than the average of all sectors and the average CPO and its derivatives.
• Government policy to make Lake Toba as a tourism destination is the right thing to create new sources of economic growth.
17

Analysis of Agricultural
Sector Development in
South Sulawesi
18

➢ Despite decreasing in growth in the second quarter of 2018 (qtq), the growth of South Sulawesi is always above the nationallevel (except for exports).
➢ From Expenditure side, economic growth in the 2nd quarter of 2018 is 7.38% (y-on-y), affected by positive growth in almostall expenditure components.
➢ The highest growth was achieved by the component of Non Profit Institution Consumption Expenditures Serving Households(LNPRT) by 21.7%; followed by Government Consumption at 6.8% and Gross Fixed Capital Formation (PMTB) at 6.32%.
➢ The high growth of LNPRT impact by regional head elections (pilkada) which encouraged the rapid increase in LNPRTspending.
Sumber : BPS (2018)
South Sulawesi’s Economic Growth is above the National Growth in the second
quarter of 2018Economic Growth in South Sulawesi Economic Growth based on Expenditure Side in South Sulawesi
19
6.77
7.41
7.38
5.065.27
4.5
5
5.5
6
6.5
7
7.5
8
8.5
I II III IV I II III IV I II
2016 2017 2018
per
cen
t (%
)
South Sulawesi Indonesia
0
10
20
30
40
50
60
70
HouseholdConsumption
Non profitinstitution
servinghousehold
governmentexpenditure
Gross fuxedcapital
formation
Export Import
TrilionRupiah
TWII-2017 TWI-2018 TWII-2018

The Economy of South Sulawesi is diversified but Agriculture
remain the leading sector
Source : BPS (2018)
➢ Agriculture still the main sector of South Sulawesi, this can be seen from the highest economic growth and the sector contribution whosevalue is above 22% of economy structure in South Sulawesi.
➢ The second largest sub-sector comes from trade, the growth in this sector is due to the strategic nature of South Sulawesi as a goodsdistribution channel, especially this province is the gateway of East Indonesia.
➢ Overall, the economy of South Sulawesi is diversified where other sectors such as the manufacturing industries, Construction andServices are starting to show significant contribution.
Sector based on year 2010 2016 2017 Q1 - 2018 Q2 - 2018
Agriculture, Forestry and Fishery 7,86 5,34 14,43 10,77
Mining and Excavation 1,22 4,52 -3,57 6,01
Manufacturing Industry 8,23 5,03 -6,12 -2,72
Electricity supply, Gas 11,52 6,1 -7,1 6,32
Water supply 5,44 7,89 2,76 4,84
Construction 6,75 8,66 -4,43 4,1
Large and wholesale trade 9,87 10,74 -2,37 10,5
Transportation and Warehousing 7,75 8,37 -1,31 6,62
Food and Beverage Accommodiation 8,47 11,66 0,16 5,71
Information and Communication 8,13 10,52 0,64 2,3
Financial Service 13,63 4,39 0,13 3,71
Real Estate 6,37 4,48 0,29 1,07
Firm service 7,88 8,44 0,43 2,52
Mandatory Government, Defense and Social Administration -0,22 5,2 -1,58 8,8
Education Service 6,86 9,72 0,16 5,18
Health and Social Activities Service 8,45 8,8 -2,21 3,86
Others Service 9,81 9,58 0,04 5,59
Sectoral Economic Growth in South Sulawesi
20
23.27 22.89 23.78
13.39 13.94 14.67
13.97 13.71 12.344.44 4.34 4.45.04 5.19 5.06
12.51 12.74 12.64.63 4.76 4.684.26 4.18 4.24
18.5 18.23 18.23
0%
20%
40%
60%
80%
100%
2016 2017 Tw II -2018
Sectoral Contribution in South Sulawesi
Agriculture Trade
Manufacturung industries Mandatory Government
Education services Construction
Information and communication Transportation and warehousing
Others

Number of Poor People in South Sulawesi : Downward Trend and Below the National Average
16.2215.4
14.41 14.33 14.0113.28 13.16 12.62
11.1410.28 9.71 9.66 9.38 9.24 9.24 8.78 8.46 8.42 8.29 7.97 7.66 7.38
5.7 5.324.59
0
2
4
6
8
10
12
14
16
18
Pan
gkep
Jen
epo
nto
Tora
ja U
tara
Lutr
a
Luw
u
Sela
yar
Enre
kan
g
Tato
r
Mar
os
Bo
ne
Bar
ru
Ban
taen
g
Suls
el
Taka
lar
Sin
jai
Ko
ta P
alo
po
Pin
ran
g
Go
wa
Sop
pen
g
Bu
luku
mb
a
Luti
m
Waj
o
Ko
ta P
are
-Par
e
Sid
rap
Ko
ta M
akas
sar
➢ The percentage of poor population in South Sulawesi isstill below the National percentage.
➢ Seen from distribution, rural poverty higher than urbanareas, but with a downward trend.
➢ There are 50% of districts in South Sulawesi that have apoor population above the provincial level. But, citiessuch as Makassar and Pare-Pare which is more developedwas far below South Sulawesi.
Number of poor people in South Sulawesi
Sumber : BPS (2018) 21
149 162 162 154 146 157 149 151 154 167 168
645 702 702 652 651 707 658 646 660 659 625
10
10 10
1009
10
0909
0909
09
08
09
09
10
10
11
11
Mar 2013 Sep 2013 Mar 2014 Sep 2014 Mar 2015 Sep 2015 Mar 2016 Sep 2016 Mar 2017 Sep 2017 Mar 2018
0
100
200
300
400
500
600
700
800
900
1000
Tho
usa
nd
Peo
ple
Urban Rural percentage
9.54
10.32 10.28
9.549.39
10.12
9.409.24
9.389.48
9.06
11.3711.46
11.25
10.96
11.2211.13
10.8610.7 10.64
10.12
9.82
9.00
9.50
10.00
10.50
11.00
11.50
12.00
Mar2013
Sep2013
Mar2014
Sep2014
Mar2015
Sep2015
Mar2016
Sep2016
Mar2017
Sep2017
Mar2018
Indonesian and South Sulawesi Poverty Trends
South Sulawesi Indonesia

GRDP/capita’s Disparity between districts / cities and Gini Ratio in South Sulawesi is quite high
0.405
0.410
0.4290.425 0.424
0.426
0.4070.406
0.414
0.408
0.402
0.3970.394 0.393
0.370
0.380
0.390
0.400
0.410
0.420
0.430
0.440
0
10
20
30
40
50
60
2011 2012 2013 2014 2015 2016 2017
Gin
i In
dex
Per
sen
Inequality of Population Income and Gini Index
40% Penduduk Berpenghasilan Rendah 40% Berpenghasilan Sedang 20% Penduduk Berpenghasilan Tinggi Indeks Gini Indeks Gini Nasional
Rp- Rp10,000,000 Rp20,000,000 Rp30,000,000 Rp40,000,000 Rp50,000,000 Rp60,000,000 Rp70,000,000 Rp80,000,000 Rp90,000,000
Gowa
Jeneponto
Tana Toraja
Bulukumba
Takalar
Enrekang
Toraja Utara
Barru
Luwu Utara
Luwu
Bantaeng
Kota Palopo
Sinjai
Soppeng
Bone
Kep. Selayar
Sidrap
Kota Pare-Pare
Pinrang
Wajo
Maros
Pangkep
Luwu Timur
Kota Makassar
GRDP per capita between districs/cities in South Sulawesi
2016 2011 Averages 2016 Averages 2011
Sources : Macroeconomic Indicators and BPS (2018)
There was an incomeincreasing between2011 and 2016. Severalcities in South Sulawesi had highest income than other districts.
• Inequality of income in South Sulawesi is relatively higher thanNational level. • The growth of income
Group of 20% of thehigh incomepopulation is higherthan the other group.
22
40% Low-Income Population40% Moderate Income
Population 20% High Income Population Gini Index
Indonesia Gini Index

Sector February 2017 August 2017 Februaryy 2018
Agriculture 1.544.614 1.391.639 1.617.680
Trade 666.962 674.127 652.232
Manufacture 279.668 279.246 304.224
Adm. Government 239.782 206.819 262.878
Education Service 246.833 228.271 253.103
Construction 245.679 232.673 236.673
Others 577.869 585.888 622.506
Amount 3.801.407 3.598.663 3.949.296
Agriculture and Trade Sectors were the dominant sector to absorb Labor in South Sulawesi
➢ The agriculture still the main sector to absorb labor in South Sulawesi Province. In February 2018, agricultural sector was able toabsorb 1.62 million people, this number grew positively compared to February and August 2017.
➢ This increase was caused by the harvest in early 2018 so that the needs of worker in the harvest season had raised.
➢ Other sectors that contribute to absorb labor in South Sulawesi are Trade and followed by the Processing Industry.
Source : BPS (2018) 23
41% 39% 41%
18% 19% 17%
7% 8% 8%
6% 6% 7%
6% 6% 6%
6% 6% 6%
15% 16% 16%
0%
20%
40%
60%
80%
100%
February 2017 Agustus 2017 February 2018
Agriculture Trade Manufacturung industries
Mandatory Government Education services Construction
Others

6.5
5
5.9
7
5.9
4
5.9
3
5.9
0
5.8
5
5.7
7
5.6
5
5.6
1
5.5
7
5.5
3
5.4
7
5.4
6
5.4
2
5.4
1
5.4
0
5.3
9
5.3
7
5.3
3
5.2
6
5.2
1
5.2
0
5.1
9
5.1
7
5.1
5
5.1
2
5.1
1
5.0
3
5.0
0
4.9
7
4.9
5
4.9
1
4.8
8
4.6
4
3.7
0
DK
I Jak
arta
Jaw
a Te
nga
h
DI Y
ogy
akar
ta
Bal
i
Jaw
a B
arat
Ke
pu
lau
an R
iau
Jaw
a Ti
mu
r
Sula
wes
i Uta
ra
Sum
ater
a U
tara
Ke
pu
lau
an B
angk
a…
Kal
iman
tan
Sel
atan
Ind
on
esi
a
Sula
wes
i Sel
atan
Sum
ater
a B
arat
Sum
ater
a Se
lata
n
Kal
iman
tan
Tim
ur
Lam
pu
ng
Ban
ten
Kal
iman
tan
Ten
gah
Ria
u
Kal
iman
tan
Uta
ra
Be
ngk
ulu
Go
ron
talo
Sula
wes
i Te
ngg
ara
Sula
wes
i Te
nga
h
Ace
h
Jam
bi
Nu
sa T
engg
ara
Bar
at
Sula
wes
i Bar
at
Kal
iman
tan
Bar
at
Mal
uku
Uta
ra
Mal
uku
Pap
ua
Bar
at
Nu
sa T
engg
gara
Tim
ur
Pap
ua
• Notes: values 1-3 are “unsatisfied” categories, values 4-7 are “satisfied” categories and values 8-10 are “very satisfied” categories. Calculation of the
Inclusive Economic Development Index based on economic growth, income distribution and poverty reduction and expansion of access and opportunity
• The position of South Sulawesi is still below the National level due to the low index of economic growth pillars and pillars ofequity and poverty
alleviation.
Source : Bappenas (2018)
The Inclusive Economy Index of South Sulawesi Province is 5.46… The inclusive economic development index of South Sulawesi Province was still below the national level
24
5.17
4.88
Indonesia South Sulawesi
1st Pillar : Economic Growth
6.64
6.57
Indonesia South Sulawesi
2nd Pillar: Income Equality and Poverty Reduction
5.05
5.82
Indonesia South Sulawesi
3rd Pillar: Improving Access and Opportunity
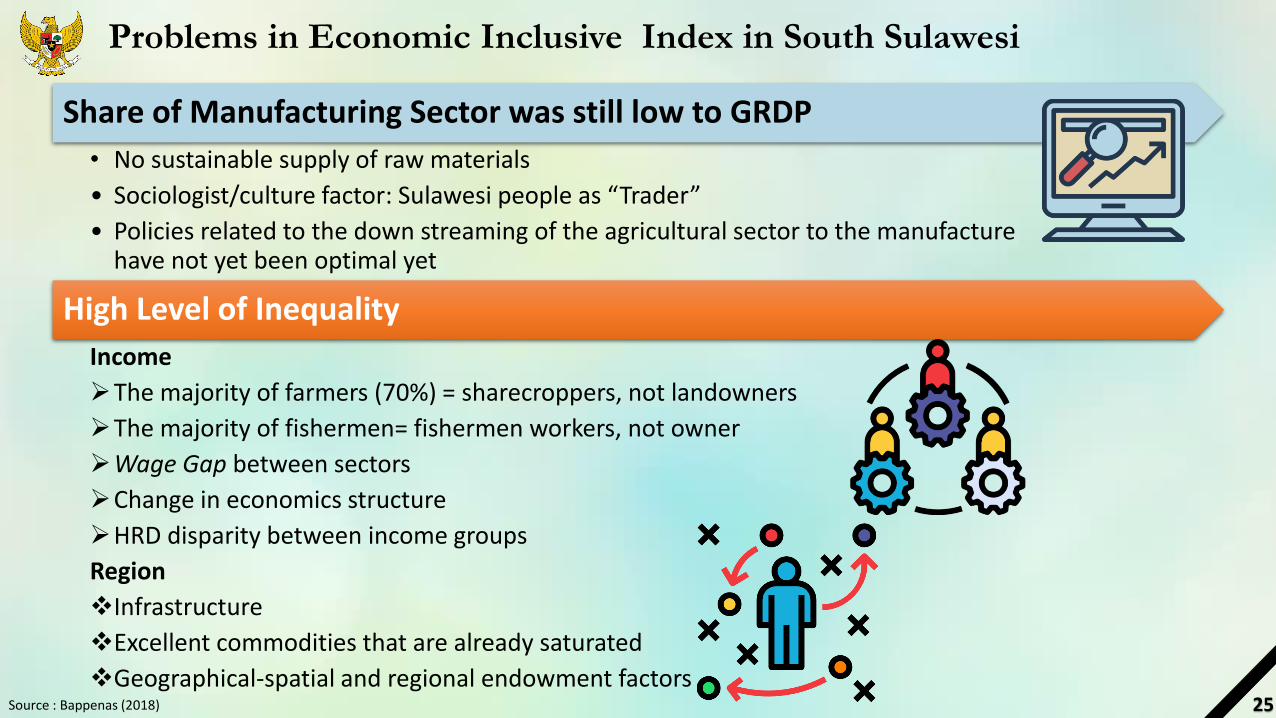
Problems in Economic Inclusive Index in South Sulawesi
Source : Bappenas (2018)
Share of Manufacturing Sector was still low to GRDP
• No sustainable supply of raw materials
• Sociologist/culture factor: Sulawesi people as “Trader”
• Policies related to the down streaming of the agricultural sector to the manufacturehave not yet been optimal yet
High Level of Inequality
Income
➢The majority of farmers (70%) = sharecroppers, not landowners
➢The majority of fishermen= fishermen workers, not owner
➢Wage Gap between sectors
➢Change in economics structure
➢HRD disparity between income groups
Region
❖Infrastructure
❖Excellent commodities that are already saturated
❖Geographical-spatial and regional endowment factors25

Policy Direction
26

Policy Strategy
ENCOURAGING ECONOMIC GROWTH TO THE WHOLE AREA
Capacity building of human resources
through vocational education
Providing affordable business financing
opportunities through KUR
Economic Equality Policy
Industry
Basic Industry: Iron / Steel,
Petrochemical, and Basic Chemicals
SDA, Agro and Mineral Downstream
Industry
Land Chance Human Resource Capacity
TARGET :
PKE Reformation 16Infrastructure
222 National Strategic
Projects and 3 Programs*
Economic Area
12 Special Economic Zone
(SEZ)
16 industry areas
*) Program Kelistrikan dan Program Pesawat Jarak Menengah
Land Reform Policy: asset reform,
land redistribution, access reform
The success of economic growth and the improvement of people's welfare cannot be separated from government policies. Government policy
packages are in the form of infrastructure development, strengthening competitiveness, economic zones and building tourism areas in all parts of
Indonesia which supported by economic equality policies.
Increasing
investment
climate
Increasing
logistic efiency
Export stimulation
Encouraging industrial competitiveness
Tourism Promotion
Strengthening people’s purchasing power
27

Kereta Api Tebing Tinggi – Kuala Tanjung
• As a means of supporting KEK Sei Mangkei and being part of KA Trans Sumatra Network
• Total investment sebesar Rp 477 Billion
Industrial Zone of Kuala Tanjung
Kuala Tanjung International Hub Seaport• The Kuala Tanjung international hub port aims to create an
entrance for logistic flow to the western region of Indonesia
• Support the development KEK Sei Mangkei
• Total investment Rp 30 Trilion
Bendungan Lausimeme
• Total investment sebesar Rp 741 Billion
• Operation Target: 2021
KEK Sei Mangkei
• The main business is in the form of palm oil and rubber industries.
• Project impact on the economy Rp. 92,1 trillion
• Employment in 2017 : 3.672 person.
• Estimated Invesment
1. Infrastructure : Rp. 4,2 trilion
2. Business investment : Rp 123,3 trilion
• Existing investor:
1. PT. Unilever Oleochemical Indonesia (PT UOI)
2. PT. Industri Nabati Lestari
3. PT. Alternatif Protein Indonesia (on process)
Encouraging the diversification of sources of growth : Development of Infrastructure through PSN (National Strategic Project)
Source : KPPIP
• Total invesment Rp 3.5 Trilion
• Progress :
1. Land acquisition until May 2018 amounting to 61 hectares (11%)
Toll Road Project
• Medan – Binjai – Toll Road (16 km)
• Kisaran – Tebing Tinggi – Toll Road
• Medan – Kualanamu – Lubuk Pakam – Tebing Tinggi Toll Road (62 km)
• Binjai – Langsa Toll Road (110 km)
• Rantau Prapat – Kisaran Toll Road (100 km)
• Tebing Tinggi – Pematang Siantar – Prapat – Tarutung – Sibolga Toll Road (200 km)
• Dumai – Sp. Sigambal – Rantau Prapat Toll Road (175 km)
Lake Toba is one of the top 10 national destinations.
28

Types and Characteristics of Regional Infrastructure Financing Instruments
Desirability criteria
Tenor Interest Rate Currency match Risk profileComplexity and
transaction costsImplementation Amount available
APBN/APBD Not applicable Not applicable Not applicable Not applicable
Unlikely to increase
significantly in the
medium term
PT SMI Up to 25 years <10% Debt issued in IDR
Government
guarantee; Local
government debt
transfer if there is a
default
Outstanding 1,21
Trillion
Commitment 2,78
Trillion
SMI has sufficient
funds in the medium
term
Regional Bonds 10-15 years*10%
(rating AA+)Debt issued in IDR
No government
guarantee
Prov. Jateng for
issuance planned
2019-2021
Limited by investor
demand*
Regional Loans
through BPD<10 years* >12%* Debt issued in IDR
No government
guarantee;
Rp1.204 billion
Update per August
2018*
Loan ceiling size is
likely to be small
Public Private
Partnerships
(PPPs)10-30 years 16-18%*
Finance can be in
any currency
Depends on risk
allocation
Only two local
government PPPs
signed
Limited by pipeline
of suitable projects
Undesirable Very DesirableNeutral DesirableSomewhat undesirable
Source: Prospera*the data is the number of loans proposed by the Regional Government to the BPD and has been approved by the Minister of Home Affairs in 2018
…..Local governments need to be encouraged to develop regional infrastructure development innovations by adopting aportfolio approach
29

Transparancy and quality of financial reports
• Audit opinion for last 2 years
• Timeliness of publishing financial reports
• Public access to fiscal information(APBD, RKA and SKPD)
Budget performance
• Aggregate expenditure outturn*)
• Capital expenditure outturn*)
• Proportion of capital to totalexpenditure*)
• PAD outturn
• Proportion of PAD to totalrevenue
• SILPA balance proportion ofexpenditure
• Ratio of debt to revenue / assets
Budget processes and governance
• Implementation of Medium Term Budget Finance (MTBF) and it’s alignment with strategic plan
• Multi-year contracts expenditure as proportion of total expenditure
• Perda APBD passed on time
• Use of e-Government for PFM
Infrastucture planning andmanagement
• Economic analysis of investmentproposals
• Investment project selection
• Investment project costing
• Investment project monitoring
Innovation of Financing Sources by Enhancing Investment Opportunity and Creditworthiness, through:• Efficiency and Effectiveness of Financial Governance• Transparency and Accountability in Local Government Execution
Source: Prospera 30

Thank you
31

32
▪ Monitoring and EvaluationTo ensure the right amount, on time and on target
▪ Replicating National Program increases the participation coverage
▪ Regional Program Innovation
▪ Encouraging Synergy of National Priority
▪ Preparing Business Units to be accessible by banks
▪ Preparing Human Resources to compete and could be
more productive
▪ Preparing Regulations to improve the effectiveness of
the implementation of the Village Law (Utilization of
DD and ADD)
▪ Regional Program Innovation
▪ Encouraging Synergy of National Priority
Reducing Expense
(especially for the poor)
Increasing Income
(especially for the poor and vulnerability)
Increasing the role of local governments to reduce inequality in their respective regions
32

GOVERNMENT POLICY
The government issued var ious pol ic ies to suppor t investment c l imate and economic equal i ty
33

ONLINE SINGLE SUBMISSION (OSS)
Basic Principle
OSS is a system that integrates all business licensing services within the authorized authority (i.e
Minister/Head of Institution, Regent, or Mayor) through single electronic platform.
2
3
45
6
1
Monitoring is accompanied
and/or done by certificated
profession.
Integrated with all related
Ministries/Institutions/Governments.
Easy to access IT services for all
community/business actors.
Confidence to comply to
standard from business actors
(through commitment).
Standardized licensing
(national and/or international).
Fulfilment assurance of the Safety,
Health, and Security, and Environment
Aspect.
22
1

Government Policy : Fiscal Incentives
100% Corporate Income Tax Reduction
(Tax Holiday) for pioneer industries, with
concession period of :
500B - <1T Investment value 5 years
1T - <5T Investment value 7 years
5T - <15T Investment value 10 years
15T - <30T Investment value 15 years
≥30T Investment value 20 years
25
Reduction in final income tax rates from
1% to 0.5%
TAX HOLIDAYINCOME TAX REDUCTION
FOR MSMEs
1 2
2

36
Fiscal Incentives: New Tax Holiday Policy

Internship
Link and Match between the Education and
Business and Industry Sectors.
Competency Standard
Kelembagaan
The use of Work Competency
Standard (SKK) defined by the
Profession Certificate Institution
(LSP).
Building cooperation between
the education and business
and industry sectors.
Internship program within the
cooperation of Ministry of
Manpower and KADIN
Development of education
institution and vocation training
(BLK, SMK, and Poltek).
3.5 Years A C H I E V E M E N T
▪ 7.710 People by 2017
▪ 2.000 People (By March 2018)
568 Companies
1.537 vocational school
37.534 3-in-1 education
and training
Participants
2.770 Cooperation
AgreementP.S until the launching of the 5th vocational industry in Banten
3.5 Years A C H I E V E M E N T
2014 2015 2016 2017
421.927 Certificated
manpower by 201764
SKK
104
SKK
107
SKK
45
SKK
3.5 Years A C H I E V E M E N T
13.236 SMK 192 Politeknik
301 BLK 9.106 LPK Swasta
3.5 Years A C H I E V E M E N T
Sumber : Kementerian Tenaga Kerja dan Kementerian Perindustrian
Government Policy: Improvement of Human Resources Through
Vocational School
26
3

38
Progress Status of National Strategic Projects (PSN) and 35 GW Electricity Program
Progress of PSN and Programsper June 20181
2 projects already completed
6 projects in transaction
53 projects and 1 Airplane Industry Program in
preparation
29 projects in construction and will start operating in 2018
44 projects and 1 Electricity Program in construction and
partial operation phase
52 projects in construction and will start operating in 2019
37 projects in construction and will start operating after 2019
1%
20%
13%
23%
16%
3%
24%
223 + 3 PSN
2.614 MW are operating
17.403 MW are in construction
12.281 MW have signed PPA but have not reached financial close
1.002 MW are in planning
35GW
2.135 MW are in procurement
Progress of 35 GW Electricity Programper July 2018
3%6%
35%
49%
7%
1 Excluding the economic equality program that will be reported separately
Government Policy: Accelerate Infrastructure Development4.1

39
Government Encourages The Center Of Economic Growth Through SEZ
Investment incentives in SEZs▪ 100% foreign ownership▪ Corporate Income Tax
Holiday up to 25 years / local taxes in tourism SEZ
▪ *for activities that comply with the main focus of the zones
▪ Tax allowance up to 10 years
▪ Competitive Capital Cost ▪ Online Single Submission
and One Stop Shop for all relevant clearance
▪ 0% import duties for imported goods (negative list) entering SEZ
▪ 0% Value-Added Tax for transaction within SEZ
▪ Simplified immigration formalities
Total Output 12 SEZUSD 4,8 Billion
Expected Minimum PDB2025
USD 1.908 TrillionPer Capita US$ 6700/Capita
Expected Output (2025)USD 53 Billion
4.2

Kuala Tanjung Landak
Tanggamus Kendal
Tanah Kuning Morowali Buli, Halmahera Timur BintuniKetapang
Batulicin
Jorong
KonaweGresikTanjung Buton Wilmar Serang Bantaeng
40
Government is Developing 14 Integrated Industrial Zones Across Indonesia Such as Aluminum, Food, Manufacturer, Furniture Industry, Etc.
4.3

Realization
Rp 96,7 Trilion
0.3%KUR of Placement for Migrant Worker (TKI)
32.9% KUR RETAIL
66.8% KUR of MicroKUR Distribution Performance of 2017
Stakeholders14 Central Government2 Supervisor34 Bank (State-owned Enterprises (BUMN) & Privates)
4 Non Bank Institutions2 Cooperatives2 Deposite Insurance Agency (LPS)Entire Regional Government (Province, Municipalities)
Economic Sector
Fisheries, Hunting, Forestry, Processing Industry, Trade, Construction, and Services
Debtor
2,893,035
Rp 65,2 Trilion
Rp 31,2 Trilion
Rp 0,3 Trilion
Realization of KUR by July 2018:
65%(of target at Rp 126.9 Trilion)
NPL: 0.04%41
5 Expansion of KUR Recepient

AMENDMENT OF KUR 2018B a s e d o f P e r m e n k o N o . 11 T h n 2 0 1 7
The Business Group Becoming The
Recipient Of KUR
Special KUR Schemes (For Plantations, Livestock, And
Fishery)
Interest Rate of KUR in 2018 to be 7%
Minimum Portion of Distribution to the Production Sector
Multisectoral KUR Scheme
Payment Mechanism for Bayar Panen
(Yarnen) and Grace Period
Changing Terminology of Retail KUR to be Small KUR
Micro KUR Ceiling for Production sector is Rp 25 Million per
production cycle, while outside the maximum production sector
the ceiling accumulation is Rp100 million
Channel distribution in conjunction with other
allowed credits (KUR, KPR, KKB, SSRG)
Cost Structure of Placement Migrants
Worker’s KUR
KUR for Border Inhabitans
KUR for the KUBEoptimalization
42
To optimize the KUR program implementation and the accuracy increase of KUR distribution target, the Coordinating Ministry for Economic Affairs
designated Regulation Number 11 of 2017 regarding the KUR Implementation Guidelines. The 12 KUR policy points are valid from January 1, 2018.

In the last three years, government has taken some strategic measures to improve
financial inculsion:
FINANCIAL INCLUSION PROGRAM
Issuance of regulation related to NSFI:
1. President Regulation No 82/2016 on NSFI
2. Decree of Coordinating Ministry for Economic
Affairs No 93/2017 on Working Groups and the
Secretariat of National Council of Financial
Inclusion.
3. Coordinating Ministry for Economic Affairs
Regulation No 6/2017 on Work Mechanism and
Procedure of National Council of Financial
Inclusion.
01
Implementation of Financial Inclusion program:
1.Non-cash allowance such as Non-cash Social
Allowance, Non-cash Food Allowance, Farmer Card,
Smart Indonesia Program.
2.Credit program for people business including
People Business Credit (KUR) and Developing
Prosperous Family's Economy (Mekaar)
3.Financial services program by agent namely Digital
Financial Services and Laku Pandai where people
can open bank account through agents
02
03As the ecosystem of financial service sector has been developing in the last three years, Indonesia financial service and infrastructure sector regulator has succeeded to encourage some key aspects in
improving financial service ecosystem such as:
1. National Non-Cash Movement has promoted Less Cash Society,
2.Development of regulation which facilitate the growth of
financial technology,
3.Implementation of Palapa Ring and Base Transceiver Station
have increased the internet coverage to 55% of villages in
Indonesia
4. The launching of National Payment Gate in 4 December 2017
expands interoperability of financial service.
Acceleration of market access expansion of farmer/fisher/entrepreneur in village through food e-commerce application platform.
1. Market access expansion of farmer/fisher/entrepreneur in
village through food e-commerce application platform.
2. Beside market access, the application allows expansion of
farmer/fisher/entrepreneur’s access to financial products
especially financing and insurance.
terutama pembiayaan dan asuransi.
3.The application already can be utilized in some pilot regions before
it's national implementation date of 2019.
04
5

Indonesia encourages the use of savings accounts: 42% of savings account holders are in formal financial institutions such as banks or microfinance institutions - 10% higher than the average of developing countries.
10%higher than the average
of developing countries.
GLOBAL FINDEXINDONESIA
Digital payment activity has increased, such as in making or receiving online payment system
2014 2017
62% 71%
Referring to Global Findex 2017 survey result, Indonesia needs to add 54,388,751 adult residents who have accounts in formal financial institutions to achieve the target of 75% of financial
inclusion in 2019

To accelerate financial inclusion while achieving Indonesia finansial inclusion target in 2019, Indonesia’s National Council of Financial Inclusion has recommended strategic measures which
will be executed by seven working groups.
STRATEGY TO ACCELERATE FINANCIAL INCLUSION
1
2
34
5
6
Encourage the increasing role of cooperative in rural area to expand its service range
Use biometric data of electronic national identity card (KTP-el) for e-KYC and as obligation to open bank account
Expand financial services through synergy with Telko and non-bank institutions
Enhance electrification and internet infrastructure that support financial inclusion
Accelerate the certification of community property rights
Increase public awareness of bankaccount opening and financial literacy

The Rich and The Poor
Indonesia has experienced a considerable growth in savings account holder for
the poor between 2014 and 2017, from 22% to 37%. This growth is much higher
than other countries in East Asia and the Pacific which below 10%.
1
22% 37%
2014 2017
The Poor The Rich
57%45%
2014 2017
Rp
2
2014 2017
35% 46%
2014 2017
37% 51%
Financial Inclusion RateBased on Gender
Indonesia is one of the countries experiencing gender equality in account
ownership. The percentage of adult women holding savings account is greater
than the percentage of adult males, which is 51% and 46%. Though, men have a
higher percentage of account ownership than women globally.
2014 2017
3Financial Inclusion RateBased on Living Location
Ownership of savings account in rural areas increased
sharply. By 2014, only 28% of rural adults have savings
account in formal financial institutions. By 2017, the
percentage increases to 47%. There is a 15% increase in
ownership of saving accounts in rural areas. This increase in
ownership of savings accounts is greater than that of East
and Pacific (2%) and global (8%) countries.
29% 47%
Urban Area
51%46%
FINANCIAL INCLUSION SEGMENTATIONINDONESIA
Rural Area
Male Female
2014 2017
29% 47%

Use an account to pay bills
12%
4%
Use the internet to
pay bills
11%
Use the internet to
buy product online
Use the internet or
mobile phone to access
the account
8%
INDONESIA DIGITAL FINANCIAL DEVELOPMENT
Indonesia has made rapid progress in digital financial transactions over a period of three years.
As many as 35% of adult population has made or received payment
digitally or increased 13% compared to the results of 2014. The
amount of adult population who use digital transactions for certain
purposes include: