encouraging direct reductions in insert the title of your ... · pdf fileencouraging direct...
TRANSCRIPT

Insert the title of your presentation here
Presented by Name Here Job Title - Date
Encouraging direct reductions in car use
Dr Sally Cairns Senior Research Fellow, TRL & UCL
IEA workshop: Transport, energy efficiency and behaviour, 10/5/16, Paris.

Improve energy
efficiency
More efficient vehicles
and driving
Reduce private car ownership and use
Demand
management
Modal shift

MOT project (2012-2016)
www.motproject.net
Information from licensing records, and periodic technical inspections
(the MOT test), together with Census data, has enabled the creation of
a 2011 dataset about every vehicle registered in Britain, including:
• Distance travelled in the last year by each vehicle
• Vehicle characteristics, including average emissions and fuel
economy.
Vehicle location is known at a relatively small-scale – enabling the
division of Britain into ‘small areas’ of about 700 households each*.
*34,753 lower super output areas in England and Wales; 6976 data zones in Scotland.

‘Small area’ data display Where are all the VW diesels?
0
500
1000
1500
2000
2500
3000
3500
4000
4500
5000
6.5
6.6
6.7
6.8
6.9 7
7.1
7.2
7.3
7.4
7.5
7.6
7.7
7.8
7.9 8
8.1
8.2
8.3
8.4
8.5N
um
be
r o
f sm
all a
reas
Fuel economy (litres/100km)
0
500
1000
1500
2000
2500
3000
3500
146
147.5
149
150.5
152
153.5
155
156.5
158
159.5
161
162.5
164
165.5
167
168.5
170
171.5
173
174.5
176
More
Nu
mb
er
of
smal
l are
as
Average CO2 emissions per vehicle (g/km)
Page 5
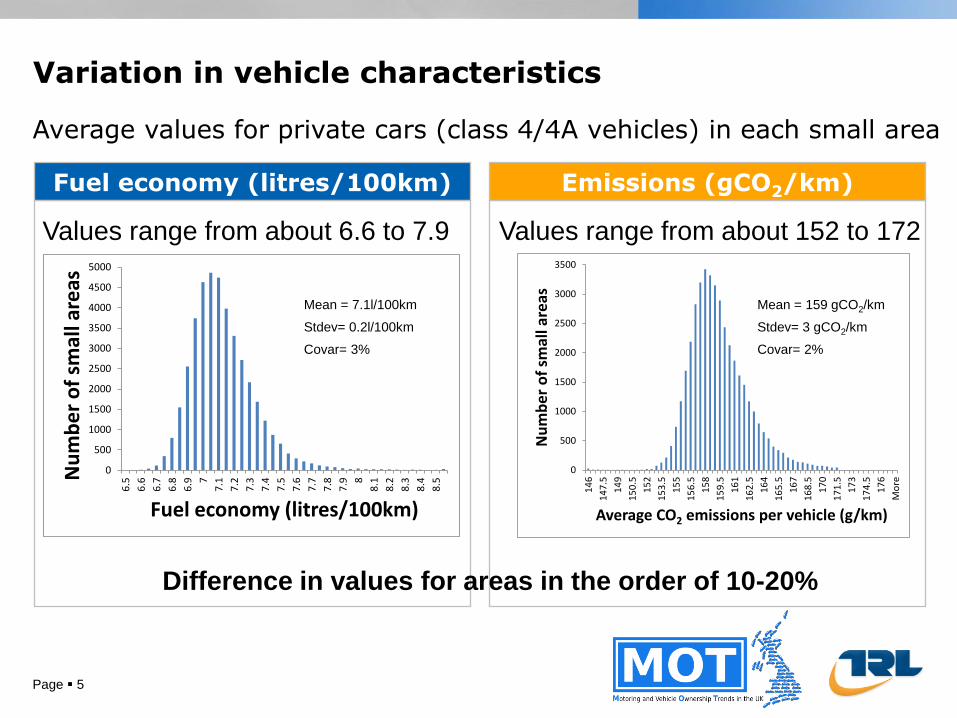
Variation in vehicle characteristics
Fuel economy (litres/100km) Emissions (gCO2/km)
Average values for private cars (class 4/4A vehicles) in each small area
Mean = 159 gCO2/km
Stdev= 3 gCO2/km
Covar= 2%
Values range from about 152 to 172
Mean = 7.1l/100km
Stdev= 0.2l/100km
Covar= 3%
Values range from about 6.6 to 7.9
Difference in values for areas in the order of 10-20%

0
200
400
600
800
1000
1200
1400
250
750
1250
1750
2250
2750
3250
3750
4250
4750
5250
5750
6250
6750
7250
7750
8250
8750
9250
9750
10250
10750
11250
11750
Nu
mb
er
of
smal
l are
asKms per person per year
0
200
400
600
800
1000
1200
1400
1600
2.5
7.5
12.5
17.5
22.5
27.5
32.5
37.5
42.5
47.5
52.5
57.5
62.5
67.5
72.5
77.5
82.5
More
Nu
mb
er
of
smal
l are
as
Cars per 100 people
Page 6
Variation in car ownership and use
Car ownership
Values range from about 10 to 80
Car use
Average values for private cars (class 4/4A vehicles) in each small area
Values range from about 1000 to 10000
Mean = 42
Stdev= 15
Covar= 35%
Mean = 4885
Stdev= 1934
Covar= 40%
Difference in values for areas in the order of x8 or x10

Page 7
Total energy use more dependent on average mileages than types of vehicles owned
Link to average car use
R2 = 0.77
Link to average emissions
Data for private cars (class 4/4A vehicles) in each small area
R2 = 0.016
0
2000
4000
6000
8000
10000
12000
14000
16000
18000
20000
145 150 155 160 165 170 175 180 185
Tota
l en
erg
y u
se (
'00
0 k
Wh
p.a
.)
Emissions per vehicle (gCO2/km)
0
2000
4000
6000
8000
10000
12000
14000
16000
18000
20000
0 2000 4000 6000 8000 10000 12000
Tota
l en
erg
y u
se (
'00
0 k
Wh
p.a
.)
Kms per person per year

Underlying geo-demographic characteristics only partially determine car use
Use of a model using
data about population
density, average
median income, and
the proportion of
people aged over 65 is
successful at predicting
about 70% of the
variance in the miles
per person in any given
small area.
Values are ‘000 miles per person per annum travelled in
private cars for each small area (LSOA) in England and Wales
0
1
2
3
4
5
6
0 1 2 3 4 5 6 7
Pred
icte
d d
ista
nce t
ravelled
Actual distance travelled

International survey https://www.smartsurvey.co.uk/s/Vehicleinspections/

Declining car use in urban areas
‘Peak car’?
London 2012 Olympics
Page 11
35% adults in London
modified their behaviour
on a weekday during the
Olympics

Page 12
Measure – reducing road space for cars
Evidence from about 150 sources for nearly 100 places from 14 countries.
Examples included pedestrianisation schemes, bus and cycle lanes, and
road closures due to maintenance, construction and natural disasters.
On average, 41% traffic
reduction on the treated roads,
of which less than half
reappeared on other routes.
Median overall traffic
reduction of 14%-16%.
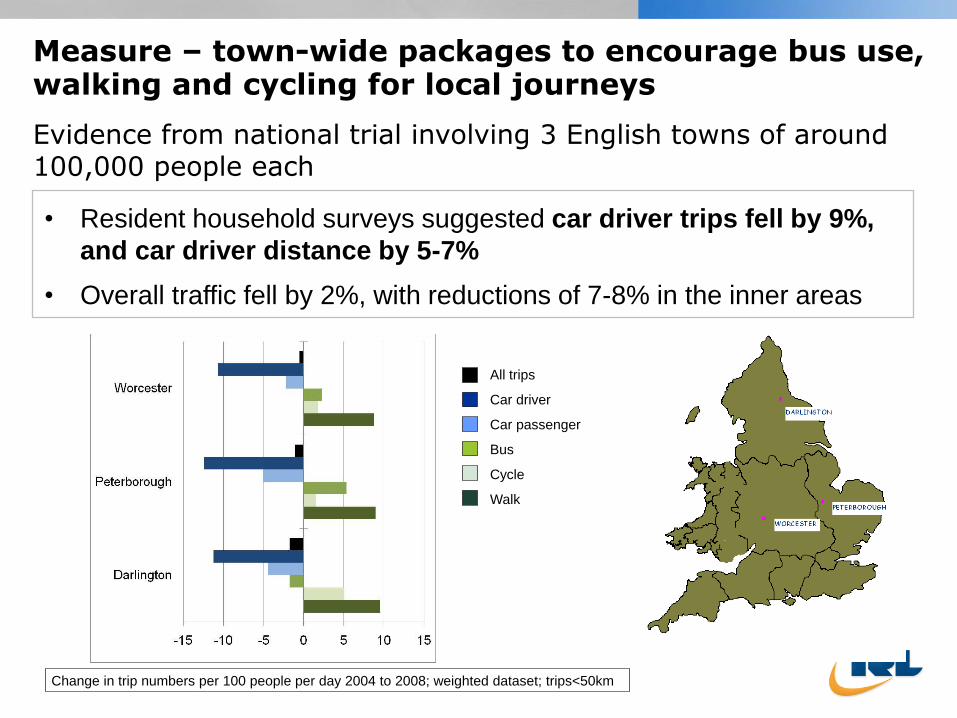
Measure – town-wide packages to encourage bus use, walking and cycling for local journeys
Evidence from national trial involving 3 English towns of around 100,000 people each
• Resident household surveys suggested car driver trips fell by 9%,
and car driver distance by 5-7%
• Overall traffic fell by 2%, with reductions of 7-8% in the inner areas
All trips
Car driver
Car passenger
Bus
Cycle
Walk
Change in trip numbers per 100 people per day 2004 to 2008; weighted dataset; trips<50km
-15 +15
Page 14
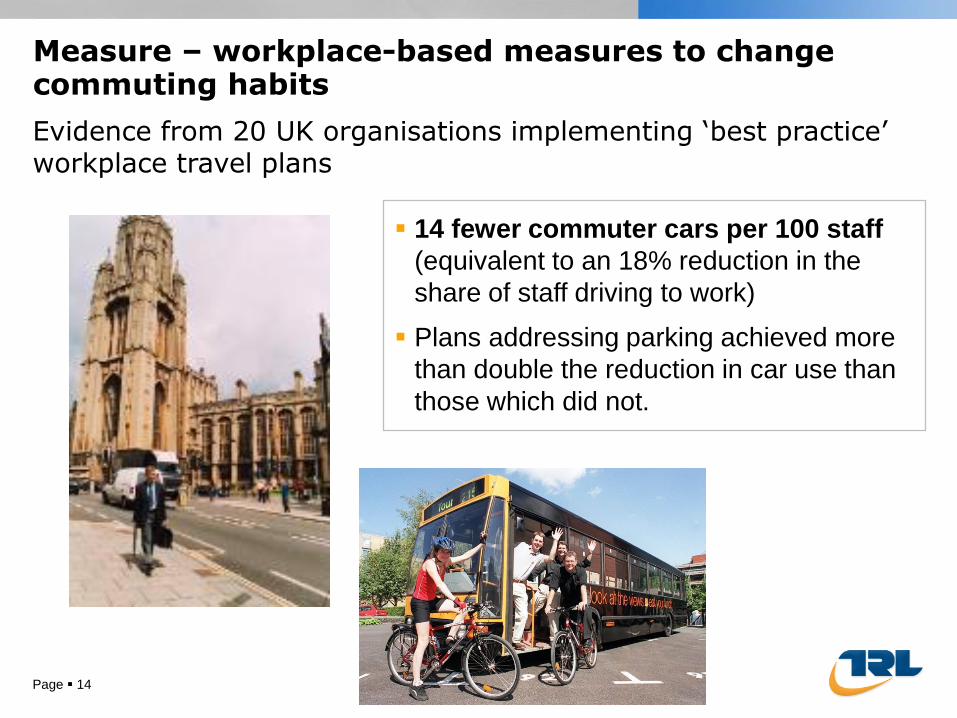
Measure – workplace-based measures to change commuting habits
Evidence from 20 UK organisations implementing ‘best practice’ workplace travel plans
14 fewer commuter cars per 100 staff
(equivalent to an 18% reduction in the
share of staff driving to work)
Plans addressing parking achieved more
than double the reduction in car use than
those which did not.
Page 15
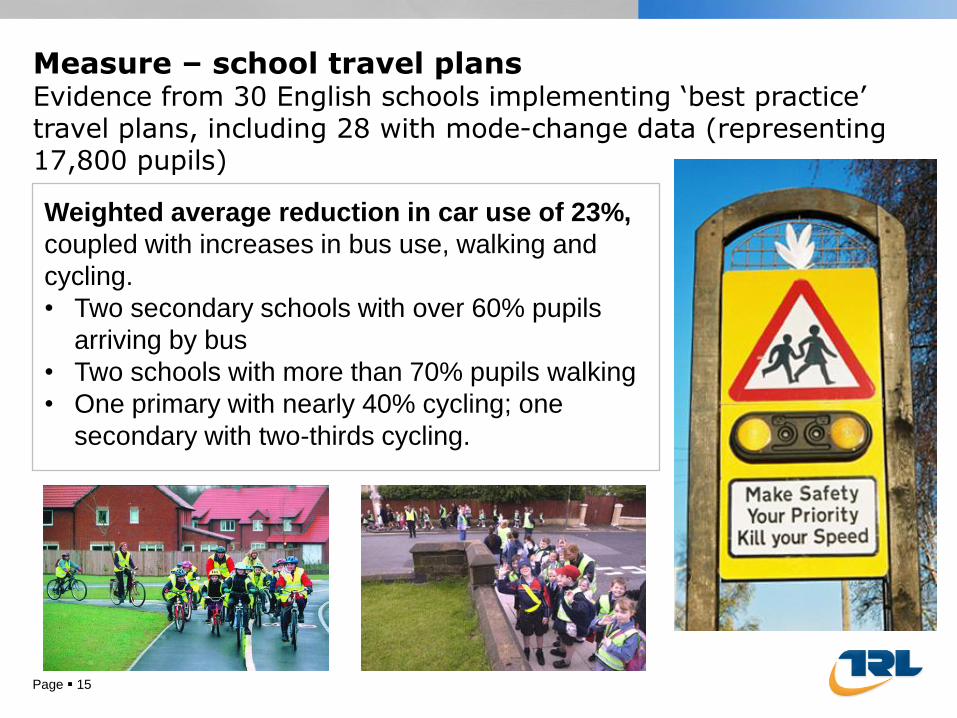
Measure – school travel plans Evidence from 30 English schools implementing ‘best practice’ travel plans, including 28 with mode-change data (representing 17,800 pupils)
Weighted average reduction in car use of 23%,
coupled with increases in bus use, walking and
cycling.
• Two secondary schools with over 60% pupils
arriving by bus
• Two schools with more than 70% pupils walking
• One primary with nearly 40% cycling; one
secondary with two-thirds cycling.
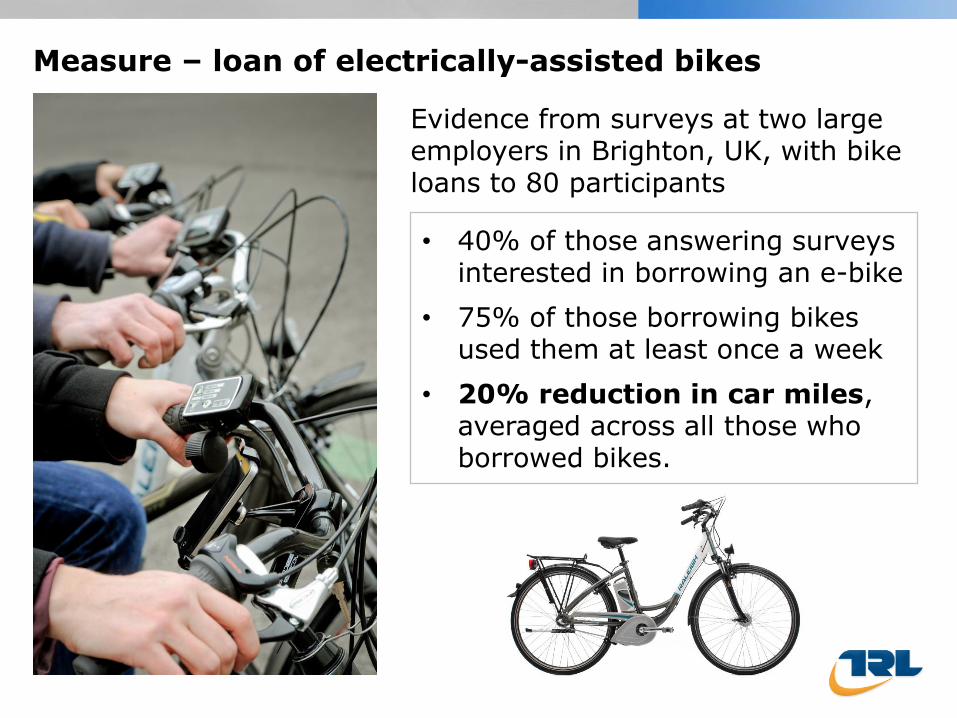
Measure – loan of electrically-assisted bikes
Evidence from surveys at two large employers in Brighton, UK, with bike loans to 80 participants
• 40% of those answering surveys interested in borrowing an e-bike
• 75% of those borrowing bikes used them at least once a week
• 20% reduction in car miles, averaged across all those who borrowed bikes.
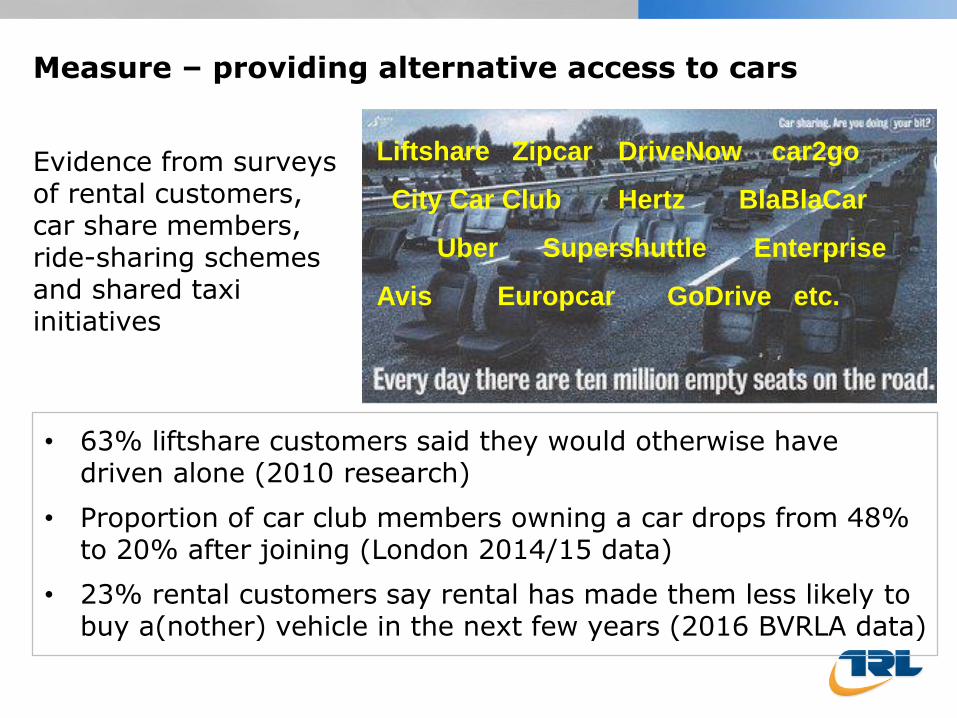
Measure – providing alternative access to cars
Evidence from surveys of rental customers, car share members, ride-sharing schemes and shared taxi initiatives
• 63% liftshare customers said they would otherwise have driven alone (2010 research)
• Proportion of car club members owning a car drops from 48% to 20% after joining (London 2014/15 data)
• 23% rental customers say rental has made them less likely to buy a(nother) vehicle in the next few years (2016 BVRLA data)
Liftshare Zipcar DriveNow car2go
City Car Club Hertz BlaBlaCar
Uber Supershuttle Enterprise
Avis Europcar GoDrive etc.