encoding trader ‘horse-sense’ - stanford...
TRANSCRIPT

Stanford AI Lab & Peeking Possum LLC Encoding Trader ‘Horse-Sense’
Encoding Trader ‘Horse-Sense’:Ideas and Experiments using Historical Foreign Exchange Data
Selene MakariosStanford University AI Lab & Peeking Possum LLC
[email protected] [email protected]
1
1

Stanford AI Lab & Peeking Possum LLC Encoding Trader ‘Horse-Sense’
Introduction
• horse-sense colloq. (orig. U.S.)“A coarse, robust, and conspicuous form of shrewdness.”
• Early reference: 1870 Nation (N.Y.) 18 Aug. 105“The new phrase – born in the West, we believe – of ‘horse-sense’, which is applied to the intellectual ability of men whoexceed others in practical wisdom.” (OED)
2
2

Stanford AI Lab & Peeking Possum LLC Encoding Trader ‘Horse-Sense’
Introduction
•A classical (pre-connectionist, pre-Bayesian network) artificialintelligence paradigm:
– Logical or algorithmic encoding of common-sense informa-tion and heuristic procedures.
– Incorporation into computational processes.
3
3

Stanford AI Lab & Peeking Possum LLC Encoding Trader ‘Horse-Sense’
Introduction
• Trade with the trend.•Cut losses short.• Let gains run.
These three trading dictums, which we characterize as “horse-sense” trading principles, are often found explicated in lay-audiencetreatments of trading, and elsewhere.
4
4

Stanford AI Lab & Peeking Possum LLC Encoding Trader ‘Horse-Sense’
Introduction
Tools and Tactics for the Master Day Trader– Oliver L. Velez, Greg Capra
Trader Vic–Methods of a Wall Street Master– Victor Sperandeo and T. Sullivan Brown
The Four Cardinal Principles of Trading– Bruce Babcock
Lessons from the Greatest Stock Traders of All Time– John Bok
How to Trade Stocks– Jesse Livermore
5
5
Stanford AI Lab & Peeking Possum LLC Encoding Trader ‘Horse-Sense’
Introduction
•What do they mean?•Can they can be gainfully incorporated into computational trad-
ing?• This approach would be qualitatively different from traditional
price-series modeling and prediction techniques involving:
– autoregressive moving-average– conditional heteroscedastic models– others
6
6

Stanford AI Lab & Peeking Possum LLC Encoding Trader ‘Horse-Sense’
Spoiler
•We find some evidence that suitable encoding and applicationof the three principles can result in a parameterized tradingmodel in which historically-inferred parameter values yieldcomputationally-driven returns exceeding those of the analo-gous strategy with randomized parameters; that is:
– A strategy that chooses parameters by inspecting historicaldata behaves differently vs.
– A strategy that ignores the historical data.
7
7

Stanford AI Lab & Peeking Possum LLC Encoding Trader ‘Horse-Sense’
Formulating “Cutting Losses Short”
•What does this mean?
– Don’t allow an (unrealized) loss on a position to influence adecision to close.
– A natural emotional reaction to an unrealized loss is to hopethat it will reverse.
– In fact, the greater the unrealized loss, the more difficult itis to close the position – converting an unrealized loss to arealized loss is painful.
– Maintain a loss threshold, and if it is exceeded, cut the lossshort and take the hit.
8
8

Stanford AI Lab & Peeking Possum LLC Encoding Trader ‘Horse-Sense’
Formulating “Letting Gains Run”
•What does this mean?
– Don’t allow an (unrealized) gain on a position to influence adecision to close.
– A natural emotional reaction to an unrealized gain is to fearthat it will vanish.
– Maintain a gain threshold, and until it is exceeded, hold theposition.
– If the gain evaporates, so be it.
9
9

Stanford AI Lab & Peeking Possum LLC Encoding Trader ‘Horse-Sense’
Asymmetric Trading – the Trailing Stop
10
10
Stanford AI Lab & Peeking Possum LLC Encoding Trader ‘Horse-Sense’
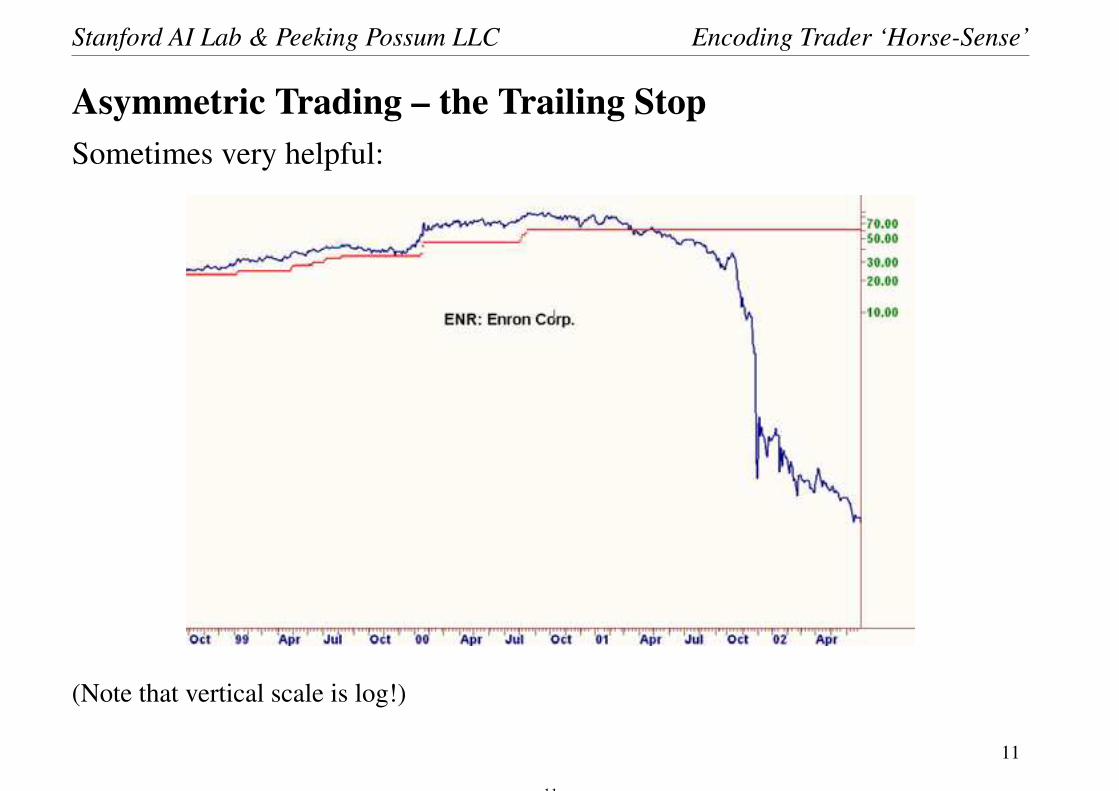
Asymmetric Trading – the Trailing StopSometimes very helpful:
(Note that vertical scale is log!)
11
11
Stanford AI Lab & Peeking Possum LLC Encoding Trader ‘Horse-Sense’
Asymmetric Trading – the Trailing Stop
•Use of trailing stop could be regarded as a single mechanismthat captures both sides of:
– cut losses short– let gains run
in a disciplined way.
12
12

Stanford AI Lab & Peeking Possum LLC Encoding Trader ‘Horse-Sense’
Formulating “The Trend”
•Definition of trend based on heuristics loosely derived fromthe writings of Jesse Livermore (the “World’s Greatest StockTrader”),– Born July 26, 1877, began “bucket shop” trading at age 15, eventu-
ally reached sufficient notoriety due to his gains that the bucket shopscollaboratively blacklisted him.
– Gained $3M by shorting in the crash of 1907.– Lost most of that on one bad cotton future trade by repeatedly adding
to a losing position.– Gained $100M shorting in the crash of 1929.– Managed to lose most of that by 1934.– Went bankrupt.– Committed suicide November 28, 1940.
13
13

Stanford AI Lab & Peeking Possum LLC Encoding Trader ‘Horse-Sense’
Formulating “The Trend”
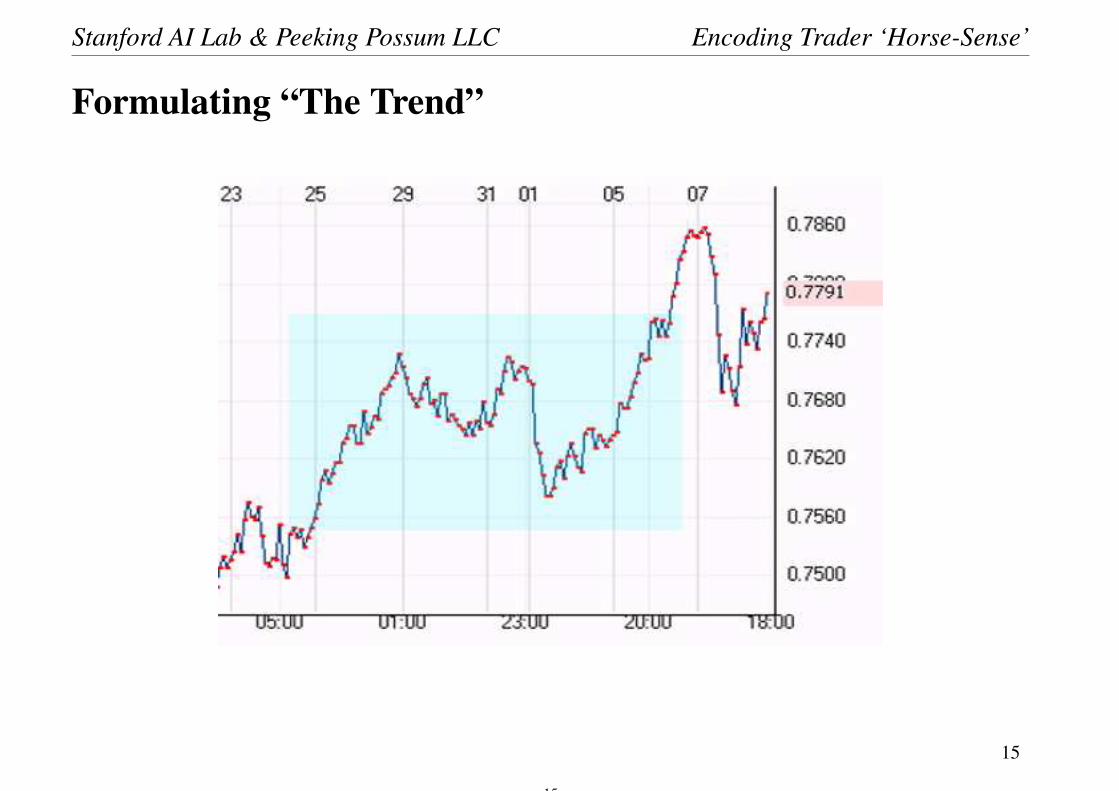
•Define an “upward trend”
– a “peak” is detected,– retreated from,– then surpassed,
all within a given time window.•A “peak” is just a net downward change in price by a specified
amount, within the time window.• So, “upward trend” = a peak, a dip, and an overcompensating
recovery.• “Downward trend” is the complement.
14
14
Stanford AI Lab & Peeking Possum LLC Encoding Trader ‘Horse-Sense’
Formulating “The Trend”
15
15

Stanford AI Lab & Peeking Possum LLC Encoding Trader ‘Horse-Sense’
“Agent”-based Approach
•Agents (software entities) watch for trend formations, and openand close positions accordingly using trailing stops.
•Dimensions of agent parameter space:
– window size– peak size– trailing-stop size
16
16

Stanford AI Lab & Peeking Possum LLC Encoding Trader ‘Horse-Sense’
Agent Parameter Space
• 3-dimensional parameter space:– Sliding window length: 0.7 to 25 days, logarithmically spaced, 16
values.– Peak size (minimum dip): 7 to 350 pips, logarithmically spaced, 16
values.– Trailing stop spread: 6 to 300 pips, logarithmically spaced, 16 values.
• Each agent’s behavior is governed by one triple within the pa-rameter space.
• The entire population of agents is 16 x 16 x 16 = 4096.
17
17

Stanford AI Lab & Peeking Possum LLC Encoding Trader ‘Horse-Sense’
•Compensating for “drift”: both the historically-based and ran-domized strategies have equal position bias.
– Equivalently: all price-series data were de-biased by pre-processing.
•All comparison testing between the historical and randomizedstrategies was done out-of-sample.
18
18
Stanford AI Lab & Peeking Possum LLC Encoding Trader ‘Horse-Sense’
• Experiment: Divide the historical data in half. Call the earlierhalf “in sample”, and the later half “out of sample”.– Allow all 4096 agents to perform “hypothetical” trades on the in-
sample data.– For each agent, record∗ the highest net gain (gain relative to initial capital),∗ the lowest net gain, and∗ the final net gain.
• Each agent gets a score given by the sum of these three fig-ures. (Why: this (very crudely) correlates with average netgain (from initial capital) of agent during trial.)
• The ten highest-scoring agents participate in out-of-sample test.
19
19

Stanford AI Lab & Peeking Possum LLC Encoding Trader ‘Horse-Sense’
The Arbitor
•After in-sample run, choose the agents with the ten highestscores.
•Using the out-of-sample data, begin hypothetical trading withthese ten agents.
• For each agent, the arbitor maintains a sliding average of thatagent’s net gain.
•At regular intervals, the arbitor chooses the agent with thehighest sliding-average net-gain currently.
• The arbitor (actually) executes the (hypothetical) trades indi-cated by the chosen agent, for the duration of the current inter-val. The hypothetical trades of the other agents are computedbut not used by the arbitor.
20
20

Stanford AI Lab & Peeking Possum LLC Encoding Trader ‘Horse-Sense’
The Arbitor
• Selecting ten agents from the agent parameter-space amountsto choosing 30 parameters of a trading model.
• If in-sample price-change behavior contains no informationabout out-of-sample price-change behavior, then a choice ofthe 30 parameters based on inspection of the in-sample pricedata should, on average, perform as well as (i.e. not betterthan) 30 parameters chosen randomly from the parameter-space.
• In practice, we chose ten arbitrary agents and compared theirperformance with the ten highest-scoring agents from the in-sample run.
21
21

Stanford AI Lab & Peeking Possum LLC Encoding Trader ‘Horse-Sense’
Agent Performance on Out-of-sample Data
Bse. Ctr.
Best
10 Net
Gain
Rand.
10 Net
Gain Bse. Ctr.
Best
10 Net
Gain
Rand.
10 Net
Gain Bse. Ctr.
Best
10 Net
Gain
Rand.
10 Net
Gain
AUD JPY 568 -1822 x 2AU JPY -2486 -1936 x 2US BEF -16884 -98093 x
AUD USD -1591 -1463 x 2AU USD -2081 -2367 x 2US CAD -618 -1679 x
CAD JPY 66 -11 x 2CH JPY -1132 -4266 x 2US CHF -2636 -2606 x
CHF JPY -1093 -1513 x 2DE CHF -577 -995 x 2US DEM -2705 -2834 x
EUR AUD 449 119 x 2DE JPY -1100 -4167 x 2US DKK -302 -519 x
EUR CAD -14 -241 x 2EU CHF -576 -2272 x 2US ESP -3422 -35666 x
EUR CHF -689 -513 x 2EU GBP -1245 -900 x 2US FIM -9183 -14966 x
EUR GBP -910 -1371 x 2EU JPY -3427 -2839 x 2US FRF -12515 -7445 x
EUR JPY -733 -806 x 2EU USD -1852 -1885 x 2US HUF -9467 -32301 x
EUR USD -90 -404 x 2GB CHF -6640 -15984 x 2US ITL -4540 -2185 x
GBP CHF -2437 -4534 x 2GB DEM -6057 -14504 x 2US JPY -961 -5185 x
GBP JPY 398 -1619 x 2GB EUR -2545 -6010 x 2US NLG -1757 254 x
GBP USD 501 -1571 x 2GB JPY -711 -3134 x 2US NOK -1290 -56626 x
USD CAD -366 -2011 x 2GB USD 317 -5982 x 2US SEK -1790 -28980 x
USD CHF -1498 -3106 x 2NZ USD -1007 -2022 x 2US SGD -2341 -872 x
USD JPY -1715 -1645 x 2US ATS -1451 -34846 x
Performance of best ten agents and of random ten agents onout-of-sample historical data.
22
22
Stanford AI Lab & Peeking Possum LLC Encoding Trader ‘Horse-Sense’
Agent Performance on Out-of-sample Data
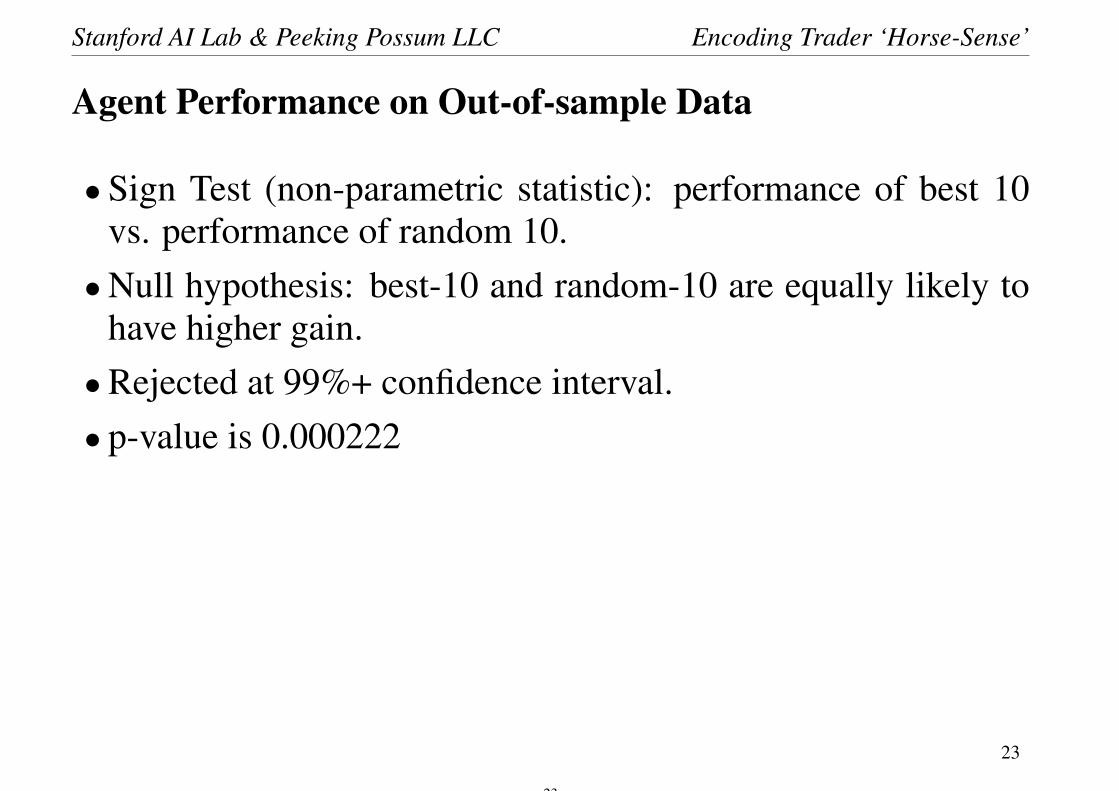
• Sign Test (non-parametric statistic): performance of best 10vs. performance of random 10.
•Null hypothesis: best-10 and random-10 are equally likely tohave higher gain.
•Rejected at 99%+ confidence interval.• p-value is 0.000222
23
23

Stanford AI Lab & Peeking Possum LLC Encoding Trader ‘Horse-Sense’
Price-Chart Discriminator
• The computational machinery developed here can be used toconstruct a discriminator of historical FOREX price-charts ver-sus random price-charts.
•Random price charts are generated by Wiener/Martingale pro-cesses having means and variances the same as those of thehistorical data.
•A total of 36 random price-charts were generated, de-biased,and tested (both normal and log-normal error term distribu-tions were tried, with no observable difference).
24
24

Stanford AI Lab & Peeking Possum LLC Encoding Trader ‘Horse-Sense’
Price-Chart DiscriminatorMean Std
Mean/
Std Mean Std
Mean/
Std Mean Std
Mean/
Std Mean Std
Mean/
Std
AUD JPY -67.40 100.31 -0.672 2GB USD -3.3557 6.0669 -0.553 NOI ZAJ -356.26 116.50 -3.058 NNO IEU -1.2006 0.7808 -1.538
AUD USD -0.3425 0.4733 -0.724 2NZ USD -1.7765 3.4507 -0.515 NOI ZAU -0.5010 0.3777 -1.327 NNO IGF -1.9282 0.8896 -2.168
CAD JPY -2.3817 2.4979 -0.953 2US CAD -2.9311 4.8862 -0.600 NOI ZCJ -12.75 3.9363 -3.238 NNO IGJ -271.56 104.79 -2.591
CHF JPY -50.105 60.417 -0.829 2US CHF -6.1424 10.5563 -0.582 NOI ZFJ -221.48 77.67 -2.852 NNO IGU -2.3736 1.1193 -2.121
EUR AUD -2.1876 2.7625 -0.792 2US JPY -344.48 636.94 -0.541 NOI ZEA -1.6304 0.7673 -2.125 NNO INJ -19.2289 11.423 -1.683
EUR CAD -0.0421 0.0410 -1.027 2DE CHF -0.1670 0.2749 -0.608 NOI ZEC -0.0620 0.0403 -1.540 NNO INU -0.2425 0.1449 -1.674
EUR CHF -0.3288 0.4784 -0.687 2DE JPY -22.105 40.169 -0.550 NOI ZEF -0.2893 0.3294 -0.878 NNO IUC -1.3708 0.8780 -1.561
EUR GBP -0.1705 0.2432 -0.701 2GB DEM -5.3227 6.8148 -0.781 NOI ZEG -0.1572 0.1744 -0.901 NNO IUF -1.2729 0.9275 -1.372
EUR JPY -66.972 100.148 -0.669 2GB EUR -2.9077 3.9168 -0.742 NOI ZEJ -366.82 106.71 -3.437 NNO IUJ -154.09 80.544 -1.913
EUR USD -0.6730 0.8392 -0.802 2US ATS -30.937 22.050 -1.403 NOI ZEU -0.5641 0.4172 -1.352
GBP CHF -2.0467 2.6119 -0.784 2US BEF -530.87 293.28 -1.810 NOI ZGF -1.8955 0.7282 -2.603
GBP JPY -176.29 255.08 -0.691 2US CZK -1470.78 735.90 -1.999 NOI ZGJ -565.20 161.44 -3.501
GBP USD -0.6957 1.1111 -0.626 2US DEM -1.7525 2.3737 -0.738 NOI ZGU -1.6875 0.9969 -1.693
NZD JPY -6.9914 13.8979 -0.503 2US DKK -133.35 107.40 -1.242 NOI ZNJ -43.43 14.388 -3.018
NZD USD -0.1280 0.1791 -0.715 2US ESP -996.67 495.34 -2.012 NOI ZNU -0.2714 0.2124 -1.278
USD CAD -0.6774 0.6561 -1.032 2US FIM -10.2551 9.3788 -1.093 NOI ZUC -1.1993 0.9314 -1.288
USD CHF -0.7992 0.8876 -0.900 2US FRF -12.6381 12.9553 -0.976 NOI ZUF -2.3184 1.0971 -2.113
USD JPY -51.370 74.065 -0.694 2US HUF -12016.45 5694.70 -2.110 NOI ZUJ -430.31 113.75 -3.783
2AU JPY -425.22 766.72 -0.555 2US ITL -21953.75 11412.82 -1.924 NNO IAJ -108.26 55.120 -1.964
2AU USD -2.2583 4.5370 -0.498 2US NLG -2.5734 3.2189 -0.799 NNO IAU -0.8602 0.5187 -1.658
2CH JPY -340.15 566.86 -0.600 2US NOK -204.41 165.04 -1.238 NNO ICJ -12.75 3.9363 -3.238
2EU CHF -15.713 31.503 -0.499 2US SEK -420.31 280.00 -1.501 NNO IFJ -84.66 49.53 -1.709
2EU GBP -2.5231 5.3610 -0.471 2US SGD -3.5250 4.9206 -0.716 NNO IEA -2.2451 0.8603 -2.609
2EU JPY -869.63 1536.03 -0.566 2US ZAR -520.28 255.83 -2.034 NNO IEC -0.0172 0.0229 -0.753
2EU USD -2.2370 4.1729 -0.536 2XG USD -357.67 181.08 -1.975 NNO IEF -0.3634 0.2737 -1.328
2GB CHF -44.095 57.827 -0.763 2XU USD -14162.18 6202.24 -2.283 NNO IEG -0.1944 0.2085 -0.932
2GB JPY -1563.87 2027.95 -0.771 NNO IEJ -157.89 81.309 -1.942
Average agent performance on historical price-series (left) andon random-walk price-series (right).
25
25

Stanford AI Lab & Peeking Possum LLC Encoding Trader ‘Horse-Sense’
Price-Chart Discriminator
• Two populations
– average agent gain/loss on historical price-series– average agent gain/loss on randomly generated price-series
•Null hypothesis: common mean for the two populations.•Rejected at a 99%+ confidence interval.• Two-sided un-pooled t-test
– p-value is 0.000000006.
26
26

Stanford AI Lab & Peeking Possum LLC Encoding Trader ‘Horse-Sense’
Price-Chart Discriminator
Green: average agent performance on random price-charts.Red: average agent performance on historical price-charts.
27
27
Stanford AI Lab & Peeking Possum LLC Encoding Trader ‘Horse-Sense’
Price-Chart Discriminator
• These results could be construed as evidence against the Ran-dom Walk Hypothesis.
•What the is physical/sociological/scientific justification for theRandom Walk Hypothesis?
•Why should the distribution of changes in a stock price, bondreturn, commodity price, or FOREX rate be normally distributedand have zero hysteresis?
28
28

Stanford AI Lab & Peeking Possum LLC Encoding Trader ‘Horse-Sense’
Price-Chart Discriminator
•Brownian motion is derivable from properties of molecular ac-tivity (Einstein).
•How is Brownian motion derived for price-series?•Without derivation from first principles, strong claim (normal
distribution and zero hysteresis) requires strong evidence.• Lack of well-known means for exploiting price hysteresis does
not constitute evidence.
– Absence of evidence, not evidence of absence.
29
29

Stanford AI Lab & Peeking Possum LLC Encoding Trader ‘Horse-Sense’
Relating Gain/Loss to Algorithmic Entropy
• Interesting (and serendipitous!) observed relation between:– average agent performance on a price-series, and– the ‘amount of information’ (roughly, the algorithmic entropy) in that
series.
•Heuristically measuring information content: compression al-gorithms.– Perfectly compressed information is indistinguishable from noise.– Noise does not compress; likewise, less compressibility corresponds
to more information.– Heuristic: use compressibility as measure of “information content”.
30
30

Stanford AI Lab & Peeking Possum LLC Encoding Trader ‘Horse-Sense’
Relating Gain/Loss to Algorithmic Entropy
Bse. Ctr.
un-
comp.
(KB)
bz2
(KB)
gz
(KB)
de-
flate
(KB)
log
unc/
bz2
log
unc/
gz
log
unc/
de-
flate
Mean/
Std
Gain Bse. Ctr.
un-
comp.
(KB)
bz2
(KB)
gz
(KB)
de-
flate
(KB)
log
unc/
bz2
log
unc/
gz
log
unc/
de-
flate
Mean/
Std
Gain
AUD JPY 8431.4 704.5 1248.0 2884.0 1.078 0.830 0.466 -0.672 2GB CHF 12590.5 2111.9 3633.2 7084.0 0.775 0.540 0.250 -0.763
AUD USD 7293.7 606.3 1044.7 2468.0 1.080 0.844 0.471 -0.724 2GB DEM 11051.3 1824.5 3222.4 6224.0 0.782 0.535 0.249 -0.781
CAD JPY 251.4 27.5 50.8 112.0 0.961 0.694 0.351 -0.953 2GB EUR 10794.8 1397.5 2488.6 5312.0 0.888 0.637 0.308 -0.742
CHF JPY 8500.5 681.8 1202.7 2832.0 1.096 0.849 0.477 -0.829 2GB JPY 12443.5 1915.7 3685.7 6816.0 0.813 0.528 0.261 -0.771
EUR AUD 8669.8 934.3 1606.5 3464.0 0.968 0.732 0.398 -0.792 2GB USD 12345.2 1640.0 2950.5 6168.0 0.877 0.622 0.301 -0.553
EUR CAD 249.2 30.3 51.9 116.0 0.915 0.681 0.332 -1.027 2NZ USD 9959.6 1182.2 2061.6 4568.0 0.926 0.684 0.339 -0.515
EUR CHF 6975.2 518.3 865.5 2168.0 1.129 0.906 0.507 -0.687 2US ATS 10210.7 2167.3 3126.0 5664.0 0.673 0.514 0.256 -1.403
EUR GBP 7473.8 479.6 807.6 2132.0 1.193 0.966 0.545 -0.701 2US BEF 7896.3 2057.5 2061.2 3876.0 0.584 0.583 0.309 -1.810
EUR JPY 9220.3 855.9 1545.4 3332.0 1.032 0.776 0.442 -0.669 2US CAD 10648.7 1321.3 2316.2 5072.0 0.906 0.663 0.322 -0.600
EUR USD 9653.0 909.6 1586.9 3572.0 1.026 0.784 0.432 -0.802 2US CHF 12365.8 1707.9 3057.4 6332.0 0.860 0.607 0.291 -0.582
GBP CHF 8629.9 949.2 1623.3 3496.0 0.959 0.726 0.392 -0.784 2US CZK 7826.6 2637.6 3769.6 5924.0 0.472 0.317 0.121 -1.999
GBP JPY 8507.4 962.1 1742.1 3460.0 0.947 0.689 0.391 -0.691 2US DEM 10904.7 1583.1 2820.7 5640.0 0.838 0.587 0.286 -0.738
GBP USD 8676.4 939.1 1661.6 3584.0 0.966 0.718 0.384 -0.626 2US DKK 11568.5 2599.6 4587.8 7616.0 0.648 0.402 0.182 -1.242
NZD JPY 918.1 98.8 187.7 412.0 0.968 0.689 0.348 -0.503 2US ESP 10307.0 4742.6 5144.7 7744.0 0.337 0.302 0.124 -2.012
NZD USD 1769.1 178.0 315.4 728.0 0.997 0.749 0.386 -0.715 2US FIM 10626.6 2118.5 3482.8 6124.0 0.700 0.484 0.239 -1.093
USD CAD 6263.1 644.6 1115.1 2464.0 0.988 0.749 0.405 -1.032 2US FRF 10576.3 2156.5 3493.8 6184.0 0.691 0.481 0.233 -0.976
USD CHF 9167.7 975.0 1735.3 3748.0 0.973 0.723 0.388 -0.900 2US HUF 7964.4 4229.3 4699.6 6640.0 0.275 0.229 0.079 -2.110
USD JPY 9209.3 868.6 1580.1 3444.0 1.025 0.766 0.427 -0.694 2US ITL 8732.5 5486.6 5283.9 7332.0 0.202 0.218 0.076 -1.924
2AU JPY 10260.6 1294.7 2391.4 4972.0 0.899 0.633 0.315 -0.555 2US JPY 12801.4 1576.4 2940.4 6104.0 0.910 0.639 0.322 -0.541
2AU USD 11207.0 1276.6 2224.2 5008.0 0.943 0.702 0.350 -0.498 2US NLG 10425.8 1576.9 2777.4 5480.0 0.820 0.574 0.279 -0.799
2CH JPY 10210.6 1237.2 2291.1 4820.0 0.917 0.649 0.326 -0.600 2US NOK 11685.0 2855.2 4916.2 8004.0 0.612 0.376 0.164 -1.238
2DE CHF 4875.6 482.5 815.8 1992.0 1.005 0.776 0.389 -0.608 2US SEK 11710.7 2967.5 5065.8 8104.0 0.596 0.364 0.160 -1.501
2DE JPY 7109.3 787.6 1490.8 3176.0 0.956 0.678 0.350 -0.550 2US SGD 6104.1 831.6 1399.8 2968.0 0.866 0.640 0.313 -0.716
2EU CHF 11893.2 1561.6 2500.9 5664.0 0.882 0.677 0.322 -0.499 2US ZAR 5724.5 1693.6 2597.6 4084.0 0.529 0.343 0.147 -2.034
2EU GBP 11932.8 1246.3 2115.2 5036.0 0.981 0.751 0.375 -0.471 2XG USD 3499.8 987.7 1361.9 2216.0 0.549 0.410 0.198 -1.975
2EU JPY 12156.7 1625.1 3054.2 6136.0 0.874 0.600 0.297 -0.566 2XU USD 5757.2 3706.3 4054.7 5460.0 0.191 0.152 0.023 -2.283
2EU USD 12548.1 1511.0 2692.7 5940.0 0.919 0.668 0.325 -0.536
Historical price-series: compressibility under various compression algorithms, andaverage agent gain/loss.
31
31
Stanford AI Lab & Peeking Possum LLC Encoding Trader ‘Horse-Sense’
Relating Gain/Loss to Algorithmic Entropy
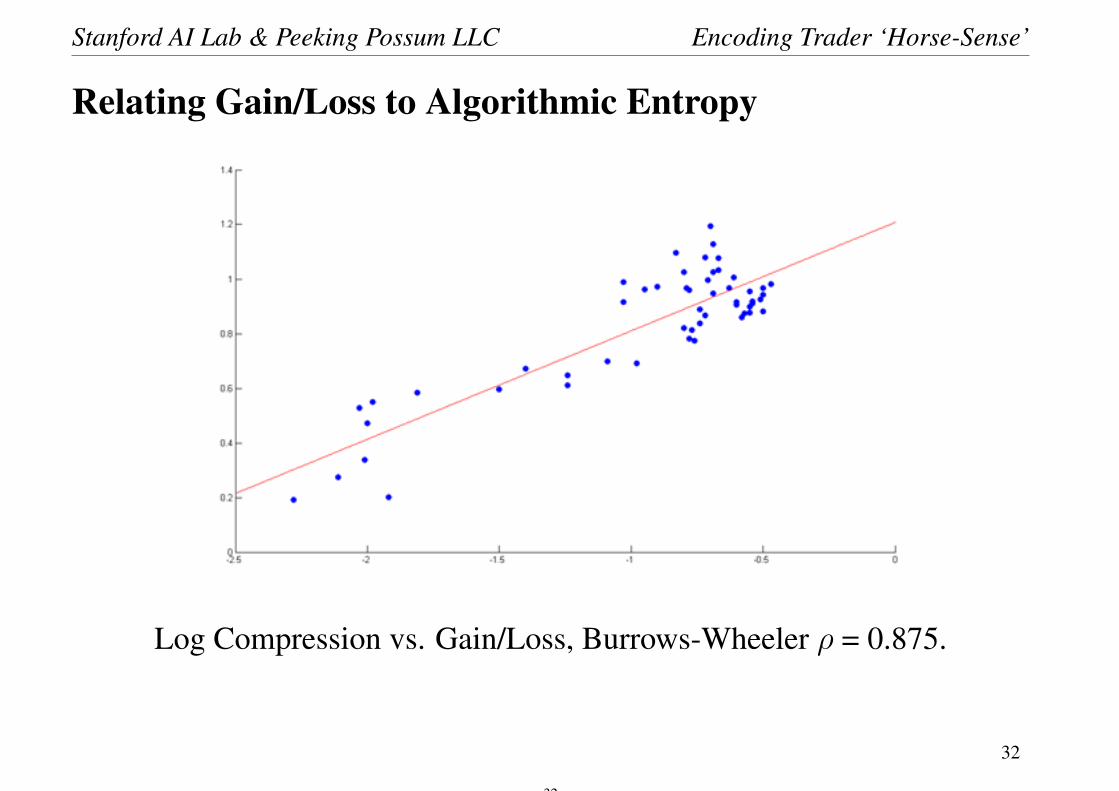
Log Compression vs. Gain/Loss, Burrows-Wheeler ρ = 0.875.
32
32

Stanford AI Lab & Peeking Possum LLC Encoding Trader ‘Horse-Sense’
Relating Gain/Loss to Algorithmic Entropy
Log Compression vs. Gain/Loss, Lempel-Ziv77, ρ = 0.746.
33
33

Stanford AI Lab & Peeking Possum LLC Encoding Trader ‘Horse-Sense’
Relating Gain/Loss to Algorithmic Entropy
Log Compression vs. Gain/Loss, DEFLATE, ρ = 0.797.
34
34

Stanford AI Lab & Peeking Possum LLC Encoding Trader ‘Horse-Sense’
Relating Gain/Loss to Algorithmic Entropy
•Why? Perhaps because:
– Compression algorithms operate by finding (various sorts of)recurring patterns in the data and exploiting them.
– A price signal with no recurring patterns would probably notbe profitable, and also would not compress well!
35
35