encapsulation of solar cells.doc
TRANSCRIPT

7/27/2019 Encapsulation of Solar Cells.doc
http://slidepdf.com/reader/full/encapsulation-of-solar-cellsdoc 1/21
Encapsulation of Solar Cells
Contact: Axel Boden
Solar cells that are to be in operation for a long time need to be protected from
environmental factors such as dampness. To achieve this, the upper side of thesolar cells is covered with a transparent covering layer. This can be glass or plastic
sheet. The covering layer is glued to the surface of the solar cells with a plastic that
networks when heated.
Diagram of a vacuum laminator
In the laboratory, encapsulation takes place in a vacuum laminator (see above
diagram). The solar cell is placed face up inside it on a flat heater plate. EVA (ethyl
vinyl acetate) foil is laid on it and, on top of that, the transparent protective covering
(glass or plastic sheet). The lid of the laminator is then closed. In this lid, there is a
membrane, which now rests on the solar cell, dividing the laminator chamber into
two sealed parts. At the beginning of the process, both of these spaces are
evacuated and at the same time, the solar cell is heated up. On reaching a pre-
determined temperature (e.g. 80°C), air is let in to the space above the membrane.
This presses the membrane onto the stack consisting of solar cell, EVA foil and
covering layer, creating a continuous contact between the individual layers over the
entire surface. Upon increasing the temperature further, the EVA foil polymerises,
at about 150°C, becoming a transparent, thermally stable film and creating a strong
bond between the surface of the solar cells and the covering layer.

7/27/2019 Encapsulation of Solar Cells.doc
http://slidepdf.com/reader/full/encapsulation-of-solar-cellsdoc 2/21
The photo shows the encapsulation station with the vacuum laminator open on the right and controlequipment on the left. The measuring instruments in the middle record the parameters to be
examined during the process of lamination.
"Photovoltaic Energy Systems"Experiment PE1
Solar-ModulesRodrigo Guido Araújo
Dr. Stefan Krauter
Kim Onneken
Dr. Volker Quaschning
________________________________________________________________

7/27/2019 Encapsulation of Solar Cells.doc
http://slidepdf.com/reader/full/encapsulation-of-solar-cellsdoc 3/21
UFRJ-COPPE-EE
TU-Berlin
Contents
1 Solar cell, equivalent circuit and characteristics 41.1 I-V characteristic of the solar cell 71.2 MPP-Power, efficiency, fill factor 91.3 Influence of irradiance on the I-V curve 10
1.4 Influence of temperature on the I-V curve 10
2 Solar module 112.1 Influence of shadowing 122.2 Bypass-diodes 12
3 Measurement of the solar irradiance and the temperature 143.1 Measurement of the solar irradiance 143.2 Measurement of temperature 16
4 Preparation exercises 17
5 Experimentation 175.1 Setting up the experiment 175.2 Recording of I-V characteristics at different temperatures 185.3 Recording of the I-V characteristics for different levels of irradiance 185.4 Recording of the I-V characteristics for different states of shadowing 195.5 Different type of module 19
6 Protocol 19
7 List of equipment 20
8 Literature 20
Prologue
Electricity generated from photovoltaic (PV) systems produces zeroemissions, is modular, and can produce energy anywhere the sun shines.Investment in PV my be cost-effective in certain distributed generation and

7/27/2019 Encapsulation of Solar Cells.doc
http://slidepdf.com/reader/full/encapsulation-of-solar-cellsdoc 4/21
grid-support applications where PV output tends to coincidence with localpeak demands. Small stand-alone PV systems have proven practical in manyareas of the country where connection with the local distribution was toocostly or impractical. Such systems, when coupled with a storage battery,can serve loads such as homes, radio stations, control systems, telephone
repeaters and lighting systems. PV modules may be installed in buildings aspart of the roofing, walls, and/or windows.
Subject of experiment
Tests of PV-Modules at different illumination levels, module temperatures andshadowing.
Aims
• Setting-up of the experiment to trace I-V-characteristics
• Tracing of I-V-curves at different 3 illumination levels• Tracing of I-V-curves at different 3 temperature levels
• Tracing of I-V-curves at different states of shadowing.
• Determination of all module data (e.g. temperature coefficient for power output,
MPP).
• Comparison of different types of modules (mono- and multicrystalline)
Introduction In applied photovoltaics, 20 to 80 solar cells are connected in series to a "Solar
Module” to get a applicable voltage of 10-40 V. A PV solar module consists of asandwich with a front cover of highly transmittive glass solar cells, and either aback cover of glass or of a laminated foil. The cells and the sandwich are sealed bya soft transparent plastic layer, so no moisture could harm. The plastic is oftenEVA (ethylene-vinyl-acetate) which is melted in a vacuum laminator to avoid air-bubbles in the sandwich.The power output of a solar module is given by the manufacturer in W p (Wattpeak), which says that the module was rated at the so called "Standard testconditions”(STC), which mean an illumination level of 1 000 W/m² (which is brightsunshine), a spectrum equivalent to AM 1,5 and 25°C module temperature at thetest. During real application most of the times the illumination is much lower than 1
000 W/m² (average is 200 to 500 W/m² - to measure the actual illumination, a socalled "pyranometer” is used) and the cell temperature is at 40-60°C. Irradiation isseldom at AM 1.5 nor perpendicular to the module surface. Also a part of themodule is sometimes shadowed by trees or buildings or direct dirt (e.g. from birds)accumulation on the front surface. To observe the influence of most of the upper parameters on the electrical performance (as I-V-characteristic, efficiency andpower output) this experiment was designed for.
1. Solar cell, equivalent circuit and characteristics

7/27/2019 Encapsulation of Solar Cells.doc
http://slidepdf.com/reader/full/encapsulation-of-solar-cellsdoc 5/21
This chapter an overview of the different equivalent circuits of the solar cell isgiven, without discussing the physical processes in a profound way.
1. Equivalent Circuits
The simplified equivalent circuit of a solar cell consists of a diode and a current
source which are switched in parallel. The current source generates the photocurrent I Ph, which is directly proportional to the solar irradiance E . The p-n transitionarea of the solar cell is equivalent to a big diode (in admissive orientation) which isalso integrated in the picture.
Figure 1: Simplifiedequivalent circuit of the solar cell.The V-I equation of the simplified equivalent circuit could be derived fromKirchhoff's current law (first law of Kirchhoff: all in- and outgoing currents at point
add up to zero): ( 1.1)withI Ph Photo current
I D Diode currentI S Diode reverse saturation current
m Diode "ideally factor" m = 1...5VT Thermal voltage: ; VT = 25,7mV at 25°C.k constant of Boltzmann k = 1,380658 · 10-23 JK-1 T absolute temperature; [T ] = K (Kelvin) 0 K = -273,15°Ce charge of an electron e = 1,60217733 · 10-19 As
As given by the name, the simplified equivalent circuit doesn't give an optimalrepresentation of the electrical process at the solar cell. At real solar cells a voltageloss on the way to the external contacts could be observed. This voltage loss couldbe expressed by a series resistor R S . Furthermore leakage currents could be
observed, which could be described by a parallel resistor R P .

7/27/2019 Encapsulation of Solar Cells.doc
http://slidepdf.com/reader/full/encapsulation-of-solar-cellsdoc 6/21
Figure 2: Equivalent circuit with one diode of a solar cell..Derived from Kirchhoff´s first law the equation for the extended I-V curve could beachieved.
0 = I Ph - I D - I p - I. with follows
( 1.2)This implicit equation could not be solved to I and U in such an easy way as theequation from the simplified equivalent circuit. Therefore a numeric method (e.g. asNewton-Raphson (see Stoer 1993) have to be applied..
An even more exact modeling could be achieved by the Two-Diode-Model. Heretwo different diodes with different diode ideally factors m connected in parallel.
At the equations of the diode it was always taken for granted the there is nobreakthrough at operation in the inhibited direction of the diode, but at highnegative voltages a breakthrough at the solar cell could be observers. This wasmodeled at the following figure by a variable current source I (V D).
Figure 3: Two-Diode-Model of a solar cell with a second current source to simulate thebreakthrough of the diodes at high negative voltages..The I-V curve of the equivalent circuit can also be derived from the node-law of Kirchhoff. The supplementary term of the equation models the breakthrough athigh negative voltages.

7/27/2019 Encapsulation of Solar Cells.doc
http://slidepdf.com/reader/full/encapsulation-of-solar-cellsdoc 7/21
( 1.3)with
V, I terminal voltage and current at the solar cellI Ph photo currentI S1,I S2 saturation current of the first, respectively the second diodeR S serial resistanceR P parallel resistancem1,m2 diode factor of the first, respectively the second diode (m1 1 (ideal), m2 2)V T temperature voltage (see page 4)V Br breakdown voltage (V Br -15V..-50 V)a correction factor (a = 0..1 -1)n exponent for avalanche breakdown (n = 1..10)
1. I-V characteristic of the solar cell
In the figure shown below measurements and calculated I-V characteristics of amulticrystalline solar cell (10 x 10 cm) are compared. The simplified model (Fig.1)with an ideal diode (m=1) shows still large deviations, while a much better fit couldbe achieved by modeling with a real diode. (m>1). Even more accurate resultscould be completed by the "full" one-diode-model (Fig.2). A modeling by the two-diode model only makes sense, when more precise measurements as done in thisexperiment are carried out. The uncertainty region of the measurement values aremarked as a beam.

7/27/2019 Encapsulation of Solar Cells.doc
http://slidepdf.com/reader/full/encapsulation-of-solar-cellsdoc 8/21
Figure 4: I-V curve of a multicrystalline solar cell (10 x 10 cm), irradiance E=430W/m², temperature T=300 K.In the figure below the dark current I-V curve of a solar cell for a wide range of voltage is shown. To measure a dark current curve an external voltage has to beapplied to the solar cell. At the positive voltages the diode is in permitting stage. Atnegative voltages the diode blocks up to -15 V and then breaks through slowly. At
this stage a high power dissipation occurs in the cell which warms it up. At acurrent of 2 A the heat dissipation of the dark cell is already 30 W. When thetemperature rises too much the cell could be destroyed by so called "hot spots".

7/27/2019 Encapsulation of Solar Cells.doc
http://slidepdf.com/reader/full/encapsulation-of-solar-cellsdoc 9/21
Figure 5: Dark I-V curve of a solar cell for an extended voltage region.1. MPP-Power, efficiency, fill factor
If a solar cell gets short circuited, a short circuit current I sc occurs which is aboutequivalent to the photo current (I sc I Ph), the terminal voltage is zero. If no load isapplied, the so called open circuit voltage V oc could be measured at the terminal. Inboth cases the electrical output power is 0 W. An irradiated cell is providing power
output for a voltage region between 0 V and V oc . A point of operation where outputpower is at its maximum is preferred. This specific operation point is called MPP(maximum power point), while voltage times current is maximal here. Theefficiency of a solar cell could be calculated from the power at MPP P MPP , the cellarea AC and the irradiance E as follows:
( 1.4) Also another value plays a role in photovoltaics, the so called fill factor FF. It is
defined as follows: ( 1.5)
If the I-V curve would be rectangular (that is the ideal case), the fill factor would be1. The fill factor is a quality consideration, for real cells it is between 0.75 and 0.85.
1. Influence of irradiance on the I-V curve
By increasing the irradiance level also the amount of electron-hole pairs gettingseparated and inducing the photo current are increasing. The photo current istherefore proportional to the irradiance, which could be seen on the I-V curves.
Also the output power in increasing

7/27/2019 Encapsulation of Solar Cells.doc
http://slidepdf.com/reader/full/encapsulation-of-solar-cellsdoc 10/21
. . ( 1.6)1. Influence of temperature on the I-V curve
Most of the parameter of the solar cell show a temperature dependency. Thegeneral equation to calculate the temperature coefficient TC for a value y is:
( 1.7)If there is a linear connection between the size y and the temperature T , so the
temperature coefficient TC is: ( 1.8)The short circuit current is increasing a little bit at rising temperatures, while lossesof the open circuit voltage is about ten times higher (-0.4%/K). Therefore the power output is decreasing for increasing temperatures. The power loss factor is around0.3-0.5 % per degree Celsius, so for an increase of 30°C in temperature the power is decreasing by 9-15 %.
1. Solar module
At a solar module many cells are connected in series in order to achieve a higher voltage. Most commercial modules have between 36 and 40 cells..
Figure 6: Series
connection of 36 cells.The current through all cells is identical. (I 1 = I 2 = ... = I 36 ). The voltage of the
module consists of the single voltages V i over the n cells: ( 2.1)If the electrical parameters are the same for all cells as well as the temperatureand the irradiance the Voltage of the module is: V = n·V i ( 2.2)The I-V curve of the module is composed by the I-V curves of the single cells(addition of voltages at the same current).

7/27/2019 Encapsulation of Solar Cells.doc
http://slidepdf.com/reader/full/encapsulation-of-solar-cellsdoc 11/21
Figure7: I-V characteristics of PV-module (36 cells) at E = 400 W/m², T = 300 K 26°C.
1. Influence of shadowing
The I-V curve is affected decisively when cells are irradiated at a different level.This will be explained at an example. At a module consisting of 36 monocrystallinecells (10 x 10 cm) one cell is shadowed by 75%. All other cells are irradiatedcompletely. The following figure explains the creation of one point at the final I-Vcurve (1): For a given current the voltage is calculated by the addition of theshadowed cell (1a) and 35 times the voltage of a irradiated cell (1b). The final I-Vcurve is also drawn in the figure: It could be seen that the module power output is
reduced drastically by this single cell shadowing. While there was shadowed only2% of the module area, the power output at MPP is reduced by 70 %. Theshadowed cell acts as a load. The maximum power dissipation - at this cell is 12.7W occurring at short circuit of the module. The points of the maximum power P1 and P2 are marked in the curves of identical power output..

7/27/2019 Encapsulation of Solar Cells.doc
http://slidepdf.com/reader/full/encapsulation-of-solar-cellsdoc 12/21
Figure 8: I-V curve of module with one cell shadowed by 75 %, irradiance E = 407W/m², temperature T = 300 K.
1. Bypass-diodes
At the shadowed cell there is the threat of overheating already at this experiment.Therefore the manufactures of PV-modules switch bypass diodes to the cells or strings of cells. If the cells are operated at negative voltages, the current passes
through the bypass diode. The voltage at the cells is limited to the threshold of thepassing operation of the diode.
Figure 9: Simplified equivalent circuit of a solar cell with a bypass diodeIf a bypass diode is switched to every cell as shown in Fig.9, the module outputpower is reduced only by the power of the shadowed cell in case of shadowing(plus the losses of the diode). At most commercial modules bypass diodes are notimplemented for each cell, but for each string of 12-24 cells. A destruction of a cell
7/27/2019 Encapsulation of Solar Cells.doc
http://slidepdf.com/reader/full/encapsulation-of-solar-cellsdoc 13/21
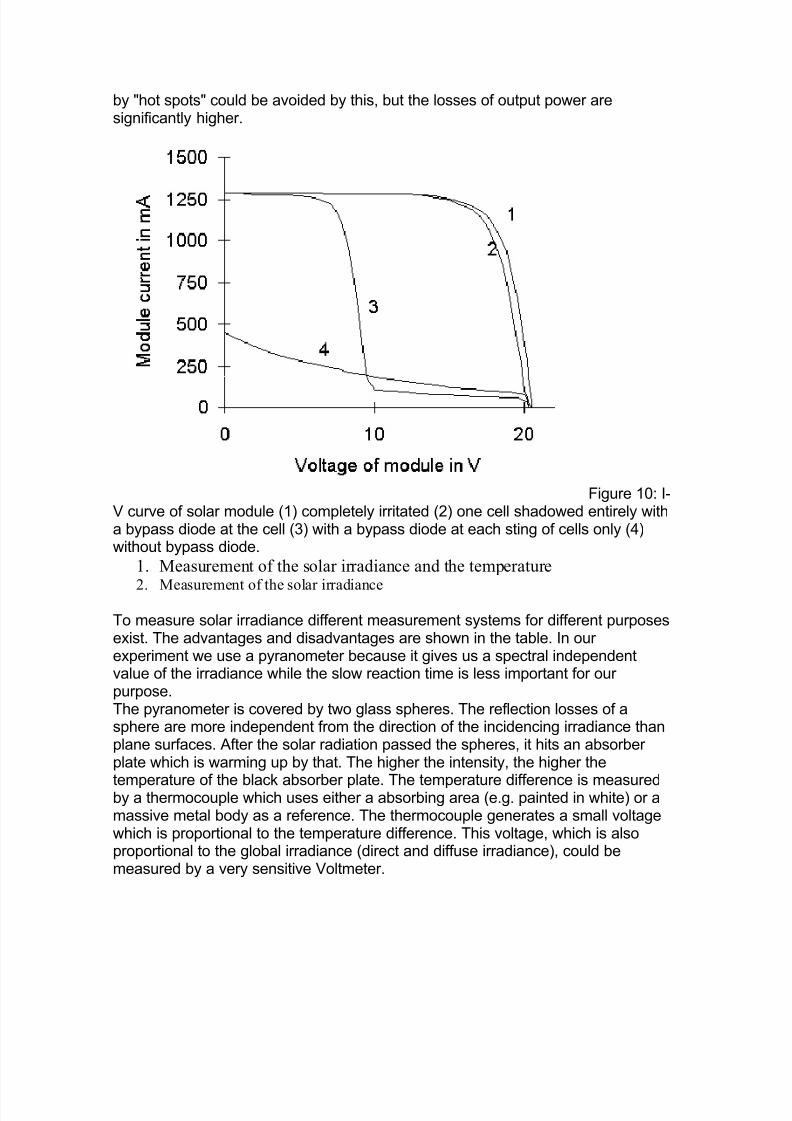
by "hot spots" could be avoided by this, but the losses of output power aresignificantly higher.
Figure 10: I-V curve of solar module (1) completely irritated (2) one cell shadowed entirely witha bypass diode at the cell (3) with a bypass diode at each sting of cells only (4)without bypass diode.
1. Measurement of the solar irradiance and the temperature
2. Measurement of the solar irradiance
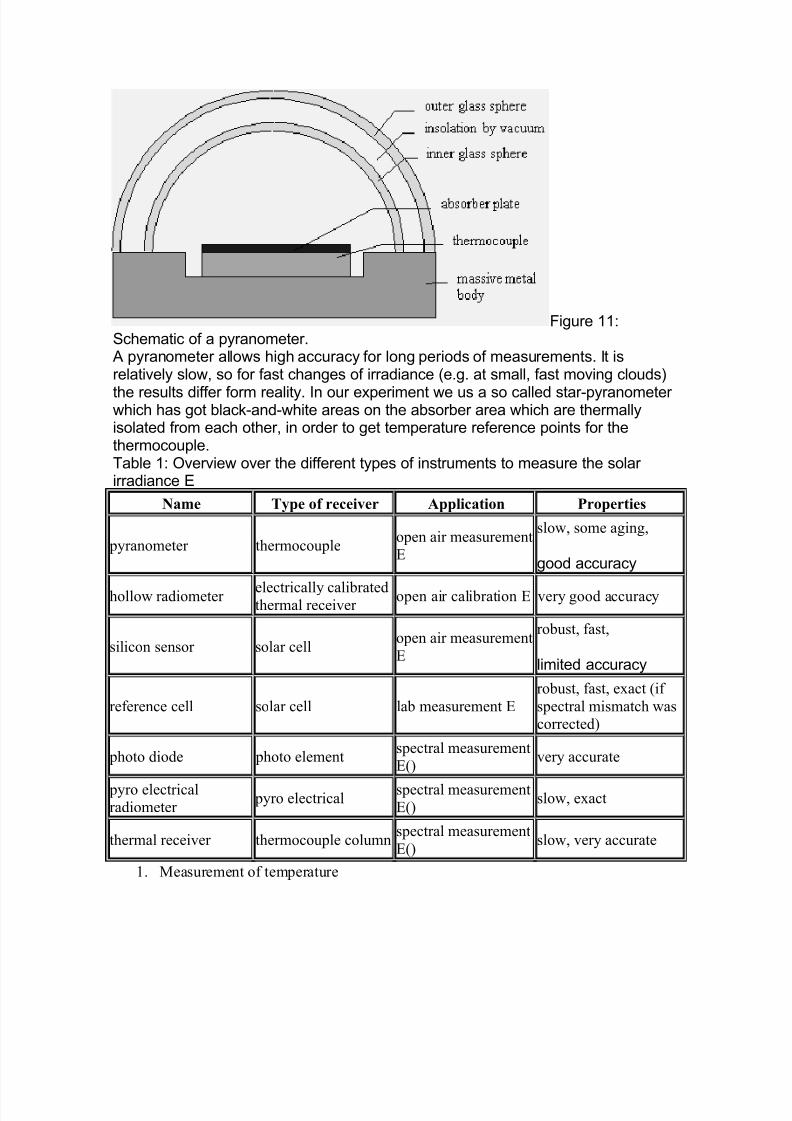
To measure solar irradiance different measurement systems for different purposesexist. The advantages and disadvantages are shown in the table. In our experiment we use a pyranometer because it gives us a spectral independentvalue of the irradiance while the slow reaction time is less important for our purpose.The pyranometer is covered by two glass spheres. The reflection losses of asphere are more independent from the direction of the incidencing irradiance thanplane surfaces. After the solar radiation passed the spheres, it hits an absorber plate which is warming up by that. The higher the intensity, the higher the
temperature of the black absorber plate. The temperature difference is measuredby a thermocouple which uses either a absorbing area (e.g. painted in white) or amassive metal body as a reference. The thermocouple generates a small voltagewhich is proportional to the temperature difference. This voltage, which is alsoproportional to the global irradiance (direct and diffuse irradiance), could bemeasured by a very sensitive Voltmeter.
7/27/2019 Encapsulation of Solar Cells.doc
http://slidepdf.com/reader/full/encapsulation-of-solar-cellsdoc 14/21
Figure 11:Schematic of a pyranometer.
A pyranometer allows high accuracy for long periods of measurements. It isrelatively slow, so for fast changes of irradiance (e.g. at small, fast moving clouds)
the results differ form reality. In our experiment we us a so called star-pyranometer which has got black-and-white areas on the absorber area which are thermallyisolated from each other, in order to get temperature reference points for thethermocouple.Table 1: Overview over the different types of instruments to measure the solar irradiance E
Name Type of receiver Application Properties
pyranometer thermocoupleopen air measurementE
slow, some aging,
good accuracy
hollow radiometer electrically calibratedthermal receiver
open air calibration E very good accuracy
silicon sensor solar cellopen air measurement
E
robust, fast,
limited accuracy
reference cell solar cell lab measurement E
robust, fast, exact (if
spectral mismatch wascorrected)
photo diode photo elementspectral measurementE()
very accurate
pyro electricalradiometer
pyro electrical spectral measurementE()
slow, exact
thermal receiver thermocouple columnspectral measurement
E()slow, very accurate
1. Measurement of temperature

7/27/2019 Encapsulation of Solar Cells.doc
http://slidepdf.com/reader/full/encapsulation-of-solar-cellsdoc 15/21
At the experiment three different kinds of temperature measurements areconsidered, they have different properties, advantages and disadvantages.3.2.1 Thermoelectric voltageThe thermoelectric voltages of a thermocouple junction (each consisting of twodifferent metals solded together) at the measuring point (the solar cell) and at a
reference point (e.g. ambient) are measured and compared. The voltage differenceindicates the temperature at the measuring point. Therefore this kind of measurement requires a reference temperature and a quite sensitive voltmeter it isnot used here.3.2.2 Thermal resistance
A temperature dependent resistor (as the Pt 100) is used. The resistance of theresistor increases as its temperature increases, e.g. at a temperature coefficient of TC R =0,00385 K-1 for a platinum resistor. The Pt 100 resistor has got a referencevalue of R (T 0 ) = 100 at T 0 = 0 °C. For different temperatures the accordingresistance is given as follows:
( 3.1)
To get accurate values for the temperature, the measurement of the resistance hasto be carried out very precisely (e.g. by a so called four-wire-measurement whicheliminates the resistive losses of the cables from the sensor to the Ohmmeter) . If done properly the results of this kind measurement are very accurate (deviationless than 0,1 K).
1. Temperature measurement by NTC or PTC.
A semiconductor as silicon shows a temperature dependency of its conductivity,this effect is used to use it as a temperature sensor. Although the temperature-resistance dependency is non-linear, for a certain range of temperatures it could be
approximated as a linear function and expressed by a temperature coefficient. NTCdevices show a negative temperature coefficient, while PTC show a positivetemperature coefficient of the electrical resistance towards the temperature. As arecent development integrated circuits with an attached amplifier to get an active,linearized device (output e.g. 5 mV/K) are often used.
1. Preparation exercises
The theory has to be known as well that all experiments could be done quicklywithout hesitation. If the preparation is not good enough the students are obliged todo the experiments another time.
• From Fig. 8 short circuit current, open circuit voltage, power at MPP, the efficiency
and the fill factor have to be determined for both, completely irradiated andshadowed condition.
• Which current and voltage are at a resistor of a) 1 and b) 20 connected to the
module of Fig. 7 ? The output power of the module has to be calculated for bothloads.
7/27/2019 Encapsulation of Solar Cells.doc
http://slidepdf.com/reader/full/encapsulation-of-solar-cellsdoc 16/21
• Which voltage could be read at the millivoltmeter connected to the pyranometer at
an irradiance of E = 200 W/m² ?
• Which voltage has got the thermocouple at a temperature of 40 °C ?
1. Experimentation 2. Setting up the experiment
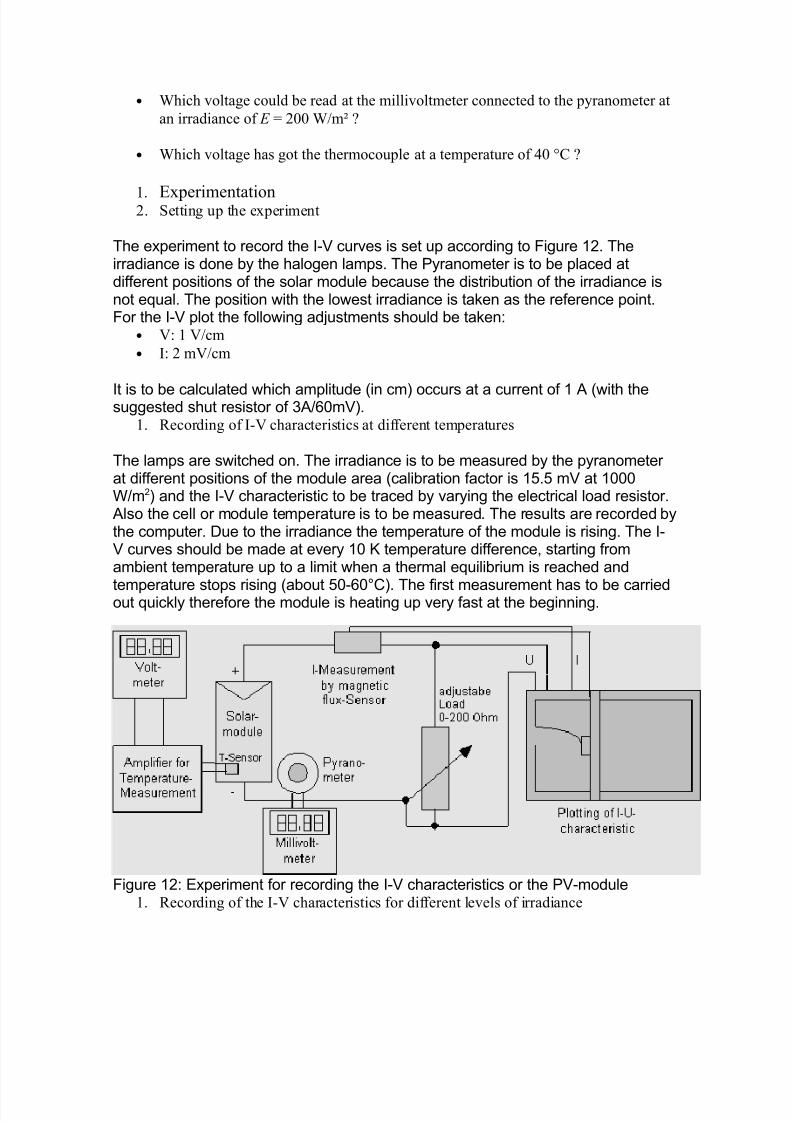
The experiment to record the I-V curves is set up according to Figure 12. Theirradiance is done by the halogen lamps. The Pyranometer is to be placed atdifferent positions of the solar module because the distribution of the irradiance isnot equal. The position with the lowest irradiance is taken as the reference point.For the I-V plot the following adjustments should be taken:
• V: 1 V/cm
• I: 2 mV/cm
It is to be calculated which amplitude (in cm) occurs at a current of 1 A (with thesuggested shut resistor of 3A/60mV).
1. Recording of I-V characteristics at different temperatures
The lamps are switched on. The irradiance is to be measured by the pyranometer at different positions of the module area (calibration factor is 15.5 mV at 1000W/m2) and the I-V characteristic to be traced by varying the electrical load resistor.
Also the cell or module temperature is to be measured. The results are recorded bythe computer. Due to the irradiance the temperature of the module is rising. The I-V curves should be made at every 10 K temperature difference, starting fromambient temperature up to a limit when a thermal equilibrium is reached and
temperature stops rising (about 50-60°C). The first measurement has to be carriedout quickly therefore the module is heating up very fast at the beginning.
Figure 12: Experiment for recording the I-V characteristics or the PV-module1. Recording of the I-V characteristics for different levels of irradiance

7/27/2019 Encapsulation of Solar Cells.doc
http://slidepdf.com/reader/full/encapsulation-of-solar-cellsdoc 17/21
The irradiance level should be increased in steps by 100 W/m², starting at 100W/m², going up to the maximal irradiance (about 800 W/m2). The irradiance couldbe varied either by changing the voltage of the lamps (unfortunately this changesalso the spectrum of the lamps) or keeping the voltage of the lamps constant andusing different kind of neutral filters in front of the lamps or in front of the module.
For doing that, the irradiance according to the readings by the millivoltmeter has tobe calculated: Very often the low inner resistance of the millivoltmeter influencesthe measurement, this deviation has to be taken into account.Then the I-V characteristics could be recorded: The measurements should be donequickly to keep the temperature almost constant for all measurements. Thetemperature has to be recorded too in order to determine the temperaturecoefficients later.
1. Recording of the I-V characteristics for different states of shadowing
The average irradiance on the module area is fixed at 500 W/m². For the differentshadowing states the according I-V curves are recorded. These states have to be
examined:• no shadowing
• an entire cell at the center of the module
• an entire cell at the corner of the module
• ¾ cell at the corner of the module
• ½ cell at the corner of the module
• ¼ cell at the corner of the module
• 2 neighboring cells at the corner of the module
• 2 cells at different corners of the module
1. Different type of module
The same procedure has to be carried for a different kind of module. After doingthe experiments the students are obliged to dismantle the experiment for the nextgroup to come.
1. Protocol
The protocol should include the following points:• Circumstantial answering of the preparation exercises
• Results of the experiments:
Curves, axis and scales have to be marked and described. Minimum and maximum
of irradiance on the module area has to be noted, as well as ambient and module
temperature.
The I-V characteristics are to be discussed.• Determination of power at MPP, efficiency and fill factor for all I-V curves
• Graphical representation of power at MPP, efficiency and fill factor as a function of
temperature and irradiance.• Determination of the temperature coefficients of open circuit voltage, short circuit
current and power at MPP.
7/27/2019 Encapsulation of Solar Cells.doc
http://slidepdf.com/reader/full/encapsulation-of-solar-cellsdoc 18/21
• Determination of number of bypass diodes of the module.
1. List of equipment o 1 PQ10/40 and 1 SM 55 solar module
o temperature sensors with measurement transformer and amplifier, if
necessaryo 4 Halogen lights, each 500W, 130 V
o 1 Pyranometer with amplifier and Millivoltmeter 0...20 mV
o 1 Shunt-resistor 3A, 60mV or an equivalent magnetic sensor with instrument
amplifier
o 1 Potentiometer 200 Ω, 3 A
o 1 I-V-curve tracking device (X-Y-Plotter or a computer with a A/D
converter, printer)
o connection cables
o 1 digital multimeter for check
o paper for plotter or printer
o different cover materials: black mosquito net (to cover module and to reduceirradiance) black carton (to cover some solar cells for the shadowingexperiment).
2. Literature
• Wenham, S. R. Green, M. A., Watt, M. E.: Applied Photovoltaics. Center of
Photovoltaic Systems and Devices, University of New South Wales, Sydney,
Australia, 1994.• "Solar-Server" on the Internet http://emsolar.ee.TU-Berlin.DE
Flexible polymer barrier filmsfor theencapsulationof solar cells
Initial situationRenewable energies, such as photovoltaics (PV), do notproduce carbon dioxide or other dangerous green house gasesand thus, have a strongly positive influence on the climaticbalance in the atmosphere. PV can also partly replace nuclear energy which always entails hazardous risks.Thin film solar cells have the potential of low cost, highefficiency and low material demand, which will be decisive for
future dissemination of PV. The encapsulation of thin film solar cells is made by a vacuum lamination process using anencapsulating polymer (ethylene vinyl acetate, EVA) and asecond sheet of glass (Figure 1). The disadvantages of thistechnology are high weight and the gap between the two sheetsof glass at the edges, where moisture and gas can enter intothe photoactive layers and cause degradation. The process cannot be easily automated and needs a lot of time, energy andmaterial. Besides, it is not possible to produce flexible modulesin this way. Therefore, the development of new encapsulation
7/27/2019 Encapsulation of Solar Cells.doc
http://slidepdf.com/reader/full/encapsulation-of-solar-cellsdoc 19/21
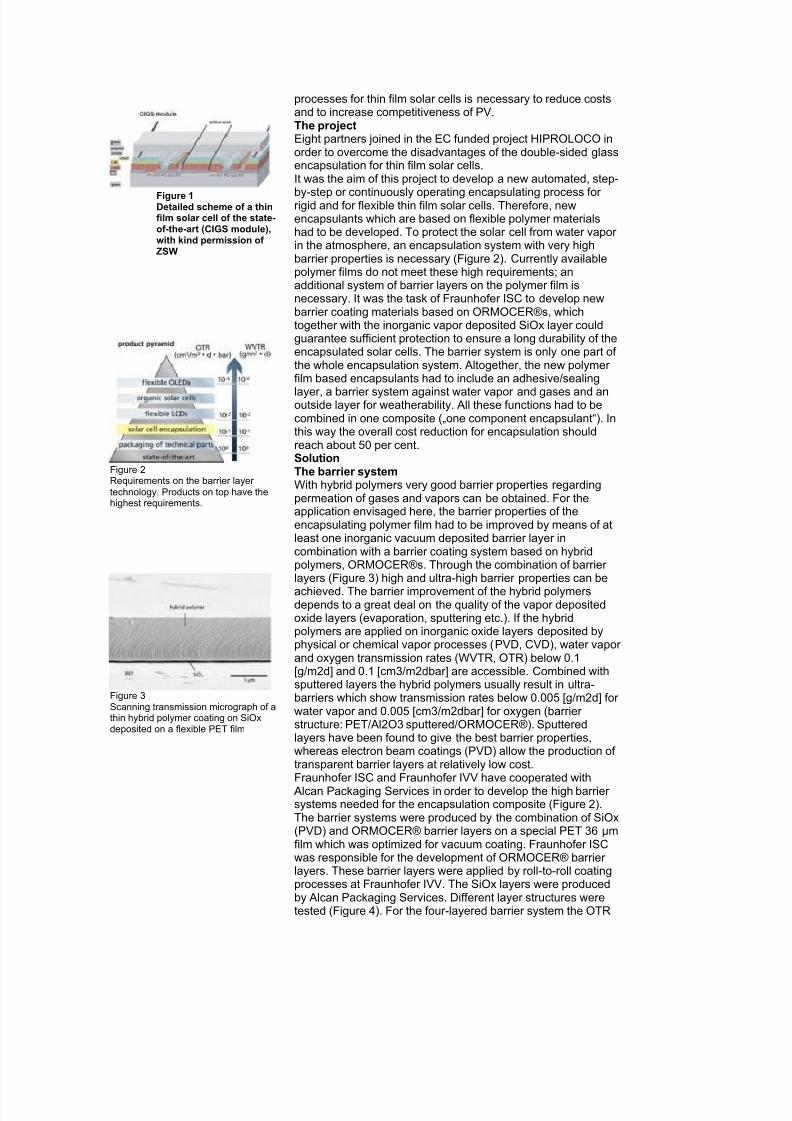
Figure 1Detailed scheme of a thinfilm solar cell of the state-of-the-art (CIGS module),with kind permission of ZSW
Figure 2Requirements on the barrier layer
technology. Products on top have thehighest requirements.
Figure 3Scanning transmission micrograph of athin hybrid polymer coating on SiOxdeposited on a flexible PET film
processes for thin film solar cells is necessary to reduce costsand to increase competitiveness of PV.The projectEight partners joined in the EC funded project HIPROLOCO inorder to overcome the disadvantages of the double-sided glassencapsulation for thin film solar cells.It was the aim of this project to develop a new automated, step-
by-step or continuously operating encapsulating process for rigid and for flexible thin film solar cells. Therefore, newencapsulants which are based on flexible polymer materialshad to be developed. To protect the solar cell from water vapor in the atmosphere, an encapsulation system with very highbarrier properties is necessary (Figure 2). Currently availablepolymer films do not meet these high requirements; anadditional system of barrier layers on the polymer film isnecessary. It was the task of Fraunhofer ISC to develop newbarrier coating materials based on ORMOCER®s, whichtogether with the inorganic vapor deposited SiOx layer couldguarantee sufficient protection to ensure a long durability of theencapsulated solar cells. The barrier system is only one part of the whole encapsulation system. Altogether, the new polymer film based encapsulants had to include an adhesive/sealing
layer, a barrier system against water vapor and gases and anoutside layer for weatherability. All these functions had to becombined in one composite („one component encapsulant“). Inthis way the overall cost reduction for encapsulation shouldreach about 50 per cent.SolutionThe barrier systemWith hybrid polymers very good barrier properties regardingpermeation of gases and vapors can be obtained. For theapplication envisaged here, the barrier properties of theencapsulating polymer film had to be improved by means of atleast one inorganic vacuum deposited barrier layer incombination with a barrier coating system based on hybridpolymers, ORMOCER®s. Through the combination of barrier layers (Figure 3) high and ultra-high barrier properties can be
achieved. The barrier improvement of the hybrid polymersdepends to a great deal on the quality of the vapor depositedoxide layers (evaporation, sputtering etc.). If the hybridpolymers are applied on inorganic oxide layers deposited byphysical or chemical vapor processes (PVD, CVD), water vapor and oxygen transmission rates (WVTR, OTR) below 0.1[g/m2d] and 0.1 [cm3/m2dbar] are accessible. Combined withsputtered layers the hybrid polymers usually result in ultra-barriers which show transmission rates below 0.005 [g/m2d] for water vapor and 0.005 [cm3/m2dbar] for oxygen (barrier structure: PET/Al2O3 sputtered/ORMOCER®). Sputteredlayers have been found to give the best barrier properties,whereas electron beam coatings (PVD) allow the production of transparent barrier layers at relatively low cost.Fraunhofer ISC and Fraunhofer IVV have cooperated with
Alcan Packaging Services in order to develop the high barrier systems needed for the encapsulation composite (Figure 2).The barrier systems were produced by the combination of SiOx(PVD) and ORMOCER® barrier layers on a special PET 36 µmfilm which was optimized for vacuum coating. Fraunhofer ISCwas responsible for the development of ORMOCER® barrier layers. These barrier layers were applied by roll-to-roll coatingprocesses at Fraunhofer IVV. The SiOx layers were producedby Alcan Packaging Services. Different layer structures weretested (Figure 4). For the four-layered barrier system the OTR

7/27/2019 Encapsulation of Solar Cells.doc
http://slidepdf.com/reader/full/encapsulation-of-solar-cellsdoc 20/21
Figure 4Barrier properties of the barrier systems produced by roll-to-rollprocesses (OR: ORMOCER®)
Figure 5Encapsulation films for solar modules,with kind permission of IVV
Figure 6Encapsulation system for solar modules: encapsulation material for a)the front side and b) the rear side of the solar cell
was measured below 0.01 cm3/m2 d bar while the WVTRreached the value 0.01 g/m2d. These results are in the range of the necessary barrier requirements for the encapsulation of solar cells. Therefore, this layer structure was used for the newencapsulation process tested at the end of the project.The design of the encapsulation systemBesides the barrier film laminate additional layers with different
properties have to be used for both the front and the rear sideof the solar cell to reach the requirements mentioned above(Figure 6).The front side material, which has to be a transparentfilm composite, consists of the following single layers: an ETFE(ethylene tetrafluoro-ethylene copolymer) film which givesmechanical stability and weatherability, the SiOx layer workingalso as a primer for a UV absorber containing adhesive andadditionally working as a first barrier layer, the barrier system(multilayer structure) which provides the required high barrier properties against moisture and gases. For the rear side of thesolar cell there is no need for protection against UV-light. Lighttransparency of the back layer is not an important issue.Therefore, the design of the rear side material is lesscomplicated (Figure 6b).The process of encapsulation
The composite encapsulating materials were produced byIsovolta according to Figures 5 and 6. They were used for theproduction of test modules at Kloepper MaschinentechnikGmbH, ZSW and Free Energy Europe SA. The suitability of thenew process of encapsulation has been proved. Someoptimization work with regard to scaling up and adaptation of the single process steps has still to be carried out. This isplanned in the frame of a further project.Customer benefitsThe flexible nature of the encapsulants results in an optimizedencapsulation process and especially in good protection of theedge area. The new material can be used from the roll, thusproviding an easy handling and automation in the production of flexible modules. Thin barrier layers, like SiOx, combined withORMOCER® based barrier coatings, will save material and
energy consumption in the production of the new encapsulatingmaterial. Therefore, the result of this project is a material andenergy saving encapsulation technology.This will help to promote the application of thin film solar cells inthe building industry and to increase the number of users of solar cells. Especially flexible thin film solar cells cover broader fields of application because they can be adapted to non-planar surfaces. That means, PV could be a standard integrated partof construction components, in e. g. roofing materials, façades,balustrades. Thus, a larger number of potential users couldbenefit from the solar technology. Upcoming and futureproducts require flexible films that have high barrier or evenultra-high barrier properties (Figure 2). The encapsulation filmfor solar modules is one important example which illustratesthat there is still a great need for the development of improvedpolymer barrier systems.CooperationThe work described was carried out in the HIPROLOCO projectfunded by the European Commission (ENK5-CT-2000-00325).We thank the EC for funding and all partners for their cooperation.Partners of Fraunhofer ISC: Fraunhofer IVV, Germany; Isovoltaösterreichische Isolierstoffwerke AG, Austria; Zentrum für Sonnenenergie- und Wasserstoff-Forschung Baden-Württemberg ZSW, Germany; Kloepper Maschinentechnik

7/27/2019 Encapsulation of Solar Cells.doc
http://slidepdf.com/reader/full/encapsulation-of-solar-cellsdoc 21/21
GmbH, Germany; Alcan Packaging Services AG, Switzerland;Free Energy Europe SA, France; Slovak University of Technology, Slovakia.
Your contactDr. Sabine Amberg-SchwabPhone +49(0)9 31/41 00-6 20Fax +49(0)9 31/41 00-6 98
E-Mail: [email protected] E-Mail:[email protected] Weber Phone +49(0)9 31/41 00-6 21Fax +49(0)9 31/41 00-6 98
E-Mail: [email protected] E-Mail:
© 2005 Fraunhofer-Institut für Silicatforschung ISC