enabling free internet access in developing countries ... 1 enabling free internet access in...
TRANSCRIPT
1
ENABLING FREE INTERNET
ACCESS IN DEVELOPING
COUNTRIES USING A
PARTICIPATORY DESIGN
APPROACH
by
JINESH NAGIN PAREKH
A THESIS
Submitted in partial fulfillment of the requirements for the degree
MASTERS IN HUMAN COMPUTER INTERACTION
Institute of Informatics
Tallinn University, Estonia
2015
Supervised and approved by:
Professor David Lamas
Dr. Sonia Sousa

2
DECLARATION
I hereby declare that I have written this thesis by myself, and that I have used only the materials
and sources indicated in the list of work cited. Neither I myself nor any other person has submitted this
thesis to any other institution for a degree or for publication.
Jinesh Nagin Parekh
.
.................................... ...................... Signature Date
Certified by:
Professor David Lamas
Dr. Sonia Sousa
(Advisor)
..................................... ...................... Signature Date
..................................... ...................... Signature Date
3
NON-EXCLUSIVE LICENCE TO REPRODUCE THIS
THESIS AND MAKE IT AVAILABLE TO PUBLIC
I, Jinesh Nagin Parekh (DOB: 10.11.1988) grant Tallinn University a permit ( a non-exclusive
licence) to reproduce for free and make public in the repository of Tallinn University Academic
Library this thesis titled: “Enabling Free Internet Access in Developing Countries”, supervised by
Professor David Lamas and Dr. Sonia Sousa.
I am aware of the fact that the author also retains the rights mentioned in Clause 1.
I certify that granting the non-exclusive licence does not infringe the intellectual property rights of
other persons or the rights arising from the Personal Data Protection Act.
In Tallinn, ....................................
Signature Date: .....................
4
Acknowledgements
I would like to thank the existing members of the HCID and ICTD community and their continued efforts
to bridge the digital divide. This thesis would not be possible without the involvement of all the
participant volunteers and their ideas, time and efforts.
A Special Thank You to the All the Key Enablers of the Design Project
For giving me crucial economic and financial insights with regards to ISP businesses in India and helping
me create a business model for Muft WiFi.
Bharti Parekh (Business Modeling Expert and Chartered Account, ICAI India)
Nagin Parekh (Business Modeling Expert and Chartered Account, ICAI India)
Aditi Parekh (Consultant, Deloitte)
Hitesh Shah (Investment Expert, PPIC)
Ritesh Shah (Financial Analyst, ex-KMPG)
Neha Rambhia (Student, Harvard Business School)
Rajesh Shah (Entrepreneur, Mumbai Masala Café)
Siddharth Bharwani (COO, Jetking Infotrain)
Rashi Dhandia (MBA, Singapore Management University)
For giving me crucial insights on governmental efforts on bridging the digital divide, understanding
government laws and regulations and national cyber security concerns.
Meenakshi Lekhi (Member of Parliament for Government of India)
Vijay Tribhuvan (Assistant commissioner, Mumbai Police)
Dilip Shah (Lawyer, Dilip Shah and Associates)
Akhil Gurwada (Lawyer, Mulla & Mulla & Craigie Blunt & Caroe)
For helping me understand wireless technologies, network architectures and developing the overall
technical solutions required for this project.
Vipul Patel (Engineer, 3 Spin Creative Solutions)
Yatin Tribhuvan (Interaction Designer, Colorbud Studio)
Amit Goyal (Chief Engineer, Rirev)
Audrey Boullot (International Development (student), SciencePo Paris)
Mahendra Nagle (Freelance Network Architect)
Khwaja Umair (Human Computer Interaction (student), Tallinn University)
For giving me crucial insights on existing digital advertising and ad-market insights.
Preeti Vyas (Owner, VGC Interactive Designs)
Anushree Seth (Media Selling Expert, ex-Disney India)
Harshil Karia (Co-Founder, Foxymoron Digital Agency)
For their key volunteering efforts at different stages of the project:
Małgorzata Łuczkowska
Amey Tribhuvan
Mel Batson
Student volunteers from H.R College (RCHR Club)
Management Staff at Jetking Infotrain, Technical Staff at Realtel ISP and Hathway ISP
Lastly, I would I like thank my supervisors Professor David Lamas and Dr. Sonia Sousa and my
colleagues at Tallinn University’s Institute of Informatics for their constant support and guided expertise
throughout this project.
5
Dedication
This thesis is dedicated to 60% of the human race whose creativity we miss out on every single day
simply because they lack Internet access.
6
Table of Content
1. Introduction ......................................................................................................................................... 11
1.1 Research Problem and Significance .............................................................................................. 11
1.2 Thesis Overview ............................................................................................................................ 12
1.3 Understanding Context .................................................................................................................. 13
1.3.1 The Positive Effects of Internet .............................................................................................. 13
1.3.2 The Case of Estonia ................................................................................................................ 13
1.3.3 The Current State of Internet Access and Digital Divide ....................................................... 15
1.3.4 Where Do Most Number of Offline People Come From? ...................................................... 16
1.3.5 India’s ICT Context: 1 Billion Offline? .................................................................................. 17
1.4 Closing Remarks ............................................................................................................................ 22
2. The Study ............................................................................................................................................. 24
2.1 Research Problem and Strategy ..................................................................................................... 24
2.1.1 IDEO Human Centered Design (HCD) Toolkit ..................................................................... 25
2.1.2 Double Diamond ..................................................................................................................... 26
2.2 Study Procedure ............................................................................................................................. 27
2.2.1 Material and Instruments ........................................................................................................ 29
2.2.2 Participants and Roles ............................................................................................................ 34
2.3 Closing Remarks ............................................................................................................................ 35
3. Results ................................................................................................................................................. 35
3.1 First Stage of The Research ........................................................................................................... 35
3.1.1 User Research ......................................................................................................................... 36
3.1.2 Technical Research ................................................................................................................. 37
3.1.3 Market Research ..................................................................................................................... 39
3.2 Discussion ...................................................................................................................................... 45
3.3 Second Stage of The Research ...................................................................................................... 46
7
3.3.1 Ideation: Muft WiFi Concept.................................................................................................. 46
3.3.2 Development: Muft WiFi Solution ......................................................................................... 51
3.3.3 Implementation ....................................................................................................................... 55
3.4 Discussion ...................................................................................................................................... 57
3.5 Closing Remarks ............................................................................................................................ 58
4. Conclusions ......................................................................................................................................... 59
4.1 Main Result Achieved ................................................................................................................... 59
4.2 Overall Discussion ......................................................................................................................... 59
4.3 Future Work ................................................................................................................................... 60
4.4 Reflections ..................................................................................................................................... 61
8
Table of Figures
Figure 1-1: An upward trend in key economic development indicators with rise in Internet population in
Estonia. Data Source: (The World Bank, 2013) ......................................................................................... 14
Figure 1-2: Most number of offline people in the world come from this region. ....................................... 17
Figure 1-3: Tele-density figures are derived from the telephone subscriber data provided by the access
service providers and the projections of population published by the Office of the Registrar General &
Census Commissioner, India. (Telephone Regulatory Authority of India, 2014) ...................................... 18
Figure 1-4: Wholesale bandwidth costs around the world. Cities like New York and Amsterdam pay less
10% of what Mumbai pays (Telegeography, 2009). ................................................................................... 19
Figure 1-5: A comparison of fixed-broadband prices in terms of purchasing power parity, which takes into
account the national buying power of a local currency, shows that fixed broadband is quite inexpensive in
a number of countries with a relatively low Gross National Income (GNI) per capita. Image Source:
(International Telecommunication Union, 2013) ........................................................................................ 20
Figure 2-1: The HCD process encompasses three phases over 3 lenses: Hear, Create, and Do – what’s
desirable, feasible and viable. (University of British Columbia, 2014) ...................................................... 26
Figure 2-2: Traditional Double Diamond design process for problem solving source name. .................... 26
Figure 2-3: Schema explaining design strategy adopted for this study. ..................................................... 28
Figure 2-4: Screenshot of the homepage of Muft Internet .......................................................................... 30
Figure 2-5: Screenshot of Open Wiki section with links to some important articles .................................. 31
Figure 2-6: A sample of an Open Letter to a prominent member of the parliament of India – Ms.
Meenakshi Lekhi. In due course of the thesis, she was very helpful in giving us insights on governmental
efforts (and roadblocks) to bridge the digital divide in India. ..................................................................... 31
Figure 2-7: Profile Page on Muftinternet.com with links to Activity Feed, Notifications, Messages,
Forums and Settings. ................................................................................................................................... 32
Figure 2-8: Examples of open letters were being tweeted to various influential members within the ICT
industry to (potential) participants. ............................................................................................................. 33
Figure 2-9: An image of the Participatory Design community - representing user groups and roles during
the course of this project. ............................................................................................................................ 34
Figure 3-1: The diagram above shows some of the rough transition in course of User Research – from
understanding key roadblocks for users - to eventually defining the user goals. ........................................ 36
9
Figure 3-2: Resources needed to access Internet at a legally compliant Wi-Fi Zones in India .................. 37
Figure 3-3: Network Architecture for Quasi ISPs - Sharing resources, High Set-up Costs........................ 38
Figure 3-4: Network Architecture for Quasi ISPs - No sharing of resources. ............................................ 39
Figure 3-5: Illustration showing break up of cost components for running a legally complaint public Wi-
Fi network ................................................................................................................................................... 40
Figure 3-6: Understanding financial models of Free Wi-Fi service providers in Mumbai. ........................ 41
Figure 3-7 – Extract from the legal guidelines that affects Wi-Fi access in India ...................................... 42
Figure 3-8: Implications of public Wi-Fi access laws/guidelines in India. ................................................. 43
Figure 3-9: Common roadblocks faced by ISPs and Quasi ISPs in India. .................................................. 44
Figure 3-10: The above illustration shows the transition from defining the roadblocks and the movement
towards exploring and ideating upon specific solutions. ............................................................................ 45
Figure 3-11: Details from the Free Internet Access plans. .......................................................................... 47
Figure 3-12: Low-Fi Prototype of User Flow for Muft WiFi Concept ....................................................... 47
Figure 3-13: Proposed technical flow for Muft WiFi network concept ...................................................... 49
Figure 3-14: Proposed network architecture for Muft WiFi network shows how Quasi ISPs can share
common network resources through Muft WiFi’s Central Server. ............................................................. 50
Figure 3-15: Proposed solutions for Muft WiFi network servers. .............................................................. 51
Figure 3-16: Muft WiFi concept business plan overview. .......................................................................... 52
Figure 3-17: Estimating usage and revenue for 250 Muft WiFi Zones. ..................................................... 53
Figure 3-18: Hi-Fidelity functional Prototype - Screenshots from functional User Authentication System
with SMS gateway – with potential ad space under the Muft WiFi network ............................................. 54
Figure 3-19: Screenshot of a Muft WiFi's Database Manager. ................................................................... 55
Figure 3-20: Illustration showing the entrance to Mumbai Masala and its location in Mumbai. ............... 56
Figure 3-21: Images after successfully implementing the high fidelity prototype for the pilot studies. ..... 56
10
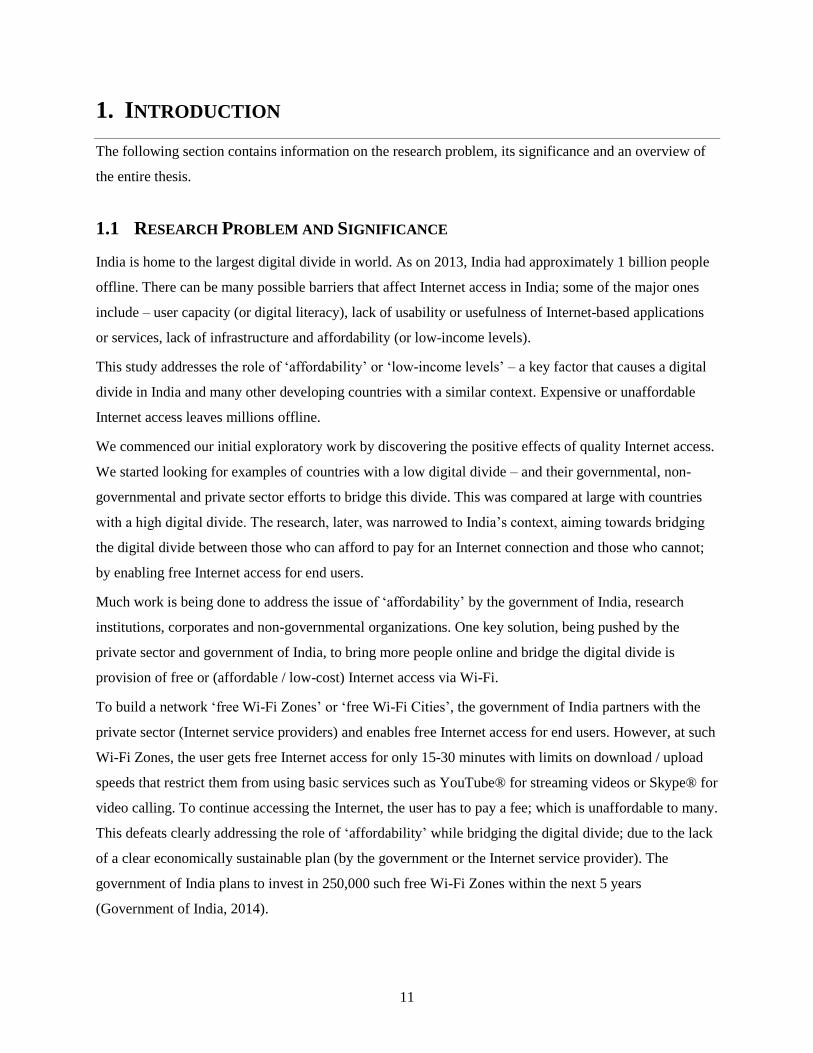
Abstract
In the past couple of decades we have seen a sharp rise in Internet usage, data consumption and the
overall number of Internet users. With the rise of broadband connectivity, mobile Internet, mobile
applications and overall web utility through localized content and services; we have been able to observe
many positive effects of Internet access. Many Human Computer Interaction and Development (HCID)
and Information and Communication Technology and Development (ICTD) studies in this time have
demonstrated how countries with higher Internet penetration and adoption enjoy better economic growth,
improved educational systems, more democratic participation and overall enhancement in various Quality
of Life (QOL) indicators.
As of 2014, the sad truth remains that over half of the human population is deprived of basic Internet
access. Most of these people live in developing or poor countries. This reflects a deep gap between
technology creators’ / designers’, policy makers’ and industry’s understanding/involvement of the end
users. The problems lie beyond an individual’s conventional understanding like hardware availability,
user literacy or network coverage.
Complex and intertwined sociotechnical roadblocks play a key role in curbing Internet penetration and
adoption in many countries that face a huge digital divide. However, one common pattern can be spotted
among such countries – ‘affordability’. Even with the sharp decline in prices of Internet enabled mobile
devices and data plans over the past decade, quality Internet access still remains expensive or
unaffordable to many.
The study was conducted in India with the goal of overcoming various legal, economic and technological
barriers to ‘enable free Internet access’ for users. In this study, we try to address the problem of
‘affordability’ in Internet access for existing Internet users in India that own an Internet enabled mobile
device but cannot afford to pay for mobile Internet packages. Using a Participatory Design approach and
a Double Diamond design process, an economically sustainable and technologically scalable ‘free Wi-Fi
Zone’ model was designed and prototyped in this study.
This research study aims to provide valuable insights to various research organizations, governmental
bodies, Internet service providers, hardware/software companies and other agents working in the ICTD
space and trying to bridge the digital divide.
11
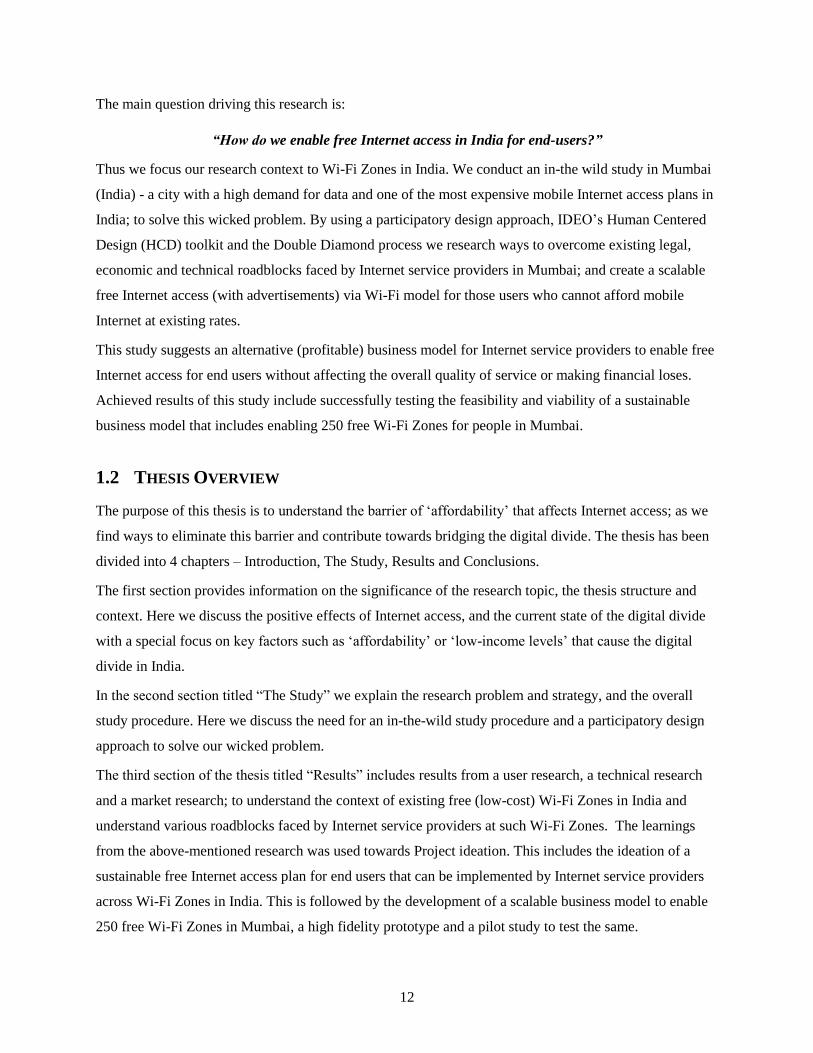
1. INTRODUCTION
The following section contains information on the research problem, its significance and an overview of
the entire thesis.
1.1 RESEARCH PROBLEM AND SIGNIFICANCE
India is home to the largest digital divide in world. As on 2013, India had approximately 1 billion people
offline. There can be many possible barriers that affect Internet access in India; some of the major ones
include – user capacity (or digital literacy), lack of usability or usefulness of Internet-based applications
or services, lack of infrastructure and affordability (or low-income levels).
This study addresses the role of ‘affordability’ or ‘low-income levels’ – a key factor that causes a digital
divide in India and many other developing countries with a similar context. Expensive or unaffordable
Internet access leaves millions offline.
We commenced our initial exploratory work by discovering the positive effects of quality Internet access.
We started looking for examples of countries with a low digital divide – and their governmental, non-
governmental and private sector efforts to bridge this divide. This was compared at large with countries
with a high digital divide. The research, later, was narrowed to India’s context, aiming towards bridging
the digital divide between those who can afford to pay for an Internet connection and those who cannot;
by enabling free Internet access for end users.
Much work is being done to address the issue of ‘affordability’ by the government of India, research
institutions, corporates and non-governmental organizations. One key solution, being pushed by the
private sector and government of India, to bring more people online and bridge the digital divide is
provision of free or (affordable / low-cost) Internet access via Wi-Fi.
To build a network ‘free Wi-Fi Zones’ or ‘free Wi-Fi Cities’, the government of India partners with the
private sector (Internet service providers) and enables free Internet access for end users. However, at such
Wi-Fi Zones, the user gets free Internet access for only 15-30 minutes with limits on download / upload
speeds that restrict them from using basic services such as YouTube® for streaming videos or Skype® for
video calling. To continue accessing the Internet, the user has to pay a fee; which is unaffordable to many.
This defeats clearly addressing the role of ‘affordability’ while bridging the digital divide; due to the lack
of a clear economically sustainable plan (by the government or the Internet service provider). The
government of India plans to invest in 250,000 such free Wi-Fi Zones within the next 5 years
(Government of India, 2014).
12
The main question driving this research is:
“How do we enable free Internet access in India for end-users?”
Thus we focus our research context to Wi-Fi Zones in India. We conduct an in-the wild study in Mumbai
(India) - a city with a high demand for data and one of the most expensive mobile Internet access plans in
India; to solve this wicked problem. By using a participatory design approach, IDEO’s Human Centered
Design (HCD) toolkit and the Double Diamond process we research ways to overcome existing legal,
economic and technical roadblocks faced by Internet service providers in Mumbai; and create a scalable
free Internet access (with advertisements) via Wi-Fi model for those users who cannot afford mobile
Internet at existing rates.
This study suggests an alternative (profitable) business model for Internet service providers to enable free
Internet access for end users without affecting the overall quality of service or making financial loses.
Achieved results of this study include successfully testing the feasibility and viability of a sustainable
business model that includes enabling 250 free Wi-Fi Zones for people in Mumbai.
1.2 THESIS OVERVIEW
The purpose of this thesis is to understand the barrier of ‘affordability’ that affects Internet access; as we
find ways to eliminate this barrier and contribute towards bridging the digital divide. The thesis has been
divided into 4 chapters – Introduction, The Study, Results and Conclusions.
The first section provides information on the significance of the research topic, the thesis structure and
context. Here we discuss the positive effects of Internet access, and the current state of the digital divide
with a special focus on key factors such as ‘affordability’ or ‘low-income levels’ that cause the digital
divide in India.
In the second section titled “The Study” we explain the research problem and strategy, and the overall
study procedure. Here we discuss the need for an in-the-wild study procedure and a participatory design
approach to solve our wicked problem.
The third section of the thesis titled “Results” includes results from a user research, a technical research
and a market research; to understand the context of existing free (low-cost) Wi-Fi Zones in India and
understand various roadblocks faced by Internet service providers at such Wi-Fi Zones. The learnings
from the above-mentioned research was used towards Project ideation. This includes the ideation of a
sustainable free Internet access plan for end users that can be implemented by Internet service providers
across Wi-Fi Zones in India. This is followed by the development of a scalable business model to enable
250 free Wi-Fi Zones in Mumbai, a high fidelity prototype and a pilot study to test the same.
13
The final section titled “Conclusions” discusses the results achieved in the course of this thesis along with
an overall discussion on learning outcomes, future works and reflections.
1.3 UNDERSTANDING CONTEXT
1.3.1 The Positive Effects of Internet
Over the past few years and even today, it has been repeatedly pointed out by many researchers and
NGOs through key World Development Indicators1 that countries (or societies) with higher Internet
penetration benefit with higher economic development, more open information and media
communication, better civic systems such as education and healthcare, improved civic engagement
democratic participation and overall enhancement in QOL2 in comparison to those countries (or societies)
that have a low Internet penetration (Mauro F. Guillén, 2005) (Warschauer, 2002) (Richard Kahn, 2004)
(Selwyn, 2004) (Norris, 2001).
The Internet has transformed many aspects of our ways of life amidst different spheres of our civil society
– private, corporate and governmental.
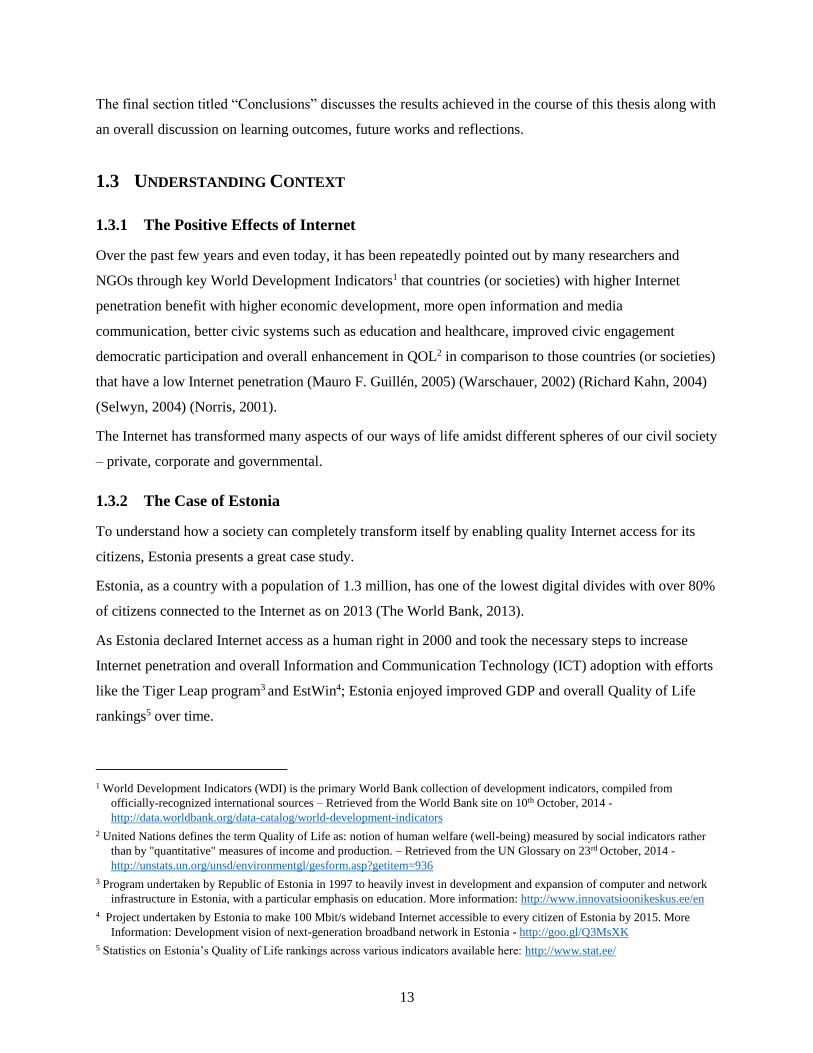
1.3.2 The Case of Estonia
To understand how a society can completely transform itself by enabling quality Internet access for its
citizens, Estonia presents a great case study.
Estonia, as a country with a population of 1.3 million, has one of the lowest digital divides with over 80%
of citizens connected to the Internet as on 2013 (The World Bank, 2013).
As Estonia declared Internet access as a human right in 2000 and took the necessary steps to increase
Internet penetration and overall Information and Communication Technology (ICT) adoption with efforts
like the Tiger Leap program3 and EstWin4; Estonia enjoyed improved GDP and overall Quality of Life
rankings5 over time.
1 World Development Indicators (WDI) is the primary World Bank collection of development indicators, compiled from
officially-recognized international sources – Retrieved from the World Bank site on 10th October, 2014 -
http://data.worldbank.org/data-catalog/world-development-indicators
2 United Nations defines the term Quality of Life as: notion of human welfare (well-being) measured by social indicators rather
than by "quantitative" measures of income and production. – Retrieved from the UN Glossary on 23rd October, 2014 -
http://unstats.un.org/unsd/environmentgl/gesform.asp?getitem=936
3 Program undertaken by Republic of Estonia in 1997 to heavily invest in development and expansion of computer and network
infrastructure in Estonia, with a particular emphasis on education. More information: http://www.innovatsioonikeskus.ee/en
4 Project undertaken by Estonia to make 100 Mbit/s wideband Internet accessible to every citizen of Estonia by 2015. More
Information: Development vision of next-generation broadband network in Estonia - http://goo.gl/Q3MsXK
5 Statistics on Estonia’s Quality of Life rankings across various indicators available here: http://www.stat.ee/

14
In less than 15 years, Estonia’s GDP grew by 4 times from 5.67 Billion USD in 2000 to 24.47 Billion
USD in 2013. In 2013, over a fourth or 27% of services exported by Estonia were ICT based (The World
Bank, 2013) amounting to 1.48 Billion USD (The World Bank, 2013).
Figure 1-1: An upward trend in key economic development indicators with rise in Internet population in Estonia. Data Source: (The World Bank, 2013)
As of 2013, 99.6% of all banking transactions in Estonia were done online (Republic of Estonia, 2006)
and in the 2011 elections 15.34% of eligible population voted online (Republic of Estonia, 2011).
Most Estonian (and world) researchers, academicians and general citizens believe that the Quality of Life
in Estonia has improved as the country implemented the necessarily ICT measures to bridge the digital
divide. This transformed a fragile post-soviet country with information disparity into a highly advanced
digital society.
Numerous studies have repeatedly shown how countries with higher penetration and adoption of Internet
like Estonia have resulted in better educational systems, improved democratic participation, government
services, and higher economic development than countries that were late or non-adopters (Kattel, 2006)
(Ifinedo, 2005) (Dasgupta, 2001).
15
The urgent need to bridge this digital divide has been recognized by the United Nations (Frank La Rue,
2011) and countries like Costa Rica (United States of America, 2011), Estonia (Republic of Estonia,
2006), Finland (BBC Network, 2010), France (Fox Networks, 2009), Greece (Government of Greece,
2008) and Spain (Sarah Morris, 2009); that have created frameworks and policies that consider Internet
Access as a fundamental Human Right.
While users in some countries have been able to harness the potential of information
technologies to thrive and become a major contender in today’s information economy,
others have lagged behind as producers of low-value labor and products for wealthier
nations. (Datta, 2011)
As of January 2014, the sad truth remains that over 60% of the world population do not use the Internet.
(The World Bank, 2013). Most of these users come from poor or low-income countries. As the non-users
miss out on this basic human right, the online population of the world is losing out on their creativity and
contribution.
1.3.3 The Current State of Internet Access and Digital Divide
The United States Department of Commerce defines digital divide as “an economic and social
inequality according to categories of persons in a given population in their access to, use of, or
knowledge of information and communication technologies (ICT)” (U.S. Department of
Commerce, 1995).
According to Beal (2002), digital divide is “a term used to describe the discrepancy between people who
have access to and the resources to use new information and communication tools, such as the Internet,
and people who do not have the resources and access to the technology. The term also describes the
discrepancy between those who have the skills, knowledge and abilities to use the technologies and those
who do not. The digital divide can exist between those living in rural areas and those living in urban
areas, between the educated and uneducated, between economic classes, and on a global scale between
more and less industrially developed nations” (Beal, Vangie, 2002).
Online dictionary reference.com authors coin the term digital divide as “the socioeconomic and other
disparities between those people who have opportunities and skills enabling them to benefit from digital
resources, especially the Internet, and those who do not have these opportunities or skills.”
(Reference.com, 2008)
The concept of digital divide can be classified in many ways – among different countries or sections of
the society. The concept of digital divide on a global scale is well explained by Lu (2001) as “the global
digital divide describes global disparities, primarily between developed and developing countries, in
16
regards to access to computing and information resources such as the Internet and the opportunities
derived from such access” (Lu, Digital divide in developing countries, 2001).
In the past couple of decades much research has been done in understanding the digital divide. The
definition of digital divide has evolved over time. As modern ICT based technologies grew, so did the
context of research.
“Well before the late 20th century, digital divide referred chiefly to the division between
those with and without telephone access; after the late 1990s the term began to be used
mainly to describe the split between those with and without Internet access, particularly
broadband.” (TechTarget, 2014)
With multiple schools of thought and multiple definitions for defining the digital divide over time, it was
not clear which definition to formally adopt. However, the key fundamental remains the same – people
with ready access to information and communication technology are believed to have more socio-
economic opportunities than those who do not.
There are many factors that lead to the digital divide. In one of the later chapters titled “The role of
‘Affordability’ in India’s Digital Divide” it has been observed that low-income levels or affordability is a
common barrier amidst places with low Internet penetration. For the purposes of this thesis only, Digital
Divide is defined as the gap in society between people who have affordable access to Internet versus
people who do not. This definition includes non-Internet users as well as existing Internet users who stay
offline most of the times due to low-income levels or affordability.
1.3.4 Where Do Most Number of Offline People Come From?
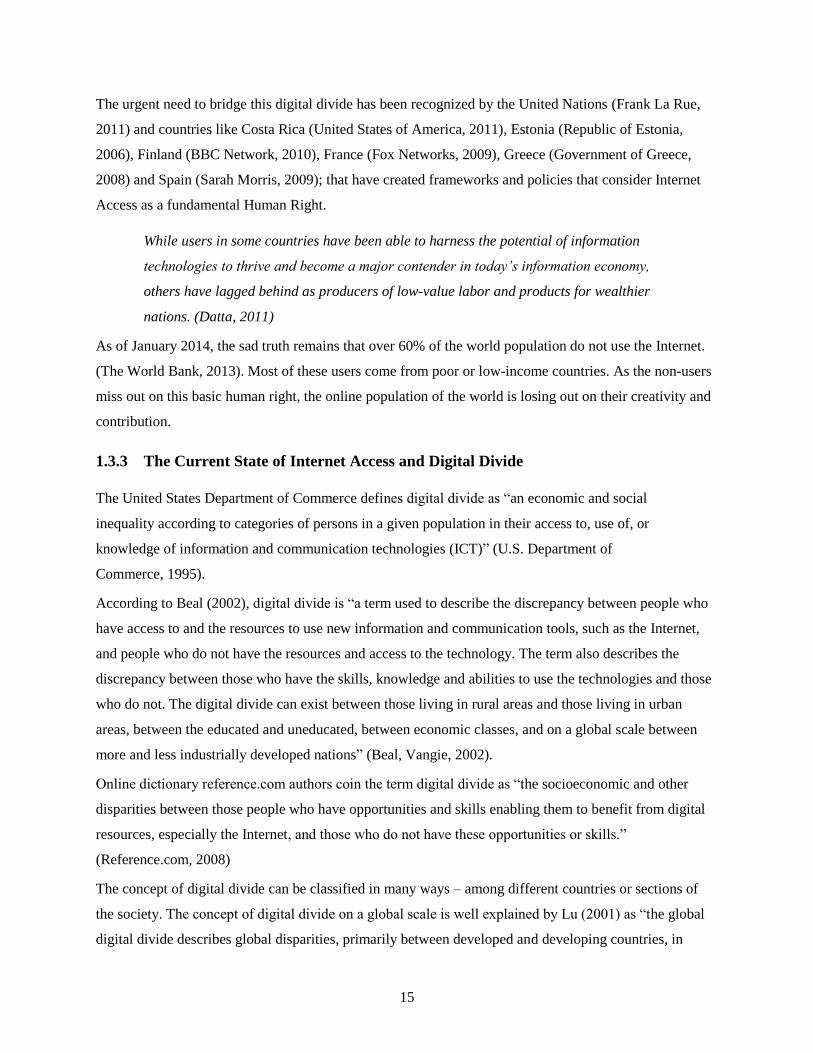
In a recent study conducted by Mckensy in 2014, it was stated that out of the 4.4 billion people in the
world who lack Internet access, 3.4 billion non-users come from just 20 countries (Kara Sprague, James
Manyika, Bertil Chappuis, Jacques Bughin, Ferry Grijpink, Lohini Moodley, Kanaka Pattabiraman,
2014).
17
Figure 1-2: Most number of offline people in the world come from this region.
What is even more interesting is 2.3 billion or approximately 50% of the offline population come from
just 5 countries – China, India, Indonesia, Pakistan and Bangladesh6.
1.3.5 India’s ICT Context: 1 Billion Offline?
India is a developing country with a population of approximately 1.3 billion or roughly 1000 times that of
Estonia’s. India has 29 states and 7 union territories, with its population spread across over approximately
30 major cities, 8000 towns and more than 600,000 villages.
India has one of the lowest Internet penetration rates with only 15% of its population having access to
Internet (The World Bank, 2013). This may seem like a small number in percentage but India has over
300 million Internet users - the third largest digital population in the world.
As of 2014, India had 930 million cellphone subscriptions. Only 6.4 % (or 60.19 million) of these are
mobile Internet users - by way of a smartphone or a USB data dongle. (Telephone Regulatory Authority
of India, 2014).
Only about 5% of India's service exports are ICT based (The World Bank, 2013) amounting to
approximately 100 billion USD. This is roughly 66 times that of Estonia’s ICT export (gross).
Strangely, the world’s highest number of non-Internet users come from the same country that produces
some of the cheapest smartphones, has one of the widest network coverage by kilometer square, is the
third largest ICT exporter in the world and has the second largest cellphone subscriptions in the world.
6 Country (Non-Users in Millions): India (1063), China (736), Indonesia (210), Pakistan (162) and Bangladesh (146). Data
Source: World Bank (2013)

18
The Role of ‘Affordability’ in India’s Digital Divide
Due to the large size of this country and its environmental and cultural diversity, it is difficult to find
common trends or factors that lead to the digital divide. However, one key trend was observed among
states in India with a large digital divide versus states with a lower digital divide. The key factor here is –
income levels and affordability.
Figure 1-1: Tele-density figures are derived from the telephone subscriber data provided by the access service providers and the projections of population published by the Office of the Registrar General & Census Commissioner, India. (Telephone Regulatory Authority of India, 2014)
Poorer states in India such as Bihar, Assam, Madhya Pradesh and Uttar Pradesh showed a larger digital
divide in comparison to some of the richer states 7such as Maharashtra, Gujarat and Himachal Pradesh.
7 GDP per capita by states in India: http://planningcommission.nic.in/data/datatable/0306/table%20168.pdf
ALL INDIABihar
AssamMadhya Pradesh
Uttar PradeshOdisha
J & KNorth East
West BengalRajasthan
HaryanaAndhra Pradesh
MaharashtraGujarat
KarnatakaKerelaPunjab
Himachal PradeshTamil Nadu
Telephone Subscriptions per 100
Sta
tes
in In
dia
TELE-DENSITY IN INDIA (State Wise) as of 30th September 2014
19
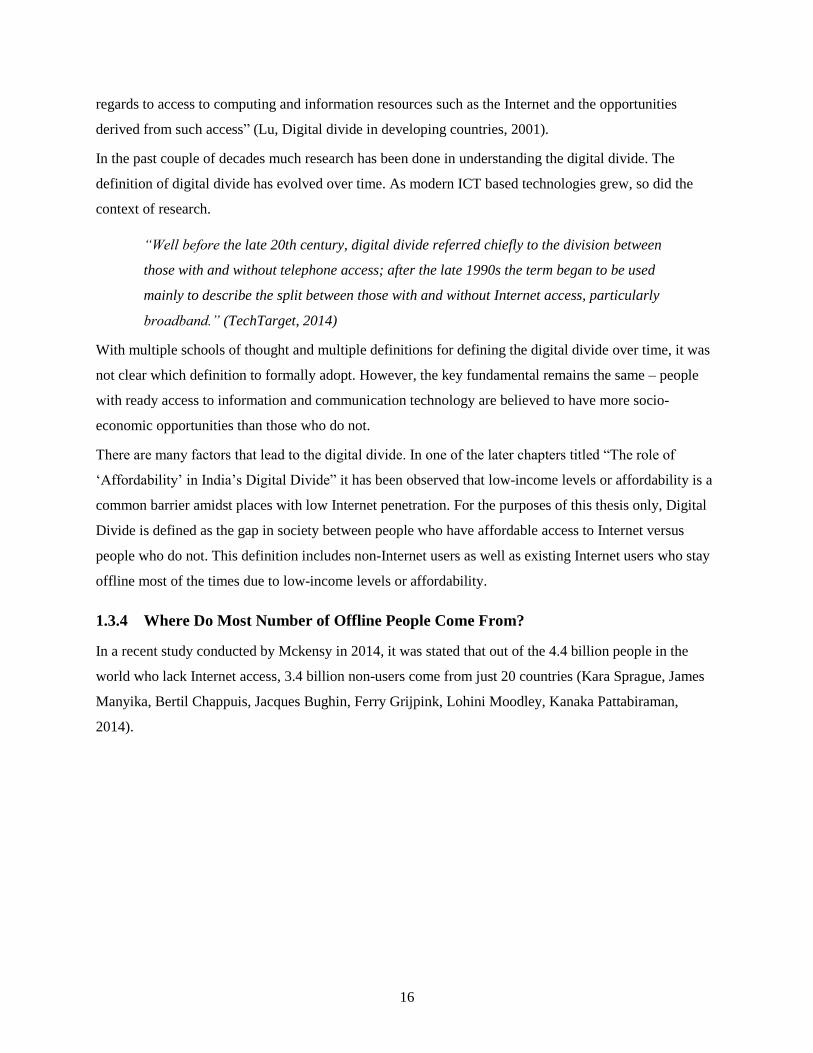
Low-income levels or ‘affordability’ has been considered as a significant barrier that causes the digital
divide in not just India – but many countries like India with expensive wholesale data access.
Figure 1-2: Wholesale bandwidth costs around the world. Cities like New York and Amsterdam pay less 10% of what Mumbai pays (Telegeography, 2009).
India has one of highest price of wholesale bandwidth costs in the world. According to a press release by
Telegeography – a telecommunications market research and consulting firm; “IP transit is one of the most
widely bought and sold wholesale communications services. Median monthly IP transit prices for GigE
ports in major North American and European cities averaged around $10 per Mbps. In contrast, the
median monthly price per Mbps of a GigE port in Q2 2009 is $31 in Tokyo, $52 in São Paulo, and $80 in
Mumbai” (Telegeography, 2009)

20
Figure 1-3: A comparison of fixed-broadband prices in terms of purchasing power parity, which takes into account the national buying power of a local currency, shows that fixed broadband is quite inexpensive in a number of countries with a relatively low Gross National Income (GNI) per capita. Image Source: (International Telecommunication Union, 2013)
ISPs in India find it difficult to offer globally competitive prices thereby affecting ‘affordability’ to user.
Apart from global market factors, local taxes and abnormal license fees set by the government for Internet
service providers in India further drive up the cost of the Internet to the end user.
The high prices do not just affect non-users - Millions of existing Internet users stay offline most of the
times simply because it is too expensive to consume Internet data.
Existing Efforts to Bridge the Digital Divide in India
In 2014, the government of India launched an extensive program called Digital India with a vision to
transform India into a digital society. The program has systematic investment in 3 key areas - improving
ICT infrastructure, digital literacy and e-governance (Government of India, 2014). Some of the key
highlights from the program that address bridging the digital divide include:
Improving Infrastructure – High speed Internet access in rural areas still remains a dream for
many Indians. The government of India plans to invest $4billion USD to create a national optic
fiber that connects 200,000 villages in India with broadband access. However, it is to be noted
that India has 610,000+ villages.
Improving user capacity – Creating special training programs in state run schools and colleges for
basic computer literacy (in rural and semi-urban areas) of the country.
Apart from the government, much work is being done by research institutions, corporates and non-
governmental organizations to bridge the digital divide.
21
For instance, researchers Indrani Medhi, Aman Sagar, and Kentaro Toyama (2007) - In their study titled
‘Designing text-free user interfaces for semi-literate and illiterate users’ explain how text free user
interfaces are integral to bring illiterate/semi-literate users online and also provide framework to design
and develop ‘text-free’ apps and services. In their study, they built two applications using these principles,
one for a job search portal for illiterate domestic laborers from the slums in Bengaluru, and another for a
generic map that could be used for navigating a city (Indrani Medhi, 2007).
This example illustrates how ICTD researchers are bridging the digital divide by increasing
contextualization and localization of apps and services to increase the usability and usefulness of the
Internet.
Along with this usability and usefulness of the web, additional efforts are being undertaken to educate and
improve digital literacy to bring more users online. A notable example is the ‘Hole-in-the-wall’ learning
project8 by Sugata Mitra (2005) whereby 17 learning stations (a computer with Internet access) were
placed at different rural (and semi-urban) parts India. This project received worldwide attention when
children lacking basic computer skills learned how to use a computer, without any teacher and; through
group discovery. Similar experiments were repeated in Cambodia.
Another example worth mentioning is the Intel® Teach Program9 - a professional development program
designed to help teachers in India integrate technology into instruction and help students acquire such
skills as digital literacy.
Corporate sponsored free Wi-Fi Zones and the rise of open source culture in wireless networking
applications are other examples of efforts by various non-governmental agents to bridge the digital divide.
The Role of Wi-Fi in shaping India’s Internet access
With the rise of low cost, high-end smart phones and of open source operating systems such as android,
the price of owning an Internet enabled mobile device has substantially dropped over the past few years.
As per research firm eMarketer ®, it is estimated that India will surpass the United States as the world’s
second largest smartphone market, after China, by 2016 with over 200 million smartphone users.
(eMarketer, 2014)
In densely populated cities in India (and neighboring countries with similar cities) mobile network
congestion is a huge issue that tends to hinder on-the-go Internet access. Network congestion results in
slow Internet speeds and frequent disconnections for end users. This, coupled with the high cost of data
makes mobile Internet access a broken experience (Prasanto K Roy, 2014).
8 More information on Hole-in-the-wall project can be found here: http://www.hole-in-the-wall.com/Solution.html
9 More information on Intel® Teach program can be found here: http://goo.gl/fxxvGd
22
The most affordable route of accessing Internet on-the-go at such places is through broadband/leased line
with Wi-Fi access points. Cisco® estimates that in 2018 61% of all Internet traffic will be generated
through Wi-Fi. Fixed traffic will be account for 24% and mobile connected devices will account for 15%
total Internet traffic by 2018. In comparison, Wi-Fi was 55%; cellular was 4%; and fixed was 41% in
2013. (Cisco Systems, Inc, 2014)
This is one of the reasons the government of India is planning to invest in 400,000+ public Internet (Wi-
Fi) access points. This includes free (or low cost) Wi-Fi networks (hotspots) in 250,000 schools, 400
universities, 2500 train stations and various public places. (Government of India, 2014)
For instance, in New Delhi and Kolkata - the local body government (along with private partnerships) has
plans to implement a city wide free Wi-Fi area network to bridge the digital divide. Many cities in India
are adopting such a model to bridge the digital divide (Tikoo, Taniya, 2015) (Times News Network,
2015).
1.4 CLOSING REMARKS
We addressed an existing problem in developing countries like India in the sections above. A problem
between the current state of Internet access and digital divide. We illustrate several examples on the
existing efforts in bridging the digital divide. We also discuss possible issues that lead to the inability of
some research institutions, corporates and non-governmental organizations to bridge the digital divide in
such specific conditions. Especially indicating the need to design free Internet provision models that focus
on users’ needs, affordability and in providing positive user experiences i.e. without affecting quality of
service.
For instance, the organization Internet.org; recently founded by companies like Facebook®, Microsoft®,
Samsung® and a few others who claim to bridge the digital divide in India; partnered with telecom
company Reliance Communications® to provide ‘free’ Internet access to all Reliance network users who
download the Internet.org app (Reliance Communications, 2015). However, it is to be noted that the so
called free Internet access is limited to only approximately 40 websites (Russel, Jon, 2015) – such as
social networking site facebook.com, airline ticket booking site cleartrip.com10 and so on. These few sites
can be accessed through certain browsers only. Basic services such as Google® Search via the Reliance
Communications® network are charged whereas accessing partner sites through Internet.org app are not.
10 In the course of this thesis Cleartrip (and many other Indian sites) pulled out of Internet.org as it violates Net Neutrality in
India. More information: http://goo.gl/qe6Mey
23
In this example, the lack of clear business model in distributing free Internet access not only fails at
bridging the digital divide but could also hamper India’s net neutrality (Sawant, Nimish, 2015).
Another failed effort worth mentioning is that of New Delhi’s free Wi-Fi model. In an area called
Chitranjan Park in New Delhi the government had proposed ‘a free Wi-Fi Zone’. The so called ‘free Wi-
Fi service’ only lasts for 20 minutes per day, has a quota on download/upload data and speed and censors
a large portion of the Internet (HT Media, 2014). After 20 minutes, the users need to pay a fee for access
which is not possible for many due to low-income levels or ‘affordability’ as explained in the earlier
section (refer 1.3.5.3. – The Role of ‘Affordability’ in Bridging the Digital Divide). Such inefficient
models of ‘free’ but ‘not really free’ Internet access through Wi-Fi are being adopted throughout India.
Clearly, these Wi-Fi Zones have a lower user experience (in comparison to unlimited Wi-Fi zones) and do
not end up doing much to bridge the digital divide for a large section of the offline population.
In this study we explore such existing models of free (or low cost) Wi-Fi in India and find ways to
overcome existing legal, economic and technical roadblocks with a research goal to enable free Internet
access for end users.
24
2. THE STUDY
The following sections contain information on the ‘in-the-wild’ study procedure adopted for the purposes
of this study – introducing a participatory design approach devised to achieve an answer to this ‘wicked
problem’; that is to provide free Internet access to end users in India and contribute towards bridging the
existing digital divide by eliminating the barrier of ‘affordability’. For the purpose this study, we adopted
IDEO’s (HCD) toolkit and the Double Diamond design process to achieve those goals.
2.1 RESEARCH PROBLEM AND STRATEGY
Over the last ten years, many studies have been conducted to understand and bridge the digital divide
(Quibria, 2003). In our initial exploratory research process it was discovered that some of these studies
seemed irrelevant (or obsolete) in the context of India today. The fast paced nature and dynamics of
developing countries such as India and their use of ICT; require involvement of the researcher or designer
(with end users) in the real environment. According to Alan Chamberlain, Andy Crabtree, Tom Rodden,
Matt Jones and Yvonne Rogers (2012), taking people out of their natural environment and designing in
the lab without long term user engagement may no longer be an appropriate way to properly understand
the impacts of technology in the real world (Alan Chamberlain, 2012). For this reason we use the ‘in-the-
wild’ study approach to conduct our field study in Mumbai (India) to solve our key research problem –
“How do we enable free Internet access in India for end users”.
The large number of foreseen and unforeseen roadblocks affecting affordability in data access in India,
involved understanding of various disciplines involved such as wireless networking technologies,
interaction design, financial modeling, digital advertising and unclear legal laws and guidelines affecting
data access in India. This made it a ‘wicked problem’ to tackle. A ‘wicked problem’ in the field of social-
technical planning; is a social or cultural problem that is difficult to solve for as many as four reasons:
incomplete or contradictory knowledge, the number of people and opinions involved, the large economic
burden, and the interconnected nature of these problems with other problems (Kolko, Jon, 2012)
(Australian Public Service Commission, 2007). It is impossible for a single individual (designer or
researcher) to be of aware all the problems faced by the various stakeholders. This demanded the use of
Participatory Design (PD) approaches.
Participatory design (PD) is a set of theories, practices, and studies related to end-users as full
participants in activities leading to software and hardware computer products and computer-
based activities. The field is extraordinarily diverse, drawing on fields such as user-centered
design, graphic design, software engineering, architecture, public policy, psychology,

25
anthropology, sociology, labor studies, communication studies, and political science, and from
localized experiences in diverse national and cultural contexts. Many researchers and
practitioners in PD (but not all) are motivated in part by a belief in the value of democracy to
civic, educational, and commercial settings – a value that can be seen in the strengthening of
disempowered groups including workers, children, older adults, in the improvement of internal
processes, and in the combination of diverse knowledge’s to make better services and products
(Muller, 2002)
Over the past couple of decades, Participatory Design (PD) methods have solved many critical social
inequality issues (Muller, 2002). The key philosophy behind PD is to involve the end-user / community in
the design process i.e. collective problem finding and collective problem solving. To do so a series of
tools, strategies and methods need to be adopted.
The following sections entail the design toolkit, the design process and the design strategy adopted in the
course of this study to tackle the problem of ‘affordability’. The adopted design methods included, the
IDEO Human Centered Design (HCD) toolkit and the Double Diamond approach.
2.1.1 IDEO Human Centered Design (HCD) Toolkit
This IDEO HCD toolkit was originally created for non-governmental organizations and social enterprises
that work with impoverished communities in Africa, Asia, and Latin America. (University of British
Columbia, 2014)
26
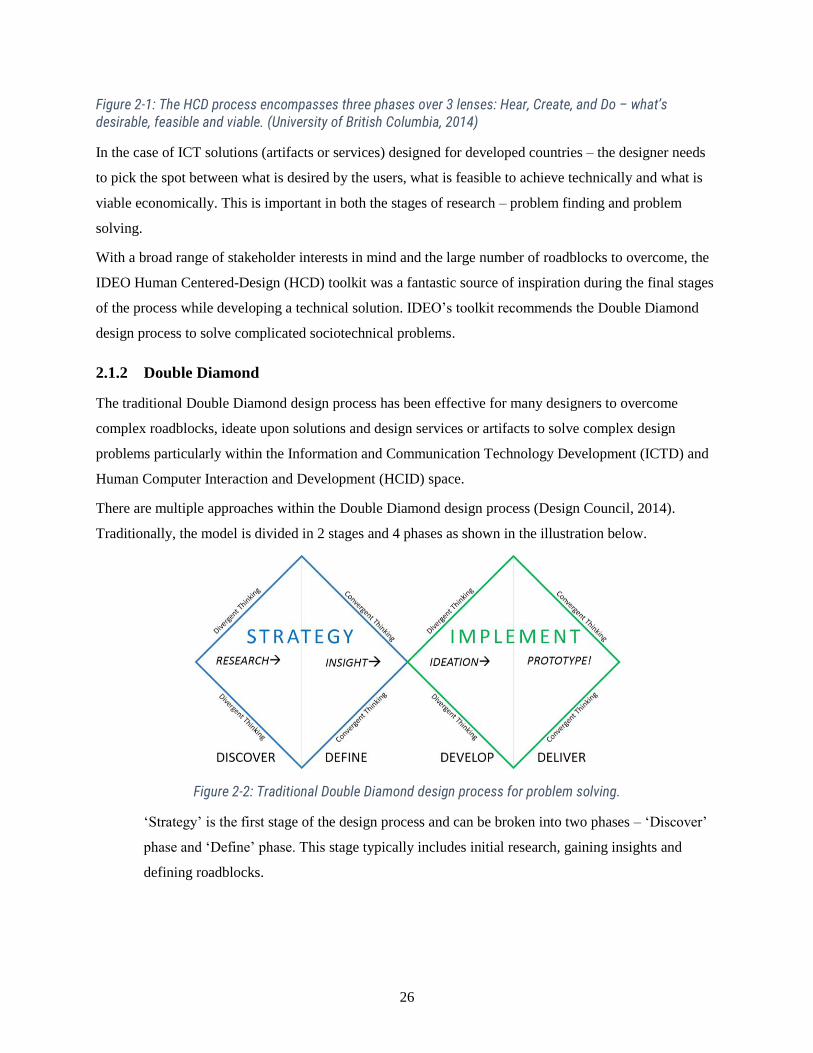
Figure 2-1: The HCD process encompasses three phases over 3 lenses: Hear, Create, and Do – what’s desirable, feasible and viable. (University of British Columbia, 2014)
In the case of ICT solutions (artifacts or services) designed for developed countries – the designer needs
to pick the spot between what is desired by the users, what is feasible to achieve technically and what is
viable economically. This is important in both the stages of research – problem finding and problem
solving.
With a broad range of stakeholder interests in mind and the large number of roadblocks to overcome, the
IDEO Human Centered-Design (HCD) toolkit was a fantastic source of inspiration during the final stages
of the process while developing a technical solution. IDEO’s toolkit recommends the Double Diamond
design process to solve complicated sociotechnical problems.
2.1.2 Double Diamond
The traditional Double Diamond design process has been effective for many designers to overcome
complex roadblocks, ideate upon solutions and design services or artifacts to solve complex design
problems particularly within the Information and Communication Technology Development (ICTD) and
Human Computer Interaction and Development (HCID) space.
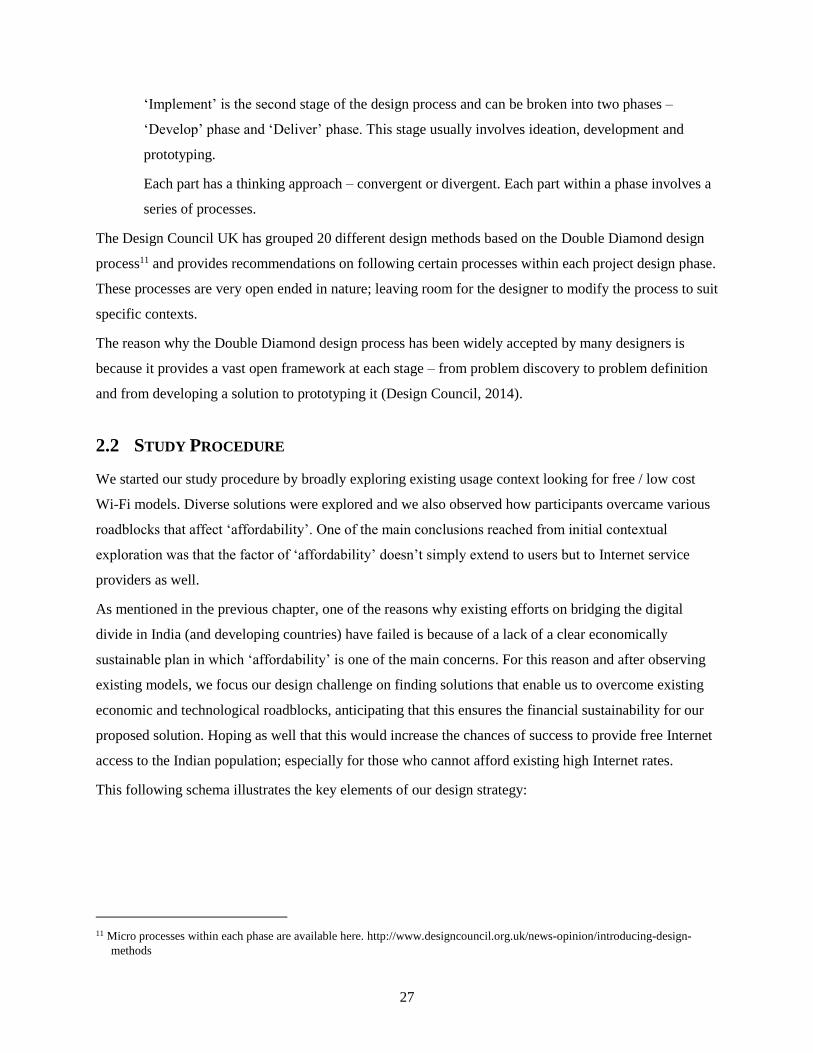
There are multiple approaches within the Double Diamond design process (Design Council, 2014).
Traditionally, the model is divided in 2 stages and 4 phases as shown in the illustration below.
Figure 2-2: Traditional Double Diamond design process for problem solving.
‘Strategy’ is the first stage of the design process and can be broken into two phases – ‘Discover’
phase and ‘Define’ phase. This stage typically includes initial research, gaining insights and
defining roadblocks.
27
‘Implement’ is the second stage of the design process and can be broken into two phases –
‘Develop’ phase and ‘Deliver’ phase. This stage usually involves ideation, development and
prototyping.
Each part has a thinking approach – convergent or divergent. Each part within a phase involves a
series of processes.
The Design Council UK has grouped 20 different design methods based on the Double Diamond design
process11 and provides recommendations on following certain processes within each project design phase.
These processes are very open ended in nature; leaving room for the designer to modify the process to suit
specific contexts.
The reason why the Double Diamond design process has been widely accepted by many designers is
because it provides a vast open framework at each stage – from problem discovery to problem definition
and from developing a solution to prototyping it (Design Council, 2014).
2.2 STUDY PROCEDURE
We started our study procedure by broadly exploring existing usage context looking for free / low cost
Wi-Fi models. Diverse solutions were explored and we also observed how participants overcame various
roadblocks that affect ‘affordability’. One of the main conclusions reached from initial contextual
exploration was that the factor of ‘affordability’ doesn’t simply extend to users but to Internet service
providers as well.
As mentioned in the previous chapter, one of the reasons why existing efforts on bridging the digital
divide in India (and developing countries) have failed is because of a lack of a clear economically
sustainable plan in which ‘affordability’ is one of the main concerns. For this reason and after observing
existing models, we focus our design challenge on finding solutions that enable us to overcome existing
economic and technological roadblocks, anticipating that this ensures the financial sustainability for our
proposed solution. Hoping as well that this would increase the chances of success to provide free Internet
access to the Indian population; especially for those who cannot afford existing high Internet rates.
This following schema illustrates the key elements of our design strategy:
11 Micro processes within each phase are available here. http://www.designcouncil.org.uk/news-opinion/introducing-design-
methods
28
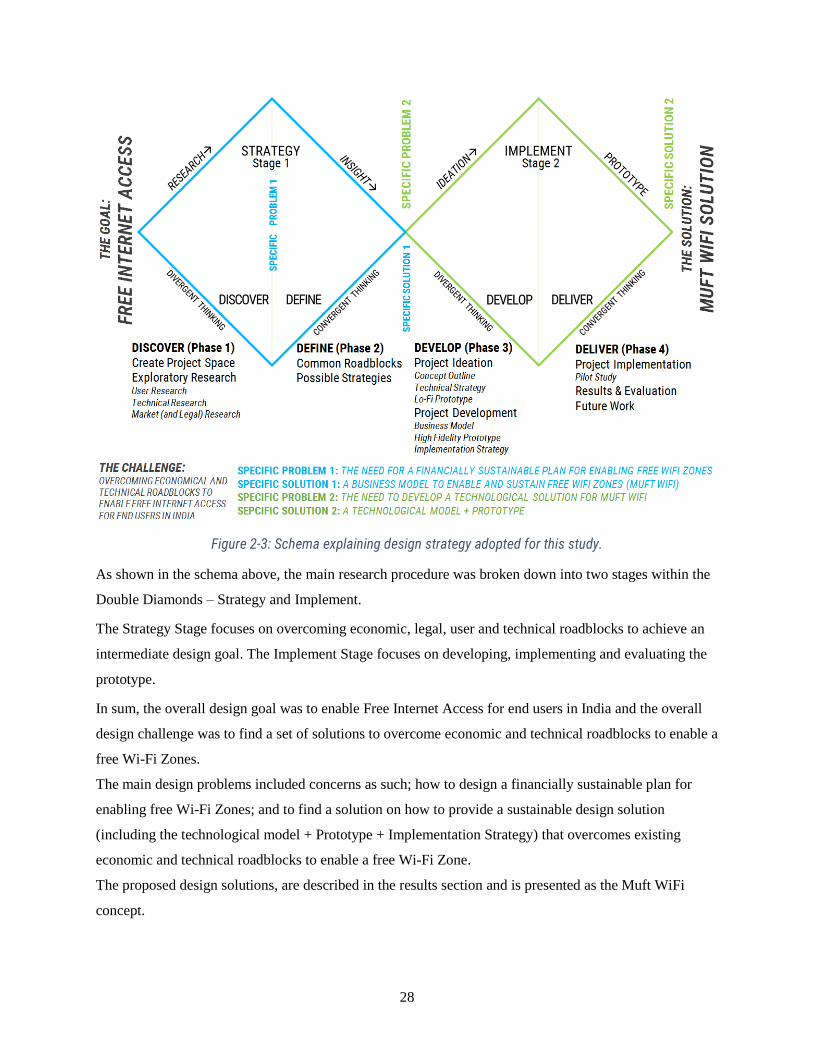
Figure 2-3: Schema explaining design strategy adopted for this study.
As shown in the schema above, the main research procedure was broken down into two stages within the
Double Diamonds – Strategy and Implement.
The Strategy Stage focuses on overcoming economic, legal, user and technical roadblocks to achieve an
intermediate design goal. The Implement Stage focuses on developing, implementing and evaluating the
prototype.
In sum, the overall design goal was to enable Free Internet Access for end users in India and the overall
design challenge was to find a set of solutions to overcome economic and technical roadblocks to enable a
free Wi-Fi Zones.
The main design problems included concerns as such; how to design a financially sustainable plan for
enabling free Wi-Fi Zones; and to find a solution on how to provide a sustainable design solution
(including the technological model + Prototype + Implementation Strategy) that overcomes existing
economic and technical roadblocks to enable a free Wi-Fi Zone.
The proposed design solutions, are described in the results section and is presented as the Muft WiFi
concept.
29
The complex nature of the above proposed problems required that we constantly validate the different
solutions with different stakeholders. For that we used different data collection techniques like online
discussion forums, participatory co-design sessions and interviews. In this participatory design process
the different stakeholders involved included developers, users, Internet service providers, politicians,
lawyers, network architects, software engineers, business modeling experts, investors and digital
advertising specialists and various other experts.
The main reason for the adoption of above described design approaches was due to the complexity of the
research problem, this is the specific contextualized problem – the Indian context a developing country
with specific needs and specific contextualized solutions. .
For instance, to be able to ensure the sustainability of our co-designed solution we needed first to
overcome the existing Indian socioeconomic roadblocks. This required working closely with local
financial analysts, business modeling experts, taxation specialists, lawyers, politicians, Internet service
providers, hardware manufacturers, telecom companies, interaction designers, network architects,
software engineers, business owners, investors, advertising agencies, digital media buying and selling
experts.
This efforts were then transferred to the second stage of the Double Diamond design process; the
implementation, and in here the key participants (selected from above sub-groups) worked closely on
ideating technical solutions and developing a prototype.
Note that the schema above merely iterates the design challenge process but due to the complex nature of
the problem, this design process doesn’t follow a linear time-line from ‘Strategy’ to ‘Implementation’ as
represented in the graphic above; as many problems and solutions are correlated, codependent and/or
concurrent.
In the following chapters, a detailed account of the processes involved and solution(s) designed in the
course of this study will be explained.
2.2.1 Material and Instruments
During this study we collected and organize information from a various range of stakeholders; through an
online portal (called muftinternet.com) that we developed, and co-design sessions in the form of in-depth
interviews and workshops. This enabled us to work on project visibility also facilitate an effective and
efficient communication process between participants.
Along with the online portal, in the later stages of the study, we used a studio workspace that helped that
participants to co-develop a solutions.

30
The Muftinternet.com Online Portal
Our first step towards this participatory design approach, was to develop an online portal where
participants from diverse backgrounds and key knowledge areas such as laws in India affecting Internet
access, wireless networking, business modeling for Internet services providers and digital advertising –
could be collectively engaged in sharing knowledge and ideating upon various (proposed) solutions.
The portal enabled engaged participants to provide feedback and/or comment the overall project idea and
concept; and collectively create a solution to our wicked problem.
This online platform was called “Muftinternet.com”, Muft’ means ‘free’ in Hindi and Urdu, so in literal
sense it means - ‘Free Internet’.
Figure 2-4: Screenshot of the homepage of Muft Internet
As on March 2014, the online portal has over 4400 registered members. In a period of 5 months, the
online portal received over 80,000+ page views. The following sections make up the main components of
this portal.
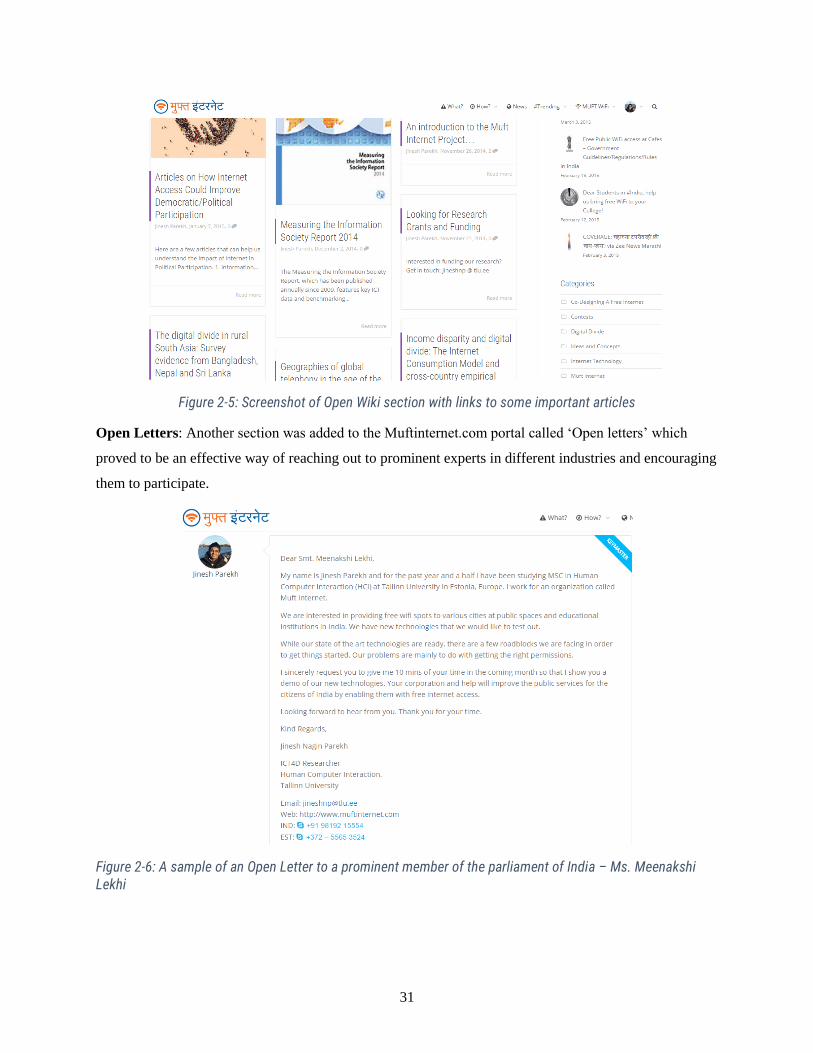
Open Wiki: the first version of the online portal originally started as a simple Open Wiki – an e-
participation platform that aimed to explain the research goal to participants and enable us to explore (and
share) additional information about the current status of the digital divide. Relevant articles about efforts
and ways to bridge the digital divide in various parts of the world were posted here.
31
Figure 2-5: Screenshot of Open Wiki section with links to some important articles
Open Letters: Another section was added to the Muftinternet.com portal called ‘Open letters’ which
proved to be an effective way of reaching out to prominent experts in different industries and encouraging
them to participate.
Figure 2-6: A sample of an Open Letter to a prominent member of the parliament of India – Ms. Meenakshi Lekhi

32
Over 200 such publicly available open letters12 were written to various politicians, media experts,
hardware companies, lawyers, and business tycoons etc. to invite their participation to the project. Open
letters was also an effective way to maintain transparency in project communications.
Additional collaboration Tools: This portal also enabled different types of complementary collaboration
and communication tools like Twitter®, Facebook® and Quora®. The objective was to maintain
transparency and clarity in information across various social media channels. Those played a key role in
reaching various experts.
In sum, in this portal participants communicate primarily on the Muftinternet.com portal by tagging each
other on short status updates (similar to twitter), sending personal messages and by posting to each other’s
wall (similar to Facebook).
Figure 2-7: Profile Page on Muftinternet.com with links to Activity Feed, Notifications, Messages, Forums and Settings.
These activity feeds were particularly helpful during co-design sessions and in-depth interviews – it was a
simple and quick way to share updates, statuses and facts that affected the overall project.
During the course of this study over 11,000+ tweets13 were made – Twitter proved to be the most
effective way to reach prominent industry experts. Open letters were tweeted out to various experts asking
them for their participation.
12 Letters/Emails that were made publically available can be found here: http://muftinternet.com/forums/forum/openletters/
13 All tweets available on: www.twitter.com/muftInternet
33
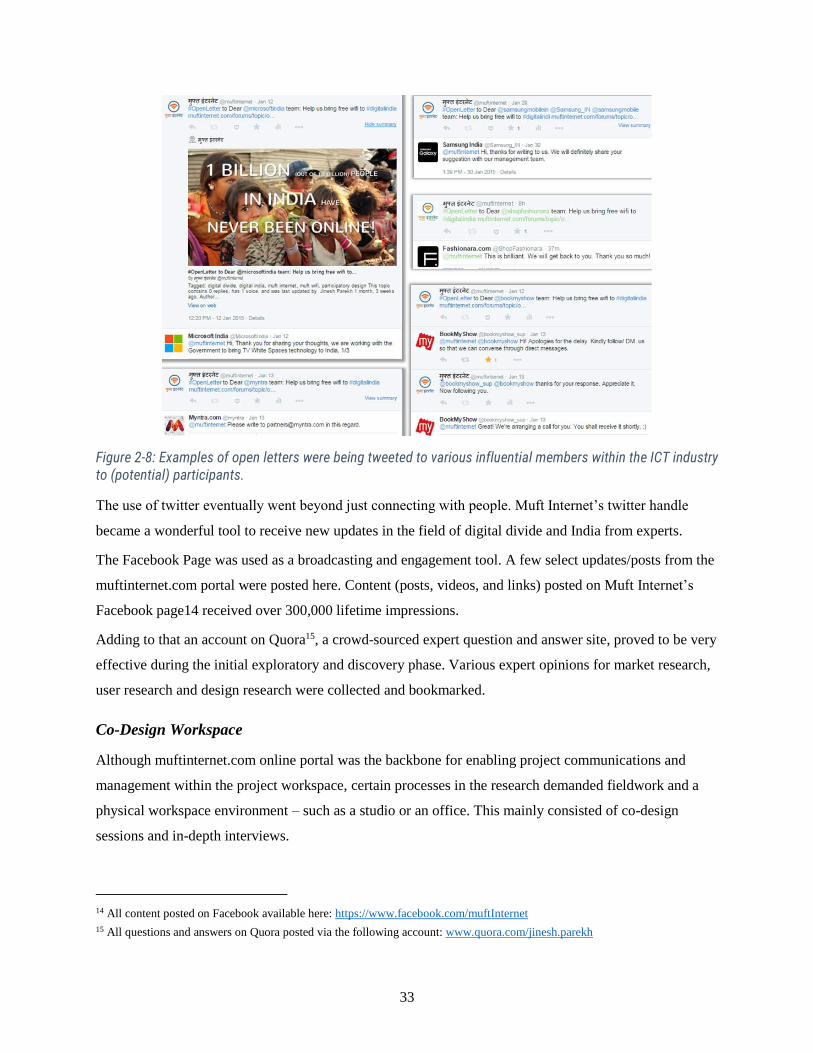
Figure 2-8: Examples of open letters were being tweeted to various influential members within the ICT industry to (potential) participants.
The use of twitter eventually went beyond just connecting with people. Muft Internet’s twitter handle
became a wonderful tool to receive new updates in the field of digital divide and India from experts.
The Facebook Page was used as a broadcasting and engagement tool. A few select updates/posts from the
muftinternet.com portal were posted here. Content (posts, videos, and links) posted on Muft Internet’s
Facebook page14 received over 300,000 lifetime impressions.
Adding to that an account on Quora15, a crowd-sourced expert question and answer site, proved to be very
effective during the initial exploratory and discovery phase. Various expert opinions for market research,
user research and design research were collected and bookmarked.
Co-Design Workspace
Although muftinternet.com online portal was the backbone for enabling project communications and
management within the project workspace, certain processes in the research demanded fieldwork and a
physical workspace environment – such as a studio or an office. This mainly consisted of co-design
sessions and in-depth interviews.
14 All content posted on Facebook available here: https://www.facebook.com/muftInternet 15 All questions and answers on Quora posted via the following account: www.quora.com/jinesh.parekh
34
The fieldwork conducted mostly included user research, technical research and market research. Data
collected during this process included photo diaries, video interviews and notes.
The co-design sessions were performed in a studio, donated by one of the participants for a few hours
every couple of days. The studio space was particularly helpful for the co-design sessions especially
during the 3rd phase of the study – the development phase. In that phase designers and developers worked
together to develop a prototype.
Due to country constraints and to lack of resources most in-depth interviews were held at public places
such as a cafés (which can often be quite noisy) or corporate/government offices of the
participants/experts.
Additional research was undertaken with the help of project volunteers - For instance we observed
various densely populated public spots in Mumbai to find places where we could apply cost-effective Wi-
Fi Zones and; video interviews of various students from different colleges to try to understand their needs
and how they could use Wi-Fi Zones in (or around) their colleges. We also conducted several telephonic
conference calls with experts from different disciplines during the course of this study.
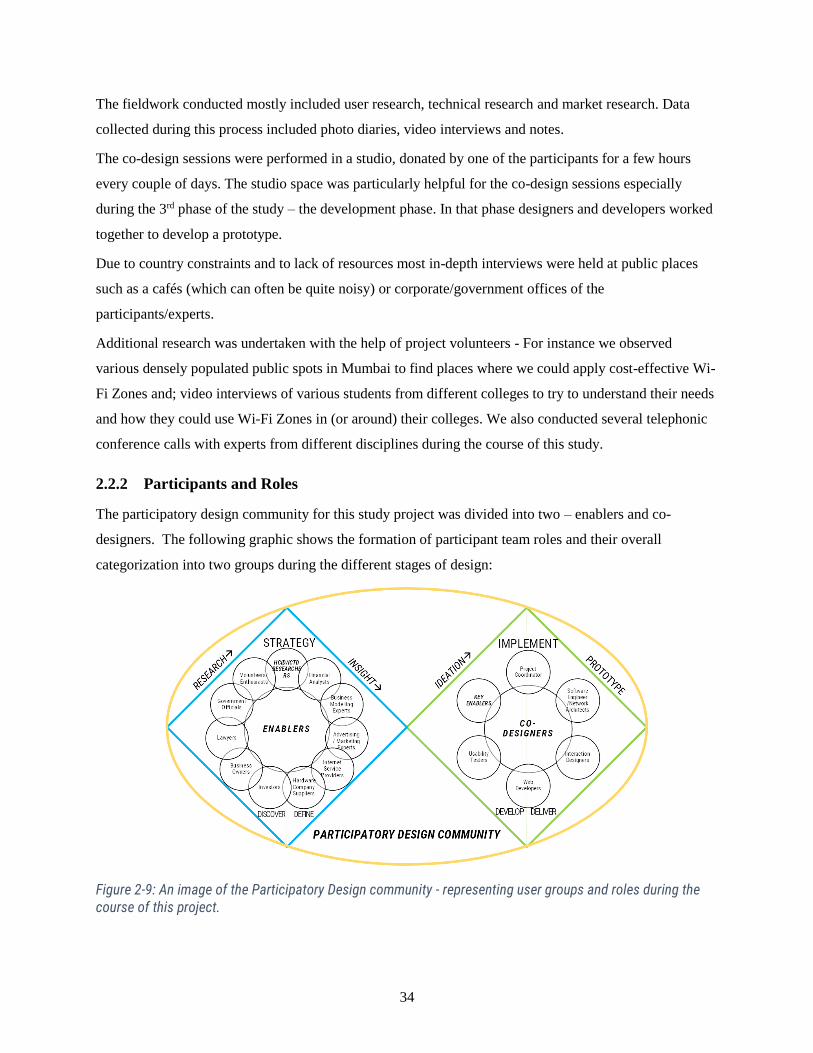
2.2.2 Participants and Roles
The participatory design community for this study project was divided into two – enablers and co-
designers. The following graphic shows the formation of participant team roles and their overall
categorization into two groups during the different stages of design:
Figure 2-9: An image of the Participatory Design community - representing user groups and roles during the course of this project.
35
The role of ‘enablers’ was to help us create a strategy to understand and overcome roadblocks during the
first two phases of the design process. During this stage, the enablers played a key role in exploring and
gaining insights on technical, legal, economic and various other roadblocks. The co-designers (or key
enablers/participants, experts and high level enthusiasts) were invited for different co-design sessions at
the development and implementation phase of the design.
The role of ‘co-designers’ was to ideate and prototype an overall design solution with the help of key
enablers. Co-Designers played a key role in implementation stage of the design.
At all stages of design, the researchers conducted in-depth interviews and kept all the participants,
stakeholders and volunteers in the loop via the online portal and other communication tools.
2.3 CLOSING REMARKS
In this chapter we addressed the research problem and the strategy involved in this study. The wicked
problem, of enabling free Internet access for end user requires an in-the-wild study approach enabled
through participatory design methods.
We illustrate the use of IDEO’s toolkit and the Double Diamond design process adopted for the purposes
of the study.
In the following chapter we discuss the results achieved using the abovementioned study procedure and
problem strategy from our six months of field work in Mumbai.
3. RESULTS
In this chapter we discuss the results obtained using the above mentioned study approach and procedure.
It contains information on the project space created for this study and important results from exploratory
research. Further, we discuss the key results from project development and implementation.
3.1 FIRST STAGE OF THE RESEARCH
This section focuses on overcoming economic, legal, user and technical roadblocks to achieve an
intermediate design goal and contains the main results from the user research, technical research and
market research. This was achieved by a three-step exploratory research procedure; one to better
understand the user, another to understand possible technical constrains to implement free and affordable
Internet in India and a final one that explore legal and market roadblocks that could affect the successful
accomplishment of desired user goals; and the potential technical solution(s). We end this section by
discussing a possible (identified) solution for the problem.
36
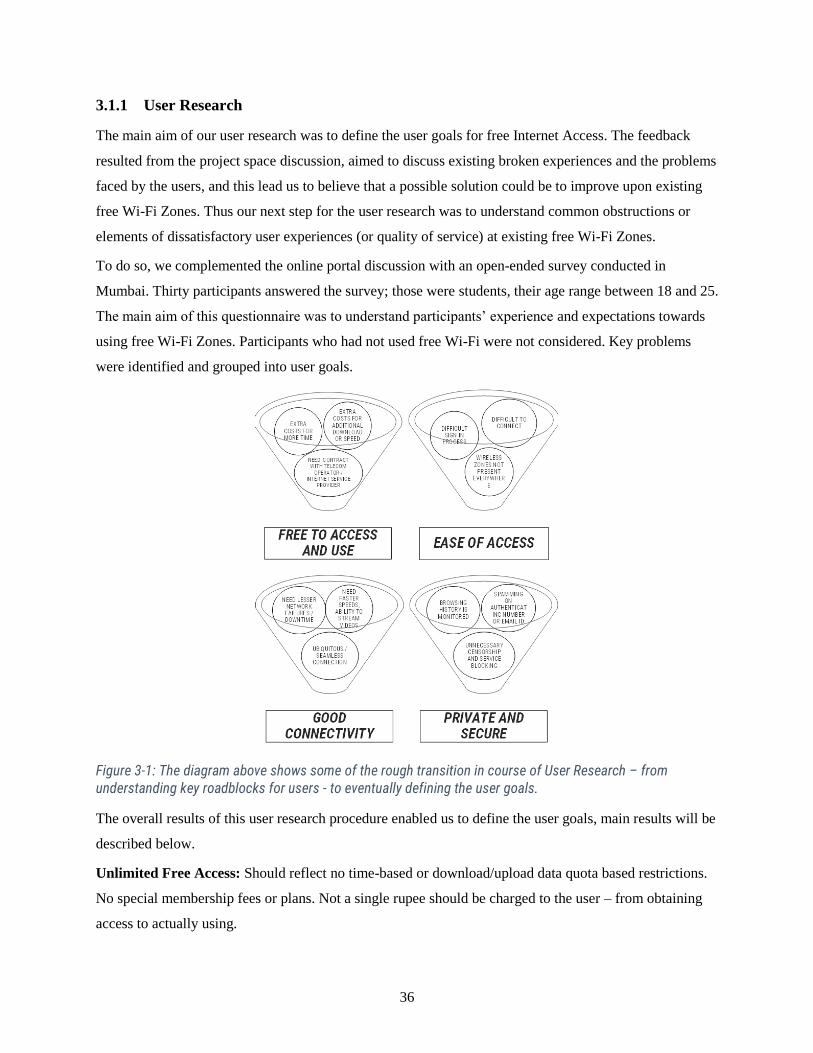
3.1.1 User Research
The main aim of our user research was to define the user goals for free Internet Access. The feedback
resulted from the project space discussion, aimed to discuss existing broken experiences and the problems
faced by the users, and this lead us to believe that a possible solution could be to improve upon existing
free Wi-Fi Zones. Thus our next step for the user research was to understand common obstructions or
elements of dissatisfactory user experiences (or quality of service) at existing free Wi-Fi Zones.
To do so, we complemented the online portal discussion with an open-ended survey conducted in
Mumbai. Thirty participants answered the survey; those were students, their age range between 18 and 25.
The main aim of this questionnaire was to understand participants’ experience and expectations towards
using free Wi-Fi Zones. Participants who had not used free Wi-Fi were not considered. Key problems
were identified and grouped into user goals.
Figure 3-1: The diagram above shows some of the rough transition in course of User Research – from understanding key roadblocks for users - to eventually defining the user goals.
The overall results of this user research procedure enabled us to define the user goals, main results will be
described below.
Unlimited Free Access: Should reflect no time-based or download/upload data quota based restrictions.
No special membership fees or plans. Not a single rupee should be charged to the user – from obtaining
access to actually using.
37
Ease of Access: Should be efficient, easy to connect and distributed. A single user account across all free
Wi-Fi networks.
Connectivity: Ensuring minimal network failures/downtime. Provide high enough speeds to stream
videos. Increasing number of free Wi-Fi Zones.
Private and Secure issues: Ensure user that ISPs (or marketers) will not keep a track of user’s browsing
history or ensure that personal information is keep private. Not allowing marketers to spam on email ID /
phone number used at the time of validation. No additional censorship or service blocking programs.
Respecting the principles of net neutrality.
3.1.2 Technical Research
The technical research was conducted after the user research procedure, the main aim of this research was
to understand ‘who’, ‘where’ and ‘how’ wireless networks or ‘Wi-Fi Zones’ could be implemented in
Indian context. For that purpose several free (or low cost) Wi-Fi Zones in Mumbai were explored.
Interviews were also conducted with the network architects, software engineers and Internet service
providers of such Wi-Fi Zones. This helped us understand the technical (as well as the business) model of
such Wi-Fi Zones.
The overall results of this technical research procedure enable us to define the common terms and
architectures; main results will be described below.
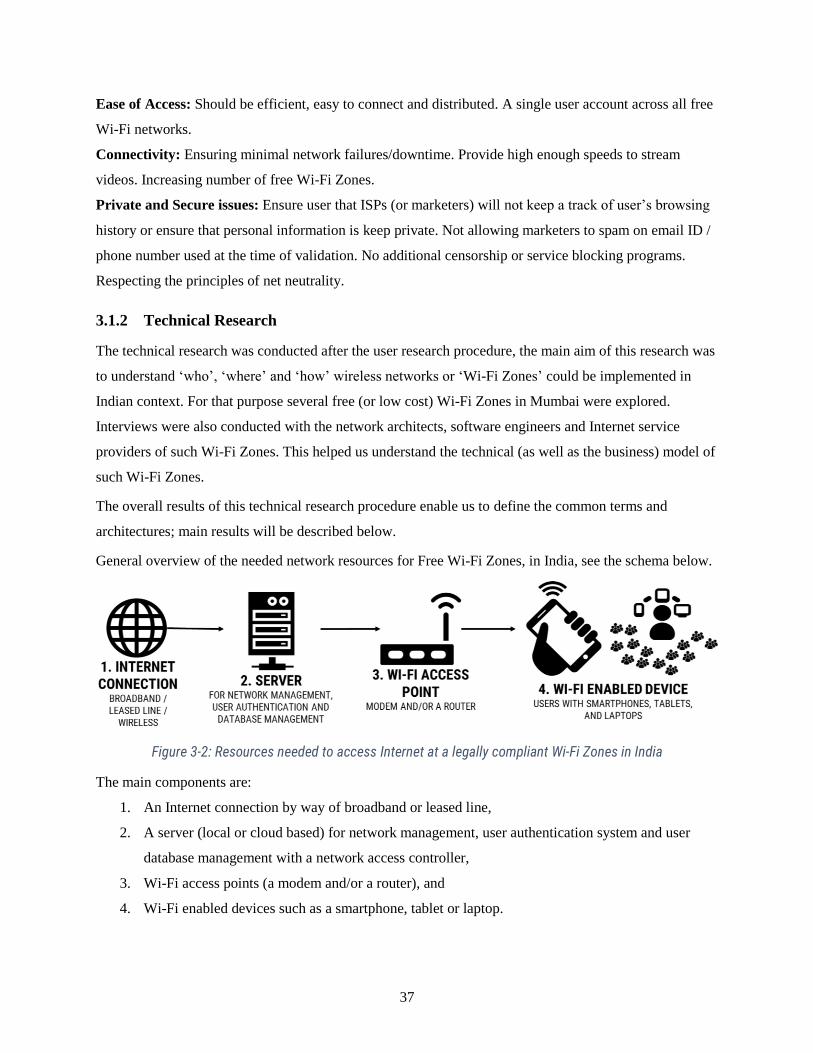
General overview of the needed network resources for Free Wi-Fi Zones, in India, see the schema below.
Figure 3-2: Resources needed to access Internet at a legally compliant Wi-Fi Zones in India
The main components are:
1. An Internet connection by way of broadband or leased line,
2. A server (local or cloud based) for network management, user authentication system and user
database management with a network access controller,
3. Wi-Fi access points (a modem and/or a router), and
4. Wi-Fi enabled devices such as a smartphone, tablet or laptop.
38
The possible technical scenarios for network architecture of Free Wi-Fi Zones that fits the purposes of
this research, that is to enable affordable Free (or low cost) Wi-Fi service in Mumbai area have 2 main
possibilities: Internet Service Providers (ISPs) and Quasi Internet Service Providers (Quasi ISPs).
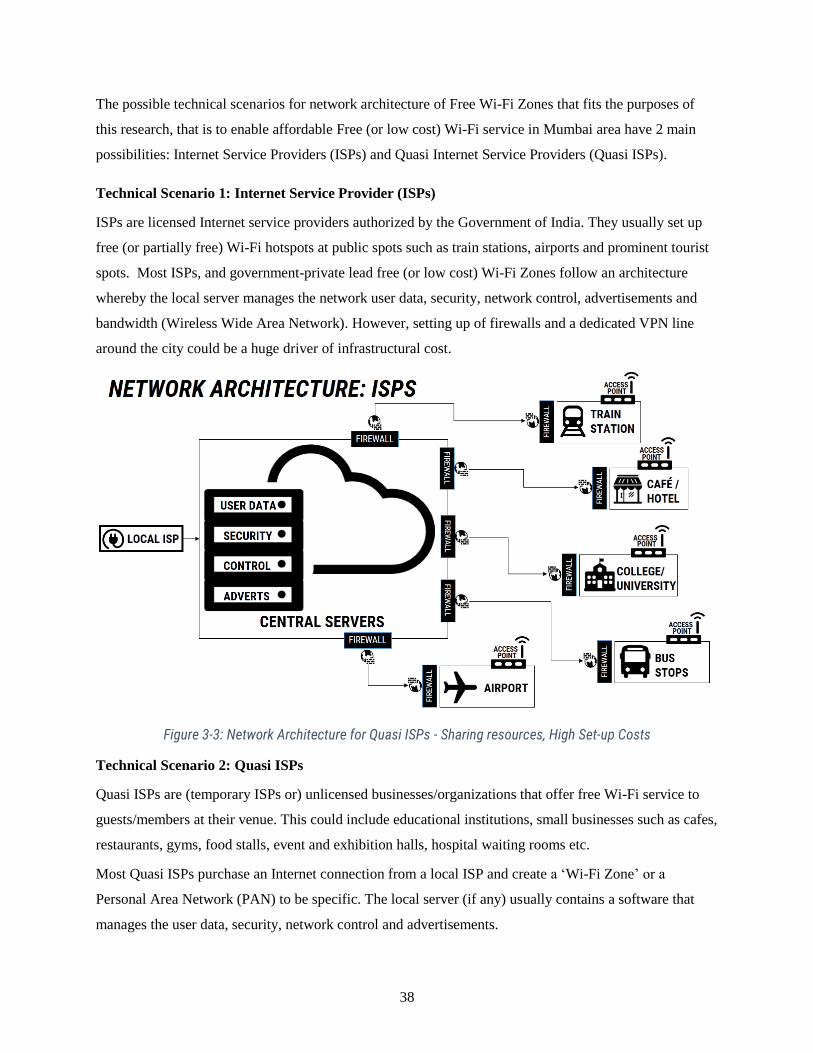
Technical Scenario 1: Internet Service Provider (ISPs)
ISPs are licensed Internet service providers authorized by the Government of India. They usually set up
free (or partially free) Wi-Fi hotspots at public spots such as train stations, airports and prominent tourist
spots. Most ISPs, and government-private lead free (or low cost) Wi-Fi Zones follow an architecture
whereby the local server manages the network user data, security, network control, advertisements and
bandwidth (Wireless Wide Area Network). However, setting up of firewalls and a dedicated VPN line
around the city could be a huge driver of infrastructural cost.
Figure 3-3: Network Architecture for Quasi ISPs - Sharing resources, High Set-up Costs
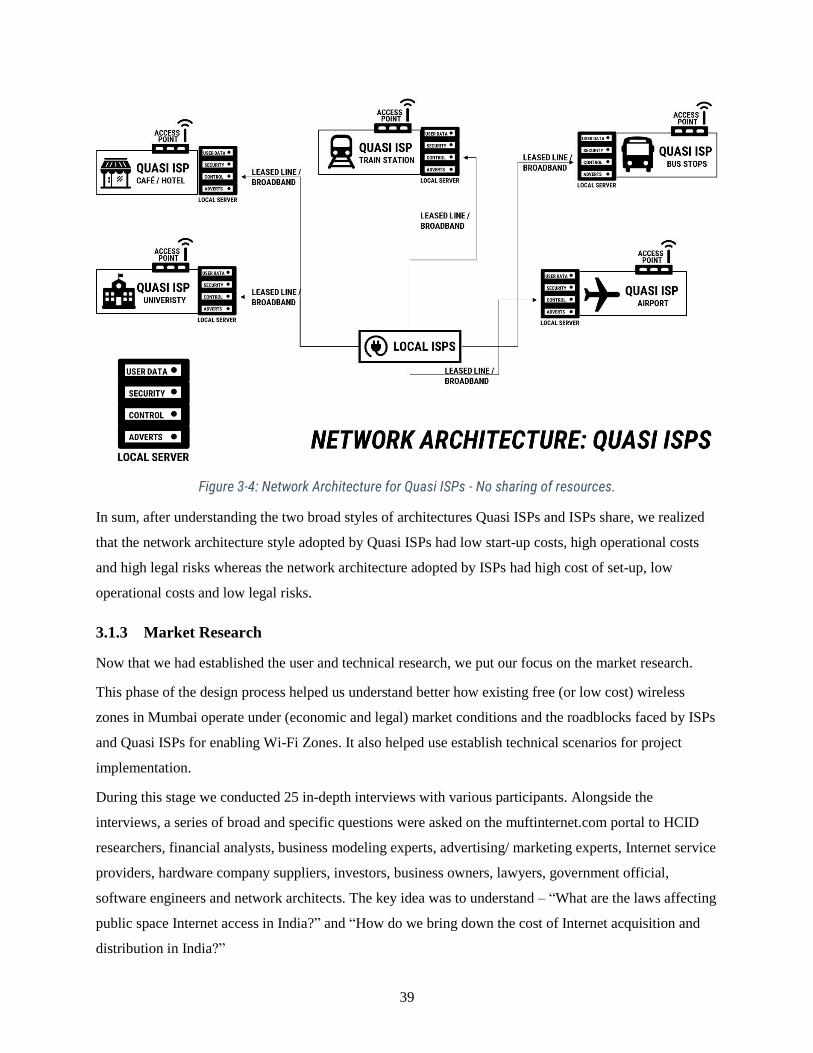
Technical Scenario 2: Quasi ISPs
Quasi ISPs are (temporary ISPs or) unlicensed businesses/organizations that offer free Wi-Fi service to
guests/members at their venue. This could include educational institutions, small businesses such as cafes,
restaurants, gyms, food stalls, event and exhibition halls, hospital waiting rooms etc.
Most Quasi ISPs purchase an Internet connection from a local ISP and create a ‘Wi-Fi Zone’ or a
Personal Area Network (PAN) to be specific. The local server (if any) usually contains a software that
manages the user data, security, network control and advertisements.
39
Figure 3-4: Network Architecture for Quasi ISPs - No sharing of resources.
In sum, after understanding the two broad styles of architectures Quasi ISPs and ISPs share, we realized
that the network architecture style adopted by Quasi ISPs had low start-up costs, high operational costs
and high legal risks whereas the network architecture adopted by ISPs had high cost of set-up, low
operational costs and low legal risks.
3.1.3 Market Research
Now that we had established the user and technical research, we put our focus on the market research.
This phase of the design process helped us understand better how existing free (or low cost) wireless
zones in Mumbai operate under (economic and legal) market conditions and the roadblocks faced by ISPs
and Quasi ISPs for enabling Wi-Fi Zones. It also helped use establish technical scenarios for project
implementation.
During this stage we conducted 25 in-depth interviews with various participants. Alongside the
interviews, a series of broad and specific questions were asked on the muftinternet.com portal to HCID
researchers, financial analysts, business modeling experts, advertising/ marketing experts, Internet service
providers, hardware company suppliers, investors, business owners, lawyers, government official,
software engineers and network architects. The key idea was to understand – “What are the laws affecting
public space Internet access in India?” and “How do we bring down the cost of Internet acquisition and
distribution in India?”
40
The following text contains a summary with the main research highlights. This includes a description of
two main roadblocks, economic and legal roadblocks affecting ISPs and Quasi ISPs. In the end we
summarize those in common Roadblocks for Enabling Free (or low cost) Wi-Fi Zones.
Economic Roadblocks
The economic roadblocks, includes a description of the possible cost components and revenue models
involved when setting up and operating free (or low cost) Wi-Fi Zones.
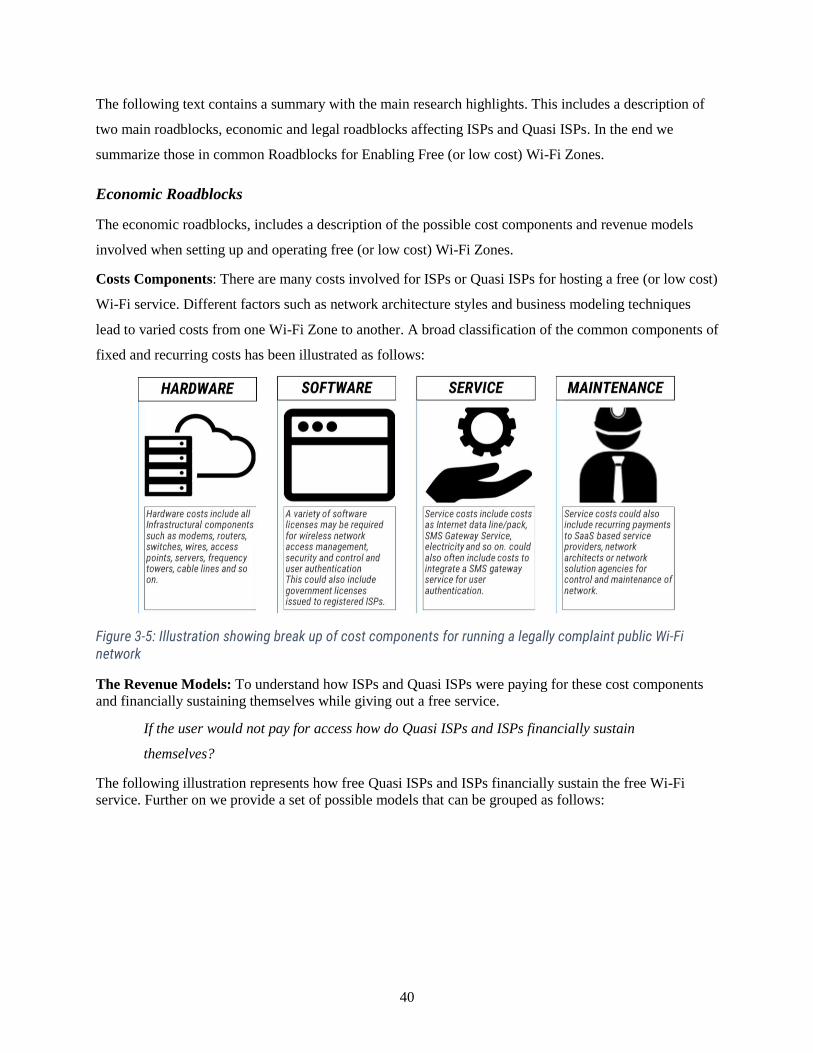
Costs Components: There are many costs involved for ISPs or Quasi ISPs for hosting a free (or low cost)
Wi-Fi service. Different factors such as network architecture styles and business modeling techniques
lead to varied costs from one Wi-Fi Zone to another. A broad classification of the common components of
fixed and recurring costs has been illustrated as follows:
Figure 3-5: Illustration showing break up of cost components for running a legally complaint public Wi-Fi network
The Revenue Models: To understand how ISPs and Quasi ISPs were paying for these cost components
and financially sustaining themselves while giving out a free service.
If the user would not pay for access how do Quasi ISPs and ISPs financially sustain
themselves?
The following illustration represents how free Quasi ISPs and ISPs financially sustain the free Wi-Fi
service. Further on we provide a set of possible models that can be grouped as follows:
41
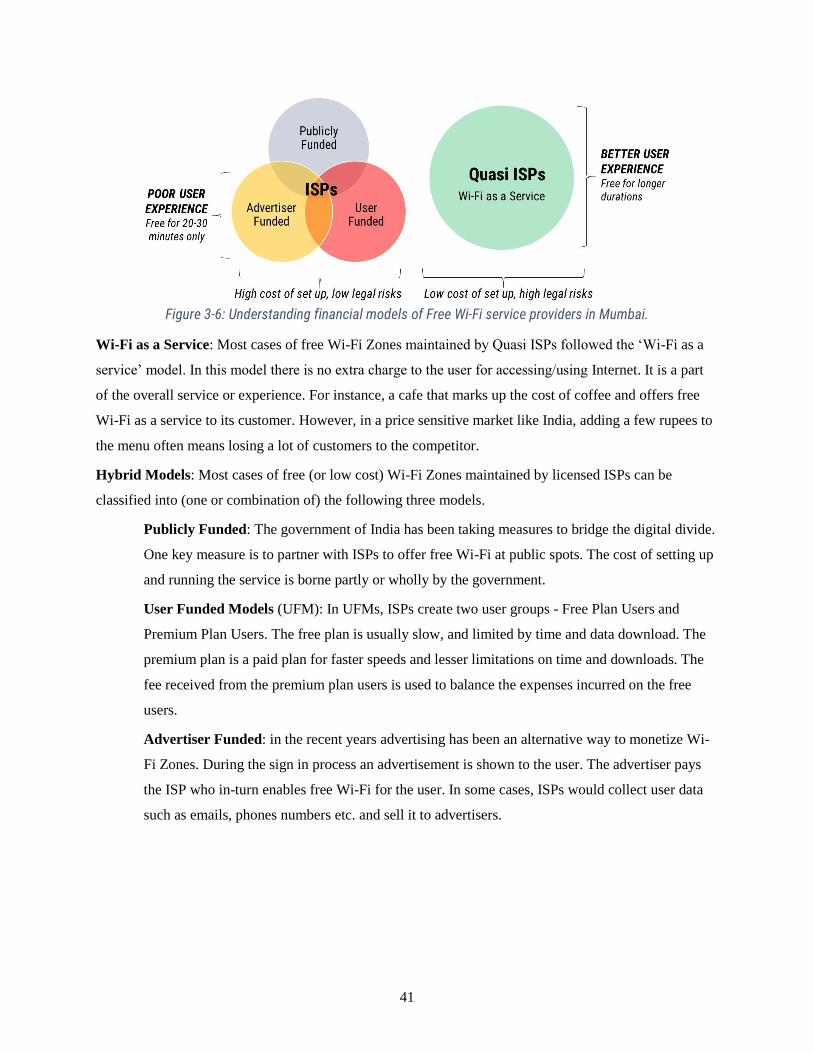
Figure 3-6: Understanding financial models of Free Wi-Fi service providers in Mumbai.
Wi-Fi as a Service: Most cases of free Wi-Fi Zones maintained by Quasi ISPs followed the ‘Wi-Fi as a
service’ model. In this model there is no extra charge to the user for accessing/using Internet. It is a part
of the overall service or experience. For instance, a cafe that marks up the cost of coffee and offers free
Wi-Fi as a service to its customer. However, in a price sensitive market like India, adding a few rupees to
the menu often means losing a lot of customers to the competitor.
Hybrid Models: Most cases of free (or low cost) Wi-Fi Zones maintained by licensed ISPs can be
classified into (one or combination of) the following three models.
Publicly Funded: The government of India has been taking measures to bridge the digital divide.
One key measure is to partner with ISPs to offer free Wi-Fi at public spots. The cost of setting up
and running the service is borne partly or wholly by the government.
User Funded Models (UFM): In UFMs, ISPs create two user groups - Free Plan Users and
Premium Plan Users. The free plan is usually slow, and limited by time and data download. The
premium plan is a paid plan for faster speeds and lesser limitations on time and downloads. The
fee received from the premium plan users is used to balance the expenses incurred on the free
users.
Advertiser Funded: in the recent years advertising has been an alternative way to monetize Wi-
Fi Zones. During the sign in process an advertisement is shown to the user. The advertiser pays
the ISP who in-turn enables free Wi-Fi for the user. In some cases, ISPs would collect user data
such as emails, phones numbers etc. and sell it to advertisers.
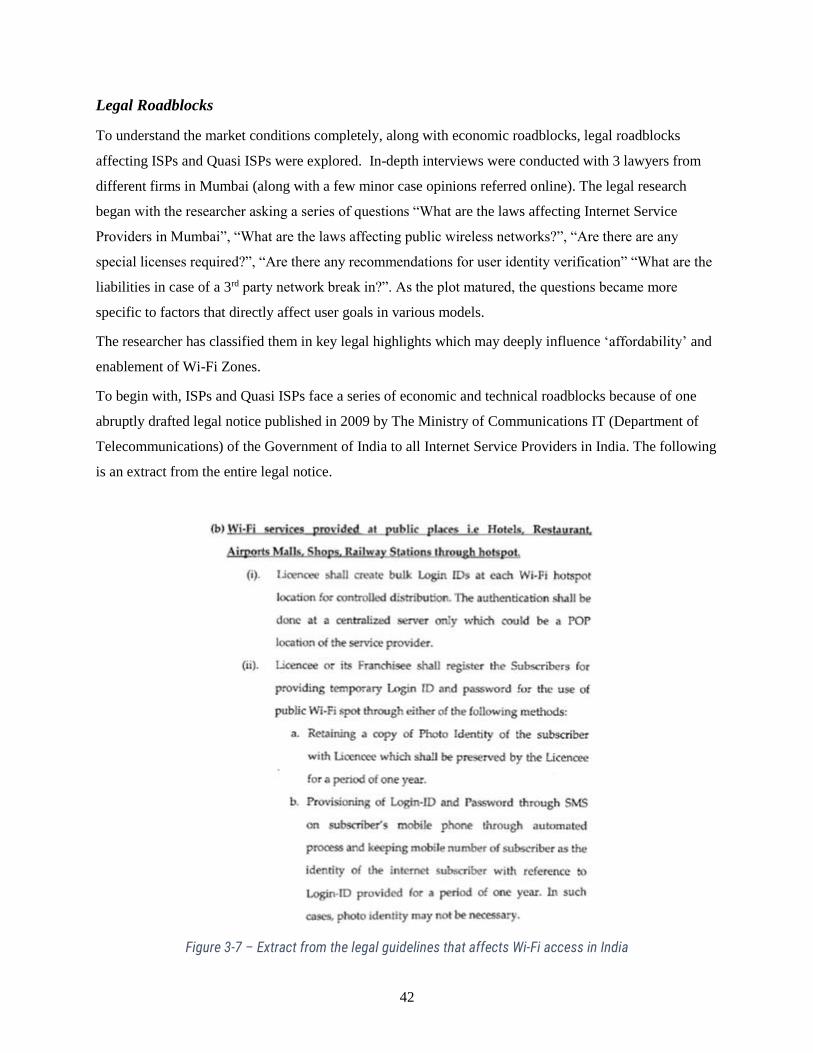
42
Legal Roadblocks
To understand the market conditions completely, along with economic roadblocks, legal roadblocks
affecting ISPs and Quasi ISPs were explored. In-depth interviews were conducted with 3 lawyers from
different firms in Mumbai (along with a few minor case opinions referred online). The legal research
began with the researcher asking a series of questions “What are the laws affecting Internet Service
Providers in Mumbai”, “What are the laws affecting public wireless networks?”, “Are there are any
special licenses required?”, “Are there any recommendations for user identity verification” “What are the
liabilities in case of a 3rd party network break in?”. As the plot matured, the questions became more
specific to factors that directly affect user goals in various models.
The researcher has classified them in key legal highlights which may deeply influence ‘affordability’ and
enablement of Wi-Fi Zones.
To begin with, ISPs and Quasi ISPs face a series of economic and technical roadblocks because of one
abruptly drafted legal notice published in 2009 by The Ministry of Communications IT (Department of
Telecommunications) of the Government of India to all Internet Service Providers in India. The following
is an extract from the entire legal notice.
Figure 3-7 – Extract from the legal guidelines that affects Wi-Fi access in India
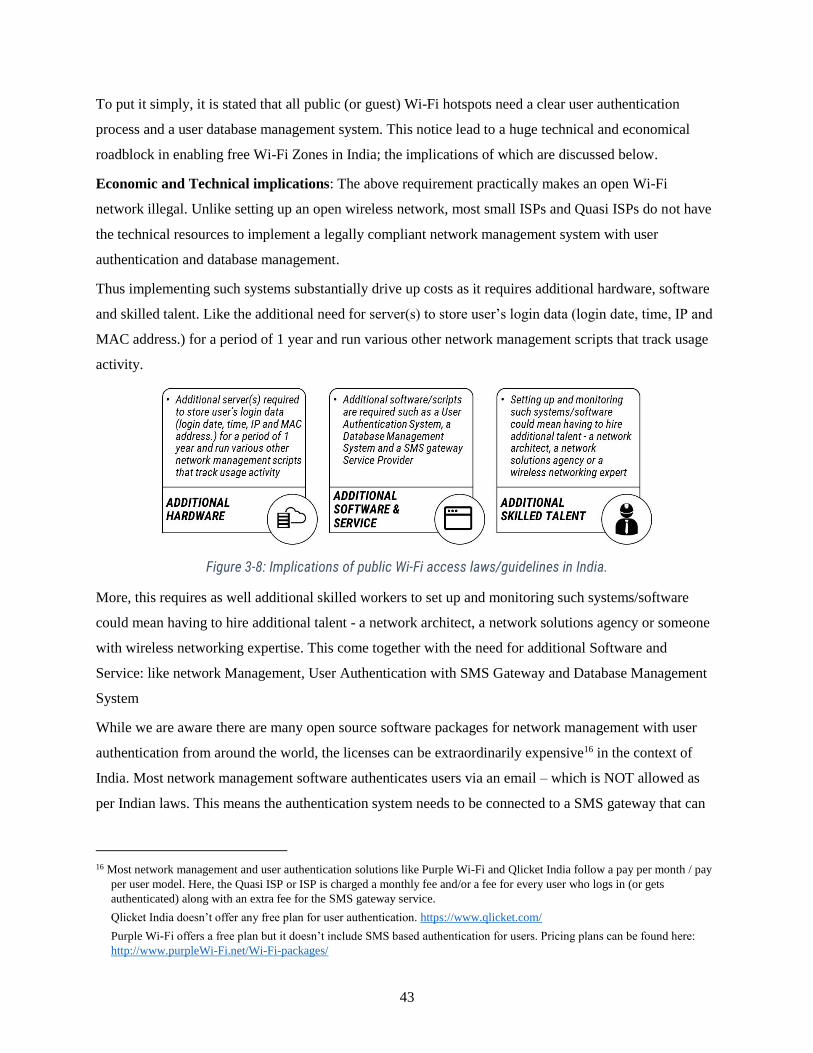
43
To put it simply, it is stated that all public (or guest) Wi-Fi hotspots need a clear user authentication
process and a user database management system. This notice lead to a huge technical and economical
roadblock in enabling free Wi-Fi Zones in India; the implications of which are discussed below.
Economic and Technical implications: The above requirement practically makes an open Wi-Fi
network illegal. Unlike setting up an open wireless network, most small ISPs and Quasi ISPs do not have
the technical resources to implement a legally compliant network management system with user
authentication and database management.
Thus implementing such systems substantially drive up costs as it requires additional hardware, software
and skilled talent. Like the additional need for server(s) to store user’s login data (login date, time, IP and
MAC address.) for a period of 1 year and run various other network management scripts that track usage
activity.
Figure 3-8: Implications of public Wi-Fi access laws/guidelines in India.
More, this requires as well additional skilled workers to set up and monitoring such systems/software
could mean having to hire additional talent - a network architect, a network solutions agency or someone
with wireless networking expertise. This come together with the need for additional Software and
Service: like network Management, User Authentication with SMS Gateway and Database Management
System
While we are aware there are many open source software packages for network management with user
authentication from around the world, the licenses can be extraordinarily expensive16 in the context of
India. Most network management software authenticates users via an email – which is NOT allowed as
per Indian laws. This means the authentication system needs to be connected to a SMS gateway that can
16 Most network management and user authentication solutions like Purple Wi-Fi and Qlicket India follow a pay per month / pay
per user model. Here, the Quasi ISP or ISP is charged a monthly fee and/or a fee for every user who logs in (or gets
authenticated) along with an extra fee for the SMS gateway service.
Qlicket India doesn’t offer any free plan for user authentication. https://www.qlicket.com/
Purple Wi-Fi offers a free plan but it doesn’t include SMS based authentication for users. Pricing plans can be found here:
http://www.purpleWi-Fi.net/Wi-Fi-packages/
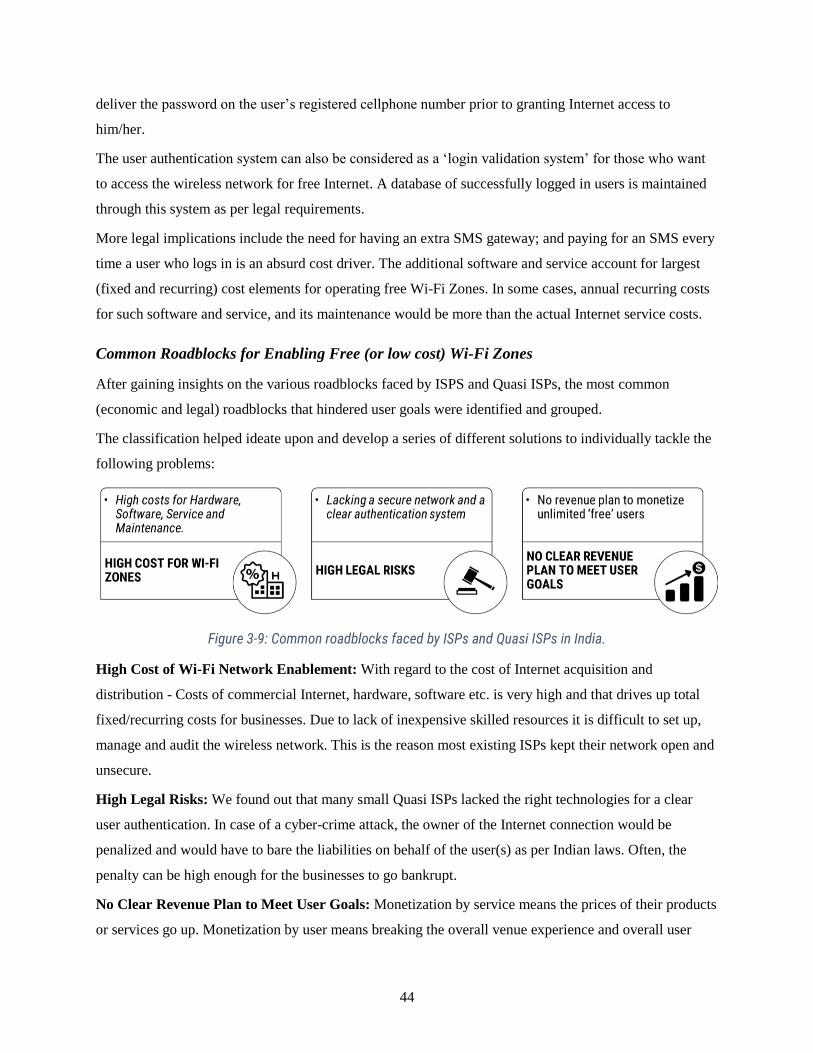
44
deliver the password on the user’s registered cellphone number prior to granting Internet access to
him/her.
The user authentication system can also be considered as a ‘login validation system’ for those who want
to access the wireless network for free Internet. A database of successfully logged in users is maintained
through this system as per legal requirements.
More legal implications include the need for having an extra SMS gateway; and paying for an SMS every
time a user who logs in is an absurd cost driver. The additional software and service account for largest
(fixed and recurring) cost elements for operating free Wi-Fi Zones. In some cases, annual recurring costs
for such software and service, and its maintenance would be more than the actual Internet service costs.
Common Roadblocks for Enabling Free (or low cost) Wi-Fi Zones
After gaining insights on the various roadblocks faced by ISPS and Quasi ISPs, the most common
(economic and legal) roadblocks that hindered user goals were identified and grouped.
The classification helped ideate upon and develop a series of different solutions to individually tackle the
following problems:
Figure 3-9: Common roadblocks faced by ISPs and Quasi ISPs in India.
High Cost of Wi-Fi Network Enablement: With regard to the cost of Internet acquisition and
distribution - Costs of commercial Internet, hardware, software etc. is very high and that drives up total
fixed/recurring costs for businesses. Due to lack of inexpensive skilled resources it is difficult to set up,
manage and audit the wireless network. This is the reason most existing ISPs kept their network open and
unsecure.
High Legal Risks: We found out that many small Quasi ISPs lacked the right technologies for a clear
user authentication. In case of a cyber-crime attack, the owner of the Internet connection would be
penalized and would have to bare the liabilities on behalf of the user(s) as per Indian laws. Often, the
penalty can be high enough for the businesses to go bankrupt.
No Clear Revenue Plan to Meet User Goals: Monetization by service means the prices of their products
or services go up. Monetization by user means breaking the overall venue experience and overall user
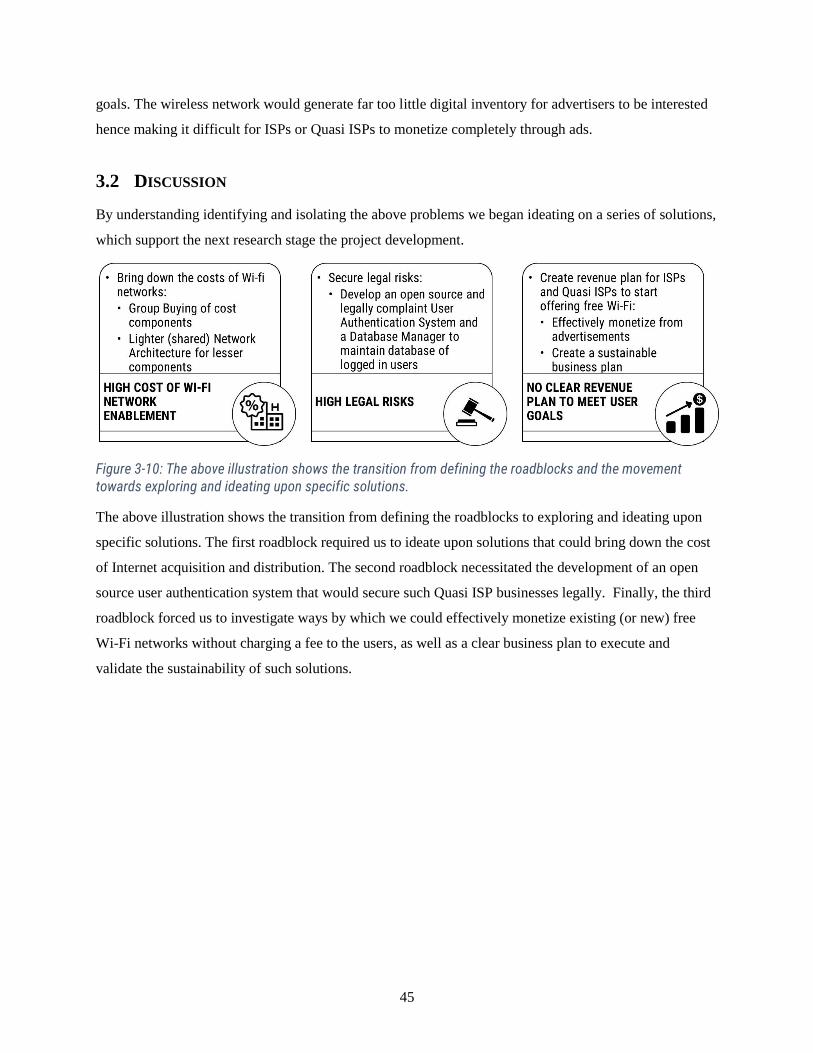
45
goals. The wireless network would generate far too little digital inventory for advertisers to be interested
hence making it difficult for ISPs or Quasi ISPs to monetize completely through ads.
3.2 DISCUSSION
By understanding identifying and isolating the above problems we began ideating on a series of solutions,
which support the next research stage the project development.
Figure 3-10: The above illustration shows the transition from defining the roadblocks and the movement towards exploring and ideating upon specific solutions.
The above illustration shows the transition from defining the roadblocks to exploring and ideating upon
specific solutions. The first roadblock required us to ideate upon solutions that could bring down the cost
of Internet acquisition and distribution. The second roadblock necessitated the development of an open
source user authentication system that would secure such Quasi ISP businesses legally. Finally, the third
roadblock forced us to investigate ways by which we could effectively monetize existing (or new) free
Wi-Fi networks without charging a fee to the users, as well as a clear business plan to execute and
validate the sustainability of such solutions.
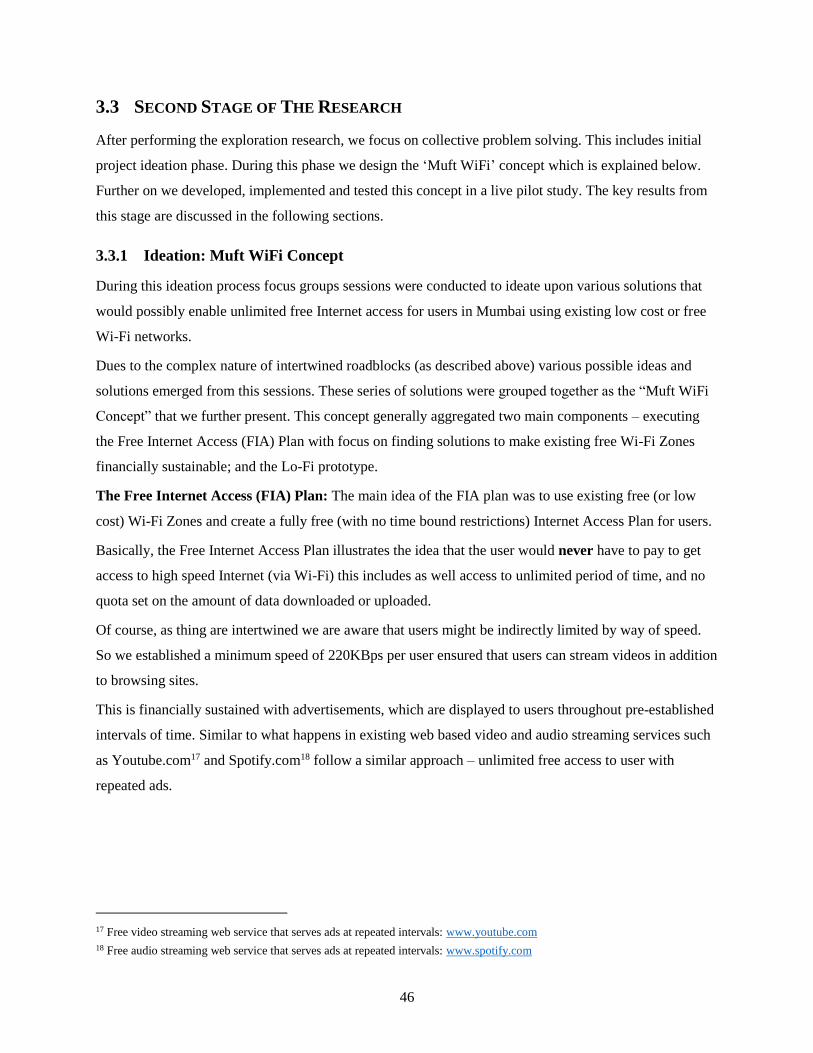
46
3.3 SECOND STAGE OF THE RESEARCH
After performing the exploration research, we focus on collective problem solving. This includes initial
project ideation phase. During this phase we design the ‘Muft WiFi’ concept which is explained below.
Further on we developed, implemented and tested this concept in a live pilot study. The key results from
this stage are discussed in the following sections.
3.3.1 Ideation: Muft WiFi Concept
During this ideation process focus groups sessions were conducted to ideate upon various solutions that
would possibly enable unlimited free Internet access for users in Mumbai using existing low cost or free
Wi-Fi networks.
Dues to the complex nature of intertwined roadblocks (as described above) various possible ideas and
solutions emerged from this sessions. These series of solutions were grouped together as the “Muft WiFi
Concept” that we further present. This concept generally aggregated two main components – executing
the Free Internet Access (FIA) Plan with focus on finding solutions to make existing free Wi-Fi Zones
financially sustainable; and the Lo-Fi prototype.
The Free Internet Access (FIA) Plan: The main idea of the FIA plan was to use existing free (or low
cost) Wi-Fi Zones and create a fully free (with no time bound restrictions) Internet Access Plan for users.
Basically, the Free Internet Access Plan illustrates the idea that the user would never have to pay to get
access to high speed Internet (via Wi-Fi) this includes as well access to unlimited period of time, and no
quota set on the amount of data downloaded or uploaded.
Of course, as thing are intertwined we are aware that users might be indirectly limited by way of speed.
So we established a minimum speed of 220KBps per user ensured that users can stream videos in addition
to browsing sites.
This is financially sustained with advertisements, which are displayed to users throughout pre-established
intervals of time. Similar to what happens in existing web based video and audio streaming services such
as Youtube.com17 and Spotify.com18 follow a similar approach – unlimited free access to user with
repeated ads.
17 Free video streaming web service that serves ads at repeated intervals: www.youtube.com
18 Free audio streaming web service that serves ads at repeated intervals: www.spotify.com
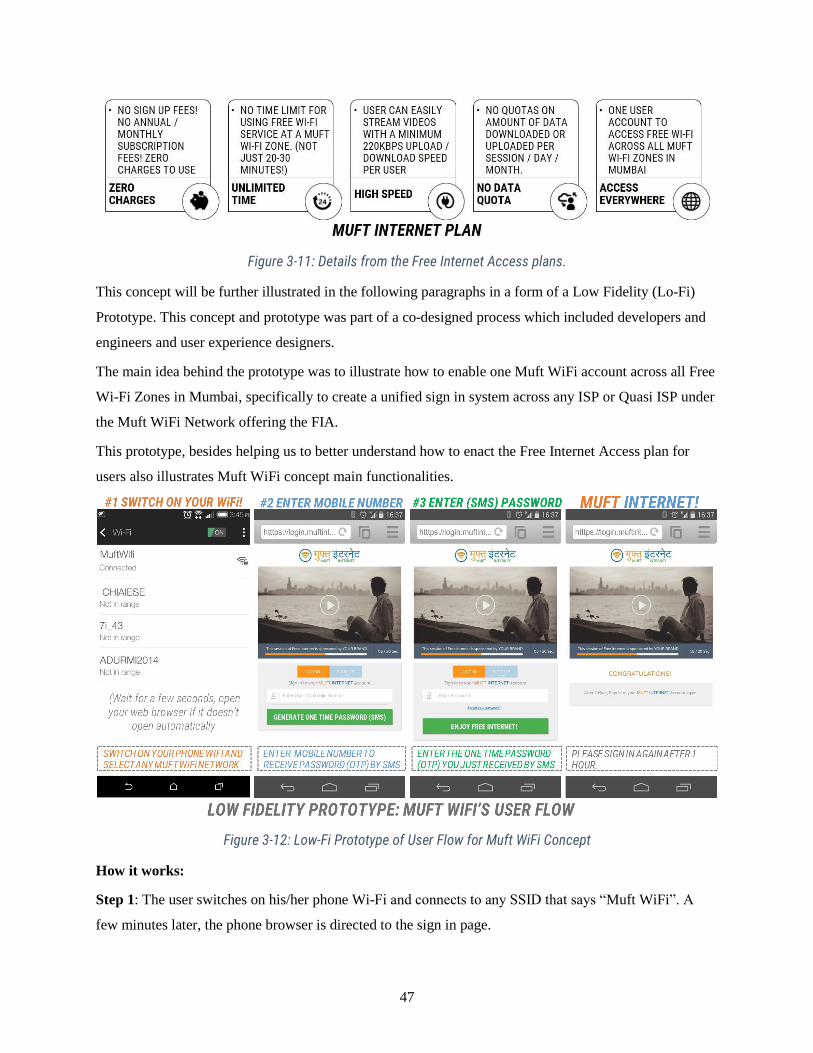
47
Figure 3-11: Details from the Free Internet Access plans.
This concept will be further illustrated in the following paragraphs in a form of a Low Fidelity (Lo-Fi)
Prototype. This concept and prototype was part of a co-designed process which included developers and
engineers and user experience designers.
The main idea behind the prototype was to illustrate how to enable one Muft WiFi account across all Free
Wi-Fi Zones in Mumbai, specifically to create a unified sign in system across any ISP or Quasi ISP under
the Muft WiFi Network offering the FIA.
This prototype, besides helping us to better understand how to enact the Free Internet Access plan for
users also illustrates Muft WiFi concept main functionalities.
Figure 3-12: Low-Fi Prototype of User Flow for Muft WiFi Concept
How it works:
Step 1: The user switches on his/her phone Wi-Fi and connects to any SSID that says “Muft WiFi”. A
few minutes later, the phone browser is directed to the sign in page.
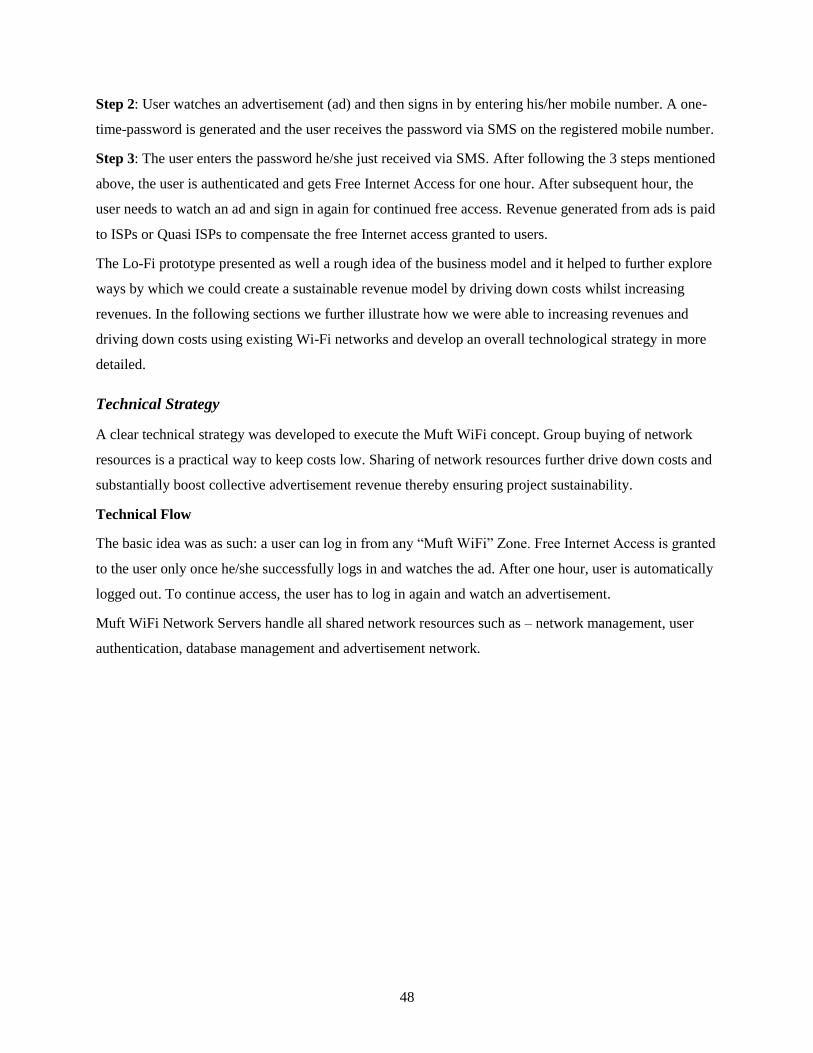
48
Step 2: User watches an advertisement (ad) and then signs in by entering his/her mobile number. A one-
time-password is generated and the user receives the password via SMS on the registered mobile number.
Step 3: The user enters the password he/she just received via SMS. After following the 3 steps mentioned
above, the user is authenticated and gets Free Internet Access for one hour. After subsequent hour, the
user needs to watch an ad and sign in again for continued free access. Revenue generated from ads is paid
to ISPs or Quasi ISPs to compensate the free Internet access granted to users.
The Lo-Fi prototype presented as well a rough idea of the business model and it helped to further explore
ways by which we could create a sustainable revenue model by driving down costs whilst increasing
revenues. In the following sections we further illustrate how we were able to increasing revenues and
driving down costs using existing Wi-Fi networks and develop an overall technological strategy in more
detailed.
Technical Strategy
A clear technical strategy was developed to execute the Muft WiFi concept. Group buying of network
resources is a practical way to keep costs low. Sharing of network resources further drive down costs and
substantially boost collective advertisement revenue thereby ensuring project sustainability.
Technical Flow
The basic idea was as such: a user can log in from any “Muft WiFi” Zone. Free Internet Access is granted
to the user only once he/she successfully logs in and watches the ad. After one hour, user is automatically
logged out. To continue access, the user has to log in again and watch an advertisement.
Muft WiFi Network Servers handle all shared network resources such as – network management, user
authentication, database management and advertisement network.
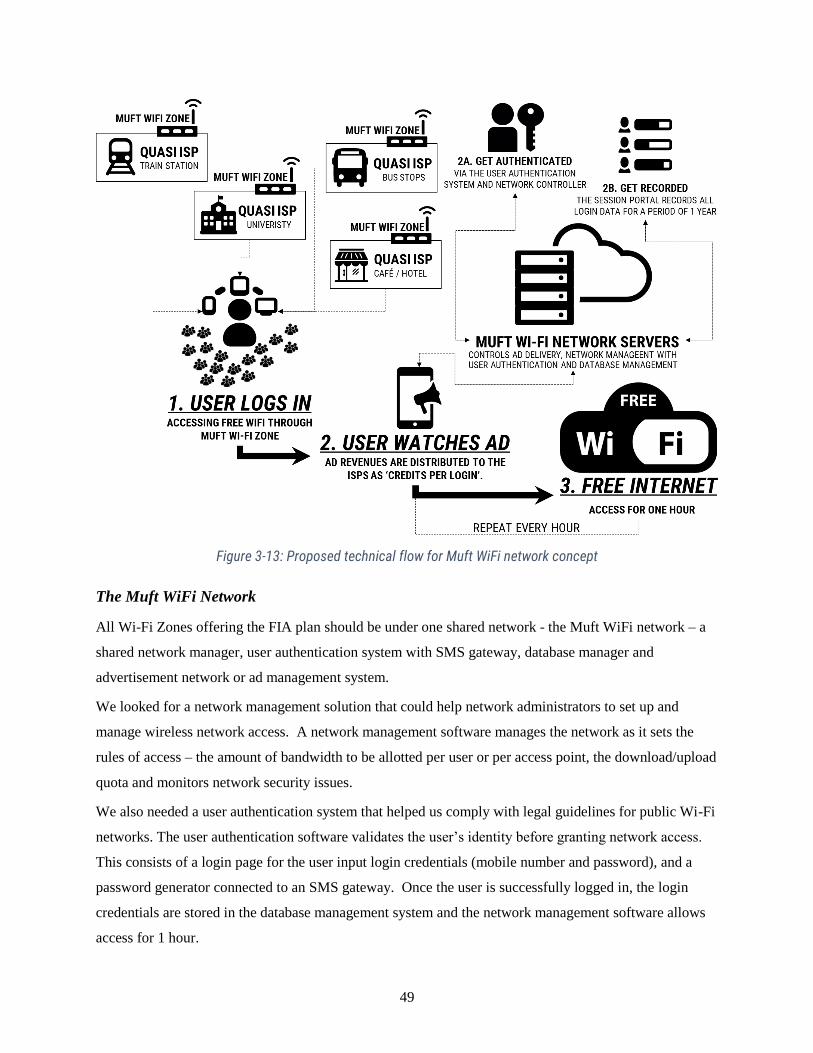
49
Figure 3-13: Proposed technical flow for Muft WiFi network concept
The Muft WiFi Network
All Wi-Fi Zones offering the FIA plan should be under one shared network - the Muft WiFi network – a
shared network manager, user authentication system with SMS gateway, database manager and
advertisement network or ad management system.
We looked for a network management solution that could help network administrators to set up and
manage wireless network access. A network management software manages the network as it sets the
rules of access – the amount of bandwidth to be allotted per user or per access point, the download/upload
quota and monitors network security issues.
We also needed a user authentication system that helped us comply with legal guidelines for public Wi-Fi
networks. The user authentication software validates the user’s identity before granting network access.
This consists of a login page for the user input login credentials (mobile number and password), and a
password generator connected to an SMS gateway. Once the user is successfully logged in, the login
credentials are stored in the database management system and the network management software allows
access for 1 hour.
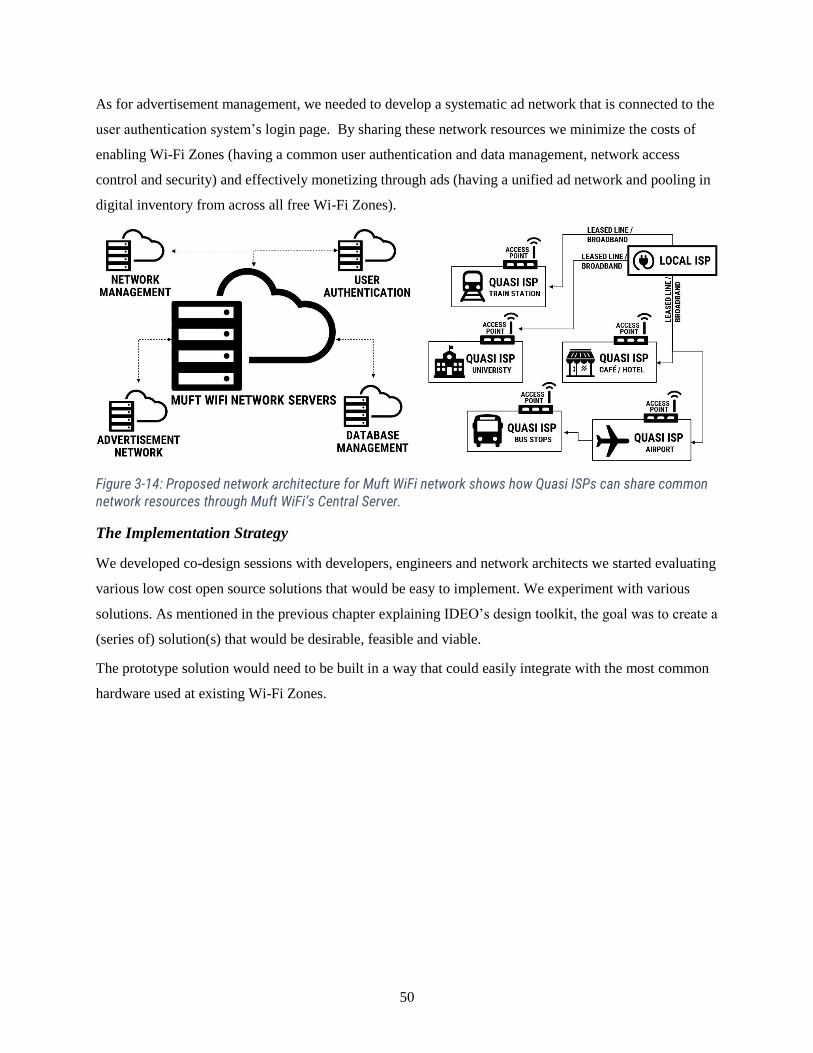
50
As for advertisement management, we needed to develop a systematic ad network that is connected to the
user authentication system’s login page. By sharing these network resources we minimize the costs of
enabling Wi-Fi Zones (having a common user authentication and data management, network access
control and security) and effectively monetizing through ads (having a unified ad network and pooling in
digital inventory from across all free Wi-Fi Zones).
Figure 3-14: Proposed network architecture for Muft WiFi network shows how Quasi ISPs can share common network resources through Muft WiFi’s Central Server.
The Implementation Strategy
We developed co-design sessions with developers, engineers and network architects we started evaluating
various low cost open source solutions that would be easy to implement. We experiment with various
solutions. As mentioned in the previous chapter explaining IDEO’s design toolkit, the goal was to create a
(series of) solution(s) that would be desirable, feasible and viable.
The prototype solution would need to be built in a way that could easily integrate with the most common
hardware used at existing Wi-Fi Zones.
51
Figure 3-15: Proposed solutions for Muft WiFi network servers.
We found out that some ISPs in Mumbai used a ‘free to use’ software for wireless network management
called Unifi® Controller developed by hardware manufacturing company Ubiquity Networks®.
However, Unifi® controller lacks an SMS based user authentication system as required by the laws in
India.
In the later stages of the study we developed an open source User Authentication and Database
Management System that could be integrated with Unifi® Controller. This would legally secure ISPs and
Quasi ISPs and dramatically reduce costs for them.
The User Authentication System (UAS) would also be connected to the ad network ad-network (open
source Revive Ad Server) and the Database Manager for database management through the Muft WiFi
network.
The Database Manager System (DBS) that we built extracts user logs to portable databases. The system
stores user logs for a period of 1 year as required by law. After 1 year, user data gets automatically
destroyed.
The development of both, the User Authentication System and Database Manager, would not be possible
without the collective contribution of the key developers, engineers and interaction designers.
3.3.2 Development: Muft WiFi Solution
In this phase of the design process a business model was created with the help of business modeling
experts and ISPs with a goal to start 250 Free (Muft) Wi-Fi Zones in Mumbai. To test this business
model, a high fidelity prototype was developed by the co-designers that could be used for the pilot testing.
The following section contains notes on how a business model, a high-fidelity and a pilot study was
created to ensure project sustainability, viability and feasibility.
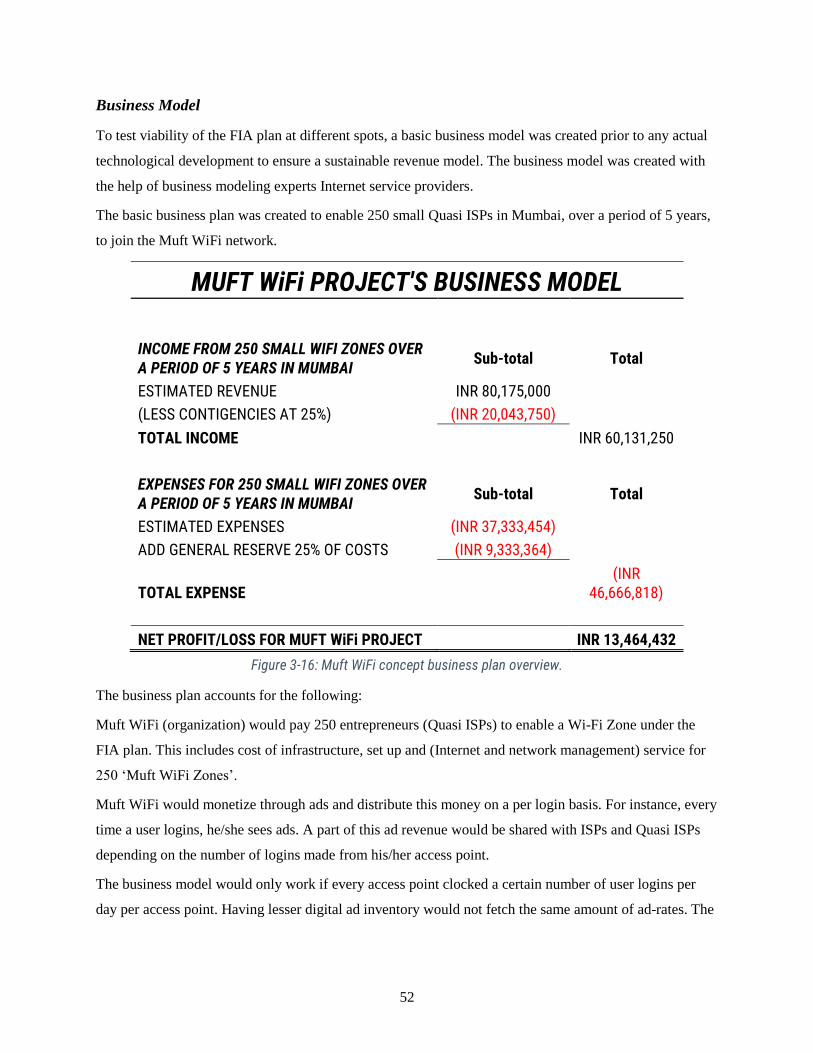
52
Business Model
To test viability of the FIA plan at different spots, a basic business model was created prior to any actual
technological development to ensure a sustainable revenue model. The business model was created with
the help of business modeling experts Internet service providers.
The basic business plan was created to enable 250 small Quasi ISPs in Mumbai, over a period of 5 years,
to join the Muft WiFi network.
MUFT WiFi PROJECT'S BUSINESS MODEL
INCOME FROM 250 SMALL WIFI ZONES OVER A PERIOD OF 5 YEARS IN MUMBAI
Sub-total Total
ESTIMATED REVENUE INR 80,175,000
(LESS CONTIGENCIES AT 25%) (INR 20,043,750)
TOTAL INCOME INR 60,131,250
EXPENSES FOR 250 SMALL WIFI ZONES OVER A PERIOD OF 5 YEARS IN MUMBAI
Sub-total Total
ESTIMATED EXPENSES (INR 37,333,454)
ADD GENERAL RESERVE 25% OF COSTS (INR 9,333,364)
TOTAL EXPENSE (INR
46,666,818)
NET PROFIT/LOSS FOR MUFT WiFi PROJECT INR 13,464,432
Figure 3-16: Muft WiFi concept business plan overview.
The business plan accounts for the following:
Muft WiFi (organization) would pay 250 entrepreneurs (Quasi ISPs) to enable a Wi-Fi Zone under the
FIA plan. This includes cost of infrastructure, set up and (Internet and network management) service for
250 ‘Muft WiFi Zones’.
Muft WiFi would monetize through ads and distribute this money on a per login basis. For instance, every
time a user logins, he/she sees ads. A part of this ad revenue would be shared with ISPs and Quasi ISPs
depending on the number of logins made from his/her access point.
The business model would only work if every access point clocked a certain number of user logins per
day per access point. Having lesser digital ad inventory would not fetch the same amount of ad-rates. The
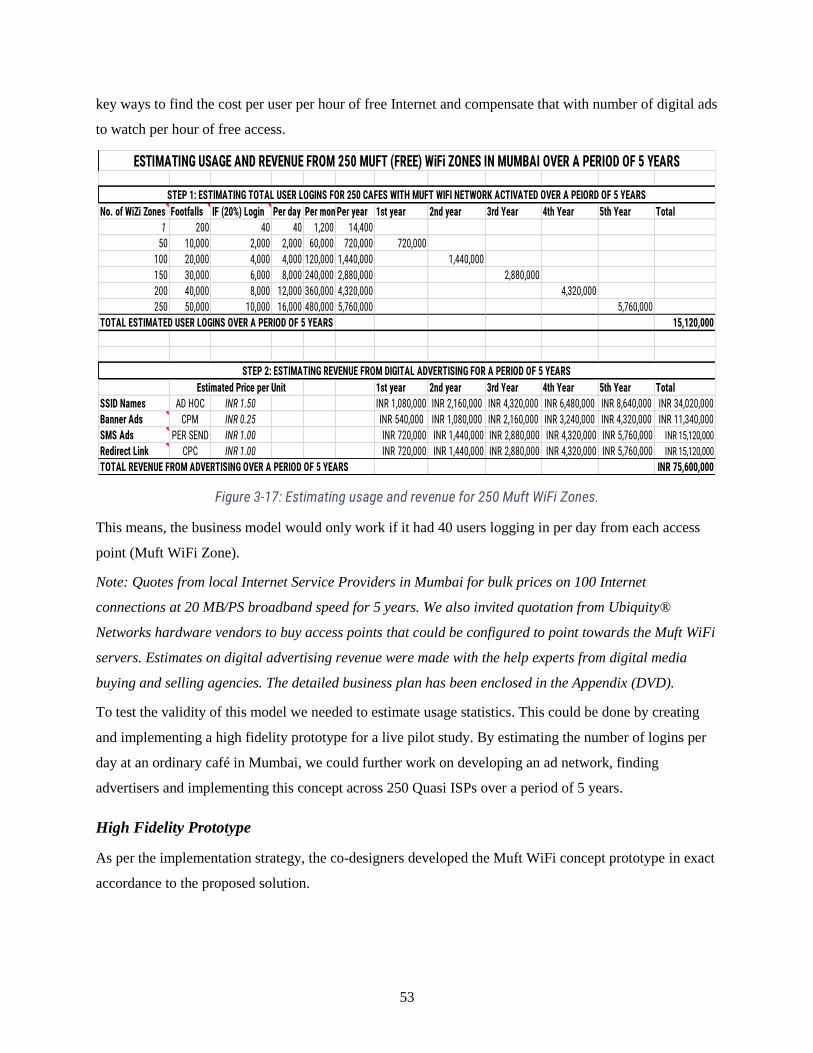
53
key ways to find the cost per user per hour of free Internet and compensate that with number of digital ads
to watch per hour of free access.
No. of WiZi Zones Footfalls IF (20%) Login Per day Per monthPer year 1st year 2nd year 3rd Year 4th Year 5th Year Total
1 200 40 40 1,200 14,400
50 10,000 2,000 2,000 60,000 720,000 720,000
100 20,000 4,000 4,000 120,000 1,440,000 1,440,000
150 30,000 6,000 8,000 240,000 2,880,000 2,880,000
200 40,000 8,000 12,000 360,000 4,320,000 4,320,000
250 50,000 10,000 16,000 480,000 5,760,000 5,760,000
TOTAL ESTIMATED USER LOGINS OVER A PERIOD OF 5 YEARS 15,120,000
Estimated Price per Unit 1st year 2nd year 3rd Year 4th Year 5th Year Total
SSID Names AD HOC INR 1.50 INR 1,080,000 INR 2,160,000 INR 4,320,000 INR 6,480,000 INR 8,640,000 INR 34,020,000
Banner Ads CPM INR 0.25 INR 540,000 INR 1,080,000 INR 2,160,000 INR 3,240,000 INR 4,320,000 INR 11,340,000
SMS Ads PER SEND INR 1.00 INR 720,000 INR 1,440,000 INR 2,880,000 INR 4,320,000 INR 5,760,000 INR 15,120,000
Redirect Link CPC INR 1.00 INR 720,000 INR 1,440,000 INR 2,880,000 INR 4,320,000 INR 5,760,000 INR 15,120,000
TOTAL REVENUE FROM ADVERTISING OVER A PERIOD OF 5 YEARS INR 75,600,000
STEP 2: ESTIMATING REVENUE FROM DIGITAL ADVERTISING FOR A PERIOD OF 5 YEARS
STEP 1: ESTIMATING TOTAL USER LOGINS FOR 250 CAFES WITH MUFT WIFI NETWORK ACTIVATED OVER A PEIORD OF 5 YEARS
ESTIMATING USAGE AND REVENUE FROM 250 MUFT (FREE) WiFi ZONES IN MUMBAI OVER A PERIOD OF 5 YEARS
Figure 3-17: Estimating usage and revenue for 250 Muft WiFi Zones.
This means, the business model would only work if it had 40 users logging in per day from each access
point (Muft WiFi Zone).
Note: Quotes from local Internet Service Providers in Mumbai for bulk prices on 100 Internet
connections at 20 MB/PS broadband speed for 5 years. We also invited quotation from Ubiquity®
Networks hardware vendors to buy access points that could be configured to point towards the Muft WiFi
servers. Estimates on digital advertising revenue were made with the help experts from digital media
buying and selling agencies. The detailed business plan has been enclosed in the Appendix (DVD).
To test the validity of this model we needed to estimate usage statistics. This could be done by creating
and implementing a high fidelity prototype for a live pilot study. By estimating the number of logins per
day at an ordinary café in Mumbai, we could further work on developing an ad network, finding
advertisers and implementing this concept across 250 Quasi ISPs over a period of 5 years.
High Fidelity Prototype
As per the implementation strategy, the co-designers developed the Muft WiFi concept prototype in exact
accordance to the proposed solution.
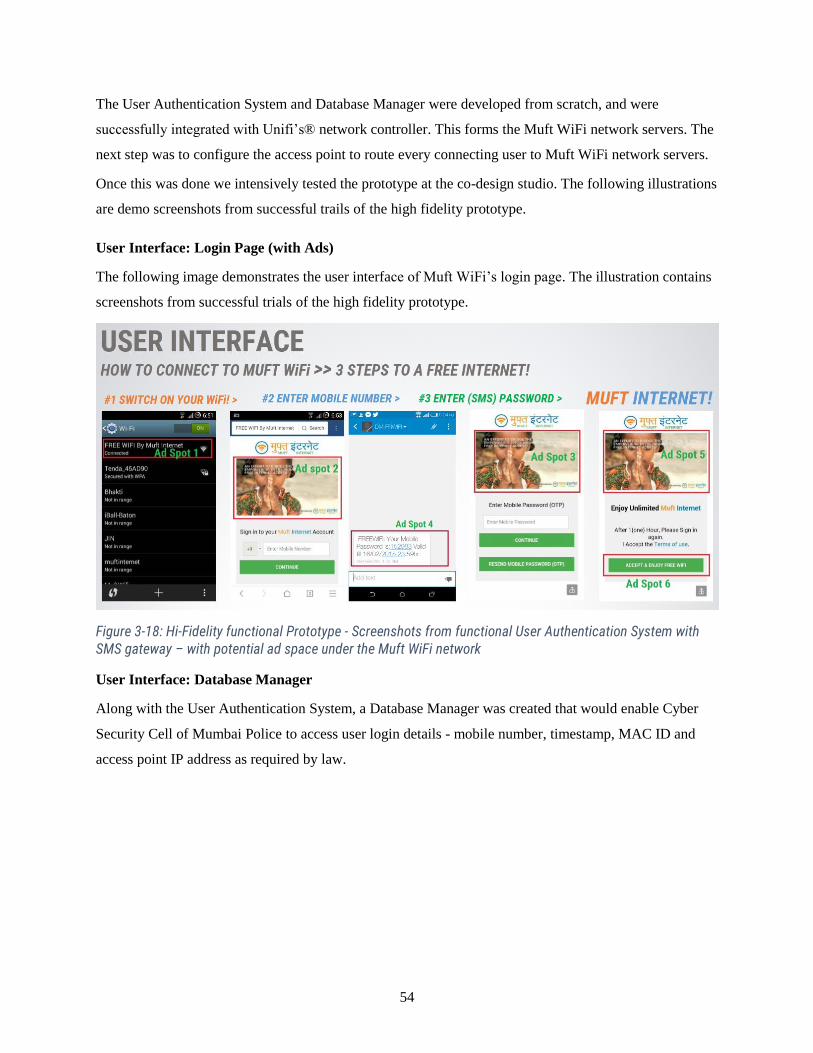
54
The User Authentication System and Database Manager were developed from scratch, and were
successfully integrated with Unifi’s® network controller. This forms the Muft WiFi network servers. The
next step was to configure the access point to route every connecting user to Muft WiFi network servers.
Once this was done we intensively tested the prototype at the co-design studio. The following illustrations
are demo screenshots from successful trails of the high fidelity prototype.
User Interface: Login Page (with Ads)
The following image demonstrates the user interface of Muft WiFi’s login page. The illustration contains
screenshots from successful trials of the high fidelity prototype.
Figure 3-18: Hi-Fidelity functional Prototype - Screenshots from functional User Authentication System with SMS gateway – with potential ad space under the Muft WiFi network
User Interface: Database Manager
Along with the User Authentication System, a Database Manager was created that would enable Cyber
Security Cell of Mumbai Police to access user login details - mobile number, timestamp, MAC ID and
access point IP address as required by law.
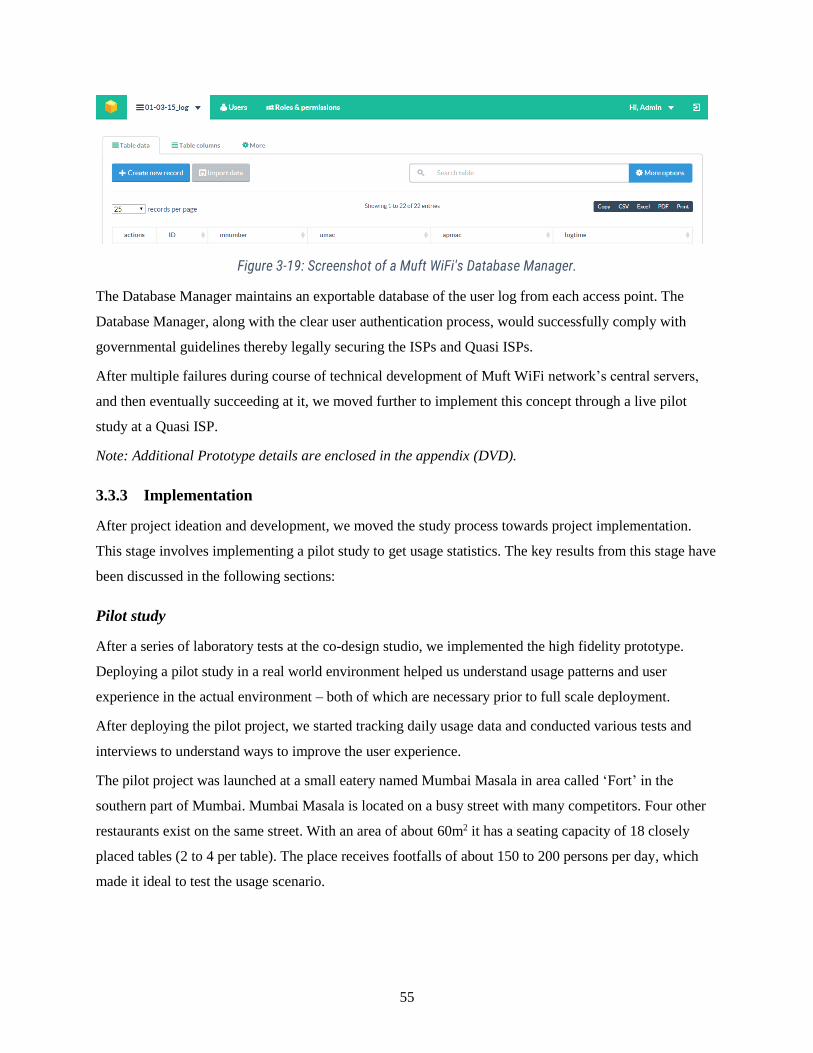
55
Figure 3-19: Screenshot of a Muft WiFi's Database Manager.
The Database Manager maintains an exportable database of the user log from each access point. The
Database Manager, along with the clear user authentication process, would successfully comply with
governmental guidelines thereby legally securing the ISPs and Quasi ISPs.
After multiple failures during course of technical development of Muft WiFi network’s central servers,
and then eventually succeeding at it, we moved further to implement this concept through a live pilot
study at a Quasi ISP.
Note: Additional Prototype details are enclosed in the appendix (DVD).
3.3.3 Implementation
After project ideation and development, we moved the study process towards project implementation.
This stage involves implementing a pilot study to get usage statistics. The key results from this stage have
been discussed in the following sections:
Pilot study
After a series of laboratory tests at the co-design studio, we implemented the high fidelity prototype.
Deploying a pilot study in a real world environment helped us understand usage patterns and user
experience in the actual environment – both of which are necessary prior to full scale deployment.
After deploying the pilot project, we started tracking daily usage data and conducted various tests and
interviews to understand ways to improve the user experience.
The pilot project was launched at a small eatery named Mumbai Masala in area called ‘Fort’ in the
southern part of Mumbai. Mumbai Masala is located on a busy street with many competitors. Four other
restaurants exist on the same street. With an area of about 60m2 it has a seating capacity of 18 closely
placed tables (2 to 4 per table). The place receives footfalls of about 150 to 200 persons per day, which
made it ideal to test the usage scenario.
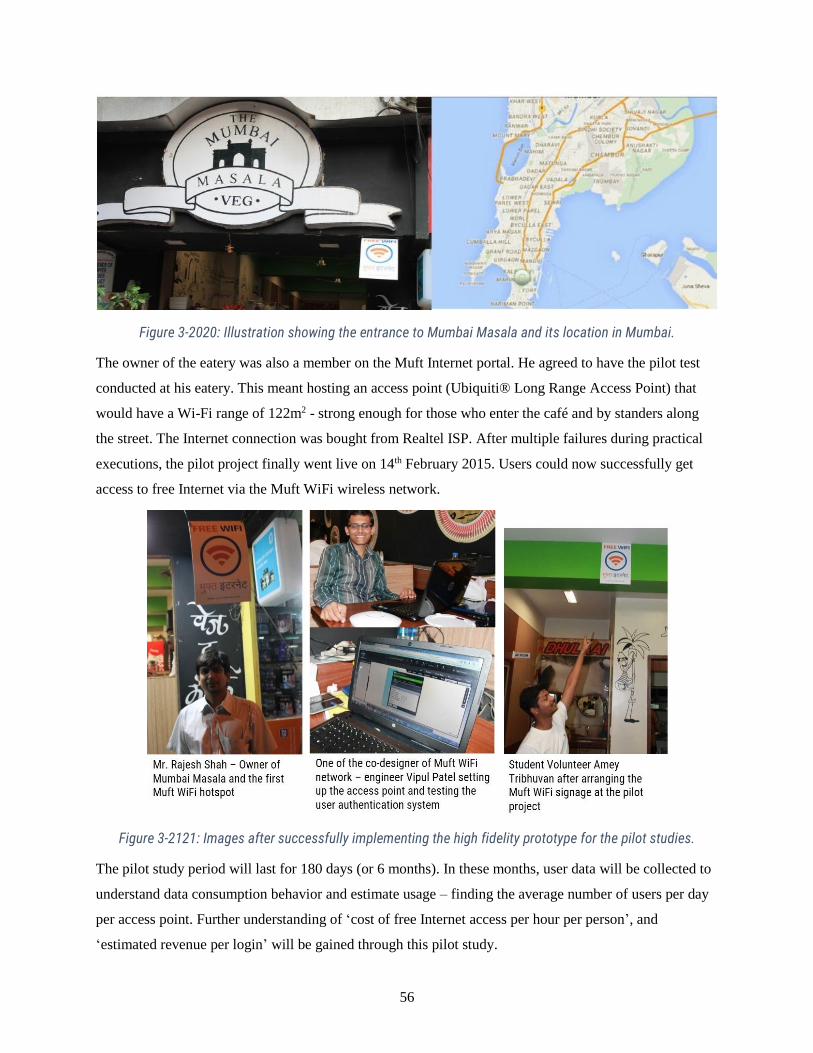
56
Figure 3-2020: Illustration showing the entrance to Mumbai Masala and its location in Mumbai.
The owner of the eatery was also a member on the Muft Internet portal. He agreed to have the pilot test
conducted at his eatery. This meant hosting an access point (Ubiquiti® Long Range Access Point) that
would have a Wi-Fi range of 122m2 - strong enough for those who enter the café and by standers along
the street. The Internet connection was bought from Realtel ISP. After multiple failures during practical
executions, the pilot project finally went live on 14th February 2015. Users could now successfully get
access to free Internet via the Muft WiFi wireless network.
Figure 3-2121: Images after successfully implementing the high fidelity prototype for the pilot studies.
The pilot study period will last for 180 days (or 6 months). In these months, user data will be collected to
understand data consumption behavior and estimate usage – finding the average number of users per day
per access point. Further understanding of ‘cost of free Internet access per hour per person’, and
‘estimated revenue per login’ will be gained through this pilot study.

57
3.4 DISCUSSION
A series of usability tests and user satisfaction surveys were conducted during the course of the pilot
project that gave us some crucial insights on ways we could improve the overall user experience.
In user satisfaction surveys, we found out that most users found it easy to access the network and sign in.
The overall rate of broken experience (i.e. people connecting through the Muft WiFi SSID but not
successfully logging in to access the free Internet service) was 1 per 80.
Upon investigation it was discovered that most of the broken experiences were because of delay in SMS
password delivery caused by the SMS gateway service provider. The delay in SMS delivery confused
many users resulting in a broken experience rate.
Since the overall solutions, depends on an SMS gateway, there were certain days with heavy network
congestion, when the SMS passwords were not delivered or delivered after a few hours. Without an SMS
based password on a registered mobile number, the user would not be able to gain access to the network
and use the free Internet service. Being dependent on an SMS gateway means waiting for an SMS
password every time a user wants to sign in – this can lead to disruption of the service flow and resulting
in a broken user experience for some. Alternate ways of faster user authentication that do not depend on
SMS delivery need to be explored.
Another factor that affects ‘ease of access’ and the overall user experience (or quality of service) are
repeated advertisements. This was (obviously) confirmed by some of the users at the pilot project as they
found the advertisements annoying.
There is no comparative data available to find out the rate of broken experiences at other Wi-Fi Zones.
Testing the Business Model
Not all parts of the business model were tested during the course of the pilot. Amongst several different
market factors, the validity of the business model depended mostly on the usage scenario. As mentioned
before, the most important outcome of the pilot study was to get estimates on the number of logins per
day; to test the validity of the business model.
After the launch, for a period of 30 days, user login data was collected. The pilot project accounted for
1205 logins; slightly more than 40 logins a day. Although the result was positive, the close margin makes
it necessary to spend further time analyzing the usage scenario at different public spots in Mumbai.
This confirms the basic hypothesis of user estimates made in the business model and hence confirms the
validity of the project as – feasible, viable and desirable (as per IDEO’s toolkit).
The pilot study needs to be repeated at other locations in Mumbai to get sufficient usage data and
statistics - only then does it make sense to implement this concept across 250 Wi-Fi Zones in Mumbai.

58
3.5 CLOSING REMARKS
In this chapter we address the main results achieved in the course of our in-the-wild study. We discussed
results from different stages of the Double Diamond design process; from discovery of roadblocks with
an exploratory research to project development and implementation with a pilot study.
The pilot study provided data for multiple user studies aiming to understand how users experience on-the-
go Internet via (secured) Wi-Fi networks. The user feedback enabled us to work on a variety of issues
such as improvement of the user interface and the overall user experience.
The business model needs to be further tested and validated at different locations. As trends have been
over the past decades, it is expected that Internet costs in Mumbai will decrease, as will the price of
hardware. It is difficult to make estimation on digital ad rates as there isn’t sufficient data to predict an
upward or downward market trend in the coming years.
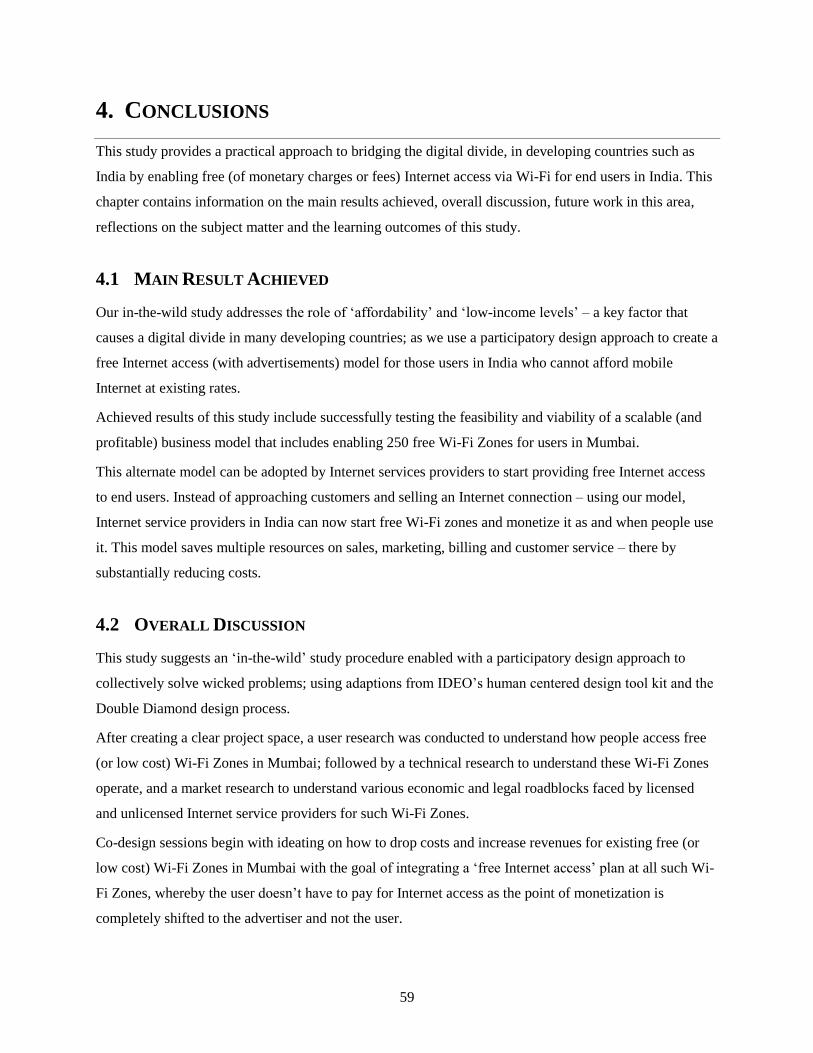
59
4. CONCLUSIONS
This study provides a practical approach to bridging the digital divide, in developing countries such as
India by enabling free (of monetary charges or fees) Internet access via Wi-Fi for end users in India. This
chapter contains information on the main results achieved, overall discussion, future work in this area,
reflections on the subject matter and the learning outcomes of this study.
4.1 MAIN RESULT ACHIEVED
Our in-the-wild study addresses the role of ‘affordability’ and ‘low-income levels’ – a key factor that
causes a digital divide in many developing countries; as we use a participatory design approach to create a
free Internet access (with advertisements) model for those users in India who cannot afford mobile
Internet at existing rates.
Achieved results of this study include successfully testing the feasibility and viability of a scalable (and
profitable) business model that includes enabling 250 free Wi-Fi Zones for users in Mumbai.
This alternate model can be adopted by Internet services providers to start providing free Internet access
to end users. Instead of approaching customers and selling an Internet connection – using our model,
Internet service providers in India can now start free Wi-Fi zones and monetize it as and when people use
it. This model saves multiple resources on sales, marketing, billing and customer service – there by
substantially reducing costs.
4.2 OVERALL DISCUSSION
This study suggests an ‘in-the-wild’ study procedure enabled with a participatory design approach to
collectively solve wicked problems; using adaptions from IDEO’s human centered design tool kit and the
Double Diamond design process.
After creating a clear project space, a user research was conducted to understand how people access free
(or low cost) Wi-Fi Zones in Mumbai; followed by a technical research to understand these Wi-Fi Zones
operate, and a market research to understand various economic and legal roadblocks faced by licensed
and unlicensed Internet service providers for such Wi-Fi Zones.
Co-design sessions begin with ideating on how to drop costs and increase revenues for existing free (or
low cost) Wi-Fi Zones in Mumbai with the goal of integrating a ‘free Internet access’ plan at all such Wi-
Fi Zones, whereby the user doesn’t have to pay for Internet access as the point of monetization is
completely shifted to the advertiser and not the user.
60
The technical strategy involves sharing of network resources across such Wi-Fi Zones. This includes the
development of Muft WiFi network - a shared (remote) wireless network for network management, user
authentication, database management and advertisement management; with a single sign-in system across
all such Wi-Fi Zones in Mumbai. Project development includes a series of technical solutions to create a
high fidelity prototype and a scalable business model with a sustainable revenue plan for 250 fully free
(Muft Wi-Fi) zones in Mumbai.
This is followed by pilot study to understand usage and overall user experience at a Muft Wi-Fi Zones
and determine if the business model viable and feasible. The results of this pilot study indicate further
improvements in the user experience by reducing time-lags while the user is connecting to such Wi-Fi
networks. Although more study needs to be done to understand usage scenario, preliminary results from
the pilot indicate that the business model is scalable.
4.3 FUTURE WORK
After testing the basic validity of the business model, future works involve refinement and execution of a
detailed business plan. The business model was primarily designed for Mumbai but it could be extended
many other cities in developing countries. Future work of the project involves implementing this concept
across semi urban and rural parts of India.
A further technical study needs to be conducted to understand how this solution can be integrated with
hardware made companies other than Ubiquiti® by using technologies such as DDWRT and OpenWRT.
Convincing ISPs and Quasi ISPs to join in to the Muft WiFi network by providing them a ‘free to use’
user authentication and providing them with ‘revenue per user logged in’ model remain a key part of Muft
WiFi’s adoption strategy.
Technical study includes creating a systematic method to evaluate the user experience at Wi-Fi Zones.
With a better understanding of broken experiences of such wireless networks, Muft WiFi as a (technical)
solution can be improved and customized to various different developing countries.
Additional efforts are required to find more advertisers to advertise using the Muft WiFi ad network, and
to create a good user experience for them.
Making the entire business model (and technical source codes) of Muft WiFi open source and free to
adopt remain a key part of the implementation and expansion strategy. This involves a series of step-by-
step ‘do it yourself’ guides. A profitable (and open) model with ‘free Internet access’ to users may
encourage ISPs and hardware companies to provide Internet access to those users that cannot afford it at
existing rates.
61
We are hopeful that a model of this sort can be customized by social entrepreneurs and governmental
bodies to bridge the digital divide in various cities that resemble the context of Mumbai.
4.4 REFLECTIONS
Using an ad based approach doesn’t really make the Internet ‘free’. Without discussing in-depth the ill-
effects of advertising on a consumerist society, the study fails to fully address some of the user goals. It
wouldn’t be recommended to using an ‘ad-based’ model of this sort in schools or corporate offices.
However, it can be considered as a transitory measure to bridge the digital divide by enabling free Internet
access for end users in public places.
During the course of this pilot study, we were asked for a bribe by a (undisclosed) member of a
governmental organization in Mumbai. The bribe was in connection to obtaining permissions from certain
authorities to start a ‘free Wi-Fi Zone’ at a certain public place in Mumbai. Whilst we didn’t resort to
such extortion, we definitely didn’t account for the delay it caused in starting the pilot project. Obtaining
permissions due to lack of clear policies or corruption can cause severe delays in many ICTD projects in
developing countries. A provision should have been added in the overall project timeline to account for
such delays.
In the course of this study and working on Muft Internet, we have learned many things within different
disciplines. Digital divide may be seem like a highly complex and troubling social issues to be worked on
– but it is not. A participatory design or co-design approach can be very effective to solve such complex
problems. A systematic design procedure with utmost consideration to user experience and economic
sustainability can be key measures required to succeed in ICT projects particularly those that aim at
bridging the digital divide in developing countries.
We had the fantastic opportunity to explore works of many HCI researchers and social workers working
intensively to bridge the digital divide. Ideas such as ‘text-free user interface for semi-literate and
illiterate users’ is one such idea that addresses a large section of population and bringing them online.
As citizens, we understood how bad Governmental laws and mobile network lobbyists have caused events
such as the “2G Scam”19 that have severely affected Internet (and information) access and affordability in
India further widening the digital divide.
Several governmental bodies play an important role in forming the policies that affect technology and
information access. The overall design of a solution, business and technical, in many countries is often
shaped by what laws and regulations govern (or do not govern) the information technology space.
19 What is the 2G Scam? Information on http://en.wikipedia.org/wiki/2G_spectrum_scam
62
Many HCI researchers still find it hard to believe that 60% of the human race has never been online. Not
all of them share the same reason - addressing the role of affordability in data access doesn’t solely
depend on market conditions. Technologists and researchers can play a key role breaking costs and
making products or services with a good user experience to this section of society. Bringing this 60% of
the (offline) human race involves many resources including the best minds of HCI.
Further sociotechnical research is needed in understand different technologies and ideas that can bridge
the digital divide.
63
References
Alan Chamberlain, A. C. (2012). Research in the wild: understanding 'in the wild' approaches to design
and development. DIS '12 Proceedings of the Designing Interactive Systems Conference (pp. 795-
796). Newcastle UK: ACM New York, NY, USA ©2012. doi:10.1145/2317956.2318078
Australian Public Service Commission. (2007). Tackling Wicked Problems: A Public Policy Perspective.
Retrieved from APSC Gov: http://www.apsc.gov.au/publications-and-
media/archive/publications-archive/tackling-wicked-problems accessed on June 2014
BBC Network. (2010). Finland makes broadband a 'legal right'. Retrieved from BBC Technology News:
http://www.bbc.co.uk/news/10461048 accessed on August 2014.
Beal, Vangie. (2002). Digital Divide. Retrieved from Webopedia:
http://www.webopedia.com/TERM/D/digital_divide.html accessed on August 2014
Cisco Systems, Inc. (2014). Visual Networking Index. San Jose: Cisco Systems, Inc. Retrieved from
http://www.cisco.com/c/en/us/solutions/collateral/service-provider/ip-ngn-ip-next-generation-
network/white_paper_c11-481360.pdf accessed on August 2014
Dasgupta, S. S. (2001). Policy reform, economic growth, and the digital divide: An econometric analysis.
World Bank Publications accessed on April 2014
Datta, P. (2011). A preliminary study of ecommerce adoption in developing countries. Information
Systems Journal, 21(1), 3-32. doi:10.1111/j.1365-2575.2009.00344.x
eMarketer. (2014). 2 Billion Consumers Worldwide to Get Smartphones. Retrieved from eMarketer -
Market Research on digital media and Internet marketing: http://www.emarketer.com/Article/2-
Billion-Consumers-Worldwide-Smartphones-by-2016/1011694 accessed on December 2014
Fox Networks. (2009). French Court Declares Internet Access as Basic Human Right. Retrieved from
FOX News: http://www.foxnews.com/story/2009/06/12/top-french-court-declares-internet-
access-basic-human-right/ accessed on July 2014.
Frank La Rue. (2011). Special Rapporteur on the promotion and protection of the right to freedom of
opinion and expression. Human Rights Council. Guatemala: United Nations. Retrieved from
http://www.ohchr.org/EN/ISSUES/FREEDOMOPINION/Pages/OpinionIndex.aspx accessed on
August 2014
Government of Greece. (2008). Article 5A: Constitution of Greece. Retrieved from Hellenic Parliament:
http://www.hellenicparliament.gr/UserFiles/f3c70a23-7696-49db-9148-f24dce6a27c8/001-
156%20aggliko.pdf accessed on July 2014
64
Government of India. (2014). NeGP. Retrieved from National e-Governance Plan:
https://negp.gov.in/pdfs/DigitalIndia.pdf accessed on August 2014
HT Media. (2014). Delhi: Now, enjoy free Wi-Fi connectivity for 20 minutes in CP. Retrieved from
Hindustan Times: http://www.hindustantimes.com/india-news/delhi-connaught-place-to-have-
public-wi-fi-from-today/article1-1286613.aspx accessed on October 2014
Ifinedo, P. R. (2005). Digital divide in Europe: assessing and comparing the e-readiness of a developed
and an emerging economy in the Nordic region. Electronic Government, an International Journal
2.2, 111-133. accessed on February 2014
Indrani Medhi, A. S. (2007). Text-Free User Interfaces for Illiterate and Semi-Literate Users. Information
Technology and International Development, 4(1), 27-50. accessed on March 2014
International Telecommunication Union. (2013). Measuring the Information Society. International
Telecommunication Union, Telecommunication Development Bureau (BDT), Geneva
Switzerland. Retrieved from http://www.itu.int/en/ITU-
D/Statistics/Pages/publications/mis2014.aspx accessed on July 2014
Kara Sprague, James Manyika, Bertil Chappuis, Jacques Bughin, Ferry Grijpink, Lohini Moodley,
Kanaka Pattabiraman. (2014). Offline and Falling Behind: Barriers to Internet Adoption. San
Francisco: McKinsey & Company. Retrieved from
http://www.mckinsey.com/insights/high_tech_telecoms_internet/offline_and_falling_behind_barr
iers_to_internet_adoption accessed on August 2014
Kattel, R. a. (2006). Knowledge-based Economy and ICT-related education in Estonia: Overview of the
current situation and challenges for the educational system. Tallinn: PRAXIS
Kolko, Jon. (2012). Wicked Problems: Problems Worth Solving: A Handbook & A Call to Action. Austin:
AC4D
Lu, M.-t. (2001). Digital divide in developing countries. Journal of Global Information Technology
Management, 3(4), 1-4. doi:10.1080/1097198X.2001.10856304
Lu, M.-t. (2014). Digital Divide in Developing Countries. Journal of Global Information Technology
Management.
Mauro F. Guillén, S. L. (2005). Explaining the Global Digital Divide: Economic, Political and
Sociological Drivers of Cross-National Internet Use. Oxford Journal: Social Forces, 84(2), 681-
708. Retrieved January 2014
65
Muller, M. J. (2002). Participatory Design : The Third Space in HCI. In A. S. Julie A. Jacko, The human-
computer interaction handbook (Vol. 4235, pp. 01-70). New Jersey: L. Erlbaum Associates Inc.
Hillsdale, NJ, USA ©2003
Norris, P. (2001). Digital Divide: Civic Engagement, Information Poverty, and the Internet Worldwide.
Cambridge: Press Syndicate of the University of Cambrdige
Prasanto K Roy. (2014). Why India’s mobile network is broken. Retrieved from BBC News:
http://www.bbc.com/news/world-asia-india-30290029 accessed on December 2014
Quibria, M. ., Ahmed, S. N., Tschang, T., & Reyes-Macasaquit, M.-L. (2003).
Digital divide: determinants and policies with special reference to Asia. Journal of Asian
Economics, 13(6), 811–825. doi:10.1016/S1049-0078(02)00186-0
Reference.com. (2008). Digital Divide. Retrieved from Dictionary.Reference.Com:
http://dictionary.reference.com/browse/digital+divide accessed on July 2014
Reliance Communications. (2015). Freenet. Retrieved from RCom Network:
http://www.rcom.co.in/Rcom/personal/internet/internet-org.html accessed on March 2015
Republic of Estonia. (2006). e-Estonia Facts. Retrieved from RIA - Information System Authority:
https://www.ria.ee/facts-about-e-estonia/ accessed on March 2014,
Republic of Estonia. (2011). Statistics on eVoters in Estonia. Retrieved from Vabariigi Valimiskomisjon:
http://www.vvk.ee/voting-methods-in-estonia/engindex/statistics accessed on May 2014
Richard Kahn, D. K. (2004). New media and internet: from the ‘Battle of Seattle’ to blogging'. New
Media & Society, 87-95. doi:10.1177/1461444804039908
Russel, Jon. (2015). Facebook Takes Internet.org And Its Free Mobile Data Services To India. Retrieved
from TechCrunch: http://techcrunch.com/2015/02/09/internet-org-india/ accessed on February
2015
Sarah Morris. (2009). Spain govt to guarantee legal right to broadband. Retrieved from Reuters News:
http://www.reuters.com/article/2009/11/17/spain-telecoms-idUSLH61554320091117 accessed on
June 2014
Sawant, Nimish. (2015). Zuckerberg’s Internet.org is unfair: Facebook founder’s pet project faces ire
from Airtel, Vodafone. Retrieved from FirstPost News: http://tech.firstpost.com/news-
analysis/zuckerbergs-internet-org-is-unfair-facebook-founders-pet-project-faces-ire-from-airtel-
vodafone-257673.html accessed on March 2015
Selwyn, N. (2004, June). Reconsidering Political and Popular Understandings of the Digital Divide. New
Media & Society, 6(3), 341-362. doi:10.1177/1461444804042519

66
Spinuzzi, C. (2005). The methodology of participatory design. Technical Communication, 52(2), 163-
174. Retrieved April 2014, from
http://www.ingentaconnect.com/content/stc/tc/2005/00000052/00000002/art00005
TechTarget. (2014). Digital Divide. Retrieved from Whatis:
http://whatis.techtarget.com/definition/digital-divide accessed on October 2014
Telegeography. (2009). What’s the price of Internet backbone capacity? Retrieved from Telegeography -
Authoritive Telecom Data: https://www.telegeography.com/press/press-
releases/2009/10/01/whats-the-price-of-internet-backbone-capacity/
Telephone Regulatory Authority of India. (2014). Highlights of Telecom Subscription Data. Ministry of
Telecommunication and Information Technology, Department of Telecom. New Delhi:
Government of India. Retrieved from
http://www.trai.gov.in/WriteReadData/WhatsNew/Documents/PR-TSD-Sep-14.pdf accessed on
November 2014
The World Bank. (2013). World Development Indicators - Internet users (per 100 people). The World
Bank. Retrieved from Word Bank: World Development Indicators:
http://data.worldbank.org/indicator/IT.NET.USER.P2/countries accessed on May 2014.
The World Bank. (2013). World Development Indicators - GDP Ranking. The World Bank. Retrieved
from Word Bank: World Development Indicators: http://data.worldbank.org/data-catalog/GDP-
ranking-table accessed on May 2014.
The World Bank. (2013). World Development Indicators - ICT service exports (% of service exports,
BoP). The World Bank. Retrieved from World Bank:
http://data.worldbank.org/indicator/BX.GSR.CCIS.ZS accessed on May 2014.
Tikoo, Taniya. (2015). Free Wi-Fi not before a year. Retrieved from Times News Network:
http://ibnlive.in.com/news/aaps-poll-promise-of-free-wifi-in-delhi-with-terms-and-
conditions/528887-37-64.html accessed on February 2015
Times News Network. (2015). Kolkata to go fully Wi-Fi in two months. Retrieved from The Times of
India: http://timesofindia.indiatimes.com/city/kolkata/Kolkata-to-go-fully-Wi-Fi-in-two-months-
time/articleshow/46035488.cms accessed on February 2015
U.S. Department of Commerce. (1995). Falling through the net: A survey of the have nots in rural and
urban America. Washington D.C: National Telecommunications and Information Administration
(NTIA). Retrieved from http://www.ntia.doc.gov/ntiahome/fallingthru.html on August 2014
67
United States of America. (2011). Human Rights in Costa Rica. Retrieved from U.S Department of State
Website: http://www.state.gov/j/drl/rls/hrrpt/2010/wha/154500.htm accessed on April 2014
University of British Columbia. (2014). Design Processes - IDEO Human-Centred Design (HCD) Design
Process. Retrieved from Design Studio UBC: http://dstudio.ubc.ca/toolkit/processes/ accessed on
January 2014
Warschauer, M. (2002). Reconceptualizing the Digital Divide. First Monday, 7(7), 2-4. Retrieved from
http://dx.doi.org/10.5210/fm.v7i7.967 accessed on March 2014
Wenhong Chen, B. W. (2004). The Global Digital Divide - Within and Between Countries. IT & Society,
1(7), 18-25. Retrieved from
https://www.academia.edu/2588000/_2004_The_Global_Digital_Divide_Within_And_Between_
Countries accessed on March 2014

68
Abstract (in Estonian language)
TASUTA INTERNETIÜHENDUSE VÕIMALDAMINE ARENGUMAADES OSALUSDISAINI
LÄHENEMISE KAUDU
Viimase paarikümne aasta jooksul oleme näinud internetkasutuse, andmetarbimise ja internetikasutajate
koguarvu järsku kasvu. Lairibaühenduse, mobiilse interneti, mobiilirakenduste ja läbi lokaliseeritud sisu
ja teenuste üldise internetikasutuse kasvuga seoses oleme märganud internetile ligipääsu mitmeid
positiivseid mõjusid. Paljud inimese ja arvuti suhtluse ja -arenduse (Human Computer Interaction and
Development, HCID) ning info- ja kommunikatsioonitehnoloogia ja -arenduse (Information and
Communication Technology and Development, ICTD) valdkonna uurimused on näidanud, et riikides, kus
internet levik on laiem, on suurem majanduskasv, parem haridussüsteem, suurem osalus demokraatias
ning kokkuvõttes paremad mitmesugused elukvaliteedi (Quality of Life, QOL) näitajad.
Aastal 2014 on jätkuvalt kurb tõsiasi see, et rohkem kui poolel maailma elanikest puudub igasugune
ligipääs internetile. Enamik neist inimestest elab arengumaades või vaestes riikides. See peegeldab
sügavat lõhet nende inimeste ja tehnoloogia loojate, disainerite, poliitikakujundajate vahel ning tööstuse
arusaama lõppkasutajatest ja nende kaasamisest. Probleemid on sügavamad üksikisiku tavateadmistest
nagu riistvara kasutamise oskus, kasutajate kirjaoskus või kaetus internetivõrguga. Paljudes riikides, mis
sellise suure digitaalse lõhega silmitsi on, seisavad interneti leviku ees komplekssed ja omavahel
põimunud sotsiaal-tehnoloogilised takistused. Siiski võib selliste riikide puhul täheldada ühist mustrit,
milleks on taskukohasus. Ehkki viimase kümne aasta jooksul on interneti kasutamise võimalusega
mobiilseadmete ja andmepakettide hinnad oluliselt langenud, on kvaliteetne ligipääs internetile ometi
paljude jaoks ikka liiga kallis, et seda endale lubada.
Uurimus korraldati Indias eesmärgiga ületada erinevad juriidilised, majanduslikud ja tehnoloogilised
takistused, et anda kasutajatele tasuta ligipääs internetile. Üritame uurimuses leida laiendust interneti
taskukohasuse probleemile India selliste olemasolevate internetikasutajate jaoks, kellel on olemas
internetivõimalusega nutiseade, kuid kellel puudub võimalus mobiilse internet paketi eest maksta.
Osalusdisaini lähenemise ja „topeltteemanti” mudelit järgiva disainiprotsessi abil loodi majanduslikult
jätkusuutlik ja tehnoloogilisest eri mõõtmetele kohandatav „tasuta Wi-Fi ala” mudel ja prototüüp.
Uurimuse eesmärk on pakkuda väärtuslikke teadmisi erinevatele teadusasutustele, riigiasutustele,
internetiteenuse pakkujatele, riistvara-/tarkvaraettevõtetele ja teistele ICTD ruumi osalistele, et üritada
seda digitaalset lõhet ületada.
69
List of Abbreviations
ISP: Internet Service Provider
Quasi ISP: A temporary or unlicensed Internet Service Provider
USD: United States Dollar
INR: Indian National Rupee
EUR: Euro
GDP: Gross Domestic Product
GNI: Gross National Income
QOL: Quality of Life
HCI: Human Computer Interaction
HCID: Human Computer Interaction and Development
ICT: Information and Communication Technology
ICTD: Information and Communication Technology and Development
Wi-Fi: Wi-Fi (or WiFi) is a local area wireless computer networking technology that allows electronic
devices to network, mainly using the 2.4 gigahertz (12 cm) UHF and 5 gigahertz (6 cm) SHF ISM radio
bands. More information: http://en.wikipedia.org/wiki/Wi-Fi
NGO: Non-Governmental Organization
PD: Participatory Design
VPN: Virtual Private Network
SMS: Short Message Service
ID: Identification (in User Identification)
Lo-Fi: Low Fidelity
Hi-Fi: High Fidelity
PAN: Personal Area Network
SaaS: Software as a service
FIA: Free Internet Access
OTP: One Time Password
SSID: Service Set Identifier in Wi-Fi technologies
UAS: User Authentication System
DBS: Database Management System
IP: Internet Protocol
MAC IP: Media Access Control IP
CPM: Cost per 1000 Impressions (in digital advertising)
CPC: Cost per click (in digital advertising)
70
Appendix
Attached to this thesis we provide a DVD with the following contents:
1. Business Model for Muft WiFi Solution
2. Prototype Details