enabling agility in existing information systems: a
TRANSCRIPT
Enabling agility in existing information systems:
A capability structure for the IT function
George Arthur Hobbs BA MIS
Submitted in total fulfillment of the requirements of the degree of Doctor of Philosophy
July 2010
Department of Information Systems The University of Melbourne
Produced on archival quality paper

ii

iii
Abstract
This thesis identifies how the IT function can create agility in existing information systems. Agility is the capability to quickly sense and respond to environmental perturbations. This thesis contrasts the agility perspective from a widely used industry framework with research perspectives on agility in the IS literature. Beer’s Viable System Model is a useful meta-level theory to house agility elements from IS research literature and applies cybernetic principles to identify the capabilities required of the IT function. Indeed, a survey of 70 organizations confirms that the meta-level theory better correlates with reported agility measures than existing practice measures do on their own.
There were three stages to the research. First, was conceptually applying the Viable System Model to the concept of agility from IS research literature. The cybernetic model proposed an explanative theory for agility in information systems and prescribed capabilities for the IT function.
The second research stage was a qualitative study with an IT consultancy. Managers and consultants participated in applicability checking the theoretical development to the agility topic. The level of analysis was the client base of an IT consultancy, which consists of approximately 250 Australian organizations. A research deliverable was a joint white paper between the University of Melbourne and the IT consultancy.
The final stage was two quantitative surveys for theory testing. The first survey mailed a Likert-type questionnaire to business and IT managers amongst the IT consultancy’s clients. The second survey invited international members of professional interest groups to complete a web-based questionnaire. The responses from the surveys were analyzed using partial-least-squares modeling and linear regression. The data analysis correlated process maturity of the IT function and the likelihood of agility in existing information systems. The thesis claims to generalize the survey findings to other large organizations in OECD countries.
The thesis offers an agility-capability model for the IT function, which extends IS research with a theory that explains and predicts agility in existing information systems. A further contribution is to improve IT industry ‘best practice’ frameworks by prescribing capabilities to develop.

iv

v
Declaration
This is to certify that:
(i) the thesis comprises only my original work towards the PhD;
(ii) due acknowledgement has been made in the text to all other material used; and
(iii) the thesis is less than 100,000 words in length, exclusive of tables, maps,
bibliographies and appendices.
George Arthur Hobbs
Saturday, 24 July 2010

vi
vii
Acknowledgments
Through my candidature, I have learnt a great deal and I am grateful for the experience.
I received the support of many friends and family members, and I am particularly
thankful for the encouragement given by my loving wife, Donna.
My supervisor, Rens Scheepers, gave me continual valuable advice and ensured that I
stayed on the fairway. I thank Rens and his family for the generous amount of time I
have taken from his schedule to assist me. Other faculty members in the Department of
Information Systems at The University of Melbourne helped me to understand the
research problem, particularly Peter Seddon and Graeme Shanks. I also thank Stephen
Smith at Monash University and Pernille Kræmmergaard at Alborg University for
reviewing my research findings and Carla Mahony for her proofreading.
I wish to acknowledge Oakton, an Australian technology and business consulting
company1, as the industry partner of this research. Oakton provided funds for the
research, an introduction to their clients for a mailed survey and the time of many staff
members to reflect on the research topic. I wish to thank James Watson, Fiona Mavros
and Brett Woolley for their continued support as my demands for this research evolved.
This research was supported under Australian Research Council's Linkage Projects
funding scheme (project LP0561936). The views expressed herein are those of the
author and are not necessarily those of the Australian Research Council.
My father, Norman Arthur Hobbs, passed away during the preparation of this thesis. He
gave me the opportunities to enjoy this research.
1 Oakton Head Office:
Level 8, 271 Collins Street Melbourne VIC 3000 http://www.oakton.com.au/ Tel: +61 3 9617 0200 Fax: +61 3 9621 1951

viii

ix
Table of Contents
Abstract iii
Declaration v
Acknowledgments vii
Table of Contents ix
List of Figures xvii
List of Tables xix
CHAPTER 1. INTRODUCTION 1
1.1. Relevancy 1
1.2. The research topic 2
1.2.1. Agility 2
1.2.2. Existing information systems 4
1.2.3. IT function 5
1.3. Conceptual basis of the thesis 5
1.4. A research question with two perspectives 7
1.5. Organization of this thesis 7
CHAPTER 2. LITERATURE REVIEW 11
2.1. Introduction 11
2.2. Theoretical perspectives on IS agility 11
2.2.1. Review of IS journal papers on agility 13
2.2.2. Review of IS agility papers in other journals 22
2.2.3. Review of IS conference papers on agility 24
2.2.4. Agility and types of IS theory 29
2.2.5. A basic model of agility from IS theory 35
2.2.6. Summary of IS theoretical perspectives 39
2.3. Practice perspectives on IS agility 40
2.3.1. COBIT 40
2.3.2. ITIL 41
2.3.3. TOGAF 43
2.3.4. Gartner Research 44
2.3.5. IS industry press articles 46
2.3.6. Summary of IS practice perspectives 47
2.4. Gaps between the IS theoretical and practice perspectives 48
x
2.5. Conclusion on the literature review 49
CHAPTER 3. THEORY DEVELOPMENT 51
3.1. Introduction 51
3.2. Cybernetics and the agility question 51
3.2.1. Cybernetic applicability 51
3.2.2. Criticisms of cybernetics 53
3.3. The viable system model 57
3.3.1. Description of the viable system model 57
3.3.2. Currency of the viable system model 60
3.3.3. The VSM applied to the IT function 61
3.3.4. The VSM applied to the basic model of agility 64
3.4. Propositions suggested 66
3.5. Conclusion on the theoretical development 67
CHAPTER 4. RESEARCH DESIGN 69
4.1. Introduction 69
4.2. Research activities 69
4.3. Role of the industry partner 70
4.3.1. Acquisition of the industry partner 71
4.3.2. Keeping the industry partner engaged 73
4.4. Focus group research method rejected 74
4.5. Conclusion on the research design 75
CHAPTER 5. APPLICABILITY CHECK 77
5.1. Introduction 77
5.2. Method 77
5.3. A model for agility in information systems 80
5.4. Relevance factors for agility 80
5.4.1. The Business Environment 80
5.4.2. The Operating Model 82
5.4.3. The Organizational Culture 85
5.5. Enabling factors for the IT function 87
5.5.1. IT Function structure 87
5.5.2. IT Governance Offices 89

xi
5.6. An intervening factor on the IT function 91
5.6.1. Business Monarchy governance 91
5.6.2. IT Monarchy governance 91
5.6.3. Feudal governance 92
5.6.4. Federal governance 92
5.6.5. IT Duopoly governance 93
5.7. An element of agility in information systems 93
5.7.1. Industry Best Practice 93
5.8. Discussion of the applicability check 94
5.9. Propositions suggested from applicability check 95
5.10. A limitation of the applicability check 96
5.11. Conclusion of the applicability check 97
CHAPTER 6. CONSTRUCT DEVELOPMENT 99
6.1. Introduction 99
6.2. Conceptual definitions 99
6.3. Hypotheses 100
6.3.1. The principal research model 100
6.3.2. Primary hypothesis of the principal research model 101
6.3.3. Primary hypotheses at a lower level of analysis 104
6.3.4. Secondary hypotheses of the principal research model 105
6.3.5. Hypotheses of alternative research models 106
6.4. Ontology 107
6.5. Conceptual variables and their measurement 108
6.5.1. POLINTCON variable 108
6.5.2. D-OPTIONS variable 112
6.5.3. ITBENEFIT variable 113
6.5.4. BUSKNOW variable 115
6.5.5. ITGOAL5 variable 115
6.5.6. ITGOVT variable 116
6.6. Testing of the variables 117
6.7. Summary of the variables used 118
6.8. Conclusion on the construct development 119
CHAPTER 7. SURVEY METHODOLOGY 121
7.1. Introduction 121

xii
7.2. Research Method 121
7.3. Data Collection: Mailed Survey 122
7.3.1. Pilot 122
7.3.2. Theoretical population 123
7.3.3. Participants 123
7.3.4. Materials 124
7.3.5. Procedures 127
7.4. Data Collection: Web-based Survey 128
7.4.1. Theoretical population 128
7.4.2. Data gathering 129
7.4.3. Materials 129
7.4.4. Participants 131
7.5. Common Method Variance 134
7.6. Both surveys sampled the same population 134
7.7. A non-response bias was not evident 141
7.8. Partial least squares 143
7.8.1. PLS software used 144
7.8.2. Interpreting PLS path modeling figures 145
7.8.3. Sample size and statistical power 146
7.8.4. Covariance 148
7.8.5. Justification for the use of PLS 151
7.9. Preface to the data analysis 153
7.10. Conclusion on the survey method 153
CHAPTER 8. A SNAPSHOT OF AGILITY 155
8.1. Introduction 155
8.2. Respondent profile 155
8.3. Descriptive findings 156
8.4. Conclusion on the snapshot 161
CHAPTER 9. MAJOR FINDINGS 163
9.1. Introduction 163
9.2. The primary hypothesis was not falsified 163
9.2.1. Testing of hypotheses H1 and H2 for falsification 164
9.2.2. PLS modeling for falsification 164
9.2.3. Reliability and validity of falsification modeling 167

xiii
9.2.4. Measurement cross loadings of falsification modeling 168
9.2.5. Findings from the falsification modeling 170
9.2.6. Data distribution normality 170
9.2.7. PLS path modeling bias 176
9.3. The primary hypothesis has transferability 177
9.3.1. Testing of hypotheses H1 and H2 for transferability 177
9.3.2. PLS modeling for transferability 177
9.3.3. Reliability and validity of transferability modeling 181
9.3.4. Findings from transferability modeling 181
9.4. Improvement over existing practice 182
9.4.1. Testing of hypothesis H4 182
9.4.2. PLS modeling of existing practice 182
9.4.3. Reliability and validity of existing practice modeling 185
9.4.4. Findings from existing practice modeling 185
9.5. A projected increase in agility outcomes 186
9.5.1. The coefficient of correlation for agility outcomes 186
9.5.2. ANOVA regression analysis of agility outcomes 186
9.5.3. Findings from agility outcomes projection 188
9.6. Adjustments for common method variance 189
9.7. Conclusion on the major findings 190
CHAPTER 10. OTHER FINDINGS 193
10.1. Introduction 193
10.2. Mutuality within the IT function enabled agility 193
10.2.1. Testing of hypotheses H1a, H1b and H1c 193
10.2.2. PLS modeling of a hierarchical construct 194
10.2.3. Reliability and validity from hierarchical modeling 198
10.2.4. Measurement cross loadings revisited 198
10.2.5. Findings from hierarchical modeling 199
10.3. Business knowledge did not add to agility 201
10.3.1. Testing of hypothesis H5 201
10.3.2. PLS modeling with business knowledge added 202
10.3.3. Reliability and validity from adding business knowledge 205
10.3.4. Findings from adding business knowledge 205
10.4. Business knowledge was not vital for agility 206
10.4.1. Testing of hypothesis H5 206
10.4.2. PLS modeling of business knowledge 207
10.4.3. Reliability and validity from business knowledge modeling 209
10.4.4. Findings from business knowledge modeling 210
10.5. Business monarchies benefit more from agility 210
xiv
10.5.1. Testing of hypothesis H3 211
10.5.2. PLS modeling for IT governance segments 212
10.5.3. Reliability and validity from IT governance modeling 216
10.5.4. Findings from IT governance modeling 217
10.6. Projected increase in IT benefits 218
10.6.1. The coefficient of correlation for IT benefits 218
10.6.2. ANOVA regression analysis 218
10.6.3. Findings from IT benefits projection 220
10.7. Conclusion on all findings 220
CHAPTER 11. DISCUSSION OF INSIGHTS 225
11.1. Introduction 225
11.2. Reversal of causality 225
11.3. Unexplained determination of D-options 228
11.4. Unexplained determination of IT benefits 229
11.5. A new set of industry best practices 231
11.6. Business knowledge of IT personnel 233
11.7. The VSM as a lens for the IT function 234
11.8. Sensing for agility and Business Intelligence 236
11.9. Generalization to large enterprises in the OECD 238
11.10. Conclusion on the insights 242
CHAPTER 12. LIMITATIONS OF FINDINGS 243
12.1. Introduction 243
12.2. Use of claimed IS industry best practices 243
12.3. Tautology in the principal research model 244
12.4. Data collection limitations 245
12.5. Cognitive bias 246
12.6. Psychometric measures and statistical inference 247
12.7. IT process maturity as a measure 249
12.8. Conclusion on the limitations 249

xv
CHAPTER 13. CONCLUSION 251
13.1. Overview of the research activities 251
13.2. The agility-capability model 253
13.3. Future research 256
13.3.1. Relevance factors of IS agility for organizations 256
13.3.2. Building portfolios of digital options 257
13.3.3. IT governance intervening in IS agility 258
13.4. Significant contributions 259
13.4.1. Contribution to IS theory on the IT function 259
13.4.2. Contribution to IS research on agility 260
13.4.3. Contribution to IS practice of agility 262
13.5. A critical reflection 263
CHAPTER 14. GLOSSARY 267
REFERENCES 275
APPENDIX A: MAILED SURVEY MATERIAL 283
APPENDIX B: WEB SURVEY MATERIALS 291
Agility in information survey home page 291
About the survey web page 292
Glossary of terms web page 294
Instructions to participants’ web page 295
Questionnaire web pages 296
APPENDIX C: PAPERS FROM THIS THESIS 307
Refereed journal papers 307
Refereed conference papers 307
Industry papers 307
Other conference presentations 308

xvi

xvii
List of Figures
Figure 2-6 Types of IS theory on agility (after Gregor 2006) 30
Figure 2-11 A basic model for agility from IS theory 37
Figure 2-13 Gartner agility cycle (from Plummer and McCoy 2006a) 45
Figure 3-2 VSM applied to the IT function 62
Figure 4-1 Research design into agility in information systems 70
Figure 5-2 A relational model for agility based on the insights of Oakton consultants 81
Figure 6-1 The principal research model with hypotheses 101
Figure 6-2 Principal research model of ontological objects 107
Figure 7-2 Email invitation to web-based survey 130
Figure 7-3 Invitation to web-based survey 130
Figure 7-4 Organizational profile of 35 web-based survey respondents 133
Figure 7-14 Covariance of POLICY measurement items 148
Figure 7-15 Covariance of INTELL measurement items 149
Figure 7-16 Covariance of CONTRL measurement items 149
Figure 7-17 Covariance of D-OPTIONS measurement items 150
Figure 7-18 Covariance of ITBENEFIT measurement items 151
Figure 9-2 Research model for falsification (n=79) 165
Figure 9-6 Normality of POLINTCON (n=79) 171
Figure 9-7 Normality of D-OPTIONS (n=79) 173
Figure 9-8 Normality of ITBENEFIT (n=79) 174
Figure 9-9 Normality of ITGOAL5 (n=79) 175
Figure 9-11 Research model for transferability (n=34) 179
Figure 9-14 Existing practice modeling (n=79) 183
Figure 9-18 Plot of the correlation of POLINTCON and D-OPTIONS (n=79) 187
Figure 10-2 Hierarchical modeling (n=79) 196
Figure 10-7 Principal research model after adding business knowledge (n=79) 203
Figure 10-11 Alternate model of business knowledge (n=79) 208
Figure 10-17 IT Monarchy segment modeling (n=12) 213
Figure 10-18 Business Monarchy segment modeling (n=35) 214
Figure 10-22 Plot of the correlation of D-OPTIONS and ITBENEFIT (n=79) 219
Figure 11-2 Reversal of causality in the principal research model 227
Figure 11-8 Industry sectors in Australia compared to other OECD members 241
Figure 13-1 The agility-capability model 254

xviii

xix
List of Tables
Table 1-1 Concepts of the research topic 3
Table 2-1 Reviewed IS journals 12
Table 2-2 Profile of 36 publications on agility in IS journals 13
Table 2-3 Key IS journals papers about the IT function enabling agility 15
Table 2-4 Papers on Agility and Information Systems from non-IS journals 23
Table 2-5 AIS conference papers on agility since 2003 25
Table 2-7 Theories for analysing 31
Table 2-8 Theories for explaining 32
Table 2-9 Theories for design and action 34
Table 2-12 Architectural drivers (from The Open Group 2009) 44
Table 5-1 Oakton contributors to the white paper (Woolley and Hobbs 2008) 79
Table 6-3 Test of variables for reliability using a pilot survey (n=8) 117
Table 6-4 Summary of variables and measures 118
Table 7-1 Summary of survey responses 121
Table 7-5 Independent tests of the two samples for POLINTCON 135
Table 7-6 Independent tests of the two samples for D-OPTIONS 136
Table 7-7 Independent tests of the two samples for ITBENEFIT 138
Table 7-8 Independent tests of the two samples for ITGOAL5 139
Table 7-9 Independent tests of the two samples for BUSKNOW 140
Table 7-10 Two-sample t-test for the response quartiles in D-OPTIONS 142
Table 7-11 Two-sample t-test for the response quartiles in ITBENEFIT 142
Table 7-12 Two-sample t-test for the response quartiles in POLINTCON 143
Table 7-13 Sample sizes for a post hoc statistical power of 0.80 (from Marcoulides and Saunders 2006) 147
Table 8-1 Snapshot of IT function's activities frequency 156
Table 8-2 Snapshot of business knowledge of IT personnel 157
Table 8-3 Snapshot of IT-dependent strategic benefits 158
Table 8-4 Snapshot of IT function process maturity 160
Table 9-1 Correlation matrix from falsification modeling (n=79) 164
Table 9-3 t-values from falsification modeling using bootstrapping 166
Table 9-4 Construct validity and reliability from falsification modeling (n=79) 168
Table 9-5 Cross loadings of measurements from falisification modeling 169
Table 9-10 Correlation matrix from transferability modeling (n=34) 178
Table 9-12 t-values from transferability modeling using bootstrapping 180
Table 9-13 Construct validity and reliability from transferability modeling (n=34) 181
Table 9-15 Correlation matrix from existing practice modeling (n=79) 184
Table 9-16 t-values from existing practice modeling using bootstrapping 184

xx
Table 9-17 Construct validity and reliability from existing proactice modeling (n=79) 185
Table 9-19 Correlations adjusted for CMV 190
Table 10-1 Correlation matrix from hierarchical modeling (n=79) 195
Table 10-3 t-values from hierarchical modeling using bootstrapping 197
Table 10-4 Construct validity and reliability from hierarchical modeling (n=79) 198
Table 10-5 Cross loadings of measurements from hierarchical modeling 199
Table 10-6 Correlation matrix after adding business knowledge (n=79) 202
Table 10-8 t-values after adding business knowledge using bootstrapping 204
Table 10-9 Construct validity and reliability after adding business knowledge (n=79) 205
Table 10-10 Correlation matrix from business knowledge modeling (n=79) 207
Table 10-12 t-values from business knowledge modeling using bootstrapping 209
Table 10-13 Construct validity and reliability from business knowledge modeling (n=79) 210
Table 10-14 Segments of IT governance archetypes amongst all respondents (n=79) 211
Table 10-15 Correlation matrix from IT Monarchy modeling (n=12) 212
Table 10-16 Correlation matrix from Business Monarchy modeling (n=35) 212
Table 10-19 t-values from IT governance modeling using bootstrapping 215
Table 10-20 Construct validity and reliability from IT Monarchy modeling (n=12) 216
Table 10-21 Construct validity and reliability from Business Monarchy modeling (n=35) 217
Table 10-23 Summary of PLS modeling of hypotheses & outcomes 221
Table 11-1 Composite vailidity and reliablity from a reversal of causality 226
Table 11-3 IT-dependent strategic agility predictors (from Fink and Neumann 2007) 231
Table 11-4 Existing COBIT linked objectives to creating IT agility 232
Table 11-5 New objectives to be linked to creating IT agility 232
Table 11-6 Existing COBIT objectives not yet linked to creating IT agility 233
Table 11-7 Profile of industry sectors in the sample and the Australian economy 240
Table 13-2 A index of IT function’s capability for IS agility 261

1
Chapter 1. Introduction This thesis extends the theory on agility in information systems. Agility has been
described as the capability to effectively sense and respond to environmental change
(Newman and Logan 2006a). Much of the current IS literature focuses on questions
relating to what agility is and if information systems enable agility in the enterprise.
This thesis takes up the unaddressed question of how the IT function of organizations
can enable agility. In doing so, this thesis extends the theoretical perspective to IS
practice by offering a tested agility-capability model that is prescriptive for the IT
function.
1.1. Relevancy
Agility in information systems is a topic of recent interest to IS academics and
practitioners (Sambamurthy et al. 2007; Seo and La Paz 2008; Weill et al. 2002). A
literature review of IS journals evidenced a research interest in agility emerging since
1998 (see Table 2-2). In a survey of senior IT executives, Ives and Mandviwalla (2004)
found strategic agility was ranked first amongst 53 issues. Luftman and McLean’s
(2004) survey of the Society of Information Management had agility ranked fifth
amongst 22 management concerns. Luftman and McLean note that a faster pace of
business change demands IT organizations respond quickly and effectively, that IT
activities once measured in years are now required in months, and the ability to sense
and respond to business demands has become critical.
This thesis found that information systems agility is also a topic of interest amongst the
highest levels of corporate management. I conducted a survey of business and IT
managers in 70 companies that asked the highest level in their organizations that had
discussed agility in information systems1. This 2008 survey found that the Chief
Executive Office had discussed agility in 31.65% of cases, followed by corporate-level
IT executives (25.32%) and corporate-level business executives (15.19%). A minority of
1 Responding to Question 6 in the mailed and web-based questionnaire included in the Appendices.

Chapter 1
2
respondents reported agility being discussed at a highest level beneath that of corporate-
level offices: mostly amongst IT executives and a business group (10.13%) and business
unit leaders (8.86%). The survey confirmed the interest in information systems agility
amongst corporate level executives and business unit leaders of large organizations.
1.2. The research topic
This section discusses the research topic and establishes the key concepts. Table 1-1
lists concise definitions of those concepts, while Chapter 14 contains a broader glossary
of the terms used in this thesis.
1.2.1. Agility
The research topic explores how the IT function enables agility in existing information
systems. The concept of agility has its genesis outside of the IS discipline. Leveled at
manufacturing enterprises competing in a global economy, Goldman et al. (1995)
identified agility as a concern of managers wishing to respond to change in a turbulent
business environment. Since the mid-1990s, manufacturing has developed agile
production methods (Vinodh et al. 2009) and some of these methods were applied to
software development.
More recently, both IS research and practice appear to be converging on a common
concept of agility for leveraging information systems. The research of Luftman and
McLean (2004) defines a concept consisting of recognition of a business environment
that fluctuates quicker than conventional planning cycles, the need to sense
environmental fluctuations, the need to respond using existing information systems, and
organizational readiness to effect the sensing and response. From a reflective
practitioner perspective, Gartner Research defines agility “as an organization's ability to
sense environmental change and respond efficiently and effectively to that change”
(Newman and Logan 2006b p. 3). Seo and La Paz (2008) extend these similar
definitions of agility, based on sensing and response, with a qualifier of learning from
experience to improve organizational competencies.

Introduction
3
Regardless of a consensus concept of agility being formed in recent years, the need of
agility is not universally accepted within IS practice. A forum of chief information
officers at Massachusetts Institute of Technology expressed opinions on agility in
information systems that ranged from it merely being a lack of planning or ad hoc
reacting, to others arguing that it is managers planning for both the known and the
unknown (Schrage 2004).
Concept Definition
Agility Recognition of a business environment that fluctuates
quicker than conventional planning cycles, the need
to sense environmental fluctuations, the need to
respond using existing information systems, and
organizational readiness to effect the sensing and
response (Luftman and McLean 2004).
Existing information systems Business initiatives that have been implemented and
are conducted using information technology (Weill et
al. 2002).
IT function The IT function is the personnel and their work
processes that have a responsibility for the delivery
of the organization’s information systems.
Capability A set of competencies of the IT function that has
strategic potential to exploit opportunities or
neutralizes threats in a organization’s environment
(Andreu and Ciborra 1996).
Structure The rules and non-human resources that refer to
patterns of social relationships and enact a social
practice by human agents (Cassell 1993; Giddens
1984).
Table 1-1 Concepts of the research topic

Chapter 1
4
1.2.2. Existing information systems
Weill et al. (2002) offer a concise definition of information systems as IT-conducted
business initiatives, where IT are electronic processes and networks. This thesis
accepted this definition with the qualification that the information systems are the result
of IT investments deliberated upon by the IT function. The definition does not include
freely utilizing a commonplace technology, such as employees’ mobile phones.
Weill and Broadbent (1998) classify four types of IT investments. First is infrastructure
technology investment in enterprise-wide communication networks, large-scale
computing and databases. IT infrastructure is the basis for the other IT investments
types. Second is transactional technology investment into basic repetitive processing
such as customer service-order provisioning, billing and accounts receivable. Third is an
informational technology investment for management control such as data warehousing
and analytics software. Last is strategic investment to gain a competitive advantage that
exploits emerging technologies. Sales channels based on location-aware, mobile
communications of customers are a contemporary example of strategic IT investments.
The totality of these IT portfolio investments is the information systems subject of this
thesis.
This thesis did not examine the agility enabled by the actual IT itself, such as software
products or development methodologies. The software technology may vary from
customized applications written in third-generation or object-orientated languages to
vendor-packaged enterprise applications. Systems integration may vary from many
applications integrated through a myriad of fixed interfaces; data warehousing, where
many applications share a database; enterprise application integration, where
middleware orchestrates many applications and databases; packaged enterprise
application software (e.g. ERPs) with a common database; to more recent service
orientated architecture based on web protocols (Markus 2000). While the type of
information technology utilized is a determinant of agility in information systems, it
was not the focus of this thesis. The focus of this thesis was the extent to which the IT
function enables agility in existing information systems.

Introduction
5
1.2.3. IT function
The IT function is the personnel and their work processes that have a responsibility for
the delivery of the information systems and analogous to a ship’s crew being the
complement to the vessel. Henderson and Venkatraman (1993) recognize an internal IT
domain composed of architectures providing choices of the technical infrastructure
configurations, work processes to operate the technical infrastructure and skills to
manage the technical infrastructure. This internal domain is within the organization,
distinct from the actual technical infrastructure, and characterizes the IT function.
The IT function is under the control of the organization, regardless whether direct
employment or a commercial arrangement resource the personnel. In-house IT staff,
external consultants, technology vendors and outsourcers of IT services are sources of
the IT function. In addition, included in the IT function are those representatives from
the business units of the organization, which are stakeholders in the business initiatives
conducted by the information systems, and routinely interact with IT personnel.
The propositions of this thesis focused on the IT function of large enterprises, with 250
or more employees, in economically developed countries. This thesis was concerned
with large enterprises in all industry sectors and not just those whose primary activity is
providing information technology services.
1.3. Conceptual basis of the thesis
This thesis reviewed the IS theoretical literature and the practice perspectives on agility.
The theoretical literature was reviewed after a methodical search for agility-related
papers of IS journals using ISI Web of Knowledge and IS conferences proceeding using
the AIS electronic library. A supplementary search for papers featuring “agility” and
“information systems” was made amongst sources from outside of recognized IS
publications.
Claimed industry best practices provided the IS practice perspectives. These best
practice frameworks of the IS industry include Control Objectives for Information and
related Technologies (COBIT), The Open Group's Architecture Forum (TOGAF) and

Chapter 1
6
the Information Technology Infrastructure Library (ITIL). Contributions for IT industry
research groups and articles in the industry press supplemented these practice
perspectives from frameworks.
Beyond the discipline of IS, in both the theoretical and practice perspectives, this thesis
drew on the reference discipline of cybernetics. Cybernetics is the science of the
feedback and control in biological and mechanical systems, founded by Norbert Wiener
in a 1948 publication. Ashby advanced the discipline by addressing the problem of how
systems deal with complexity in their environment (Ashby 1956; Conant and Ashby
1970). Beer provided a cybernetic model for human organizations to maintain a viable
existence when subject to perturbations from the environment (Beer 1979; Beer 1981;
Beer 1984; Beer 1985). Cybernetics has continued to be a basis for management science
and operations research in recent years (Espejo et al. 1996; Schwaninger 2000;
Snowdon and Kawalek 2003; Stephens and Haslett 2005; Yolles 2004).
This thesis identified gaps between the IS theoretical and practice perspectives with
regard to agility. A research method of conceptual and empirical study to reconcile the
perspectives was undertaken and cybernetics drawn on to bridge the gaps. Reconciling
the IS theoretical and the practice perspectives is relevant to both domains. It addresses
areas of further research identified in existing IS literature and informs practitioners on
how better to enable the IT function for this important capability. This reconciliation
contributes to the relevancy of IS research to practice that has long been an issue in the
academic community (Rosemann and Vessey 2008).
The conceptual and empirical study of this thesis took a soft positivist stance. This
stance holds that objective reality exists beyond the human mind and, through our
perceptions of that reality, is inextricably bound to the stream of activity that humans
enact (Kirsch 2004; Seddon and Scheepers 2006). The quantitative research method
with psychometric measures taken by this thesis reflects this positivist stance.

Introduction
7
1.4. A research question with two perspectives
This thesis addressed a single research question from both the IS theoretical perspective
and the IS practice perspective. First, this thesis extends the IS theoretical literature to
pose the question:
How can the IT function enable agility in existing information systems?
The above is not to be confused with the question: Does the IT function enable agility in
existing information systems? The later is the subject of existing discussion in the IS
research literature and an answer in the affirmative was an assumption of this thesis.
To address the research question from the IS theoretical perspective, this thesis
developed a theory for explaining and predicting (cf. Gregor 2006). Cybernetics
provided a meta-level model for the explanative theory developed by this thesis that
answers the research question. Testable hypotheses support the developed theory and a
prediction that agility arises from process maturity in the IT function.
To address the research question from the IS practice perspective, this thesis developed
a theory for design and action (cf. Gregor 2006). In answering the research question,
this thesis sought to inform IS industry ‘best practice’ frameworks on designing the IT
function that enables agility. In essence, an answer to the theoretical how question can
open doors to improve prescriptive meta-requirements in many organizations.
1.5. Organization of this thesis
This chapter described the relevancy to this thesis and outlined practical and theoretical
issues that motivated the research activities performed. The remainder of this thesis is
concerned with identifying and evaluating a structure for the IT function to enable
agility in existing information systems.
• Chapter 2 outlines the research gaps addressed by this thesis, which arise from
the existing IS theoretical and practice perspectives on agility. Chapter 2

Chapter 1
8
includes a literature review that models existing research into types of IS theory
and formulates a basic model of agility from IS theory.
• Chapter 3 develops theory and propositions, focusing on bridging the research
gaps described in Chapter 2. Together, Chapters 2 and 3 describe the conceptual
component of this thesis from research-based and practice-based perspectives.
• Chapter 4 summarizes the design of the empirical research and hypotheses
testing activities. The aim of the research design was to provide an opportunity
to falsify the propositions and produce findings that generalize to settings other
than the survey samples.
• Chapter 5 describes a qualitative applicability check of the propositions of the
theoretical development with an Australian IT consultancy. The applicability
check used a cohort of consultants and their insights on a wide client base.
Further propositions were developed.
• Chapter 6 develops constructs from the propositions of theoretical development
and the applicability check. The chapter forms the constructs into variables of
hypotheses suitable for quantitative testing and discusses their measurement.
• Chapter 7 describes the materials and procedures used in the two data collections
undertaken. The first data collection was a mailed survey of the clients of an
Australian IT consultancy and the second data collection was an international,
web-based survey of professional discussion groups.
• Chapter 8 is a descriptive snapshot of organizations with regard to IT function
process maturity, agility activities, business knowledge of personnel and
organizational benefits. The snapshot spanned from September 2008 to January
2009 and is of 70 organizations in several countries.
• Chapter 9 describes the quantitative data analysis of the major findings of the
thesis. The chapter provides the maximum opportunity to falsify the research
hypotheses, set the foundations for later transferability to other settings,

Introduction
9
benchmarks an industry ‘best practice’ framework and projects the likely
increase in agility given an IT investment.
• Chapter 10 describes the quantitative data analysis that might qualify or provide
alternatives to the major findings of Chapter 9. Sources other than the theoretical
development of Chapter 3 suggested the data analysis in Chapter 10. These
sources include a different technique of PLS path modeling, ontological
possibilities and the applicability check with Oakton.
• Chapter 11 discusses the broader insights from the thesis. This includes untested
insights arising from the theoretical development, the generalizations from the
Oakton applicability check and the findings from the survey data analysis.
• Chapter 12 assesses the limitations of this thesis arising from the IS literature
reviewed, challenges to the theoretical development and the assumptions
underlying the data collection and analysis. Admitting to these limitations is
required before generalizing the survey findings to other settings, or accepting
the IS theoretical and practices contributions.
• The concluding Chapter 13 distills the thesis findings into an agility-capability
model that explains and predicts, assesses the contributions of this thesis to IS
research and practice, and identifies areas for further research.

Chapter 1
10

11
Chapter 2. Literature Review
2.1. Introduction
This chapter reviews the current theoretical and practice perspectives on agility in
information systems. The review was informed by the structure suggested by Webster
and Watson (2002), resulting in it being concept-centric with augmentation by theory
types (Gregor 2006). The key concepts that delineated the review boundaries are those
in Table 1-1. The review attempted to reveal the patterns in the literature without
critique at this stage.
First, the IS literature on agility was reviewed to derive the current theoretical
perspective. To extract the key contributions to the topic of agility, the review included
IS journal papers, papers from non-IS journals, conference proceedings and book
sections. This was followed by modeling the reviewed IS literature into a taxonomy of
theory to assess how far the theoretical perspective extends. Second, the current IS
practice perspective for the IT function to action agility was derived from best practice
frameworks and published practitioner advice. The chapter concludes by identifying the
gaps between theoretical and practice perspectives on agility.
2.2. Theoretical perspectives on IS agility
Agility of information systems and its effect on organizational performance, has
received recent attention in IS research (Piccoli and Ives 2005; Sambamurthy et al.
2003; Weill et al. 2002). The following reviews are the contributions from the
theoretical perspective where the level of analysis is the IT function of the organization.
The literature review searched IS journals and conference proceedings for papers on IS
agility, as well as journals from other disciplines. After abstracting the found papers
from the viewpoint of the research question, the literature review profiled the papers
into types of IS theory and sculpted a basic conceptual model of agility. The basic

Chapter 2
12
model of agility was used to compare IS theory with current practice perspectives and
as a departure point for the theoretical development of this thesis.
MIS Quarterly Information Systems Research
Journal of Management Information
Systems
European Journal of Information Systems
Information Systems Journal Decision Support Systems
Management Science Decision Sciences
Operations Research Journal of the Association for Information
Systems
Journal of Information Technology Journal of Strategic Information Systems
Information and Management Information Systems
Journal of Human Computer Interaction ACM Communications
Journal of Database Management Information and Organization
Electronic Markets Journal of the ACM
Database Behaviour and Information Technology
International Journal of Electronic
Commerce
Communications of the Association for
Information Systems
Data and Knowledge Engineering Information Systems Frontiers
Information Technology and People Scandinavian Journal of Information
Systems
Journal of the Operational Research
Society
European Journal of Operations Research
Omega Australian Journal of Information
Systems
Computer Journal Information and Software Technology
Journal of End User Computing Journal of Organizational Computing and
Electronic Commerce
Journal of Systems and Software Journal of Global Information Technology
Business Intelligence Journal Asia-Pacific Management Review
Journal of Knowledge Management
Theory and Practice
Journal of Decision Systems
International Journal of Data
Warehousing and Mining
Information Resource Management
Journal
Table 2-1 Reviewed IS journals

Literature Review
13
2.2.1. Review of IS journal papers on agility
The review of IS journal papers was based on a ISI Web of Knowledge search for
“Agility” in the titles, abstracts or key words of papers published in the journals listed in
Table 2-1. The Monash University Information Technology Journal and Conference
Ranking Lists1 sourced the list of IS journal titles. An ISI Web of Knowledge search
conducted on 22 March 2009 found 36 papers meeting the search criteria for all
publication dates. Table 2-2 indicates an emerging IS research interest in agility over the
past ten years, with a special edition of the European Journal of Information Systems
(volume 15 issue 2) causing a spike in 2006.
The affiliated institutions of the first authors of the papers indicated the United States
(51%) and Europe (42%) lead the IS research interest in agility, with the remainder of
the first authors having an Asian-Pacific affiliations.
Publication year No. of papers Percentage of papers
2008 8 22.22%
2007 4 11.11%
2006 11 30.56%
2005 4 11.11%
2004 3 8.33%
2003 1 2.78%
2002 2 5.56%
1999 2 5.56%
1998 1 2.78%
Table 2-2 Profile of 36 publications on agility in IS journals
A reading of the returned papers eliminated from the literature review 21 papers with a
level of analysis other than the IT function of the enterprise. The eliminated IS papers
are mostly concerned with agile software development, a particular software
technology, or associated with agile manufacturing. Table 2-3 lists the remaining 15
papers with a level of analysis of the IT function, in descending chronological order.
1 http://www.infotech.monash.edu.au/research/internal-info/ranking-list/index.html
Chapter 2
14
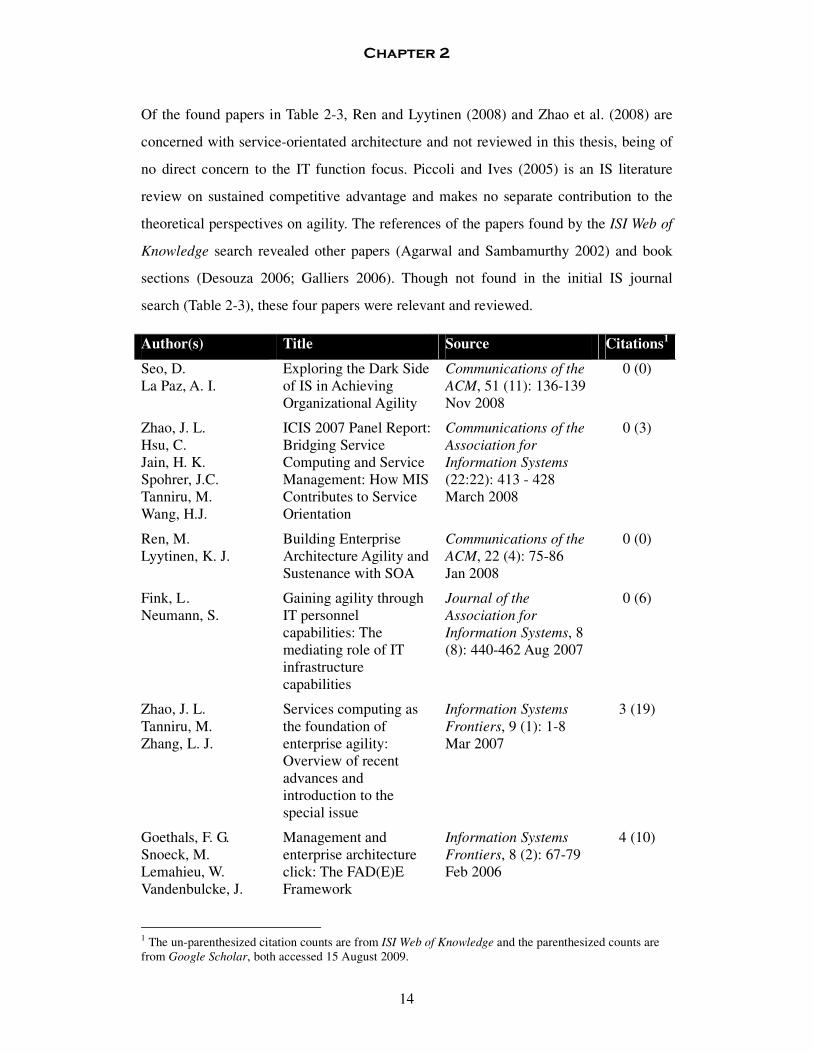
Of the found papers in Table 2-3, Ren and Lyytinen (2008) and Zhao et al. (2008) are
concerned with service-orientated architecture and not reviewed in this thesis, being of
no direct concern to the IT function focus. Piccoli and Ives (2005) is an IS literature
review on sustained competitive advantage and makes no separate contribution to the
theoretical perspectives on agility. The references of the papers found by the ISI Web of
Knowledge search revealed other papers (Agarwal and Sambamurthy 2002) and book
sections (Desouza 2006; Galliers 2006). Though not found in the initial IS journal
search (Table 2-3), these four papers were relevant and reviewed.
Author(s) Title Source Citations1
Seo, D. La Paz, A. I.
Exploring the Dark Side of IS in Achieving Organizational Agility
Communications of the
ACM, 51 (11): 136-139 Nov 2008
0 (0)
Zhao, J. L. Hsu, C. Jain, H. K. Spohrer, J.C. Tanniru, M. Wang, H.J.
ICIS 2007 Panel Report: Bridging Service Computing and Service Management: How MIS Contributes to Service Orientation
Communications of the
Association for
Information Systems (22:22): 413 - 428 March 2008
0 (3)
Ren, M. Lyytinen, K. J.
Building Enterprise Architecture Agility and Sustenance with SOA
Communications of the
ACM, 22 (4): 75-86 Jan 2008
0 (0)
Fink, L . Neumann, S.
Gaining agility through IT personnel capabilities: The mediating role of IT infrastructure capabilities
Journal of the
Association for
Information Systems, 8 (8): 440-462 Aug 2007
0 (6)
Zhao, J. L. Tanniru, M. Zhang, L. J.
Services computing as the foundation of enterprise agility: Overview of recent advances and introduction to the special issue
Information Systems
Frontiers, 9 (1): 1-8 Mar 2007
3 (19)
Goethals, F. G. Snoeck, M. Lemahieu, W. Vandenbulcke, J.
Management and enterprise architecture click: The FAD(E)E Framework
Information Systems
Frontiers, 8 (2): 67-79 Feb 2006
4 (10)
1 The un-parenthesized citation counts are from ISI Web of Knowledge and the parenthesized counts are from Google Scholar, both accessed 15 August 2009.

Literature Review
15
Author(s) Title Source Citations1
Mathiassen, L. Pries-Heje, J.
Business agility and diffusion of information technology
European Journal of
Information Systems, 15 (2): 116-119 Apr 2006
2 (5)
Overby, E. Bharadwaj, A. Sambamurthy, V.
Enterprise agility and the enabling role of information technology
European Journal of
Information Systems, 15 (2): 120-131 Apr 2006
8 (24)
Van Oosterhout, M. Waarts, E. van Hillegersberg, J.
Change factors requiring agility and implications for IT
European Journal of
Information Systems, 15 (2): 132-145 Apr 2006
3 (14)
Hovorka, D. S. Larsen, K. R.
Enabling agile adoption practices through network organizations
European Journal of
Information Systems, 15 (2): 159-168 Apr 2006
0 (3)
Lyytinen, K Rose, G. M.
Information system development agility as organizational learning
European Journal of
Information Systems, 15 (2): 183-199 Apr 2006
5 (13)
Piccoli, G. Ives, B.
Review: IT-dependent strategic initiatives and sustained competitive advantage: A review and synthesis of the literature
MIS Quarterly, 29 (4): 747-776 Dec 2005
24 (54)
Umar, A. IT infrastructure to enable next generation enterprises
Information Systems
Frontiers, 7 (3): 217-256 Jul 2005
8 (14)
Sambamurthy, V. Bharadwaj, A. Grover, V.
Shaping agility through digital options: Reconceptualizing the role of information technology in contemporary firms
MIS Quarterly, 27 (2): 237-263 Jun 2003
143 (300)
Andrade, L. F. Fladeiro, J. L.
Agility through coordination
Information Systems, 27 (6): 411-424 Sep 2002
6 (14)
Table 2-3 Key IS journals papers about the IT function enabling agility
The concepts delineated in these papers from IS journals are described in the following
paragraphs of this section. The results contributed to a concept-centric model described
in section 2.2.5 and classified by IS theory types (Gregor 2006) in section 2.2.4 to
determine the extent of the IS theoretical perspective.

Chapter 2
16
Andrade and Fladeiro (2002) propose co-ordination technologies for existing
information systems that directly act upon components to create new configurations
while mutually exhibiting their structure explicitly to IT personnel. Though the level of
analysis is the IT artifact, the co-ordination technologies enable agile responses from the
existing information systems from new architectural representations made by the IT
function.
Agarwal and Sambamurthy (2002) discuss a number of organizational structures for the
IT function observed in agile enterprises. Agarwal and Sambamurthy emphasize
drawing IT managerial responsibilities into alignment with core business units, as
appropriate for the role of IT in a particular firm, and an analysis that IT now plays a
more prominent role in corporate agility.
Weill et al. (2002) quantitatively studied business initiatives for top-performing
companies. The paper defines agility as a set of business initiatives an organization can
readily implement. While making no claims of causality, the paper finds significant
correlation between strategic agility and IT-infrastructure capability.
Sambamurthy et al. (2003) suggest firms assess their IT investments and capabilities in
terms of their quality to generate digital options for IT-enabled business process and
knowledge management initiatives. Digital options resemble the financial instruments
where there is a portfolio of rights to future investments without an obligation for full
investment. Informed by strategic foresight and systemic insight, the IT function makes
an initial IT investment, which remains open until an opportunity arrives, at which time
the IT function makes the remaining IT investment to capture the opportunity. This is a
development of the Weill et al. (2002) concept of a set of business initiatives that can be
readily implemented. The implication of Sambamurthy et al. (2003) is that digital
options enables agility in information systems by responding to an opportunity in less
time than making a full IT investment at the time of the opportunity’s arrival. The cost
of the anticipated opportunity failing to arrive is forgoing the initial IT investment in the
digital option. A goal of a portfolio of digital options is that the value of opportunities
captured from those options that ‘strike’ outweighs the other options that are ‘out of the
money’.

Literature Review
17
Peppard and Ward (2004) discuss a new era of information systems where an
organization’s performance significantly depends on an IS capability to effect agility
and is less dependent on identifying strategic IT investments. This IS capability can be
portrayed as having three inter-related competencies. First, are the ‘exploitation’
competencies of the IT function arising from the fusion of business knowledge and IS
knowledge. This fusion is possible with a structure of competencies that need not
correspond to an organizational hierarchy. The second competencies are the reusable IT
infrastructure, on which to platform information systems. An appreciation by the IT
function of the degree of permanence attached to the IT infrastructure influences future
options and speed of response. The last competencies of an IS capability for agility is an
effective use process. This is a process of the IT function monitoring and improving the
value realized from the existing information systems.
Umar (2005) takes a narrower definition of agility than that of this thesis, i.e.
responding to business needs in drastically compressed schedules to address unforeseen
circumstances. Agility is one of six dimensions for IT infrastructures identified for next
generation enterprises. Umar counts towards this agility: business intelligence
technologies, middleware, wireless and wired networks, adaptive component
architectures and IT services management that is competent in rapid reconfigurations.
Umar’s dimensions of IT infrastructure does not address business environment sensing
as part of the wider definition of IS agility.
Lyytinen and Rose (2006) studied organizations whose primary activity is information
systems development (ISD) for other organizations. Their case studies include e-
business consultancies, application service providers and system integrators. IT
innovation is the focus of the product development life cycle for the whole organization,
and not limited to the IT function servicing business units. ISD organizations exist in a
fluctuating business with constant innovation in base technologies and customers
demanding solutions. Lyytinen and Rose propose early exploration and late exploitation
capabilities as central for an agility model for the ISD product life cycle. The case
studies of seven USA and Finnish ISD firms support two findings. First, sensing
fluctuations in the business environment requires an early exploration capability and has

Chapter 2
18
process goals that allow high speed, risk and start-up costs. Second, the late exploitation
capability to adapt existing information systems has process goals to reduce cost and
risk and to increase quality. The paper informs practice in ISD organizations that
organizational learning should trade-off a different set of process goals based on where
the organization is at in an exploration/exploitation product life cycle. The paper’s
contribution to IS literature is a model of ISD agility concerned with how ISD
organizations sense and respond swiftly to develop and exploit information systems.
There are no prescriptions of how organizational learning can achieve these process
goals.
The case study of Hovorka and Larsen (2006) is of the voluntary adoption of a large-
scale IT system by two decentralized, network organizations of criminal probation
offices within New York State. The analysis is user adoption of a given information
system at organizational level and not that of the IT function leveraging information
systems in a response to environment perturbations, thus not directly relevant to the
topic of this thesis. The case study includes an Agile Adoption Practices Model, based
on a dynamic of the social information processed by voluntary adopters and a set of
organizational abilities to manage knowledge. The model does not explicitly extend to a
process of the IT function sensing current use by voluntary adopters to improve the
value realized from the existing information systems, but informs on the need for this IT
function practice.
Overby et al. (2006) defines as ‘agile’ those firms that adapt efficiently and effectively
to rapidly changing environments. The ability to sense changes in competition,
customer demands, regulation and technological advancements; and to respond readily
becomes an important determinant of a firm’s success. Agile firms continually sense
opportunities for competitive action in their environment and marshal their assets to
seize opportunities. Overby et al. further supports the concept of digital options and
classifies types of options for business process and knowledge management initiatives.
These authors suggest that enterprise agility is not directly measureable, but acts as an
index of many capabilities. Specifically, many environmental sensing capabilities and

Literature Review
19
responding capabilities are individually measured and the indicators combined to create
an index of enterprise agility.
Desouza (2006) prefaces a text of agile software techniques and case studies. Desouza
considers a perspective that the concept of agile organizations and agile information
systems signify the same thing. As information is the basis of an organization, agile
information systems denote an agile organization. Desouza also considers agile
information systems as distinct instantiations of technological solutions, which are
increasingly the product of newer agile software engineering methods and involve the
customer into rapid design cycles. Organizationally, information systems are subject to
less long-term planning strategies and more to constant adjustment and realignment.
The organization must have viable information management, which uses signals both
from within and outside to make sense of the environment, identify opportunities and to
take action.
Galliers (2006) discusses a strategizing framework for agile information systems, which
takes into account the dynamic nature of the environment through the assessment of
many future information scenarios and the assessment of unexpected consequences
experienced in existing activity. Galliers puts forward that deliberate alignment of
information systems with a stated business strategy has had limited success to foresee
the future. The framework for agile information systems pairs deliberate business
strategy alignment with emergent strategizing to respond to an unpredictable
environment.
Van Oosterhout et al. (2006) offer a model for studying agility which is composed of
three elements. The first element is external and internal change factors that influence
the required level of business agility. Second is business, organizational and cultural
factors that either enable or disable agility. Information technology is one such factor.
Last, the recognition that agility gaps arise when a firm has difficulty in meeting the
required level of business agility, due to the presence of a disabling agility factor.
Causes of information technology becoming a disabler of business agility are inflexible
legacy systems and out-dated architectures.

Chapter 2
20
Mathiassen and Pries-Heje (2006), in the editorial for the special edition on agility of
the European Journal of Information System, recognize that literature which links
business agility and the diffusion of IT is sparse. The definition of agility for the special
edition is set as the ability to quickly deliver IT-based services and quickly adapt to
changing requirements into organizational contexts. The timeliness of the edition is that
enterprise agility holds the promise for survival and success in today’s business
environment, recognition of developing IT solutions for rapidly changing business
environments, and that traditional IT diffusion consumes time and effort at scale that
causes IT projects to fail.
Goethals et al. (2006) give an overview of how organizations can create enterprise
architectures. A justification for enterprise architectures is that the availability of
architectural descriptions enhances agility. The claim is that the architectural
descriptions assist in the understanding of existing information systems. Such
descriptions help in handling complexity as they attenuate information that is not
relevant. The underlying idea is that decision makers only require the requisite
information in the architectural descriptions to enable decision-making for the
adaptation of IT enabled business initiatives. Goethals et al. justification for enterprise
architectures is a retelling of the Law of Requisite Variety in the context of the IT
function, namely a model can be less complex than the operating process, but must be
of requisite variety to control the process (Conant and Ashby 1970). The framework of
the architectural development of the enterprise includes an “as is” description of the
existing information systems and “to be” descriptions for forecasted states. A deduction
from reading the paper is that an organization may create many “to be” architectural
descriptions before deciding to actualize a forecasted state.
Zhao et al. (2007) see the goal of web services technologies is to create the necessary
technological and managerial foundation to support enterprise agility. They subscribe to
the Gartner definition of enterprise agility as the ability of an organization to sense
environmental change and respond efficiently and effectively to that change. Zhao et al.
note the impediment of existing information systems to an organization’s ability to
respond to environmental changes, e.g. architectures that have many point-to-point

Literature Review
21
fixed interfaces integrate many applications and limit the range of responses available to
an organization to adjust its processes. Web services allow an effective technological
response given the inter- and intra-organizational processes. Zhao et al. propose
cybernetics as the managerial link with the organization and the web services
technological responses. The focus is on green-field implementations of web service
technologies and not on the leveraging of existing information systems (the focus of this
thesis).
Fink and Neumann (2007) found empirical support for the proposition that existing
information systems must be managed by the IT function for agility. They tested the
hypotheses that IT personnel capabilities positively affect IT infrastructure capability
and that IT infrastructure capability positively affect IT-dependent organizational agility
outcomes. A web-based survey collected data from IT managers across a range of
industries. Fink and Neumann suggest future research to identify the mechanisms to
explain the findings that shared IT personnel and IT infrastructure capabilities afford
agility.
Seo and La Paz (2008) recognize the ability of IT personnel to sense signals in their
internal and external environments and make sense of trends that affect information
systems. Responding is an organizational pro-action and re-action to the signals sensed.
Seo and La Paz emphasize the importance of an organizational structure that provides
IT personnel with well-established instruments to sense, process and respond to signals.
The paper discusses system component standardization, agile traits in managers and
buying, leasing or outsourcing IT in the context of how to do agility in information
systems.
As the citation counts of the papers in Table 2-3 show, Sambamurthy et al. (2003) had
the most impact with 300 citations on Google Scholar; whereas, after Piccoli and Ives
(2005) literature review, the remaining papers do not have a citation count above 24.
The Sambamurthy et al. (2003) concept of digital options was influential in the
theoretical development of this thesis.

Chapter 2
22
2.2.2. Review of IS agility papers in other journals
A supplementary ISI Web of Knowledge search was conducted with the criteria of
“Agility” and “Information Systems” in the title, abstract or key words of papers of all
journals other than those IS journals in listed in Table 2-1. This search across all
publication dates revealed 17 papers, which included papers from the biological
sciences (2) and supply chain (6) literature. Table 2-4 lists the remaining nine papers of
interest.
Of these nine papers, six papers are concerned with a specific technology (Laxton 2000;
Roh et al. 2006) or information systems specifically for agile manufacturing (Coronado
2003; Coronado et al. 2002; Mondragon et al. 2004; Reich et al. 1999) and are not of
direct concern to the IT function focus in this thesis. The remainder of this section
described the concepts delineated in the remaining three papers from non-IS journals.
The results contributed to a concept-centric model described in section 2.2.5 and
classified by IS theory types (Gregor 2006) in section 2.2.4 to determine the extent of
the IS theoretical perspective.
Osborn (1998) identifies an agility paradox where organizations in competitive
environments must have a structure that is flexible to quickly respond to external
threats, but stable enough to grow from existing strengths. Obsorn suggests that the
interactions of strategy, controls and systems imply an organization can combine
competitive flexibility and structural stability to resolve the agility paradox. Obsorn
makes an analytic argument that structure and control in the organization enables
agility.

Literature Review
23
Author(s) Title Source Citations1
Roh, S. Park, M. Lee, H. et al.
A conceptual model of web service-based construction information system
Lecture Notes in
Artificial Intelligence, 4200: 597-605 2006
0 (2)
Bajgoric, N Information systems for e-business continuance: a systems approach
Kybernetes, 35 (5-6): 632-652 2006
0 (4)
Mondragon, A. E. C. Lyons, A. C. Kehoe, D. F.
Assessing the value of information systems in supporting agility in high-tech manufacturing enterprises
International Journal of
Operations &
Production
Management, 24 (11-12): 1219-1246 2004
6 (11)
Coronado, A. E. A framework to enhance manufacturing agility using information systems in SMEs
Industrial Management
& Data Systems, 103 (5-6): 310-323 2003
4 (5)
Reddy, S. B. Reddy, R.
Competitive agility and the challenge of legacy information systems
Industrial Management
& Data Systems, 102 (1-2): 5-16 2002
9 (19)
Coronado, A. E. Sarhadi, M. Millar, C.
Defining a framework for information systems requirements for agile manufacturing
International Journal of
Production Economics, 75 (1-2): 57-68 Jan 10 2002
8 (15)
Laxton, R. The World Wide Web as neural net - Implications for market-driven Web enabling
Technological
Forecasting And Social
Change, 64 (1): 55-70 May 2000
0 (2)
Reich, Y. Konda, S. Subrahmanian, E. et al.
Building agility for developing agile design information systems
Research in
Engineering Design-
Theory Applications
And Concurrent
Engineering, 11 (2): 67-83 1999
19 (15)
Osborn, C. S. Systems for sustainable organizations: Emergent strategies, interactive controls and semi-formal information
Journal of Management
Studies, 35 (4): 481-509 Jul 1998
4 (28)
Table 2-4 Papers on Agility and Information Systems from non-IS journals
1 The un-parenthesized citation counts are from ISI Web of Knowledge and the parenthesized citation counts are from Google Scholar, both accessed 15 August 2009.

Chapter 2
24
Reddy and Reddy (2002) address how to leverage legacy information systems in a
turbulent business environment, using case study evidence. The paper justifies
migrating legacy systems from a monolithic architecture to a tiered architecture of
database/business rules/application logic/user interface layers. The first justification is
increased flexibility when there is a need to adapt within one tier of the architecture.
Second, a tiered architecture of existing systems lends itself to macro-level blueprinting,
which is an effective communication tool between managers of the IT function and the
business units. As threats and opportunities arise from the business environment, this
improved communication enables agile responses to adapt existing information system.
Bajgoric (2006) does not define business agility as a distinct concept or a goal, but as an
attribute of a range of e-business technologies. The basic agility elements in IS
literature, such as sensing and responding, are not mentioned. Instead, the paper begins
with Churchman’s elements that define a system, referencing the Operational Research
and Management Science literature, and equates some of those elements to hardware
and software technologies that serve them. The paper’s key concern is IT service
continuance more than agility to deal with fluctuations in the business environments. A
claim of the paper is a technical infrastructure for e-business informed by general
systems theory. The discussion of the IT function is e-business design and service
management, enabled by technologies that have an attribute of agility.
Of the three papers considered from the search of non-IS journals, the Osborn (1998)
paper on the agility paradox had the most impact with 28 citations on Google Scholar.
2.2.3. Review of IS conference papers on agility
Conference proceedings provide an outlet for the most up-to-date research that has been
peer reviewed. A review of the latest IS conferences was based on an AIS electronic
library search for “Agility” in the title, abstract or key words of conference papers since
2003. That year saw the publication of the well-cited Sambamurthy et al. (2003) and an
increase of the published IS journal articles. Table 2-5 lists 12 full research papers from
the search of IS conference proceedings that are substantially about agility and do not
just briefly mention the capability.

Literature Review
25
Author(s) Title Proceedings
Hobbs, G. A. Scheepers, R.
Identifying Capabilities for the IT Function to Create Agility in Information Systems
PACIS 2009
Abraham, C. Junglas, I. Willis, M.
Enabling an Agile Information Supply Chain in Service Oriented Architectures with Web Services
AMCIS 2008
Nazir, S. Pinsonneault, A.
The Role of Information Technology in Firm Agility: An Electronic Integration Perspective
AMCIS 2008
Sambamurthy, V. Wei, K. K. Lim, K. Lee, D.
IT-Enabled Organizational Agility and Firms' Sustainable Competitive Advantage
ICIS 2007
Cornford, T. Venters, W. Zheng, Y.
Agility, Improvisation, or Enacted Emergence ICIS 2007
Seo, D. Desouza, K. Erickson, J.
Opening up the Black-Box: Information Systems and Organizational Agility
AMCIS 2006
Raschke, R.L. David, J.S.
Business Process Agility AMCIS 2005
Berente, N. ERP and Innovation in Schumpeterian Market Dynamics
AMCIS 2005
Ngo-Ye, L. Ahsan, M.
Enterprise IT Application Systems Agility and Organizational Agility
AMCIS 2005
Ahsan, M. Ngo-Ye, L.
The Relationship Between IT Infrastructure and Strategic Agility in Organizations
AMCIS 2005
Baskerville et al. Extensible Architectures: The Strategic Value of Service Oriented Architecture in Banking
ECIS 2005
Patten, K. Whitworth, B. Fjermestad, J. Mahindra, E.
Leading IT Flexibility: Anticipation, Agility and Adaptability
AMCIS 2005
Table 2-5 AIS conference papers on agility since 2003
Two papers are concerned with agile responses using service-orientated architecture
(Abraham et al. 2008; Baskerville et al. 2005) and not of direct concern to the IT

Chapter 2
26
function, which is the focus of this thesis. The remainder of this section described the
concepts delineated in the remaining ten conference papers.
Patten et al. (2005) define agility in the second tier of a hierarchical construct of
flexibility. Agility is the ability to respond to change in order to profit in a turbulent
business environment. The anticipation of change, giving time to prepare through
forecasting and planning, precedes agility; and adaptability is the ease to change the
information system to accommodate environmental change. Though the paper has a
narrower definition of agility than that of this thesis, the elements of the hierarchical
construct of flexibility is consistent with the dominant concepts of agility found in the IS
literature (Sambamurthy et al. 2003). Patten et al. (2005) definition of anticipation
equates to the basic model sensing and forming digital options, agility is the decision-
making to exercise a digital option and adaptability is responding with changes to
information systems in a timeframe considered agile.
Ahsan and Ngo-Ye (2005) concentrates on the technical infrastructure of hardware,
systems software, communications technologies, data and core applications, and non
human infrastructure of the IT function. They propose a parametric 0-80 scale to
correlate technical infrastructure agility with organizational agility outcomes and a pilot
survey to test the scale. Though the paper’s emphasis is not the IT function of this
thesis, it informs research method design in IS agility. The paper does not discuss the
suitability of a very granular, parametric scale for psychometric responses elicited in a
questionnaire of individuals’ perceptions. The paper’s scale stands in contrast to that
adopted by this thesis, which used five and six point ordinal scales for psychometric
measurement. Ngo-Ye and Ahsan (2005) is a similar paper proposing the study design
after literature review.
Berente (2005) focuses on ERPs that integrate corporate finances and centralize
resource planning, and cautions how ERPs moderate the responding element of agility.
Drawing on Sambamurthy et al. (2003) and focusing on firm-wide agility, creating agile
responses will be moderated if ERP are configured without local knowledge, consume
large amounts of IT investment capital, routinize work processes without any flexibility,
and reward employees for procedural compliance. These factors reduce the creation of

Literature Review
27
digital options for agile responses. Berente cautions that ERPs moderating agile
responses leaves open the possibility of ERPs amplifying the responses, if the ERP
implementation emancipates entrepreneurial creation in the firm. The paper does not
include prescriptions on how an ERP implementation can emancipate creation of agile
responses.
Raschke and David (2005) present a conceptual paper taking an number of points from
the IS literature, and plan a qualitative field study on business process agility based on a
model of Sambamurthy et al. (2003). The paper recognizes the need for measures for
agility.
Seo et al. (2006) highlight basic elements of IS agility and the six threats to those
elements. First, channels overloaded with noise, multiple sources and existing
information systems that attenuate signals that threaten the sensing of the requisite
information from the environment. Second, different data formats or incompatible
communication systems threaten the processing of sensed signals. Third, business
decision-making for the appropriate response, based on processing sensed information
from the environment, does not have optimized processes. As the decisions are large IT
investments, the decisions must be equally agile. Fourth, a threat to adapting existing
information systems is from IT architectures not open to new external connections and
closeted by an organizational view of static systems in maintenance. Fifth, existing
information systems viewed as static threatens organizational learning as it diminishes
the opportunity to discuss improved work processes. The last threat to IS agility
encompasses the preceding four threats: IT competencies for change of information
systems must be aware of agility and not lock-in yesterday’s work processes. Seo et al.
suggest further research should isolate the key dimensions of information systems that
either support or inhibit agility and the examining of actions of the IT function to enable
agility.
Cornford et al. (2007) is a case study of agile systems development for CERN grid
computing. Though the paper has an IT project focus and not the normative IT function
focus of this thesis, it raises ontological questions against conventional planning in a
disorderly world. Following Weick’s embodiment of action and creation into enactment,

Chapter 2
28
these authors suggests that organizations construct the environment before they respond
to it, and this is a process of sense making. In a turbulent environment, a highly
pragmatic and improvisational approach is required for new systems development, in
preference to conventional planning. The case study is necessarily silent on leveraging
existing information systems.
Sambamurthy et al. (2007) conceptually and empirically addresses how specific IT
investments can enable organizational agility and its impact on sustained competitive
advantage. The hypotheses look at the combination of the IT function and information
systems complementing non-IT factors to enable organizational agility and
organizational agility effect on sustained competitive advantage. An interview-based
survey of 178 Chinese firms, in a snapshot of 7 months in late 2006, mostly supported
the hypotheses. The paper’s focus is organizational determinants of IT factors
complementing non-IT factors to enable organizational agility. This is dissimilar to the
narrower focus of this thesis, which has an organizational determinant of the IT function
enabling agility in information systems.
Nazir and Pinsonneault (2008) list hypotheses to link IT infrastructure with sensing and
responding that enable agility in the firm. The electronic integration within the primary
and secondary activities of the firm, and the electronic integration of the primary
activities into distribution/sales and the supply chain, leads to firm-wide agility through
knowledge integration and growing competencies in the firm’s primary activities. The
hypotheses are not empirically tested. Nazir and Pinsonneault’s focus is a technological
determinant of the IT infrastructure to enable firm-wide agility. In contrast, this thesis
adopted an organizational focus in exploring the IT function’s enablement of agility in
existing information systems.
Hobbs and Scheepers (2009) is a paper from the theory development and empirical
study of this thesis, and not considered in this literature review. No citation count was
included in Table 2-5 of the IS conference papers. Any impact analysis based on citation
counts is premature, as the earliest paper only dates back to the European Conference
on Information Systems held in May 2005, and half the conference papers date as
recently as the Americas Conference on Information Systems held in August 2006.

Literature Review
29
2.2.4. Agility and types of IS theory
Gregor (2006) provides a taxonomy of five IS theory types. This taxonomy was used to
assess the theoretical reach of the IS literature on agility. The first type is theory for
analyzing, which describes concepts but does not specify causal relationships or make
predictions. The second type is theory for explaining that specifies causal relationships,
but does not intend to predict with any accuracy and has no testable propositions. The
third type is theory for predicting that provides testable propositions but does not have
well-justified causal explanations. The fourth type is theory for explaining and
predicting, which has testable propositions and causal explanations. Last is theory for
design and action that has explicit prescriptions to construct an IT artifact.
Gregor (2006) draws interrelationships on how these theory types inform each other and
notes that theories of analyzing are needed to develop the other theory types by
providing clear definition of constructs. Gregor emphasizes that theories for design and
action have a strong interrelation with theories for explaining and predicting but are
developable, without such theory, based on what has worked in practice.
Figure 2-6 reports on the classification of the reviewed IS literature on agility into the
taxonomy of the five IS theory types. A justification for reviewed papers typed as
theories of analysing in the IS literature on agility is in Table 2-7. Some of these papers
are arguably theories for explaining, based on varying claims of moderate predictive
accuracy. Similarly, papers typed as theories for explaining are in Table 2-8. According
to Gregor (2006), these papers of this type cannot claim to be theories for explaining
and predicting, as they contain no testable propositions.

Chapter 2
30
Figure 2-6 Types of IS theory on agility (after Gregor 2006)
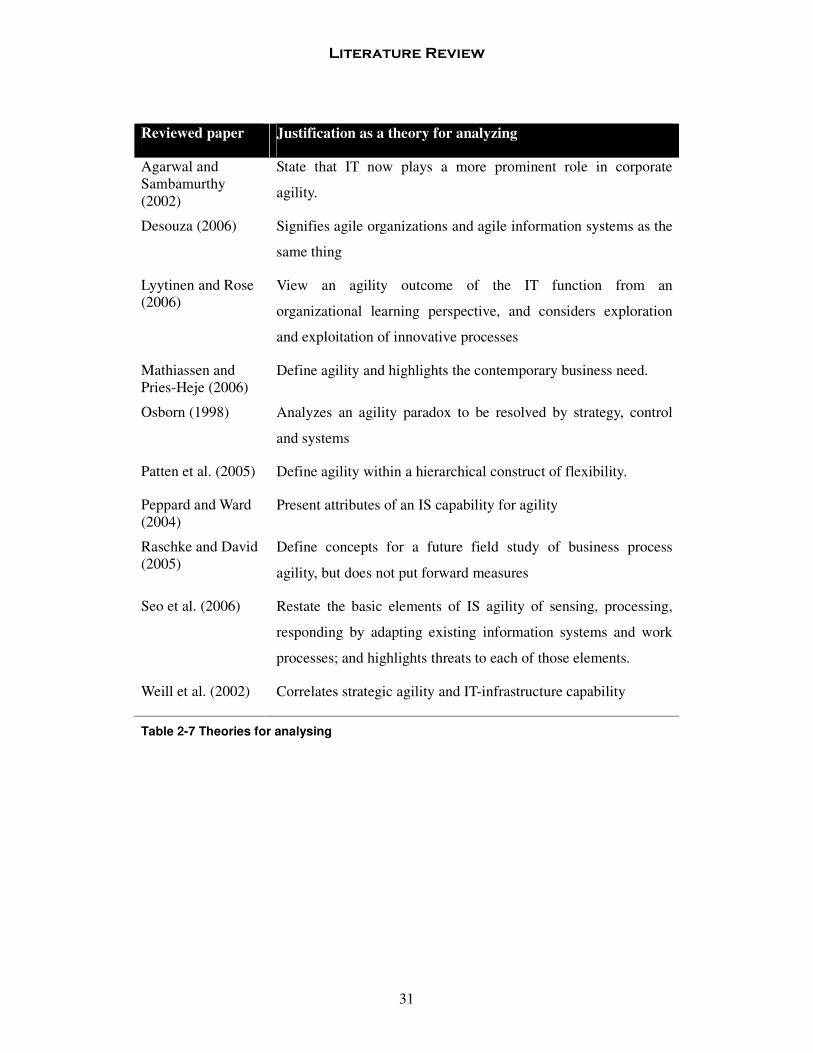
Literature Review
31
Reviewed paper Justification as a theory for analyzing
Agarwal and Sambamurthy (2002)
State that IT now plays a more prominent role in corporate
agility.
Desouza (2006) Signifies agile organizations and agile information systems as the
same thing
Lyytinen and Rose (2006)
View an agility outcome of the IT function from an
organizational learning perspective, and considers exploration
and exploitation of innovative processes
Mathiassen and Pries-Heje (2006)
Define agility and highlights the contemporary business need.
Osborn (1998) Analyzes an agility paradox to be resolved by strategy, control
and systems
Patten et al. (2005) Define agility within a hierarchical construct of flexibility.
Peppard and Ward (2004)
Present attributes of an IS capability for agility
Raschke and David (2005)
Define concepts for a future field study of business process
agility, but does not put forward measures
Seo et al. (2006) Restate the basic elements of IS agility of sensing, processing,
responding by adapting existing information systems and work
processes; and highlights threats to each of those elements.
Weill et al. (2002) Correlates strategic agility and IT-infrastructure capability
Table 2-7 Theories for analysing

Chapter 2
32
Reviewed paper Justification as a theory for explaining
Ahsan and Ngo-Ye (2005)
Plan a qualitative study to correlate IT infrastructure to
organizational agility, but makes no prediction on the fit.
Cornford et al. (2007)
Recommend the need for organizations to construct internally
the environment before responding to it as part of the sense
making process.
Galliers (2006) Suggests a strategizing framework for agile information systems
Lyytinen and Rose (2006)
Explain that early exploration and late exploitation for IS
development firms, and the different goals these competencies
demand.
Nazir and Pinsonneault (2008)
List hypotheses to link IT infrastructure with agility sensing and
responding, but the un-operationalized hypotheses are untested
and makes no accurate prediction of correlation.
Overby et al. (2006) Define enterprise agility and explore the underlying capabilities,
explain the enabling role of IT, and propose scoring agility
based on unspecified measures of sensing and responding.
Reddy and Reddy (2002)
Explain the problem of enabling agility in information systems
using an industry case study of legacy systems in older multi-
nationals.
Sambamurthy et al. (2003)
Define IT competencies to enable digital options that afford
agility1 .
Seo and La Paz (2008)
Advance the topic by recommending component
standardization, agile traits in managers, buying, leasing or
outsourcing IT, and organization structure to do agility in
information systems.
Van Oosterhout et al. (2006)
Define the change factors requiring agility, and identifies IT as
both an enabler and inhibitor of agility.
Table 2-8 Theories for explaining
1 Interestingly, Gregor (2006) classifies this paper as a theory for explaining and predicting, even though Sambamurthy et al. (2003) does not have testable propositions nor claims to predict with precision.

Literature Review
33
Fink and Neumann (2007) is the sole instance of presenting an IS theory for predicting
agility without an theoretical explanation. An e-mail based survey of IT professionals
found a large positive correlation between IT personnel capabilities and IT-dependent
organizational agility outcomes, with an intervening variable of IT infrastructure
capabilities. The paper leaves explanatory mechanisms of how IT personnel and IT
infrastructure capabilities afford agility for future research.
Similarly, the review of IS theoretical literature on agility found one paper
(Sambamurthy et al. 2007) with a theory for explaining and predicting. This is unusual
as Gregor’s survey of Management Information Systems Quarterly and Information
Systems Research issues from March 2003 to June 2004 classified 66% of articles as
concerned with theories for explaining and predicting. A well cited example of this type
of IS theory is the Venkatesh et al. (2003) paper on user acceptance of information
technology. The distinguishable attributes of the theory type is that it provides
predictions and has both testable propositions and causal explanations (Gregor 2006).
The recent publication of the IS theories for analyzing and for explaining is a likely
reason for the absence of theories for explaining and predicting agility. Such theories
provide description of theoretical constructs and the relationships among them
necessary to advance theories of explaining and predicting (Gregor 2006). Table 2-2
shows that 81.81% of the IS journal papers on agility, of all theory types, were
published since 2004. This thesis aims to extend the progression of the IS theoretical
perspective to produce an IS theory for explaining and predicting agility.
Gregor (2006) notes that reference disciplines provide a high-level way of thinking
about IS topics of interest and inform the formulation of IS theories of explaining and
predicting. An example relevant to the IS agility requirement to sense and respond to
perturbations in the business environment comes from the discipline of general system
theory. An example is the Law of Requisite Variety (Conant and Ashby 1970), which
puts that every good regulator of a system must be a model of that system at a requisite
variety to enable system’s responses to absorb perturbations.

Chapter 2
34
Reviewed paper Justification as a theory for design and action
Andrade and Fladeiro (2002)
Discuss extending Component-Based Development for
software engineering for agility
Bajgoric (2006) Types a range of e-business technologies with the attribute of
agile responsiveness
Berente (2005) Cautions how ERPs moderate the responding element of
agility.
Bieberstein et al. (2005)
Propose a SOA-paradigm for the IT function to enable
Business/IT alignment and a greater agility outcome.
Börjesson et al. (2006)
Explain agile software change request processes.
Fitzgerald et al.(2006) Case study on agile software practices at Intel.
Goethals et al. (2006) Consider how IT architectures add to sensing for agility by
describing future options.
Holmqvist and Pessi (2006)
A case study of IT agility at Volvo by working with scenario
development
Hovorka and Larsen (2006)
Look at how voluntary users adopt in an agile manner in two
case studies.
Seo and La Paz (2008)
Discuss system component standardization, agile traits in
managers and outsourcing IT in how to do agility in
information systems.
Umar (2005) Describe an IT infrastructure for agility composed of business
intelligence applications, middleware, wireless and other
technologies.
Zhao et al. (2007) Overview of service-orientated computing and enterprise
agility
Table 2-9 Theories for design and action

Literature Review
35
Sambamurthy et al. (2007) is the single example found of an IS theory for explaining
and predicting. The paper has limitations arising from the measurement model. First,
details of the measurement items that reflect the latent variables are not included in the
conference paper. This omission is likely the result of the page limitations of the short
conference paper format. Second, the exogenous variables have only one or two
measurement items and the final endogenous variables have one reflective measure item
each. This measurement model does not meet the rule-of-thumb of at least three
measurement items per construct, which allows the identification of the co-variances
among the measures. It is the co-variances of reflective measurements that identify
latent constructs (Freeze and Raschke 2007). The measurement model of Sambamurthy
et al. (2007) limits statistical inferences made and the target population of Chinese firms
limits generalizations to firms in developed economies.
The remaining of the contributions in IS literature are theories for design and action,
and mostly focus on how the IT function addresses particular agile software methods.
Justification for the reviewed papers typed as theories of design and action in the IS
literature on agility is in Table 2-9. As this thesis focused on the IT function and not
technology, these twelve papers are not of direct concern and not reviewed in detail.
2.2.5. A basic model of agility from IS theory
IS researchers discuss a new era where a firm’s performance depends on the IS
capability to effect agility and less on identifying strategic IT investments (Desouza
2006; Mathiassen and Pries-Heje 2006; Overby et al. 2006; Peppard and Ward 2004;
Sambamurthy et al. 2003; Weill et al. 2002). Four elements of this IS capability can be
discerned from the literature, which become a basic model for agility in existing
information systems. Table 2-10 maps these elements to sources from the IS literature
review on agility and types the theory according to Gregor (2006). This section
continues by modeling the reviewed IS theoretical perspectives into a basic model of IS
agility (Figure 2-11).

Chapter 2
36
Agility concept Article IS Theory type
Sensing future needs Desouza (2006) Analyzing
Lyytinen and Rose (2006) Analyzing Overby et al.(2006) Explaining Patten et al. (2005) Analyzing Sambamurthy et al. (2003) Explaining Seo and La Paz (2008) Design and Action Seo et al. (2006) Explaining
Digital options Cornford et al. (2007) Explaining Goethals et al. (2006) Design and Action Sambamurthy et al. (2003) Explaining Seo et al. (2006) Explaining Overby et al. (2006) Explaining Weill et al. (2002) Analyzing
Sensing current use Galliers (2006) Explaining Peppard and Ward (2004) Analyzing Sambamurthy et al. (2003) Explaining Seo and La Paz (2008) Design and Action
Agile responses Andrade and Fladeiro (2002) Design and Action Bajgoric (2006) Design and Action Berente (2005) Design and Action Bieberstein et al. (2005) Design and Action Börjesson et al. (2006) Design and Action Fitzgerald et al.(2006) Design and Action Holmqvist and Pessi (2006) Design and Action Seo and La Paz (2008) Design and Action Seo et al. (2006) Explaining Umar (2005) Design and Action Zhao et al. (2007) Design and Action
Table 2-10 Concept matrix for agility from IS theory
In the first element of agility, the IT function fuses business and technical knowledge to
sense directly the business environment to forecast opportunities and threats. Many IS
researchers have written on this agility element. Desouza (2006) has agile organizations
using outside signals to make sense of the environment. Lyytinen and Rose (2006)
discuss an exploration of the business environment as a central capability for an agility
model. Overby et al.(2006) describe agile firms as continually sensing opportunities for
competitive action. Patten et al. (2005) discuss the anticipation of change in order to

Literature Review
37
profit in a turbulent environment. Similarly, Sambamurthy et al. (2003) use the concept
of strategic foresight. Seo and La Paz (2008) recognize the sensing of environmental
signals as an agility trait of IT personnel. Seo et al. (2006) note threats to sensing
signals from the environment, such channel overload and incompatible formats.
The second element is sensing the current use of existing information systems, which
indirectly senses the fluctuations in the environment and uncovers future trends. Fewer
of the authors reviewed contribute to this agility element. Peppard and Ward (2004)
discuss an effective use process for existing information systems that improves the IS
capability to effect agility. Sambamurthy et al. (2003) attribute the concept of systemic
insight to the formation of digital options. That existing systems can indirectly sense the
environmental fluctuations is an idea developed by later authors. Galliers (2006) sees
the strategizing for a dynamic environment enabled by assessing unexpected
consequences experienced in existing activity. Seo and La Paz (2008) recognize the
sensing of internal signals to make sense of environmental trends.
Figure 2-11 A basic model for agility from IS theory

Chapter 2
38
Mostly the analyzing and explaining theories of Type I and II support the two sensing
elements of agility. There is less support for these two elements by the theories of
design and action, with the exception of Seo and La Paz (2008) stressing the personality
traits and skills of IT managers for sensing and agility.
Third is generating digital options for forecasted needs. This element includes
constructing a portfolio of digital options, making initial IT investment for each digital
option and deciding to exercise a digital option into a full IT investment once a
forecasted opportunity arrives. This element was articulated by Sambamurthy et al.
(2003) and that work influenced many IS researchers (Berente 2005; Raschke and
David 2005; Sambamurthy et al. 2007). Earlier Weill et al. (2002) expressed this agility
element as a set of business initiatives that can be readily, but not necessarily,
implemented. Overby et al. (2006) support the concept of digital options and classify
them into business process and knowledge management activities. Seo et al. (2006)
define a threat to decision-making to exercise an agile response from processes that are
not optimized. There are few theoretical contributions for the digital options
competency by the design and action theories of Type V. Cornford et al. (2007) and
Goethals et al. (2006) stress the need to construct internally a representation of the
business environment and the use of IT architectural blueprints.
After deciding to exercise a digital option, the last element is adapting the existing
information systems to complete the agile response. IS design and action theories of
Type V dominate this element for agile responses, as they illustrate how particular
software technologies and development methods contribute to adaptability of existing
information systems. Andrade and Fladeiro (2002) propose coordinating technologies
that expose IT structure explicitly for new configurations. Bajgoric (2006) enables
agility with e-business technologies while Berente (2005) focuses on ERPs and
Bieberstein et al. (2005) on service-orientated architecture. To enable agility, Börjesson
et al. (2006) discuss change management, Fitzgerald et al.(2006) software development
practices and Seo and La Paz (2008) component standardization. Umar (2005)
emphasizes IT infrastructures and Zhao et al. (2007) service-orientated computing. Seo
et al. (2006) raise threats to adapting information systems from static IT architectures,

Literature Review
39
which reduces organizational learning and lock-in processes. Given the technological
imperative of this body of literature, it is the most well served element in the basic
agility model.
2.2.6. Summary of IS theoretical perspectives
This review of the IS research on agility revealed a profile of the types of IS theory
published and distilled a basic model of agility in information systems. The review
shows a surge in interest in IS journals since 2006 and continued interest in recent IS
conference submissions. This review has highlighted two deficiencies in the IS
theoretical perspectives.
First, there are no theories for explaining and predicting (cf. Gregor 2006) the basic
model of agility in information systems. The precursors of theories for analyzing and
theories for explaining exist, but a theory for explaining and predicting is yet to emerge.
An exception is Sambamurthy et al. (2007), which has level of analysis of the whole
enterprise, rather than how the IT function enables agility, but is limited by the
measurement model and generalization.
Second, the existing theories for design and action do not equally address all the
element of the basic model of agility in information systems (Table 2-10). Most papers
of this type are concerned with agile responses to adapt information systems. The level
of analysis of these papers is concerned with producing IT artifacts and not the IT
function within an enterprise. Under represented in the IS literature are theories for
design and action concerned with sensing future needs from the business environment
or building a portfolio of digital options. This over-representation of agile responses in
the IS literature probably emerged from the software engineering interest in agile
development methods, which is informed by what works in IS practice and not deduced
from IS theories for analyzing and explaining.

Chapter 2
40
2.3. Practice perspectives on IS agility
A survey by Luftman and McLean (2004) found many IS executives subscribing to a
concept of agility. This concept consists of recognition of a complex business
environment that fluctuates quicker than conventional strategic planning cycles, the
need to sense environmental fluctuations, the need to respond using existing
information system investments, and organizational readiness to affect the sensing and
response. Gartner defines agility “as an organization's ability to sense environmental
change and respond efficiently and effectively to that change” (Newman and Logan
2006b p. 3). This IS practice concept of agility arose from the experience of agile
manufacturing and supply chain management (Holmqvist and Pessi 2006).
2.3.1. COBIT
The IS practice perspective on how the IT function can enable agility has been deduced
from a claimed ‘best practice’ framework. The Control Objectives for Information and
related Technologies (COBIT) is arguably the most appropriate control framework
available to align information systems and business goals, and is increasingly being
used by a diverse range of organizations throughout the world (Ridley et al. 2004). The
claimed best practices of COBIT represents the consensus of experts (IT Governance
Institute 2007) and from the control framework this thesis deduced the dominant design
and action theory for agility from the IS practitioner perspective. This deduction
recognizes that a design and action theory can build on idiographic studies of what has
worked in the past or on known predictive relationships that are not fully understood
(Gregor 2006).
The Information Systems Audit and Control Association (ISACA) and the IT
Governance Institute (ITGI) created the COBIT framework of best practices in 1992.
The COBIT framework consists of 34 high-level control objectives, each with a set of
detailed objectives, key performance indicators, key goal indicators and a maturity
model. COBIT provides managers, auditors and users with a set of accepted measures
and practices to assist them to develop appropriate governance and control in the IT
function (IT Governance Institute 2005).

Literature Review
41
Within the COBIT framework is a goal of creating IT agility. COBIT defines agility as
responding to changing business requirements from the customer perspective and
managing business change from an internal perspective. This definition reflects COBIT
dependence on received business requirements and strategy (IT Governance Institute
2007). A theory to design and action agility is explicit in the COBIT framework control
objectives linked to the goal.
The COBIT goal of Create IT agility (IT Goal 5) links four measurable control
objectives. First, control over the IT process of Define the information architecture
(PO2) enables IT to be agile in responding to business requirements, to provide reliable
and consistent information, and to integrate applications into business processes.
Second, control over the IT process of Define the IT processes, organization and
relationships (PO4) enables IT to be agile in responding to the business strategy, whilst
complying with governance requirements, and providing defined and competent points
of contact.
The last two control objectives linked to the COBIT goal of Create IT agility (IT Goal
5) are of Manage IT human resources (PO7) and Acquire and maintain technology
infrastructure (AI3). These control objectives aim for an infrastructure of the
technology and facilities that enable the processing of the business applications.
2.3.2. ITIL
A de facto standard for guiding organizations to establish IT service management
processes is the IT infrastructure library (ITIL). ITIL promotes the alignment of IT with
the business and defines service quality as the level of alignment between the actual
services delivered and the actual needs of the business (Hill and Turbitt 2006). The
Office of Government Commerce (OGC), a branch of the British Government,
developed ITIL in the 1980s.
ITIL does contain a statement interpretable as the concept of agility used in this thesis.
The statement reads, “Traditionally, IT was viewed as responding to the stated business
requirements – delivering according to pre-stated needs. But with developing IT
Chapter 2
42
maturity and increasing reliance of IS by the business it is now clear that IT has the
opportunity to deliver real business value proactively” (Office of Government
Commerce 2005 p. 218). The ITIL statement suggests elements of Luftman and
McLean’s (2004) definition of agility, which recognizes business environments that
fluctuate quicker than conventional planning cycles and IT organizational maturity to
act, but the statement makes no mention of the need to sense environmental fluctuations
or to respond using existing information systems.
ITIL does not fully elaborate how to deliver IT proactively, that is without pre-stated
business requirements. An ITIL strategic outcome is good IS alignment with the high
level objectives of the business and it this alignment that future IS direction is set
(Office of Government Commerce 2005 p. 218). A critical success factor for IT
alignment with business objectives is tracking of technological developments to identify
opportunities for business and having a clear answer to ‘What if we do nothing?’ before
embarking on a IT-enabled service improvement. The ITIL capability of forecasting is
pursuant to aligning received business objectives, but does not extend to the IS
theoretical perspective for the IT function to sense future needs directly from the
environment to develop digital options (Desouza 2006; Overby et al. 2006;
Sambamurthy et al. 2003).
This view is supported by qualitative case studies of three organizations by Kashanchi
and Toland (2006). Their research found that ITIL supports but does not shape the
business strategy. The ITIL processes enable organizations to differentiate from their
competitors by the quality of IT services delivered to customers, improved delivery of
services and lowing cost to organizations (Kashanchi and Toland 2006). The theoretical
perspectives of IS agility has the IT function generating digital options in response to
forecasted environmental perturbations, which may be exercised by the business, and
pro-actively shaping business strategy.
In summary, the ITIL does not address agility in information systems explicitly. A
textual interpretation of the implicit theory of design and action within ITIL contains
agility elements but bound to IT alignment with stated business objectives. The ITIL

Literature Review
43
practice perspective on IS agility has a gap, which the IS theoretical perspectives can
extend to.
2.3.3. TOGAF
A method and set of supporting resources for developing enterprise architecture is The
Open Group Architecture Framework (TOGAF). The Open Group's architecture forum
endorses TOGAF and claims an industry consensus (The Open Group 2009). Enterprise
architecture is important to enabling ability in existing information systems, as it is that
part of the IT function most likely tasked with creating digital options for agile
responses to forecasted environmental perturbations. As with ITIL but unlike COBIT,
TOGAF does not explicitly address IS agility.
At a point in time, TOGAF future orientation is toward a target architecture and does
not include many optional target architectures, of which not all are exercised. The
architectural development method (ADM), contained in TOGAF, makes no suggestion
of any process for probabilistic modeling and building digital-options, as suggested by
the theoretical perspective on IS agility. A recurring phrase in the text is “the target
architecture” produced through iterations of the ADM in a linear trajectory in time.
The ADM does include a phase of architectural change management for the enterprise
architecture baseline. This process provides for continual monitoring of new
technological developments and fluctuations in the business environment and a formal
decision to respond with another iteration of the ADM. Some technological drivers and
business drivers for architectural change from TOGAF are listed in Table 2-12 (The
Open Group 2009 pp. 112-113). A driver is defined an external or internal condition that
motivates the organization to define its goals and the given example of an external
driver is a change in compliance rules that changes an organization’s operation, such as
the passing of the U.S. Sarbanes-Oxley legislation. TOGAF defines a goal as a high-
level statement of intent or direction for an organization, used to measure success (The
Open Group 2009). TOGAF relies on received change requests from the business and is
unclear whether the IT function recognizes drivers by direct sensing of the environment.

Chapter 2
44
Technological Business
New technology reports Business-as-usual developments
Asset management cost reductions Business exceptions
Technology withdrawals Business innovations
Standards initiatives Business technology innovations
Strategic change
Table 2-12 Architectural drivers (from The Open Group 2009)
TOGAF contains elements that further agility in information systems, such as continual
monitoring of fluctuations in the business and technical environment and stating types
of fluctuations that become architectural drivers (see Table 2-12). Nevertheless, TOGAF
relies on business requests received by the IT function, without direct environmental
sensing, and a single trajectory of change without the digital options from the IS
theoretical perspective. The time horizon of TOGAF is in traditional planning cycles,
discussing target architecture in the distant timeframe of six years and traditional
implementations of two years (The Open Group 2009 pp. 112-113). The time horizon of
the ADM is greater than implied in the concept of IS agility, which recognizes a
business environment that fluctuates quicker than conventional planning cycles
(Luftman and McLean 2004).
2.3.4. Gartner Research
Gartner Inc, a well-known information technology research and advisory company,
reported in 2005 on enterprise information management. The report highlighted
enterprise agility as an important business driver for organizations to sense
environmental change and respond efficiently and effectively. The leveraged use of
technology should readily enable organizations. However, many organizations see their
existing information systems as inhibitors of change (Newman 2005).

Literature Review
45
Figure 2-13 Gartner agility cycle (from Plummer and McCoy 2006a)
Gartner Research defines IT-enabled agility, and discusses implementation and
measurement in a series of twenty research publications in 2006, (McCoy and Plummer
2006). These publications subscribe to the earlier definition of agility of Newman
(2005). At the level of analysis of the IT function, Gartner researchers organize the
elements of the definition into an agility cycle of five steps (see Figure 2-13). The first
step is sensing, where the organization is able to monitor and detect significant changes
in its business environment. Second is to strategize, where the organization is able to
develop alternative potential plans and directives to respond to the change. Third is to
decide which of many alternative plans is the most effective and exercise to strategized
directives. Fourth is to communicate, in a consistent and comprehensive manner, a
proper understanding of the decided directives to relevant personnel. The last step of
Gartner’s agility cycle is to act on the decided directive, responding to business
environment change efficiently and effectively. The description of the agility cycle is a
continuous set of steps and, by implication, not conducted in an episodic progression of
traditional planning cycles. Gartner emphasizes the optimized use of existing
information systems and avoids the more expensive and riskier purchase of new
technologies (Plummer and McCoy 2006a; Plummer and McCoy 2006b).
SENSE
STRATEGIZE
DECIDE
COMMUNICATE
ACT

Chapter 2
46
The steps of the Gartner agility cycle are comparable with elements of the basic model
of agility from IS theory (Table 2-10). Two elements of basic model from IS theory has
the IT function’s fusing business and technical knowledge to sense the environment
directly, and sensing the environment indirectly through the current use of existing
information systems. These elements equate with the first Gartner step to sense changes
in its business environment. The basic model’s generation of digital options for
forecasted needs and deciding to exercising some digital options equates with the
Gartner steps to strategize and decide. The exercising a digital option for an agile
response to existing information systems equates with the Gartner steps to communicate
and act. The basic model for agility from IS theory is a process of the IT function to
improve the value realized from the existing information systems, which is an emphasis
of Gartner’s practitioner perspective.
Comparing the steps of the Gartner agility cycle (Figure 2-13) with the elements of the
basic model of agility from IS theory (Figure 2-11) show varying levels of
conceptualization. The Gartner sense step is a higher level concept than the two basic
model elements of sensing future needs and sensing current use, while the Gartner steps
of communicate and act equate to the single basic model element of agile responses.
Nevertheless, the similarity between the two models supports the relevancy of the basic
model for agility (Figure 2-11) with some reflective practitioners.
2.3.5. IS industry press articles
A number of recent articles from IS newspapers and magazines shed light on emerging
IS practitioner perspectives on agility in information systems. A September 2004 article
in CIO (Schrage 2004) contributes an ontological definition of agility. Schrage sees
agility as timely action to implement, with an implied capability to do so. Commenting
on views expressed at a forum of chief information officers, Schrage warns that agility
should not be mistaken for a workaround of existing constraints, but the logical
exploitation and expansion of capacity in existing information systems.
With respect to the IS theoretic concept of digital options (Sambamurthy et al. 2003), an
ISACA e-mail survey with 386 respondents reported in Computerworld (Schick 2008)

Literature Review
47
suggests that initial IT investments that may not be exercised to full implementation,
exist in practice but without formal definition. Claiming statistical significance at
p<0.05, the survey found that 30% of respondents had discontinued an IT project
because business needs had changed. The Computerworld article considered IT project
discontinuance has a high incidence, and expressed a variety of IS practitioner opinion
on whether the rate is an indicator of project management failure or increased maturity
of the IT function stop-go decision-making. From the IS research perspective of a basic
model of IS agility, the reported discontinuance of information systems adaptations
arises from forecasted fluctuations sensed in the business environment and making
initial IT investments in response; and the consequence of some business opportunities
failing to arrive and no longer warranting full IT investment. As some IS practitioners
view discontinuance as an outcome of mature decision-making, this suggests that
portfolios of digital options exists in practice but without explicit recognition and
standardized processes.
Denning et al. (2008) are IS researchers writing for a practitioner audience. They note
industry cases where development time for IT projects exceeds the environment change
times, causing the information systems to be obsolete before implementation, and
discuss alternatives to conventional planning cycles. An aspect of the Denning et al.
conclusion is an evolutionary approach of the IT function, which embraces risk and
patience to see what opportunity for IT investments emerge. The evolutionary approach
mimics natural selection, where a number of adaptations propagate with only the fittest
achieving a viable existence. Though the article discusses agile software development
techniques, there is call for the IT function to move away from risk adverse
conventional planning of information system adaptations to a position where it is
acceptable for some IT investment initiations to fail to deliver a business return.
2.3.6. Summary of IS practice perspectives
The three IT ‘best practice’ frameworks considered exist at two levels of analysis. First,
COBIT is a framework for the IT function as a whole. COBIT exists within an IT
governance framework, which gives IT decision-making rights to IT function, business

Chapter 2
48
unit or groups, and corporate-level executives (Weill 2004). Second, the TOGAF and
ITIL frameworks have a lower level of analysis of parts of the IT function, and
respectively address the enterprise architecture and the IT service delivery and
maintenance competencies.
Collectively, the three existing IT ‘best practice’ frameworks rely on received business
unit requests for adaptations to information systems, in conventional planning cycles.
Conventional planning cycles receive a statement of requirements from a business that
commences an IT implementation project with the intent to make a full IT investment,
and often measured in years for large information systems.
None of the frameworks caters for agile responses based on exercising digital options
from a portfolio of initial IT investments and forecasted by sensing the business
environment. The need for a shift from information system adaptations from wholly
received business requests to an agile model (as shown in Table 2-10) is touted by some
reflective IS practitioners at Gartner Research and in the industry press.
2.4. Gaps between the IS theoretical and practice perspectives
Comparing the IS theoretical perspective on agility, gleaned from the research literature,
with the IS practice perspective of how to create agility, deduced from the dominant
best practice framework, has highlighted four noteworthy gaps.
The first gap between the IS theoretical and practice perspectives was differences in the
concept of agility itself. The COBIT definition of agility is narrower than the IS
theoretical perspective, as it is based on the IT function responding to received business
requirements and strategy. The IS theoretical perspective observes that deliberate
alignment of information systems with a stated business strategy has had limited
success (Galliers 2006). The IS theoretical perspective on agility has information
systems being subject to less long-term planning strategies and more to constant
adaptation (Desouza 2006; Peppard and Ward 2004). The COBIT definition of agility is
also narrower than some other IS practice perspectives (Luftman and McLean 2004;

Literature Review
49
Newman and Logan 2006b), which include the IT function sensing and responding
directly with the business environment.
The second gap was the capability for the IT function to sense future needs directly
from the environment. The IS theoretical perspective emphasizes this forecasting
capability (Desouza 2006; Overby et al. 2006; Sambamurthy et al. 2003). In the IS
practice perspective, the capability to sense environmental change is noted by Gartner
(Newman and Logan 2006b), but the COBIT goal of Create IT agility is not linked to
any process for this capability. That COBIT is silent on the IT function directly sensing
future needs from the environment. The COBIT concept of agility being a response to a
received business strategy is the likely cause of it not addressing this capability.
The third gap between the IS perspectives was concerned with maintaining digital
options that can be readily implemented. This capability is put forward in the IS
research literature on agility (Overby et al. 2006; Sambamurthy et al. 2003; Weill et al.
2002). From the IS practice perspective, the theory of design and action deduced from
the enabling factors for the COBIT goal to Create IT agility is silent on this capability.
Last, the IT function sensing current use of the information systems was not included in
the IS practice perspective on agility. There are several references to this capability in IS
theoretical literature which discuss systemic insight (Sambamurthy et al. 2003),
effective use processes (Peppard and Ward 2004) and the assessment of unexpected
consequences that were experienced in existing activity (Galliers 2006). The IS practice
perspective is silent on this capability, as deduced from the stated COBIT enablers to
Create IT agility.
2.5. Conclusion on the literature review
The IS research literature discusses the phenomena of enterprise agility and information
system agility, and the extent that information system agility enables enterprise agility.
The IS literature also discusses whether the IT function enables information systems
agility. It is likely that the discussion amongst IS researchers on the existence of these

Chapter 2
50
phenomena and their relationships will continue (Sambamurthy et al. 2007). Adding to
this discussion was not a contribution of this thesis.
This thesis assumes that enterprise agility and information system agility exist, and
assumes that information system agility enables enterprise agility. This thesis also
assumes that the IT function enables information systems agility. From these
assumptions, the theoretical departure made by this thesis was explaining and predicting
how the IT function enables agility in existing information systems. In other words, this
thesis claims unearthing a theoretical mechanism for the IT function to enable such
agility. From this departure point in IS theoretical perspective, this thesis informs IS
practice perspective by prescribing how the IT function can enable agility. The next
chapter is the theoretical extension from the assumptions by providing a theory of
explaining and predicting agility enabled by the IT function.

51
Chapter 3. Theory development
3.1. Introduction
Given the research question proposed in section 1.4, this chapter draws together some of
the gaps identified in the literature review and develops the propositions that form the
basis of the empirical work described in later chapters.
This chapter has three parts. First is a justification of a cybernetic approach to agility in
information system. Parallels are drawn between the general problems that cybernetics
addresses and the motivations for agility from the IS theoretical perspectives. This
section also reviewed general criticisms of cybernetics in the academic literature and
discusses the criticisms in the context of the IS research topic. Second, the chapter
applies the cybernetic theory of the viable system model (VSM), as an explaining
mechanism, to the IT function enabling agility. Last, the chapter lists three propositions
from the theory development. Chapter 4 and Chapter 7 will respectively describe the
research design and the survey methodology to test these propositions.
3.2. Cybernetics and the agility question
3.2.1. Cybernetic applicability
The theory development drew parallels between the IS research into agility in
information systems and an established model of cybernetics. A cybernetic model was a
valid method for a number of reasons.
First, the business issue of agility for sensing and responding to the environment
(Overby et al. 2006) is the fundamental problem addressed by cybernetics (Ashby 1956;
Beer 1984). Agility in information systems requires alertness by IT personnel to
perceive incoming signals from its internal and external environments, processing the
signals and responding adequately. In the research context, the signals might include the
drivers articulated in Table 2-12 e.g. business exceptions or new technology reports.

Chapter 3
52
The processing of income signals require filtering accurate information to drive
decision-making for response in a timely way. The challenge for the IT function is
processing an overwhelming collection of signals, in un-standardized formats, and from
overlapping sources, which overloads decision-makers (Seo and La Paz 2008). This
signal overload problem of IS must be addressed for agility, and is the problem
addressed in the cybernetic models to comply with the law of requisite variety (Ashby
1956; Conant and Ashby 1970). The law of requisite variety recognizes that
environment inherently contains more variety than the system’s processes can absorb
and therefore demands that the system must attenuate environmental variety to what is
requisite to control the system’s processes.
Second, enabling agility in information systems appears subject to the cybernetic
theorem that every good controller of a system’s processes must be a model of that
system. The controller of a system cannot know all the details of the system’s processes
and must have variety attenuated to deliver the requisite amount of information to
manage the system. Theoretical perspectives on agility of information systems require a
requisite knowledge base to manage information received from the environment and to
enable adaptations of existing IT and work processes (Desouza 2006). This concept is
consistent with the cybernetic theorem of managing environmental perturbations by
maintaining a model of operations. The model can be less complex than the operating
process but must be of requisite variety to control the process (Conant and Ashby 1970).
This second point is distinct from the first made in this section, which was concerned
with the requisite variety in the process, while the current point is concerned with the
requisite variety in the model of the process controller.
Last, elements from the basic model of agility from IS theory (Figure 2-11) can be
understood with the cybernetic theory of the VSM. Two of these elements are externally
focused future planning, and an internally focused effective use process (Desouza 2006;
Galliers 2006; Peppard and Ward 2004). These elements can be interpreted as
subsystems of the VSM (Beer 1979; 1984; 1985), and the model’s known dynamic
between these subsystems informs an understanding of the basic model of IS agility.

Theory development
53
The validity of a cybernetic framework for an explaining and predicting theory is
supported by Gregor (2006). Gregor states a commonality of cybernetics with general
system theory. General system theory provides a high-level way of thinking about IT
systems. Systems are in a continuous state of exchange with their environment and
other systems, and modeled with concepts of input, throughput, output, feedback,
boundary and environment. Gregor suggests general systems theory and cybernetics as
examples of ‘grand theories’ for explaining and predicting.
From the IS practitioner perspective, the cybernetic concept of control can be
interpreted as that of a dominant ‘best practice’ framework. In COBIT, “Control is
defined as the policies, procedures, practices and organizational structures designed to
provide reasonable assurance that business objectives will be achieved and undesired
events will be prevented or detected and corrected” (IT Governance Institute 2007 p.
13). The COBIT control model is illustrated as a room-heating thermostat (IT
Governance Institute 2007), which is an well-worn cybernetic example (Ashby 1956).
3.2.2. Criticisms of cybernetics
This section reviews the criticisms of cybernetic foundations of the VSM, and
concludes that the criticisms of cybernetics do not limit its applicability to this thesis.
Though the IS literature does contains suggestions of cybernetic frameworks for
explanatory and predictive theory (Gregor 2006), and in particular the VSM (Zhao et al.
2007), there are general criticisms of the cybernetic approach (Checkland 1983; Herring
and Kaplan 2001; Hofstede 1978; Jackson and Keys 1984; Ormerod 1995; Sutton
1995).
Hofstede (1978) is a paper on the limitations of cybernetics, published before major
works of Beer (1979; 1984; 1985) on the VSM. The paper takes the mechanistic
definition of the cybernetic control paradigm as a feedback loop, e.g. a thermostat, and
examines its application as the dominant management control paradigm of the time, as
applied to Taylorist division of labor methods. The position taken by Hofstede has the
cybernetic paradigm applicable to technical systems of defined objectives and measured
deviation, but posits that these assumptions do not hold in organizational systems with

Chapter 3
54
human factors, such as communicating motivation. According to Hofstede, human
organizations have no mandated objectives and a political control is the alternate
paradigm for management. Hofstede proposes an alternative of homeostatic paradigm
based biology that is self-regulating and autonomous, which is suggestive of Koestler's
holons (Koestler 1967) .
Later cybernetic theorists advance Hofstede’s proposed biology-based alternative. Beer
tasks the VSM with providing closure to subordinate homeostatic conflicts in order to
maintain the identity of the viable system distinct from the environment and to higher
order systems that may question its viability. Beer (1980) is influenced by the identity
concept of Maturana-Varela’s autopoiesis model (Maturana and Varela 1980) founded in
cellular biology.
Jackson and Keys (1984) take a position that the VSM is suitable for complex systems
with unitary-goals, but inappropriate for complex systems with pluralistic goals.
Unitary-goals have a problem context with a cohesiveness of decision-makers, well-
understood goal-making behaviour and an implementation accepted by all parts. A
complex system does not have all parts directly observable; laws are probabilistic in
nature; and decisions made for political, cultural or ethical reasons that are difficult to
understand.
According to the logic of Jackson and Keys, Beer’s application of the VSM to the
Chilean national government (Medina 2006) was inappropriate. Jackson and Keys’
limitations are less relevant to this thesis’ research focus, which applies the VSM to the
IT function and has mostly unitary-goals set by interplays of an IT governance
framework.
Much of the criticism of the VSM centers on what type of theory it is. Herring and
Kaplan (2001) validate the VSM as an architectural framework for a complex system of
a large number of heterogeneous components in a dynamically changing environment.
In their study, the level of analysis is an IT artifact of a business-to-business e-
commerce application. Though Herring and Kaplan explicitly state that they are not
testing the VSM, they are validating its application to understand a complex system and
Theory development
55
the production of software architecture. In the Herring and Kaplan instance, the use of
the VSM is as a theory of explanation and as a theory of design and action (Gregor
2006).
Others consider the VSM as neither of these theory types. In a review of Ormerod’s
(1995) case study of VSM utilization, Sutton (1995 p. 1038) states the “VSM would
better be viewed as a tool to assess the manner in which viability is being maintained in
an enterprise rather than for the presence of appropriate functions”. If applying Gregor’s
later taxonomy of IS theory types (Gregor 2006) and using the logic of Sutton, the VSM
can be seen as a theory for analyzing by classifying specific dimensions of a phenomena
and not a theory for explaining or predicting.
In an earlier theoretical classification of the VSM, Checkland (1983) positions the
model as belonging to ontology where the reality is systemic, composed of systems, and
the methodology to understand the reality can be systemic. According to Checkland, the
VSM is concerned with hard systems characterized by situated, logical interconnections
and is dominated by decisions to reach a known objective. Checkland’s position
contrasts the VSM with his own soft system methodology, where interconnections are
cultural and have meaning attributed by the observer and reality is problematic, as it is
not known ontologically.
Mingers and Brocklesby (1997) elaborates on Checkland’s limits on the VSM to
consider subjective perspectives of individuals. They subscribe to Habermas’ three-
dimensional world consisting of an objective material world we observe, an inter-
subjective social world we participate in, and a subjective personal world we
experience. According to Mingers and Brocklesby, the VSM is a technique to relate the
material and social worlds, providing a structure of viable organizations, and the ability
to analyze weaknesses and suggest alternatives. Mingers and Brocklesby exclude the
VSM from the analysis of the personal world, as there is nothing in the model to
account for an individual's beliefs and perceptions.
Beer (1984) responds to the logic of Checkland (1983), and the later elaboration of
Mingers and Brocklesby (1997), in a retrospective of the VSM. Beer suggests that

Chapter 3
56
people with freewill are the basic elements of a viable system in the VSM, but people
function under whatever constraints that the job entails. Beer argues that the
prescription of the VSM informs these job constraints for a system to employ people
viably.
Johnston (1998 p. 72) gives a succinct criticism of cybernetics as “assuming that both
the current world state and the goal state can be represented by particular values of, in
its simplest form, one real variable, or in its more advanced control theory elaboration,
several possibly vector variables. The nature of the world is also seen in rather
simplistic terms, being static except for unpredictable disturbances”. This criticism of
over simplicity may be valid, but this thesis deems the cybernetic model as appropriate
to the research topic for two reasons.
First, the cybernetic view of the world can encompass existing information systems
within its limits. A current world state and the goal state can be represented by particular
values, where the object phenomena is existing information systems constructed using
traditional data processing frames-of-reference. These frames-of-reference include
software configurations, service levels measurements and data flows in structures of
fields, records and files; and can have an explicit representation as variables in a
cybernetic model.
Second, the unitary goals of the cybernetic model are sufficient for agility. An IT
investment that instantiates an information system has a goal state of maintaining the
requisite variety of information to the business initiative stakeholders, and to maximize
the return of investment. Adapting the existing information system to counter
disturbances in the environment, internal operations or enterprise policy is a sufficient
purpose for a cybernetic model.
Theory development
57
3.3. The viable system model
3.3.1. Description of the viable system model
This section is a description of the VSM mostly derived from Beer’s The Heart of
Enterprise (Beer 1979). The viable system model is a generalized description of any
system capable of self-adaptation in a fluctuating environment. Viability is maintaining
a separate existence and identity from other systems that share the environment. To be
self-adapting, a viable system has subsystems that perform operations that define the
system’s identity, and subsystems that adapt those operations to achieve viability. The
VSM views an organization as an information processing system striving to maintain
balance when faced with perturbations from the environment. The model provides a
means for diagnosing the structure of an organization, its ability to distinguish and
communicate adaptations, and its effectiveness in controlling self-adaptive resources
(Peppard 2005). The concept of recursion is essential for the VSM to encompass
complex organizations, as any viable system contains operational subsystems that are
themselves viable systems, and can be diagnosed at the lower level of recursion.
Figure 3-1 is a general representation of the VSM without adaptation to the research
topic1. System ONE to System FIVE denotes the subsystems of the VSM. For
simplicity, the figure does not show the interactions between the three sub-systems
within the meta-system and those between the sub-systems within the operations of the
viable system. The figure does show interactions between the meta-system, the
operations and the environment of the viable system.
System ONE occurs in many instances in a viable system and each instance is an
independent operation, with their coordinated behaviour composing the identity of the
viable system. An intersection of the operational requirements and coherence imposed
by the meta-system of the viable system affects the freedom of any System ONE
instance. The instances of System ONE can be recognized as the core business systems
that transact with the outside environment, e.g. with customers, suppliers, business
partners and regulators.
1 A VSM adaptation for the research topic follows in Figure 3-2.

Chapter 3
58
Figure 3-1 The Viable System Model
Instances of System ONE are subject to a resource bargain within the organization. This
is an exchange to provide resources for System ONE for performing in a preferred
manner. System ONE has rules of behaviour that it must observe, e.g. legal obligations
and corporate rules. Figure 3-1 shows three instances of System ONE and each instance
shows an imbedded VSM at the lower level of recursion.
The function of System TWO is to dampen oscillations that will arise between both the
meta-system and System ONE and amongst other instances of System ONE at the same
level of recursion. System TWO is recognizable by the attributes of a network of
elements for stabilizing the execution of System ONE instances within homeostatic
levels, providing a service to a System THREE to dampen unexpected fluctuations from
the System ONE instances, and transduction of code-sets to relay information across the
boundaries of System ONE instances.

Theory development
59
System THREE is responsible for the inside and now control of System ONE. This is
direct and immediate control. The tasks that recognize System THREE are sourcing for
the plans, programs and schedules to adapt System ONE; monitoring the behaviour of
System ONE resulting from the regulatory action of System TWO; and monitoring
System TWO.
System THREE has a helper task of System THREE*, which is responsibility to
sporadically audit System ONE. System THREE* is not logically separate from System
THREE, but normally operates physically apart from System THREE. The attributes
that recognize System THREE* are ensuring that directions coming to System ONE
from System TWO are being performed as reported to System THREE, filling any time
gaps in reporting, and making special case assessments of System ONE.
System ONE, System TWO and System THREE have concentrated on the internal
aspects of stabilizing the system. This is a model for a feedback regulator not aware of
its environment. The system has no mechanism for planning or adapting: this is the role
of System FOUR. System FOUR spends most of its time looking outside the system
and to the future. System FOUR is necessary for the viable system to anticipates change
and adjust System ONE to fit a dynamic environment. This is accomplished by
possession of a model of the viable system and its environment and is consistent with
the Conant-Ashby Theorem (Conant and Ashby 1970) that every good regulator must
have a model of the system it is regulating. System FOUR gathers data from the
environment and collects and stores data on the state of System ONE (obtained via
System THREE). Based on this data, System FOUR can build probabilistic models for
use in forecasting events that may occur in the environment and predict how System
ONE will react to those events. System FOUR indicates structural changes required that
lead to a different configuration of System ONE instances and System TWO.
System FIVE sets the overall goals of the system and constrains the possibilities of
adaptive behaviour provided when System FOUR couples with System THREE. System
FIVE produces policy that governs the behaviour of the total system i.e. top-level rules.
System FIVE monitors the System THREE and System FOUR couple, supervises their
behaviour and mediates conflicts. System FIVE thinks about what the system produces

Chapter 3
60
and why. Finally, System FIVE absorbs any variety that is not disposed of by System
ONE, System TWO, System THREE and System FOUR.
The VSM is a process theory (Markus and Robey 1988), as it is concerned with
ensuring discrete viability outcomes over time. In the recursive nature of the VSM, each
instance of a System ONE in a viable system in-focus is itself a viable system in the
next level of recursion down. Collectively, Systems THREE, FOUR and FIVE are the
meta-system for the control of a viable system, but not viable systems themselves. The
meta-system does not exist for itself, but is a necessary redundancy to regulate the
complexity in the environment that embeds the viable system.
3.3.2. Currency of the viable system model
The established currency of VSM in management practice and academic organizational
theory has only recently been reflected in IS research. Similarly, the IS research does
not feature any rigorous criticism of cybernetics as a reference discipline. This is
surprising as both computing and cybernetics have common origins in the operations
research efforts of World War II, cybernetics remains an active discipline of academic
research, and both disciplines share well understood concepts.
Practitioners mostly applied the VSM at the industry-wide and enterprise level for the
assessment of effective organization structures. Beer (1984) recounts many case studies
published by others. More recent VSM applications range from small co-operatives
(Walker 2001) to the UK electricity market (Shaw et al. 2004), to the Australian
Taxation Office (Haslett and Sarah 2006) and several case studies of the St Gallen
Institute of Management (Schwaninger 2006). Beer’s trilogy on the VSM (Beer 1979;
1981; 1985) has 2,533 citations in Google Scholar1 .
An ISI Web of Knowledge search of 45 leading IS journals published to 2006, found
three articles that included the ‘Viable System Model’ as a topic (Shaw et al. 2004;
Snowdon and Kawalek 2003; Sutton 1995). Some recent doctoral dissertations based on
the VSM have addressed adaptive software architectures (Herring 2002), and how IT
1 Measured by (Harzing 2009), accessed 19 July 2009
Theory development
61
empower worker participation for the effective management of an enterprise (Nyström
2006).
Peppard (2005), in a conference paper of two case studies, discusses the VSM as an
interpretive and diagnostic tool for IT governance of many IT activities. The IT
activities are projects, operations and service-delivery that occur throughout the
organization, which represented as the System ONE occurrences of the VSM. IT
governance forms the meta-system of the VSM. Peppard’s unit of analysis is IT
governance decision-making for many IT activities and not the existing information
systems that are the topic of this thesis. According to Peppard, the VSM is a proven
model and one that is accessible to IT practitioners.
Ahmad and Yusoff (2006) used the VSM as an interpretative tool to model the strategic
information systems planning of a Malaysian social development program. The case
study identified the functionalities of the many agencies at different levels of federal
government and their relationships. Ahmad and Yusoff did not diagnose the viability of
the development program, but found the VSM useful to elicit enterprise information
requirements in a complex situation.
Zhao et al. (2007) note cybernetics foundation as an academic discipline in 1948, and
that it remains relevant to make systems react to changes through measurement and
feedback control. In discussing merging web-service technologies with an
understanding of business processes and organization, the position of Zhao et al. is the
VSM does “gain a better understanding of the dependencies across a business value
chain and possibly provide one potential theoretical foundation” (Zhao et al. 2007 p. 5).
3.3.3. The VSM applied to the IT function
The theory development mapped the attributes of the five subsystems of the VSM to the
components of the IT function. After clarifying the terms for the subsystems applied in
this thesis, this section describes the mapping to establish the VSM as a plausible
framework for a meta-system to enable agility in existing information systems.

Chapter 3
62
This thesis used the terms Applications, Integration, Control, Intelligence and Policy to
respectively describe System ONE to System FIVE, for an IS research audience and a
focus on information systems. An adoption of localized names for the subsystems is a
liberty often taken by interpreters of the VSM. Beer (1984) used a general terminology
to describe System ONE to System FIVE: process, anti-oscillatory, inside & now self-
organization & regulation, outside & future self-reference, planning & simulation, and
policy. Later interpreters used a simpler terminology of operations, coordination,
control, intelligence and policy. Stephens and Haslett (2003) uses the descriptions of the
productive, coordination, executive, planning and future focus, and policy when
applying the VSM to IT governance at the enterprise level.
Figure 3-2 VSM applied to the IT function
Figure 3-2 depicts applying the VSM to the IT function. The viable system is composed
of the existing information systems (circled) which produce the identity of the viable
system, and the IT function (boxed) as the meta-system of the information systems.

Theory development
63
There is no representation of transactional data flows, user interfaces and the internal
technical architecture for delivering functionality of the information systems.
The VSM subsystems of System ONE are interpretable as the Applications of the
information systems. These are instantiations of electronic processes and networks used
to enable business initiatives and the business users of those initiatives. The
instantiations of the IT can be a portfolio of SCM, CRM and ERP packages or legacy
systems. Applications receive sustaining resources from the organization in return for
performing at prescribed service levels, within the legal obligations and corporate rules.
System TWO is interpretable as the Integration between the Applications of the
information systems. This can be instantiations of system integration software to
stabilize applications and the transduction of code-sets. Examples of the integration
software include Data Warehousing, ERP and Enterprise Applications Integration
(Markus 2000). Integration extends to new software engineering mechanisms that can
be used for extending Component-Based Development specifically to endow
information systems with the agility (Andrade and Fladeiro 2002). An IT support group
is often involved to dampen fluctuations between Applications not handled
electronically by the system integration software, i.e. though exception/error-handing
work procedures. Applications and Integration compose the information system, which
is subject to the meta-system of the IT function.
The System THREE, System FOUR and System FIVE meta-system of the information
systems is the IT function. System THREE is interpretable as the Control subsystem of
the IT function. Control is often the accountability of the Application Management
Office, which includes a disciplined approach to delivering IT-enabled business
initiatives beyond the usual view of project completion, a single point of ownership for
application support and a single point of contact for operational support. Deliverables of
the Application Management Office include the measurements of service levels,
problem management, and capacity and security (Oakton 2006). System THREE* can
be seen as the Audit component of the IT function, such as COBIT high-level processes
of monitoring and evaluating (IT Governance Institute 2007).

Chapter 3
64
System FOUR is interpretable as the Intelligence subsystem of the IT function. In many
organizations, this is the accountability of the Strategy and Enterprise Architecture
office. The accountabilities of the office include aligning business and IT strategies,
monitor benefit realization, translate strategy to operational programs, prioritize
initiatives for delivery, and one-stop communication for strategy stakeholders.
Deliverables of the office include identified IT trends and opportunities, approved
current and target enterprise architectures, and transition roadmaps (Oakton 2006). The
System FOUR attribute of building probabilistic models to forecast events and how
System ONE will react to those events is consistent with discussion of the IS agility as a
family of future electronically-enabled business initiatives that are readily implemented
(Weill et al. 2002), and digital options (Sambamurthy et al. 2003).
System FIVE is interpretable as the Policy subsystem of the IT function. In many
enterprises, this role is that of a steering committee, with representation by the IT
function. The IT governance model specifying decision rights and accountabilities for
important IT decisions configures the Policy subsystem. The aim is to encourage
desirable behaviours in the use of IT. Weill (2004) conducted an international survey of
more than 250 organizations and found a wide variety of IT governance arrangements
for decision rights. These decision rights included high-level statements about business
uses, policies and rules of IT; and IT project approvals and justification techniques.
These decision rights of the surveyed IT governance arrangements are consistent with
the System FIVE attributes found in Beer (1979).
A portfolio of existing information systems is the system-in-focus for the application of
the VSM. In the recursive nature of the VSM, the application technologies executed by
the existing information systems are themselves viable systems, and subject to the VSM
at a lower level of recursion. Similarly, the information systems in-focus may be part of
a larger viable system at a higher level of recursion, e.g. the IT enterprise architecture.
3.3.4. The VSM applied to the basic model of agility
The theory development mapped the meta-system of the VSM to the basic model of
agility gleaned from IS theory (Figure 2-11). This section maps System FOUR of the

Theory development
65
VSM with the agility elements to sense future needs and form digital options, and
System THREE with the elements to sense current use and implement agile responses
in existing information systems.
As described in section 3.3.1, System FOUR looks outside the viable system and to the
future. This is necessary for the viable system to anticipate perturbations from a
dynamic environment (Beer 1979). The IS literature on agility contains discussion on
this element. The agility element of sensing future needs is variously described as: using
outside signals to make sense of the environment (Desouza 2006); exploration of the
business environment (Lyytinen and Rose 2006); continually sensing opportunities for
competitive action (Overby et al. 2006); anticipation of change in order to profit (Patten
et al. 2005); and strategic foresight (Sambamurthy et al. 2003).
Additionally, System FOUR builds probabilistic models on perturbations that may occur
in the environment and predicts how System ONE may need to adapt to react to the
forecast perturbations (Beer 1979). This role of System FOUR is comparable to the
element of digital options from the basic model of agility. Weill et al. (2002) expressed
this agility element as a set of business initiatives than can be readily implemented.
Sambamurthy et al. (2003) developed this element to a portfolio of rights to future IT
investments without an obligation for full investment, and informed by strategic
foresight and systemic insight.
System THREE of the VSM decomposes to two isomorphisms with the basic model of
agility from IS theory. First, the agility element of sensing current use compares to
monitoring the behaviour of System ONE and System TWO, which enables System
FOUR to forecast environmental trends (Beer 1979). In the IS literature, this agility
element is described as systemic insight (Sambamurthy et al. 2003); strategizing by
assessing unexpected consequences in existing activity (Galliers 2006); and sensing of
internal signals to make sense of environmental trends (Seo and La Paz 2008).
The second element of the basic agility model that compares to System THREE is
implementing agile responses. System THREE is charged by the VSM with sourcing
plans, programs and schedules to adapt System ONE (Beer 1979). The agility element
Chapter 3
66
from the basic model adapts the existing information systems to complete the agile
response. As noted in section 2.2.5, there is much in the IS literature about agile
software technologies (Andrade and Fladeiro 2002; Bajgoric 2006; Berente 2005;
Bieberstein et al. 2005; Seo and La Paz 2008; Umar 2005) and agile development
methods (Börjesson et al. 2006; Fitzgerald et al. 2006; Hovorka and Larsen 2006).
This section applied Beer’s VSM to the basic model of agility from IS theory. As the
VSM is a model that diagnoses and controls self-adaptive systems (Peppard and Ward
2005), it provides a theory for explaining and predicting agility (c.f. Gregor 2006).
Thus, the VSM informs the research question: How can the IT function enable agility in
existing information systems?
3.4. Propositions suggested
Applying cybernetics to the IT function suggests propositions of agility enabled by the
capabilities arising from the Policy, Intelligence and Control subsystems. These
capabilities are embedded within the fabric of the IT function and difficult to identify,
but capabilities are reflected in business performance (Peppard and Ward 2004). From
the practice perspective, the maturity of IT processes predicates IT function
performance (IT Governance Institute 2007). Thus, the maturity of IT processes couches
the definition of Policy, Intelligence and Control as independent variables of the
suggested propositions.
The first proposition suggested by applying the VSM to the IT function to enable agility
was:
P1 The more mature the Policy processes of the IT function, the more the IT
function will be able to create agility in existing information systems.
The IT processes that reflect a Policy capability for agility can include creating an IT
strategic plan that will contribute to the company’s strategy; maintaining a set of
policies to support IT strategy; and maintaining an optimal co-ordination,
communication and liaison structure within the IT function (IT Governance Institute

Theory development
67
2007). These processes are consistent with System FIVE setting the goals of the viable
system, producing policy that governs the viable systems behaviour and mediating
conflict between the subsystems of the VSM (Beer 1979).
The proposition pertaining to the Intelligence subsystem and agility was:
P2 The more mature the Intelligence processes of the IT function, the more the
IT function will be able to create agility in existing information systems.
The IT processes that reflect an Intelligence capability for agility include monitoring
industry, technology and regulatory environment trends; planning technological
direction to realize the IT strategy; and examining the possibility of alternative courses
of action (IT Governance Institute 2007). These processes are consistent with System
FOUR looking outside the viable system to the environment, indicating structural
change and building probabilistic models of perturbations that may occur and predicting
how the viable system may react (Beer 1979).
The Control subsystem, informed by applying the VSM to the IT function, suggested
the proposition:
P3 The more mature the Control processes of the IT function, the more the IT
function will be able to create agility in existing information systems.
The IT processes that reflect a Control capability for agility include maintaining
applications in line with IT strategy; continuously monitoring service level
performance and identifying trends (IT Governance Institute 2007). These IT processes
are consistent with System THREE looking inside the viable system, sourcing structural
change and monitoring behaviour of System ONE and System TWO (Beer 1979).
3.5. Conclusion on the theoretical development
The theoretical development of this chapter drew on a meta-theory of cybernetics and
applied it to the research question. The chapter proposed the VSM as a mechanism to
explain how the IT function can enable agility in existing information systems. In

Chapter 3
68
addressing the question, the meta-system of the VSM interpreted a structure of the IT
function.
Applying the VSM to the IT function draws together some of the gaps identified in the
literature review. First, the VSM provides a theory for explaining and predicting for the
basic model of agility (Figure 2-11), which is lacking in the IS research literature.
Second, the lack of a theory for design and action to sense future needs (Desouza 2006;
Overby et al. 2006; Sambamurthy et al. 2003) and to build a portfolio of digital options
(Overby et al. 2006; Sambamurthy et al. 2003; Weill et al. 2002) is addressed by the
prescribed attributes of the VSM meta-system.
Further, this development of the basic model of IS agility into a theory of explaining
and predicting is strongly interrelated with providing IS practice with a theory of design
and action (Gregor 2006). A cybernetic approach and the VSM provides a meta-level
theory to develop the IS theoretical and practice perspectives in the context of agility of
existing information systems (Hobbs and Scheepers 2009). Using the VSM meta-system
as a lens to the IT function provides insights to other topics of IS research (see section
11.7).
The three propositions deduced theoretically in this chapter, along with others induced
from an applicability check with practitioners in Chapter 5, become testable hypotheses
of Chapter 6. Further developing the constructs into variables, providing an ontological
basis and associating operational measures arrives at this testability. The attributes of
the viable system model discussed in this chapter informed the association of measures
for the variables in Chapter 6. The theory development of this chapter contributed to the
applicability check in Chapter 5, by providing reflective IS practitioners of an IT
consultancy with a lens to generalize the capabilities of the IT function over a large
number of client firms. A final contribution of this theoretical development is in Chapter
11, which discusses pathologies generally identified by the viable system model and
how those pathologies in the IT function impair agility.

69
Chapter 4. Research design
4.1. Introduction
Chapter 2 reviewed the theoretical literature on IS agility, and identified gaps in terms
of explanatory and predictive theory on agility. Chapter 3 discussed the VSM as a
mechanism to meet this need, and as a bridge to reconcile the IS theoretical and practice
perspectives of the research question. This chapter outlines the empirical research taken
from this theoretical development.
4.2. Research activities
The theoretical development proposes an explanative and predictive theory for agility in
existing information systems, where the meta-system of the VSM prescribes the
structure of the IT function. The empirical research proceeded from this conceptual
point in three stages.
The first stage was a qualitative study with Oakton, an Australian IT consultancy.
Rosemann and Vessey (2008) propose that IS researchers do an applicability check of
findings with practitioners to improve the relevance of their research. Oakton managers
and consultants checked the applicability of the VSM meta-system to the IT function.
The level of analysis was the client base of Oakton, which consists of approximately
250 organizations across eastern Australia.
The second stage of the empirical research was quantitative surveys for theory testing. A
survey mailed to Oakton’s client base tested the correlation of process maturity of the IT
function and the likelihood of agility outcomes in existing information systems. The
relationships between these constructs are propositions from applying the VSM meta-
system to the IT function and the applicability check with Oakton.
Later, the quantitative data collection expanded to include an international survey of
LinkedIn subscribers. The surveyed LinkedIn subscribers were members of professional

Chapter 4
70
discussion groups with an interest in this particular research topic. This expansion of the
data collected increased the number of respondents to provide a greater opportunity to
falsify the thesis’ hypotheses. The expanded data collection also allowed falsification in
settings other than amongst Australian companies.
The final stage of the empirical research was the analysis of the responses from the
mailed and web-based surveys using partial-least-squares (PLS) path modeling and
ANOVA regression. The propositions from the VSM application and the applicability
check suggested the structural models.
Figure 4-1 Research design into agility in information systems
4.3. Role of the industry partner
Having Oakton as the industry partner was beneficial to the particular research design
shown in Figure 4-1. Oakton’s contribution was three-fold. First Oakton provided cash
contributions towards the research costs. This cash contribution paid for the printing and

Research design
71
mailing of covering letters and questionnaires for the mailed survey, and the
professional development and hosting of the web-based survey1.
Second and more importantly, Oakton provided access to their entire client base for the
empirical research. This contribution afforded a survey to collect data from
approximately 250 organizations, with the Oakton customer database providing the
contact details of an IT manager/professional and a business manager/stakeholder in
each organization. The opportunity to access the population of clients of an IT
consultancy lent itself more to a quantitative survey than field research using case study
or ethnography, and the transferability of findings to a wider population of organizations
that the Oakton client base represent.
Third, Oakton provided an in-kind contribution of time spent by Oakton staff with
myself. The Oakton consultants can be typified as reflective IS practitioners and
knowledgeable of their client base. This contribution allowed an applicability check
with Oakton consultants of this thesis’ propositions, described in Chapter 5.
4.3.1. Acquisition of the industry partner
It is worth briefly noting the circumstances that led to Oakton becoming the industry
partner of this thesis and some lessons learnt. The soft positivist stance of this thesis
necessitated access to relevant, empirical data. In this regard, I deemed it important to
have an industry partner who could facilitate access to a wide range of organizations.
My PhD candidature commenced, in May 2006, with a different industry partner than
Oakton. The initial industry partner was an IT consultancy, with an office in Melbourne
and focused on producing IBM Websphere solutions. In March 2007, the IBM
Websphere consultancy advised me that, due to financial difficulties, they were
withdrawing from the research project. I began making efforts to secure a replacement
industry partner. These efforts included a research presentation in March 2007 to the
chief information officer of a defense-engineering firm. The first indication from the
defense-engineering firm was support for this thesis and a readiness to become the
1 The web-based survey as built by Philology Pty. Ltd, http://www.philology.net.au/.

Chapter 4
72
replacement industry partner. Unfortunately, on the 21 March 2007, I received a reply
from the CIO stating that, due to an internal reorganization, they were unlikely to link as
an industry partner in the near future.
Subsequently on 30 March 2007, I sent an industry partner proposal to an international
IT product and services company, with regional headquarters in Melbourne. This large
company would have been a valuable industry partner due to its access to a wide
Australian client base. Representatives of the company showed an interest in this thesis
at an industry forum in October 2006, but were unable to formally link to the project.
Later, Oakton was identified an industry partner and commenced in late August 2007
once the legalities were finalized. The addition of a new industry partner delayed the
finalization of the research approach and the commencement of the data collection
phase from the planned date of 31 August 2007 to 01 December 2007. The linkage and
contributions of Oakton afforded the research design the particular trajectory shown in
Figure 4-1. With hindsight, Oakton’s interest in COBIT as an exemplar IT for this thesis
was less problematic than the original industry partner’s interest in IBM Websphere to
research the IT function leveraging existing information systems for agility.
A lesson learnt from this episode of uncertainty in the research project is the need to
consider the risks associated with engagement of an industry partner. The project risks
encountered included financial-stress experienced by small companies, a business
reorganization causing interest in academic research to be lost, or the power-distance
within large companies not allowing initially interested individuals to formalize a
research agreement. Though the final industry partnership afforded this research project
a number of valuable opportunities, similar IS research programs should consider the
size and organizational structure of potential partners to identify project risks.
Beyond project risk assessment, other lessons learnt when considering the opportunities
of an industry partnership in IS research is whether the company’s activities encourage
reflective IS practitioners, accesses a client base for fieldwork and a preference for an
IT artifact that exemplifies the theoretical concepts to be tested.

Research design
73
4.3.2. Keeping the industry partner engaged
A challenge for an IS researcher working with an industry partner is to sustain the
partner’s interest over the number of years required to produce research outcomes, such
as a doctoral thesis or a publication in a IS journal. A tangible outcome from IS
academic research is often in excess of three years after the initial contact with the
industry partner, and longer than the normal IT industry horizon for conceptual work. I
identified early the importance of sustaining the industry partner’s interest over the
three-year research project to ensure continued access to Oakton’s client database and
material support.
The research design included two ‘quick wins’ for the industry partner to sustain their
interest in the research project. First, a by-product of the applicability check undertaken
with the Oakton consultants was a fourteen-page white paper (Woolley and Hobbs
2008) recording their collective insight on the topic of agility in information systems.
The white paper finalized eight months after the engagement of Oakton as the industry
partner. Oakton and the University of Melbourne co-branded the white paper and it is
available for Oakton to circulate to its clients.
The second benefit delivered to the industry partner during the course of the research
project was a summary of the data collected from the mailed survey of Oakton clients
(Hobbs 2008). The five-page summary informs IS practitioners of the capability of
agility in information systems amongst the sample and a means to benchmark particular
organizations. The content of the survey was a tabular and graphical representation of
the snapshot data in Chapter 8. The survey summary had the co-branding of Oakton, the
Australian Research Council and the University of Melbourne, and was available for
Oakton to circulate to its clients. In November 2008, I mailed copies to all survey
respondents amongst Oakton clients, which was thirteen months after the engagement
of Oakton as the industry partner. This was before the completion of detailed analysis of
the collected data, which produced the findings of Chapter 9.
These two deliverables to Oakton, early in the course of the research project, transferred
knowledge from this thesis to their own consultants and clients and contributed to

Chapter 4
74
keeping the industry partner engaged as the demands for this research evolved. I
acknowledge the assistance provided by the Oakton marketing personnel to produce a
mailing list of potential survey respondents from client organizations.
4.4. Focus group research method rejected
There was extensive consideration of collecting the empirical data by means of a focus
group. The focus group would consist of IT professionals, representing a subset of the
client organizations of Oakton, with the aim to validate the propositions of this thesis1. I
eventually put aside a focus group research method in preference of a quantitative
survey of the Oakton client base.
Particular to this thesis, I envisioned the following focus group research design. A white
paper (Woolley and Hobbs 2008) would have been circulated to senior IT professionals
from approximately six client organizations of Oakton. Consequently, these IT
professionals would have been invited to a focus group to discuss the concepts raised in
the white paper. The aim would have been to falsify the propositions generated from the
analysis of the white paper. This author and an experienced co-moderator would have
moderated the focus group, hosted at the usability laboratory of the Department of
Information Systems at the University of Melbourne. The expected duration of the focus
group would have been 120 minutes and to consist of seven open-ended questions.
Audio-visually recording of the focus group sessions would allow transcription of the
proceedings. Another researcher and I would thematically code the transcription using
the ATLAS.ti software. Conduct of the focus group sessions would conform to ethical
protocols of the University of Melbourne.
The aim would have been to detect themes in the focus group discussions, generated by
the open-ended questions, which falsify the hypotheses listed in section 6.3.2. For
example, the falsification of hypothesis H3, the IT governance model of an IT Monarchy
1 Hobbs, G. A. (2008). Combining Delphi & Focus Group Research Methods. Information
Systems Doctoral Consortia. Presented 28 April at the University of Melbourne
http://web.dis.unimelb.edu.au/isrpg/Events/phdConsortium/dc2008/home.html

Research design
75
is less likely to have digital-options for the existing information systems that are
exercisable than the IT governance model of a Business Monarchy, could occur from
focus group comments arising from the questions:
• How does the decision-making arrangement between the Business & IT help or
hinder the rapid adaptation of information systems; and
• Can you recall incidences where the agility of the information systems mitigated
any shortcomings in the decision-making arrangement?
A number of concerns caused the abandonment of focus groups as a research method
for this thesis. First, focus groups are a valid research method for exploration of a topic
and less valid for hypotheses testing (Gibson et al. 2004). Second, feedback from senior
researchers in this area questioned whether focus groups tested any positivist truth or
the perceptions of a relative small number of participants. A larger sample of
respondents from a quantitative survey was considered better able to reveal an objective
truth.
Finally, a focus group would have the benefit to illustrate perception gaps with IS
practitioners and an objective truth claimed by the theoretical development of this
thesis. Given the resource constraints of the research project, the decision was to forego
this benefit from a focus group in preference to hypotheses testing by mailed and web-
based surveys.
In summary, it is important to consider which data collection approaches are appropriate
in any research project, beyond the practicalities associated with a particular method.
More importantly, a researcher should consider if a method fits with the particular
epistemological stance taken. In this case, a focus group did not fit with soft positivism
of this thesis.
4.5. Conclusion on the research design
The research design arose from the gaps between the IS theoretical and practice
perspectives found in Chapter 2 and how theoretical development of Chapter 3 might

Chapter 4
76
bridge the gaps with a theory that explains and predicts agility in information system, as
enabled by the IT function.
This chapter outlined the research design. First, the propositions of the theory
development are applicability checked by gathering the qualitative insights on the
Oakton client organizations from a cohort of Oakton consultants. Given a prima facie
support for the theoretical propositions from the applicability check, this thesis had
justification for a more rigorous quantitative survey of the Oakton Australian client base
to test the propositions. Later, the quantitative survey expanded to include non-Oakton
clients using a web-based survey of LinkedIn discussion group members, which
collected data internationally. The aim of the research design was to provide an
opportunity to falsify the propositions and to produce findings that generalize to settings
other than the Oakton client base. The next chapter reports on the applicability check
with the Oakton consultants.
77
Chapter 5. Applicability check
5.1. Introduction
Rosemann and Vessey (2008) propose that IS researchers do an applicability check of
research findings with practitioners to improve the relevance of their research. The
check is an additional step at the beginning or the end of the research project and leaves
intact the normal rigorous research methods used. In this way, the applicability check
does not compromise traditional IS research methods.
An applicability check of the theoretical development of this thesis was done with
Oakton, a Melbourne headquartered IT and business service consultancy. The level of
analysis of the applicability check was the client base of Oakton, as observed by
managers and consultants of Oakton’s strategy and enterprise architecture unit. Oakton
has approximately 250 clients on the eastern seaboard of Australia, which includes a
broad cross section of industries and types of organizations. The clients range from
major banks to small, not-for-profit and semi-government support organizations.
A white paper of 4,500 words recorded the insights from Oakton. The white paper
describes Oakton’s current thinking on the topic of agility. It provides insight into the
business need for IS agility and how the IT function can leverage the existing
information systems. This is a wider topic of agility than is addressed by the research
question of this thesis. This thesis does not address the determinants for the business
need for agility in information systems. But in addressing the research question, the
participating members of Oakton identified enabling factors for an IT function to
leverage the existing information systems and intervening factors in the IT function’s
enablement of agility.
5.2. Method
The applicability check used a modified nominal group technique (Okoli and
Pawlowski 2004), with the white paper being the research instrument. The method

Chapter 5
78
began with identification of a set of concepts followed by further classification and
development of those concepts. The applicability check proceeded in five stages.
The first stage identified the factors of interest in a brainstorming session. This was an
hour-long meeting with a senior manager and a manager of the strategy and enterprise
architecture unit of Oakton, my faculty supervisor and I. The identified factors
determined the relevance of agility in information systems to an organization and
enabled the IT function to leverage the existing information systems for emerging
opportunities.
The second stage of the study defined the identified factors. This included the
introduction of concepts from the IS literature by myself. This resulted in the first draft
of the white paper. The conduct of this discourse was mostly electronic.
The third stage was to understand the causal relationships between factors. This
involved recording an Oakton manager’s insights into causality based on his consulting
experience with the client base. This resulted in the second draft of the white paper.
The fourth stage of the applicability check was to generate concise generalizations. This
was the result of my e-mail discourse with an Oakton manager. I drafted the
propositions based on the input of the earlier stages and refined the generalizations from
the feedback of the Oakton manager. The second and third drafts of white paper
recorded the outcomes of this discourse.
The final stage was further development of the factors and the generalizations by
inviting the reflection of twelve other consultants of Oakton. Of these twelve, five
consultants did not contribute. The remaining consultants’ contributions were included
in the final version of the white paper. Table 5-1 is a description of each consultant
invited to reflect on the white paper and their contribution. The ascending hierarchy of
roles at Oakton is consultant, senior consultant, lead consultant and principal consultant.
Overall, the contribution of the seven responding consultants was an endorsement of the
white paper’s insights.

Applicability check
79
At this stage, I was careful not to introduce any theoretical model that explains or
predicts agility. I only provided definitions of the factors identified by Oakton, from
known concepts in the academic literature and utilized by this thesis.
Role at Oakton Industry experience Contribution
Senior consultant 10+ years in a primarily corporate role
A written contribution included points
for clarification in the draft white paper,
and a discussion of the organizational
cultural dimension of low and high
individualism.
Senior consultant 8+ years in a primarily IT services
Provided verbal agreement
Consultant 5+ years in primarily IT services
A written contribution included points
for clarification in the draft white paper
and suggested a greater emphasis on
positioning agility as relevant to CIO
attention.
Principal consultant
15+ years in primarily consulting
Provided verbal agreement
Lead consultant 15+ years Did not explicitly contribute
Senior consultant 10+ years in primarily IT services
Provided verbal agreement
Senior consultant 8+ years Did not explicitly contribute
Consultant 5+ years Did not explicitly contribute
Senior consultant 8+ years Did not explicitly contribute
Lead consultant 15+ years Did not explicitly contribute
Lead Consultant 10+ years in primarily consulting
Provided verbal agreement
Principal consultant
15+ years in primarily a corporate role
Points for clarification in the draft white
paper
Table 5-1 Oakton contributors to the white paper (Woolley and Hobbs 2008)

Chapter 5
80
5.3. A model for agility in information systems
A product from the applicability check with Oakton is a model for agility in existing
information systems, shown in Figure 5-2. The model contains relevance factors for
agility in existing information systems, enabling factors of the IT function to leverage
existing information systems for emerging opportunities, and an intervening factor on
the IT function enabling agility.
Figure 5-2 contains these factors (outer boxes), types within a factor (inner boxes) and
the generalizations of the factor types (arrows) to an outcome of Agility in Existing
Information Systems (the centre box). The meaning of the generalizations reads in the
direction of the arrow. For example, the top-rightmost relationship in Figure 5-2 reads
as “The IT governance model of Business Monarchy has organizational risk mitigated
by Agility in Existing Information Systems”. The section explains the generalizations
contained in the model.
5.4. Relevance factors for agility
Oakton believes that the main factors for the relevance of agility in information systems
are the business environment, the operating model and the organizational culture. An
Oakton manager and I discussed different types within each of these factors. Oakton
then proceeded to record insights on whether each type adds to or subtracts from the
organization’s need for agility. Below are the Oakton insights on each identified factor.
5.4.1. The Business Environment
Oakton identified three types of business environment, in the context of the relevancy of
agility in existing information systems to the organization: Turbulent, Orderly and
Stable/Static. These types describe the degree of environmental fluctuation. An
organization usually only exists in one of these environment types for any period.
Material events usually cause the changes.

Applicability check
81
Figure 5-2 A relational model for agility based on the insights of Oakton consultants

Chapter 5
82
Turbulent
In the Private, Commercial and Financial sectors, Oakton observed that organizations
have a much greater need for, and value recognition of, agility. A systemic need to be
able to adapt and change either to meet competitive pressures or to seek competitive
advantages drives this need. According to Oakton, this has grown in importance, as
information systems have become an instrument of differentiation in a much greater
variety and number of industries. The generalization in Figure 5-2 is “A Business
Environment that is Turbulent has a great need for Agility in Existing Information
Systems”.
Orderly
In many industries, where operational shifts occur only in planning and budgetary
cycles, the business environment values agility but it is not a fundamental competency.
An example is a government department. Oakton’s insights are that these organizations
tended to value cost efficiency over agility. The generalization in Figure 5-2 is “A
Business Environment that is Orderly has limited need for Agility in Existing
Information Systems”.
Stable/Static
In regulated monopolies, the ability to change rapidly is typically not valued as service
delivery and cost efficiency are the greater focus. Indeed Oakton observed that seeking
agility has been counterproductive in some instances. This is because the organization is
not interested in understanding the trade-offs involved in enabling agility in both the
technology and the IT function. According to Oakton, the lack of drivers does not
promote thinking to enable the appropriate level of agility with its associated increase in
costs. The generalization in Figure 5-2 is “A Business Environment that is Stable/Static
does not value Agility in Existing Information Systems”.
5.4.2. The Operating Model
The operating model of an organization describes the necessary level of business
process integration and standardization for delivering goods and services to customers.

Applicability check
83
This established description organizes these dimensions of ‘integration’ and
‘standardization’ into four types of operating model and associates a key IT capability
with each type (Weill et al. 2006). The four types of operating model are Unification,
Coordination, Replication and Diversification. An organization usually only conforms
to one of these operating models. Following is a discussion of these operating models
and Oakton’s insights relating to each model.
Unification
Organizations that fall under the unification model have high business process
standardization and high business process integration. Organizations under this model
have a single business with global process standards and global data access. The IT
capability key for these organizations is enterprise systems reinforcing standard
processes and providing global data access (Weill et al. 2006).
Oakton observed that unification based organizations have sought agility across the
domain because of the breadth of impact across the enterprise for change. According to
Oakton, this means that change in any area needs careful monitoring and measuring
across the other areas of the business. The generalization in Figure 5-2 is “The
Operating Model of Unification seeks Agility in Existing Information Systems”.
Coordination
Organizations with the coordination model have low business process standardization
and high business process integration. These organizations have unique business units
with a need to know each other’s transactions. The IT capability key for these
organizations is access to shared data through standard technology interfaces (Weill et
al. 2006).
Oakton observed that organizations with this operating model have less need for
managed agility as they tend to have good process boundaries that can compensate for
the ability to adapt systems. According to Oakton, this lesser need is true for the smaller
business units in a coordination-operating model, but the need for agility increases in
the larger business units. The generalization in Figure 5-2 is “The Operating Model of
Coordination has less need for Agility in Existing Information Systems”.

Chapter 5
84
Replication
Organizations that exhibit the replication model have high business process
standardization and low business process integration. Organizations with this operating
model have independent but similar business units. The key IT capability is to provide
standard infrastructure and application components for global efficiencies (Weill et al.
2006).
Oakton observed that these organizations have a low need for agility, as each of the
businesses tends to operate their own model. According to Oakton, this means that
while there is often change, the corporate infrastructure stabilizes the common elements
reducing the need for high agility. The generalization in Figure 5-2 is “The Operating
Model of Replication has a low need for Agility in Existing Information Systems”.
Diversification
Organizations that display the diversification model have low business process
standardization and low business process integration. These organizations have
independent business units with different customers and expertise. The IT capability key
for these organizations is to provide IT-resource economies of scale without limiting
independence of the business units (Weill et al. 2006).
Oakton observed that these organizations have a high need for agile information
systems because of the focus on supporting a variety of businesses. According to
Oakton, the agility focus is infrastructure rather than applications, which tend to be
business unit specific. The generalization in Figure 5-2 is “The Operating Model of
Diversification has a high need for Agility in Existing Information Systems”.
In summary, Oakton believes that those organizations that exist in industries that are
facing an ever-changing business environment demand a greater level of IT agility than
those organizations that exist in orderly or stable/static environments.

Applicability check
85
5.4.3. The Organizational Culture
The organization culture is a relevance factor for agility leveled at the whole enterprise,
of which the IT function is a part. Leidner and Kayworth’s (2006) literature review
identified that Hofstede’s (1980; 1983) cultural dimensions is the most prominent
typology amongst studies of culture, IT use and outcomes in organizations1; with
particular use of the dimensions of Power Distance, Uncertainty Avoidance and
Individualism-Collectivism. One or many of these cultural dimensions may assess an
organization.
Power Distance
The first cultural dimension for organizations is the distribution of decision-making
power that is accepted. A low Power Distance de-emphasizes the association between
organization members’ position and decision-making power. Decision-making is
decentralized and more likely to span organizational boundaries. High Power Distance
in organizations is more likely to follow a hierarchical system that does not allow
decision-making amongst most members and across organizational boundaries
(Hofstede 1980; Hofstede 1983).
Oakton observed that low power distance drives a need for agility due to breadth of
impact and the more capability-based decisions that tend to demand more flexibility.
However, Oakton also observed that occasionally high power distance also supports the
need for agility due to the increased speed of decision-making enabling wider, more
reactive and flexible change. According to Oakton, high power distance leads to a need
for agility when combined with a turbulent business environment. The generalization in
Figure 5-2 is “An Organizational Culture of Low Power Distance drives a need for
Agility in Existing Information Systems”.
1 Hofstede (1980; 1983) talks about national culture in IT organizations. Leidner and Kayworth (2006) review other culture typologies that are less prominent than Hofstede’s. The applicability check with Oakton was not an appropriate platform for discussing the relative merits of culture typologies. I chose Hofstede’s dimensions to elicit generalized observations on organizational culture from Oakton consultants at this early stage of the research. Leidner and Kayworth describe Hofstede as more explicit and observable compared to other models, such as Schein (1985). This thesis did not pursue the theme of organizational culture beyond this stage.

Chapter 5
86
Uncertainty Avoidance
The second cultural dimension is the level of tolerance for uncertainty and ambiguity. A
low Uncertainty Avoidance reflects an organization that is less procedure-bound and
less able to manage change. A high Uncertainty Avoidance creates a rule-oriented
organization that institutes procedures to manage change (Hofstede 1980; Hofstede
1983).
Oakton observed that low uncertainty avoidance requires agility to a greater degree than
organizations that have high uncertainty avoidance cultures. This has been fundamental
because change is more likely in a low uncertainty avoidance culture. Interestingly,
Oakton’s experience is that the higher the uncertainty avoidance, the more controlled
the changes and this, at times, increases the ability to change (even if it reduces the
propensity to do so). The generalization in Figure 5-2 is “An Organizational Culture of
Low Uncertainty Avoidance drives a demand for Agility in Existing Information
Systems”.
Individualism-Collectivism
The final cultural dimension for organizations is the reinforcement of individualist or
collectivist relationships. High Collectivism closely ties individuals within a group.
Everyone seeks consensus from fellow members of their group. These closely bonded
groups may be introspective and less inclined to share knowledge across organizational
boundaries. High Individualism indicates that individual independence and
responsibility are dominant within the organizations. Individuals may tend to form a
large number of loose relationships outside of the immediate group and facilitate
sharing of knowledge across organizational boundaries (Hofstede 1980; Hofstede
1983).
Typically, it has been Oakton’s experience that high collectivism slows decision-making
and hence reduces the need for agility. According to Oakton, the time to get consensus
from decision-makers and to prepare for the change occurs in parallel. The
generalization in Figure 5-2 is “An Organizational Culture of High Collectivism reduces
a need for Agility in Existing Information Systems”.

Applicability check
87
5.5. Enabling factors for the IT function
Given the relevance of agility of information systems to an organization based on its
business environment, operating model and culture, Oakton identified some enabling
factors to leverage existing information systems. These enabling factors are a structure
of the IT function, and the governance framework that surrounds these capabilities.
5.5.1. IT Function structure
The VSM suggested a structure of the IT function that is necessary and sufficient to
adapt a system within a fluctuating environment (Beer 1979). The structure consists of
Delivery, Audit, Intelligence and Policy subsystems.
Performance of these subsystems can be dispersed throughout the IT function and
include business unit representatives, in-house IT staff, external consultants, IT product
vendors and outsourcers. Individual roles can vary from providing consultancy
recommendations to direct responsibility for exercising IT processes. The white paper
discusses how to identify who performs these subsystems in the IT function, some of
their constituent tasks and Oakton’s insights on their effect on agility in existing
information systems.
Delivery
The Delivery subsystem in the IT function is identifiable by asking: “Who has direct
responsibility for the ‘inside and now’ control of implemented information systems?”
The capability includes the tasks of sourcing the plans and schedules for the information
system adaptations, monitoring the operation of each information system, and
monitoring the coordination of the information systems (Beer 1979).
Oakton observed that the Delivery must have a solid understanding of what is required
to achieve agility and the dimensions of agility required in the future for the
organization. According to Oakton, Delivery needs to plan agility into both the
processes to develop systems and the technical solutions devised. The generalization in
Figure 5-2 is “The IT capability of Delivery requires an understanding of Agility in
Existing Information Systems”.

Chapter 5
88
Audit
Identifying the Audit subsystem in the IT function comes from asking: “Who has the
responsibility for any sporadic audit?” The audit capability ensures that directions to the
information systems performed as reported, fills in possible gaps in reporting, and
makes special case assessments of operations of the information system (Beer 1979).
Oakton had not observed a significant relationship between an Audit capability and
agility. According to Oakton, there is a perception that good discipline of Audit
encourages agility, but it is more an indicator than a prerequisite. The generalization in
Figure 5-2 is “The IT capability of Audit reinforces practices needed for Agility in
Existing Information Systems”.
Intelligence
The Intelligence subsystem in the IT function is identified by asking: “Who spends most
of their time looking to the environment and the future?” The Intelligence subsystem
includes the tasks of maintaining a model of the information systems and the
environment, gathering data from the environment and the internal operations of the
information systems, probabilistic modeling of future events to predict how the
information systems will react, and proposing structural changes to the information
systems (Beer 1979).
According to Oakton consultants, agility comes by means of desire and planning. The
degrees of freedom required needs planning across the people, processes, technology
and culture of organizations. According to Oakton, the role of the intelligence capability
in understanding the dimensions of change needed is critical to actually achieving an
agile IT environment. The generalization in Figure 5-2 is “The IT capability of
Intelligence is critical for Agility in Existing Information Systems”.
Policy
Identifying the Policy subsystem in the IT function comes from asking: “Who sets the
overall goals and constrains the possibilities of adaptation?” The Policy subsystem
includes incidences of producing policy to govern the behaviour of the information

Applicability check
89
systems, intervening in the Intelligence-Delivery interaction, and thinking about what is
being produced and why (Beer 1979).
Oakton observed that a Policy capability has a material effect on the agility of the
organization, during policy planning, framing and enforcement. Oakton observed two
facets of this effect. One is the support for agility by the nature and styles of its policies;
and the other is the support by the way it adapts the actual policies to changing
circumstance. The generalization in Figure 5-2 is “The IT capability of Policy has a
material effect on Agility in Existing Information Systems”.
5.5.2. IT Governance Offices
The following are the offices of the IT function that Oakton sees as necessary for a
practical framework of good IT governance: Strategy and Enterprise Architecture,
Program Management Office and Application Management Office.
The accountabilities of these offices are not the direct management of IT resources, to
detail a program of business initiatives, or the delivery and running of the enabling IT.
The consideration given to these IT governance offices is their decision rights that are
particular to leveraging existing information systems for emerging opportunities. An IT
function should have all of these offices.
Strategy and Enterprise Architecture
The decision rights of the office cover aligning business and IT strategies, monitoring
benefit realization, translating strategy to operational programs, prioritizing initiatives
for delivery, and communicating with strategy stakeholders. Deliverables of the office
include identified IT trends and opportunities, approved current and target enterprise
architectures, and transition roadmaps.
As noted, it is clear from Oakton’s insights that agility comes via desire and planning.
The degree of freedom required needs planning across the people, processes, technology
and culture of organizations. According to Oakton, the role of the strategy and
architecture capability in understanding the dimensions of business and IT change
needed are critical to achieving an agile environment. The generalization in Figure 5-2

Chapter 5
90
is “The IT governance office of Strategy and Enterprise Architecture is critical for
achieving Agility in Existing Information Systems”.
Program Management Office
The decision rights of the office cover a disciplined approach to project delivery, a
single point of contact for project status, and ownership of project management
standards. Deliverables of the office include audited information on delivery cost and
time estimates, performance to plan, delivery risks and architectural compliance.
Oakton observed that agility is a function of design and control. The role of the Program
Management Office is establishing the control framework for implementation.
According to Oakton, this is a key element of planning agility objectives for delivery, or
explicitly ignoring agility due to another agreed business driver. The generalization in
Figure 5-2 is “The IT governance office of Program Management is a key element for
Agility in Existing Information Systems”.
Application Management Office
The decision rights of the Application Management Office cover a disciplined approach
to delivering IT-enabled business initiatives beyond the usual view of project
completion, ownership for application support, and contact for operational support.
Deliverables of the office include the measurements of service levels, problem
management, and capacity and security.
The role of the Application Management Office and other support groups is unclear
concerning agility. On one hand, having appropriate support is a key to a stable and
effective IS environment that delivers business value on an ongoing basis despite
change. However, Oakton have not seen a direct impact on agility per se. The
generalization in Figure 5-2 is “The IT governance office of Application Management
has no direct impact for Agility in Existing Information Systems”.

Applicability check
91
5.6. An intervening factor on the IT function
Oakton identified the IT governance model as a factor that may drive or confound the
IT function’s enablement of agility in existing information systems. IT governance
involves specifying decision rights and accountabilities for important IT decisions. The
aim is to encourage desirable behaviours in the use of IT. An international survey of
more than 250 organizations found a wide variety of arrangements for decision rights
(Weill 2004). IT governance archetypes that classify these arrangements include
Business Monarchy, IT Monarchy, Feudal, Federal and IT Duopoly. An organization
should conform to only one of these IT governance models.
5.6.1. Business Monarchy governance
A Business Monarchy model of IT governance has the corporate-level business
executives making IT decisions that affect the entire organization. The Chief
Information Officer may participate as an equal partner with other corporate-level
leaders. The corporate-level business executives receive input from many sources,
including the Chief Information Officer’s direct reports, the business units, and
organization-wide program management (Weill 2004).
Oakton observed that organizations with a Business Monarchy are at risk unless agility
is available. This is because the constant business drive for change (and sometimes
without IT moderation) has no real understanding of the systems implementations.
According to Oakton, agility is not just the ability to do what the business wants in an
instance but efficiently supporting a changing set of needs on an ongoing basis. The
generalization in Figure 5-2 is “The IT governance model of Business Monarchy has
organizational risk mitigated by Agility in Existing Information Systems”.
5.6.2. IT Monarchy governance
In IT Monarchies, the IT professionals make the IT decisions. Organizations implement
IT monarchies in many different ways, often involving IT professionals from both
corporate teams and business units (Weill 2004).

Chapter 5
92
Oakton’s insight is that this style of governance inwardly focuses the agility on
technology in information systems rather than business initiatives. According to Oakton,
the implemented electronic processes and networks change the nature and the focus of
the IT function. As with all of the insights, it is a matter of degree rather than absolute
focus. The generalization in Figure 5-2 is “The IT governance model of IT Monarchy
drives technology-based Agility in Existing Information Systems”.
5.6.3. Feudal governance
The feudal model has business unit leaders, key process owners, or their delegates
making the IT decisions for a business unit, region or function. The feudal model does
not seek synergies across business units (Weill 2004).
Oakton’s insight on these organizations is that the number of leaders driving unique
changes compromise agility. This tends to fragment the change program and challenge
the IT function’s management of the program. The relationship in Figure 5-2 is “The IT
governance model of Feudal compromises Agility in Existing Information Systems”.
5.6.4. Federal governance
The federal model of IT governance has corporate executives and business unit
representatives coordinating decision-making across two levels of the business
hierarchy. Business-unit representatives can be the business unit leaders and/or process
owners. IT leaders from the corporate level or the business units may also participate,
but do not take the place of a business group (Weill 2004).
Oakton observed that this model is effective in driving the need for agility. This is
because the model requires, on a peer basis, the tradeoffs between business needs and
system capabilities. According to Oakton, the information systems supporting this
model need to be agile to fulfill the business needs. The generalization in Figure 5-2 is
“The IT governance model of Federal is effective in driving Agility in Existing
Information Systems”.
Applicability check
93
5.6.5. IT Duopoly governance
The IT duopoly governance model is where decisions represent an agreement between
IT executives and one business group as a two-party arrangement. The IT executives
may be any combination of IT groups. The business group is typically C-level
executives, business unit leaders, or business process owners (Weill 2004).
Oakton believes that an IT duopoly is expensive and tends to cause internal IT tension
as the variety of duopolies within an enterprise clash. In this light, Oakton sees
flexibility rather than agility as the key issue, that is, more the ability to handle the
greater scope of bipartisan activity than to be able to change quickly. According to
Oakton, the ability to change remains important and the appropriate control mechanisms
are vital to understand the impact of the change across a broad range of capabilities. In
the case of IT duopoly, agility helps moderate the agreement risk by being able to
understand the impacts of change across a broader range of relationships and
system/service provision. The generalization in Figure 5-2 is “The IT governance model
of IT Duopoly has ‘agreement risk’ moderated by Agility in Existing Information
Systems”.
5.7. An element of agility in information systems
5.7.1. Industry Best Practice
A question put was “How is agility determined by industry best practice?” The most
accepted best practice for a governance and control framework in the IT function is
COBIT (IT Governance Institute 2007).
Oakton notes that COBIT is a control mechanism with a heritage in the audit capability.
According to Oakton, a properly implemented control mechanism enables the
management of change from the proactive consideration of the business needs and the
management of the technological implementation. Oakton also observed that effective
agility requires a good control mechanism to ensure the desired outcomes. In this light,
Oakton considers that industry ‘best practice’ is an element rather than a determinant of
Chapter 5
94
agility. The generalization in Figure 5-2 is “Agility in Existing Information Systems has
an element of Industry ‘best practices’ ”.
5.8. Discussion of the applicability check
To enable future adaptations by leveraging existing IT investments, the Oakton white
paper focuses on how the IT function can sense and respond rapidly to emerging
opportunities and open up options for near-horizon adaptations. Oakton proposes the
return on investment into agility in information systems is likely to be positive or
negative depending respectively on the turbulence or stability of the business
environment. A return on investment is also likely to be positive where the operating
model is unified or diversified, and less likely for coordinated and replicated operating
models; and positive where the organizational culture has a low power distance to
decision-makers, low uncertainty avoidance or high individualism.
Given a potential return to an organization from agility, Oakton proposes the IT function
is more likely to leverage existing information systems with an investment into Policy,
Intelligence and Delivery capabilities and the governance offices of Strategy &
Enterprise Architecture and Program Management. The white paper suggests the
maturity levels of industry best practice achieved in the IT function indicates agility of
information systems.
Importantly, Oakton proposes how different models of the IT governance, at the whole-
of-organization level, can drive or confound the enablement of agility by the IT
function. In some IT governance models, the IT function enabling agility may mitigate
the inherent risks of the model. On the other hand, Oakton suggests the IT Monarchy
and Feudal governance models may compromise the IT function enabling agility.
The white paper reflects an endorsement of the VSM meta-system applicability to the
IT function. Overall, Oakton observed that System THREE must have a solid
understanding of what is required to achieve agility, System FOUR understanding the
dimensions of change needed are critical to achieving agility and that System FIVE has
a material effect on the agility of the organization.

Applicability check
95
5.9. Propositions suggested from applicability check
The applicability check with Oakton provided insights into agility in information
systems and, specifically, how the IT function can leverage those systems. In addition to
the propositions from the theory development (see section 3.3.4), the generalizations
from Oakton white paper suggested to myself three further propositions of interest to
this thesis. The first proposition is:
P4 IT function is more likely to leverage existing information systems with an
investment into Policy, Intelligence and Delivery based capabilities.
Regarding enabling agility in existing information systems, the Oakton consultants’
insight on their client organizations is that Policy has a material effect on, Intelligence is
critical for and Delivery requires an understanding of agility (see Figure 5-2). The
proposition P4 suggested by the applicability check is closely related to the propositions
P1, P2 and P3 of the theoretical development.
Second, Oakton consultants’ insight that industry ‘best practice’ is an element rather
than a determinant of agility suggested the following proposition:
P5 The industry best practice achieved in the IT function indicates the agility of
information systems.
Oakton proposition P5 informed this thesis’ use of maturity levels of industry practices
as reflective measures of the IT function’s capability to enable agility, as opposed to
being formative measures for the capability. The last proposition, of interest to this
thesis, suggested by the Oakton applicability check related to IT governance
frameworks and agility in existing information systems.
P6 Different models of the IT governance amplify or attenuate the IT-dependent
strategic benefits obtained from agility of information systems.
The Oakton consultants’ insight that business monarchies have organizational risk
mitigated by agility (see Figure 5-2) suggested proposition P6. Weill recognizes
business monarchies as an archetype of IT governance, where a group of corporate level
Chapter 5
96
executives holds the decision rights for IT investments and bar IT executives acting
independently. Business monarchies are a dominant form of IT governance. Weill’s
survey of the 256 organizations in 23 countries found 30% were business monarchies
(Weill 2004).
The last two propositions arose from the insights of the Oakton consultants. They were
not deduced from the VSM or the IS literature. The reason for including P5 and P6 in
the research was exploratory.
5.10. A limitation of the applicability check
The insights of the applicability check are subject to any bias arising from the personal
interactions between clients and an Oakton consultant. This interaction exists within a
commercial context and there is a likely difference in the balance of applicative
knowledge perceived by each of the parties. To mitigate this personal bias, the white
paper recorded the thinking of many Oakton consultants on agility. It contains insights
on the client base by two Oakton managers, made in the first four stages of the
investigation. The final stage asked twelve other Oakton consultants to verify the
insights. The aim was to obtain a consensus view of the generalizations from the Oakton
consultants.
Individual Oakton consultants have practical experience that constitutes an applicative
knowledge that is of equal value to theory. The applicative knowledge enables
practitioners to perform thought experiments and decide if theory is applicable based on
their knowledge of the operational conditions (Klein and Rowe 2008). Practitioners use
an ability to explain a result with a generalization generated by their intuition and reject
other propositions as implausible based on their experience.
A quantitative survey directed to the Oakton clients (see section 7.3) addressed the
limitation of the insights being subject to a perception bias of Oakton consultants
arising from personal interactions.

Applicability check
97
5.11. Conclusion of the applicability check
The applicability check with Oakton consultants is not a rigorous test of the theoretical
developments of Chapter 3. The applicability check provided a prima facie basis for the
propositions deduced from applying the VSM to the IT function and explores further
propositions on agility of the information systems generalized from the Oakton client
base.
There are two research results of the applicability check. First, a prima facie check of
the theoretical developed propositions of section 3.3.4, conducted with a group of
reflective Oakton consultants, justified the effort for a field survey of many hundred
Oakton clients to rigorously, quantitative test the propositions.
Second, the applicability check raised further research propositions from the insights of
the Oakton consultants. The propositions inducted from the relational model for agility
in existing information systems chosen for rigorous quantitative testing are those on the
right-hand of Figure 5-2 and represent the enabling factors of agility in the model.
Section 6.3 lists these propositions and forms them into testable hypotheses of interest
to the research question. The propositions from the left hand of Figure 5-2 represent the
relevance factors for agility in information systems, and noted for future research
projects (see section 13.3.1)

Chapter 5
98
.

99
Chapter 6. Construct development
6.1. Introduction
This chapter provides further justification for the constructs of the propositions from the
theoretical development (section 3.3.4). It forms the constructs into variables of
hypotheses suitable for quantitative research and discusses their measurement. A pilot
survey tested the reliability of the measures of the variables.
6.2. Conceptual definitions
This thesis used the following terms in developing concepts from the theoretical
development to empirical testing and data analysis. A ‘construct’ is a broad mental
configuration of a given phenomenon, while a ‘variable’ is a measurable configuration
derived from a construct (Wetzels et al. 2009). This thesis has variable names
capitalized.
A construct or variable may be either endogenous or exogenous, depending whether it
has a causal relationship inside or outside the structural model. A construct or variable
may be independent or dependent, based on whether it produces or results from a causal
relationship. A construct or variable can be both endogenous and independent, if it is
part of a second-order causal relationship in a structural model, e.g. D-OPTIONS in
Figure 6-2.
The measurement items of variables used in this thesis are all reflective and not
formative. Items are reflective where they are observable and indirectly measure an
unobservable or indefinable variable, whereas formative items cause or define a
variable (Gefen et al. 2000; Petter et al. 2007). Petter et al. (2007) offer four criteria for
a measurement item to be reflective or formative, where failing any one criterion causes
the item to be reflective. One of these criteria asks does a variance in one measurement
item of the construct not require a variance in all other measurement items of the
construct. The analysis of data collected by this thesis contained a post hoc justification

Chapter 6
100
for using reflective measures, as each variable had measurement items that vary
together (see section 7.8.4) and do not vary independently to typify a formative
construct.
For an observed value as an indirect measure of a variable, this thesis used the term
‘measurement item’ in preference to ‘indicator’. Though ‘indicator’ has common use for
the specific context of measurement models (Gefen et al. 2000), it was avoided so as not
be confused with the generic usage in this thesis.
This thesis avoided the term ‘latent variable’ in the context of PLS path modeling.
Generally, a latent variable is a construct not measured directly, but indirectly through
measurement items that reflect or form the construct (Gefen et al. 2000). In a MIS
Quarterly forward, Marcoulides et al. (2009) discourage the usage of the term with PLS
path modeling, as the PLS approximates the covariance of the measurement items of a
variable and does not fully explain covariance.
6.3. Hypotheses
6.3.1. The principal research model
Figure 6-1 shows the hypotheses that compose the principal research model. The
hypotheses model consists of a primary hypothesis (H1) informed by the theoretical
development of this thesis, an alternative to the primary hypothesis at a lower level of
analysis (H1a, H1b and H1c) but informed by the same theoretical development, and
two secondary hypotheses (H2 and H3) informed by the IS literature and the Oakton
applicability check. What follows is a description of the hypotheses of the principal
research model, along with those of alternative models that challenge the principal
research model. Chapter 9 and Chapter 10 quantitatively tested the principal research
model and the alternative models.

Construct development
101
Figure 6-1 The principal research model with hypotheses
6.3.2. Primary hypothesis of the principal research model
The propositions P1, P2 and P3 from the theoretical development (section 3.3.4) and
the propositions P4 and P5 of the Oakton applicability check (section 5.9) suggested the
following testable hypothesis:
H1. The more mature the coupled processes of Policy, Intelligence and Control
of the IT function (POLINTCON), the more often digital-options for the
existing information systems are exercisable (D-OPTIONS).
The independent variable POLINTCON arises from applying the meta-system of
Policy, Intelligence and Control of the VSM (Beer 1979) to the IT function. An
isomorphism between the VSM meta-system and the elements of agility from IS theory
requires POLINTCON to adapt existing information systems.
The Intelligence subsystem of the IT function serves the agility elements of sensing
future needs and forming digital options, which are informed by Desouza (2006),
Lyytinen and Rose (2006), Overby et al.(2006), Patten et al. (2005), Sambamurthy et al.
(2003), Seo and La Paz (2008) and Seo et al. (2006). Intelligence is consistent with

Chapter 6
102
System FOUR of the VSM, where the sub-system builds probabilistic models for
adaptations to the viable system that are based on perturbations sensed directly from the
environment (Beer 1979).
The IT function subsystem of Control encompasses the agility element of sensing
current use, which is informed by Galliers (2006), Peppard and Ward (2004) ,
Sambamurthy et al. (2003) and Seo and La Paz (2008). This is the same function of
System THREE to monitor the behaviour of the viable system (Beer 1979).
Additionally, Control realizes the agile responses to existing information systems with
technologies (Andrade and Fladeiro 2002; Bajgoric 2006; Berente 2005; Bieberstein et
al. 2005; Seo and La Paz 2008; Umar 2005) and methods (Börjesson et al. 2006;
Fitzgerald et al. 2006; Hovorka and Larsen 2006). The task is consistent with the
System THREE description to source adaptations to the viable system (Beer 1979).
The VSM meta-system houses Intelligence and Control with the Policy subsystem
(System FIVE). Policy constrains the sensing and responding behaviour of the meta-
systems to confirm to rules and resources. Within the primary hypotheses, the meta-
system is the independent variable of POLINTCON.
The dependent variable of the primary hypothesis is D-OPTIONS. This is an activity
generated by System FOUR, when applied to the IT function, and drawn from the
element of IS agility theory concerned with generating digital options for forecasted
needs. The element is best articulated in Sambamurthy et al. (2003) and conceptually
supported by Cornford et al. (2007) , Goethals et al. (2006), Seo et al. (2006), Overby et
al. (2006) and Weill et al. (2002)
POLINTCON and D-OPTIONS are ontologically different. POLINTCON is a structure
of rules and non-human resources persistent in time. In contrast, D-OPTIONS are a
sporadic activity of human agency enabled by POLINTCON. Exercising digital options
is a necessary activity for agile responses to adapt existing information systems.
Applying the VSM to the IT function, in the context of the basic model of the IS
theoretical perspective of agility (Table 2-10), suggested the causal relationship between
POLINTCON and D-OPTIONS.

Construct development
103
The definition of dependent variable of hypothesis H1 has the qualifier of exercisable,
in relation to digital options. As recalled from the literature review, digital options is an
existing concept of IS theorists and defined as rights to future IT investment choices
without a current obligation for full investment made by an initial IT investment
(Sambamurthy et al. 2003). This thesis borrowed the root verb exercise from financial
options terminology. In this thesis, exercise refers to making a full IT investment at the
time of the opportunity’s arrival. The opportunity was previous forecasted after sensing
the business environment and this forecasting resulted in an initial IT investment to
create the digital option. The initial IT investment for the forecasted opportunity might
range from adapting an existing information system to be readily configurable to
respond, creating a detailed design for a response, creating a high-level design for a
response, to formulating an alternative target IT architecture for a new business model.
If the forecasted opportunity arrives, the digital option is exercisable, in that a decision
is required for a full IT investment. Typically, a steering committee makes the decision
to exercise a digital option based on resources required, top-level policies and the
identity integrity of the information systems (cf. Beer 1979). The decision to act on an
exercisable digital option is that of Policy, when applying the VSM meta-system to the
IT function. In the context of adapting existing information systems, an exercised digital
option becomes the agile response for forecasted fluctuations in the environment.
The response is agile when the response time is less than conventional planning cycles
(Luftman and McLean 2004), where the total IT investment commences in reaction to
the arrival of a business opportunity. Where there is an organizational readiness to affect
agility, the initial IT investment of the exercised digital option reduces the response time
required, when calculated from the arrival time of the opportunity. The initial IT
investment is foregone if the opportunity fails to arrive, or if the opportunity arrives and
a decision is made not to exercise a digital option.
The dependent variable in hypothesis H1 refers to the frequency of exercisable digital
options, in preference to exercised digital options. This was to minimize confounding
factors in the decision to exercise a digital option, particularly budgetary considerations
to make a full IT investment when the forecasted opportunity arrives. The frequency of

Chapter 6
104
exercisable digital options was one measure of agility in information systems available
to this thesis. Alternative, later agility activity measures are the frequency of exercised
digital options or the frequency of agile responses implemented. This thesis measured
the earlier prerequisite activity of deciding on exercisable digital options as the agility
outcome to minimize later confounding factors in alternative measures.
6.3.3. Primary hypotheses at a lower level of analysis
The hypothesis H1 is at the level of analysis of the IT function as a meta-system of the
existing information systems, as interpreted from the VSM. This meta-system is an
amalgam of System FIVE, System FOUR and System THREE. A more granular level of
analysis is the structure of the IT function of System FIVE, System FOUR and System
THREE. These more granular hypotheses are:
H1a. The more mature the processes of Policy of the IT function (POLICY), as a
part of POLINTCON, the more often digital-options for the existing
information systems are exercisable (D-OPTIONS).
H1b. The more mature the processes of Intelligence of the IT function (INTELL),
as a part of POLINTCON, the more often digital-options for the existing
information systems are exercisable (D-OPTIONS).
H1c. The more mature the processes of Control of the IT function (CONTRL), as
a part of POLINTCON, the more often digital-options for the existing
information systems are exercisable (D-OPTIONS).
Hypotheses H1a, H1b and H1c are not an alternative to H1, but at a lower level of
analysis. Wetzal et al. (2009) discuss the utility of a two-tier hierarchical construct like
POLINTCON. First, a hierarchical construct affords theoretical parsimony and reduces
structural model complexity. Second, hierarchical construct models allow matching the
level of analysis of the independent and dependent variables. In this thesis,
POLINTCON is at the level of whole IT function and not the offices within the IT
function where POLICY, INTELL and CONTRL lie. Typically, a Policy capability for
agility lies in the steering committees of the IT function, an Intelligence capability in the

Construct development
105
Strategic & Enterprise Architecture office, and a Control capability in the Application
Management Offices. The level of analysis of POLINTCON matches the whole of IT
function level of D-OPTIONS.
6.3.4. Secondary hypotheses of the principal research model
The theoretical development of this thesis suggested the primary hypothesis H1 of the
principal research model. To inform further the topic, this thesis puts forward two
secondary hypotheses not founded on the theoretical development.
First, this thesis assumed that enterprise agility and information system agility exist, and
assumed that information system agility enables the enterprise. These assumptions were
based on the existing IS literature (Agarwal and Sambamurthy 2002; Desouza 2006;
Weill et al. 2002) and were tested by the following hypothesis of the principal research
model.
H2. The more often digital-options for the existing information systems are
exercisable (D-OPTIONS), the more likely that IT-dependent strategic
benefits (ITBENEFIT) occur.
Second, proposition P6 of the Oakton applicability check (section 5.9) suggested a
hypothesis to test the influence of IT governance on agility. The Oakton consultants
observed that business monarchies have organizational risk mitigated by agility (section
5.6.1). The secondary hypothesis of the principal research model is:
H3. The IT governance model (ITGOVT) of a Business Monarchy is more
likely than an IT Monarchy to realize IT-dependent strategic benefits
(ITBENEFIT) from exercisable digital-options for the existing information
systems (D-OPTIONS).
This thesis chose IT and business monarchies for comparison in this hypothesis because
of the distinction between these IT governance archetypes. The distinction is that IT
executives wholly hold IT investment decision rights in an IT monarchy, whereas

Chapter 6
106
corporate level executives hold the decision rights in a business monarchy to the
exclusion of IT executives (Weill 2004).
6.3.5. Hypotheses of alternative research models
The theoretical development underlying the principal research model has the structure
of the IT function as a determinant for the agility activity of the IT personnel. In turn,
the agility activity enables organizational benefits afforded by existing information
systems. The hypotheses therefore described a chain of effects from the coupled
POLICY, INTELL and CONTRL subsystems of IT function, through D-OPTIONS
frequency, to ITBENEFIT outcomes. Quantitative data analysis of the principal research
model will test the hypothesized relationships.
However, two alternative theoretically anchored models may describe different
relationships between IT personnel, capabilities of IT function and agility activity in
existing information systems. The first alternative model replaces the measures of the
POLINTCON variable with those of the existing practice perspective of COBIT (IT
Governance Institute 2007).
H4. The more mature the processes of the COBIT IT Goal 5 control objectives
(ITGOAL5), the more often digital-options for the existing information
systems are exercisable (D-OPTIONS).
The ontology in section 6.4 suggests a second alternative model. This alternative
replaces the ontological object of structure, the POLINTCON construct of the IT
function, with knowledge human agency (Giddens 1984).
H5. The more business knowledge displayed by IT personnel of the IT function,
the more often digital-options for the existing information systems are
exercisable (D-OPTIONS).
These two alternative hypotheses are not founded in the IS theory. They are put forward
based on existing practice perspectives and an ontological possibility (Giddens 1984).

Construct development
107
Quantitative data analysis tested these hypothesized relationships of the alternative
research models. To determine whether the principal research model fits the collected
data better than the alternative research models, this thesis compared the amount of
variance explained by the three structural models. This comparison was uncomplicated,
as three structural models use the same measurement model for the endogenous
variables of D-OPTIONS and ITBENEFIT.
6.4. Ontology
The principal research model was informed by structuration theory, which proposes that
social structure and human agency are a mutually constitutive duality (Giddens 1984).
Structuration is a theory of human society that accounts for the sort of things that are in
the world, but not what is happening between them, and which Jones and Karsten
(2008) describe as an ontology for IS research. Structuration theory deals with social
phenomena at a high level of abstraction rather than their instantiation in a specific
context (Jones and Karsten 2008).
Figure 6-2 Principal research model of ontological objects
In this thesis, the structure of POLINTCON predicts the phenomenon of ITBENEFIT
by means of the activity of D-OPTIONS. The structural model of Figure 6-2 reflects

Chapter 6
108
this instantiation. The exogenous variable of POLINTCON is a structure of “rules of
social life which are techniques or generalizable procedures applied in the enactment
and reproduction of practices” (Jones and Karsten 2008 p. 131). Giddens argues that
structure is enabling as well as constraining. The endogenous variable of ITBENEFIT is
a phenomena arising from product of structure and the knowledgeable human agency of
the IT function (D-OPTIONS). Human agents draw on structures in their activity and, at
the same time, this activity serve to produce and reproduce structure. The human agents’
knowledge maps to the exogenous variable of BUSKNOW.
From the IS practitioner perspective, these ontological objects can be interpreted as the
key goal indictors of ITBENEFIT being predicted by maturity models of the
POLINTCON, by means of the key performance indicators of D-OPTIONS. Key goal
indictors, maturity models and key performance indicators are recognized components
of ‘best practice’ frameworks, such as COBIT (IT Governance Institute 2007). Key goal
indicators point to met goals, persistent after the fact, while key performance indicators
point toward the likelihood of meeting the goals at point in time before the outcome is
clear (IT Governance Institute 2007).
6.5. Conceptual variables and their measurement
The following sections define the measures for the variables of the hypotheses. Each
measurement was a Likert-type item on the questionnaire. A parenthesized code made
up of an alphabetic prefix and a numeric suffix references the measurement items in the
questionnaire. The prefix indicates the Likert scale of the item: a ‘MAT’ prefix indicates
a six-point maturity scale, ‘AGR’ a five-point agreement scale and ‘FRQ’ a five-point
frequency scale. The suffix is the question number on the questionnaire. The complete
four-page, research instrument is in Appendix A.
6.5.1. POLINTCON variable
The variable POLINTCON represented the VSM meta-system applied to the IT
function, as proposed by the theoretical development of this thesis. The VSM meta-
system is composed of System FIVE, System FOUR and System THREE. In the

Construct development
109
context of the IT function, POLINTCON is a composite of the variables POLICY,
INTELL and CONTRL, which respectively represent System FIVE, System FOUR and
System THREE.
As a composite, POLINTCON possesses a mutual property to enable agility in existing
information systems. In applying the VSM, POLICY, INTELL or CONTRL
individually do not possess this property. POLINTCON possesses the mutual property
only by relating to components (cf. Shanks et al. 2002). The measure for the composite
variable POLINTCON is the whole of the measures from each of the component
variables of POLICY, INTELL and CONTRL.
Capabilities are hidden within the fabric of the IT function but can be reflectively
measured by business performance (Peppard and Ward 2004). The maturity of IT
processes are a predicate IT function performance (IT Governance Institute 2007) and
offer a reflective measure of capability. To form testable hypotheses, this thesis
measures the component variables of POLICY, INTELL and CONTRL with the
maturity of IT processes that reflect the agility capability.
The measures for POLICY, INTELL and CONTRL used an ordinal scale of non-
existent, initial, repeatable, defined, managed and optimized. The maturity scale is
recognizable to many IT practitioners from the ‘best practice’ frameworks of COBIT
(IT Governance Institute 2007) and ITIL (Office of Government Commerce 2005), and
originated from the maturity framework developed by the Software Engineering
Institute at Carnegie Mellon (Humphrey 1987). The use of maturity levels as a scale for
quantitative measures has precedents in IS research (Sledgianowski et al. 2006).
The following is a description of the measures for each of the component variables of
POLICY, INTELL and CONTRL that constitute POLINTCON.
POLICY variable
The variable POLICY represented the Policy subsystem of the IT function. From the
theoretical development of this thesis, this construct is an interpretation of the VSM
subsystem of System FIVE. The measures for the POLICY are variable:

Chapter 6
110
• to develop and maintain a set of policies to support IT strategy. This includes
policy intent, roles and responsibilities (MAT37);
• to establish and maintain an optimal co-ordination, communication and liaison
structure within the IT function (MAT38); and
• to create a strategic plan that defines how IT goals will contribute to the
company’s strategic objectives (MAT39).
The measures interpret the VSM attributes of System FIVE. System FIVE produces
policy that governs the behaviour of the total system i.e. top-level rules (MAT37),
monitors the System THREE and System FOUR couple, supervises their behaviour and
mediates conflicts (MAT38), and thinks about what is being produced and why, i.e. the
viable system is produced by System ONE (MAT39) (Beer 1979).
The three measures (MAT37, MAT38 and MAT39) reuse existing COBIT control
objectives. The COBIT control objectives respectively are PO6.3 IT Policies
Management, PO4.15 Define the IT Relationship and PO1.4 Define a strategic IT plan
(IT Governance Institute 2007).
INTELL variable
The variable INTELL represented the construct of the Intelligence subsystem of the IT
function. From the theoretical development of this thesis, this construct is an
interpretation of the VSM subsystem of System FOUR. The measures for the INTELL
variable are:
• to maintain a set of high-level designs for IT-enabled capabilities, which are
options for forecasted business initiatives (MAT34);
• to implement a set of IT-enabled capabilities, which are readily configurable for
forecasted business initiatives (MAT35);
• to assess any unexpected operational consequences, arising from existing
information systems, to forecast business initiatives (MAT36);

Construct development
111
• to monitor the business sector, industry, technology, infrastructure, legal &
regulatory environment trends (MAT40);
• to analyze existing and emerging technologies, and plan which technological
direction to realize the IT strategy (MAT43); and
• to develop a feasibility study that examines the possibility of implementing the
requirements and alternative courses of action (MAT44).
The measures interpret the VSM attributes of System FOUR. System FOUR builds
probabilistic models to react to forecasted events (MAT34 and MAT36), gathers data
from the environment (MAT40 and MAT43), and indicates structural changes that lead
to a different configuration of System ONE and System TWO (MAT35 and MAT44)
(Beer 1979).
Three of these six measures (MAT40, MAT43 and MAT44) reuse existing COBIT
control objectives. The COBIT control objectives respectively are PO3.3 Monitoring of
future trends and regulations, PO3.1 Technological Direction Planning and AI1.3
Feasibility Study and Formulation of Alternative Courses of Action) (IT Governance
Institute 2007).
CONTRL variable
The variable CONTRL represented the construct of the Control subsystem of the IT
function. From the theoretical development of this thesis, this construct is an
interpretation of the VSM subsystem of System THREE. The measures for the
CONTRL variable are:
• to acquire and maintain applications in line with IT strategy and IT architecture
(MAT45);
• to continuously monitor specified service level performance, and report in a
format that is meaningful to the stakeholders (MAT46); and

Chapter 6
112
• to report service desk activity to enable management to measure service
performance and to identify trends (MAT47).
The measures interpret the VSM attributes of System THREE. System THREE sources
the plans, programs and schedules to adapt System ONE (MAT45); monitors the
behaviour of System ONE resulting from the regulatory action of System TWO
(MAT46); and monitors System TWO (MAT47) (Beer 1979).
The three measures (MAT45, MAT46 and MAT47) reuse existing COBIT control
objectives. The COBIT control objectives respectively are AI2 Acquire & maintain
application software, DS1.5 Monitoring and Reporting of Service Level Achievements
and DS8.5 Reporting and Trend Analysis (IT Governance Institute 2007).
6.5.2. D-OPTIONS variable
The variable D-OPTIONS represented the construct of exercisable digital-options for
the existing information systems. The measures for the D-OPTIONS variable are:
• have existing information systems that are readily configurable for a new
business initiative (FRQ07);
• have existing detailed designs for IT that can be used, partially or wholly, for a
new business initiative (FRQ08);
• have existing, high-level designs for IT that can be used, partially or wholly, for
a new business initiative (FRQ09); and
• have alternative target IT architectures and road maps for new business models
(FRQ10).
The reflective measures of the variable D-OPTIONS are the respondents’ experience of
how often their company has exercisable digital options. The reflective measures have
an ordinal scale of very frequently, somewhat frequently, occasionally, rarely and never.

Construct development
113
This construct was suggested by the concept of digital options in IS literature on agility
(Sambamurthy et al. 2003), where the IT function maintains a portfolio of digital
options. If the forecast need arises, the exercising of a digital option becomes the agile
response for the existing information systems. The frequency of exercising digital
options observed by the survey respondents was the operationalization of the concept.
6.5.3. ITBENEFIT variable
The variable ITBENEFIT represented the construct of IT-dependent strategic benefits.
Measures of IT-dependent strategic benefits that might arise from agility in existing
information systems were based on Mirani and Lederer (1998), who developed an
instrument to assess the strategic benefits of IS projects. These IT benefits have sub-
dimensions of competitive advantage, business alignment and customer relations. A
survey of IT professionals on the anticipated benefits of projects they have recently
worked on, as best as they can recall, derives the measurement items associated with the
sub-dimensions.
Mirani and Lederer (1998) offer research instrument measures for the sub-dimensions
of IT strategic benefits. Most of these measures appear in the questionnaire in the
surveys of this thesis. The competitive advantage dimension has the measures to:
• enhance competitiveness or create strategic advantage (AGR24); and
• enable the organization to catch up with competitors (AGR25).
The business alignment dimension has the measures to:
• align well with stated organizational goals (AGR26);
• help establish useful linkages with other organizations (AGR27); and
• enable the organization to respond more quickly to change (AGR28).
Mirani and Lederer (1998) propose the instrument measures as an evaluation tool to
assess the performance of the IT function.

Chapter 6
114
Not included in this thesis questionnaire was the Mirani and Lederer (1998) customer
relations sub-dimension of IT strategic benefits. Improvements to customer relations,
providing new products or services to customers and providing better products or
services to customers measure this sub-dimension. The exclusion of these three
measures was not to over-represent customer relations at the expense of supplier,
regulator and strategic partner relationships in overall agility, and to maintain brevity in
the questionnaire.
The items of IS strategic benefits used in this thesis’ questionnaire (AGR24, AGR25,
AGR26, AGR27 and AGR28) were linked to the agility by Fink and Neumann (2007).
Fink and Neumann measured the concept of IT-Dependent Strategic Agility in their e-
mail quantitative survey of IT professionals. Fink and Neumann describe this form of
agility as the ability to respond efficiently and effectively to emerging market
opportunities by taking advantage of existing IT capabilities.
Börjesson and Mathiassen (2005) argued that the two complementary elements of
transactional and informational dimensions of agility are needed for using IT to react
quickly and effectively (IT dependent strategic agility). An organization would probably
not be able to use IT to respond successfully to emerging opportunities or threats if
changes to its systems and information use practices are costly and complicated.
Sambamurthy et al. (2003) considered IT competence, of which the quality of IT
infrastructure is a key element, a critical antecedent for firms to generate more
competitive actions and greater action repertoire complexity. Weill et al. (2002) found a
significant correlation between infrastructure capability and strategic agility, defined by
the set of business initiatives an enterprise can readily implement.
To reflect this thesis' definition of IT-benefits and its focus on shared IT capabilities as a
source of agility, these measures assessed the agility attributed directly to IT shared
across the organization.

Construct development
115
6.5.4. BUSKNOW variable
The variable BUSKNOW represented the construct of business knowledge of the IT
personnel of the IT function. The business knowledge is the capability of IT personnel
to understand the functions of the business units and understanding the business
environment (Lee et al. 1995). Business knowledge enables IT personnel to anticipate
and plan for implementation needs and to align IT and business strategies (Duncan
1995; Henderson and Venkatraman 1993).
The measurement items for business capability of the IT function’s personnel are drawn
from those proposed by Byrd and Turner (2001) measurement items for technology
management. These measures are:
• IT personnel are knowledgeable about the key success factors that must go right
if our organization is to succeed (AGR17);
• IT personnel are encouraged to learn new technologies (AGR18);
• IT personnel closely follow the trends in current technologies (AGR19); and
• the strategies of the IT group and our organization’s strategies are well aligned
(AGR20).
Measurement items for business skills are:
• IT personnel understand our organization’s policies and plans (AGR21);
• IT personnel are able to interpret business problems and develop appropriate
technical (AGR22); and
• IT personnel are knowledgeable about business functions (AGR23).
6.5.5. ITGOAL5 variable
The variable ITGOAL5 represented the construct Create IT agility from COBIT. The
industry practice of COBIT has a goal of Create IT agility (IT Goal 5) that depends on
Chapter 6
116
four measurable control objectives over the IT processes. These COBIT objectives are
the basis for measurement items for the existing industry practice:
• Define the information architecture (COBIT objective PO2) enables IT to be
agile in responding to business requirements, to provide reliable and consistent
information, and to seamlessly integrate applications into business processes
(MAT42);
• Define the IT processes, organization and relationships (COBIT objective PO4)
enables IT to be agile in responding to the business strategy, whilst complying
with governance requirements, and providing defined and competent points of
contact (MAT31);
• Manage IT human resources (COBIT objective PO7) (MAT32); and
• Acquire and maintain technology infrastructure (COBIT objective AI3)
(MAT33).
6.5.6. ITGOVT variable
The variable ITGOVT represented the construct of IT governance. The IT governance
archetype is the independent variable for testing H3. A single categorical item (CAT05)
in the survey questionnaire measures the variable: Which of the following best describes
the group that makes the strategic business / IT decisions for your company? The
CAT05 item offered respondents five archetypes of IT governance:
• corporate-level business executives, signifying a Business Monarchy model;
• corporate-level IT executives, signifying an IT Monarchy model;
• business unit leaders, signifying a Feudal model;
• IT executives and one business group, signifying an IT Duopoly; and
• corporate executives and business unit leaders, signifying a Federal model.

Construct development
117
The offered IT governance archetypes and signifying values in the research instrument
are based on a survey of organizations on the arrangements of decision rights for
important IT decisions by Weill (2004).
6.6. Testing of the variables
A pilot survey of eight Oakton consultants tested the variables to determine whether the
measurement items demonstrated reliability (see section 7.3.1). Reliability is the extent
that all the measurement items for a given variable have consistent values and a
common benchmark is a Cronbach's alpha of 0.7 or higher (Gefen et al. 2000). Table
6-3 shows that the data collected from the pilot survey met the Cronbach's alpha
benchmark for all but one variable.
Variable No. of measurement
items
Cronbach’s alpha
POLINTCON 12 0.919
D-OPTIONS 4 0.940
ITBENEFIT 5 0.863
BUSKNOW 7 0.916
ITGOAL5 4 0.568
Table 6-3 Test of variables for reliability using a pilot survey (n=8)
Only the variable ITGOAL5 failed to meet the benchmark. This variable had four
measurement items prescribed by COBIT and, consequently, must remain unchanged to
be representative of the existing industry practice. The variable ITGOVT had a single
categorical item and did not require testing for reliability.
The pilot survey suggested the variables displayed sufficient reliability for use in larger
quantitative surveys. The results from the larger surveys, as reported in Chapter 9, later
supported this conclusion. The variable ITGOAL5 also displayed sufficient reliability in
the larger surveys.

Chapter 6
118
6.7. Summary of the variables used
The above sections developed variables for six constructs: an IT function structure that
is a coupling of Policy, Intelligence and Delivery; an IT function capability to create
agility prescribed by COBIT; exercisable digital options; IT-dependent strategic
benefits; business knowledge of the IT personnel; and IT governance archetype.
The variables used a variety of measurement scales. The two variables of the IT
function share sixteen measures that use a six-point ordinal scale based on maturity
levels. The exercisable digital options have four measures using a five-point ordinal
scale based on frequency. The variables for IT-dependent strategic benefits and business
knowledge have respectively five and seven measures that use a five-point ordinal scale
based on agreement with statements. The last variable of IT governance archetype has a
single measure of six categories. Table 6-4 summarizes the six variables.
Variable Ontological
type
Measures
POLINTCON A structure of
rules and non-
human resources
Maturity of processes associated with the IT
function subsystems of Policy, Intelligence and
Delivery, as perceived by respondents
D-OPTIONS Human activity Frequency of digital options exercisable, as
perceived by respondents
ITBENEFIT Social
phenomena
Agreement with statements of IT-dependent
strategic benefits from existing information
systems, as perceived by respondents
ITGOVT A structure of
rules and non-
human resources
Categories of IT governance archetypes, as
perceived by respondents
BUSKNOW Human agency Agreement with statements of business knowledge
of IT personnel, as perceived by respondents
ITGOAL5 A structure of
rules and non-
human resources
Maturity of processes associated with the IT
function creating IT agility, as prescribed by
COBIT and perceived by respondents
Table 6-4 Summary of variables and measures

Construct development
119
The principal research model (see Figure 6-1) used four of the six variables to support
three hypotheses. These variables are POLINTCON, D-OPTIONS, ITBENEFIT and
ITGOVT. The principal research model relates the first three variables for the
hypotheses H1 and H2, and supports the hypothesis H3 by segmenting collected data
into ITGOVT categories. The principal research model did not use the remaining
variables, BUSKNOW and ITGOAL5. The alternate hypotheses (see section 6.3.5)
utilize these two variables for comparison with the explanative value of the principal
research model.
6.8. Conclusion on the construct development
This chapter developed the hypotheses and the variables used in quantitative theory
testing, and the items used to measure the variables. Chapter 9 will evidence with post
hoc data analysis that these measurement items displayed high reliability. The reliability
of the first order predictors of POLICY, INTELL and CONTRL variables, and the
second order predictor of POLINTCON in a hierarchy, indicated that the VSM meta-
system translated effectively to the hypotheses.
Two variables, BUSKNOW and ITBENEFIT, and their measurement items were
adopted from existing concepts in the IS theoretical literature. Again, post hoc data
analysis of the variables and measurement items confirmed strong reliability.
The variable of D-OPTIONS, suggested by IS theoretical literature but without existing
measurement items, had new measurement items proposed by this thesis. Similarly, the
data analysis reported in Chapter 9 supports the measurements of the variable.
This chapter developed hypotheses and variables, whereas the next chapter describes
the methodology used in quantitative surveys to gather data for these variables.

Chapter 6
120

121
Chapter 7. Survey methodology
7.1. Introduction
This chapter documents the research method used in the data collection phase of this
thesis to test the hypotheses developed in section 6.3. The chapter describes two
quantitative surveys. The surveys sampled the perceptions of IT managers/professionals
and business managers/stakeholders of the IT function of large companies. The t-tests in
section 7.5 evidences that each sample belonged to the same underlying population. The
first data collection used a mailed survey of Oakton consultants (as a pilot survey) and
the entire of Oakton client base, while the second data collection was a web-based
survey of LinkedIn users that are members of professional discussion groups with an
interest in the IT function. A summary of the survey responses is in Table 7-1. The
chapter concludes by introducing the PLS path modeling method, which is the mainstay
of the data analysis in Chapter 9.
Survey Method Anonymity Period Individuals Organizations
Oakton consultants Mailed No Jun 2008 8 1
Oakton clients Mailed No Sep 2008 36 34
LinkedIn discussion group members
Web based
Yes Nov 2008 Jan 2009
35 35
TOTAL 79 70
Table 7-1 Summary of survey responses
7.2. Research Method
There were two aims of the surveys undertaken: descriptive research and hypotheses
testing. First, the survey provided a snapshot of the client base of Oakton as to process
maturity of their IT function to enable agility in existing information systems.
Descriptive research is a valid use of the survey research method (Galliers 1991; Shanks
et al. 1993). Second, the survey tested the correlation of variables of process maturity
of the IT function and the frequency of agility outcomes. The theoretical development
of this thesis proposed causality between these variables by applying Beer’s VSM to the

Chapter 7
122
IT function. The survey research method can be used for hypothesis testing (Galliers
1991; Shanks et al. 1993). If the survey was unsuccessful in correlating variables for
hypotheses testing, the descriptive research findings remain to complement the
conceptual theory and qualitative study of Oakton in the other modes of investigation of
this thesis.
The unit of analysis of this thesis was individuals in the IT function of organizations
who completed the survey. The level of analysis was the entire IT function of
organizations, as the object of the questions in the survey.
7.3. Data Collection: Mailed Survey
The following is a description of an Oakton and University of Melbourne Australian
Industry Survey of Agility in Information Systems. The structure of the mailed survey
was in accordance with established research methods (Churchill Jr 1979; Dillman
2000).
7.3.1. Pilot
The first mailed survey was a pilot of the questionnaire and sent to twelve employees of
the enterprise architecture and strategy practice of Oakton. The pilot survey was of the
agility of Oakton in-house information systems and not that of their client organizations.
The University of Melbourne researcher treated the responses confidentially and did not
share the responses with anyone in Oakton in any form. The pilot respondents e-mailed
comments on the efficacy of completing the survey directly to me.
The pilot survey resulted in eight completed responses from the twelve mailed
questionnaires. Respondents classified themselves as IT professionals (6), IT managers
(1) and business stakeholders (1). The most of the respondents (5) had one to five years
of employment with Oakton, with the remaining having less than one year (3). The pilot
feedback led to questionnaire changes from American to UK spelling and adding the
term “turbulent” to the glossary. The data analysis from the pilot survey suggested that

Survey methodology
123
the measurement items displayed sufficient reliability for their associated variables, as
reported in section 6.6.
7.3.2. Theoretical population
The second mailed survey’s target population was the Oakton’s client base of
organizations. Oakton provided access to their client base for potential respondents for
the survey, and identified an IT professional and a business stakeholder in most of the
organizations. This resulted in mailing a questionnaire to 506 individuals in 257 client
organizations.
Of these 506 questionnaires, 169 returned undelivered due to insufficient addressing or
the contact no longer being at the address. This left a possible 204 organizations with at
least one deliverable survey. Thirty-four organizations returned 36 completed surveys,
giving an organizational response rate of 16.75%. Two organizations each completed
two responses from different individuals.
7.3.3. Participants
The activities of the 34 organizations responding to the mailed survey were:
• Education and training (2);
• Electricity, gas, water and waste
services (5);
• Financial and insurance (5);
• Information media and
telecommunications (1);
• Manufacturing (3);
• Mining (2);
• Other community, social and
personal services (3);
• Professional, scientific and
technical services (2);
• Public administration and
defense (4);
• Rental, hiring and real estate
services (3);
• Retail trade (2);
• Transport, postal and
warehousing (1);
• Unidentified (1)
The single information media and telecommunications organization in the mailed
survey was an internet service provider. The sample represented organizations that are
not part of IT industry, as expected from the client bases of an IT services consultancy.

Chapter 7
124
This affords the sample a wide representation for the transferability of findings to other
large organizations, as explored in section 11.9.
Business environments were described as competitively turbulent (16), allowing
stable/orderly change within planning cycles (8) and government regulated (12). The
number of employees in the organizations averaged 10,504 with a standard deviation of
27,326. All were large enterprises with 250 or more employees.
Respondent individuals classified themselves as business managers (2), senior business
managers (10), IT professionals (1), IT managers (5) and senior IT managers (18). The
median experience of the respondents was one to five years of employment in their
organization. A workforce-hire firm and a fire service each returned two questionnaires,
completed by different individuals in the organizations.
7.3.4. Materials
The research instrument was a four-paged, printed questionnaire. The questionnaire had
48 closed questions in a Likert format and 3 open-ended questions. The estimated time
to complete was 15 minutes. The logos of the University of Melbourne and the
Australian Research Council appeared on the questionnaire. The return mailing address
was the Department of Information Systems at the University of Melbourne. The
covering letter, included with the questionnaire, co-branded the survey as that of
Oakton, the University of Melbourne and the Australian Research Council. The
covering letter made clear to respondents that Oakton did share in the individual
responses from the questionnaires.
The questionnaire was four A4 pages, which were portrait printed 2-to-a-side and
double-sided on a single A3 sheet. Folding the printed A3 sheet in half made a four-
page, side-flip booklet. The mailed questionnaire had four parts and a glossary of 14
terms used in the questions. The occurrence of a glossary-term in a question had
asterisks superscripted to indicate to the respondents that a definition was available in
the questionnaire glossary (see in Appendix A).

Survey methodology
125
Part-A Organizational Profile
The categorical questions in this part of the questionnaire profile the respondents’
organization for generalizing findings to other settings, and segmenting the data
collected by IT governance archetypes to test hypothesis H3.
Part-B Activity of the IT function
This part of the questionnaire surveyed the agility activity in ten questions, as perceived
by the respondents. Particularly, Part-B measured four items that reflected the
endogenous variable of D-OPTIONS as defined in section 6.5.2.
Six of ten questions in Part-D remain extraneous to the measurement model of D-
OPTIONS. The six extraneous measures are FRQ11 to FRQ16, and found in Part-D of
Appendix A. Their inclusion added to the information richness of the snapshot,
obscured the D-OPTIONS construct from respondents and provided potential common
method variance (CMV) markers (see section 9.5).
To address common-method variance when testing the primary hypothesis H1 and the
subordinate hypotheses H1a, H1b and H1c, respondents who are business
managers/stakeholders of an organization were to have their Part-D responses mapped
to those Part-B responses of IT managers/professionals from the same organization.
Part-C Outcomes of the IT function
This part of the questionnaire surveyed the agreement by the respondents with fourteen
statements. This part included the five measures for the endogenous variable of
ITBENEFIT in H2 hypothesis testing and seven measures for the exogenous variable of
BUSKNOW for an alternative to the primary hypothesis, defined respectively in
sections 6.5.3 and 6.5.4.
Two of fourteen questions in Part-C remain extraneous to the measurement of
ITBENEFIT and BUSKNOW. The extraneous measures are AGR29 and AGR30, and
found in Part-C of Appendix A. Their inclusion added to the richness of the snapshot,

Chapter 7
126
aided in obscuring the two constructs within that Part-C from respondents and provided
potential CMV markers (see section 9.5).
To address common-method variance when testing hypothesis H2, respondents who are
business representatives of an organization were to have their Part-C responses mapped
to those Part-B responses of IT professionals from the same organization.
Part-D Maturity of the IT function
This part of the questionnaire surveyed perceived process maturity of the IT function to
enable agility. The closed-ended questions in Part-D measured the first-order variables
of POLICY, INTELL and CONTRL of the two-tier hierarchy on POLINTCON. This
part fulfilled for the descriptive research aim and measured the exogenous variables in
hypotheses testing.
The testing of the primary hypothesis H1 and the subordinate hypotheses H1a, H1b and
H1c need to deal with common-method variance. The structure of the research
instrument reflected the aim to have respondents that are IT managers/ professionals of
an organization have their Part-B responses mapped to those Part-D responses of
business managers/stakeholders from the same organization.
The six of eighteen questions in Part-D were not measures of the first-order variables of
POLICY, INTELL and CONTRL, as defined in section 6.5.1. Questions MAT31,
MAT32, MAT33 and MAT42 are measures of ITGOAL5, as defined in section 6.5.5.
ITGOAL5 is an exogenous variable suggested by COBIT for an alternative hypothesis
from existing practice. Questions MAT41 and MAT48 are unrelated to any variable in
the data analysis in Chapter 9 or Chapter 10. These six questions in Part-D, extraneous
to the twelve questions that measure the POLINTCON variable, have three purposes.
First, they added to the information richness of the snapshot of agility reported in
Chapter 8. Second, they obscured the construct of POLINTCON from respondents to
minimize any cognitive bias. Last, the extraneous variables are candidates for a marker
variable in a post hoc adjustment for CMV (see section 9.5).

Survey methodology
127
Part-E Open-ended questions
This part had three open-ended questions to capture any opinion on the topic not catered
for in the closed, Likert-scaled questions. The open-ended questions were included in
the questionnaire as a contingency, where there was a falsification of the hypothesized
correlations between the variables measured in Part-B, Part-C and Part-D. Had the
falsification occurred, the responses in Part-E may have shed light on the null
hypotheses being true, or suggest new set of alternative hypotheses.
In approximately half of the returned responses to the mailed survey, respondents did
not complete the three opened-ended questions. This was a contrast to the closed-
questions of Part-B, Part-C and Part-D, where there were only two instances of missing
values, amongst the 42 questions of the 36 returned responses. In the web-based version
of the survey, described in section 7.4, the three open-ended questions of Part-E were
not mandatory for the respondents to submit the completed questionnaire.
Consequently, the collected responses to the three opened-questions in Part-E were not
subject to any rigorous coding of a qualitative research method. The testing of the
hypotheses (see section 6.3) relied totally on quantitative data analysis of the variables
measured in Part-B, Part-C and Part-D of the questionnaire.
7.3.5. Procedures
Respondents had at least two weeks to complete the questionnaire. After this period,
non-respondents received a follow-up letter and another copy of the questionnaire. The
mailed questionnaire had a stamped identification number used only to identify survey
non-respondents for follow-up. The initial mail-out was 12 September 2008, and the
follow-up mail-out was 10 October 2008. Both mailings included a pre-paid, return
envelope for the completed questionnaires addressed to me at the Department of
Information System, the University of Melbourne. Completed responses from both
initial and follow-up mailings continued to the received until 20 November 2008.
The incentive for possible respondents completing the questionnaire was receiving a
summary of the survey findings. The summary informed the respondents of the

Chapter 7
128
capability of agility in information systems amongst the sample and a means to
benchmark their organization.
7.4. Data Collection: Web-based Survey
The third survey was of individual practitioners with a subscribed interest in IT
governance or IT control standards. The instrument of this survey was a web-based
version of the questionnaire used in the mailed survey of Oakton clients (see Appendix
B).
7.4.1. Theoretical population
The web-based survey drew possible participants from members of four discussion
groups in LinkedIn.com, a professional networking website. Below are stated profiles of
the groups (LinkedIn Corporation 2008)
• Integration Consortium: “The mission of the Integration Consortium (IC) is
to foster the leading community of like-minded Information Technology
professionals responsible for transforming business through both traditional
systems integration and emerging SOA with greater agility, ease of use and
business results”. Created on 10 December 2007, the discussion group had 130
members.
• ISACA Professionals: “ISACA is a standard setting body in the areas of
information governance, control, and security for professionals. Its IT auditing
and IT control standards are followed by professionals around the world. We are
a group of individuals interested keeping current with ISACA”. Created on 2
January 2008, the discussion group had 6,326 members.
• IT Governance: “IT Governance Group (ITGG) is intended for professionals
to expand their network of people and ideas, to give opportunity to exchange
information, methodologies, experiences, cases and other subjects on ITG”.
Created on 22 October 2007, the discussion group had 6,677 members.

Survey methodology
129
• IT Governance Institute: “The IT Governance Institute (ITGI) exists to assist
enterprise leaders in their responsibility to ensure that IT is aligned with the
business and delivers value, its performance is measured, its resources properly
allocated and its risks mitigated”. Created on 22 January 2008, the discussion
group had 46 members.
7.4.2. Data gathering
I posted invitations to participated in the survey on the LinkedIn discussion boards of
the four professional groups. Members of the professional groups were aware of the
survey if they viewed the discussion board, or subscribed to a daily or weekly digest e-
mail of discussion board postings. The discussion board posting included a hyperlink to
the website hosting the questionnaire. Respondents to the web-based survey reflected an
international population and were anonymous to myself. The invitations on the
discussion boards were re-posted twice a week, during the survey period, to keep the
invitations in a prominent position amongst recent board postings.
It is noted that membership of a LinkedIn discussion group is vetted by the specific
group's manager, who must approve prospective members. The assumption is that the
qualification of prospective members joining a discussion group is the strength of the
professional description in their personal LinkedIn profiles satisfying the group's
manager. This prima facie membership test provided the selection criterion of
respondents invited to complete the web-based survey.
At the end of period of the web-based survey, I downloaded the completed responses
from the web-site database into a comma-separated file, which was suitable for import
into the data analysis software.
7.4.3. Materials
Figure 7-2 is an example of a daily digest e-mail from one of the LinkedIn professional
group to participate in the web-based survey.

Chapter 7
130
Figure 7-2 Email invitation to web-based survey
Following the hyperlink Be the first to comment ›› on the above e-mail led to an
invitation similar to Figure 7-3.
Figure 7-3 Invitation to web-based survey
Survey methodology
131
Figure 7-3 is an example of an invitation to participate in the web-based survey from
one of the LinkedIn professional group discussion pages. See Appendix B for the
remainder of the web-based survey material used.
7.4.4. Participants
In the LinkedIn survey, 66 members of the four discussion groups commenced the
survey. Of these, 31 surveys were incomplete. Comments posted by respondents suggest
that incompletion was due to the framing of the questionnaire for an employee of a
company, whereas many discussion group members were not employees or affiliated to
several companies. Thirty-five surveys completed gave a completion rate of 53.03%
based on those that commenced the survey. The largest discussion group had 6,677
members at 13 January 2009, though it cannot be assessed how many were active in the
discussion group during the survey period of ten weeks. The web-based survey did not
record a respondent’s membership of a LinkedIn discussion group. The activities of the
organizations responding to the web-based survey were:
• Education and training (1);
• Electricity, gas, water and waste
services (0);
• Financial and insurance (6);
• Information media and
telecommunications (16);
• Manufacturing (2);
• Mining (0);
• Other community, social and
personal services (0);
• Professional, scientific and
technical services (5);
• Public administration and
defense (1);
• Rental, hiring and real estate
services (0);
• Retail trade (3);
• Transport, postal and
warehousing (1);
• Other services (0).

Chapter 7
132
The regions of the world where the respondents mostly work were:
• Asia-Pacific (1);
• Western Europe (9);
• USA & Canada (18);
• Greater Region of China (1);
• Central & Eastern Europe (2);
• Latin America (2);
• India, Pakistan & Sri Lanka (0); and
• the Middle East & Africa (2).
The web respondents described the business environment of their companies as:
• Regulated, where change is required by government and not generated within
the company (5);
• Stable, where change is generated within the company and not required by the
environment (8);
• Orderly, where change can be done within normal planning and budgetary
cycles (9);
• Turbulent, where change is required to meet competitive pressures or seek
competitive advantage (11); and
• Very turbulent (2)
The number of employees in the organizations averaged 22,499 with a standard
deviation of 65,549. The companies of the respondents categorized as small office/home
office (4) of fewer than 10 employees, small-medium enterprises (5) and large
enterprises (25) of 250 or more employees1. One respondent failed to record a number
of employees.
Respondent individuals classified themselves as business stakeholders (2), business
managers (2), senior business managers (3), IT professionals (10), IT managers (7) and
senior IT managers (11). The median experience of the respondents was one to five
years of employment in their organization.
1 http://ec.europa.eu/enterprise/enterprise_policy/sme_definition/index_en.htm assessed 28 May 2009

Survey methodology
133
Region of the world Main industry sector Employees
Asia-Pacific Public Administration and Defense 500 Greater region of China
Information Media and Telecommunications 800
Western Europe Information Media and Telecommunications 1
2 20
250
Financial and Insurance Services 410 1500
9000
Professional, Scientific & Technical Services 4500 Other Services 6,000
Central & Eastern Europe
Information Media and Telecommunications 200
Professional, Scientific & Technical Services 10000 Middle-East & Africa Information Media and Telecommunications 65000
Other Services >120000
USA & Canada Manufacturing 900
5500
Retail Trade 3500 5000
350000
Transport, Postal and Warehousing 8 Information Media and Telecommunications 60
1500
3000
12000
20000
Financial and Insurance Services 10000 Professional, Scientific & Technical Services 6
80
Other Services 28 1500
3000
130000 Latin America Financial and Insurance Services 700
Education and Training missing
value
Figure 7-4 Organizational profile of 35 web-based survey respondents
Chapter 7
134
Though the web-based survey was anonymous, there was an assumption that the 35
respondents represent 35 different organizations. The level of analysis was the IT
function of an organization. The self-descriptions of the respondents’ organizations
support the assumption, as they do not include any two organizations with a similar
region, industry sector and an estimate of employee numbers (see Figure 7-4).
7.5. Common Method Variance
Common method variance (CMV) refers to the amount of spurious covariance shared
among variables because data collection used a common method (Malhotra et al. 2006;
Sharma et al. 2009). The surveys’ use of one questionnaire for a single respondent to
collect data on both independent and dependent variables was prone to CMV.
The a priori strategy to overcome the CMV issue for mailed-based survey findings was
the framing of respondents from the Oakton client base. The survey mailed a copy of
the questionnaire to an IT manager, to measure process maturity of the IT function, and
a copy to a business manager from the same client organization, to measure the agility
outcomes. The aim was to match and merge the two responses from each organization
to form a single set of data points for the organization for data analysis. Oakton agreed
that framing in this manner was available from their client contact database.
The data collected from the survey did not allow the match-and-merge solution to CMV,
as only one of the 257 mailed organizations completed two questionnaires from an IT
manager and a business manager. As a result, this thesis adopted a post hoc adjustment
for CMV, based on a marker variable, during the data analysis (see section 9.6).
7.6. Both surveys sampled the same population
This section reports on the likelihood that respondents from the members from the
LinkedIn discussion groups come from a different population than the Oakton client
base. In other words, are they two samples from the same population? This was relevant
to later data analysis that combined the Oakton client responses and the LinkedIn

Survey methodology
135
discussion group responses for the purpose of falsification with the largest sample size
of the underlying population (see section 9.2).
Each variable of research models was subject to a parametric test and non-parametric
test for the two independent samples of 36 Oakton client respondents and 34 LinkedIn
discussion group respondents. The results of the independence tests reported in this
section determine whether two samples are likely to have come from the same two
underlying populations that have the same mean. This thesis used the XLSTAT1
functions of t-test and Mann-Whitney U-test respectively for interdependence of
parametric and non-parametric data. The interdependence tests used the un-standardized
variable scores for POLINTCON, D-OPTIONS, ITBENEFIT and ITGOAL5, generated
by the PLS path modeling reported in sections 9.2 and 9.4.
POLINTCON summary statistics:
Sample Minimum Maximum Mean Std. deviation
Oakton clients 1.094 6.000 3.132 1.187
LinkedIn members 1.919 5.367 3.241 1.037
Mann-Whitney test / Two-tailed test:
U 559.000
Expected value 595.000
Variance (U) 6941.413
p-value (Two-tailed) 0.670
alpha 0.050
t-test for two independent samples / Two-tailed test:
Difference 0.109
t (Observed value) 0.405
t (Critical value) 1.996
DF 67
p-value (Two-tailed) 0.687
alpha 0.05
Table 7-5 Independent tests of the two samples for POLINTCON
1 XLSTAT Version 2009.3.01, Copyright Addinsoft 1995-2009, www.xlstat.com.

Chapter 7
136
Table 7-5 shows the non-parametric comparison of the two samples of POLINTCON in
the principal research model (see Figure 9-2). The Mann-Whitney test returned a U-
value 0.559 at a p-value of 0.670. The null hypothesis is where the difference of
location between the POLINTCON samples is equal to zero. The alternative hypothesis
is where the difference of location between the POLINTCON samples is different from
zero. As the Mann-Whitney test has the computed p-value of 0.670 greater than the
significance level of 0.05, the null hypothesis was accepted.
Further, Table 7-5 shows the parametric comparison of the two samples of
POLINTCON. The t-test returned a critical-value 1.996 at a p-value of 0.687. The t-test
interpretation has the computed p-value of 0.687 greater than the significance level of
0.05. Thus, the null hypothesis was accepted.
D-OPTIONS summary statistics:
Sample Minimum Maximum Mean Std. deviation
Oakton clients 1.253 5.000 2.865 0.969
LinkedIn members 1.682 4.703 2.831 0.747
Mann-Whitney test / Two-tailed test:
U 583.000
Expected value 595.000
Variance (U) 6932.156
p-value (Two-tailed) 0.890
alpha 0.05
t-test for two independent samples / Two-tailed test:
Difference -0.034
t (Observed value) -0.164
t (Critical value) 1.996
DF 67
p-value (Two-tailed) 0.870
alpha 0.05
Table 7-6 Independent tests of the two samples for D-OPTIONS
Table 7-6 shows the non-parametric comparison of the two samples of D-OPTIONS in
the principal research model (see Figure 9-2). The Mann-Whitney test returned a U-

Survey methodology
137
value 583 at a p-value of 0.890. The null hypothesis is where the difference of location
between the D-OPTIONS samples is equal to zero. The alternative hypothesis is where
the difference of location between the D-OPTIONS samples is different from zero. As
the Mann-Whitney test has the computed p-value of 0.890 greater than the significance
level of 0.05, the null hypothesis was accepted.
Further, Table 7-6 shows the parametric comparison of the two samples of D-
OPTIONS. The t-test returned a critical-value 1.996 at a p-value of 0.687. The t-test
interpretation has the computed p-value of 0.687 greater than the significance level of
0.05. Thus, the null hypothesis was accepted.
When testing the primary hypothesis H1, the probability of the mailed survey of
Australian Oakton clients was likely to have come from the same underlying population
of organizations as the international survey of LinkedIn discussion group members. The
independent variable for H1 is POLINTCON and the dependent variable is D-
OPTIONS. The probability that the respondents from each survey belonging to the same
underlying population exceeds 0.05. A probability of 0.05 is the significance level
commonly accepted by most social researchers, beneath which the alternative
hypothesis of the two samples come from different populations must be accepted.
Table 7-7 shows the non-parametric comparison of the two samples of ITBENEFIT in
the principal research model (see Figure 9-2). The Mann-Whitney test returned a U-
value 595 at a p-value of 0.112. The null hypothesis is where the difference of location
between the ITBENEFIT samples is equal to zero. The alternative hypothesis is where
the difference of location between the ITBENEFIT samples is different from zero. As
the Mann-Whitney test has the computed p-value of 0.112 greater than the significance
level of 0.05, the null hypothesis was accepted.
Further, Table 7-7 shows the parametric comparison of the two samples of ITBENEFIT.
The t-test returned a critical-value 1.996 at a p-value of 0.0243. As the t-test
interpretation had a computed p-value of 0.0243 less than the significance level of 0.05,
the alternative hypothesis was accepted.

Chapter 7
138
ITBENEFIT summary statistics:
Sample Minimum Maximum Mean Std. deviation
Oakton clients 1.220 5.000 3.394 1.073
LinkedIn members 2.619 5.000 3.891 0.663
Mann-Whitney test / Two-tailed test:
U 462.000
Expected value 595.000
Variance (U) 6937.862
p-value (Two-tailed) 0.112
alpha 0.05
t-test for two independent samples / Two-tailed test:
Difference 0.4964
t (Observed value) 2.3044
t (Critical value) 1.9960
DF 67
p-value (Two-tailed) 0.0243
alpha 0.0500
Table 7-7 Independent tests of the two samples for ITBENEFIT
When testing the hypothesis H1 with the variables D-OPTIONS and POLINTCON, the
probability of the mailed survey of Australian Oakton clients was likely to have come
from the same underlying population of organizations as the international survey of
LinkedIn discussion group members. The independent t-tests for the two samples
supports a claim that they represent the same underlying population of large
organizations when testing the primary hypothesis H1, but less so for the dependent
variable ITBENEFIT of hypothesis H2.
Table 7-8 shows the non-parametric comparison of the two samples of ITGOAL5 in the
alternate research model. The Mann-Whitney test returned a U-value 646 at a p-value of
0.544. The null hypothesis is where the difference of location between the ITGOAL5
samples is equal to zero. The alternative hypothesis is where the difference of location
between the ITGOAL5 samples is different from zero. As the Mann-Whitney test has

Survey methodology
139
the computed p-value of 0.544 greater than the significance level of 0.05, the null
hypothesis was accepted.
ITGOAL5 summary statistics:
Sample Minimum Maximum Mean Std. deviation
Oakton clients 2.000 5.316 3.487 0.979
LinkedIn members 1.000 6.000 3.335 1.153
Mann-Whitney test / Two-tailed test:
U 646.000
Expected value 595.000
Variance (U) 6933.551
p-value (Two-tailed) 0.544
alpha 0.05
t-test for two independent samples / Two-tailed test:
Difference 0.152
t (Observed value) 0.589
t (Critical value) 1.996
DF 67
p-value (Two-tailed) 0.558
alpha 0.05
Table 7-8 Independent tests of the two samples for ITGOAL5
Further, Table 7-8 shows the parametric comparison of the two samples of ITGOAL5.
The t-test returned a critical-value 1.996 at a p-value of 0.558. The t-test interpretation
has the computed p-value of 0.558 greater than the significance level of 0.05. Thus, the
null hypothesis was accepted.
Table 7-9 shows the non-parametric comparison of the two samples of BUSKNOW in
the alternate research model. The Mann-Whitney test returned a U-value 718 at a p-
value of 0.086. The null hypothesis is where the difference of location between the
BUSKNOW samples is equal to zero. The alternative hypothesis is where the difference
of location between the BUSKNOW samples is different from zero. As the Mann-
Whitney test has the computed p-value of 0.086 greater than the significance level of
0.05, the null hypothesis was accepted.

Chapter 7
140
BUSKNOW summary statistics:
Sample Minimum Maximum Mean Std. deviation
Oakton clients 1.000 5.000 3.827 0.857
LinkedIn members 1.155 5.000 3.462 0.904
Mann-Whitney test / Two-tailed test:
U 718.000
Expected value 577.500
Variance (U) 6640.616
p-value (Two-tailed) 0.086
alpha 0.05
t-test for two independent samples / Two-tailed test:
Difference 0.364
t (Observed value) 1.703
t (Critical value) 1.997
DF 66
p-value (Two-tailed) 0.093
alpha 0.05
Table 7-9 Independent tests of the two samples for BUSKNOW
Further, Table 7-9 shows the parametric comparison of the two samples of BUSKNOW.
The t-test returned a critical-value 1.997 at a p-value of 0.093. The t-test interpretation
has the computed p-value of 0.093 greater than the significance level of 0.05. Thus, the
null hypothesis was accepted.
The t-tests associated with the dependent variable in hypothesis H2 of ITBENEFIT,
shown in Table 7-7, yielded results beneath the 0.05 significance level. This result may
be due to the LinkedIn discussion group sample having proportionally less business
managers and stakeholders (20.6%), compared to IT managers and professionals, than
the Oakton client sample (33.3%). A difference in the IT-dependent strategic benefits
perceived by business managers and stakeholders and by IT managers and professionals
was expected. Similarly, information, media and technology companies employed
proportionally more LinkedIn discussion group respondents (34.2%), compared to the
respondents of the Oakton client sample (2.9%).

Survey methodology
141
This explanation may also account for the t-tests and U-tests for the independent
variable of the business knowledge of IT personnel (BUSKNOW) having results closer
to the 0.05 significance level than the variables of POLINTCON or D-OPTIONS.
Overall, the independent tests for the two samples supported a claim that they represent
the same underlying population of large organizations when testing the primary
hypothesis, but less so for other variables of the secondary hypotheses. The parametric
t-test and non-parametric Mann-Whitney U-test for interdependence of data produced
consistent results for each variable.
7.7. A non-response bias was not evident
Determining any non-response bias is an important consideration of survey-based
research. The method of determining non-response bias adopted by this thesis is
common amongst IS studies, such as Fink and Neumann (2007). This method compares
the earliest responses received and the last responses received to detect any bias
amongst the respondents’ readiness to complete the questionnaire.
Testing for a non-response bias was amongst the mailed survey of 257 Oakton client
organizations, as this survey had a known response rate of 16.75%. Accordingly,
identified from the 36 responses of the mailed survey were two groups of nine. These
two groups are the first and last quartile of responses based on their returned mail date.
Each variable of principal research model was subject to a two-sample t-test for the first
and last quartile of responses. The results of the independence tests populated the tables
of this section determine whether two quartiles are likely to have come from the same
underlying population with the same mean. The interdependence tests used the un-
standardized variable scores for POLINTCON, D-OPTIONS and ITBENEFIT,
generated by PLS software using the model in 9.3.2.
Table 7-10 shows the parametric comparison of the two quartiles of D-OPTIONS
responses. The t-test returned a critical-value 2.16037 at a p-value of 0.29122. The t-test
interpretation has the computed p-value of 0.29122 greater than the significance level of

Chapter 7
142
0.05. Thus, we accept the null hypothesis that the difference of location between the two
response quartiles for D-OPTIONS is equal to zero.
D-OPTIONS statistics: First quartile Last quartile
Mean 2.44757 2.76596
Variance 0.17915 0.57465
Observations 9 9
alpha 0.05
DF 13
p-value (Two-tailed) 0.29122
t (Critical value) 2.16037
Table 7-10 Two-sample t-test for the response quartiles in D-OPTIONS
Table 7-11 shows the parametric comparison of the two quartiles of ITBENEFIT
responses. The t-test returned a critical-value 2.14478 at a p-value of 0.73955. The t-test
interpretation has the computed p-value of 0.73955 greater than the significance level of
0.05. Thus, we accept the null hypothesis that the difference of location between the two
response quartiles for ITBENEFIT is equal to zero.
ITBENEFIT statistics: First quartile Last quartile
Mean 3.93036 4.04990
Variance 0.37904 0.73941
Observations 9 9
alpha 0.05
DF 14
p-value (Two-tailed) 0.73955
t (Critical value) 2.14478
Table 7-11 Two-sample t-test for the response quartiles in ITBENEFIT
Table 7-12 shows the parametric comparison of the two quartiles of POLINTCON
responses. The t-test returned a critical-value 2.16036 at a p-value of 0.25501. The t-test
interpretation has the computed p-value of 0.25501 greater than the significance level of
0.05. Thus, we accept the null hypothesis that the difference of location between the two
response quartiles for POLINTCON is equal to zero.

Survey methodology
143
POLINTCON statistics: First quartile Last quartile
Mean 2.82482 3.40302
Variance 0.50822 1.61359
Observations 9 9
alpha 0.05
DF 13
p-value (Two-tailed) 0.25501
t (Critical value) 2.16036
Table 7-12 Two-sample t-test for the response quartiles in POLINTCON
Overall, the two response quartiles for the variables in the principal research model had
no significant differences. The conclusion is that 16.75% of mailed survey responses
from the 257 Oakton client organizations contained no bias between the early and late
responders, and there is no trend to suggest that the non-responding 83.25% had a bias
regarding the tested variables.
7.8. Partial least squares
Partial-Least-Squares (PLS) path modeling is a statistical technique to explain or predict
a set of dependent variables from a set of independent variables. This goal is achievable
by deriving from the measurements of the variables a set of loadings that delivers the
best determinative power. PLS is used for confirmatory research of a priori models of
variables (Gefen et al. 2000) and is used extensively for that purpose in this thesis. The
theoretical development of this thesis did not generate quantitative values for a
structural equation of the hypotheses’ variables. The PLS path modeling discovered
these quantitative values from the data collected from the mailed and web-based
surveys.
A PLS path model consists of three parts. First is an a priori structural model that shows
the dependency relationships between the unobserved variables. Second is an a priori
measurement model that relates the unobserved variables to measurement items. Last
are the loadings of the measurement items to score the unobserved variables. PLS
software iteratively calculates these loadings to minimize the variance of the
Chapter 7
144
independent variables for determining the dependent variables (Haenlein and Kaplan
2004). The maximized R2 values of the dependent variables reflect this minimized
variance.
The PLS path modeling in this thesis relied on the construct development of Chapter 6.
The principal research model (see section 6.3.1) informed the structural model, and the
variables and their measures (see section 6.5) informed the measurement model. The
PLS path modeling output in Figure 9-2 provides an example for the resulting structural
and measurement models, with the calculated loadings shown. Another PLS path
modeling output is the score for each unobserved variable, calculated on an average of
its loaded measurement items, for each survey response. Further data analysis is
possible using the calculated scores, such as two-sample independent t-tests or ANOVA
regression analysis. The ordinal measures used in the PLS path modeling, such as
maturity levels, have been used for regression analysis in previous IS research
(Sledgianowski et al. 2006).
The PLS path modeling also reports quality statistics of the dependent and independent
variables. These statistics include Cronbach’s alpha, Composite Reliability and Average
Variance Extracted, and are not specific to PLS but general to most forms of structural
equation modeling. Similarly, the loading benchmark for the reliability of a
measurement item is not specific to PLS (Hulland 1999).
7.8.1. PLS software used
To assist in replicating this thesis findings and the falsification of the principal research
model with future data collections, this section recounts the software package used and
the options set. The software used was SmartPLS version 2.0.M3 (Ringle et al. 2005). A
PLS algorithm option used was measurement standardization (mean 0, variance 1) for
the different ordinal scales in the reflective measures. Measure standardization has been
done for ordinal items, such as Likert-scaled attitudinal items. Reflective measures are
used if it is decided that the measures can be conceived of as approximately parallel
indicators (i.e. equivalent in their measurement of the underlying construct), and there is
no a priori emphasis given to a particular indicator in the set (Chin et al. 2003).

Survey methodology
145
The PLS execution used a centroid-weighting scheme. There are three different
weighting schemes available in SmartPLS: centroid, factor and path weighting schemes.
Others have demonstrated that the choice between weighting schemes has only a minor
impact on the results (Haenlein and Kaplan 2004).
To derive the t-values for significance levels, the SmartPLS bootstrap procedure used
the settings of individual sign changes, 2000 samples and the number of cases per
sample equaling the sample sizes of the models. Bootstrapping was preferred to
jackknifing, as computational time was not a restriction for 79 individual responses with
21 data points each and jackknifing is an approximation of bootstrapping (Chin et al.
2003).
7.8.2. Interpreting PLS path modeling figures
The PLS path modeling presented in this thesis are images directly exported from
SmartPLS. These images appear in the figures in Chapter 9 and Chapter 10.
The measurement items are the boxes in the PLS path modeling figures and are labeled
with a three-alphabetic prefix and a two-numeric suffix to indicate the associated
questionnaire item.
The variables are the ellipses in the PLS path modeling figures and are labeled with the
concept name defined in the hypotheses (see section 6.4). Those variables with no
inward arrows from other variables are exogenous and those with inward arrows are
endogenous. The direction of the arrows indicates the causality of the variable
correlation suggested by the hypotheses.
The PLS path modeling figures record three types of calculation results. First, the outer
loading of the measures label the outward arrows leading from the variables. The
outward arrows from the variables to the measure items indicate a reflective measure.
Second, the standardized path coefficients label the arrows between the variables.
Positive path coefficients support the hypotheses in section 6.3, as the wording of the

Chapter 7
146
hypotheses was in the positive. A negative path coefficient indicates a falsification of a
hypothesis. A beta (ß) denotes a standardized path coefficient value in the text.
Last, the R2 is inside the ellipse of the endogenous variables. This statistic is the
coefficient of determination, and represents the portion of the data that is the closest to
the line of correlation coefficient. An R2 of 1.0 indicates a perfect determination of
dependent variable by the predictors with no variances. Exogenous variables do not
have an R2 and instead have a zero inside the ellipse. Common use descriptions of R2
values to 0.13 is ‘small’, 0.13 to 0.26 is ‘medium’ and 0.26 to 1.0 is ‘large’ (Wetzels et
al. 2009). The descriptions used in this thesis are an R2 value to 0.13 is ‘small’, 0.13 to
0.26 is ‘medium’, 0.26 to 0.52 is ‘large’ and above 0.52 to 1.0 is ‘very large’. The
extended descriptions distinguish the wide range of coefficients of determination
discovered in this thesis.
The PLS path modeling figures exported from SmartPLS do not include the p-values for
Type I errors. The p-values are reported in this thesis, derived from t-values from a
separate bootstrap procedure of SmartPLS, used the Microsoft EXCEL function of
TDEST for the Student’s t-distribution for two-tailed tests.
7.8.3. Sample size and statistical power
IS literature suggests PLS for structural equation modeling with small sample sizes. A
common heuristic is there should be at least 10 cases per predictor in the most complex
portion of the model (Chin and Newstead 1999; Gefen et al. 2000). All but one of the
PLS models in this thesis had a single predictor and used either 34 or 79 cases,
satisfying the heuristic of at least 10 cases. PLS path modeling in section 10.2.2 was the
exception with three predictors and requiring at least 30 cases, but adequately catered
for with 79 cases. The ‘10 cases per predictor’ heuristic is useful for a priori judgment
whether PLS is suitable for an expected sample size and a particular structural model. A
more rigorous post hoc justification of PLS path modeling with the sample sizes is the
statistical power generated (Chin and Newstead 1999). This thesis used two assessments
of statistical power, at different levels of analysis.

Survey methodology
147
The first assessment of statistical power was at the whole of model level. It utilized the
Monte Carlo simulations of Marcoulides and Saunders (2006) of the sample sizes
needed to achieve the statistical power of 0.80, which is acceptable to most researchers.
The simulations use normally distributed data and no missing values. The 79 cases had
no missing values, and meets the qualifications of normal distribution within standard
errors (see section 9.2.6). The results of the simulations are in Table 7-13 and referenced
with the smallest correlation between variables and the smallest loading of a
measurement item to produce a conservative estimate of the minimal sample size
required.
The second assessment is at hypothesis level. It utilized a post hoc statistical power
calculation for multiple regressions. An on-line calculator returns the statistical power
given the observed Type I significance level, the number of predictors, the observed R2
value, and the sample size used (Soper 2009). This thesis used both the Monte Carlo
simulation and the post hoc statistical power calculation to justify the PLS path
modeling with the samples sizes.
V
Measurement item loading
Path
correlation ß
0.9 0.8 0.7 0.6 0.5 0.4
0.1 916 1053 1261 1806 2588 4927
0.2 256 292 371 457 764 1282
0.3 96 99 147 223 317 672
0.4 46 57 71 98 186 343
0.5 25 34 43 66 111 220
0.6 16 20 23 44 78 175
0.7 15 15 17 33 61 134
0.8 15 15 17 25 46 109
0.9 15 15 17 25 42 99
Table 7-13 Sample sizes for a post hoc statistical power of 0.80 (from Marcoulides and Saunders 2006)

Chapter 7
148
7.8.4. Covariance
This section illustrates the covariance of measurement items for the variables used in
the principal research model (see Figure 6-1). All the measurement items for the
variables in the models in this thesis are reflective, as indicated by the direction of
causality arrows from the construct to the item. Reflective measures are the
manifestations of a construct, not a cause of it. The reflective measures have a common
theme, e.g. process maturity for a capability. The expectation was that reflective
measures for a variable covary with one another, as they are measuring the same
phenomenon. Internal reliability is important in reflective measures, as all of the items
are measuring the same phenomenon and if the value for one measure changes, then the
other values should move in the same direction (Petter et al. 2007).
The three subsystems of POLICY, INTELL and CONTRL constitute POLINTCON in a
two-tier hierarchy. Figure 7-14, Figure 7-15 and Figure 7-16 respectively display the
covariance of measurement items of the subsystems that constitute the exogenous
variable. All the measures are on a six-point Likert scale of Non-existent (1), Ad Hoc
(2), Repeatable (3), Defined (4), Managed (5) and Optimized (6); with the parenthesized
value being that of the ordinal value used in the PLS path modeling.
1 2 3 4 5 6
MAT37
MAT38
MAT39
Figure 7-14 Covariance of POLICY measurement items

Survey methodology
149
1 2 3 4 5 6
MAT34
MAT36
MAT40
MAT43
MAT44
MAT35
Figure 7-15 Covariance of INTELL measurement items
1 2 3 4 5 6
MAT45
MAT46
MAT47
Figure 7-16 Covariance of CONTRL measurement items
All process maturity measures that constitute POLINTCON covary. Though the
maturity level measures have differing central tendency and dispersion, there was a
common movement in the same direction. The common movement for POLICY,
INTELL and CONTRL subsystems had three inflexion points, where the first inflexion
point was higher than the last. No measurement item had a proportion of Optimized
processes greater than any other maturity level.

Chapter 7
150
Figure 7-17 displays the covariance of measurement items of the endogenous variable
of D-OPTIONS. All the measures are on a five-point Likert scale of Very rarely (1),
Rarely (2), Occasionally (3), Frequently (4) and Very Frequently (5); with the
parenthesized value being that of the ordinal value used in PLS path modeling. The four
frequency measures of D-OPTIONS display covariance, where the common movement
for D-OPTIONS having a major infection point in the first part of the scale, followed by
a longer tail.
1 2 3 4 5
FRQ07
FRQ08
FRQ09
FRQ10
Figure 7-17 Covariance of D-OPTIONS measurement items
Figure 7-18 displays the covariance of measurement items of the endogenous variable
of ITBENEFIT. All the measures are on a five-point Likert scale of strongly disagree
(1), somewhat disagree (2), neither agree nor disagree (3), somewhat agree (4) and
strongly agree (5); with the parenthesized value being that of the ordinal value used in
the PLS path modeling. The five agreement measures of ITBENEFIT covary, where the
common movement having a major infection point in the second part of the scale,
preceded by a long tail. No measurement item had a proportion of ‘Strongly disagree’ or
‘Disagree’ statements greater than any other agreement statements.
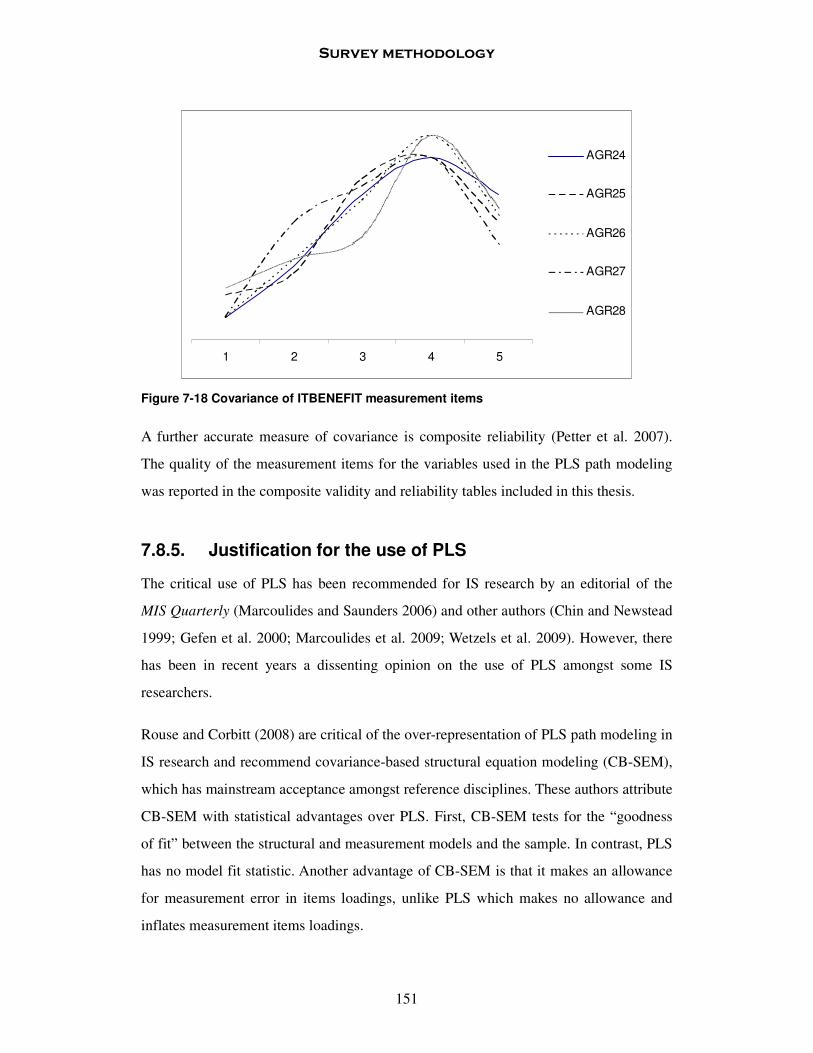
Survey methodology
151
1 2 3 4 5
AGR24
AGR25
AGR26
AGR27
AGR28
Figure 7-18 Covariance of ITBENEFIT measurement items
A further accurate measure of covariance is composite reliability (Petter et al. 2007).
The quality of the measurement items for the variables used in the PLS path modeling
was reported in the composite validity and reliability tables included in this thesis.
7.8.5. Justification for the use of PLS
The critical use of PLS has been recommended for IS research by an editorial of the
MIS Quarterly (Marcoulides and Saunders 2006) and other authors (Chin and Newstead
1999; Gefen et al. 2000; Marcoulides et al. 2009; Wetzels et al. 2009). However, there
has been in recent years a dissenting opinion on the use of PLS amongst some IS
researchers.
Rouse and Corbitt (2008) are critical of the over-representation of PLS path modeling in
IS research and recommend covariance-based structural equation modeling (CB-SEM),
which has mainstream acceptance amongst reference disciplines. These authors attribute
CB-SEM with statistical advantages over PLS. First, CB-SEM tests for the “goodness
of fit” between the structural and measurement models and the sample. In contrast, PLS
has no model fit statistic. Another advantage of CB-SEM is that it makes an allowance
for measurement error in items loadings, unlike PLS which makes no allowance and
inflates measurement items loadings.
Chapter 7
152
The statistical advantages of CB-SEM are not relevant to this thesis. The theory
development did not produce a model with quantified relationships between variables
and the empirical research discovered the covariance of measurement items. Thus, a
quantitative “goodness of fit” was not calculable to test the principal research model.
Similarly, the error variance of the survey instrument is undetermined, negating an
advantage of CB-SEM not to inflate loadings with a measurement error.
Qureshi and Campeau (2009) conducted Monte Carlo simulations on PLS and SEM to
determine the appropriateness of each method. This thesis satisfied the decision path
proposed by these authors to apply PLS path modeling. First, the data is normally
distributed. Section 9.2.6 will show distribution of the variables of POLINTCON, D-
OPTIONS, ITBENEFIT and ITGOAL5 have sufficient kurtosis and skewness for
normal data.
Second, the sample size of 79 is small by Qureshi and Campeau criterion and leans
towards the applicability of PLS. Similarly, the number of measurement items per
variable in the primary research model was not less than four. Three or less
measurement items are a criterion for CB-SEM. The fourth criterion is the correlation of
the exogenous variables. In the principal research model, there is a single exogenous
variable of POLINTCON, which is a composite of three component variables POLICY,
INTELL and CONTRL. As shown in section 7.8.4, there is a correlation in process
maturity levels of the three component exogenous variables, with a common movement
of three inflexion points, where the first inflexion point was higher than the last.
The last criterion is the size of the path coefficients. The modeling in Chapter 9 shows
these path coefficients. The primary research model had all path coefficients greater
than the 0.4 benchmark determined by Qureshi and Campeau for applying PLS. The
conclusion from this a priori application of Qureshi and Campeau’s decision tree was
that the use of PLS was appropriate as CB-SEM for the data analysis of this thesis.
There was no clear criterion for excluding the use of PLS path modeling and, given the
theory development of this thesis, no statistical advantage to use CB-SEM.

Survey methodology
153
7.9. Preface to the data analysis
The data analysis had three aspects: a statistical snapshot of the data collection, PLS
path modeling, and an analysis of the normality of the data distribution.
First, Chapter 8 is a snapshot of the respondent organizations’ IT function process
maturity, frequency of agility activity and IT-dependent strategic benefits, and the
business knowledge of IT personnel. The snapshot used the frequency distribution of
raw data from the Likert items in the questionnaire, regardless of whether they compose
the constructs of the theoretical development or not.
Second, various sections in Chapter 9 and Chapter 10 model the hypotheses for effects
amongst various variables. These models used PLS path modeling for hypotheses
falsification, the transferability of findings to settings other than sample populations,
comparison of the hypotheses to existing practice models and alternative explanations,
and explore a finer level of analysis of the principal research model and population
segmentation.
Third, section 9.2.6 reviews the data collected as variables of the hypotheses. The
review used indices of central tendency, dispersion, and the normal curve of the data
distribution of the variables; and establishes their validity of statistical inferences made
from PLS path modeling and linear regression.
Section 9.6 wraps up with a measure of common method variance to qualify the
findings from the three aspects of the data analysis.
7.10. Conclusion on the survey method
This chapter explained the method used in the quantitative surveys reported in this
thesis. A large portion of the chapter was devoted to explaining the details of the mailed
and web-based surveys of this thesis, using a common questionnaire for both surveys. A
major distinction between the data collected by the two surveys was that I knew the
potential respondents to the mailed survey before sending the questionnaire, and
recognized the respondents when they completed and returned the questionnaire. This
Chapter 7
154
was in contrast to the web-based survey, where I never knew the identities of the
respondents. This distinction had a major impact to later data analysis for hypothesis
falsification and the transferability of findings to other settings. This chapter also
provided details of the population of participants to allow evaluation of sample
representativeness and the degree both survey samples represent the same population.
The chapter discussed any non-response bias that threatens the external validity of the
findings.
This chapter ended with a discussion to justify the use of PLS path modeling in the data
analysis of this thesis. This justification included the appropriateness of PLS to discover
the coefficients of correlation and quantify the relationships between constructs
suggested by applying the VSM to the IT function, the statistical power afforded by the
sample sizes, and the covariance of measurement items amongst the constructs.
The next chapter provides a snapshot of the data collected from both the mailed and
web-based surveys. Chapter 9 is the data analysis, commencing with the hypotheses
testing relating to the principal research model in Figure 6-2.

155
Chapter 8. A snapshot of agility
8.1. Introduction
The surveys provided a snapshot of process maturity of their IT function to enable
agility in existing information systems amongst 70 organizations internationally.
Descriptive research is a valid use of the survey research method (Galliers 1991). The
snapshot spanned from September 2008 to January 2009 and coincided with the US
presidential elections and the unfolding of the global financial crisis. In the absence of a
control study, there was no measure of the impact these political and economic events
had on the psychometric responses of the surveys.
8.2. Respondent profile
The 79 respondents described themselves as senior business managers (16%), business
managers (5%), business stakeholders (4%), senior IT managers (35%), IT managers
(18%) and IT professionals (22%)1. The respondents’ period with their company ranged
from less than one year (23%), one to five years (44%) and more than five years
(33%)2.
When asked the number of employees in their companies, 5% of respondents were in
small office/home office with less the 10 employees, 16% in small/medium enterprises,
and 73% in large enterprises of 250 employees or more. Five percent of respondents
made no employee number estimate. The average number of estimated employees was
14,831 and the median number was 1,1503.
The respondents described the business environments of their companies as regulated
(17%), stable (21%), orderly (35%), turbulent (22%) and very turbulent (5%)4.
1 Responding to Question 1 of the questionnaires in the Appendices 2 Responding to Question 2 of the questionnaires in the Appendices 3 Responding to Question 3 of the questionnaires in the Appendices 4 Responding to Question 4 of the questionnaires in the Appendices

Chapter 8
156
8.3. Descriptive findings
Below are the descriptive findings from the 79 responses from the mailed and web-
based surveys. The presentation is according to the sections of the questionnaire, and
not in sets of measurement items for the variables of the hypotheses.
IT function activity
Qu
est
ion
Ver
y r
are
ly
Ra
rely
Occ
asi
on
all
y
Fre
qu
en
tly
Very
fre
qu
entl
y
Have existing information systems that are readily configurable for a new business initiative
FRQ07 8% 35% 32% 20% 4%
Have existing, detailed designs for IT that can be used, partially or wholly, for a new business initiative
FRQ08 13% 28% 38% 16% 5%
Have existing, high-level designs for IT that can be used, partially or wholly, for a new business initiative
FRQ09 9% 27% 35% 22% 8%
Have alternative target IT architectures and road-maps for new business models
FRQ10 11% 33% 38% 11% 6%
Have IT policy reviews or updates
FRQ11 4% 15% 37% 35% 9%
Have escalations or unresolved issues due to lack of, or insufficient responsibility for, assignments
FRQ12 3% 18% 41% 35% 4%
Have technology infrastructure plan reviews or updates
FRQ13 4% 18% 44% 28% 6%
Conduct activities to ensure integrity and consistency of all data stored electronically, e.g. in databases and data warehouses
FRQ14 10% 29% 30% 23% 8%
Do trend analysis of service incidents and queries
FRQ15 6% 24% 34% 24% 11%
Update the data dictionary, including the data criticality and sensitivity classification scheme
FRQ16 16% 30% 33% 14% 6%
Table 8-1 Snapshot of IT function's activities frequency

A snapshot of agility
157
The average and median responses had an occasional frequency for all the IT function
activities listed in Table 8-1.
The median responses were ‘somewhat agree’ with all the statements measuring the
business knowledge of IT personnel listed in Table 8-2. The average responses were
same as the medians, except for Questions 19 and 20 where the average was to neither
agree nor disagree.
Business knowledge
Qu
esti
on
Str
on
gly
dis
ag
ree
So
mew
ha
t
dis
ag
ree
Neit
her
ag
ree
or
dis
ag
ree
So
mew
ha
t
ag
ree
Str
on
gly
ag
ree
The IT personnel are knowledgeable about the key success factors that must go right if my company is to succeed
AGR17 6% 13% 10% 43% 27%
The IT personnel are encouraged to learn new information technologies
AGR18 5% 9% 19% 43% 24%
The IT personnel closely follow the trends in current information technologies
AGR19 4% 23% 16% 43% 14%
The strategies of the IT function and my company's strategies are well aligned
AGR20 10% 22% 14% 35% 19%
The IT personnel understand my company's policies and plans
AGR21 6% 16% 20% 37% 20%
The IT personnel are able to interpret business problems and develop appropriate technical solutions
AGR22 6% 14% 14% 38% 28%
The IT personnel are knowledgeable about business functions
AGR23 4% 18% 14% 48% 16%
Table 8-2 Snapshot of business knowledge of IT personnel
Over the mailed and web-based surveys, the median and average responses were
‘somewhat agree’ with all the statements measuring the IT-dependent strategic benefits

Chapter 8
158
in Table 8-3, except for Questions 27 and 30 where the median and average was to
‘neither agree nor disagree’.
IT benefit
Qu
esti
on
Str
on
gly
dis
ag
ree
So
mew
ha
t
dis
ag
ree
Nei
ther
ag
ree
or
dis
ag
ree
So
mew
ha
t
ag
ree
Str
on
gly
ag
ree
IT shared across the company enhances competitiveness or creates strategic advantage
AGR24 4% 13% 25% 32% 27%
IT shared across the company enables the company to catch up with competitors
AGR25 8% 11% 28% 33% 20%
IT shared across the company aligns well with stated organisational goals
AGR26 4% 14% 24% 37% 22%
IT shared across the company helps establish useful linkages with other organisations
AGR27 4% 20% 27% 33% 16%
IT shared across the company enables the company to respond more quickly to change
AGR28 9% 14% 18% 37% 23%
IT shared across the company enables faster retrieval or delivery of information or reports
AGR29 6% 14% 16% 42% 22%
IT shared across the company allows other applications to be developed faster
AGR30 4% 18% 29% 35% 14%
Table 8-3 Snapshot of IT-dependent strategic benefits
Broadly, the median response had a repeatable maturity level for the processes of the IT
function surveyed in Table 8-4. At this maturity level, the processes happen but in a
different manner by different people, as procedures are undefined. The exceptions were
Questions 35, 36, 40 and 43, which all had a median response of an ad hoc maturity
level for those IT processes.
The average responses were repeatable for all maturity levels surveyed, except for that
of Question 33 concerning provision of IT infrastructure and had a defined maturity
level.

A snapshot of agility
159
Process of the IT function
Qu
esti
on
No
n-e
xis
ten
t
Ad
Ho
c
Rep
ea
ted
Defi
ned
Ma
na
ged
Op
tim
ized
To define the IT procedures, organisation & relationships for compliance with governance requirements
MAT31 6% 23% 24% 19% 25% 3%
To manage IT human resources
MAT32 9% 28% 27% 14% 22% 1%
To acquire and maintain technology infrastructure
MAT33 3% 19% 33% 18% 25% 3%
To maintain a set of high-level designs for IT-enabled capabilities, which are options for forecasted business initiatives
MAT34 9% 41% 19% 15% 11% 5%
To implement a set of IT-enabled capabilities, which are readily configurable for forecasted business initiatives
MAT35 11% 42% 14% 18% 13% 3%
To assess any unexpected operational consequences, arising from existing information systems, to forecast business initiatives
MAT36 10% 46% 15% 13% 14% 3%
To develop & maintain a set of policies to support IT strategy. This includes policy intent, roles & responsibilities.
MAT37 6% 28% 29% 11% 22% 4%
To establish & maintain an optimal co-ordination, communication & liaison structure within the IT function
MAT38 6% 28% 25% 18% 19% 4%
To create a strategic plan that defines how IT goals will contribute to the company’s strategic objectives.
MAT39 9% 18% 27% 23% 19% 5%
To monitor the business sector, industry, technology, infrastructure, legal & regulatory environment trends
MAT40 8% 43% 20% 10% 14% 5%
To define & implement procedures to ensure the integrity & consistency of all data stored in electronic form.
MAT41 8% 32% 23% 15% 18% 5%

Chapter 8
160
Process of the IT function
Qu
esti
on
No
n-e
xis
ten
t
Ad
Ho
c
Rep
ea
ted
Defi
ned
Ma
na
ged
Op
tim
ized
To establish & maintain an information architecture to enable applications development & decision-supporting activities
MAT42 6% 42% 14% 14% 20% 4%
To analyse existing and emerging technologies, and plan which technological direction to realise the IT strategy
MAT43 8% 47% 14% 13% 15% 4%
To develop a feasibility study that examines the possibility of implementing the requirements & alternative courses of action
MAT44 15% 28% 19% 15% 18% 5%
To acquire and maintain applications in line with IT strategy & IT architecture
MAT45 4% 32% 25% 16% 20% 3%
To continuously monitor specified service level performance, and report in a format that is meaningful to the stakeholders.
MAT46 11% 20% 25% 20% 18% 5%
To report service desk activity to enable management to measure service performance and to identify trends
MAT47 10% 15% 27% 18% 25% 5%
To monitor IT performance to make sure that the right things are done, and in line with the set directions & policies
MAT48 11% 32% 20% 20% 13% 4%
Table 8-4 Snapshot of IT function process maturity
The definitions of maturity levels used to question IT processes are contained in the text
box in section C of the mailed questionnaire (see Appendix A). The wording of the
definitions is that of COBIT 4.1 (IT Governance Institute 2007).

A snapshot of agility
161
8.4. Conclusion on the snapshot
The above snapshot suggested poor agility in existing information systems amongst the
surveyed companies. This is given the proposition that agility was the result of maturity
of the IT processes determining the effectiveness of the IT function’s activity, in
possible combination with the business knowledge of the IT personnel. Mostly these
variables are in the middle of the ordinal scales used in the survey. The lack of
favourable responses suggests that agility remains a problem for most companies.
Further descriptive statistics on the standard deviation and the normality of the
measurement items for the hypotheses are in section 9.2.6. The responses from the
mailed and web-based surveys were subject to further data analysis based on PLS path
modeling in the next two chapters. Chapter 9 presents strongly supported findings from
the data analysis that test the validity and efficacy of the principal research model.
Chapter 10 presents less supported findings that suggest areas of further research.

Chapter 8
162

163
Chapter 9. Major findings
9.1. Introduction
This chapter presents the analysis of data collected from the Oakton consultant pilot, the
Oakton client mailed survey and the web-based LinkedIn survey. It reports on three
instances of PLS path modeling and one instance of regression analysis, all of which
have support in the theoretical development of this thesis.
The first PLS path model of the chapter used all completed responses to provide the
maximum opportunity to falsify the principal research model (see Figure 6-1). The
second PLS path model only used the fully identified responses from the client
organizations of Oakton. These findings are for later transferability of the principal
research model to settings other than the survey samples. The third model used an
existing model for creating IT agility, from an industry ‘best practice’ framework, to
compare with the principal research model. Last, a regression analysis projected the
likely increase in agility outcomes given an IT investment.
The use of PLS path modeling in this thesis was justified in Section 7.8 and sufficient
covariance of the data collected for PLS analysis was evident in section 7.8.4. Section
9.2.6 describes the normality distribution of data collected to support all findings for
statistical inference. Chapter 10 follows with findings with less theoretical support but
worthy of consideration.
9.2. The primary hypothesis was not falsified
A finding of the data analysis was not falsifying the principal research model. This
section describes the testing of two hypotheses from the principal research model using
PLS path modeling. After establishing the statistical acceptability of the modeling, the
section interprets the modeling results as support for the falsification finding.

Chapter 9
164
9.2.1. Testing of hypotheses H1 and H2 for falsification
This section reports on the testing of hypotheses H1 and H2 of the principal research
model of Figure 6-1. These two hypotheses stated:
The more mature the coupled processes of Policy, Intelligence and Control of the
IT function (POLINTCON), the more often digital-options for the existing
information systems are exercisable (D-OPTIONS); and
The more often digital-options for the existing information systems are
exercisable (D-OPTIONS), the more likely that IT-dependent strategic benefits
(ITBENEFIT) occur.
The primary purpose of the quantitative data collection and analysis was to test the
principal research model. This is for Popperian falsification (Popper 1959) and the use
of PLS path modeling is valid for this purpose (Marcoulides and Saunders 2006). All
completed responses (n=79) from the mailed and web-based surveys were utilized in the
modeling to provide the maximum opportunity for falsification. Section 7.5 evidenced
that the two samples from the Oakton Australian clients and the LinkedIn discussion
groups came from the same underlying population.
9.2.2. PLS modeling for falsification
The PLS path modeling of the mailed and LinkedIn surveys is shown in Figure 9-2 and
the correlation matrix in Table 9-1.
D-OPTIONS ITBENEFIT POLINTCON
D-OPTIONS 0.861
ITBENEFIT 0.607 0.843
POLINTCON 0.723 0.659 0.807
Table 9-1 Correlation matrix from falsification modeling (n=79)

Major findings
165
Figure 9-2 Research model for falsification (n=79)

Chapter 9
166
Figure 9-2 depicts the structural model with the standardized path coefficients and the
coefficients of determination. The standardized path coefficients in the structural model
supported hypotheses H1 and H2. The coupled sub-systems of the IT function explained
52 percent of the variance in exercisable digital options. The activity of exercisable
digital options determined 37 percent of the variance in IT strategic benefits. This PLS
path modeling did not address hypotheses H1a, H1b, H1c and H3 of the principal
research model.
Population t-value
AGR24 ← ITBENEFIT 18.975
AGR25 ← ITBENEFIT 10.018
AGR26 ← ITBENEFIT 32.375
AGR27 ← ITBENEFIT 17.354
AGR28 ← ITBENEFIT 33.060
FRQ07 ← D-OPTIONS 24.914
FRQ08 ← D-OPTIONS 43.671
FRQ09 ← D-OPTIONS 34.721
FRQ10 ← D-OPTIONS 15.089
MAT34 ← POLINTCON 27.973
MAT35 ← POLINTCON 30.572
MAT36 ← POLINTCON 30.668
MAT37 ← POLINTCON 19.426
MAT38 ← POLINTCON 17.824
MAT39 ← POLINTCON 19.381
MAT40 ← POLINTCON 12.616
MAT43 ← POLINTCON 22.454
MAT44 ← POLINTCON 17.666
MAT45 ← POLINTCON 18.208
MAT46 ← POLINTCON 10.868
MAT47 ← POLINTCON 8.433
D-OPTIONS → ITBENEFIT 11.690
POLINTCON → D-OPTIONS 13.554
Table 9-3 t-values from falsification modeling using bootstrapping
Major findings
167
Significance testing used a bootstrap procedure with 2000 samples of the 79 responses
and generated the t-values of Table 9-3. As the procedure uses random-sampling, each
bootstrap execution with the same response data produces a slightly different set of t-
values. The two-tailed, t-values of measurement item weights and the variable
correlations were all significant at p < 0.01 for Type I errors.
The PLS path modeling achieved a statistical power in excess of 0.80, considered by
most researchers as acceptable to reject a false null hypothesis (Type II errors)
(Marcoulides and Saunders 2006). This claim is based on the loadings of measurement
items rounding to 0.7 or greater and path correlations greater than 0.6 (see Figure 9-2).
These large effect sizes require a sample size of 23 to achieve a power of 0.80, as
determined in Table 7-13. The sample size of 79 used in the PLS path modeling was
more than sufficient to claim an acceptable level of statistical power.
A post hoc statistical power calculation for the primary hypothesis used the observed R2
of 0.522 (Figure 9-2, D-OPTIONS), a single predictor of POLINTCON and a p-value of
0.01. These variables generated a statistical power of 1.00 for the sample size of 79
(Soper 2009).
9.2.3. Reliability and validity of falsification modeling
When a variable has multiple measures, the measurement items must demonstrate
reliability and validity. Convergent reliability is the extent that all the measurement
items for a given variable have consistent values (Gefen et al. 2000). A Cronbach's
alpha of 0.7 is a benchmark for modest convergent reliability.
A second measure of convergent reliability is composite reliability and a modest
benchmark recommended is 0.70 (Hulland 1999). Composite reliability indicates that
the measurement items sufficiently represented their respective variable (Fink and
Neumann 2007), though construct reliability is ultimately not an empirical issue. That
the quality statistics produced from the PLS path modeling exceeded these two
benchmarks in Table 9-4 indicated strong convergent reliability.

Chapter 9
168
Variable AVE Composite reliability Cronbach’s alpha
D-OPTIONS 0.741 0.919 0.883
ITBENEFIT 0.710 0.924 0.898
POLINTCON 0.651 0.957 0.951
Table 9-4 Construct validity and reliability from falsification modeling (n=79)
Discriminant validity is the extent to which measurement items of a given variable
differ from measurement items of other variables in the same structural model (Hulland
1999). The falsification modeling had adequate discriminant validity, as the square root
of the Average Variance Extracted (AVE) for each variable was greater than any
correlations with other variables (Hulland 1999). The root of the AVE for each variable
is in the bolded cells in the diagonal of the correlation matrix in Table 9-1 and all show
adequate discriminant validity.
The loading with its respective variable indicates a measurement item’s reliability. A
low loading may be the result of a poorly worded question, an inappropriate item or an
improper transfer of an item from one context to another. The loading of the
measurement item to its respective variable should be 0.7 or more (Hulland 1999).
Figure 9-2 shows the loadings of the measurement items with the variables labeled on
the connecting arrows and all the loadings show sufficient item reliability.18
9.2.4. Measurement cross loadings of falsification modeling
Table 9-5 contains the cross-loadings of each measurement item with variables not
linked in Figure 9-2. The purpose of this quality check is to indicate problems in
discriminant validity, where cross loading of a measurement item with other variables is
too high.
Table 9-5 shows that most of the cross loadings of the measurement items with the other
variables were properly less than the benchmark of 0.7 (Hulland 1999). PLS path
18 The MAT47 loading of 0.671 had sufficient item reliability after rounding to the precision of the 0.7 benchmark.

Major findings
169
modeling is a mixture of a priori knowledge and data analysis (Tenenhaus et al. 2005).
The a priori knowledge of the cross loadings that are over the benchmark (MAT35←D-
OPTIONS, MAT45←D-OPTIONS, AGR26←POLINTCON, FRQ10←POLINTCON)
supported the claim of adequate discriminant validity. In these four cases, the
measurement items are of a different ontological type to the unlinked variables, e.g.
MAT35 is a measure of a persistent structure while D-OPTIONS activity is measured by
event frequency. Overall, the cross loadings reported in Table 9-5 indicated adequate
discriminant validity and supported the a priori knowledge of the constructs.
D-OPTIONS ITBENEFIT POLINTCON
AGR24 0.489 0.494
AGR25 0.367 0.458
AGR26 0.610 0.659
AGR27 0.492 0.532
AGR28 0.547 0.592
FRQ07 0.571 0.617
FRQ08 0.581 0.634
FRQ09 0.479 0.585
FRQ10 0.446 0.650
MAT34 0.642 0.559
MAT35 0.717 0.648
MAT36 0.630 0.557
MAT37 0.515 0.518
MAT38 0.557 0.510
MAT39 0.527 0.435
MAT40 0.542 0.440
MAT43 0.607 0.595
MAT44 0.536 0.477
MAT45 0.659 0.588
MAT46 0.471 0.474
MAT47 0.515 0.524
Table 9-5 Cross loadings of measurements from falisification modeling

Chapter 9
170
9.2.5. Findings from the falsification modeling
Overall, the falsification modeling displayed high statistical power and significance,
strong convergent validity for the variables, adequate discriminant validity and item
reliability for each measurement. Thus, the PLS path modeling was acceptable for
testing hypotheses H1 and H2.
The PLS path modeling showed a positive correlation between POLINTCON and D-
OPTIONS (Figure 9-2, ß=0.723, t=13.554, p<0.01) and did not falsify the H1
hypothesis. Similarly, the positive correlation between D-OPTIONS and ITBENEFIT
(Figure 9-2, ß=0.607, t=11.690, p<0.01) did not falsify the H2 hypothesis.
This PLS path modeling did not test hypotheses H1a H1b and H1c or hypothesis H3 in
the primary research model in Figure 6-1. Sections 10.2 and 10.3 respectively report the
testing of these hypotheses.
9.2.6. Data distribution normality
A MIS Quarterly editorial comment on PLS recommends the measurement of data
distribution normality (Marcoulides and Saunders 2006). Any statistical inferences from
the major findings to other large firms assumed normality in the data measured. The
findings have a probability of accepting a false positive of < 0.01 (Type I error) and
rejecting a false negative of > 0.80 (Type II error). The SmartPLS bootstrap procedure
estimated the population means and variances to calculate the probability of Type I
errors. The bootstrapped probability of Type I errors was an input to the post hoc
statistical power calculation for Types II errors (Soper 2009). Referencing Table 7-13
also assumes data normality, to estimate the minimum sample size to avoid Types II
errors (Marcoulides and Saunders 2006). Any deviation from data normality limits the
inferences from these probabilities to accept the hypotheses and generalize the findings
to a population. This section subjected the sample of 79 respondents from the mailed
and LinkedIn surveys to tests for normal distribution.
Where the mean and the variance of a population distribution are unknown, the
Kolmogorov-Smirnov test for normality is suited. Kurtosis and skewness are descriptive

Major findings
171
measures for normality. The kurtosis for a normal distribution is 0.00, with a value of
3.00 indicating a pointed peak and a negative value indicating uniform distribution. The
skewness for a normal distribution is 0.00, with a negative value indicating a long left
tail and relatively few low values, and with a positive value indicating a long right tail
and relatively few high values. The normality tests used the un-standardized latent
variable scores for POLINTCON, D-OPTIONS, ITBENEFIT and ITGOAL5 generated
by the SmartPLS execution reported on in section 9.2.
Histograms
0
0.1
0.2
0.3
0.4
0.5
0.6
0 1 2 3 4 5 6 7
POLINTCON
Den
sit
y
POLINTCON Normal(3.120,1.105)
POLINTCON sample statistics
Mean 3.120
Variance 1.220
Skewness (Pearson) 0.607
Kurtosis (Pearson) -0.453
Figure 9-6 Normality of POLINTCON (n=79)

Chapter 9
172
Figure 9-6 shows the degree of distribution normality of POLINTCON in the principal
research model (see Figure 9-2). The histogram shows statistics based on the input
POLINTCON data and the estimated parameters of a perfect normal distribution. As
perfect normal distribution is rare, a Kolmogorov-Smirnov test for normality returned a
D-value 0.133 at a p-value of 0.114. The null hypothesis is that POLINTCON follows a
normal distribution and the alternative hypothesis is that POLINTCON did not follow a
normal distribution. As the Kolmogorov-Smirnov test interpretation had the computed
p-value of 0.114 greater than the significance level of 0.05, the null hypothesis was
accepted.
Figure 9-7 shows the degree of distribution normality of D-OPTIONS. The histogram
shows statistics based on the input D-OPTIONS data and the estimated parameters of a
perfect normal distribution. The Kolmogorov-Smirnov test for normality returned a D-
value of 0.075 at a p-value of 0.752. The null hypothesis is D-OPTIONS follow a
normal distribution and the alternative hypothesis is D-OPTIONS did not follow a
normal distribution. As the Kolmogorov-Smirnov test interpretation had the computed
p-value of 0.752 greater than the significance level of 0.05, the null hypothesis was
accepted.

Major findings
173
Histograms
0
0.1
0.2
0.3
0.4
0.5
0.6
0 1 2 3 4 5 6
D-OPTIONS
Den
sit
y
D-OPTIONS Normal(2.771,0.893)
D-OPTIONS sample statistic
Mean 2.771
Variance 0.798
Skewness (Pearson) 0.385
Kurtosis (Pearson) -0.190
Figure 9-7 Normality of D-OPTIONS (n=79)

Chapter 9
174
Histograms
0
0.1
0.2
0.3
0.4
0.5
0.6
0 1 2 3 4 5 6
ITBENEFIT
Den
sit
y
ITBENEFIT Normal(3.525,0.967)
ITBENEFIT sample statistics
Mean 3.525
Variance 0.936
Skewness (Pearson) -0.507
Kurtosis (Pearson) -0.523
Figure 9-8 Normality of ITBENEFIT (n=79)
Figure 9-8 shows the degree of distribution normality of ITBENEFIT. The histogram
shows statistics based on the input ITBENEFIT data and the estimated parameters of a
perfect normal distribution. The Kolmogorov-Smirnov test for normality returned a D-
value of 0.126 at a p-value of 0.155. The null hypothesis is that ITBENEFIT follows a
normal distribution and the alternative hypothesis is that ITBENEFIT did not follow a
normal distribution. As the Kolmogorov-Smirnov test interpretation had the computed

Major findings
175
p-value of 0.155 greater than the significance level of 0.05, the null hypothesis was
accepted.
Histograms
0
0.05
0.1
0.15
0.2
0.25
0.3
0.35
0.4
0.45
0 1 2 3 4 5 6 7
ITGOAL5
Den
sit
y
ITGOAL5 Normal(3.322,1.061)
ITGOAL5 sample statistics
Mean 3.322
Variance 1.125
Skewness (Pearson) 0.310
Kurtosis (Pearson) -0.692
Figure 9-9 Normality of ITGOAL5 (n=79)
Figure 9-9 shows the degree of distribution normality of ITGOAL5 of the existing
practice model (section 9.4). The histogram shows statistics based on the input
ITGOAL5 data and the estimated parameters of a perfect normal distribution. The
Kolmogorov-Smirnov test for normality returned a D-value of 0.094 at a p-value of

Chapter 9
176
0.473. The null hypothesis is that ITGOAL5 follows a normal distribution and the
alternative hypothesis is that ITGOAL5 did not follow a normal distribution. As the
Kolmogorov-Smirnov test interpretation had the computed p-value of 0.473 greater than
the significance level of 0.05, the null hypothesis was accepted.
The software XLSTAT19 calculated the above normality values and Kolmogorov-
Smirnov tests. Overall, the tests suggested that the distribution normality of
POLINTCON, D-OPTIONS and ITBENEFIT in the primary research model (see Figure
9-2), and ITGOAL5 in the alternative research model, are sufficient for statistical
inferences to be made from the major findings of this thesis (Marcoulides and Saunders
2006).
The major findings had probabilities of accepting a false positive of p<0.01 (Type I
error) and rejecting a false negative of > 0.80 (Type II error). Any deviation from data
normality in the target population downgrades these probabilities. The results of the
above Kolmogorov-Smirnov tests suggested imperfect but significant data normality.
An assumption of this thesis was that any degradation from the above probabilities
arising from the less than perfect normality did not exceed 0.05 for Type I errors and
0.80 for Type II errors, which social science practice generally accept as significant.
9.2.7. PLS path modeling bias
A known bias in PLS path modeling is that a smaller number of measurement items for
a construct will overestimate the loading of the measurement items and underestimate
the structural paths among constructs (Rouse and Corbet 2008). In the principal research
model, D-OPTIONS and ITBENEFIT respectively have four and five measurement
items. Chin suggests that the need for six to eight measurement items per construct may
be relaxed with more reliable measures (Chin et al. 2003). This relaxation was
permissible for the principal research model as the composite reliability of all constructs
was high (see Table 9-4). As the effect of the PLS bias from smaller number of
measurement items is an underestimated path coefficient, the large correlations between
POLINTCON and D-OPTIONS (Figure 9-2, ß=0.723, t=13.554, p<0.01) and between
19 XLSTAT Version 2009.3.01, Copyright Addinsoft 1995-2009, www.xlstat.com.

Major findings
177
D-OPTIONS and ITBENEFIT (Figure 9-2, ß=0.607, t=11.690, p<0.01) found in the
falsification modeling are conservative determinations. Consequently, the known bias in
PLS path modeling was not considered a limitation of the very large determinations of
the findings.
9.3. The primary hypothesis has transferability
A data analysis finding was that the plausibility of the principal research model is
transferable to other settings beyond the survey samples. This section describes the
testing of two hypotheses from the principal research model using PLS path modeling.
After establishing the statistical acceptability of the modeling, the section interpreted
the modeling results as support for the transferability finding.
9.3.1. Testing of hypotheses H1 and H2 for transferability
This section reports on the testing of hypotheses H1 and H2 with a smaller but well-
identified sample. The purpose was to determine the transferability of the findings to
other settings, as explored in section 11.9.
The PLS path modeling was repeated to establish the transferability of the principal
research model (see Figure 6-1) to organizations outside the surveyed samples (Seddon
and Scheepers 2006). The complete set of 79 responses used for falsification had
limitations for this purpose. First, the eight responses from the pilot survey over-
represent Oakton in any generalization. Second, the 33 responses from the web-based
survey were anonymous and their self-described organizational profiles are unverifiable.
Third, respondents from information, media and telecommunication organizations are
over-represented (33%) in the web-based survey of IT discussion groups.
9.3.2. PLS modeling for transferability
The transferability modeling used the responses from the 34 Oakton client organizations
for three reasons. First, I could identify the client organizations and the individual
respondents from the mailed survey, which allowed verification of their

Chapter 9
178
representativeness for generalization. Second, the mailed survey had a known
organizational response rate of 16.75% and no evident non-response bias (see section
7.7). Third, there was a notable representation of both business managers (12) and IT
managers (22) to mitigate any respondent bias in measuring process maturity of IT
function or business outcomes from existing information systems.
In this PLS path modeling, the level of analysis was the organization and not the
individual. Two organizations each completed two responses. In order not to over-
represent these two organizations, the responses used were that of an IT manager in
preference to an IT professional, and a business manager to an IT manager.
D-OPTIONS ITBENEFIT POLINTCON
D-OPTIONS 0.806
ITBENEFIT 0.602 0.732
POLINTCON 0.734 0.584 0.799
Table 9-10 Correlation matrix from transferability modeling (n=34)
The significance testing used a bootstrap procedure with 2000 samples of the 34
responses and generated the t-values of Table 9-12. The two-tailed, t-values of
measurement item weights and the variable correlations were all significant at p<0.01
for Type I errors.

Major findings
179
Figure 9-11 Research model for transferability (n=34)

Chapter 9
180
The PLS path modeling for transferability achieved a statistical power in excess of 0.80.
This claim was based on the loading of measurement items that rounded to 0.7 or
greater, and path correlations greater than 0.6, as shown in Figure 9-11. These large
effect sizes required a sample size of 23 to achieve a power of 0.80, as determined by
Table 7-13. The sample size of 34 used in the transferability PLS path modeling was
sufficient to claim an acceptable level of statistical power.
Further, the post hoc statistical power calculation for the primary hypothesis used the
observed R2 of 0.539 (Figure 9-11, D-OPTIONS), with a single predictor of
POLINTCON and a p-value of 0.01. These variables generated a statistical power of
0.999680 for the sample size of 34 (Soper 2009).
Population t-value
AGR24 ← ITBENEFIT 5.636
AGR25 ← ITBENEFIT 4.756
AGR26 ← ITBENEFIT 7.510
AGR27 ← ITBENEFIT 6.607
AGR28 ← ITBENEFIT 12.316
FRQ07 ← D-OPTIONS 5.306
FRQ08 ← D-OPTIONS 18.661
FRQ09 ← D-OPTIONS 16.923
FRQ10 ← D-OPTIONS 11.469
MAT34 ← POLINTCON 16.416
MAT35 ← POLINTCON 26.151
MAT36 ← POLINTCON 20.468
MAT37 ← POLINTCON 10.973
MAT38 ← POLINTCON 9.481
MAT39 ← POLINTCON 9.725
MAT40 ← POLINTCON 6.242
MAT43 ← POLINTCON 17.333
MAT44 ← POLINTCON 10.110
MAT45 ← POLINTCON 8.789
MAT46 ← POLINTCON 9.549
MAT47 ← POLINTCON 6.747
D-OPTIONS → ITBENEFIT 8.441
POLINTCON → D-OPTIONS 10.234
Table 9-12 t-values from transferability modeling using bootstrapping

Major findings
181
9.3.3. Reliability and validity of transferability modeling
High composite reliability and Cronbach’s alpha measures in Table 9-13 showed strong
convergent validity. The root of the AVE for each variable is in the diagonal of the
correlation matrix in Table 9-10 and all showed adequate discriminant validity.
Variable AVE Composite reliability Cronbach’s alpha
D-OPTIONS 0.650 0.881 0.882
ITBENEFIT 0.536 0.852 0.788
POLINTCON 0.639 0.955 0.948
Table 9-13 Construct validity and reliability from transferability modeling (n=34)
The measurement items’ loadings indicate their individual reliabilities. The loading of
the measurement item to its respective variable should be 0.7 or more (Hulland 1999).
Figure 9-11 shows that the loadings of all measurements had item reliability.
9.3.4. Findings from transferability modeling
Overall, the transferability modeling displayed high statistical power and significance,
strong convergent validity, adequate discriminant validity and item reliability for each
measurement. Thus, the PLS path modeling was acceptable for testing hypotheses H1
and H2.
The results of the PLS path modeling for transferability was comparable with that of
research modeling for falsification. The positive path coefficient between POLINTCON
and D-OPTIONS are consistent in both models (Figure 9-11, ß=0.734, p<0.01 cf. Figure
9-2, ß=0.723, p<0.01). Similarly, the positive path coefficient between D-OPTIONS and
ITBENEFIT are consistent between the two models (Figure 9-11, ß=0.602, p<0.01 cf.
Figure 9-2, ß=0.607, p<0.01).
The H1 and H2 hypotheses of the principal research model was confirmed by the PLS
path modeling that used only data from the 34 client organizations of Oakton. This
subset of data collected had fully identified respondents to determine the transferability
of the correlations of the principal research model to settings beyond the responding
client organizations of Oakton. Section 7.3.3 described the profile of responding Oakton

Chapter 9
182
clients, and is used to extrapolate the PLS path modeling of principal research model to
other large companies in Australian and other OECD countries. Section 11.9 discusses
this generalization to other settings.
9.4. Improvement over existing practice
The data analysis found that the principal research model was an improvement over an
existing industry practice when determining agility outcomes. This section describes the
testing of a hypothesis of an alternative research model using PLS path modeling. After
establishing the statistical acceptability of the modeling, the section interpreted the
results as support for the finding of an improvement over existing practice.
9.4.1. Testing of hypothesis H4
This section reports on the testing of hypothesis H4 as an alternative to the principal
research model. The hypothesis stated
The more mature the processes of the COBIT IT Goal 5 control objectives
(ITGOAL5), the more often digital-options for the existing information systems
are exercisable (D-OPTIONS).
The aim is to compare the efficacy of an existing industry practice against the principal
research model in determining agility outcomes.
9.4.2. PLS modeling of existing practice
COBIT 4.1 explicitly links four measurable control objectives to the goal of Create IT
agility, denoted as ITGOAL5. The COBIT control objectives are Define the information
architecture; Define the IT processes, organization and relationships; Manage IT human
resources and Acquire and maintain technology infrastructure (IT Governance Institute
2007). The mailed and web-based questionnaires surveyed the maturity of the IT
processes associated with these COBIT control objectives in questions MAT42, MAT31,
MAT32 and MAT33 respectively. An exogenous variable ITGOAL5 reflectively linked

Major findings
183
the four measurement items and became the sole predictor of D-OPTIONS, as an
alternative to POLINTCON in the primary research model.
The correlation matrix of Table 9-15 and the path modeling of Figure 9-14 reported the
findings of this alternative model from an existing industry practice.
Figure 9-14 Existing practice modeling (n=79)

Chapter 9
184
ITGOAL5 D-OPTIONS
ITGOAL5 0.806
D-OPTIONS 0.616 0.861
Table 9-15 Correlation matrix from existing practice modeling (n=79)
The statistical significance testing used a bootstrap procedure with 2000 samples of the
79 responses and generated the t-values of Table 9-16. The two-tailed, t-values of
measurement item weights and the variable correlations were all significant at p < 0.01
for Type I errors.
Population t-value
FRQ07 ← D-OPTIONS 22.555
FRQ08 ← D-OPTIONS 43.183
FRQ09 ← D-OPTIONS 32.066
FRQ10 ← D-OPTIONS 14.899
MAT31 ← ITGOAL5 7.233
MAT32 ← ITGOAL5 25.377
MAT33 ← ITGOAL5 20.089
MAT42 ← ITGOAL5 17.564
FRQ07 ← D-OPTIONS 22.555
FRQ08 ← D-OPTIONS 43.183
ITGOAL5 → D-OPTIONS 9.757
Table 9-16 t-values from existing practice modeling using bootstrapping
The PLS path modeling for existing practice achieved a statistical power in excess of
0.80. This claim was based on the loadings of measurement items rounding to 0.7 or
greater, and paths correlations greater than 0.6, as shown in Figure 9-14. These large
effect sizes required a sample size of 23 to achieve a power of 0.80 (see Table 7-13).
The sample size of 79 used in the existing practice PLS path modeling was sufficient to
claim an acceptable level of statistical power.
Further, a post hoc statistical power calculation for the alternative hypothesis H4 used
the observed R2 of 0.379 (Figure 9-14, D-OPTIONS), with a single predictor of

Major findings
185
ITGOAL5 and a p-value of 0.01. These variables generate a statistical power of
0.999989 for the sample size of 79 (Soper 2009).
9.4.3. Reliability and validity of existing practice modeling
The benchmarks in Table 9-17 show strong convergent validity. The root of the AVE for
each variable is in the diagonal of the correlation matrix in Table 9-15 and all show
adequate discriminant validity values.
The loading of the measurement item to its respective variable should be 0.7 or more
(Hulland 1999). Figure 9-14 shows the loadings of all measurements with their
variables had item reliability.
Variable AVE Composite reliability Cronbach’s alpha
ITGOAL5 0.650 0.881 0.820
D-OPTIONS 0.741 0.920 0.883
Table 9-17 Construct validity and reliability from existing proactice modeling (n=79)
9.4.4. Findings from existing practice modeling
Overall, the existing practice modeling displayed high statistical power and
significance, strong convergent reliability, strong discriminant validity and item
reliability for each measurement. Thus, the PLS path modeling was acceptable for
testing hypothesis H4.
The objective of PLS is to maximize the variance explained, revealed in the R2 of the
endogenous variable. This PLS path modeling found the existing practice of using
ITGOAL5 as the exogenous variable had a weaker determination for agility outcomes
(Figure 9-14, D-OPTIONS, R2=0.379) than the principal research model that used
POLINTCON (Figure 9-2, D-OPTIONS, R2=0.522).
While not falsifying the hypothesis H4, the finding questions whether the existing
practice to create IT agility, as prescribed by COBIT, is more effective than the structure
identified by applying the VSM meta-system to the IT function. The finding supports a

Chapter 9
186
claim that the principal research model of this thesis is an improvement over existing
industry practice.
9.5. A projected increase in agility outcomes
A finding was that the likely increase in the frequency of exercisable digital options has
a correlation constant of 0.577 for an increase in process maturity of the IT function.
This section describes a regression analysis and the interpretation of the ANOVA results
that supported this projection of agility outcomes.
9.5.1. The coefficient of correlation for agility outcomes
This thesis aimed to provide an explaining and predicting theory on how the IT function
enables agility in information systems that informs IS practitioners. A coefficient of
correlation between the constructs POLINTCON and D-OPTIONS provides IS practice
with the basis for estimating the return from an investment in the IT function to increase
the frequency of agility events. Providing a prediction is in contrast to the IS theoretical
tradition, which focuses on explaining variances using coefficient of determination and
goodness-of-fit measures (Gefen et al. 2000; Hulland 1999). IS papers that provide
guidelines on structural equation modeling rarely mention reporting the coefficient of
correlation (Chin et al. 2003; Gefen et al. 2000; Haenlein and Kaplan 2004; Henriksen
and Pedersen 2007; Marcoulides and Saunders 2006; Wetzels et al. 2009). This
coefficient is the constant a in the slope-intercept form of the linear equation: y = ax +
b. Informing practitioners on how to project returns from investments into IT resources
contributes to the relevancy of IS research to practice, which has long been an issue in
the academic community (Rosemann and Vessey 2008).
9.5.2. ANOVA regression analysis of agility outcomes
In the PLS path modeling in section 9.2.2, SmartPLS generated un-standardized latent
variable scores. These scores underwent a regression analysis using XLSTAT20. All
completed responses (n=79) from both the mailed and web-based surveys were utilized
20 XLSTAT Version 2009.3.01, Copyright Addinsoft 1995-2009, www.xlstat.com.

Major findings
187
in the regression analysis. The use of un-standardized variable scores for linear
regression is a general recommendation of the academic authors of SmartPLS (Ringle et
al. 2005).
Figure 9-18 showed the correlation constant for the trend line was 0.5776, at a level of
significance of p<0.01. The plotted points are the individual 79 cases of the
respondents.
Regression of D-OPTIONS by POLINTCON (R²=0.510)
0
1
2
3
4
5
6
1 2 3 4 5 6 7
POLINTCON
D-O
PT
ION
S
Active Model
Conf. interval (Mean 95%) Conf. interval (Obs. 95%)
Source Value Standard error t-value Pr > |t|
Intercept 0.969 0.215 4.517 < 0.0001
POLINTCON 0.578 0.065 8.902 < 0.0001
Equation of the model:
D-OPTIONS = 0.9691 + 0.5776*POLINTCON
Figure 9-18 Plot of the correlation of POLINTCON and D-OPTIONS (n=79)

Chapter 9
188
The intercept constant for the un-standardized correlation between POLINTCON and
D-OPTIONS plotted points was 0.9691. An intercept of the trend-line at approximately
one was probably the result of POLINTCON having measurement items of a 6-point
maturity scale and D-OPTIONS measured on a 5-point frequency scale. If the scales to
measure the independent and dependent variables had the same number of points, the
intercept constant for the un-standardized correlated variables may have been zero.
9.5.3. Findings from agility outcomes projection
The finding from the regression analysis is a likely forecast in increasing agility in
existing information systems. An increase in POLICY, INTELL and CONTRL of the IT
function, as measured by the maturity of the associated IT processes, will result in a
0.5776 increase in the frequency that digital options are exercisable. The explained
variance along the trend line was very strong (Figure 9-2, D-OPTIONS, R2=0.522).
An upper limit to this trend line is likely to occur when the associated IT processes
reach the optimized maturity level. At the optimized level, the IT processes continue to
be subject to continuous improvement or adopt the best practices from other enterprises.
This thesis did not measure the frequency of agility activity where the IT processes are
continuing at the optimized level over time. A reasonable assumption is an increase in
agility activity would continue within the optimized level, albeit at a different rate of
increase than from moving up from the lower maturity levels.
In terms of the basic model of agility from IS theory (Figure 2-11), the increased
capability of the IT function to sense fluctuations in the business environment and to
build a portfolio of digital options, is likely to increase, in some proportion, the
occurrence of exercisable digital options that become agile responses to those
fluctuations. The correlation constant of 0.5776 predicts that proportion when moving
up the IT processes maturity levels.
The finding informs IS practitioners how to project the likely return of investment.
Armed with the correlation constant of 0.5776, a cost for increasing process maturity of
Policy, Intelligence and Control subsystems of the IT function, and a measured benefit

Major findings
189
from exercisable digital options; a return of investment is calculable. Any prediction is
subject to the limitations of this thesis discussed in Chapter 12.
9.6. Adjustments for common method variance
As with most Likert-type surveys, this thesis relied on collecting all the measurement
items from each respondent, with each respondent using a single survey instrument at
one point in time. This allows the possibility that common method variance (CMV)
inflated the relationships found among the variables. Malhotra et al. (2006) recommend
the marker variable technique for assessing CMV as effective for IS research. The
questionnaire included an item (FRQ12) that asked how frequently does your company
"Have escalations or unresolved issues due to lack of, or insufficient responsibility for,
assignments?" This measurement item met the post hoc analysis criteria for a marker
variable by having the smallest positive correlation with an exogenous or endogenous
variable from Figure 9-2 (Malhotra et al. 2006). The conservative assumption was the
correlations of those variables with the marker variable were due to CMV. The
calculations of the adjusted correlation, rA, and adjusted t-statistic, tα/2,n−3, from the
unadjusted correlation, rU and the marker variable correlation, rM, are:
M
MU
Ar
rrr
−
−=
1
( )( )3
1 2n/2,
−−
= 3−
nr
rt
A
A
α
The estimate of CMV used was the marker variable correlation of FRQ12 with D-
OPTIONS, i.e. rM = 0.156. Table 9-19 shows the correlations between variables
adjusted by the CMV estimate from the above modeling that address hypotheses H1 and
H2. The adjusted correlations suggest that CMV may be present in the survey responses
but only account for a small reduction from the uncorrected correlations. The adjusted t-
values of the correlations remain significant at p < 0.01.
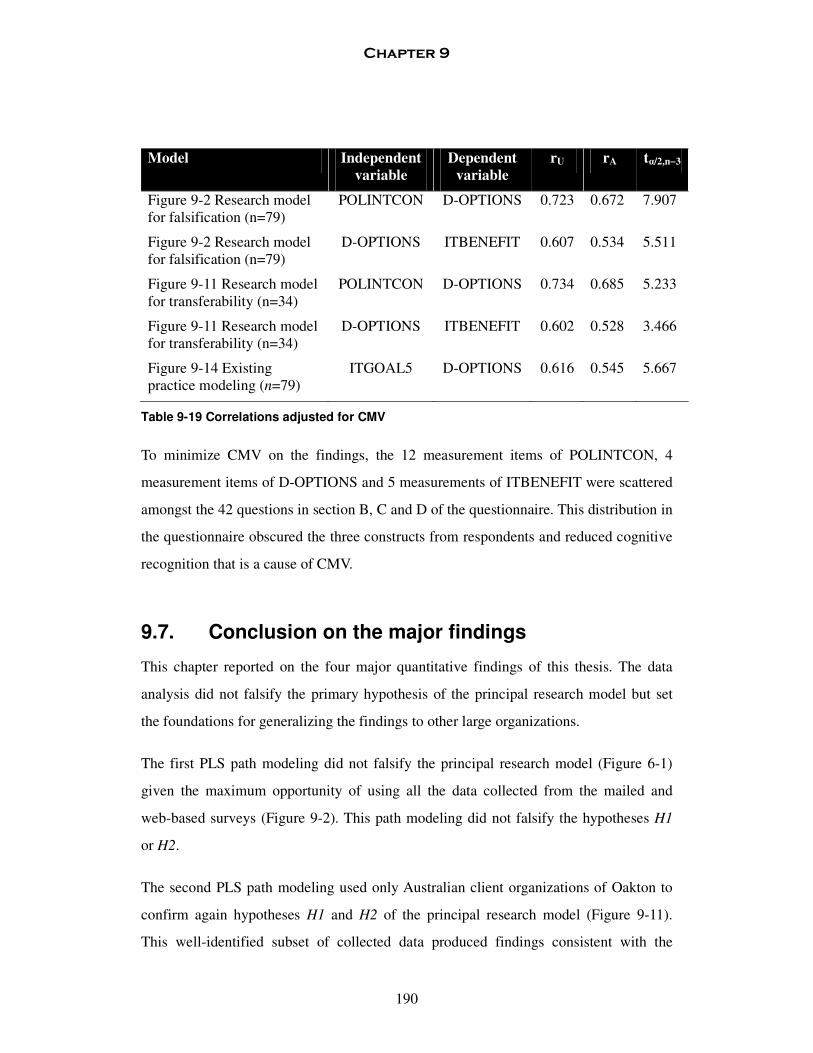
Chapter 9
190
Model Independent
variable
Dependent
variable
rU rA tα/2,n−3
Figure 9-2 Research model for falsification (n=79)
POLINTCON D-OPTIONS 0.723 0.672 7.907
Figure 9-2 Research model for falsification (n=79)
D-OPTIONS ITBENEFIT 0.607 0.534 5.511
Figure 9-11 Research model for transferability (n=34)
POLINTCON D-OPTIONS 0.734 0.685 5.233
Figure 9-11 Research model for transferability (n=34)
D-OPTIONS ITBENEFIT 0.602 0.528 3.466
Figure 9-14 Existing practice modeling (n=79)
ITGOAL5 D-OPTIONS 0.616 0.545 5.667
Table 9-19 Correlations adjusted for CMV
To minimize CMV on the findings, the 12 measurement items of POLINTCON, 4
measurement items of D-OPTIONS and 5 measurements of ITBENEFIT were scattered
amongst the 42 questions in section B, C and D of the questionnaire. This distribution in
the questionnaire obscured the three constructs from respondents and reduced cognitive
recognition that is a cause of CMV.
9.7. Conclusion on the major findings
This chapter reported on the four major quantitative findings of this thesis. The data
analysis did not falsify the primary hypothesis of the principal research model but set
the foundations for generalizing the findings to other large organizations.
The first PLS path modeling did not falsify the principal research model (Figure 6-1)
given the maximum opportunity of using all the data collected from the mailed and
web-based surveys (Figure 9-2). This path modeling did not falsify the hypotheses H1
or H2.
The second PLS path modeling used only Australian client organizations of Oakton to
confirm again hypotheses H1 and H2 of the principal research model (Figure 9-11).
This well-identified subset of collected data produced findings consistent with the

Major findings
191
falsification modeling (Figure 9-2) and suggested transferability to other large
companies beyond the sample.
The third PLS path modeling looked at an existing industry ‘best practice’ framework of
COBIT (Figure 9-14). The finding suggests that the principal research model is superior
in creating agility in information systems than the existing ‘best practice’ framework.
This chapter included a regression analysis of the data generated from the falsification
modeling. This lead to a prediction of how much an increase in process maturity of the
IT function will increase the frequency of exercisable digital options for existing
information systems. The chapter finished discussing the adjustments to the major
findings made for common method variance.
The following chapter tests the remaining hypotheses H1a, H1b, H1c and H3, and
explores some alternative models to challenge the principal research model (Figure
6-1).

Chapter 9
192

193
Chapter 10. Other findings
10.1. Introduction
A number of sources, other than the theoretical development of Chapter 3, suggested the
data analysis in this chapter. The first source was a different technique of PLS path
modeling to explain the coupling of POLICY, INTELL and CONTRL into the higher-
order construct of POLINTCON (Wetzels et al. 2009). Second, the ontological
possibilities of this thesis suggested alternatives to the principal research model (Figure
6-1), where the business knowledge of the human agents of the IT function may be a
significant factor in enabling agility in information systems. Third, the applicability
check with Oakton suggested that organizations with an IT governance archetype of a
business monarchy get greater benefit from agility in information systems than IT
monarchies (H3). This chapter’s findings are limited by not being founded in the
theoretical development of the thesis, but are worthy of consideration.
10.2. Mutuality within the IT function enabled agility
A finding was that Intelligence accounted for more than half the IT function capability
for determining agility. Following Intelligence, Policy and Control share the remaining
half of the determination of agility by the IT function. This section describes the testing
of three hypotheses from the principal research model using PLS path modeling. After
establishing the statistical acceptability of the modeling, the section interpreted the
modeling results that supported the finding. This finding did not contradict the VSM
approach that the whole IT function possesses mutual properties for enabling agility,
and is not just the aggregate of Policy, Intelligence and Control.
10.2.1. Testing of hypotheses H1a, H1b and H1c
This section reports on the testing of hypotheses H1a, H1b and H1c of the principal
research model (Figure 6-1). These three hypotheses respectively stated:

Chapter 10
194
The more mature the processes of Policy of the IT function (POLICY), as a part
of POLINTCON, the more often digital-options for the existing information
systems are exercisable (D-OPTIONS).
The more mature the processes of Intelligence of the IT function (INTELL), as a
part of POLINTCON, the more often digital-options for the existing information
systems are exercisable (D-OPTIONS).
The more mature the processes of Control of the IT function (CONTRL), as a
part of POLINTCON, the more often digital-options for the existing information
systems are exercisable (D-OPTIONS).
The PLS path modeling in this section unbundled the POLINTCON construct into a
two-order hierarchical construct. The analysis affirms that POLINTCON possesses its
own properties, and is not just the aggregate of POLICY, INTELL and CONTRL (see
section 6.5.1). The first-order constructs were POLICY, INTELL and CONTRL, which
represent the three sub-systems of the VSM meta-system; and the second-order
construct was POLINTCON, which represents the entire VSM meta-system applied to
the whole IT function.
10.2.2. PLS modeling of a hierarchical construct
Wetzel et al. (2009) set guidelines for hierarchical constructs in PLS path modeling,
which informed the two-order hierarchical construct used in this section, by
recommending the repeated use of each measurement item in each order of the
hierarchical construct. Thus, the three reflective measures for POLICY, the seven
measures of INTELL and three measures of CONTRL, in the first-order of the
hierarchical construct, all appear again as reflective measures of the second-order for
POLINTCON. Figure 10-2 shows the repeated use of the reflective measures in the
two-order hierarchical construct.
The first-order of the hierarchical construct tested the hypotheses H1a, H1b and H1c.
Each of the hypotheses respectively tested POLICY, INTELL and CONTRL as indirect
determinants of D-OPTIONS. The modeling in this section had a level of analysis of

Other findings
195
parts of the IT function, which is lower than that in Figure 9-2 that viewed the IT
function as a whole.
CONTRL D-OPTIONS INTELL ITBENEFIT POLICY
CONTRL 0.866
D-OPTIONS 0.641 0.861
INTELL 0.781 0.722 0.851
ITBENEFIT 0.615 0.607 0.644 0.843
POLICY 0.686 0.593 0.850 0.542 0.900
Table 10-1 Correlation matrix from hierarchical modeling (n=79)
The significance testing used a bootstrap procedure with 2000 samples of the 79
responses and generated the t-values of Table 10-3. The two-tailed, t-values of
measurement item weights and the variable correlations were all significant at p<0.01
for Type I errors.
The hierarchical modeling achieved a statistical power in excess of 0.80, based on the
loadings of measurement items rounding to 0.7 or greater, and paths correlations of 0.5
or greater, as shown in Table 10-1. These effect sizes require a sample size of 43 to
achieve a power of 0.80, as indicated in Table 7-13. The sample size of 79 used in the
hierarchical modeling was sufficient to claim an acceptable level of statistical power.
Further, a post hoc statistical power calculation for the primary hypotheses H1a,
H1band H1c used the observed R2 of 0.515 (Figure 10-2, D-OPTIONS), with three
predictors of POLICY, INTELL and CONTRL, and a p-value of 0.01. These variables
generate a statistical power of 0.999978 for the sample size of 79 (Soper 2009).

Chapter 10
196
Figure 10-2 Hierarchical modeling (n=79)

Other findings
197
Population t-value
AGR24 ← ITBENEFIT 18.371 AGR25 ← ITBENEFIT 9.774
AGR26 ← ITBENEFIT 31.932
AGR27 ← ITBENEFIT 16.449
AGR28 ← ITBENEFIT 33.952
FRQ07 ← D-OPTIONS 26.229
FRQ08 ← D-OPTIONS 42.900 FRQ09 ← D-OPTIONS 35.404
FRQ10 ← D-OPTIONS 15.801
MAT34 ← INTELL 34.671 MAT34 ← POLINTCON 26.644
MAT35 ← POLINTCON 25.720
MAT35 ← INTELL 40.967 MAT36 ← INTELL 23.701
MAT36 ← POLINTCON 30.618
MAT37 ← POLICY 39.749 MAT37 ← POLINTCON 19.924
MAT38 ← POLICY 25.540
MAT38 ← POLINTCON 17.533 MAT39 ← POLICY 45.298
MAT39 ← POLINTCON 21.641
MAT40 ← INTELL 13.565 MAT40 ← POLINTCON 13.011
MAT43 ← INTELL 21.819
MAT43 ← POLINTCON 20.531 MAT44 ← INTELL 19.341
MAT44 ← POLINTCON 19.442 MAT45 ← CONTRL 19.844
MAT45 ← POLINTCON 17.557
MAT46 ← CONTRL 33.841 MAT46 ← POLINTCON 11.757
MAT47 ← CONTRL 20.835
MAT47 ← POLINTCON 8.530
CONTRL → POLINTCON 17.425
D-OPTIONS → ITBENEFIT 11.956
INTELL → POLINTCON 36.288 POLICY → POLINTCON 26.825
POLINTCON → D-OPTIONS 12.388
Table 10-3 t-values from hierarchical modeling using bootstrapping

Chapter 10
198
10.2.3. Reliability and validity from hierarchical modeling
The benchmarks in Table 10-4 show convergent validity.
Variable AVE Composite reliability Cronbach’s alpha
CONTRL 0.750 0.900 0.833
D-OPTIONS 0.741 0.919 0.883
INTELL 0.724 0.940 0.923
ITBENEFIT 0.710 0.924 0.898
POLICY 0.810 0.927 0.882
POLINTCON 0.651 0.957 0.951
Table 10-4 Construct validity and reliability from hierarchical modeling (n=79)
The bolded cells in the diagonal of the correlation matrix in Table 10-1 show
discriminant validity, as the square roots of the AVE in the diagonal cells was greater
than the correlations in the cells along their vertical and horizontal axes (Hulland 1999).
Discriminant validity was only required of the first-order variables and not the second-
order variable (Wetzels et al. 2009).
The loading of the measurement item to its respective variable should be 0.7 or more
(Hulland 1999). Figure 10-2 shows all the loadings had item reliability.
10.2.4. Measurement cross loadings revisited
Constructing POLINTCON from second-order variables afforded an opportunity to
revisit the analysis of the measurement cross loadings discussed in section 9.2.4. Table
10-5 contains the cross-loadings of measurement items with POLICY INTELL and
CONTRL not linked in Figure 10-2.
Table 10-5 showed that many cross loadings did not meet the benchmark of being less
than 0.7. The strongest indications are that all the POLICY measures (MAT37 MAT38
MAT39) displayed commonality with INTELL, and most of the INTELL measures
(MAT35 MAT36 MAT40 MAT44) displayed commonality with POLICY. The
CONTRL measures did discriminate from INTELL and POLICY, with the exception of
MAT45.

Other findings
199
Measurement CONTRL INTELL POLICY
MAT34 0.7112 0.6982
MAT35 0.6544 0.7139
MAT36 0.7408 0.7978
MAT37 0.6098 0.7518
MAT38 0.5955 0.7901
MAT39 0.6465 0.7517
MAT40 0.5736 0.7120
MAT43 0.6723 0.6968
MAT44 0.6217 0.7185
MAT45 0.7646 0.7223
MAT46 0.6555 0.5414
MAT47 0.5847 0.4894
Table 10-5 Cross loadings of measurements from hierarchical modeling
Accessing PLS path modeling requires a priori knowledge (Tenenhaus et al. 2005). The
knowledge to assess discriminant validity of POLICY, INTELL and CONTRL is the
composite construction of POLINTCON. POLINTCON possesses mutual properties
and is not a conglomerate of unique properties of POLICY, INTELL and CONTRL. The
axioms of the VSM have residual variety of System THREE and System FOUR
absorbed by System FIVE, bestowing mutual properties on the meta-system (Beer
1984). Mutual properties goes towards explaining the loadings of measures linked with
the POLICY, INTELL and CONTRL (mostly 0.8 and 0.9 in Figure 10-2) being close to
their cross-loadings (mostly 0.6 and 0.7 in Table 10-5). The IS literature on doing PLS
path modeling (Gefen et al. 2000; Hulland 1999; Marcoulides et al. 2009; Wetzels et al.
2009) is silent on the interpretation of cross-loadings amongst second-order variables
for discriminant validity. This is a possible area for further research.
10.2.5. Findings from hierarchical modeling
Overall, the hierarchical modeling displayed high statistical power and significance,
strong convergent validity, discriminant validity amongst first-order variables and the

Chapter 10
200
item reliability for each measurement. Thus, the PLS path modeling was acceptable for
testing hypotheses H1a, H1b and H1c.
The findings reported in this section did not falsify these hypotheses. The first order
variables of INTELL, CONTRL and POLICY displayed discriminant validity amongst
themselves, and second-order construct of POLINTCON positively correlated with D-
OPTIONS (Figure 10-2, ß=0.718, p<0.01).
Wetzel et al. (2009) guide the deriving of the indirect effects of a first-order exogenous
variable on a endogenous variable. The indirect effect is the product of the path
coefficient of the first-order variable and that of the second-order variable of the
exogenous hierarchical construct. From Figure 10-2, the indirect effects of the first-
order exogenous variables on D-OPTIONS calculate as:
• POLICY→POLINTCON (ß=0.280) and POLINTCON→D-OPTIONS
(ß=0.718) having the product 0.201;
• INTELL→POLINTCON (ß=0.537) and POLINTCON→D-OPTIONS
(ß=0.718) having the product 0.386;
• CONTRL→POLINTCON (ß=0.255) and POLINTCON→D-OPTIONS
(ß=0.718) having the product 0.183.
These findings from hierarchical modeling reveal the relative contribution of POLICY,
INTELL and CONTRL to enable agility in existing information systems. From the IS
practice perspective, an IT function of a large organization should look first to the
strategy and enterprise architecture office, where Intelligence is typically housed, to see
where more than half the capability for enabling agility is determined. Following that,
attention can fall on the steering committees and application management offices, which
respectively house Policy and Control, and share the remaining half of the agility
capability.
An alternative method to hierarchical modeling was to correlate POLICY, INTELL and
CONTRL directly to D-OPTIONS, but this PLS path modeling produced statistically

Other findings
201
non-significant results (e.g. POLICY→D-OPTIONS, ß=-0.091, t=0.868, p>0.05). In
addition to greater statistical significance from using a hierarchical construct, other IS
researchers note that using hierarchical constructs allow greater theoretical parsimony
and reduces model complexity (Marcoulides et al. 2009).
10.3. Business knowledge did not add to agility
A finding was that the business knowledge of the IT personnel did not add to the
determination of agility, where the VSM prescribed structure for the IT function is in
place. This section describes the testing of a hypothesis in an augmented research model
using PLS path modeling. After establishing the statistical acceptability of the
modeling, the section interpreted the results that supported the business knowledge
finding.
10.3.1. Testing of hypothesis H5
This section reports on the testing of hypothesis H5 of an alternative research model.
This hypothesis stated:
The more business knowledge displayed by IT personnel of the IT function, the
more often digital-options for the existing information systems are exercisable
(D-OPTIONS).
The principal research model (see Figure 6-1) was parsimonious with a single
exogenous variable of POLINTCON, after applying the meta-theory of the VSM to the
IT function. Framing the principal research model within the structuration ontology
suggested a less parsimonious model with two exogenous variables.
Structuration argues social phenomena arise from human agency, which is the product
of structure and the knowledgeable human agents (Jones and Karsten 2008). In the
context of this thesis, the structure of the IT function (POLINTCON) combines with the
business knowledge of IT personnel (BUSKNOW) to produce an activity of exercisable
digital options (D-OPTIONS) that leads to IT-dependent strategic benefits
(ITBENEFIT). A variation of the principal research model added BUSKNOW, as a

Chapter 10
202
second exogenous variable, to form the less parsimonious research model seen in Figure
10-7.
10.3.2. PLS modeling with business knowledge added
The PLS path modeling with the two exogenous variables of POLINTCON and
BUSKNOW is shown in Figure 10-7 and the correlation matrix in Table 10-6. All
completed responses (n=79) were utilized to provide the maximum opportunity for
falsification.
The exogenous variable BUSKNOW reflectively links to seven measurement items and
positively correlated with D-OPTIONS (Figure 10-7, BUSKNOW→D-OPTIONS,
ß=0.540). The objective of PLS is to maximize the variance explained in the
endogenous variable. The determination of D-OPTIONS with the added exogenous
variable of BUSKNOW was consistent with that of the principal research model (Figure
10-7, D-OPTIONS, R2=0.535 cf. Figure 9-2, D-OPTIONS, R2=0.522).
BUSKNOW D-OPTIONS ITBENEFIT POLINTCON
BUSKNOW 0.799
D-OPTIONS 0.540 0.861
ITBENEFIT 0.561 0.607 0.842
POLINTCON 0.624 0.722 0.659 0.808
Table 10-6 Correlation matrix after adding business knowledge (n=79)
The significance testing used a bootstrap procedure with 2000 samples of the 79
responses and generated the t-values of Table 10-8. The two-tailed, t-values of
measurement item weights and the path correlations were mostly significant at p<0.01
for Type I errors. The exception was the added path from BUSKNOW to D-OPTIONS
with p<0.16 and non-significant against the usual social science convention of p<0.05.

Other findings
203
Figure 10-7 Principal research model after adding business knowledge (n=79)

204
Population t-value
AGR17 ← BUSKNOW 20.120
AGR18 ← BUSKNOW 13.259
AGR19 ← BUSKNOW 17.145
AGR20 ← BUSKNOW 16.094
AGR21 ← BUSKNOW 18.434
AGR22 ← BUSKNOW 10.672
AGR23 ← BUSKNOW 11.842
AGR24 ← ITBENEFIT 18.783
AGR25 ← ITBENEFIT 9.814
AGR26 ← ITBENEFIT 33.841
AGR27 ← ITBENEFIT 16.350
AGR28 ← ITBENEFIT 33.101
FRQ07 ← D-OPTIONS 27.176
FRQ08 ← D-OPTIONS 41.946
FRQ09 ← D-OPTIONS 33.139
FRQ10 ← D-OPTIONS 14.436
MAT34 ← POLINTCON 28.179
MAT35 ← POLINTCON 31.050
MAT36 ← POLINTCON 29.987
MAT37 ← POLINTCON 18.560
MAT38 ← POLINTCON 17.671
MAT39 ← POLINTCON 19.344
MAT40 ← POLINTCON 12.697
MAT43 ← POLINTCON 23.299
MAT44 ← POLINTCON 17.553
MAT45 ← POLINTCON 18.672
MAT46 ← POLINTCON 11.026
MAT47 ← POLINTCON 8.401
BUSKNOW → D-OPTIONS 1.432
D-OPTIONS → ITBENEFIT 11.876
POLINTCON → D-OPTIONS 5.815
Table 10-8 t-values after adding business knowledge using bootstrapping

Other findings
205
The PLS analysis, after adding business knowledge, achieved a statistical power in
excess of 0.80. This claim was based on the loadings of measurement items rounding to
0.7 or greater and the smallest path correlation being greater than 0.5, as shown in Table
10-6. These effect sizes require a sample size of 43 to achieve a power of 0.80, as
determined by Table 7-13. The sample size of 79 used in the modeling was sufficient to
claim an acceptable level of statistical power.
Further, a post hoc statistical power calculation for the alternative hypothesis H5 used
the observed R2 of 0.535 (Figure 10-7, D-OPTIONS), with two predictors of
POLINTCON and BUSKNOW, and a p-value of 0.16. These variables generated a
statistical power of 1.00 for the sample size of 79 (Soper 2009).
10.3.3. Reliability and validity from adding business knowledge
The benchmarks in Table 10-9 show strong convergent validity. The root of the AVE for
each variable is in the diagonal of the correlation matrix in Table 10-6 and all show
adequate discriminant validity.
Variable AVE Composite reliability Cronbach’s alpha
BUSKNOW 0.639 0.925 0.908
D-OPTIONS 0.741 0.919 0.883
ITBENEFIT 0.709 0.924 0.898
POLINTCON 0.653 0.957 0.951
Table 10-9 Construct validity and reliability after adding business knowledge (n=79)
The loading of the measurement item to its respective variable should be 0.7 or more
(Hulland 1999). Figure 10-7 shows the loading of all measurements had item reliability.
10.3.4. Findings from adding business knowledge
Overall, the model with business knowledge added displayed high statistical power,
strong convergent validity, discriminant validity and the item reliability for each
measurement, but was statistically non-significant on the added path. This statistical
non-significance made the PLS path modeling unacceptable for testing hypothesis H5.

Chapter 10
206
Further, only a minor difference in determining agility was found between the principal
research model (Figure 9-2, D-OPTIONS, R2=0.522) and the model with business
knowledge added (Figure 10-7, D-OPTIONS, R2=0.535). The additional path for
BUSKNOW did not improve the model.
In such cases, the more parsimonious model should be chosen for further consideration
(Gefen et al. 2000), as a parsimonious model provides abstractions with insightful
explanations about complex phenomenon (Petter et al. 2007). The minor improvement
in determining agility outcomes and statistical non-significance (Table 10-8,
BUSKNOW→D-OPTIONS, t=1.432, p>0.05) together support disregarding this less
parsimonious model from further consideration.
10.4. Business knowledge was not vital for agility
The data analysis found that the business knowledge of the IT personnel was a lesser
determinant of agility than the VSM prescribed structure of the IT function. This section
describes the testing of a hypothesis from an alternative research model using PLS path
modeling. After establishing the statistical acceptability of the modeling, the section
describes the interpretation of the modeling results that support the business knowledge
finding.
10.4.1. Testing of hypothesis H5
This section reports on a second test of hypothesis H5 in an alternative structural model.
This hypothesis stated:
The more business knowledge displayed by IT personnel of the IT function, the
more often digital-options for the existing information systems are exercisable
(D-OPTIONS).
An alternate explanation for creating agile responses in existing information system is
that the business knowledge of IT function personnel (BUSKNOW) is a greater
determinant than the Policy-Intelligence-Control structure of the IT function
(POLINTCON). This alternative explanation exists within the confines of the ontology

Other findings
207
used in the study, as stated in section 6.4. Measurement items for BUSKNOW were
included in the surveys and used on the same agreement measures defined by Fink and
Neumann (2007). Section 6.5.4 identifies the reflective measures for BUSKNOW.
10.4.2. PLS modeling of business knowledge
The result of PLS path modeling using BUSKNOW as the exogenous variable and all
79 completed responses is depicted in Figure 10-11. The modeling produced a positive
correlation to support hypothesis H5 (Figure 10-11, BUSKNOW→D-OPTIONS,
ß=0.542, t=7.363, p< 0.01), but a much lesser determination of agility outcomes (Figure
10-11, D-OPTIONS, R2=0.294) than the principal research model (Figure 9-2, D-
OPTIONS, R2=0.522).
BUSKNOW D-OPTIONS ITBENEFIT
BUSKNOW 0.799
D-OPTIONS 0.542 0.861
ITBENEFIT 0.561 0.608 0.842
Table 10-10 Correlation matrix from business knowledge modeling (n=79)
The significance testing used a bootstrap procedure with 2000 samples of the 79
responses and generated the t-values of Table 10-12. The two-tailed, t-values of
measurement item weights and the variable correlations were all significant at p<0.01
for Type I errors.
The alternate PLS path modeling achieved a statistical power in excess of 0.80. This
basis of the claim was the loadings of measurement items rounding to 0.7 or greater and
the path correlations rounding to 0.5 or greater, as shown in Figure 10-11. These effect
sizes require a sample size of 43 to achieve a power of 0.80, as indicated in Table 7-13.
The sample size of 79 used in alternate modeling was sufficient to claim an acceptable
level of statistical power.

Chapter 10
208
Figure 10-11 Alternate model of business knowledge (n=79)

Other findings
209
Further, a post hoc statistical power calculation for the alternative hypothesis H5 used
the observed R2 of 0.249 (Figure 10-11, D-OPTIONS), with a single predictor of
BUSKNOW and a p-value of 0.01. These variables generate a statistical power of
0.992942 for the sample size of 79 (Soper 2009).
Population t-value
AGR17 ← BUSKNOW 20.642
AGR18 ← BUSKNOW 13.089
AGR19 ← BUSKNOW 17.075
AGR20 ← BUSKNOW 15.724
AGR21 ← BUSKNOW 18.609
AGR22 ← BUSKNOW 10.968
AGR23 ← BUSKNOW 12.456
AGR24 ← ITBENEFIT 18.489
AGR25 ← ITBENEFIT 9.680
AGR26 ← ITBENEFIT 32.902
AGR27 ← ITBENEFIT 16.210
AGR28 ← ITBENEFIT 34.281
FRQ07 ← D-OPTIONS 30.477
FRQ08 ← D-OPTIONS 39.184
FRQ09 ← D-OPTIONS 34.905
FRQ10 ← D-OPTIONS 13.792
BUSKNOW → D-OPTIONS 7.363
D-OPTIONS → ITBENEFIT 11.705
Table 10-12 t-values from business knowledge modeling using bootstrapping
10.4.3. Reliability and validity from business knowledge modeling
The benchmarks in Table 10-13 show strong convergent validity. The root of AVE for
each variable is in the diagonal of the correlation matrix in Table 10-10 and all showed
strong discriminant validity. Figure 10-11 showed the loading of all measurements had
item reliability, as each loading was 0.7 or more (Hulland 1999).

Chapter 10
210
Variable AVE Composite reliability Cronbach’s alpha
BUSKNOW 0.639 0.925 0.908
D-OPTIONS 0.741 0.919 0.883
ITBENEFIT 0.709 0.924 0.898
Table 10-13 Construct validity and reliability from business knowledge modeling (n=79)
10.4.4. Findings from business knowledge modeling
Overall, the business knowledge modeling displayed high statistical power and
significance, strong convergent validity, discriminant validity and the item reliability for
each measurement. Thus, the PLS path modeling was acceptable for testing hypothesis
H5.
The PLS path modeling found that using BUSKNOW as the exogenous variable had a
weaker determination of agility outcomes (Figure 10-11, D-OPTIONS, R2=0.294)
compared to the principal research model that used POLINTCON (Figure 9-2, D-
OPTIONS, R2=0.522). While not falsifying hypothesis H5, the finding questions any
suggestion that the business knowledge of the IT personnel is a greater determinant of
agility than the VSM structure of the IT function.
10.5. Business monarchies benefit more from agility
The data analysis found that some IT governance frameworks were more likely to enjoy
IT-dependent strategic benefits than other frameworks, given the same frequency of
agility outcomes. In particular, the finding was that business monarchies had a larger
determination of IT-dependent strategic benefits than IT monarchies. This section
describes the testing of a hypothesis from the principal research model using PLS path
modeling and segmentation of the data collected. After discussing the statistical
acceptability of the modeling, the section describes the interpretation of the results for
qualified support for the IT governance finding.
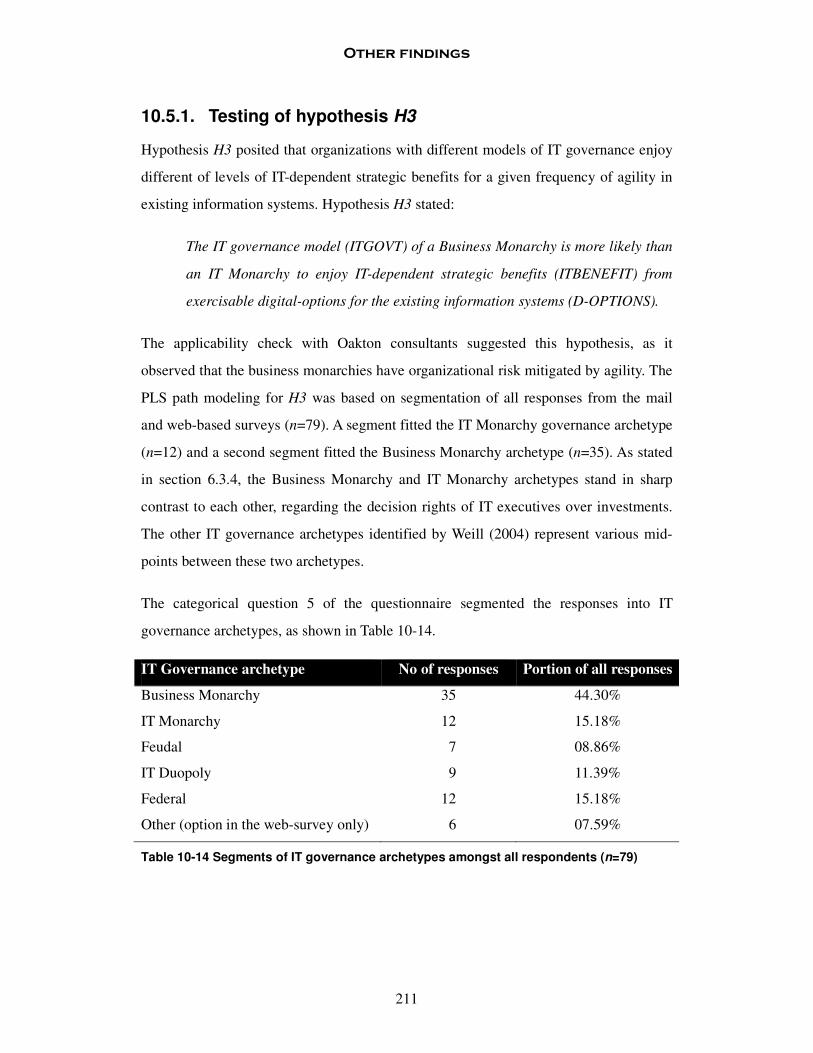
Other findings
211
10.5.1. Testing of hypothesis H3
Hypothesis H3 posited that organizations with different models of IT governance enjoy
different of levels of IT-dependent strategic benefits for a given frequency of agility in
existing information systems. Hypothesis H3 stated:
The IT governance model (ITGOVT) of a Business Monarchy is more likely than
an IT Monarchy to enjoy IT-dependent strategic benefits (ITBENEFIT) from
exercisable digital-options for the existing information systems (D-OPTIONS).
The applicability check with Oakton consultants suggested this hypothesis, as it
observed that the business monarchies have organizational risk mitigated by agility. The
PLS path modeling for H3 was based on segmentation of all responses from the mail
and web-based surveys (n=79). A segment fitted the IT Monarchy governance archetype
(n=12) and a second segment fitted the Business Monarchy archetype (n=35). As stated
in section 6.3.4, the Business Monarchy and IT Monarchy archetypes stand in sharp
contrast to each other, regarding the decision rights of IT executives over investments.
The other IT governance archetypes identified by Weill (2004) represent various mid-
points between these two archetypes.
The categorical question 5 of the questionnaire segmented the responses into IT
governance archetypes, as shown in Table 10-14.
IT Governance archetype No of responses Portion of all responses
Business Monarchy 35 44.30%
IT Monarchy 12 15.18%
Feudal 7 08.86%
IT Duopoly 9 11.39%
Federal 12 15.18%
Other (option in the web-survey only) 6 07.59%
Table 10-14 Segments of IT governance archetypes amongst all respondents (n=79)

Chapter 10
212
10.5.2. PLS modeling for IT governance segments
The PLS path modeling depicted in Figure 10-17 used the 12 completed responses from
the IT Monarchy segment of ITGOVT. Compared to the falsification research model of
all ITGOVT segments, the IT Monarchy modeling produced a weaker determination of
IT-dependent strategic benefits (Figure 9-2, ITBENEFIT, R2=0.368 cf. Figure 10-17,
ITBENEFIT, R2=0.282). The two-tailed, t-values of all measurement item weights and
the variable correlations in Figure 10-17 were significant at p < 0.05.
D-OPTIONS ITBENEFIT POLINTCON
D-OPTIONS 0.865
ITBENEFIT 0.531 0.810
POLINTCON 0.810 0.723 0.780
Table 10-15 Correlation matrix from IT Monarchy modeling (n=12)
Figure 10-18 depicts the PLS path modeling that used the 35 completed responses from
the Business Monarchy segment of ITGOVT. Compared to the falsification research
model with all ITGOVT segments, the Business Monarchy segment modeling produced
a stronger determination of IT-dependent strategic benefits (Figure 9-2, ITBENEFIT,
R2=0.368 cf. Figure 10-18, ITBENEFIT, R2=0.468). The two-tailed, t-values of all
measurement item weights and the variable correlations in Figure 10-18 were
significant at p < 0.01.
D-OPTIONS ITBENEFIT POLINTCON
D-OPTIONS 0.894
ITBENEFIT 0.684 0.869
POLINTCON 0.811 0.635 0.835
Table 10-16 Correlation matrix from Business Monarchy modeling (n=35)
The significance testing used a bootstrap procedure with 2000 samples and generated
the t-values of Table 10-19. The two-tailed, t-values of measurement item weights and
the variable correlations were all significant at p<0.01 for the business monarchy
segment (n=35) and p<0.05 for the IT monarchy segment (n=12).

Other findings
213
Figure 10-17 IT Monarchy segment modeling (n=12)

Chapter 10
214
Figure 10-18 Business Monarchy segment modeling (n=35)

Other findings
215
Population IT Monarchy
t-value
Business Monarch
t-value
AGR24 ← ITBENEFIT 3.234 17.411
AGR25 ← ITBENEFIT 3.806 4.744
AGR26 ← ITBENEFIT 5.006 20.368
AGR27 ← ITBENEFIT 4.169 16.270
AGR28 ← ITBENEFIT 5.815 39.682
FRQ07 ← D-OPTIONS 3.342 39.660
FRQ08 ← D-OPTIONS 12.358 29.626
FRQ09 ← D-OPTIONS 7.112 31.506
FRQ10 ← D-OPTIONS 7.372 10.259
MAT34 ← POLINTCON 5.969 14.674
MAT35 ← POLINTCON 10.219 20.344
MAT36 ← POLINTCON 9.207 12.953
MAT37 ← POLINTCON 6.296 9.160
MAT38 ← POLINTCON 3.108 18.014
MAT39 ← POLINTCON 2.730 14.244
MAT40 ← POLINTCON 3.617 10.886
MAT43 ← POLINTCON 5.000 11.549
MAT44 ← POLINTCON 6.302 11.261
MAT45 ← POLINTCON 2.610 26.275
MAT46 ← POLINTCON 4.527 17.867
MAT47 ← POLINTCON 10.048 7.290
D-OPTIONS → ITBENEFIT 4.338 12.047
POLINTCON → D-OPTIONS 12.268 14.545
Table 10-19 t-values from IT governance modeling using bootstrapping
The PLS path modeling for ITGOVT segmentation for IT Monarchy did not achieve a
level of statistical power of 0.80. This claim was based on the loadings of measurement
items rounding to 0.6 or greater and path correlations greater than 0.5, as shown in
Figure 10-17. These effect sizes required a sample size of 66 to achieve a power of 0.80,
as indicated in Table 7-13. The sample size of 12 used in the IT monarchy segment
modeling was insufficient to claim an acceptable level of statistical power.

Chapter 10
216
Further, a post hoc statistical power calculation for the secondary hypothesis H3 and the
IT Monarchy segment used the observed R2 of 0.282 (Figure 10-17, ITBENEFIT), with
a single predictor of D-OPTIONS and a p-value of 0.05. These variables generated a
statistical power of 0.507 for the sample size of 12 (Soper 2009).
In contrast, the PLS path modeling for ITGOVT segmentation for Business Monarchy
achieved a statistical power in excess of 0.80. That the loadings of measurement items
round to 0.7 or greater and the path correlations round to 0.7 or greater (see Figure
10-18) are the basis of this claim. To achieve a power of 0.80 with these effect sizes
requires a sample size of 17, as determined by Table 7-13. The sample size of 35 used in
Business Monarchy segment modeling was sufficient to claim an acceptable level of
statistical power.
The post hoc statistical power calculation for the secondary hypothesis H3 and the
Business Monarchy segment used the observed R2 of 0.468 (Figure 10-18,
ITBENEFIT), with a single predictor of D-OPTIONS, and a p-value of 0.01. These
variables generated a statistical power of 0.996 for the sample size of 35 (Soper 2009).
10.5.3. Reliability and validity from IT governance modeling
The benchmarks in Table 10-20 showed convergent validity for the IT Monarchy
segment, which had the smaller sample size. The root of the AVE for each variable is in
the diagonal of the correlation matrix in Table 10-15, and all show adequate
discriminant validity values.
Variable AVE Composite reliability Cronbach’s alpha
D-OPTIONS 0.749 0.922 0.887
ITBENEFIT 0.656 0.905 0.873
POLINTCON 0.608 0.948 0.938
Table 10-20 Construct validity and reliability from IT Monarchy modeling (n=12)
The benchmarks in Table 10-21 showed convergent validity for the Business Monarchy
segment, which had the larger sample size. The root of the AVE for each variable is in

Other findings
217
the diagonal of the correlation matrix in Table 10-16 and all show adequate discriminant
validity values.
Variable AVE Composite reliability Cronbach’s alpha
D-OPTIONS 0.800 0.941 0.916
ITBENEFIT 0.756 0.939 0.920
POLINTCON 0.698 0.965 0.960
Table 10-21 Construct validity and reliability from Business Monarchy modeling (n=35)
The loading of the measurement item to its respective variable should be 0.7 or more
(Hulland 1999). Figure 10-17 and Figure 10-18 shows the loadings of the measurement
items in the respective measurement models. All of the loadings in both figures show
item reliability.
10.5.4. Findings from IT governance modeling
Overall, the business monarchy segment displayed high statistical power and
significance, strong convergent validity, adequate discriminant validity and item
reliability for each measurement. Thus, the PLS path modeling was acceptable for
testing hypothesis H3.
In contrast, whilst the IT-monarchy segment displayed sufficient statistical significance,
strong convergent validity, adequate discriminant validity and item reliability for each
measurement, it did not display adequate statistical power. Thus, this PLS path
modeling has qualified use for testing hypothesis H3.
The Business Monarchy segment showed a stronger determination of IT-dependent
strategic benefits when compared to the IT Monarchy segment (Figure 10-18,
ITBENEFIT, R2=0.468 cf. Figure 10-17, ITBENEFIT, R2=0.282), at a level of
significance to reject a false positive. Thus, the PLS path modeling supported the H3
hypothesis but subject to a qualification.
The qualification is that the lack of statistical power in the IT monarchy segment
increased the likelihood of a Type II error. As the test of H3 hypothesis resulted in the

Chapter 10
218
rejection of the null hypothesis, the probability of a false negative was not of immediate
concern to the interpretation of these findings. Regardless, the low statistical power
suggested that the IT Monarchy segment requires further research with a larger sample
size.
Regardless of the qualification, the finding was that business monarchies are more
likely than IT monarchies to enjoy IT-dependent strategic benefits from the same
frequency of agility in the existing information systems. The justification for this
finding was the Oakton consultants’ generalization that business monarchies have
organizational risk mitigated by agility.
10.6. Projected increase in IT benefits
A finding was that the likely increase in IT-dependent strategic benefits has a correlation
constant of 0.643 for an increase in the frequency of exercisable digital options. This
section described a regression analysis that supported this projection of IT-dependent
strategic benefits.
10.6.1. The coefficient of correlation for IT benefits
An objective of this thesis was to provide IS practitioners with a theory that explains
and predicts how the IT function enables agility in existing information systems. The
coefficient of correlation between the constructs D-OPTIONS and ITBENEFIT
provides IS practice with a projection on the return on IT-dependent strategic benefits
from an investment that increased the frequency of agility outcomes. As discussed in
section 9.5.1, informing practitioners on how to project returns from IT investments
contributes to the relevancy of IS research and addresses a long standing issue in the
academic community (Rosemann and Vessey 2008).
10.6.2. ANOVA regression analysis
The un-standardized latent variable scores generated by SmartPLS, from the PLS path
modeling in section 9.2.2, was subjected to a regression analysis using the software

Other findings
219
XLSTAT1. All completed responses (n=79) from the mailed and web-based surveys
were utilized in the regression analysis.
Figure 10-22 shows the correlation constant for the slope of the trend line was 0.6433,
at a level of significance of p<0.01. The plotted points are the individual 79 cases of the
respondents.
Regression of ITBENEFIT by D-OPTIONS (R²=0.353)
0
1
2
3
4
5
6
7
0 1 2 3 4 5 6
D-OPTIONS
ITB
EN
EF
IT
Active Model
Conf. interval (Mean 95%) Conf. interval (Obs. 95%)
Source Value Standard error t-value Pr > |t|
Intercept 1.742 0.291 5.988 < 0.0001 D-OPTIONS 0.643 0.100 6.435 < 0.0001 Equation of the model:
ITBENEFIT = 1.7420 + 0.6433*D-OPTIONS
Figure 10-22 Plot of the correlation of D-OPTIONS and ITBENEFIT (n=79)
1 XLSTAT Version 2009.3.01, Copyright Addinsoft 1995-2009, www.xlstat.com.
Chapter 10
220
10.6.3. Findings from IT benefits projection
A major finding of this thesis was a positive correlation between the frequency that
digital options are exercisable and the IT-dependent strategic benefits enjoyed by an
organization (Figure 9-2, D-OPTIONS→ITBENEFIT, ß=0.607, t=11.690, p<0.01). A
further projection of IT-dependent strategic benefits from a regression analysis aimed to
inform IT practitioners about this major finding.
Given a cost for increasing the frequency of exercisable digital options, IS practitioners
can make an informed prediction of the likely return of investment. An increased
capability to produce agile responses is likely to increase, in some proportion, IT-
dependent strategic benefits to the organization. The correlation constant of 0.6433 in
Figure 10-22 predicts that proportion. Any prediction is subject to the limitations of this
thesis discussed in Chapter 12.
An upper limit to this trend line is likely to occur at some point. I can speculate that an
inflexion point occurs when the frequency of exercisable digital options matches the
frequency of business environment fluctuations, though intuitively such an event is
unlikely. Other than broadly describing business environments as regulated, stable,
orderly, turbulent and very turbulent1, the surveys did not measure the frequency of
business environment fluctuations. This thesis does not offer a theoretical or empirical
justification for an upper limit to the trend line for obtaining IT-dependent strategic
benefits from agility.
10.7. Conclusion on all findings
Chapter 9 and Chapter 10 contained several instances of PLS path modeling of the data
collected to verify and challenge the principal research model. These instances of PLS
path modeling, the hypotheses tested and their outcomes was summarized in Table
10-23.
1 Question 4 in the mailed and web-based questionnaire included in the appendices.

Other findings
221
PLS path modeling n H
1
H
2
H
3
H
4
H
5
H
1
a
H
1
b
H
1
c
D-OPTIONS
R2
ITBENEFIT
R2
Principal research model falsification (Figure 9-2)
79 � � 0.522 .0368
Principal research model transferability (Figure 9-11)
34 � � 0.539 0.362
Alternative model of existing practice
(Figure 9-14)
79 � 0.379
Principal research model with a hierarchical construct (Figure 10-2)
79 � � � 0.515 0.368
Principal research model with business knowledge added (Figure 10-7)
79 � 0.535 0.368
Alternative model of business knowledge (Figure 10-11)
79 � 0.294 0.369
Principal research model for IT monarchies (Figure 10-17)
12 � 0.655 0.282
Principal research model for business monarchies (Figure 10-18)
35 � 0.658 0.468
Table 10-23 Summary of PLS modeling of hypotheses & outcomes
The first PLS path model did not falsify the principal research model (Figure 6-1) given
the maximum opportunity of using all the data collected from the mailed and web-based
surveys (Figure 9-2). This path modeling displayed a positive correlation between the
POLINTCON and D-OPTIONS (ß=0.723, t=13.554, p<0.01) that did not falsify the
hypothesis H1 in this instance. Further, the positive correlations between the D-
OPTIONS and ITBENEFIT (ß=0.607, t=11.690, p<0.01) did not falsify the hypothesis

Chapter 10
222
H2. Both coefficients of determination generated by these correlations (D-OPTIONS,
R2=0.522 and ITBENEFIT, R2=0.368) are considered large in the social sciences, where
there may be contributions from complicating factors (Wetzels et al. 2009).
The second PLS path model used only data from the Australian client organizations of
Oakton and reconfirmed the H1 and H2 hypotheses of the principal research model
(Figure 9-11). This path modeling with a subset of cases (n=34) produced a consistent
determination of agility outcomes (Figure 9-11, D-OPTIONS, R2=0.539) as the
falsification modeling (Figure 9-2, D-OPTIONS, R2=0.522). Similarly, the subset path
modeling produced a consistent determination of IT-dependent strategic benefits (Figure
9-11, ITBENEFIT, R2=0.362) as the falsification modeling (Figure 9-2, ITBENEFIT,
R2=0.368). This subset had fully identified respondents and supported the transferability
of findings to other large companies in developed economies (see section 11.9).
The third instance of PLS path modeling examined an existing industry ‘best practice’
framework (Figure 9-14). The control objectives nominated by COBIT to create IT
agility generated the exogenous variable. The existing practice had a weaker
determination of agility outcomes (Figure 9-14, D-OPTIONS, R2=0.379) compared to
the principal research model (Figure 9-2, D-OPTIONS, R2=0.522). This finding
suggested that the principal research model (Figure 6-1) is superior to the existing ‘best
practice’ framework in determining agility in existing information systems.
A fourth path model unbundled the POLINTCON variable into the three subsystems of
the VSM meta-system of the IT function: POLICY, INTELL and CONTRL (Figure
10-2). This POLINTCON unbundling informs on the relative contributions of the three
subsystems to agility outcomes. The INTELL subsystem accounted for more than half
the total IT function capability for determining agility, while POLICY and CONTRL
shared the remaining half of the determination.
The fifth instance added to the principal research model the business knowledge of the
IT personnel (BUSKNOW), along with the structure of the IT function (POLINTCON),
for the determination of agility outcomes (D-OPTIONS). This less parsimonious
modeling (Figure 10-7) found adding the business knowledge of the IT personnel did

Other findings
223
not significantly add to the determination of agility (Figure 10-7, D-OPTIONS,
R2=0.535) compared to the principal research model (Figure 9-2, D-OPTIONS,
R2=0.522).
The sixth instance modeled the ontological alternative of the business knowledge of the
IT personnel (BUSKNOW) for the determination of agility outcomes (D-OPTIONS).
The path model (Figure 10-11) found the alternate explanation had a weaker
determination of agility outcomes (Figure 10-11, D-OPTIONS, R2=0.294) compared to
the principal research model (Figure 9-2, D-OPTIONS, R2=0.522).
The last PLS path modeling of the principal research model segmented the data
collected into the IT governance archetypes. This path modeling supported the
hypothesis H3 that IT-dependent strategic benefits are less likely in IT monarchies
(Figure 10-17, ITBENEFIT, R2=0.282) than business monarchies (Figure 10-18,
ITBENEFIT, R2=0.468), though a small segment size of IT monarchies did not reject
the possibility of a false negative.
Chapter 7 included a justification using the PLS path modeling as the theory
development of this thesis did not generate a prior path coefficients and item loadings
to be tested for fit against the data collected. These values are discovered by the PLS
path modeling.
Section 9.2.6 demonstrated that the data collected had sufficient normal distribution for
statistical inferences to be made from the PLS path modeling in Chapter 9 and Chapter
10. Section 9.6 identified a minor reduction to the modeled determination of dependent
variables as an adjustment for common method variance.

Chapter 10
224

225
Chapter 11. Discussion of insights
11.1. Introduction
This chapter discusses new but untested insights arising from the theoretical
development of applying the VSM to the IT function, the generalizations from the
Oakton applicability check and the findings from the survey data analysis.
This chapter first explains an ontological implication of this thesis. The chapter then
discusses unexplained variances from the PLS path modeling, a recommendation for
industry best practices, and the empirical finding that business knowledge of IT
personnel may not be vital to the IT function’s success. Next, the chapter discusses
possible pathologies to the IT function, and places the current trend for Business
Intelligence software in the context of this thesis. Last, the chapter discusses the
generalization of the major findings of this thesis to large organizations outside the
survey sample.
11.2. Reversal of causality
As correlation does not mean causality, a consideration was required of the reversal of
causation amongst the variables of the primary hypothesis. The primary hypothesis H1
had POLINTCON as the independent variable and D-OPTIONS as the dependent
variable. The principal research model was found to have a large positive correlation
between these variables (Figure 9-2, POLINTCON→D-OPTIONS, ß=0.722, p<0.01). It
was the theoretical development of the IT function as a VSM meta-system of the
existing information systems, viewing POLINTCON as the mechanism for generating
agile outcomes, which established the causality of hypothesis H1. This thesis must give
consideration to the alternate explanation that the strong positive correlation was the
result of POLINTCON dependency on D-OPTIONS, in a reversal of the temporal order.
The new hypothesis that expressed the reversed causality was:

Chapter 11
226
H6 The more often digital-options for the existing information systems are
exercisable (D-OPTIONS), the more mature the coupled processes of
Policy, Intelligence and Control of the IT function (POLINTCON).
Figure 11-2 represents the results of PLS path modeling reflecting H6. The modeling for
reversed causality used the 79 responses from the mailed and web-based surveys. As
expected, it was found that the reversal of causality between POLINTCON and D-
OPTIONS produced the same path coefficients and measurement item loadings as in
Figure 9-2, with the only difference being that the same coefficient of determination
(Figure 9-2, D-OPTIONS, R2=0.522) had transferred to POLINTCON.
Table 11-1 suggests convergent validity and discriminant validity from the reversal of
causality are the same as in Table 9-4. All measurement items continued to show
reliability. The statistical significance of the relations in Figure 11-2 remain at p<0.01.
Similarly, the statistical power was the same as the principal research model, as the
calculations received the same generated values. Given consistent statistical results from
the reversal of causality, consideration of any theoretical basis for alternate causation
was required.
Variable AVE Composite
Reliability
Cronbach’s alpha
D-OPTIONS 0.650 0.881 0.882
ITBENEFIT 0.536 0.852 0.788
POLINTCON 0.639 0.955 0.948
Table 11-1 Composite vailidity and reliablity from a reversal of causality

Discussion of insights
227
Figure 11-2 Reversal of causality in the principal research model

Chapter 11
228
The use of Giddens’ structuration theory as the ontology of this thesis allowed a reversal
of causation. Giddens proposes that structure and human agency are a mutually
constitutive duality (Jones and Karsten 2008). In adopting the ontology, POLINTCON
is a structure of codified rules and authoritative resources, and D-OPTIONS are an act
of human agency. Authoritative resources have a capacity to generate commands over
actors. Consistent with the ontology is that human agents of the IT function draw on
structures (POLINTCON) in their activity (D-OPTIONS) and, at the same time, this
activity serves to reproduce structure (POLINTCON).
Giddens argues that knowledgeable human agents, lead by a distinctive concern with
routinisation, serve in the ongoing reproduction of structure through action over time.
Giddens argues that predictable routines are fundamental to the stability of the
personality of the agent (Giddens 1984), which is underpinned by ontological security.
Structuration suggests the human activity of the IT function, enabled by the
POLINTCON structure, reproduces the POLINTCON structure for further routinisation.
It does not suggest a permanent reversal of causality from D-OPTIONS activity to
POLINTCON. The data analysis of this thesis, using a quantitative survey snapshot and
PLS modeling with unidirectional paths, cannot measure the mutual constitution of
structure and human agency. The mutual constitution of POLINTCON and D-
OPTIONS is a subject for further research using a longitudinal method.
11.3. Unexplained determination of D-options
The determination from Policy, Intelligence and Control of the IT function
(POLINTCON) to the frequency of exercisable digital options (D-OPTIONS) had an
R2=0.522 (see Figure 9-2). Exercisable digital options measure the agility of existing
information systems. This coefficient leaves a large determination of exercisable digital
options unexplained.
The variance was probably a function of the agility in the information technology (IT)
that enables the existing information systems (van Oosterhout et al. 2006). This thesis
defined IT as the electronic processes and networks that enable a business initiative. The

Discussion of insights
229
scope of this thesis did not include the agility inherent in the IT itself, and there was no
measurement of agile IT in survey questionnaires. The scope of this thesis was the
agility determined by the IT function, which are the personnel and their work processes
that have a responsibility for the delivery of the IT-enabled business initiatives.
Many IS practitioners recognize the importance of the agile IT. Gartner Research notes
a number of IT service providers that heavily market agile IT, such as Accenture,
BearingPoint, Capgemini and HP services (Cantara 2006). Their observation is that IT
service providers promote their ability to enable agility in information systems through
agile IT, predominately by service-orientated architecture solutions. Gartner estimates
that IT service providers spend 80 per cent of their time in the acting step of the agility
activity cycle (see Figure 2-13), which can be seen as the agile responses competency
of the basic model of agility from IS theory (see Table 2-10).
The role of agile IT as an enabler of the digital options competency of the basic model
of agility (see Table 2-10) also suggests it as a determinant of agility in existing
information systems. The digital options competency generates a portfolio of rights to
future IT investments without an obligation for full investment (Sambamurthy et al.
2003). Insight into how agile IT can leverage adaptive responses from existing
information systems informs the possibilities of digital options. It is likely that
unmeasured agile IT in the mailed and web-based surveys is the unknown determinant
to explain the variance of D-OPTIONS beyond the very large determination (R2=0.522)
made from POLINTCON.
11.4. Unexplained determination of IT benefits
IT-dependent strategic benefits from existing information systems (ITBENEFIT)
determined by the activity of exercisable digital options (D-OPTIONS) had a large R2
of 0.362 (see Figure 9-2). This coefficient leaves a large variance of IT-dependent
strategic benefits unexplained. This thesis did not propose agility as a major determinant
of strategic benefits from IT to the organization. This section discusses an alternate,
wider view of agility, which may minimize the variance in ITBENEFIT.

Chapter 11
230
The view of agility taken by this thesis was that of a capability to undertake an action.
Specifically, agility is the organizational readiness to sense environmental fluctuations
and respond using existing information systems. The agility activity is not an
organizational benefit in itself. The product of the actions of agility is a persistent
strategic benefit from IT to the organization. The structuration ontology adopted by this
thesis informed this view (see section 6.4). The IS strategic benefits of Mirani and
Lederer (1998) have had long-standing in IS research and were used in this thesis as the
measurements of ITBENEFIT (AGR24, AGR25, AGR26, AGR27 and AGR28).
Fink and Neumann (2007) view agility as an outcome instead of an activity. These
authors construct a variable of IT-Dependent Strategic Agility, described as the ability to
respond efficiently and effectively to emerging market opportunities by taking
advantage of existing IT capabilities. Fink and Neumann chose to measure the ability to
act with outcomes and not activity, and link IT-Dependent Strategic Agility to the five
measurement items of IS strategic benefits of Mirani and Lederer (1998).
Fink and Neumann (2007) construct three independent variables to correlate with IT-
Dependent Strategic Agility: Infrastructure capabilities, IT-Dependent Information
Agility and IT-Dependent System Agility. Table 11-3 defines these independent variables.
Their e-mail survey gathered responses from 361 Israeli IT professionals. The data
analysis delivers a very large determination of IT-Dependent Strategic Agility (R2=0.61)
from the three independent variables. The Fink and Neumann variable IT-Dependent
Strategic Agility equates with the ITBENEFIT of this thesis (Figure 9-2, R2=0.362), as
both are measured by the same IS strategic benefits of Mirani and Lederer (1998).
The difference in the sample populations of Fink and Neumann (2007) and this thesis is
likely to vary the determination of the IS strategic benefits of Mirani and Lederer
(1998). The target population of Fink and Neumann is IT managers in Israel, whereas
this thesis sampled business managers/stakeholders (25%) and IT
managers/professionals (75%) from both Australian (57%) and international (43%)
organizations.

Discussion of insights
231
Predictors Definition Examples
Infrastructure
capabilities
The ability of the IT function to
provide extensive firm-wide IT
infrastructure services that
support the organization's
business processes
□ Extensive communication
services
□ Data management services
□ IT management services
IT-dependent
system agility
The ability to accommodate
change in information systems
without incurring significant
penalty in time or cost
□ Reducing system modification
or enhancement costs
□ Developing applications faster
IT-dependent
information
agility
The ability to easily
accommodate change in the way
organizational users access and
use information resources
□ Faster retrieval of information
□ Increasing the flexibility of
information requests
Table 11-3 IT-dependent strategic agility predictors (from Fink and Neumann 2007)
The findings of Fink and Neumann (2007) suggest independent variables to explain the
variance of ITBENEFIT beyond the determination of the exercisable digital options
(Figure 9-2, D-OPTIONS, R2=0.362). The personnel and their work processes of the IT
function was the focus of this thesis. Not surveyed were the technology-focused
variables for Infrastructure capabilities, IT-Dependent System Agility and IT-Dependent
Information Agility, as defined in Table 11-3. Consequently, the agility-related
determination of ITBENEFIT in this thesis did not include these technological
variables.
11.5. A new set of industry best practices
A purpose of this thesis was to consider both the IS theoretical and practical
perspectives that inform the enablement of agility. Section 9.4 found that the existing
practice model, based only on COBIT control objectives, determined less than half the

Chapter 11
232
agility in existing information systems (Figure 9-14, D-OPTIONS, R2=0.379). Informed
by cybernetic principles (i.e. the meta-system processes of the VSM) and concepts from
the IS literature, this thesis selected additional COBIT measures and derived new
measures, which determined more than half of the variance of agility amongst the
survey responses (Figure 9-2, D-OPTIONS, R2=0.522). This suggested the meta-level
cybernetic theory, applied to the IT function, better correlates with reported agility
outcomes than the existing COBIT measures do on their own.
COBIT objective ID Measure
Define IT processes, organization & relationships PO4 MAT31
To manage IT human resources PO7 MAT32
To acquire and maintain technology infrastructure AI3 MAT33
Integrity Management PO2.4 MAT42
Table 11-4 Existing COBIT linked objectives to creating IT agility
What is missing in the COBIT framework are measures to create agility that relate to
the Policy-Intelligence-Control structure of the IT function (POLINTCON). This thesis
proposed three new objectives and recognized eight existing COBIT objectives to create
agility. Table 11-5 lists the new objectives and Table 11-6 the existing COBIT objectives
not previously linked to agility. A research recommendation is future versions of
industry ‘best practices’ that address IT agility include both sets of objectives.
New objective Measure
Define high-level designs for forecasted business initiatives MAT34
Implement configurable software for forecasted business initiatives MAT35
Assess unexpected operational consequences to forecast business
initiatives
MAT36
Table 11-5 New objectives to be linked to creating IT agility

Discussion of insights
233
COBIT objective ID Measure
IT policies management PO6.3 MAT37
Define the IT relationships PO4.15 MAT38
Define a strategic IT plan PO1.4 MAT39
Monitoring future trends and regulations PO3.3 MAT40
Technological direction planning PO3.1 MAT43
Acquire and maintain application software AI2 MAT45
Monitoring and reporting of service levels DS1.5 MAT46
Reporting and trend analysis DS8.5 MAT47
Table 11-6 Existing COBIT objectives not yet linked to creating IT agility
Of course, one could argue that adding measures to the existing COBIT-based model
was an obvious improvement. The questions then become whether the additional
measures are necessary, is the new set of measures sufficient, and how can this be
justified theoretically? Using cybernetics, and the VSM in particular, this thesis offers a
pathway to answer these fundamental questions and, in doing so, point towards a more
comprehensive and defensible theory on agility. In this regard, cybernetics offered a
mechanism to reconcile the disparate bodies of knowledge from IS practice and
research.
11.6. Business knowledge of IT personnel
An alternate explanation for creating agile responses in existing information systems
was that the business knowledge of the IT function personnel (BUSKNOW) is a greater
determinant than the Policy-Intelligence-Control structure of the IT function
(POLINTCON). Measurement items for BUSKNOW were included in the surveys and
used on the same agreement measures defined by Fink and Neumann (2007).
Section 10.4 described the PLS path modeling that replaced BUSKNOW as the single
exogenous variable for an agility outcome. Using all 79 individual responses, this
alternate model produced a weaker determination of agility (Figure 10-11, D-
OPTIONS, R2=0.294) than the principal research model (Figure 9-2, D-OPTIONS,

Chapter 11
234
R2=0.522). The finding is the business knowledge of IT personnel is a lesser
determinant for creating agility in information systems than the structure of the IT
function.
A second PLS path model further questioned the importance of the business knowledge
of IT personnel. Section 10.3 described the PLS path modeling that added BUSKNOW
as the second exogenous variable for agility outcomes, along with POLINTCON. Using
all 79 individual responses, this less parsimonious model did not significantly improve
the determination of agility (Figure 10-7, D-OPTIONS, R2=0.535) compared with the
principal research model (Figure 9-2, D-OPTIONS, R2=0.522). This empirical finding
leads to the new proposition that the business knowledge of IT personnel is not a
significant determinant for creating agility in information system.
These findings are consistent with that of Fink and Neumann (2007). Their survey
found that the ability of IT personnel to understand the overall business environment
and the specific organizational context is not significant. Those authors suggest that IT
personnel do not necessarily need deep business knowledge to develop capabilities for
agility. Once IT personnel are able to establish effective partnerships with business
clients the necessary business knowledge may come from the business side.
The findings of sections 10.3 and 10.4 questioned the consensus view held in industry
‘best practices’. ITIL contains a statement regarding delivering services to the business
that “a better result is more likely to be delivered by a wide understanding and
appreciation of the need for a business perspective across the entire range of IT staff”
(Office of Government Commerce 2005 p. 217). The weak determination of D-
OPTIONS by BUSKNOW suggests that the consensus view of industry ‘best practices’
did not hold in the context of creating agility in existing information systems.
11.7. The VSM as a lens for the IT function
An anticipated contribution of applying the VSM meta-system to the IT function is
insights gained from known viable system pathologies inform further IS research. The
VSM has been applied in many organizational contexts other than the IT function

Discussion of insights
235
(Laumann et al. 2008; Medina 2006; Shaw et al. 2004; Walker 2001) and described
pathologies often found in organizational systems. These salutary lessons are
transferable to the IT function to avoid the same pathologies. Beer (1984) originally
makes this claim and is later supported by Mingers and Brocklesby (1997). Mingers
and Brocklesby see the VSM as a technique to analyze the underlying causality between
the material world and social activity, and claim for the VSM the power to analyze
weaknesses and suggest alternative structural arrangements of the material world. Using
the VSM as a theoretical lens for the IT function extends benefits beyond this thesis’
topic of enabling agility. Beer (1984) provides four pathologies of the VSM. Viewed
through the VSM lens, these pathologies in the IT function are observable.
The first of Beer’s pathologies is that estranging any of the five sub-systems of the
VSM may destroy the ability of the system to operate viably (Beer 1984). In the IS
research context of the VSM meta-system enabling agility in information systems, the
scenario of interest is the outsourcing the System FOUR/Intelligence competency with
the Strategy & Enterprise Architecture office, or the outsourcing the System
THREE/Control competency with the Application Management Office. The pathology
is the risk of the interconnectivity of the outsourced subsystem with the in-house meta-
system. For example, outsourcing the Application Management Office (System
THREE) might impair the sensing of the current use of the existing information systems
and the forecasting of environmental fluctuations by the in-house Strategy & Enterprise
Architecture office (System FOUR).
The second pathology stems from the question whether System FIVE truly represents
the entire system within the context of larger and more powerful systems (Beer 1984).
Beer sees this as an issue of identity. When System FIVE/Policy of the IT function
decides on responses to make the viable system adapt in a changing environment, it
must ask, “Will the system still be recognizable amongst larger and more powerful
systems?” If identity is not recognizable, cybernetics suggests the system is no longer a
viable entity.
An interpretation of this pathology is in the GARDENCO case study of Bussen and
Myers (1997). A new company secretary and MIS manager of a New Zealand

Chapter 11
236
subsidiary ceased to represent the subsidiary’s executive information system (EIS) and
the IT function did not make local adaptations to the EIS. That the Australian parent, as
a larger system, discontinued the subsidiary’s EIS one year after implementation is
consistent with the pathology.
A third pathology arises as managers often fail to understand the need for System
FOUR/Intelligence. If System FOUR is missing, System THREE and System FIVE can
collapse into each other (Beer 1984). Beer generalizes that managers of System
FIVE/Policy are usually promoted from System THREE/Control. In the IT function
context, steering committee members often come from the Application Management
Office and are likely to react to a perturbation with a familiar ‘inside and now’
perspective. In the worst case, managers of System FIVE are incapable of considering
System FOUR foresight, and risk adaptations to the information systems that react to
perturbations when they occur and in response times that are not agile.
The last pathology is whether the System THREE, System FOUR and System FIVE
form a VSM meta-system that discourages interactivity (Beer 1984). Transposing
Beer’s observations to the IT function, the risk of low interactivity is vulnerability of the
Application Management Office to tunnel vision and the Strategy & Enterprise
Architecture office to unrealistic flights of imagination.
Using the VSM as a theoretical lens identified pathologies to the viability of the IT
function and the information systems. The guard against these pathologies is to ensure
the mechanisms derived from the VSM logic, as described in section 3.3.3. The set of
industry best practices recommended by this thesis measures the viability of the IT
function using the attributes of the VSM. Increased process maturity of these best
practices may well reduce the instance of the pathologies. Section 11.5 lists the industry
best practices recommended by this thesis.
11.8. Sensing for agility and Business Intelligence
An IS topic intertwined with the concept of sensing for agility is that of business
intelligence (BI) (Davenport et al. 2001; Umar 2005). BI software tools enable

Discussion of insights
237
organizations to understand their internal and external environments through systematic
collection and analysis of information. This section briefly discusses the insights
brought to the IS theoretical perspectives on BI from the basic model of agility from IS
theory (Figure 2-11) and the theoretical development of viewing the IT function as a
VSM meta-system.
Existing IS research defines two uses of BI tools (Chung 2009). First, BI tools are used
to manipulate large amounts of operational data to extract essential business information
and reveal trends and patterns in the current use. BI tools of this type include decision
support systems, executive information systems, online analytical processing, data
warehouses and data mining systems. Second, BI tools are used to systematically collect
and analyze information directly from the business environment to assist in
organizational decision-making. This second use of BI tools mainly gathers information
from public sources, such as using meta-search engines of the World Wide Web. Table
2-12 lists business and technological target content from public sources suggested by
TOGAF (The Open Group 2009 p. 112-113).
Bringing the VSM lens to the IS topic of BI provides new insights. The first use of BI
tools adds to the capability of System THREE, which focuses on the inside and now
control of the organization. The second use of BI adds to the capability of System
FOUR, focused on outside and future intelligence from the business environment. The
insights afforded by applying the VSM include how BI systems contribute to the
viability of the organization, the competencies necessary to enable BI to bring self-
awareness and adaptation to the organization, the necessity of System FIVE to govern
BI, and awareness of the VSM pathologies that may adversely influence BI.
Gartner Research provides a reflective IS practice perspective on the topic of BI (Burton
et al. 2006). Gartner suggest organizations establish a business intelligence competency
center (BICC). The role of the BICC is to support business managers in decision-
making and to expand BI competencies across the organization. A BICC consists of
personnel skilled in the business, the operational IT and BI techniques.

Chapter 11
238
The activities of the BICC include exploring data and discovering anomalies and trends,
researching business problems and creating models to analyze these problems, and
developing insights in using current operational data for a specific analysis. These BICC
activities are interpretable as the agility activities of sensing future needs, generating
digital options for forecasted needs and sensing current use, respectively. These agility
activities are parts of the basic model from IS theory discussed in section 2.2.5.
Further, this thesis viewed the BICC as part of the VSM meta-system for making the
enterprise self-aware and self-adapting of existing information systems to
environmental perturbations. To serve System THREE/Control and System
FOUR/Intelligence, the VSM prescribes the BICC with competencies to assist in
making the enterprise viable. An anticipated contribution of this thesis is to bring the
VSM approach to other IS research topics with insights that pose additional inquiries.
Applying VSM to the BI is an example.
11.9. Generalization to large enterprises in the OECD
The stance of this thesis was that an objective reality exists beyond the human mind, in
the form of a structure of rules and non-human resources, and inextricably bound to the
stream of activity that humans enact though our perceptions of that reality. For a given
structure, there is regularity in human activity limited to particular contextual situations
but different regularities for other people, cultures or times. The term ‘soft positivism’
has been used to describe this stance in IS research (Kirsch 2004; Seddon and Scheepers
2006).
The primary hypothesis of this thesis was the more mature the coupled processes of
Policy, Intelligence and Control of the IT function, the more often digital-options for the
existing information systems are exercisable (H1). From the stance of soft positivism,
and my motivation to seek to generalize the major findings of this thesis to other
settings, a knowledge claim was that primary hypothesis is true for large enterprises in
the developed economies in these first decades of the twenty-first century. Truth, in this

Discussion of insights
239
context, is a belief justified beyond reasonable doubt in this thesis, but subject to later
revisions based on contrary evidence.
Transferability of the primary hypothesis relies on the representativeness of the sample
of 33 client organizations of Oakton, as tested in section 9.3. This involves profiling
known attributes of the sample Australian organizations of Oakton clients and the target
population of large enterprises in the member countries of the Organization for
Economic Co-operation and Development (OECD). Section 7.3.3 describes the
attributes of the 33 organizations of Oakton clients. The transferability profile did not
include the 35 international companies from the web-based survey of LinkedIn
discussion group members for two reasons. First, the web-based survey was anonymous
and the attributes of the respondents are unverified from the public knowledge of the
organizations. Second, the web-based survey over-represented organizations primarily
concerned with information, media and telecommunications services. This over-
representation is probably due to the special interests of the invited LinkedIn discussion
groups.
Similarly, three responses from the mailed survey of Oakton clients were not included
in the transferability profile. In one case, the respondent removed the identifier from the
questionnaire; and in two cases, they were the second response from an organization.
Further, the eight responses for the pilot of Oakton consultants were not included in the
profiling to all large organizations, so not to over represent Oakton as an IT consultancy.
The comparison used was the incidence of the 33 client organizations classified into
Australian Bureau of Statistics’ industry sectors, against each sector’s contribution to
2005-2006 Australian Gross Domestic Product (Australian Bureau of Statistics 2008).
The comparison excluded the agriculture, forestry and fishing production sector, which
is subject to year-on-year weather variations.

Chapter 11
240
Industry sector Oakton clients GDP 2005-06
Mining (2) 6.06% 6.15%
Manufacturing (3) 9.09% 13.13%
Electricity, gas and water supply (5) 15.15% 2.81%
Construction (1) 3.03% 8.43%
Wholesale trade (0) 0.00% 6.14%
Retail trade (2) 6.06% 7.28%
Accommodation, cafes and restaurants (0) 0.00% 1.80%
Transport and storage (1) 3.03% 5.75%
Communication services (1) 3.03% 3.46%
Finance and insurance (3) 9.09% 9.01%
Property and business services(c) (5) 15.15% 14.83%
Government administration and defence (2) 6.06% 4.81%
Education (3) 9.09% 5.27%
Health and community services (3) 9.09% 7.58%
Cultural and recreational services (2) 6.06% 1.85%
Personal and other services (0) 0.00% 1.70%
Table 11-7 Profile of industry sectors in the sample and the Australian economy
Table 11-7 shows the incidence of industry sectors in the sample of Oakton client
organizations was mostly comparable to the contribution of those sectors to the total
Australian economy, within five percentage points. The exception in the sample was an
over-representation of the electricity, gas and water supply sector, and an under-
representation of the construction and wholesale trade sectors. In Australia,
organizations in the electricity, gas and water supply sectors exist in a regulated
business environment, where government generates change in conventional planning
cycles. Any over-representation of the electricity, gas and water supply sector in the
Oakton client sample was likely to under-estimate agility activity, as agility is more
likely to exist in turbulent business environments.

Discussion of insights
241
Industry sector Australia EU271 USA
Agriculture, hunting, forestry and fishing 2.4% 1.8% 1.1%
Mining, manufacturing, and electricity, gas & water
21.5% 20.2% 17.3%
Construction 7.5% 6.2% 5.1%
Transport, wholesale & retail trade, hotels & restaurants
20.5% 21.3% 18.8%
Banks, insurance, real estate and other business services
29.4% 27.8% 33.1%
Government, health, education and other personal services
18.7% 22.7$ 24.6%
Figure 11-8 Industry sectors in Australia compared to other OECD members
Figure 11-8 is a broader comparison of the industrial sectors in the Australian economy
to that of other OECD members. The percentages shown are of total value added in
2006, where Australia reports on a fiscal year and other OECD members on a calendar
year (OECD 2009). The OECD comparison shows the sectoral composition of
Australian industry is mostly representative of other member countries, with only the
government, health, education and other personal services sector in Australia having
more the five-percentage points difference from the USA.
This thesis claims that the major findings have external validity to other large
companies in the OECD region. External-validity problems in IS survey-based research
are introduced when the sample frame drawn does not include all relevant
characteristics of the population to which inferences are to be drawn (Seddon and
Scheepers 2006). The inference that the primary hypothesis of this thesis was true for
large enterprises throughout the OECD was borne by the characteristics of the Oakton
client organizations sampled represent the population of Australian organizations, and
that Australian organizations are representative of other OECD countries. As the
Oakton’s clients sampled had 250 employees or more, the inference was qualified to
large enterprises. The assumption was that, in a globalized world economy, any national
1 The European Union comprises 27 countries: Austria, Belgium, Bulgaria, Cyprus, Czech Republic, Denmark, Estonia, Finland, France, Germany, Greece, Hungary, Ireland, Italy, Latvia, Lithuania, Luxembourg, Malta, Netherlands, Poland, Portugal, Romania, Slovak Republic, Slovenia, Spain, Sweden
and the United Kingdom. http://stats.oecd.org/glossary/index.htm accessed 2 June 2009

Chapter 11
242
variation amongst the OECD countries was minimal with regard to the enablers for
agility in information systems.
There are limitations for the knowledge claim that the primary hypothesis was true for
large companies in the developed economies. These include the limitations of data
collections and analysis of the sample listed in Chapter 12, the characteristics to draw
inferences to a population was limited to the industry sectors of the sampled
organizations, and the external-validity of comparing Australian Bureau of Statistics and
OECD reports.
11.10. Conclusion on the insights
This chapter discussed insights not wholly supported by the theoretical development in
Chapter 3 and the major findings from the data analysis in Chapter 9. These insights
arose from a wider consideration of the IS theoretical and practice literature, the
ontology adopted by this thesis and the general insights afforded by applying the VSM
to the IT function.
These insights, along with the findings in Chapter 9 and Chapter 10, are subject to the
theoretical, data collection and data analysis limitations of this thesis. The next chapter
discusses these limitations.

243
Chapter 12. Limitations of findings
12.1. Introduction
This chapter recognizes a number of possible limitations of this thesis arising from the
IS perspectives reviewed, challenges to the theoretical development and the
assumptions underlying the data collection and analysis. These limitations require
consideration before accepting the thesis’ contributions to IS research and practice.
12.2. Use of claimed IS industry best practices
A research limitation was the reliance on COBIT as a representative industry framework
for the IS practice perspective on agility. COBIT has an explicit goal to create IS agility
(IT Governance Institute 2007). The alternative frameworks of ITIL and TOGAF are not
explicit in creating agility.
Ridley et al. (2004) review the utilization of COBIT and profile its widespread adoption
by highlighting use at Daimler-Chrysler in Germany, the New South Wales Department
of Health in Australia, Royal Philips Electronics in the Netherlands, Curtin University
of Technology in Australia, Blue Cross Blue Shield of Michigan and the Department of
Defense in the USA. The introduction of the Sarbanes-Oxley Act of 2002 hastened the
adoption of COBIT amongst public companies listed in the United States.
Regardless of the adoption of COBIT, the assumption by this thesis that it represents a
dominant IS practice perspective on agility may not reflect the reality of design and
action. Gregor (2006) notes that meta-requirements for IS design and action arise from
observations of practitioners of what has worked in the past. Clearly, there is a dynamic
between generalized ‘best practice’ frameworks and localized theories of design and
action, which qualifies any assumption that COBIT is representative of IS practice
perspectives on any goal.

Chapter 12
244
12.3. Tautology in the principal research model
During the development of the hypotheses of the principal research model (Figure 6-2),
avoiding errors of tautology was considered. A theoretical tautology in causal
explanations is where the independent and dependent variables are the same thing being
restated with a different set of measures and true by definition (Neuman 1991).
The claim the primary hypothesis H1 was free of any error of tautology was defensible
due to five reasons. First, the measures of the variables have different temporality. The
process maturity measures of POLINTCON, though evolving at business pace, are
persistent in time, while the exercising of digital options (D-OPTIONS) is an event.
Second, in the structuration ontology of this thesis, the variables POLINTCON, D-
OPTIONS and ITBENEFIT of the primary research model are different types of
objects. POLINTCON is a structure of rules and non-human resources that refer to
patterns of social relationships and enact a social practice by human agents. The
exercising of D-OPTIONS is an act of human agents and ITBENEFIT is a social
outcome (Cassell 1993).
The third defense against a claim of tautology was a statistical measure. The variables
of the primary hypothesis exhibited discriminant validity, which is the extent that
measures of a construct differ from measures of other constructs in the model. In the
PLS path modeling undertaken in section 9.2, discriminant validity was shown where a
construct shares more variance with its measures than it does with other constructs in a
given model. Discriminant validity was measured using average variance extracted
(AVE) for each construct. In the falsification modeling of the primary hypothesis, the
correlation matrix in Table 9-1 includes the correlation between POLINTCON and D-
OPTIONS (0.723), and the square roots of the AVE for POLINTCON and D-OPTIONS
(0.807 and 0.861 respectively). As the square roots of the AVE are both greater than the
correlation, Table 9-1 indicates discriminant validity between POLINTCON and D-
OPTIONS (Hulland 1999).
Fourth, the graphical representations of covariance provide a defense against a charge of
a tautological relationship between POLINTCON and D-OPTIONS. The first-order

Limitations of findings
245
constructs of POLICY, INTELL and CONTRL, which constitute POLINTCON, each
covary in a different manner from that of D-OPTIONS. Figure 7-14, Figure 7-15 and
Figure 7-16 show the individual covariance of the three independent variables. Figure
7-17 shows the covariance of the measures of D-OPTIONS. Covariance for D-
OPTIONS had a single inflexion point at the Rarely-Occasionally frequency of activity,
while covariance amongst the three first-order constructs, which constitute
POLINTCON, each had three inflexion points. The different behaviour of the
independent and dependent variables suggests they are not the same thing restated with
a different set of measures, i.e. not tautological.
A last defense against an error of tautology is the existing practice perspective of the
variables. The concepts of the primary research model interpret to the different
components in the industry ‘best practice’ framework of COBIT, which is a consensus
of many practitioners of what is distinct in the real world. The constructs of
POLINTCON, D-OPTIONS and ITBENEFIT respectively interpret as the COBIT
framework components of Control Objectives, Key Activities and IT Goals. Similarly,
the COBIT measures for these framework components respectively are maturity
models, performance indicators and outcome measures (IT Governance Institute 2007).
The above reasons of ontological and temporal distinctions of the constructs, the
statistical and graphical results of the data analysis, and the foundation of the primary
research model in the real world of IS practice together defend the hypotheses from a
charge of tautology.
12.4. Data collection limitations
This section notes a number of biases and errors that may affect the validity of the
mailed and web-based surveys.
First, the survey results were subject to mailing errors. This was mainly due to
respondents nominated by Oakton no longer being at their client firm, or insufficient
addressing failing to find the respondent. These errors did not allow representatives of

Chapter 12
246
all the client organizations of Oakton to have an equal chance of participating in the
survey.
Second, any bias in the client base of Oakton limits the transferability of the survey
findings to other organizations. It is arguable that those organizations that engage an IT
consultancy may be less internally capable to enable agility, and therefore over-
represent the poor IT process maturity or IT-dependent strategic benefits noted in the
snapshot of organizations. The risk of a bias in the client base of Oakton was unlikely,
given the similarity in the results between the transferability instance of PLS path
modeling with the 34 Oakton client organizations (Figure 9-11) and that of the
falsification instance (Figure 9-2) with 79 respondents. The assumption is the IT
professionals responding to the Oakton in-house pilot and the web-based survey are not
subject to a bias of belonging to organizations requiring an IT consultancy.
Third, a bias may occur where non-respondents hide a significant capability for agility.
Given the high ranking of agility as an issue amongst senior IT executives (Luftman and
McLean 2004), it was unlikely that non-respondents have a high capability of agility.
Comparing early and late responders to the mailed survey found no trend towards a
non-response bias (see Section 7.7).
12.5. Cognitive bias
In the context of the survey method, cognitive bias refers to an event being judged more
probable if it can be easily imagined (Arnott 2002; Tversky and Kahneman 1974).
Imaginability is a probable function of experience, memory and intellect of the
respondent. Questioning a respondent on both independent and dependent variables, at
the same point in time, is prone to cognitive bias.
The responses of the questionnaire rely on the perceptions of the respondents and not
formative measurements of the variables that make up the hypotheses. The responses
might be subject to cognitive biases, such as where the frequency of an agility event is
over-reported if it is easily imagined, or the maturity of an IT process is over-reported as

Limitations of findings
247
it is a desired outcome (Arnott 2006; Tversky and Kahneman 1974). The design of the
questionnaire employed three features to minimize imaginability.
First, the order of questions in the questionnaire was in reverse temporal order to that of
the principal research model. Part C questioned the measurement items of exogenous
variable and Part-B questioned those for the endogenous variables. The aim was this
order would make the underlying hypotheses less apparent to the respondent, who
might otherwise bias responses to address the hypotheses.
Second, in the midst of the questionnaire the order of the Likert scales reversed. The
Likert-point answers for the exogenous variable were presented in Part-C in ascending
order for a positive correlation of the primary hypothesis, whereas the Likert-point
answers for the endogenous variables in Part-B were presented in descending order.
Again, the aim was to conceal the underlying hypothesis from the respondent.
Last, Part-B and Part-C included extraneous questions unrelated to the concepts of the
hypotheses. In Part-B the extraneous questions were FRQ11, FRQ12, FRQ13, FRQ14,
FRQ15 and FRQ16. In Part-C, questions MAT31, MAT32, MAT33, MAT41, MAT42
and MAT48 were extraneous. None of these questions became measurement items of
POLINTCON, D-OPTIONS or ITBENEFIT. These extraneous questions fraught sense
making by the respondents of the underlying principal research model in the
questionnaire.
These features of the questionnaire’s design attempted to minimize the cognitive bias of
the respondents, which might otherwise overstate any correlations of the hypotheses.
12.6. Psychometric measures and statistical inference
This thesis takes a soft positivist stance. This stance recognizes an objective reality that
exists beyond the human mind and, through our perceptions of that reality, inextricably
bound to the stream of activity that humans enact (Seddon and Scheepers 2006). The
mailed and web-based questionnaires used psychometric measures, with prefacing
statements to elicit the respondents’ perception of the objective reality in the Likert-type

Chapter 12
248
questions. The prefacing statements were “Based on your experience” or “To which
extent do you agree or disagree”. The Likert-scales used for the psychometric measure
are ordinal and non-parametric.
One can question whether the non-parametric, psychometric measures used are fit for
the statistical inferences made from the sample to wider populations. The data analysis
suggested the statistical inferences are valid as psychometric measures behaved in a
parametric manner, and this thesis used sound psychometric measures.
First, section 7.5 reported the tests for two independent samples from Oakton clients
and LinkedIn discussion group members. The parametric t-test and non-parametric
Mann-Whitney U-test for interdependence of data produced consistent results for each
variable in respect to the probability of acceptance of the null hypotheses. These results
supported the claim that the Likert-scale ordinal measures behaved in a parametric
fashion, as the difference of location measured parametrically did not vary from that
measured non-parametrically.
Second, a core requirement for sound psychometric measures is unidimensionality,
where a set of measures reflect a single construct. Without unidimensionality, some
measures reflecting a construct might correlate in a different way to other measures. The
test for unidimensionality is the extent all psychometric measures tend to move in the
same direction in each construct (Rouse and Corbet 2008). The covariance of the
psychometric measures described in section 7.8.4 established the unidimensionality of
constructs of the principal research model. The high Cronbach’s alphas further
evidenced the reliability of the psychometric measures used (see Table 9-13).
That this thesis was not able to measure directly the objective reality of the constructs
POLINTCON, D-OPTIONS and ITBENEFIT was a limitation. An acceptance of the
soft positivist stance and sound psychometric measurements mitigated the limitation of
the findings based on perceptions of the respondents.

Limitations of findings
249
12.7. IT process maturity as a measure
The validity of process maturity levels as a measure finds acceptance in the IS
practitioner literature (IT Governance Institute 2007). But this measure does not have a
rigourous theoretical foundation in the IS literature on process maturity (Humphrey
1987; Sledgianowski et al. 2006). This lack of rigour raises questions on process
maturity being a valid reflective measure of IT function capabilities.
An argument might be made that the maturity-scale over represents organizations at the
less mature end. By design, the maturity model (Humphrey 1987) initializes
organizations at the lower end and offers the most mature levels as a hard fought goal.
The scale is clearly ordinal and ascending the levels involves increasing intervals of
effort. The snapshot of agility found in Chapter 8 does not support this argument. The
IT processes’ maturity from the survey respondents (Table 8-4) found few organizations
assessed at the lower end of non-existent process maturity. The median response for
maturity was mid-scale at repeatable, with few at the optimized maturity level. Any bias
inherent in the maturity scale did not manifest in an over-representation of the
responding organizations towards the lower end.
A more valid argument against the use of the IT process maturity scale is an inaccurate
assessment by a Likert-based survey designed to take 15 minutes. Large organizations
undertake an assessment of process maturity (Humphrey 1987) with a sizable
investment of IT personnel effort. That this thesis relied on the perceptions of the survey
respondents and not a rigorous assessment of IT processes is a limitation. The COBIT
maturity model’s wide acceptance in industry, which informed the respondents’
perceptions, mitigates this limitation to some extent.
12.8. Conclusion on the limitations
This chapter made a number of defenses against tautological errors in the hypotheses
and errors in the data collection. Given the data collected displayed sufficient normality
(section 9.2.6), sound psychometric measurement (section 12.6), the PLS modeling
favouring conservative correlations (section 9.2.7) and low common method variance
Chapter 12
250
(section 9.6); the proposition that the prescribed structure of the IT function largely
determines the frequency of agile responses in existing information systems is
defensible.
It is my belief that the discussed limitations left the principal research model internally
and externally valid. This chapter did not alter the findings of Chapter 9 that the
hypotheses are plausible, statistically inferable to large companies in other settings and
presents an improvement over existing industry practice.

251
Chapter 13. Conclusion
13.1. Overview of the research activities
This thesis commenced with a literature review of IS agility. The major findings of the
IS literature review was a void of theories for explaining and predicting the basic model
of agility in information systems, and that the agility elements of sensing fluctuations in
the business environment and forecasting a portfolio of digital options are
underrepresented in the literature.
Similarly, this thesis reviewed existing IT ‘best practice’ frameworks and found a
reliance on received business unit requests for adaptations to information systems, in
conventional planning cycles. None of the frameworks caters for agile responses from
information systems created from directly sensing the business environment and
forecasting IT investments opportunities.
This thesis developed theory and propositions, focusing on bridging the gaps between
the IS theoretical and practice perspectives. First, a cybernetic approach to the agility in
information systems was justified by drawing parallels between the general problems
that cybernetics addresses and the specific aspects of agility draw from the IS
theoretical perspectives. The cybernetics of the VSM was described and its currency
assessed. The VSM was applied to the IT function as an explaining mechanism to
address the IS theoretical and practice perspectives.
After explaining the design of the empirical research and hypotheses testing activities,
based on the opportunities available by having an IT consultancy as an industry partner,
this thesis described the applicability check with Oakton consultants. The applicability
check delivered two results. First, the prima facie validation of the theoretical
developed propositions justified a wider, rigorous survey of Oakton clients. Second, the
application test raised further research propositions from the insights of the Oakton
consultants.

Chapter 13
252
Combining the propositions from applying of VSM meta-system to the IT function and
Oakton applicability check suggested the following primary research hypothesis: The
more mature the coupled processes of Policy, Intelligence and Control of the IT
function, the more often digital-options for the existing information systems are
exercisable. This thesis defined the ontological basis and reflective measures of the
primary hypothesis and secondary hypotheses, and those of alternative research models.
The materials and procedures for collecting quantitative data were described for a
mailed survey of Oakton client organizations and a web-based survey of LinkedIn
discussions groups. The 79 respondents from both surveys showed sufficient statistical
power from using post hoc evaluations. Similarly, the collected data for each of the
constructs showed sufficient unidimensionality and normality for data analysis and
statistical inference. The snapshot of data collected described the poor agility in existing
information systems amongst the responding companies.
Quantitative data analysis using PLS and ANOVA did not falsify the hypotheses of the
principal research model and recognized a well-identified sample to generalize to a
population of large organizations in developed economies. The major findings of the
data analysis were a strong correlation to support the primary research hypothesis and a
stronger determination of exercisable digital-options that existing practices codified by
COBIT.
Further data analysis considered alternatives to the principal research model. A more
hierarchical construct of the IT function did not produce a superior research model.
Another finding was the business knowledge of IT personnel alone was a weak
determinant of agility in information systems. Identified for future research was the
intervening effect of IT governance framework to qualify the primary research
hypothesis.
There were many discussions arising from the insights of the major findings. The
conceptual findings produced insights into IT personnel reproducing the structure of the
IT function; the unmeasured role of agile technologies to enable agility; other factors to
explain variances in measured IT-dependent strategic benefits; and pathologies to the

Conclusion
253
viability of the IT function. From the empirical findings were insights to question a
common view that business knowledge of IT personnel is vital and the generalization of
the major findings to other large organizations of the OECD.
After a defense against errors of tautology, this thesis concluded with considering any
limitations in the data collection, the cognitive biases of the respondents and the use of
psychometric measures for statistical inference.
13.2. The agility-capability model
Figure 13-1 shows a capability model for the IT function to enable agility in existing
information systems. The agility-capability model was a conceptual summary of the
findings of this thesis. This thesis contrasted the agility perspective from a widely used
industry framework with research perspectives on agility in the IS literature. This thesis
suggested Beer’s Viable System Model was a useful meta-level theory to house agility
elements from IS research literature and apply VSM principles to identify the structure
required of the IT function. By means of a survey of 70 organizations, this thesis
confirmed that the meta-level theory better correlates with reported agility measures
than existing practice measures do on their own.
The leftmost box of the agility-capability model contains the capabilities of the IT
function necessary to produce the basic agility activities. The VSM meta-system
informed the identification of the capabilities: a Policy capability to set the overall goals
of the information systems, an Intelligence capability to look outside the systems and to
the future, and a Control capability with an inside and now focus on the systems. A set
of IT work processes reflected each of the capabilities of the IT functions. The IT work
processes drew mostly from COBIT objectives, with the exception of acquire and
maintain designs for forecasted business initiatives and implement configurable
software for forecasted business initiatives coined by this thesis.

Chapter 13
254
Figure 13-1 The agility-capability model

Conclusion
255
The centre column of the agility-capability model has the basic agility activities gleaned
from the IS theoretical literature and includes the concept of digital options. Digital
options are rights to future IT investment choices, without a current obligation for full
investment, made by an initial IT investment (Sambamurthy et al. 2003). The Policy,
Intelligence and Control structure of the IT function links to the agility activities.
The rightmost box of agility-capability model of Figure 13-1 shows the outcomes from
the agility activities. The occurrence of exercisable digital options reflects the agility
outcomes. These events are prior initial IT investments for forecasted business
initiatives completed to various stages in the systems development life cycle, and afford
a head start to delivering an adaptation to existing information systems once a
forecasted business initiative arrives. The initial IT investments are a head start on the
full IT investments and allow an agile adaptation faster than conventional planning
cycles. With conventional planning cycles, a full IT investment is budgeted soon after
receiving the request for a business initiative.
The agility-capability model of Figure 13-1 is theory that explains and predicts. The
prescribed IT function subsystems are a large determinant of the agility capability
(Figure 9-2, D-OPTIONS, R2=0.522). Intelligence, which is often associated with
Strategy & Enterprise Architecture Offices, contributes more than half of the IT function
determination of agility (see section 10.2). Policy and Control share the remaining
determination of agility by the IT function, which are respectively associated with
Steering Committees and Application Management Offices.
Further, the regression analysis in section 9.5 predicted that an increase in process
maturity levels of the IT function increases the frequency of agility outcomes by near
60%. (POLINTCON, correlation constant=0.578, t=8.902, p<0.01). An IS practice
implication of this prediction is to calculate the return on investment to increase process
maturity levels of the IT function, after estimating the cost of that investment and the
benefit from an increased frequency of agility outcomes. The agility-capability model
fills the deficit in IS research for a theory of explaining and predicting agility that is
generalized to large companies in OECD countries.

Chapter 13
256
The agility-capability model of Figure 13-1 also addresses the activities of the basic
model for agility identified in existing IS research, but mostly does not extend to
theories of explaining and predicting or theories of design and action. The model
prescribes IT function activities to sense future needs from the environment, sense
current use of information systems, create a portfolio of digital options and decide to
exercise a digital option. As seen in section 2.2.5, most IS theories for design and action
have taken the technological imperative and focus on agile responses when adapting
information systems.
13.3. Future research
13.3.1. Relevance factors of IS agility for organizations
The application test of Chapter 5 raised research propositions from the insights of the
Oakton consultants inducted from generalizations of the 250 client organizations of
Oakton. The propositions are contained in the relational model for agility in information
systems of Figure 5-2. The current research project only developed the enabling factors
of agility, from the right hand of the relational model, into testable hypotheses. The
propositions from the left hand of Figure 5-2 represent the relevance factors for agility
in information systems. The relevance factors remain untested and topics for a future
research project. The relevance factors demanding information systems agility in
organization are:
• a turbulent business environment has a great demand.
• an orderly business environment has a limited demand.
• a stable or static business environment has little demand.
• an operating model of unification has a demand.
• an operating model of coordination has less demand.
• an operating model of replication has low demand.
• an operating model of diversification has a demand.
• an organizational culture of low power distance drives demand.
• an organizational culture of low uncertainty avoidance drives a demand.
• an organizational culture of high collectivism reduces demand.

Conclusion
257
The relevance factors in the propositions used prominent IS typologies in IS theory for
operating models (Weill et al. 2006) and organizational culture (Hofstede 1980). These
were the most obvious typologies for quickly delivering the applicability check. Future
research into the agility relevance factors requires a rigorous review of existing IS
theories to be applied and measures for demand for agility in information systems.
13.3.2. Building portfolios of digital options
Piccoli and Ives (2005) challenge IS researchers to view information systems as digital
options generators (Sambamurthy et al. 2003). The hypotheses testing of this thesis,
with its use of the D-OPTIONS construct, was an empirical contribution to this
challenge. The findings suggest research into the building of digital options portfolio
within the IT function.
The digital options portfolios can leverage existing information systems, in the value
added to the business by the IT function (Sambamurthy et al. 2003). Future research
might investigate where in the systems development life cycle are the digital options
taken to, the cost in creating digital options, cost in maintaining digital options, criteria
for digital options to lapse, and measuring the benefit of exercising digital options
verses delivery to received business requirements.
Applying financial options valuation models to the IT function can be used to inform
the further research. Black-Scholes (1973) is a dominant model and merits
consideration to a digital options model for the IT function. A future research agenda
consists of a theoretical exploration of the ontology equivalence between financial
options and digital options, the variations of the Black-Scholes model in the
management science literature, valuation models for information systems, and the
volatility in IT-dependent strategic benefits planned and realized. A possible empirical
study would be of many IS adaptation projects, with a post hoc Black-Scholes valuation
of the initial IT investment with the information available at the project initiation phase,
and a correlation with later project discontinuance.

Chapter 13
258
IS practitioners suggests there is a high incidence of project discontinuance because
business needs had changed (Schick 2008). The proposed research might inform IS
practice on the cost and benefits of project discontinuance by viewing instances in the
large scope of a portfolio of digital options that enable agility in information systems.
13.3.3. IT governance intervening in IS agility
The Oakton consultants identified the IT governance model as a factor that may drive or
confound the IT function’s enablement of agility in existing information systems. They
proposed that some IT governance models, such as Business Monarchy, drive the IT
function to enable agility. On the other hand, Oakton suggests the IT Monarchy and
Feudal governance models may compromise the IT function in the enablement of agility
(Woolley and Hobbs 2008). This interesting proposition raised the secondary hypothesis
H3 of this thesis:
The IT governance model (ITGOVT) of a Business Monarchy is more likely than
an IT Monarchy to realize IT-dependent strategic benefits (ITBENEFIT) from
exercisable digital-options for the existing information systems (D-OPTIONS).
Data analysis from the mailed and web-based surveys did not falsify hypothesis H3,
however, the findings did not display sufficient statistical power to reject a false
negative. The finding in section 10.5 suggests that the proposition requires further
research with a larger sample size for all IT governance archetypes. Business
monarchies were the most common IT governance archetype amongst the surveys’ 79
respondents (see Table 10-14). This profile varies to the 250 organizations surveyed by
Weill (2004), which found the Federal governance archetype was the most common.
Further research must have a more robust identification of the IT governance model
from respondents, than the single question used in this thesis’ questionnaire (see
Question 5 of Appendix A). Greater granularity in the types of IT decision taken would
provide a richer picture of IT governance frameworks in place. Further research should
consider alternative IT governance typologies to those of Weill (2004).

Conclusion
259
The contribution of this future research is to explore efficacy of the IT function subject
to different IT governance frameworks within the whole organization. The activity of
agility in information systems becomes a performance indicator of the IT function in
such a study.
13.4. Significant contributions
13.4.1. Contribution to IS theory on the IT function
This thesis explored the use of the VSM as an organizational theory for effective IT
functions within enterprises. As noted in section 3.3.2, the currency of VSM in
management practice and academic organizational theory is not reflected in IS research
to date.
This is an interesting omission as the problem of supplying requisite information to
managers is a persistent theme of MIS technologies, highlighted by Ackoff and others
(Eppler and Mengis 2004), and that Beer’s organizational theories have long-standing as
a possible model. There are a number of possible reasons for this lack of inter-
disciplinary convergence. Historically, IS was founded as an applied discipline of
technology and only in recent decades has utilized theoretical frameworks. This is a
different trajectory to cybernetics, which commenced as general systems theory in the
same post-World War II period. Stylistically, Beer’s writing is a laborious read for those
familiar in the rigorous discourse of IS research. The complex description of the VSM is
spread over many books and the writing is difficult to understand (Stephens and Haslett
2003). Lastly, much of the analysis of IS research has been leveled at the IT function
within the enterprise, while the principal focus of VSM applications has been the entire
enterprise.
Applying VSM to the Business Intelligence in section 11.8 is an example of this thesis
bringing the cybernetic approach to other IS research topics, with insights that pose
additional inquiries.

Chapter 13
260
13.4.2. Contribution to IS research on agility
This thesis extended the IS theory on agility beyond that of the research literature
reviewed in Chapter 2. The contribution is a theory to explain and predict agility in
existing information systems (c.f. Gregor 2006), as illustrated in the agility-capability
model (Figure 13-1). Theories for analyzing and explaining agility existed in the IS
research (Desouza 2006; Overby et al. 2006; Sambamurthy et al. 2003; Weill et al.
2002). However, until this thesis, theories for explaining and predicting agility in
information systems were concentrated on technology (Andrade and Fladeiro 2002;
Bieberstein et al. 2005; Börjesson et al. 2006; Holmqvist and Pessi 2006; Umar 2005;
Zhao et al. 2007) and did not address the capabilities of the IT function.
Further, this thesis contributed to two gaps identified for further research in the IS
literature. First, Fink and Neumann (2007) suggest future research to identify the
mechanisms underlying shared IT personnel and IT infrastructure capabilities that
afford agility. The theory of explanation and prediction for agility in information
systems, extended by this thesis, identifies the VSM as a plausible mechanism.
Recognition of this IS research gap is echoed by Sambamurthy et al. (2007), who state
the internal mechanisms for deploying and utilizing IT resources to enable
organizational agility remains under-researched. This thesis’ surveys fulfilled the need
to empirically test determinants of the IS agility suggested by recent authors (Ahsan and
Ngo-Ye 2005; Raschke and David 2005).
This thesis contributed a confirmatory test of a Fink and Neumann (2007) proposition
that IT personnel with deep business knowledge is not vital to create agility in
information systems. Fink and Neumann found that the ability of IT personnel to
understand the business environment and the organizational context is statistically
insignificant in determining IT-dependent agility. Those authors suggest that once the IT
personnel establishes effective partnerships with the business units, the necessary
knowledge may come from the business, and IT personnel need not develop a deep
business knowledge. Section 10.4 of this thesis describes reproducing the Fink and
Neumann e-mail survey of 288 Israeli IT managers with a mailed and web-based survey

Conclusion
261
of 79 business and IT professionals from many countries. This thesis did not falsify
Fink and Neumann findings.
Second, the extension to theoretical development extends to measuring IT process
maturity to enable agility. This addresses the need for an index of sensing and
responding suggested by Overby et al. (2006). The measures suggested by applying the
VSM meta-systems to the IT function and loaded from the findings in section 9.2 form
an index of the persistent capacity to enable agility. Rather than the frequency of past
agility events, six stages of process maturity scale the components for an agility
capability index. Table 13-2 lists the measures and loadings that compose the proposed
index. The maximum score is 57.918, which is the sum of the loads of the twelve
measures multiplied by 6 (the maximum point on the maturity scale). The index is the
sum of each score multiplied by the load and dividing the sum by the maximum score.
This calculation gives index values from 0.000 to 1.000. For example, the 36 Oakton
clients responding to the mailed survey returned an index of 0.537, indicating a
middling capability for agility amongst these Australian companies.
Index capability Loading Measure
Define high-level designs for forecasted business initiatives 0.863 MAT34
Implement configurable software for forecasted business initiatives
0.863 MAT35
Assess unexpected operational consequences to forecast business initiatives
0.877 MAT36
IT policies management 0.808 MAT37
Define the IT relationships 0.824 MAT38
Define a strategic IT plan 0.815 MAT39
Monitoring future trends and regulations 0.763 MAT40
Technological direction planning 0.826 MAT43
Feasibility studies to examine the possibility of implementing requirements and alternative courses of action
0.788 MAT44
Acquire and maintain application software 0.828 MAT45
Monitoring and reporting of service levels 0.727 MAT46
Reporting and trend analysis 0.671 MAT47
Table 13-2 A index of IT function’s capability for IS agility

Chapter 13
262
An editorial of Information System Frontiers (2007) calls for the academic research to
bring together underlying theoretical foundations from many fields, including
cybernetic management and the VSM, to develop theoretical foundations for, and guide
the development of, a service-computing environment for enterprise agility. Cybernetics
positions the IT function as a meta-system of the existing information systems. An
anticipated contribution of this thesis was to bring this approach to the IT function with
insights that pose additional inquiries.
13.4.3. Contribution to IS practice of agility
This thesis demonstrated that the IS theoretical and practice perspectives on agility are
reconcilable through cybernetics. By applying cybernetic principles to the problem area,
we addressed the “why” behind the “how to do” frameworks of the IS practice
perspective of enabling agility. The cybernetic framework complemented the model of
agility capability from the existing IS theoretical perspectives. The VSM application
provided a testable theory of agility that explains and predicts (Gregor 2006), which
was missing from the IS theoretical perspectives and which is required to inform IS
practice to plan and action agility. The survey results strongly suggest that an increase in
process maturity of the Policy-Intelligence-Control structure in the IT function can
cause a near-proportional increase in agile responses for existing information systems
and determine half of agility activity.
Some IS practitioners recognize the need for the contribution of this thesis. Gartner
Research (Plummer and McCoy 2006a) states enterprises must learn how to measure
agility and make investments to improve their agility, and predicts best practices for
agility will emerge through to 2011. A submission of an article to the ISACA Journal is
the principal conduit of knowledge transfer from this thesis to IS practice. The ISACA
Journal provides professional development information on IT governance and control
of information systems, and claims a readership of 86,000 practitioners in 160
countries1. The planned article will describe the survey results and discuss the findings
1 See the ISACA Journal web page, as accessed on 27 April 2009,
http://www.isaca.org/Content/NavigationMenu/Members_and_Leaders1/Overview1/Journal/ISACA_Journal_Home.htm

Conclusion
263
in section 11.5 that propose a new set of industry best practices for agility in existing
information systems.
13.5. A critical reflection
It is my belief that the empirical findings of this thesis resulted from acceptable practice
in positivist research. The conventional criteria of positivist research are internal
validity, external validity and objectivity (Guba and Lincoln 1994). Regarding internal
validity, the consistency of the quantitative results of hypotheses testing with the
generalizations of the Oakton consultants supports a claim that the data represents the
reality of the IT function. Further, the favourable quality statistics of the variables
generated by the PLS path modeling claim a statistical internal validity.
External validity of the findings from the 70 organizations surveyed is demonstrable by
their transferability to other large companies in OECD countries. The data collected
from the surveys had a representative profile of organizations and displayed normality
for statistical inference to the target population (Seddon and Scheepers 2006). Further,
the competitive business environment that contextualizes the IS topic of agility suggests
that the experience of the surveyed Australian companies is transferable to other large
companies in globalized economies.
The last criterion of acceptable practice in positivist research is my objectivity. My
claim of being an objective theorist is the clear isomorphism between the VSM and the
IT function. This isomorphism was the foundation for the theoretical development of
this thesis and defensible given the adopted ontology. A reader will judge whether I
maintained neutrality in the data collection and analysis. To minimize leading
respondents with my wording of questions, the phrasing of items in the questionnaire
incorporated published COBIT descriptions. A number of decisions for the data analysis
were prone to my subjectivity. For comparison with the principal research model, the
selected existing industry practice and alternative research models are those foremost in
the practitioner literature and amongst ontological possibilities, but ultimately subjected
to my judgment. Similarly, some research limitations (Chapter 12) were the result of my

Chapter 13
264
decisions for the research design, e.g. opting for a quantitative snapshot survey that may
incur common method variance.
Looking for a deeper meaning from this thesis, a novel paradigm in IS research is
recognizable. A paradigm is a construct of philosophical assumptions that includes an
ontology, epistemology and methodology (Mingers 2001; Mingers and Brocklesby
1997). This thesis exhibited a paradigm that combined ontology from structuration
theory, a cybernetic epistemology of explicit knowledge and quantitative hypotheses
testing. A search of IS journals failed to find any publication with the words of
“structuration”, “VSM” and “PLS”1; and indicated the novelty of this paradigm.
The ontological element of the paradigm was adopted from Giddens’ theory of
structuration (Giddens 1984). Section 6.4 established this ontology and section 11.2
further discussed its possibilities. The ontology allowed an IT function structure of
codified rules and authoritative resources, and enables IT personnel to produce agile
responses from existing information systems. In the course of time, this activity of the
IT personnel reproduces the structure.
The epistemology of the paradigm adopted a cybernetic approach. Epistemology is
concerned with the possibilities of our knowledge of the world (Mingers and
Brocklesby 1997). Section 3.2.2 described the cybernetic approach to knowledgeable
actions of the personnel of the IT function. The IT function is in a continuous state of
explicit information exchange with the environment, and forecasts perturbations and
adaptations to the information systems. Housing the cybernetic VSM with structuration
is an idea not far removed from Beer’s later thinking. In a defense of his model, Beer
(1984) describes the VSM as a set of rules applied to human agents to account for the
organizational phenomena of viability and discusses the constraints laid upon the human
agents by the roles the VSM entails.
The last element of a paradigm is methodology and this thesis used quantitative data
collection and analysis. The psychometric measurement of the mailed and web-based
questionnaires of Likert-type items were subjected to PLS path modeling and ANOVA
1 Google Scholar accessed 29 May 2009

Conclusion
265
to produce the major findings. Jones and Karsten (2008) cite Giddens endorsing survey
data collection and quantitative analysis as a valid research method for structuration
theory when augmented by a qualitative study. The qualitative study with several
Oakton consultants to elicit their understanding of the research topic provided this
augmentation.
While holding a view that this thesis was the result of acceptable positivist research
conducted within a coherent paradigm, I also believe the theoretical developments and
empirical findings are justifiable based on my IS practitioner experience. I have twenty-
five years experience as an IT practitioner, mostly as a solutions architect in the later
years. My experience included many IT-enabled business initiatives that did not proceed
beyond a favourable feasibility study or discontinued early in the IT development phase.
The most common reason stated for this discontinuance phenomenon was a change in
business priorities.
In my experience, IT practitioners do not welcome the phenomenon of the early
discontinuance of IT-enabled business initiatives. Senior IT managers are often
frustrated with instances of early discontinuance, citing wasted IT resources and
opportunity costs. Similarly, IT professionals tasked with the early development work,
and possessing an ethic based on IT project delivery, expressed disappointment at a
fluctuating program of work. After experiencing this phenomenon over a number of
years, I formed an opinion that early discontinuance of IT-enabled business initiatives is
not an aberration of IT governance and not necessarily detrimental to the organization.
Given the opportunity for academic research, I found the IS literature on the agility
provided insight into the phenomenon.
The IS theory on agility, extended by this thesis, contextualizes the phenomenon of
early discontinuance of IT-enabled business initiatives. The phenomenon is viewable as
unexercised digital options that are necessary to enable agility in information systems. It
is not a consequence of poor capabilities of the IT function or detrimental to IT-
dependent strategic benefits. The agility-capability model of this thesis, founded on the
theoretical development and quantitatively tested, views early discontinuance as a

Chapter 13
266
healthy outcome of a mature IT function and necessary to realize strategic benefits from
agile information systems.
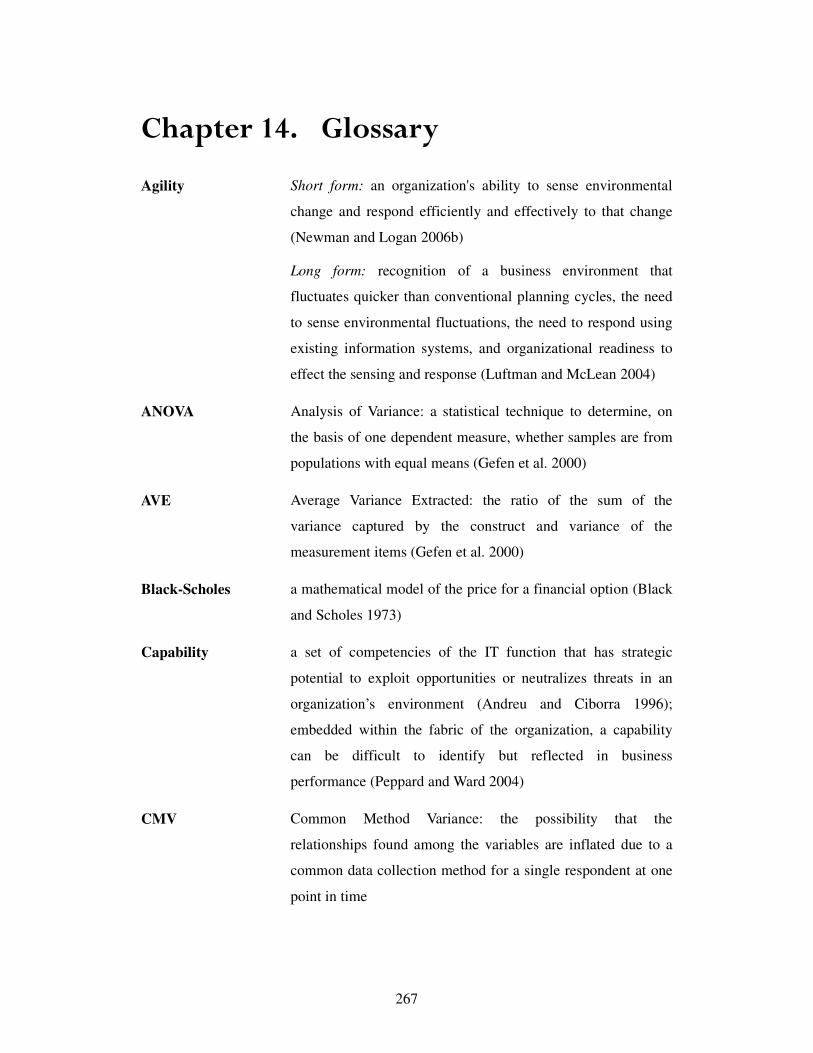
267
Chapter 14. Glossary
Agility Short form: an organization's ability to sense environmental
change and respond efficiently and effectively to that change
(Newman and Logan 2006b)
Long form: recognition of a business environment that
fluctuates quicker than conventional planning cycles, the need
to sense environmental fluctuations, the need to respond using
existing information systems, and organizational readiness to
effect the sensing and response (Luftman and McLean 2004)
ANOVA Analysis of Variance: a statistical technique to determine, on
the basis of one dependent measure, whether samples are from
populations with equal means (Gefen et al. 2000)
AVE Average Variance Extracted: the ratio of the sum of the
variance captured by the construct and variance of the
measurement items (Gefen et al. 2000)
Black-Scholes a mathematical model of the price for a financial option (Black
and Scholes 1973)
Capability a set of competencies of the IT function that has strategic
potential to exploit opportunities or neutralizes threats in an
organization’s environment (Andreu and Ciborra 1996);
embedded within the fabric of the organization, a capability
can be difficult to identify but reflected in business
performance (Peppard and Ward 2004)
CMV Common Method Variance: the possibility that the
relationships found among the variables are inflated due to a
common data collection method for a single respondent at one
point in time

Chapter 14
268
COBIT Control Objectives for Information and related Technology: an
IT industry best practice for the IT function
Composite
Reliability
if multiple measurements compose a variable, reliable
measures will all be very consistent in their values (Gefen et al.
2000); an indicator of construct reliability but ultimately
construct reliability is not an empirical issue
Construct “a construct may be viewed as a broad mental configuration of
a given phenomenon, while a variable may be viewed as an
operational configuration derived from a construct.” (Wetzels
et al. 2009 p. 178)
Control see System THREE, a synonym adopted for the context of this
thesis
Conventional
planning cycles
planning cycles based on receiving a statement of requirements
from a business that commences an IT implementation project
with the intent to make a full IT investment; often measured in
years for large information systems;
iterations of a system development life cycle, with each cycle
generally having the stages of high-level design, detailed
design, build and test, implement and review;
contrasts with agility time frames and intentions for initial IT
investments of digital options
Convergent
reliability
the extent that all the measurement items for a given variable
have consistent values (Gefen et al. 2000)
Co-ordination see System TWO, a synonym adopted for the context of this
thesis
Cronbach’s alpha an statistic of reliability for a set of measurement items of a
construct, values range between 0 and 1.0 with higher values
indicating higher reliability among the measurement items
(Gefen et al. 2000)

Glossary
269
Cybernetics the science of feedback and control in biological and
mechanical systems, founded by Norbert Wiener in a 1948
publication
Delivery see System THREE, a synonym adopted for the context of this
thesis
Digital options Rights to future IT investment choices without a current
obligation for full investment, made by an initial IT investment
(Sambamurthy et al. 2003)
Discriminant
validity
the extent to which measurement items of a given variable
differ from measurement items of other variables in the same
structural model (Hulland 1999)
ERP Enterprise Resource Planning: commercially packaged
enterprise application software that promise seamless
integration of information through an organization (Reddy and
Reddy 2002)
Exercisable describes a digital option where the opportunity has arrived to
make a decision for the full IT investment
Exercised describes a digital option where there is a decision for the full
IT investment, i.e. to enact an agile response
Existing information
systems
IT-enabled business initiatives that have been implemented
(Weill et al. 2002)
Identity the attribute of a system that is recognizable as being separate
from other systems in its environment, even though the
components of the system may change the basic structure and
function (Beer 1979)
Intelligence see System FOUR, a synonym adopted for the context of this
thesis

Chapter 14
270
IS Information systems, the discipline on the use of IT by people
and organizations
IT Information technology: electronic processes and networks
(Weill et al. 2002)
IT function IT personnel and representative of business stakeholders of the
existing information systems
IT personnel IT professionals and business stakeholders
ITIL Information Technology Infrastructure Library: an IT industry
best practice for service delivery and maintenance
Large enterprises Enterprises with 250 or more employees, i.e. not defined as a
small-medium enterprise1
Law of requisite
variety
Short form: Only variety can absorb variety, where variety is a
measure of the possible states of a system (Ashby 1956;
Conant and Ashby 1970)
Long form: an environment inherently contains more variety
than the system processes can absorb, and therefore the system
attenuates environmental variety into what is requisite for the
system’s processes, no more and no less. Similarly, the meta-
system cannot know all the details of the system’s processes
and must have variety attenuated to deliver the requisite
amount of information to manage the system
1 http://ec.europa.eu/enterprise/enterprise_policy/sme_definition/index_en.htm assessed 28 May 2009

Glossary
271
Meta-system Collectively System FIVE to System THREE is meta-system
of the viable system, but not viable systems themselves. The
meta-system does not exist for itself: it is a redundancy
explained by the Law of Requisite Variety (Ashby 1956;
Conant and Ashby 1970). The meta-system of the viable
system regulates the complexity in the environment that
embeds the viable system
Oakton an Australian IT and business consultancy, the industry partner
of this thesis
OECD Organization for Economic Co-operation and Development
Operations see System ONE
PLS Partial-least-square: a modeling technique that combines a
factor analysis of measurement items of a construct and linear
regressions between construct, enabling researchers to answer
research questions in a single analysis by modeling the
relationships among multiple independent and dependent
constructs simultaneously (Gefen et al. 2000)
Policy see System FIVE, a synonym adopted for the context of this
thesis
Primary research
hypothesis
The more mature the coupled processes of Policy, Intelligence
and Control of the IT function, the more often digital-options
for the existing information systems are exercisable;
see the Primary hypothesis of the principal research model on
page 101
Principal research
model
see Figure 6-2 Principal research model on page 107
R2 a measure of the proportion of the variance of the dependent
variable about its mean explained by the independent variables,
used in ANOVA and PLS (Gefen et al. 2000)

Chapter 14
272
Structure the rules and non-human resources that refer to patterns of
social relationships and enact a social practice by human
agents (Cassell 1993; Giddens 1984)
System FIVE a subsystem of the VSM and part of meta-system; System
FIVE sets the overall goals of the system, and constrains the
possibilities of adaptive behaviour provided by System FOUR
when coupled with System THREE
System FOUR a subsystem of the VSM and part of meta-system, System
FOUR spends most of its time looking outside the system and
to the future
System ONE a subsystem of the VSM; the operating functions of a viable
system and forms the identity of the system; there are many
System ONE instances in a viable system
System THREE a subsystem of the VSM and part of meta-system, responsible
for the inside and now control of System ONE
System TWO a subsystem of the VSM, the function of System TWO is to
dampen oscillations between both the meta-system and System
ONE and other systems related to System ONE
TOGAF The Open Group's Architecture Forum: an IT industry ‘best
practice’ framework for developing an enterprise architecture
(The Open Group 2009)
Type I errors a statistical decision that rejects the null hypothesis when the
null hypothesis is true, a false positive
Type II errors a statistical decision that fails to reject the null hypothesis
when the null hypothesis is false, a false negative
Variable see Construct
Viability the ability of an information system to adapt its identity over
time (Beer 1979; Peppard 2005)

Glossary
273
VSM Viable System Model: consists of five subsystems that are
necessary and sufficient for a viable system. Collectively
System FIVE to System THREE is meta-system of the many
System ONE instances in a viable system. The many System
ONE instances beneath meta-system produce the viable
system, i.e. they generate the viable system’s identity. System
TWO dampens the oscillations that will arise between the
meta-system and System ONE instances (Beer 1979; Beer
1984; Beer 1985)

Chapter 14
274

275
References Abraham, C., Junglas, I., and Willis, M. 2008. "Enabling an Agile Information Supply
Chain in Service Oriented Architectures with Web Services," in: AMCIS 2008 Proceedings.
Agarwal, R., and Sambamurthy, V. 2002. "Principles and Models for Organizing the IT Function," MIS Quarterly Executive (1:1), pp. 1-16.
Ahmad, R., and Yusoff, M. 2006. "A Viable System Approach to Tackle Complex Enterprise Situation for SISP," Malaysian Journal of Computer Science (19:1), pp. 87-103.
Ahsan, M., and Ngo-Ye, L. 2005. "The Relationship between IT Infrastructure and Strategic Agility in Organizations," in: AMCIS 2005 Proceedings.
Andrade, L.F., and Fladeiro, J.L. 2002. "Agility through Coordination," Information Systems (27:6), September, pp. 411-424.
Andreu, R., and Ciborra, C. 1996. "Organisational Learning and Core Capabilities Development: The Role of IT," Journal of Strategic Information Systems (5:2), pp. 111-127.
Arnott, D. 2002. "A Taxonomy of Decision Biases," 2002/01, Monash University, Melbourne.
Arnott, D. 2006. "Cognitive Biases and Decision Support Systems Development: A Design Science Approach," Information Systems Journal (16:1), p. 55.
Ashby, W.R. 1956. An Introduction to Cybernetics. London: Chapman & Hall. Australian Bureau of Statistics. 2008. "2008 Australia at a Glance," ISSN 1031-0541,
Commonwealth of Australia, Canberra. Bajgoric, N. 2006. "Information Systems for E-Business Continuance: A Systems
Approach," Kybernetes (35:5-6), pp. 632-652. Baskerville, R., Cavallari, M., Hjort-Madsen, K., Pries-Heje, J., Sorrentino, M., and
Virili, F. 2005. "Extensible Architectures: The Strategic Value of Service Oriented Architecture in Banking," in: ECIS 2005 Proceedings.
Beer, S. 1979. The Heart of Enterprise. Chichester: Wiley. Beer, S. 1980. "Preface to the Maturana and Varela's Autopoiesis: The Organization of
the Living," Boston Philosophy of Science series (40), pp. 63–72. Beer, S. 1981. Brain of the Firm, (2nd ed.). Chichester: Wiley. Beer, S. 1984. "The Viable System Model: Its Provenance, Development, Methodology
and Pathology," The Journal of the Operational Research Society (35:1), pp. 7-25.
Beer, S. 1985. Diagnosing the System for Organizations. Chichester: Wiley. Berente, N. 2005. "ERP and Innovation in Schumpeterian Market Dynamics," in:
AMCIS 2005 Proceedings. Bieberstein, N., Bose, S., Walker, L., and Lynch, A. 2005. "Impact of Service-Oriented
Architecture on Enterprise Systems, Organizational Structures, and Individuals," IBM Systems Journal (44:4), pp. 691-708.
Black, F., and Scholes, M. 1973. "The Pricing of Options and Corporate Liabilities," Journal of Political Economy (81:3), p. 637.
Börjesson, A., Martinsson, F., and Timmeras, M. 2006. "Agile Improvement Practices in Software Organizations," European Journal of Information Systems (15:2), April, pp. 169-182.
Börjesson, A., and Mathiassen, L. 2005. "Improving Software Organizations: Agility Challenges and Implications," Information Technology & People (18:4), pp. 359-382.
Burton, B., Geishecker, L., Hostmann, B., Friedman, T., and Newman, D. 2006. "Organizational Structure: Business Intelligence and Information Management," G00138940, Gartner Inc., Stamford.

276
Bussen, W., and Myers, M.D. 1997. "Executive Information System Failure: A New Zealand Case Study," Journal of Information Technology (12:2), pp. 145-153.
Byrd, T.A., and Turner, D.E. 2001. "An Exploratory Analysis of the Value of the Skills of IT Personnel: Their Relationship to IS Infrastructure and Competitive Advantage," Decision Sciences (32:1), pp. 21-54.
Cantara, M. 2006. "Achieving Agility: Evaluating the Agility-Enabling Abilities of External Service Providers," G00137908, Gartner Research, Stanford CT, p. 6.
Cassell, P. 1993. The Giddens Reader. London: Macmillan. Checkland, P. 1983. "O.R. And the Systems Movement: Mappings and Conflicts," The
Journal of the Operational Research Society (34:8), August, pp. 661-675. Chin, W.W., Marcolin, B.L., and Newsted, P.R. 2003. "A Partial Least Squares Latent
Variable Modeling Approach for Measuring Interaction Effects: Results from a Monte Carlo Simulation Study and an Electronic-Mail Emotion/Adoption Study," Information Systems Research (14:2), June, pp. 189-217.
Chin, W.W., and Newstead, P.R. 1999. "Structural Equation Modeling Analysis with Small Samples Using Partial Least Squares," in: Statistical Strategies for Small Sample Research, R.H. Hoyle (ed.). Thousand Oaks: SAGE Publications, p. 367.
Chung, W. 2009. "Enhancing Business Intelligence Quality with Visualization: An Experiment on Stakeholder Network Analysis," Pacific Asia Journal of the Association for Information Systems (1:1), March, pp. 33-53.
Churchill Jr, G.A. 1979. "A Paradigm for Developing Better Measures of Marketing Constructs," Journal of Marketing Research (16:1), pp. 64-73.
Conant, R.C., and Ashby, W.R. 1970. "Every Good Regulator of a System Must Be a Model of That System," International Journal of Systems Science (1:2), pp. 89-97.
Cornford, T., Venters, W., and Zheng, Y. 2007. "Agility, Improvisation, or Enacted Emergence," in: ICIS 2007 Proceedings.
Davenport, T.H., Harris, J.G., and Kohli, A.K. 2001. "How Do They Know Their Customers So Well?," MIT Sloan Management Review (42:2), pp. 63-73.
Denning, P.J., Gunderson, C., and Hayes-Roth, R. 2008. "The Profession of IT Evolutionary System Development," Commun. ACM (51:12), pp. 29-31.
Desouza, K.C. 2006. Agile Information Systems: Conceptualization, Construction, and Management. Oxford: Butterworth Heinemann.
Dillman, D.A. 2000. Mail and Internet Surveys: The Tailored Design Method, (Second ed.). New York: John Wiley & Sons Inc.
Duncan, N.B. 1995. "Capturing Flexibility of Information Technology Infrastructure: A Study of Resource Characteristics and Their Measure," Journal of Management Information Systems (12:2), pp. 37-58.
Eppler, M.J., and Mengis, J. 2004. "The Concept of Information Overload: A Review of Literature from Organization Science, Accounting, Marketing, MIS, and Related Disciplines," Information Society (20:5), Nov-Dec, pp. 325-344.
Fink, L., and Neumann, S. 2007. "Gaining Agility through IT Personnel Capabilities: The Mediating Role of IT Infrastructure Capabilities," Journal of the Association for Information Systems (8:8), August, pp. 440-462.
Fitzgerald, B., Hartnett, G., and Conboy, K. 2006. "Customising Agile Methods to Software Practices at Intel Shannon," European Journal of Information Systems (15:2), pp. 200-213.
Freeze, R.D., and Raschke, R.L. 2007. "An Assessment of Formative and Reflective Constructs in IS Research," 15th European Conference on Information Systems, H. Österle, J. Schelp and R. Winter (eds.), St. Gallen, pp. 1481-1493.
Galliers, R.D. 1991. "Choosing Appropriate Information System Research Approaches: A Revised Taxonomy," in: Information Systems Research: Contemporary Approaches and Emergent Traditions, Proc. IFIP TC8/Wg8.2 Working Conference, Dec. 1990, H. Nissen, H.K. Klein and R. Hirschheim (eds.). North-Holland: pp. 327-345.

277
Galliers, R.D. 2006. "Strategizing for Agility: Confronting Information Systems Inflexibility," in: Agile Information Systems: Conceptualization, Construction, and Management, K.C. Desouza (ed.). Oxford: Butterworth Heinemann.
Gefen, D., Straub, D.W., and Boudreau, M.-C. 2000. "Structural Equation Modeling and Regression: Guidelines for Research Practice," Communications of the Association for Information Systems (4:7), October, pp. 1-79.
Gibson, M., Arnott, D., Jagielska, I., and Melbourne, A. 2004. "Evaluating the Intangible Benefits of Business Intelligence: Review & Research Agenda," in: Proceedings of the 2004 IFIP International Conference on Decision Support Systems (Dss2004):Decision Support in an Uncertain and Complex World, R. Meredith, G. Shanks, D. Arnott and S. Carlsson (eds.). Prato, Italy: pp. 295-305.
Giddens, A. 1984. "The Constitution of Society: Outline of the Theory of Structure." University of California Press, Berkeley, CA.
Goethals, F.G., Snoeck, M., Lemahieu, W., and Vandenbulcke, J. 2006. "Management and Enterprise Architecture Click: The FAD(E)E Framework," Information Systems Frontiers (8:2), Feb, pp. 67-79.
Goldman, S.L., Nagel, R.N., and Preiss, K. 1995. Agile Competitors and Virtual Organizations: Strategies for Enriching the Customers. Van Nostrand Reinhold Company.
Gregor, S. 2006. "The Nature of Theory in Information Systems," MIS Quarterly (30:3), pp. 611-642.
Guba, E.G., and Lincoln, Y.S. 1994. "Competing Paradigms in Qualitative Research," in: Handbook of Qualitative Research, N.K. Denzin and Y.S. Lincoln (eds.). Thousand Oaks: Sage pp. 105-117.
Haenlein, M., and Kaplan, A.M. 2004. "A Beginner's Guide to Partial Least Squares Analysis," Understanding Statistics (3:4), pp. 283-297.
Harzing, A.-W. 2009. "Publish or Perish ". Tarma Software Research Pty Ltd. Haslett, T., and Sarah, R. 2006. "Using the Viable Systems Model to Structure a System
Dynamics Mapping and Modeling Project for the Australian Taxation Office," Systemic Practice and Action Research (19:3), June, pp. 273-290.
Henderson, J., and Venkatraman, N. 1993. "Strategic Alignment: Leveraging Information Technology for Transforming Organizations," IBM Systems Journal (32:1), pp. 4-16.
Herring, C., and Kaplan, S. 2001. "The Viable System Architecture," Proceedings of the 34th Annual Hawaii International Conference on System Sciences, pp. 1-10.
Herring, C.E. 2002. "Viable Software: The Intelligent Control Paradigm for Adaptable and Adaptive Architectures," in: The Department of Information Technology and Electrical Engineering. Brisbane: University of Queensland.
Hill, P., and Turbitt, K. 2006. "ITIL Versus COBIT." TalkBMC Retrieved 19 July, 2007, from http://bmc.media.libsynpro.com/talkbmc/TalkBMCpeterhillkenturbitt20060630.mp3
Hobbs, G.A. 2008. "Australian Industry Survey of Agility in Information Systems," Oakton, Melbourne, p. 5.
Hobbs, G.A., and Scheepers, R. 2009. "Identifying Capabilities for the IT Function to Create Agility in Information Systems," Pacific Asia Conference on Information Systems, R. Bapna and V. Sambamurthy (eds.), Hyderabad: AIS Electronic Library (AISeL).
Hofstede, G. 1978. "The Poverty of Management Control Philosophy," The Academy of Management Review (3:3), July, pp. 450-461.
Hofstede, G. 1980. Culture’s Consequences: International Differences in Work-Related Values. Beverly Hills, CA: Sage Publications.
Hofstede, G. 1983. "Dimensions of National Cultures in Fifty Countries and Three Regions," in: Explications in Cross-Cultural Psychology, J.B. Deregowski, S. Daiurawiec and R.C. Annis (eds.). Lisse, Netherlands: Swets and Zeitlinger, pp. 335-355.

278
Holmqvist, M., and Pessi, K. 2006. "Agility through Scenario Development and Continuous Implementation: A Global Aftermarket Logistics Case," European Journal of Information Systems (15:2), pp. 146-158.
Hovorka, D.S., and Larsen, K.R. 2006. "Enabling Agile Adoption Practices through Network Organizations," European Journal of Information Systems (15:2), pp. 159-168.
Hulland, J. 1999. "Use of Partial Least Squares (PLS) in Strategic Management Research: A Review of Four Recent Studies," Strategic Management Journal (20:2), February, pp. 195-204.
Humphrey, W.S. 1987. "Characterizing the Software Process: A Maturity Framework," CMU/SEI-87-TR-11, Software Engineering Institute Carnegie Mellon University, Pittsburgh, Pennsylvania, pp. 1-11.
IT Governance Institute. 2005. "COBIT 4.0: Control Objectives, Management Guidelines, Maturity Models," IT Governance Institute, Rolling Meadows, IL.
IT Governance Institute. 2007. "COBIT 4.1: Framework, Control Objectives, Management Guidelines, Maturity Models," IT Governance Institute, Rolling Meadows IL.
Ives, B., and Mandviwalla, M. 2004. "Key Issues for IT Management in 2004." Retrieved 16 July, 2007, from http://www.ebi.temple.edu/programs/keyissues2004/
Jackson, M.C., and Keys, P. 1984. "Towards a System of Systems Methodologies," The Journal of the Operational Research Society (35:6), June, pp. 473-486.
Johnston, R.B. 1998. "The Problem with Planning: The Significance of Theories of Activity for Operations Management." http://www.dis.unimelb.edu.au/staff/robertj/single.pdf Retrieved 2 May, 2007
Jones, M.R., and Karsten, H. 2008. "Giddens's Structuration Theory and Information Systems Research," MIS Quarterly (32:1), pp. 127-157.
Kashanchi, R., and Toland, J. 2006. "Can ITIL Contribute to IT/Business Alignment? An Initial Investigation," Wirtschaftsinformatik (48:5), pp. 340-348.
Kirsch, L.J. 2004. "Deploying Common Systems Globally: The Dynamics of Control," Information Systems Research (15:4), December, pp. 374–395.
Klein, H.K., and Rowe, F. 2008. "Marshaling the Professional Experience of Doctoral Students: A Contribution to the Practical Relevance Debate," MIS Quarterly (32:4), pp. 675-686.
Koestler, A. 1967. The Ghost in the Machine. London Hutchinson. Laumann, M., Rosenkranz, C., and Kolbe, H. 2008. "Diagnosing and Redesigning a
Health(Y) Organization - an Arvato (Bertelsmann) Action Research Study," Proceedings of the 15th European Conference on Information Systems, H. Österle, J. Schelp and R. Winter (eds.), St. Gallen, pp. 1990-2001.
Laxton, R. 2000. "The World Wide Web as Neural Net: Implications for Market-Driven Web Enabling," Technological Forecasting and Social Change (64:1), pp. 55-70.
Lee, D.M.S., Trauth, E.M., and Farwell, D. 1995. "Critical Skills and Knowledge Requirements of IS Professionals: A Joint Academic/Industry Investigation," MIS Quarterly (19:3), pp. 313-340.
Leidner, D.E., and Kayworth, T. 2006. "Review: A Review of Culture in Information Systems Research: Toward a Theory of Information Technology Culture Conflict.," in: MIS Quarterly. p. 357(343).
Luftman, J., and McLean, E. 2004. "Key Issues for IT Executives," MIS Quarterly Executive (3:2), pp. 89-104.
Lyytinen, K., and Rose, G.M. 2006. "Information System Development Agility as Organizational Learning," European Journal of Information Systems (15:2), April, pp. 183-199.
Malhotra, N.K., Kim, S.S., and Patil, A. 2006. "Common Method Variance in IS Research: A Comparison of Alternative Approaches and a Reanalysis of Past Research," Management Science (52:12), December, pp. 1865-1883.
Marcoulides, G.A., Chin, W.W., and Saunders, C. 2009. "A Critical Look at Partial Least Squares Modeling," MIS Quarterly (33:1), pp. 171-175.

279
Marcoulides, G.A., and Saunders, C. 2006. "PLS: A Silver Bullet?," MIS Quarterly (30:2), June, pp. iii-ix.
Markus, M. 2000. "Paradigm Shifts-E-Business and Business/Systems Integration," Communications of the Association for Information Systems (4:10), pp. 1-44.
Markus, M., and Robey, D. 1988. "Information Technology and Organizational Change: Causal Structure in Theory and Research," Management Science (34:5), pp. 583-598.
Mathiassen, L., and Pries-Heje, J. 2006. "Business Agility and Diffusion of Information Technology," European Journal of Information Systems (15:2), Apr, pp. 116-119.
Maturana, H.R., and Varela, F. 1980. Autopoiesis and Cognition: The Realization of the Living. Dordrecht: D. Reidel Publishing Co.
McCoy, D.W., and Plummer, D.C. 2006. "Defining, Cultivating and Measuring Enterprise Agility," G00139734, Gartner Research, Stanford CT, p. 5.
Medina, E. 2006. "Designing Freedom, Regulating a Nation: Socialist Cybernetics in Allende's Chile," Journal of Latin American Studies (38), pp. 571-606.
Mingers, J. 2001. "Combining IS Research Methods: Towards a Pluralist Methodology," Information Systems Research (12:3), September, pp. 240-259.
Mingers, J., and Brocklesby, J. 1997. "Multimethodology: Towards a Framework for Mixing Methodologies," Omega (25:5), 1997/10, pp. 489-509.
Mirani, R., and Lederer, A.L. 1998. "An Instrument for Assessing the Organizational Benefits of IS Projects," Decision Sciences (29:4), pp. 803-838.
Nazir, S., and Pinsonneault, A. 2008. "The Role of Information Technology in Firm Agility: An Electronic Integration Perspective," in: AMCIS 2008 Proceedings.
Neuman, W.L. 1991. Social Research Methods: Qualitative and Quantitative Approaches, (Fifth ed.). Boston: Allyn and Bacon.
Newman, D. 2005. "Business Drivers and Issues in Enterprise Information Management," G00129712, Gartner Inc., Stamford.
Newman, D., and Logan, D. 2006a. "Achieving Agility: How Enterprise Information Management Overcomes Information Silos," G00137817, Gartner Research, Stanford CT, p. 7.
Newman, D., and Logan, D. 2006b. "Achieving Agility: How Enterprise Information Management Overcomes Information Silos," G00137817, Gartner.
Ngo-Ye, L., and Ahsan, M. 2005. "Enterprise IT Application Systems Agility and Organizational Agility," in: AMCIS 2005 Proceedings.
Nyström, C.A. 2006. "Viable Intranets for Viable Organizations: Incentives for Shared and Common Intranets," in: Department of Informatics. Umeå: Umeå University.
Oakton. 2006. "IT Governance (or Business Governance of IT): A Practical Approach," in: IT Governance Executive Forum. Melbourne: Oakton Ltd.
OECD. 2009. OECD Factbook 2009 Paris: OECD. Office of Government Commerce. 2005. Introduction to ITIL. London: The Stationery
Office. Okoli, C., and Pawlowski, S.D. 2004. "The Delphi Method as a Research Tool: An
Example, Design Considerations and Applications," Information & Management (42:1), December, pp. 15-29.
Ormerod, R. 1995. "Putting Soft or Methods to Work: Information Systems Strategy Development at Sainsbury's," The Journal of the Operational Research Society (46:3), pp. 277-293.
Osborn, C.S. 1998. "Systems for Sustainable Organizations: Emergent Strategies, Interactive Controls and Semi-Formal Information," Journal of Management Studies (35:4), pp. 481-509.
Overby, E., Bharadwaj, A., and Sambamurthy, V. 2006. "Enterprise Agility and the Enabling Role of Information Technology," European Journal of Information Systems (15:2), pp. 120-131.
Patten, K., Whitworth, B., Fjermestad, J., and Mahinda, E. 2005. "Leading IT Flexibility: Anticipation, Agility and Adaptability," Eleventh Americas

280
Conference on Information Systems, D. Khazanchi and I. Zigurs (eds.), Omaha, Nebraska, pp. 11-14.
Peppard, J. 2005. "The Application of the Viable Systems Model to IT Governance," 26th International Conference on Information System (ICIS), Las Vegas, USA, pp. 11-24.
Peppard, J., and Ward, J. 2004. "Beyond Strategic Information Systems: Towards an IS Capability," Journal of Strategic Information Systems (13:2), pp. 167-194.
Peppard, J., and Ward, J. 2005. "Unlocking Sustained Business Value from IT Investments," California Management Review (48:1).
Petter, S., Straub, D., and Rai, A. 2007. "Specifying Formative Constructs in Information Systems Research," MIS Quarterly (31:4), pp. 623-656.
Piccoli, G., and Ives, B. 2005. "Review: IT-Dependent Strategic Initiatives and Sustained Competitive Advantage: A Review and Synthesis of the Literature," MIS Quarterly (29:4), December, pp. 747-776.
Plummer, D.C., and McCoy, D.W. 2006a. "Achieving Agility: Defining Agility in an IT Context," G00137819, Gartner Research, Stanford CT, p. 8.
Plummer, D.C., and McCoy, D.W. 2006b. "Achieving Agility: The View through a Conceptual Framework," G00137820, Gartner Research, Stanford CT, p. 14.
Popper, K. 1959. The Logic of Scientific Discovery. New York, NY: Basic Books. Qureshi, I., and Compeau, D. 2009. "Assessing between-Group Differences in
Information Systems Research: A Comparison of Covariance- and Component-Based SEM," MIS Quarterly (33:1), pp. 197-214.
Raschke, R.L., and David, J.S. 2005. "Business Process Agility," in: AMCIS 2005 Proceedings.
Reddy, S.B., and Reddy, R. 2002. "Competitive Agility and the Challenge of Legacy Information Systems," Industrial Management & Data Systems (102:1), pp. 5-16.
Ren, M., and Lyytinen, K.J. 2008. "Building Enterprise Architecture Agility and Sustenance with SOA," in: Communications of the Association for Information Systems.
Ridley, G., Young, J., and Carroll, P. 2004. "COBIT and Its Utilization: A Framework from the Literature," 37th Annual Hawaii International Conference on System Sciences, p. 8.
Ringle, C.M., Wende, S., and Will, A. 2005. "SmartPLS." Hamburg, Germany: University of Hamburg.
Roh, S., Park, M., Lee, H., and Kim, E. 2006. "A Conceptual Model of Web Service-Based Construction Information System," I.F.C. Smith (ed.), pp. 597-605.
Rosemann, M., and Vessey, I. 2008. "Improving the Relevance of Information System Research to Practice: The Role of Applicability Checks," MIS Quarterly (32:1), March, pp. 1-22.
Rouse, A., and Corbet, B. 2008. "There’s SEM and “SEM”: A Critique of the Use of PLS Regression in Information Systems Research," 19th Australasian Conference on Information Systems, A. Mills and S. Huff (eds.), Christchurch New Zealand, pp. 845-855.
Sambamurthy, V., Bharadwaj, A., and Grover, V. 2003. "Shaping Agility through Digital Options: Reconceptualizing the Role of Information Technology in Contemporary Firms," MIS Quarterly (27:2), June, pp. 237-263.
Sambamurthy, V., Wei, K.-K., Lim, K., and Lee, D. 2007. "IT-Enabled Organizational Agility and Firms' Sustainable Competitive Advantage," in: ICIS 2007 Proceedings.
Schein, E.H. 1985. Organizational Culture and Leadership. San Francisco, CA: Jossey-Bass.
Schick, S. 2008. "Nearly Half of IT Projects Are Killed Off Early," in: Computerworld. Schrage, M. 2004. "The Struggle to Define Agility," in: CIO. Schwaninger, M. 2006. "Design for Viable Organizations: The Diagnostic Power of the
Viable System Model," Kybernetes (35:7-8), pp. 955-966.

281
Seddon, P.B., and Scheepers, R. 2006. "Other-Settings Generalization in IS Research," Twenty-Seventh International Conference on Information Systems, Milwaukee, pp. 1141-1158.
Seo, D., Desouza, K., and Erickson, J. 2006. "Opening up the Black-Box: Information Systems and Organizational Agility," in: AMCIS 2006 Proceedings.
Seo, D.B., and La Paz, A.I. 2008. "Exploring the Dark Side of IS in Achieving Organizational Agility," Communications of the ACM (51:11), November, pp. 136-139.
Shanks, G., Arnott, D., and Rouse, A. 1993. "A Review of Approaches to Research and Scholarship in Information Systems," 4th Australian Conference on Information Systems, Brisbane, pp. 29-44.
Shanks, G., Tansley, E., Nuredini, J., Tobin, D., and Weber, R. 2002. "Representing Part-Whole Relationships in Conceptual Modeling: An Empirical Evaluation," ICIS 2002 Proceedings, pp. 89-100.
Sharma, R., Yetton, P., and Crawford, J. 2009. "Estimating the Effect of Common Method Variance: The Method--Method Pair Technique with an Illustration from TAM Research," MIS Quarterly (33:3), pp. 473-A413.
Shaw, D., Snowdon, B., Holland, C., Kawalek, P., and Warboys, B. 2004. "The Viable Systems Model Applied to a Smart Network: The Case of the UK Electricity Market," Journal of Information Technology (19:4), pp. 270-280.
Sledgianowski, D., Luftman, J., and Reilly, R. 2006. "Development and Validation of an Instrument to Measure Maturity of IT Business Strategic Alignment Mechanisms," Information Resources Management Journal (19:3), pp. 3-18.
Soper, D.S. 2009. "Post-Hoc Statistical Power for Multiple Regression." The Free Statistics Calculators Website 2.0. Retrieved 2009, 2 March, from http://www.danielsoper.com/statcalc/calc09.aspx
Stephens, J.R., and Haslett, T.R. 2003. "Demystifying Beer - Do You Want Fries with That?," Systems In Action - 9th ANZSYS Conference, T. Haslett and R. Sarah (eds.), Melbourne Australia: Australia and New Zealand Systems.
Sutton, D.C. 1995. "Viable Systems Model (VSM)," The Journal of the Operational Research Society (46:8), August, pp. 1038-1039.
Tenenhaus, M., Vinzi, V.E., Chatelin, Y.-M., and Lauro, C. 2005. "PLS Path Modeling," Computational Statistics & Data Analysis (48:1), pp. 159-205.
The Open Group. 2009. "The Open Group Architecture Framework (TOGAF) Version 9." Enterprise edition. Retrieved 16 April, 2009, from http://www.opengroup.org/architecture/togaf/
Tversky, A., and Kahneman, D. 1974. "Judgment under Uncertainty: Heuristics and Biases," Science (185:4157), 1974/09/27, pp. 1124-1131.
Umar, A. 2005. "IT Infrastructure to Enable Next Generation Enterprises," Information Systems Frontiers (7:3), Jul, pp. 217-256.
van Oosterhout, M., Waarts, E., and van Hillegersberg, J. 2006. "Change Factors Requiring Agility and Implications for IT," European Journal of Information Systems (15:2), April, pp. 132-145.
Venkatesh, V., Morris, M.G., Hall, M., Davis, G.B., and Davis, F.D. 2003. "User Acceptance of Information Technology: Toward a Unified View," MIS Quarterly (27:3), pp. 425-478.
Vinodh, S., Sundararaj, G., and Devadasan, S.R. 2009. "Total Agile Design System Model Via Literature Exploration," Industrial Management & Data Systems (109:4), pp. 570 - 588.
Walker, J. 2001. "The Viable Systems Model: A Guide for Co-Operatives and Federations." Version 2.21. Retrieved 1 November, 2006, from www.esrad.org.uk/resources/vsmg_2.2/pdf/vsmg_2_2.pdf
Webster, J., and Watson, R.T. 2002. "Analyzing the Past to Prepare for the Future: Writing a Literature Review," MIS Quarterly (26:2), June, pp. xiii-xxiii.
Weill, P. 2004. "Don’t Just Lead, Govern: How Top-Performing Firms Govern IT," MIS Quarterly Executive (3:1), pp. 1-17.

282
Weill, P., and Broadbent, M. 1998. Leveraging the New Infrastructure: How Market Leaders Capitalize on Information Technology. Boston, Massachusetts: Harvard Business School Press.
Weill, P., Ross, J.W., and Robertson, D.C. 2006. Enterprise Architecture as Strategy: Creating a Foundation for Business Execution. Boston: Harvard Business School Press.
Weill, P., Subramani, M., and Broadbent, M. 2002. "Building IT Infrastructure for Strategic Agility," MIT Sloan Management Review (44:1), Fall, pp. 57-65.
Wetzels, M., Odekerken-Schroder, G., and van Oppen, C. 2009. "Using PLS Path Modeling for Assessing Hierarchical Construct Models: Guidelines and Empirical Illustration," MIS Quarterly (33:1), pp. 177-195.
Woolley, B., and Hobbs, G.A. 2008. "Agility in Information Systems: A White Paper of Oakton and the University of Melbourne," Oakton, Melbourne, p. 14.
Zhao, J., Tanniru, M., and Zhang, L.-J. 2007. "Services Computing as the Foundation of Enterprise Agility: Overview of Recent Advances and Introduction to the Special Issue," Information Systems Frontiers (9:1), March, pp. 1-8.
Zhao, J.L., Hsu, C., Jain, H.K., Spohrer, J.C., Tanniru, M., and Wang, H.J. 2008. "ICIS 2007 Panel Report: Bridging Service Computing and Service Management: How MIS Contributes to Service Orientation," Communications of the Association for Information Systems (22:22), March 2008, pp. 413 - 428.

283
Appendix A: Mailed survey material
Australian Industry Survey of Agility in Information Systems
Section A: Your Profile
1. Which of the following best describes your role in your company?
□ Senior business manager □ Business manager □ Business stakeholder
□ Senior IT manager □ IT manager □ IT professional
2. How long have you been with the company?
□ Less than a year □ One to five years □ More than five years
3. Approximately how many employees are currently working in your company?
employees
4. Which of the following best describes the business environment of your company?
□ Regulated*** □ Stable*** □ Orderly***
□ Turbulent*** □ Very Turbulent
5. Which of the following best describes the group that makes the strategic business / IT decisions for your company?
□ Corporate-level business executives □ Corporate-level IT executives □ Business unit leaders
□ IT executives & one business group □ Corporate executives & business unit leaders
6. Which is the highest level in your company where you know of agility*** in information systems has been discussed?
□ Chief Executive Office □ Corporate-level business executives □ Corporate-level IT executives
□ Business unit leaders □ IT executives & one business group □ Other
Section B: Based on your experience, how often does your company
7. Have existing information systems that are readily configurable*** for a new business initiative?
□ Very Frequently □ Frequently □ Occasionally □Rarely □ Very Rarely
8. Have existing, detailed designs*** for IT that can be used, partially or wholly, for a new business initiative?
□ Very Frequently □ Frequently □ Occasionally □Rarely □ Very Rarely
9. Have existing, high-level designs*** for IT that can be used, partially or wholly, for a new business initiative?
□ Very Frequently □ Frequently □ Occasionally □Rarely □ Very Rarely
10. Have alternative target IT architectures*** and road-maps for new business models?
□ Very Frequently □ Frequently □ Occasionally □Rarely □ Very Rarely
11. Have IT policy reviews or updates?
□ Very Frequently □ Frequently □ Occasionally □Rarely □ Very Rarely
12. Have escalations or unresolved issues due to lack of, or insufficient responsibility for, assignments?
□ Very Frequently □ Frequently □ Occasionally □Rarely □ Very Rarely
13. Have technology infrastructure plan reviews or updates?
□ Very Frequently □ Frequently □ Occasionally □Rarely □ Very Rarely
14. Conduct activities to ensure integrity and consistency of all data stored electronically, e.g. in databases and data
warehouses?
□ Very Frequently □ Frequently □ Occasionally □Rarely □ Very Rarely
15. Do trend analysis of service incidents and queries?
□ Very Frequently □ Frequently □ Occasionally □Rarely □ Very Rarely
16. Update the data dictionary, including the data criticality and sensitivity classification scheme?
□ Very Frequently □ Frequently □ Occasionally □Rarely □ Very Rarely

284
Section C: To which extent do you agree or disagree with the followings statements
17. The IT personnel are knowledgeable about the key success factors that must go right if my company is to succeed
□ Strongly agree □ Somewhat agree □ Neither agree or disagree □ Somewhat disagree □ Strongly disagree
18. The IT personnel are encouraged to learn new information technologies
□ Strongly agree □ Somewhat agree □ Neither agree or disagree □ Somewhat disagree □ Strongly disagree
19. The IT personnel closely follow the trends in current information technologies
□ Strongly agree □ Somewhat agree □ Neither agree or disagree □ Somewhat disagree □ Strongly disagree
20. The strategies of the IT function*** and my company's strategies are well aligned
□ Strongly agree □ Somewhat agree □ Neither agree or disagree □ Somewhat disagree □ Strongly disagree
21. The IT personnel understand my company's policies and plans
□ Strongly agree □ Somewhat agree □ Neither agree or disagree □ Somewhat disagree □ Strongly disagree
22. The IT personnel are able to interpret business problems and develop appropriate technical solutions
□ Strongly agree □ Somewhat agree □ Neither agree or disagree □ Somewhat disagree □ Strongly disagree
23. The IT personnel are knowledgeable about business functions
□ Strongly agree □ Somewhat agree □ Neither agree or disagree □ Somewhat disagree □ Strongly disagree
24. IT shared across the company enhances competitiveness or creates strategic advantage
□ Strongly agree □ Somewhat agree □ Neither agree or disagree □ Somewhat disagree □ Strongly disagree
25. IT shared across the company enables the company to catch up with competitors
□ Strongly agree □ Somewhat agree □ Neither agree or disagree □ Somewhat disagree □ Strongly disagree
26. IT shared across the company aligns well with stated organisational goals
□ Strongly agree □ Somewhat agree □ Neither agree or disagree □ Somewhat disagree □ Strongly disagree
27. IT shared across the company helps establish useful linkages with other organisations
□ Strongly agree □ Somewhat agree □ Neither agree or disagree □ Somewhat disagree □ Strongly disagree
28. IT shared across the company enables the company to respond more quickly to change
□ Strongly agree □ Somewhat agree □ Neither agree or disagree □ Somewhat disagree □ Strongly disagree
29. IT shared across the company enables faster retrieval or delivery of information or reports
□ Strongly agree □ Somewhat agree □ Neither agree or disagree □ Somewhat disagree □ Strongly disagree
30. IT shared across the company allows other applications to be developed faster
□ Strongly agree □ Somewhat agree □ Neither agree or disagree □ Somewhat disagree □ Strongly disagree
Please consider the following maturity levels when answering the questions in the next section about IT processes
Non-existent: Complete lack of any recognisable processes. The company has not even recognised that there is an issue to be addressed.
Ad Hoc: There is evidence that the company has recognised that the issues exist. There are, however, no standardised processes.
Repeatable: Processes have developed to the stage where similar procedures are followed by different people undertaking the same task. There is no formal training or communication of standard procedures, and responsibility is left to the individual.
Defined: Procedures have been standardised and documented, and communicated through training. It is mandated that these processes should be followed; however, it is unlikely that deviations will be detected.
Managed: Management monitors and measures compliance with procedures, and takes action where processes appear not to be working effectively. Processes are under constant improvement and provide good practice. Automation and tools are used in a limited way.
Optimised: Processes have been refined to a level of good practice, based on the results of continuous improvement and maturity modeling with other enterprises. IT is used in an integrated way to automate the workflow.
Ref: COBIT 4.1: Framework, Control Objectives, Management Guidelines, Maturity Models. 2007, IT Governance Institute

285
Section D: Based on your experience, which maturity level best describes the following processes of the IT function
31. To define the IT procedures, organisation and relationships for compliance with governance requirements?
□ Non-existent □ Ad Hoc □ Repeatable □ Defined □ Managed □ Optimised
32. To manage IT human resources?
□ Non-existent □ Ad Hoc □ Repeatable □ Defined □ Managed □ Optimised
33. To acquire and maintain technology infrastructure?
□ Non-existent □ Ad Hoc □ Repeatable □ Defined □ Managed □ Optimised
34. To maintain a set of high-level designs for IT-enabled capabilities, which are options for forecasted*** business initiatives?
□ Non-existent □ Ad Hoc □ Repeatable □ Defined □ Managed □ Optimised
35. To implement a set of IT-enabled capabilities, which are readily configurable*** for forecasted*** business initiatives?
□ Non-existent □ Ad Hoc □ Repeatable □ Defined □ Managed □ Optimised
36. To assess any unexpected operational consequences, arising from existing information systems, to forecast*** business initiatives?
37. To develop and maintain a set of policies to support IT strategy? This includes policy intent, roles and responsibilities.
□ Non-existent □ Ad Hoc □ Repeatable □ Defined □ Managed □ Optimised
38. To establish and maintain an optimal co-ordination, communication and liaison structure within the IT function***
□ Non-existent □ Ad Hoc □ Repeatable □ Defined □ Managed □ Optimised
39. To create a strategic plan that defines how IT goals will contribute to the company’s strategic objectives?
□ Non-existent □ Ad Hoc □ Repeatable □ Defined □ Managed □ Optimised
40. To monitor the business sector, industry, technology, infrastructure, legal and regulatory environment trends?
□ Non-existent □ Ad Hoc □ Repeatable □ Defined □ Managed □ Optimised
41. To define and implement procedures to ensure the integrity and consistency of all data stored in electronic form?
□ Non-existent □ Ad Hoc □ Repeatable □ Defined □ Managed □ Optimised
42. To establish and maintain an information architecture*** to enable applications development and decision-supporting activities?
□ Non-existent □ Ad Hoc □ Repeatable □ Defined □ Managed □ Optimised
43. To analyse existing and emerging technologies, and plan which technological direction to realise the IT strategy?
□ Non-existent □ Ad Hoc □ Repeatable □ Defined □ Managed □ Optimised
44. To develop a feasibility study that examines the possibility of implementing the requirements and alternative courses of action?
□ Non-existent □ Ad Hoc □ Repeatable □ Defined □ Managed □ Optimised
45. To acquire and maintain applications in line with IT strategy and IT architecture***?
□ Non-existent □ Ad Hoc □ Repeatable □ Defined □ Managed □ Optimised
46. To continuously monitor specified service level performance, and report in a format that is meaningful to the stakeholders?
□ Non-existent □ Ad Hoc □ Repeatable □ Defined □ Managed □ Optimised
47. To report service desk activity to enable management to measure service performance and to identify trends?
□ Non-existent □ Ad Hoc □ Repeatable □ Defined □ Managed □ Optimised
48. To monitor IT performance to make sure that the right things are done, and in line with the set directions and policies?
□ Non-existent □ Ad Hoc □ Repeatable □ Defined □ Managed □ Optimised

286
Section E: Open-ended questions that you may comment on
49. How would your summarise the agility of your company’s IT function***?
50. Are there any other processes of your IT function*** that senses and responds to fluctuations in the
business environment?
51. In your opinion, is there anything that is relevant to agility*** and not addressed in the questions above?
Thank you for taking the time to complete this questionnaire. Your participation is greatly appreciated. Please return the questionnaire in the reply paid envelope provided, or to George Hobbs at the
Department of Information Systems The University of Melbourne
Victoria 3010
Glossary Agility an organizational capability consisting of:
• recognition of a business environment that fluctuates quicker than conventional planning cycles;
• the ability to sense environmental fluctuations; and • the ability to respond with options using existing information systems
Configurable where IT behaviour can be changed by altering parameter values to meet new business initiatives
Detailed design technical software application requirements
Forecast a statistical estimate of the occurrence of a future environmental event, which will require a business initiative
High-level design specification for software acquisition, taking into account the company’s technological direction and IT architecture
Information
architecture a model to facilitate the optimal creation, use and sharing of information by the business in a way that maintains integrity, and is flexible, functional, cost-effective, timely, secure and resilient to failure
Information Systems a portfolio of IT-enabled business initiatives
Information
Technology
electronic processes and networks
IT architecture the fundamental underlying design of the IT components of the business, the relationships amongst them and the manner in which they support the company’s objectives
IT function the personnel and their work processes that have a responsibility for the delivery of information systems, and under the control of the company. The IT function can be constituted from business stakeholders, in-house IT staff, external consultants, IT product vendors, and outsourcers of IT services
Orderly a business environment where change can be done within normal planning and budgetary cycles
Regulated a business environment where change is required by government, and not generated within the company
Stable a business environment where change is generated within the company, and not required by the environment
Turbulent
a business environment where change is required to meet competitive pressures or seek competitive advantage
287
12 September 2008
Australian Industry Survey of Agility in Information Systems Dear Sir/Madam,
As a valued client of Oakton, you are invited to participate in this Australian industry survey of Agility in Information Systems. Agility is the organisational capability to adapt information systems in response to fluctuations in the business environment. Agility is a high-ranking topic of interest in recent international surveys of IT management concerns, and has arisen from the recognition that contemporary business environments fluctuate quicker than conventional IT planning cycles. A research overview is enclosed.
This survey is a research activity of Oakton and the University of Melbourne. The research is supported under the Australian Research Council's Linkage Projects funding scheme (project LP0561936).
Please find the survey questionnaire enclosed. The questionnaire will take less than fifteen minutes of your time to complete. The questionnaire should be completed by a business manager or an IT manager with knowledge of information systems that IT-enable business initiatives. A short glossary of terms is provided to assist you in answering the questions.
A benefit of participating in this survey is that you will be sent a summary of the survey results in November 2008. The summary will assist you in benchmarking your company amongst others, and suggest organisational improvements that enable agility in your information systems.
This research is under the supervision of Associate Professor Rens Scheepers. If you have any questions regarding this questionnaire, please contact George Hobbs or Professor Scheepers at the University of Melbourne.
We look forward to receiving your completed questionnaire by Tuesday, 30 September 2008 at the Department of Information Systems at the below address. A return postage-paid envelope is supplied. Thank you for your valuable contribution to this important research effort.
George Hobbs James Watson Principal Researcher General Manager Department of Information Systems Planning & Development The University of Melbourne Oakton 0437 235 120 03 9617 0200 [email protected] [email protected]

288
Research Overview
THE UNIVERSITY OF MELBOURNE
DEPARTMENT OF INFORMATION SYSTEMS
PROJECT TITLE: Enabling Agility in Existing Information Systems: A Control
Structure for the IT Function
RESEARCHERS: George Hobbs (PhD Candidate) [email protected]
Associate Professor Rens Scheepers [email protected]
Research Aims
IT professionals are increasingly concerned with agility in information systems. As an management issue, agility was ranked first in a recent survey of CIOs of large US-based organisations [1]. The traditional approach of information system change acquired through long-range planning is less timely in today’s highly competitive, global marketplaces; and may constrain innovation [2]. The organizational capability of agility addresses this problem by sensing the business environment to forecast change, and responding with options to adapt existing information systems [3,4].
This research is concerned with how the IT function can leverage the existing information systems for emerging opportunities. The IT function is the personnel and their processes that have a responsibility for delivering IT-enabled business processes. The IT function can be sourced from in-house IT staff, external consultants, technology vendors, and outsourcers of IT services. The information systems of interest to the research are IT-enabled business initiatives. The research proposition is that effective control by the IT function is necessary for information systems to be agile.
There are two aims of the Australian industry survey of the research. First, the survey will provide a snapshot of Australian companies as to the maturity of their IT function to enable agility in existing information systems. Second, the survey attempts to correlate measures of the maturity of the IT function, and the frequency of agility outcomes.
Consent and Confidentiality
The project does not involve any risks. The only anticipated inconvenience for you is 15 minutes of your time taken to complete the questionnaire. The information you provide will be treated as confidential and used for research purposes only. Confidentiality of the information provided will be protected subject to any legal limitations. Access to the information will be restricted to the investigators only. Individual responses are not shared with Oakton. The identification number printed on the questionnaire will be used only to identify survey non-respondents for subsequent follow up.
As required by the University, data will be held in locked cabinets in the Department of Information Systems, and destroyed using confidential waste disposal techniques after five years following the last publication from the research. No individual person or organisation will be identifiable in the research report written up about the survey.
Your participation in the research project is voluntary. The research project has received clearance by the Human Research Ethics Committee. If you have any concerns regarding the conduct of the research please contact the Executive Officer, Human Research Ethics, The University of Melbourne: telephone 03 8344 2073 or fax 03 9347 6739.
Notes 1. Ives, B. and Mandviwalla, M., Key Issues for IT Management in 2004. 2004, Temple University. 2. Baskerville, R.L., Artful planning. European Journal of Information Systems, 2006. 15(2): p. 113-115. 3. Newman, D., Business Drivers and Issues in Enterprise Information Management. 2005, Gartner Inc.: Stamford. 4. Luftman, J. and McLean, E., Key Issues for IT Executives. MIS Quarterly Executive, 2004. 3(2): p. 89-104.

289
10 October 2008
Australian Industry Survey of Agility in Information Systems (Follow-Up Letter)
Dear Sir/Madam,
Last month we mailed you a questionnaire for the Australian Industry Survey of Agility in Information Systems. Our records indicate that your response has not been received. If you have returned the completed questionnaire in the last few days, please accept my apologies and disregard this letter.
If you have not had a chance to complete the questionnaire, we would very much appreciate it if you will use some of your valuable time to respond now.
The enclosed questionnaire contains the same questions as the one sent earlier. The questionnaire will take less than fifteen minutes of your time to complete. The questionnaire should be completed by a business manager or an IT manager with knowledge of information systems that IT-enable business initiatives. A short glossary of terms is provided to assist you in answering the questions.
This survey is a research activity of Oakton and the University of Melbourne. A research overview is enclosed. The research is supported under the Australian Research Council's Linkage Projects funding scheme (project LP0561936).
A benefit of participating in this survey is that you will be sent a summary of the survey results in November 2008. The summary will assist you in benchmarking your company amongst others, and suggest organisational improvements that enable agility in your information systems.
This research is under the supervision of Associate Professor Rens Scheepers. If you have any questions regarding this questionnaire, please contact George Hobbs or Professor Scheepers at the University of Melbourne.
We look forward to receiving your completed questionnaire by Friday, 31 October 2008 at the Department of Information Systems at the below address. A return postage-paid envelope is supplied. Thank you for your valuable contribution to this important research effort.
George Hobbs Principal Researcher Department of Information Systems The University of Melbourne 0437 235 120 [email protected]

290

291
Appendix B: Web survey materials
Agility in information survey home page

292
About the survey web page

293

294
Glossary of terms web page

295
Instructions to participants’ web page

296
Questionnaire web pages

297

298

299

300

301

302

303
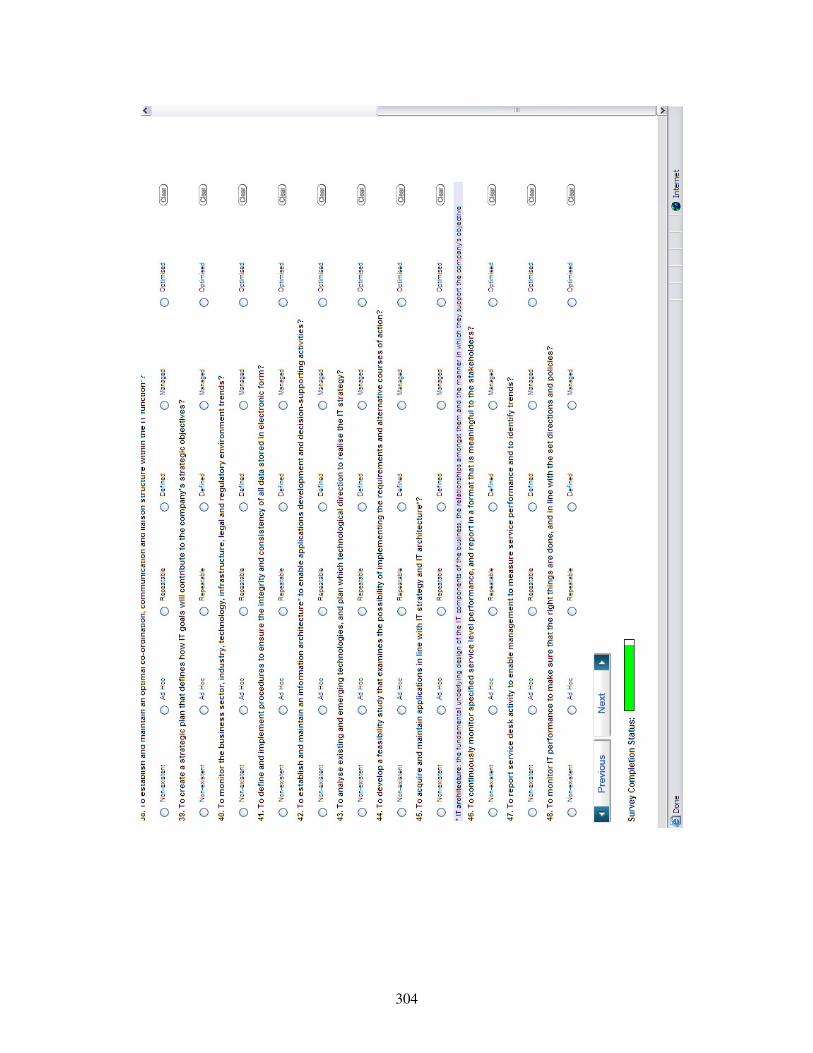
304

305

306

307
Appendix C: Papers from this thesis
Refereed journal papers
Hobbs, G.A. and Scheepers, R. 2010. "Identifying Capabilities for the IT Function to Create
Agility in Information Systems," Pacific Asia Journal of the Association for Information
Systems, (Pending). http://journal.ecrc.nsysu.edu.tw/pajais/
Ting-Peng Liang, the editor-in-chief of PAJAIS, invited a submission of the Hobbs
and Scheepers (2009) conference paper for publication in an 2010 special issue of
PAJAIS. Professor Liang made the invitation on 3 September 2009.
Refereed conference papers
Hobbs, G.A. and Scheepers, R. 2009. "Identifying Capabilities for the IT Function to Create
Agility in Information Systems," 13th
Pacific Asia Conference on Information Systems, R.
Bapna and V. Sambamurthy (eds.), Hyderabad: AIS Electronic Library (AISeL)
http://aisel.aisnet.org/pacis2009/20/
Hobbs, G.A. 2008. "Forming a Practice Perspective for Agility in Information Systems," 19th
Australasian Conference on Information Systems, A. Mills and S. Huff (eds.), Christchurch
New Zealand: Canterbury University Press, pp. 391-401.
http://www.bsec.canterbury.ac.nz/acis2008/Papers/acis-0116-2008.pdf
Woolley, B., and Hobbs, G.A. 2008. "Agility in Information Systems," 19th Australasian
Conference on Information Systems, A. Mills and S. Huff (eds.), Christchurch New Zealand:
Canterbury University Press, pp. 1079-1088.
http://www.bsec.canterbury.ac.nz/acis2008/Papers/acis-0117-2008.pdf
Industry papers
Hobbs, G.A. 2008. "Australian Industry Survey of Agility in Information Systems," Melbourne:
Oakton, pp. 5.
Woolley, B., and Hobbs, G. A. 2008. Agility in Information Systems: A White Paper of Oakton
and the University of Melbourne. Melbourne: Oakton
308
Other conference presentations
Hobbs, G.A. and Scheepers, R. 2007. Enabling Agility in Existing Information Systems: A
Control Structure for the IT Complement. Organizations and Society in Information Systems
(OASIS) Workshop, Montréal Canada
http://www.ryerson.ca/~cmiddlet/ifip82/OASIS/abstracts.pdf
Hobbs, G.A. 2008. Reconciling Theoretical and Practice Perspectives on Agility in Information
Systems. Organizations and Society in Information Systems (OASIS) seminar series.
Presented 2 May at the Department of Information Systems at the University of Melbourne
Hobbs, G. A. 2008. Combining Delphi & Focus Group Research Methods. Information Systems
Doctoral Consortia. Presented 28 April at the University of Melbourne
http://web.dis.unimelb.edu.au/isrpg/Events/phdConsortium/dc2008/home.html
Hobbs, G..A. 2008. Industry Links with Doctoral Research: Experience of an Information
Systems study. The PhD Colloquia: Research beyond the Academy: Industry Links,
Commercialisation, Knowledge Transfer. Presented 1 May at the Gryphon Gallery, the
University of Melbourne
www.gradstudies.unimelb.edu.au/programs/community/colloquia.html
Hobbs, G. A. 2008. “Enabling Agility in Existing Information Systems: A Control Structure for
the IT Function”, 19th Australasian Conference on Information Systems Doctoral
Consortium, 2 December 2008, Christchurch New Zealand
http://www.bsec.canterbury.ac.nz/acis2008/consortium.html
Hobbs, G. A. 2009. Enabling agility in existing information systems: A capability structure for
the IT function. Organizations and Society in Information Systems (OASIS) seminar series.
Presented 7 May at the Department of Information Systems at the University of Melbourne

Minerva Access is the Institutional Repository of The University of Melbourne
Author/s:
HOBBS, GEORGE ARTHUR
Title:
Enabling agility in existing information systems: a capability structure for the IT function
Date:
2010
Citation:
Hobbs, G. A. (2010). Enabling agility in existing information systems: a capability structure for
the IT function. PhD thesis, Science, Department of Information Systems, The University of
Melbourne.
Persistent Link:
http://hdl.handle.net/11343/35442
File Description:
Agility in existing information systems: a capability structure for the IT function
Terms and Conditions:
Terms and Conditions: Copyright in works deposited in Minerva Access is retained by the
copyright owner. The work may not be altered without permission from the copyright owner.
Readers may only download, print and save electronic copies of whole works for their own
personal non-commercial use. Any use that exceeds these limits requires permission from
the copyright owner. Attribution is essential when quoting or paraphrasing from these works.