en smartview 2.1 help - inspectortools.com€¦ · · 2009-12-10en_smartview_2.1_help 2. insert...
TRANSCRIPT

en_SmartView_2.1_Help

iii
Table of Contents Introduction ..................................................................................................................... 1 SmartView Basics ........................................................................................................... 5 Viewing .......................................................................................................................... 11
Viewing the IR-Fusion Visible Light Image ................................................................ 14 Using the Image Editor .................................................................................................. 17
Editing Image Annotations ......................................................................................... 24 Editing Image Comments .......................................................................................... 26
Annotations ................................................................................................................... 27 Annotation Drag and Drop ......................................................................................... 32 Voice Annotation........................................................................................................ 33
Generating Reports ....................................................................................................... 35 Report Templates ...................................................................................................... 38 Activating Report Template Editing ............................................................................ 39 Modifying Report Templates ...................................................................................... 40 Creating a Report Template ...................................................................................... 42 Report Template Elements ........................................................................................ 42 Report Template Element Attributes .......................................................................... 44
Using the Clipboard ....................................................................................................... 47 Getting Accurate Temperatures .................................................................................... 51
Basic Infrared Radiometry ......................................................................................... 51 Glossary ........................................................................................................................ 57 Index ............................................................................................................................. 59

Introduction Welcome to SmartView® SmartView Help File Revision 2.0.6 SmartView is the powerful, yet easy-to-use, analysis and reporting software provided on a CD-ROM disk included with your system. SmartView, together with your thermal imager, enables you to:
• Transfer thermographic images to a computer and efficiently manage them • Optimize and analyze your infrared and visible light control images • Create and print detailed, professional reports containing important image
data
Understanding the System Requirements Before installing and using SmartView™, be sure that your computer meets the following system requirements: Software Requirements
• Microsoft® Windows™ 2000/XP/Vista. • A Web browser for product registration and viewing FAQs: Microsoft®
Internet Explorer 5.0 or newer. • Microsoft Word 2007 for report template modification (optional)
Hardware Requirements
Memory card reader• . • 500 MB available disk space (1 GB for Vista), not including space
requirements for Web browser and Microsoft® Word. • 16-bit color, 1024 x 768 resolution video or better. • Color printer (for printing your images). • CD-ROM drive (for installing SmartView software).
Installing SmartView To install SmartView software:
1. Close all programs.
1
en_SmartView_2.1_Help
2. Insert the SmartView CD-ROM disk into your CD-ROM drive. If the Autorun feature is enabled on your system, the installation begins automatically; go to step 5.
3. From the Start menu, select Run if Autorun is not enabled. 4. Type <D:\setup> (substitute the appropriate letter of your CD-ROM drive for ”D”
if your drive letter is different). 5. Follow the on-screen instructions to complete the installation.
Uninstalling SmartView Software To uninstall SmartView software from your computer:
1. Open the Windows control panel. 2. In the Windows control panel, select Add or Remove Programs. 3. Select SmartView and click the appropriate button to remove/uninstall
SmartView software. 4. Follow any on-screen instructions displayed.
Note: Button names vary depending on the version of Windows™ you are running.
For example, in Windows™ XP, select Change/Remove.
Your Card Reader To transfer images from your thermal imager to your computer, use the memory card reader included with your system. This device connects to a USB port. To install and operate your card reader, follow the instructions that come with the device.
Reporting Problems If you have problems installing or operating SmartView, or if you wish to report a software bug, contact Technical Support. When reporting software bugs, please provide the following information:
1. The operating system you are running. 2. The computer make and model you are using. 3. The SmartView version you are running. 4. A detailed description of the problem and how it is produced. Be sure you
accurately spell any error messages you receive. Screen shots or error reports are preferred.
Contact Us Technical Support:
From USA: (800) 760-4523
2
Introduction
International: 1.425.446.5500
Address:
Fluke Thermography 3550 Annapolis Lane N. Suite 70 Plymouth, Minnesota 55447 USA Fluke Corporation 6920 Seaway Blvd. Everett, WA 98206 USA
Web: www.fluke.com
License Agreement © 2006-2008 Fluke Corporation. The information contained in this document is subject to change without notice. Fluke, the Fluke logo and SmartView are trademarks of Fluke Corporation. Windows is a trademark of Microsoft Corporation. Pentium is a trademark of Intel Corporation. All other trademarks are the property of their respective holders. END USER LICENSE AGREEMENT (EULA) The enclosed software product is furnished subject to the terms and conditions of this agreement. Retention of the software product for more than thirty days, opening the sealed wrapper surrounding the product, or use of the product in any manner will be considered acceptance of the agreement terms. If these terms are not acceptable, the unused product and any accompanying written material should be returned promptly to Fluke or the place of purchase for a full refund of the license fee paid. 1. GRANT OF LICENSE. Fluke Corporation (Fluke) grants you the right to use the enclosed software in accordance with the terms of this EULA. This grant of license does not include the right to modify or distribute the software. 2. TITLE, COPYRIGHT AND TRADEMARK. This software product is owned by Fluke or its suppliers and is protected by United States copyright laws and international treaty provisions. Therefore, except for the rights granted to you above, you must treat the software product like any other copyrighted material, and any copies must include the proper copyright notice.
3
en_SmartView_2.1_Help
4
3. RESTRICTIONS. You may not reverse engineer, decompile, or disassemble the software. If the software product is an update, any transfer must include the update and all prior versions. You may use the software only in conjunction with the Fluke products for which it is intended. You may not export or re-export the software to any country to which such export or re-export is restricted by law or regulation of the United States, or any other government having jurisdiction, without prior permission from Fluke. 4. TERM. This license agreement is effective upon your acceptance and shall remain in effect until terminated by (a) written notification to Fluke or (b) a failure on your part to comply with the license agreement. Upon termination of the license agreement, you shall return to Fluke or destroy all copies of the software product and associated written materials. 5. OTHER AGREEMENTS. Where terms or conditions of this agreement conflict with terms or conditions of other agreements, this agreement supersedes other agreements. 6. LIMITED WARRANTY. Fluke warrants that the software product will perform in its intended environment substantially in accordance with the accompanying written materials for a period of 90 days from the date of license acceptance. Fluke further warrants that the original copy of the software has been recorded on non-defective media. Fluke does not warrant that the software will be error free or operate without interruption. 7. REMEDIES. Fluke’s entire liability and your exclusive remedy shall be at Fluke’s option, (a) the return of the price paid for the product, or (b) repair or replacement of the software product that does not meet the limited warranty. This limited warranty is void if failure of the product has resulted from accident, abuse, or misapplication. Any replacement software product will be warranted for the remainder of the 90-day original warranty period or 30 days, whichever is longer. 8. NO OTHER WARRANTIES. FLUKE DISCLAIMS ALL OTHER WARRANTIES, EITHER EXPRESS OR IMPLIED BUT NOT LIMITED TO IMPLIED WARRANTIES OF MERCHANTABILITY AND FITNESS FOR A PARTICULAR PURPOSE, WITH RESPECT TO THE SOFTWARE PRODUCT AND THE ACCOMPANYING WRITTEN MATERIALS. In no event shall Fluke or its suppliers be liable for any damages whatsoever (including, without limitation, indirect, consequential, or incidental damages, damages for loss of business profits, business interruption, loss of business information, or other pecuniary loss) arising out of the use of or inability to use this software product, even if Fluke has been advised of the possibility of such damages. 9. GOVERNING LAW. This agreement and license shall be governed in the United States by the laws of the State of Washington, U.S.A., and elsewhere by the laws of the country within which the agreement is made.

SmartView Basics Saving and Transferring Your Images To save the images you capture with your thermal imager, use the removable memory card included with your system. To transfer the images saved on the memory card to your computer, use the card reader included with your system.
Starting SmartView When you install the SmartView™ software on your computer, a SmartView startup icon is placed on your Windows™ desktop and in the Windows Start menu. To start SmartView after installing the software, double-click the SmartView icon on your desktop. Or, click the SmartView icon from the Windows Start menu (inside the "Fluke" folder using the standard installation).
Using the SmartView Main Window Use the SmartView main window to access SmartView functions. The SmartView window elements include:
• Title Bar: Located across the top of the SmartView window. Contains controls to minimize, maximize, and close the SmartView window
• Menu Bar: Located under the Title Bar. Contains a number of drop down menus used to launch various SmartView functions
• Tool Bar: Located under the Menu Bar. Contains a number of controls, from left to right:
Open image file button: Click this to open an image •
Save active image button: Click this to save an active image •
Save all images button: Click this to save all open images •
Edit active image button: Click this to open the image editing window to edit the active image. (Note: You can also double-click the active image to open the image editing window
•
Quick report on all images button: Click this to open report template and generate report for the active image
•
Annotation File Editor button: Click this to open the annotation file editor to create or modify an annotation file
•
Active Image Window
5

en_SmartView_2.1_Help
• Although you can have multiple images open at a time, there can be only one "active" image at a time. Many SmartView controls operate on the active image. An active image is open in the SmartView workspace and its window is highlighted and brought to the front of the workspace if more than one image is open.
To activate an open image window:
1. Left-click on the image window you want. 2. Double-click on the image to open the Image Edit Window.
Image Icon Description:
Infrared image • Infrared image with text annotations • IR-Fusion image • IR-Fusion image with text annotations •
Using Workspaces to Organize Images Images you transfer from your thermal imager may be stored in several different folders on your computer's hard drive or company network. Use SmartView workspaces and the following recommendations to organize your images:
• Keep images from a single inspection or route together • Group all images of the same target object together. Then,
• Determine the relative health of a piece of equipment by comparing the current condition versus previous inspection conditions
• Verify maintenance corrected the thermal symptom • Verify repair work in a before and after scenario
Setting Preferences The Preferences dialog box is where you can choose most of the SmartView settings. Application Tab Sorting Images When you have multiple images open, you can sort them either by the time the image was taken or by the image file name. To select how image windows are sorted:
1. Click Edit on the SmartView Menu Bar and select Preferences…. 2. Click on the Application tab.
6
SmartView Basics
3. Click the down arrow by the "Windows Sort Method" box and select either Image Time or File Name.
4. Click OK.
Changing Language Setting To change the SmartView language setting:
1. Click Edit on the SmartView Menu Bar and select Preferences…. 2. Click on the Application tab. 3. Click the down arrow by the "Language" box and select the language you
want. 4. Click OK.
Note: You must close and restart SmartView before the language change takes effect.
Changing Temperature Unit The temperature unit controls enable you to change the temperature unit (ºF, ºK, ºC) associated with an image. To change the temperature unit:
1. Click Edit on the SmartView Menu Bar and select Preferences…. 2. Click on the Application tab. 3. Click the down arrow by the "Temperature Unit" box and select the
temperature unit you want. 4. Click OK.
Note: The Fahrenheit temperature unit is not available when the Japanese language is active.
Changing the Fixed Image Setting When you change the emissivity value of an image, the image appearance changes because the image pixel temperatures change as you adjust the emissivity and are then re-colored accordingly. Checking the box next to the "Images stay fixed even when temperatures change" setting causes the color palette values to change whenever the image’s emissivity value is changed; however, the image does not appear to change visually even though the image temperatures have. To change the Fixed Image setting:
1. Click Edit on the SmartView Menu Bar and select Preferences…. 2. Click on the Application tab. 3. Check the box to enable fixed images. Disable the check box to disable fixed
images. 4. Click OK.
Changing the Marker Properties Setting When you place a marker on an image, you may want to edit the marker properties immediately after placing the marker.
7

en_SmartView_2.1_Help
To change the edit marker properties setting:
1. Click Edit on the SmartView Menu Bar and select Preferences…. 2. Click on the Application tab. 3. Check the box to have SmartView automatically open the marker properties
window after placing a marker. Disable the check if you do not want the marker properties window to automatically open.
4. Click OK. Reports Tab Report Generation Option You can choose to generate a report in PDF or .docx format. The PDF format can be utilized in Adobe Acrobat software or similar. The .docx format is natively supported by Microsoft Word 2007. The .docx format is also supported in earlier versions of Microsoft Word by using an Office compatibility tool provided by Microsoft. Please visit www.microsoft.com and search for "Office compatibility". Download the Office compatibility pack for Word, Excel, and PowerPoint 2007 file formats. You may also generate a PDF document from a docx document by using the Save As or Print options within MS Word 2007. This is useful in the event you need to modify or add to your report after using SmartView to generate the report. Note: You may need to download and install the "Save as PDF or XPS add-in" from Microsoft. To change the generated report format:
1. Click Edit on the SmartView Menu Bar and select Preferences…. 2. Click on the Reports tab.
• Check the box next to the "PDF" setting to generate the report in .PDF • Check the box next to "MS Word docx" to generate the report in .docx
format • Check the box next to "PDF and MS Word docx to generate the report in
both PDF and docx formats 3. Click OK.
To change the report viewing option:
1. Click Edit on the SmartView Menu Bar and select Preferences…. 2. Click on the Reports tab. 3. Check the box next to the "View Report Upon Generation" setting to view the
report immediately after completion. Disable the check box to save the report without immediately viewing the report. A "Save As..." dialog box will appear to allow you to name the report and save it in a convenient location.
8
SmartView Basics
4. Click OK. Files Tab Settings File The settings file stores the settings included in the preferences window, report wizard, and quick report. You may have multiple settings files for different users much in the same way some cameras store unique user settings. The settings file can also be used to transfer SmartView settings from one computer to another, or across software upgrades. SmartView will automatically update the settings file as you modify your settings. If you would like to save your current settings prior to making settings changes, use the "Save As..." option. If you would like to use a previous settings file, use the "Open File" option. Note: The default location for the settings file is the Microsoft recommended user settings directory. You may change the location of the settings file. To change the settings file SmartView uses:
1. Click Edit on the SmartView Menu Bar and select Preferences…. 2. Click on the Files tab. 3. Click on "Open File". 4. Locate the settings file you wish to use and click Open. 5. Click OK.
To create a new settings file:
1. Click Edit on the SmartView Menu Bar and select Preferences…. 2. Click on the Files tab. 3. Click on "Save As..." to create a new settings file based on your current
settings. 4. Click OK.
Report Template Directory The report template directory setting is used to indicate the location where report templates are stored. To change the report template directory:
1. Click Edit on the SmartView Menu Bar and select Preferences…. 2. Click on the Files tab. 3. Click on "Change" to change the report template directory. 4. Click OK.
9

en_SmartView_2.1_Help
10
Note: The default report template directory is "C:\Program Files\Fluke\SmartView 2.0\Report Templates". This assumes a standard installation. Insight settings Tab Select Default Comm Port The communications port the computer uses to communicate with the IR-InSight thermal imager is set with the "Select Default Comm Port" control. SmartView automatically searches for a valid communication port when the thermal imager is connected to the computer. To change the default comm port setting:
1. Click Edit on the SmartView Menu Bar and select Preferences…. 2. Click on the Insight settings tab. 3. Click the down arrow under the "Select Default Comm Port" box to adjust the
communication port. 4. Click OK.
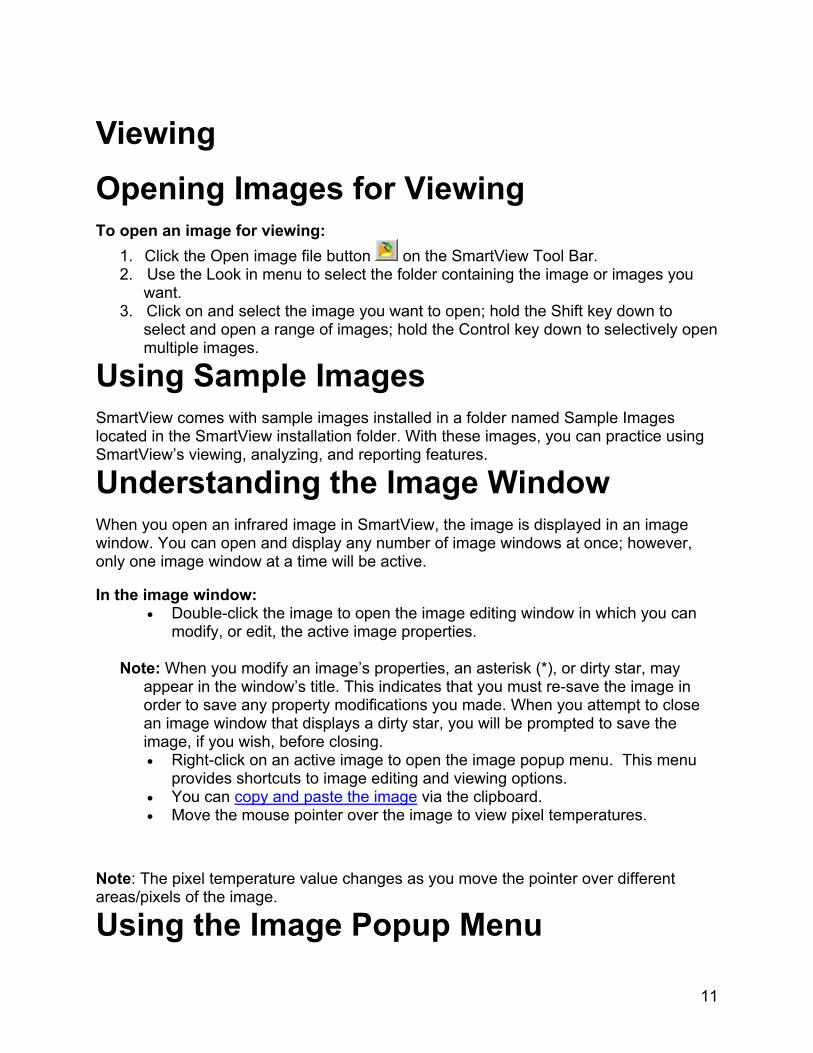
Viewing Opening Images for Viewing To open an image for viewing:
1. Click the Open image file button on the SmartView Tool Bar. 2. Use the Look in menu to select the folder containing the image or images you
want. 3. Click on and select the image you want to open; hold the Shift key down to
select and open a range of images; hold the Control key down to selectively open multiple images.
Using Sample Images SmartView comes with sample images installed in a folder named Sample Images located in the SmartView installation folder. With these images, you can practice using SmartView’s viewing, analyzing, and reporting features.
Understanding the Image Window When you open an infrared image in SmartView, the image is displayed in an image window. You can open and display any number of image windows at once; however, only one image window at a time will be active. In the image window:
• Double-click the image to open the image editing window in which you can modify, or edit, the active image properties.
Note: When you modify an image’s properties, an asterisk (*), or dirty star, may
appear in the window’s title. This indicates that you must re-save the image in order to save any property modifications you made. When you attempt to close an image window that displays a dirty star, you will be prompted to save the image, if you wish, before closing. • Right-click on an active image to open the image popup menu. This menu
provides shortcuts to image editing and viewing options. • You can copy and paste the image via the clipboard. • Move the mouse pointer over the image to view pixel temperatures.
Note: The pixel temperature value changes as you move the pointer over different areas/pixels of the image.
Using the Image Popup Menu
11

en_SmartView_2.1_Help
The image popup menu provides shortcuts to image editing and viewing options. To open an active image’s popup menu, right-click on an active image window. With the Image Popup Menu, you can:
• Click ”Copy” to copy the image to the clipboard. • Click ”Edit…” to open the image editing window. • Click "Paste Annotations" to paste annotations copied from the annotation
editor or from another image. • Click "Export" to export the file as an image or temperature data. • Click ”View image info” to open the image info window. • Click ”View graph” to open the graph window. • Click ”View data” to open the marker data window. • Click "View Visible" to open the visible window. • Click ”Zoom” to adjust zoom level in or out.
Viewing Pixel Temperatures To view individual pixel temperatures in an image using the image window:
1. Move the mouse pointer to the area of the image, or pixel, of interest. To view individual pixel temperatures in an image using the image editor:
1. Double-click the active image to open the image editor. 2. Adjust the image emissivity and background temperature to appropriate
values. 3. In the image that appears in the image editor window, move the mouse
pointer to the area of the image, or pixel, of interest. Note: The pixel temperature value changes as you move the pointer over different areas/pixels of the image.
Using the Image Info Window
The image info window displays details about the active image such as where the image is stored, the time and date the image was captured and image properties such as the emissivity and background temperature values. To open the image info window:
1. Right-click on an active image window to open the image popup menu. 2. Select "View image info" on the menu. The image info window appears below
the image. To view image info from the image editing window:
1. Double-click an active image to open the image editing window. 2. Click the Image Info tab below the image.
12

Viewing
Using the Marker Data Window The marker data window displays values and statistics related to the markers you place on your image. To view marker data:
1. Right-click on an active image window to open the image popup menu. 2. Select "View data" on the menu. The marker data appears below the image.
To view marker data from the image editing window:
1. Double-click an active image to open the image editing window 2. Click the Marker Data tab below the image.
To access marker properties from the image edit window:
1. Click on the "Select markers" icon in the draw mode menu, then double-click a marker on the image to open a marker properties window
2. Double-click on the marker label in the Marker Data tab The values displayed for each marker are:
• Label: Used to identify the marker • Emissivity: Emissivity associated with the marker. It affects the marker’s
temperature-based statistics. • Background Temp: Background temperature associated with the marker. It
affects the marker’s temperature-based statistics. • Min: Minimum temperature • Ave: Average temperature • Max: Maximum temperature • Stdev: Standard deviation • Unit: Temperature unit
Note: Click on a column header in the marker data table to sort the table by that column header.
Using Graphs Several graphs are available for advanced analysis in SmartView. SmartView offers line profiles, histograms, and 3D-IR™ graphs. Line profile graphs display the pixel temperatures for a line marker. The user may view the temperatures on the line or the X or Y temperature component of the line. The 3D-IR™ graph displays the three dimensional plot of the thermal image. IR-Fusion images have the visible light portion of the image displayed on the floor of the 3D-IR™ map as a reference. A histogram is a graph representing the distribution of a statistical frequency, or rate of recurrence. In SmartView, you can open a histogram window to see a histogram of an image’s pixels by temperature. The image’s temperature range is divided into equal-sized bins. The
13
en_SmartView_2.1_Help
height of the graph indicates how many pixels have a temperature within the range of that bin. To open a Graph window:
1. Right-click on an active image window to open the image popup menu. 2. Select View graph on the menu. The Graph window appears below the
image. 3. Select the graph type from the "Type" control.
To view the image graph from the image editing window:
1. Double-click an active image to open the image editing window. 2. Click the Graph tab below the image. 3. Select the graph type from the "Type" control.
Graph types:
1. Line Profile - displays the pixel temperatures at every point on the line. 2. X Profile - displays the pixel temperatures for the horizontal or X-axis
component of the line marker. 3. Y Profile - displays the pixel temperatures for the vertical or Y-axis
component of the line marker. 4. Histogram - displays the temperature distribution of the pixels by grouping
the pixels into temperature bins. 5. 3D-IR™ - displays the pixel temperatures for the image in a three
dimensional representation. The X and Y axes consist of the pixel locations on the image and the Z axis is the temperature value at the corresponding (X,Y) location in the image.
Note: Click the chart area of the 3D-IR™ graph with the left-click mouse button and hold the button while you move your mouse to rotate the graph.
Note: Use the clipboard to copy and paste the graph to another application. Right-click on the graph image and choose Copy from the popup menu.
Viewing the IR-Fusion Visible Light Image The Visible window displays the visible light portion of IR-Fusion images. Note: SmartView displays only visible light images from IR-Fusion enabled thermal imagers. To open a Visible Light Image window:
1. Right-click on an active image window to open the image popup menu. 2. Select View Visible on the menu. The Visible window appears below the
image.
14
Viewing
15
To view the Visible Light Image from the image editing window: 1. Double-click an active image to open the image editing window. 2. Click the Visible tab below the image.
Note: The "Full Frame" check box controls the size of the visible light image displayed both in SmartView and on the report. Enable the control to view the entire visible light image. Disable the control to display the visible light image in the same ratio as the infrared image.

Using the Image Editor Using the Image Editor The SmartView Image Editor enables you to quickly and easily enhance and adjust your infrared images. Use the Image Editor to:
• Change the color palette and adjust the level and span • Utilize controls for IR-Fusion images • View the IR-Fusion visible light image • Analyze the image using markers • Add reference images • Create, review, and edit text annotations • Perform graphical analysis • Add text comments to the image • Create an isotherm or add a color alarm • Adjust the emissivity and background temperature values
To open the Image Editor, double-click on an active image. Note: From the image editor, press the Escape (Esc) key at any time to close the editor and return to the active image.
Using the Color Palette Although all SmartView color palettes can be used with any image, you may find that some color palettes work better than others for analyzing your images depending on the situation. SmartView displays the detailed color palette to the right of the main image and displays the color palette control on the "Analysis" tab in the Image Edit Window. To change the color palette (temperature range bar):
1. Double-click the active image to open the image editor. 2. Click on the "Analysis" tab. 3. Click on the "Colors" down arrow in the "Palette" control area to open a menu of
color palette options. 4. Click on the palette option you want; the color palette changes accordingly. 5. Click OK in the image editor to save the change.
To change the saturation colors on the color palette:
1. Double-click the active image to open the image editor. 2. Click on the "Analysis" tab. 3. Click on the "Saturation" down arrow in the "Palette" control area to open a menu
of saturation color options.
17
en_SmartView_2.1_Help
4. Click on the saturation color option you want; the color palette changes accordingly.
5. Click OK in the image editor to save the change. To change the color palette temperature (temperature range) values:
1. Double-click the active image to open the image editor. 2. Click on the Analysis tab; a set of sliding boxes that indicate the lower span
(bottom set), level (middle set), and upper span (top set) pixel temperature values, appears to the left of the temperature range bar.
3. Slide the boxes up or down along the temperature bar to move in larger increments; use the set of up/down arrows next to the boxes to move in smaller increments, or type values in the boxes to change to a specific temperature value.
Note: As you change the minimum or maximum values, or span, the center value, or level, changes accordingly. And, if you move the level value, both the lower span and upper span values change accordingly.
Using Color Alarms and Isotherms In general scientific terminology, an isotherm is set of curves on a thermogram (an image you capture with your thermal imager), that mark different points that have the same temperature. In SmartView, an isotherm is an image that highlights all image pixels within a specified temperature range. These ”in-range” pixels are displayed in a single color so that they stand out from the rest of the image. A color alarm is an advanced form of an isotherm and is available on IR-Fusion images. Palette colors mark the image where the color alarm temperature criteria are met. The color alarm function allows you to highlight target object areas of thermal interest by selectively blending visible light and infrared images. You can enable a color alarm based on high, low, or high and low temperature values. You can also specify a temperature range and enable a color alarm for temperatures within that range. With the color alarm function enabled, target object temperatures are highlighted in the infrared color (based on the color palette settings) that corresponds to the color alarm temperature(s) you’ve set. Note: Color alarms work in both full screen and picture-in-picture view. With the on screen alarm disabled, the entire infrared image is blended with the visible light image according to the IR-Fusion blend setting. To enable a color alarm and define the color alarm temperature criteria:
1. Double-click the active image to open the image editor, then click on the Analysis tab.
2. Click on the down arrow in the "Color Alarm" control area to open a menu of color alarm options.
3. When "Color Alarm" is selected, the "Range" down arrow is activated. • Four options are available:
18
Using the Image Editor
1. Alarm above threshold - objects in the image with temperatures above the threshold temperature will display in the appropriate palette colors
2. Alarm below threshold - objects in the image with temperatures below the threshold temperature will display in the appropriate palette colors
3. Alarm inside range - objects in the image with temperatures between the threshold temperatures will display in the appropriate palette colors
4. Alarm outside range - objects in the image with temperatures above and below the threshold temperatures will display in the appropriate palette colors
4. Set the color alarm temperature thresholds by sliding the box/boxes up or down along the right side of the temperature range bar (color palette) to move in large increments, clicking the set of up/down arrows next to the boxes to move in small increments, or typing the temperature value.
To enable an isotherm and define isotherm temperature range:
1. Double-click the active image to open the image editor, then click on the Analysis tab.
2. Click on the down arrow in the "Color Alarm" control area to open a menu of color alarm options.
3. When Isotherm is selected, a set of sliding boxes, which indicate the minimum and maximum isotherm temperature range values, appears to the right of the temperature range bar (color palette).
4. Set the isotherm temperature range by sliding the boxes up or down along the temperature range bar to move in large increments, clicking the set of up/down arrows next to the boxes to move in small increments, or typing the temperature value.
5. Click the "Isotherm Color" button to open a range of color options; click on the color you wish to represent the isotherm and click OK.
Note: Once you set the isotherm or color alarm range, you can click on the
isotherm/color alarm temperature band on the color palette and slide it up and down the temperature bar to adjust—the color alarm's minimum and maximum values change accordingly.
Changing Emissivity and Background Temperature Changing Emissivity and Background Temperature The emissivity control enables you to change the emissivity associated with an image. To change an image’s emissivity value:
19
en_SmartView_2.1_Help
1. Double-click the active image to open the image editor, then click on the Analysis tab.
2. Click in the "Emissivity" value box and type in the emissivity value you want, or use the up/down arrows next to the emissivity value to scroll to the value you want.
Note: For reference, click the large down arrow to open a list of common materials and their emissivity values. To learn more about the importance of using the correct emissivity value to capture quality images and interpret them properly, see Basic Infrared Radiometry and Emissivity Quick Tips sections. The background temperature control enables you to change the background temperature associated with an image. To change an image’s background temperature:
1. Double-click the active image to open the image editor, then click on the Analysis tab.
2. Click in the Background Temp: value box and type in the background temperature value you want or use the up/down arrows next to the background temperature value to scroll to the value you want.
Note: To learn more about the importance of using the correct background temperature value to capture quality images and interpret them properly, see Basic Infrared Radiometry and Emissivity Quick Tips sections.
Using Image Markers You can annotate images with various types of markers to help interpret or analyze an image. You can use markers to highlight a particular area or point of interest in an image. Or, you can draw markers over critical objects whose minimum, maximum, or average temperature must be in a particular range. The marker statistics make monitoring critical objects simple. You can use the following SmartView Markers:
• Center Point Marker • Center Box Marker • Hot and Cold Cursor Markers • Point Markers • Line Markers • Rectangle Markers • Ellipse Markers • Polygon Markers
To add center point, center box, and/or hot or cold cursor markers or hide all markers:
1. Double-click the active image to open the image editor.
20
Using the Image Editor
2. Click on the Analysis tab, then click in the box of the marker(s) you want to add.
3. Use the "Display markers" box to display or hide the markers on the image. 4. A check mark means the feature is enabled. 5. Click again to disable the feature.
Note:The markers will not be deleted when hiding the markers. To add user defined markers:
1. Double-click the active image to open the image editor. 2. Click on the Analysis tab, then • For point markers:
• Click on the Draw Point Markers icon in the draw mode menu bar, then click on the image where you want to place the point
• For line, rectangle, or ellipse markers:
• Click on the appropriate draw marker icon Line marker •
Rectangle marker •
Ellipse marker • • On the image, left-click and then hold mouse button to establish a starting
point, then drag the mouse to the ending point and release the mouse button to complete the marker
• For polygon markers:
• Click on the Draw polygon marker icon in the draw mode menu bar • Left-click on the image to start the first segment. Left-click again at the
position where the next segment is to start. Repeat until all the segments you want, except for the final segment, have been drawn
• Double-click at the start of the last segment drawn. The final segment is automatically drawn from the double-click position to the start of the first segment, forming a closed polygon
To view and edit image properties: 1. Double-click the active image to open the image editor. 2. Click on the Analysis tab, then • Click the Select markers icon in the draw mode menu, then double-click a
marker on the image to open a marker properties window • Click the Display tab
• Create a name for the marker • Use the check boxes to select the text or statistics to display on the
image
21
en_SmartView_2.1_Help
• The marker name • Minimum temperature • Average temperature • Maximum temperature
• Adjust the location of the marker text by using the "Label Placement" control
• Adjust the color of the marker text by clicking on the down arrow in the "Color Selection" control area
• Browse for colors or create custom colors • Click the Annotations tab
• Add annotations to the marker • Click the Emissivity tab
• Adjust the emissivity and background temperature of the marker Example: One object in an image may have a different emissivity value from other objects in the image. Draw a marker around the first object and change the emissivity value of the marker by double-clicking the marker. The marker temperature statistics reflect the new emissivity.
Note: The "flyover" temperature displayed on the image will not reflect the new emissivity value. Only the marker statistics will reflect the new emissivity Note: Specific statistical marker properties depend on the marker type. All markers have a name, emissivity, and background temp. Point markers can display name and point temp. All other markers can display a name and minimum, maximum, and average temperature. To view statistics related to the markers you have placed:
From the SmartView window:
1. Right-click on an active image window to open the image popup menu. 2. Select View data on the menu.
From the image editing window:
1. Double-click an active image to open the image editing window 2. Click the Marker Data tab below the image.
Note: Press the Escape (Esc) key at any time to return to the active image.
Removing Markers
22
Using the Image Editor
To remove markers:
1. Double-click the active image to open the image editor, then Click on the Analysis tab.
2. Click on the Select Markers icon in the draw mode menu. 3. Click the marker on the image you want to delete. 4. Press the Delete (Del) key on your keyboard. 5. Repeat Steps 3-4 for each additional marker you want to delete. 6. Click ”OK” to save. 7. Save the image before closing by clicking ”File” on the Menu Bar, then clicking
”Save” to keep the same file name, or ”Save As” to create a new file.
Modifying Marker Properties To modify marker properties:
1. Double-click the active image to open the image editor. 2. Click on the "Select markers" icon in the draw mode menu at the top of
the Image Edit Window. 3. Double-click a marker on the image or Double-click on the marker label in the
Marker Data tab to open a marker properties window. • Click the Display tab to:
• Edit/create a name for the marker • Select to display the marker name on the image • Select to include temperature data on the image (choices include
temperature for point markers and minimum, average, and maximum for all other marker types)
• Adjust the placement and color of the marker label and/or text • Click the Annotations tab to add annotations to the marker • Click the Emissivity tab to adjust the marker emissivity and/or background
values
Working with IR-Fusion™ Images SmartView enables you to change the blend level of your IR-Fusion images from full infrared (IR) to full visible light (VL) or some combination in between. You can also modify other IR-Fusion settings including the display view (full screen or picture-in-picture), the Color Alarm, and the Parallax Adjustment. Adjusting IR-Fusion image settings
• Double-click the active image to open the image editor Adjusting the blend Level
• Slide the "Blending Level" control between "Full Infrared" and "Full Visible" to adjust the image contribution from 100% infrared to 100% visible light
23

en_SmartView_2.1_Help
Picture in Picture • Click in the "IR-Fusion Picture in Picture" control to create an infrared
'window' surrounded by a visible light frame to easily identify problems, while maintaining a frame of reference with surroundings
Note: Adjusting the blend level works in both full screen and picture-in-picture view. Color Alarm
• Click on the Analysis tab • Adjust the Color Alarm settings to display only temperatures falling above,
below, in between, or outside temperature criteria in infrared, and anything that does not meet the temperature criteria in visible light
Note: Color alarms work in both full screen and picture-in-picture view. With the on screen alarm disabled, the entire infrared image is blended with the visible light image according to the IR-Fusion blend setting. Image Alignment Image alignment is an automatic adjustment that occurs as you focus the infrared camera lens. The visible light image and the infrared image are lined up based on the focusing distance of the infrared lens so that they may be combined for viewing and analysis. You can precisely adjust the visible light image relative to the infrared image as needed for improved viewing and analysis. To use the image adjustment controls:
• Click the up, down, left, and right arrows as needed to finely adjust the image; click the Zero button to reset the adjustment to the original calculated value
Editing Image Annotations Use the image editor to edit and/or add image categories and annotations. To add annotation categories:
1. Double-click the active image to open the image editor. 2. Click on the Annotations tab, then click on the "create new annotation
category" icon. The Edit Category window opens. 3. Click in the Name box, then type the new category name. 4. Click in the Select box, then choose One or Many. 5. Click OK.
To add annotations:
1. Double-click the active image to open the image editor.
24
Using the Image Editor
2. Click on the Annotations tab, then click on the "add new annotation" icon. The Edit Annotation window opens.
3. Type the new annotation name… 4. Click OK.
To change annotation categories already saved to an image:
1. Double-click the active image to open the image editor. 2. Click on the Annotations tab, then double-click on the category in the tree
viewer you want to change. The Edit Category window opens. 3. Click in the Name box, then type the new category name. 4. Click in the Select box, then choose One or Many. 5. Click OK.
To change annotations already saved to an image:
1. Double-click the active image to open the image editor. 2. Click on the Annotations tab, then double-click on the annotation in the tree
viewer you want to change. The Edit Annotation window opens. 3. Type the new annotation name… 4. Click OK.
Using Reference Images In SmartView, you can add reference images to an infrared image. A reference image is an image, whether infrared or not, that is associated with the target image and that you want to note the association using the image editor. The following examples describe a few common types of reference images you may want to use. Examples:
1. Control image—a visible light picture of the target object. 2. Good image—an infrared image of what the target object should look like. 3. Before/After—an infrared image of what the target object looked like before
or after some operation like a repair or maintenance. To add a reference image:
1. Double-click the active image to open the image editor. 2. Click on the Reference Images tab. 3. Click either the Add infrared image button or Add visible light image button,
depending on which type you are adding. 4. In the Open dialog box, browse to find the image you want to use as a
reference. 5. Click on the image, then click ”Open.” The image appears in the reference
image thumbnail box. 6. Click on the reference image to highlight it, then, in the box below, enter a
description of the relationship between the main image and the reference image you just added by typing over the prompt text.
25
en_SmartView_2.1_Help
26
Note: You can select multiple reference images for each target image. To delete a reference image from the image editor:
1. Click on the reference image thumbnail to highlight it. 2. Press the Delete (or DEL) button on your keyboard.
Note: For IR-Fusion images, the visible light image that is taken with the infrared image is automatically selected as the visible light reference image. This reference image cannot be deleted.
Editing Image Comments You can add image comments and an image header to create a caption and header for the image in the report. To add an image header:
1. Double-click the active image to open the image editor. 2. Click on the Comments tab. 3. Type the text in the "Enter image header here:" section.
To add image comments:
1. Double-click the active image to open the image editor. 2. Click on the Comments tab. 3. Type the text in the "Enter image comments here:" section.
Editing Multiple Images At Once To edit the color palette and/or emissivity and background temperature value of all open images at once:
1. Open the images you want to edit. 2. Click Edit on the SmartView Menu Bar, then click Edit All…. The Edit All images
window appears. 3. Use the Palette control to change the palette and saturation colors of all open
images; use Emissivity controls to change the emissivity and background temperature values of all open images.
Note: Click the Select sample image down arrow to view various images in the image editor window.
Annotations Using Annotations You can add notes, or annotations, to your thermal images. An annotations file is a file named ”notations.txt” located in the root directory of the memory card. This file contains a predefined list of available annotations and annotation categories. When you insert the card into your imager, the annotation file tells the imager what annotations can be applied to an image captured with the imager. You can apply these predefined categories and annotations to images captured by that imager. (See your thermal imager's users manual for instructions.) Note: A default annotation file is included in the internal memory of imagers with text annotation capabilities. The default annotation file is included in the SmartView installation. Note: Annotations are not available on all thermal imagers. Annotations may be used on any image once the image is in SmartView. You can then view these images in the SmartView image editor and change the annotation categories and annotations originally saved with the image. You can also use the Annotations Editor in SmartView to change the predefined list on the memory card and create your own categories and annotations to later be applied to images saved to the memory card. For instructions, see the Exploring the Annotations Editor section and the Annotations Editor Tutorial. You can also add annotations to images using the image editor or the drag and drop feature in SmartView to quickly add annotations to images open in SmartView. Annotations files consist of:
• annotations • annotation categories
Annotations An annotation is a textual description that can be attached to an image. You can use annotations to store extra information with an image such as where the image was captured, what equipment is represented in the image, and who captured the image. All annotations must be a member of an annotation category. Annotation Categories An annotation category is a grouping of similar annotations. For example, the annotation category ”Location” may contain the annotations ”Basement,” ”Main Floor,” and ”Top Floor.”
27
en_SmartView_2.1_Help
Annotation categories come in two types: select one and select many. When you choose the ”Select One” category, you can apply 0 or 1 annotation to the image. If you choose ”Select Many,” you can apply any number of annotations (from 0 to the number of annotations in the category) to the image. Note: Use ”select one,” for example, with the category Client, since an image most likely applies only to one client. Use "select many,” for example, with the category Conditions, of which there could be many: dusty, cold, dark, etc.
Exploring the annotations editor The annotation editor is designed to make editing annotations files quick and simple. The editor consists of a tree viewer and Tool Bar. Most commands can be quickly accessed by clicking a Tool Bar icon in the annotations editor and/or right-clicking on the tree viewer to open a context, or popup, menu. The annotations editor is also used to "drag and drop" annotations from the editor to thermal images open in the SmartView window. Tree Viewer The tree viewer in the annotations editor displays the categories and annotations in the annotations file in a hierarchical format. If an annotation category is preceded by a +, then its annotations are hidden. Click the + to expand the category and display its annotations. If an annotation category is preceded by a -, then its annotations are displayed. Click the - to collapse the category and hide its annotations. Annotations with multiple text lines are displayed with … after the first line. Note: Right-click on the tree viewer to open the context, or popup, menu Tool Bar The annotations editor tool bar allows quick access to the editor commands you use most. Click on the tool bar button you want to access the command. To open the Annotations Editor:
1. Open the image you want to annotate or click on an open image to activate. 2. Click Tools on the Smart View Menu Bar, then select Annotations Editor….. An
annotations window appears. 3. From here you can use the Tool Bar Commands below:
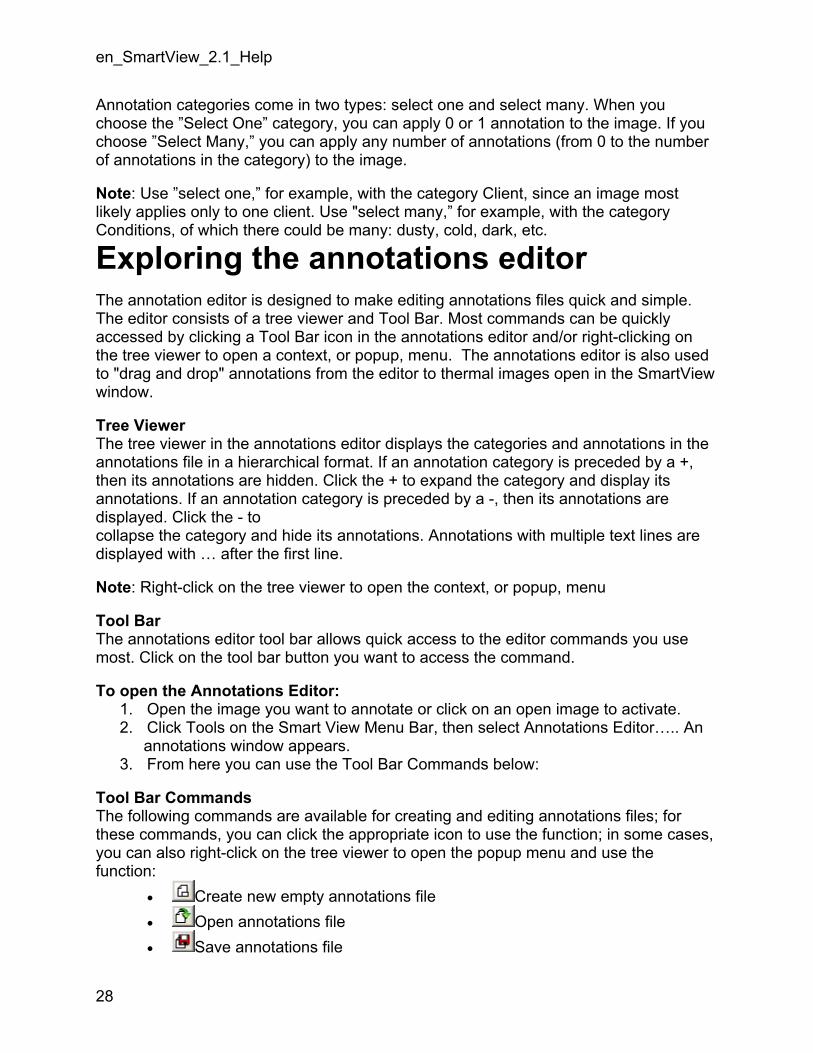
Tool Bar Commands The following commands are available for creating and editing annotations files; for these commands, you can click the appropriate icon to use the function; in some cases, you can also right-click on the tree viewer to open the popup menu and use the function:
Create new empty annotations file •
Open annotations file •
Save annotations file •
28
Annotations
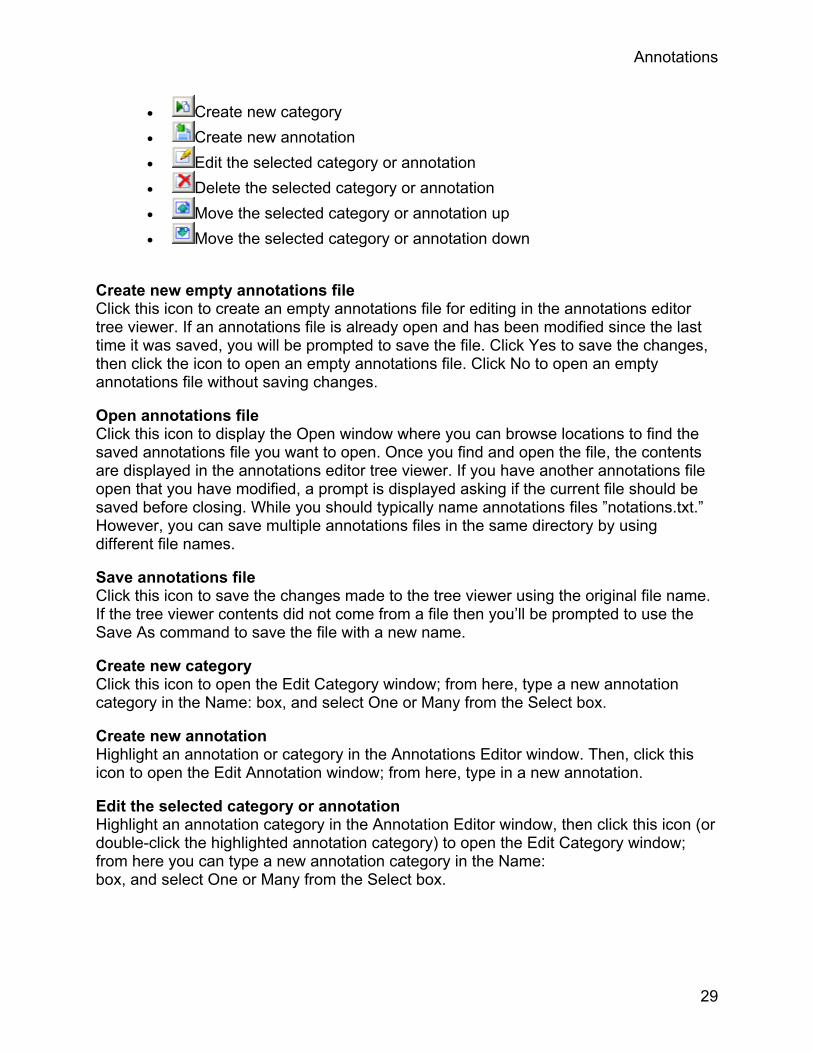
Create new category •
Create new annotation •
Edit the selected category or annotation •
Delete the selected category or annotation •
Move the selected category or annotation up •
Move the selected category or annotation down • Create new empty annotations file Click this icon to create an empty annotations file for editing in the annotations editor tree viewer. If an annotations file is already open and has been modified since the last time it was saved, you will be prompted to save the file. Click Yes to save the changes, then click the icon to open an empty annotations file. Click No to open an empty annotations file without saving changes. Open annotations file Click this icon to display the Open window where you can browse locations to find the saved annotations file you want to open. Once you find and open the file, the contents are displayed in the annotations editor tree viewer. If you have another annotations file open that you have modified, a prompt is displayed asking if the current file should be saved before closing. While you should typically name annotations files ”notations.txt.” However, you can save multiple annotations files in the same directory by using different file names. Save annotations file Click this icon to save the changes made to the tree viewer using the original file name. If the tree viewer contents did not come from a file then you’ll be prompted to use the Save As command to save the file with a new name. Create new category Click this icon to open the Edit Category window; from here, type a new annotation category in the Name: box, and select One or Many from the Select box. Create new annotation Highlight an annotation or category in the Annotations Editor window. Then, click this icon to open the Edit Annotation window; from here, type in a new annotation. Edit the selected category or annotation Highlight an annotation category in the Annotation Editor window, then click this icon (or double-click the highlighted annotation category) to open the Edit Category window; from here you can type a new annotation category in the Name: box, and select One or Many from the Select box.
29
en_SmartView_2.1_Help
Highlight an annotation in the Annotation Editor window, then click this icon (or double-click the highlighted annotation) to open the Edit Annotation window; from here, you can type in a new annotation. Note: Your annotations may require multiple lines of text. While editing annotation text, press and hold the Control (Ctrl) key and press the Enter key to insert a new line. Delete the selected category or annotation Highlight an annotation category or annotation. Then, click this icon (or press the Delete key) to delete the currently selected annotation category or annotation. A prompt is displayed verifying that the selected annotation or category should be deleted. Move the selected category or annotation up Highlight an annotation category or annotation. Then, click this icon to move up the currently selected annotation category or annotation. Note: An annotation cannot be moved out of its category. This command has no effect on an annotation or category that is first in its list. Move the selected category or annotation down Highlight an annotation category or annotation. Then, click this icon to move down the currently selected annotation category or annotation. Note: An annotation cannot be moved out of its category. This command has no effect on an annotation or category that is last in its list. Exit/Close Click the close button or the X icon to close an open annotations editor dialog box. If a file is open and has been modified since the last time it was saved, a prompt is displayed asking if the current file should be saved.
Using the Annotations Editor Tutorial Use this tutorial to help familiarize yourself with the SmartView Annotations Editor. You can use the Annotations Editor to change the predefined annotation categories and annotations in the ”notations.txt” file on your memory card. Upon completing this tutorial, you will be able to:
1. Create a new annotations file 2. Add a new annotation category 3. Add a new annotation 4. Save an annotations file 5. Save with a different file name 6. Open an annotations file 7. Edit an annotation category 8. Edit an annotation 9. Close the editor
30
Annotations
To change the predefined annotation category and annotations list using the Annotations Editor:
1. Plug the memory card reader into your computer. 2. Remove the memory card from your thermal imager and insert card into the
card reader. 3. Open your SmartView software, then click Tools on the Menu Bar. 4. Click on Annotations Editor… in the SmartView Tools drop down menu.
Follow the procedures under A – F. A. To open an Annotations File:
1. Open your SmartView software, then click Tools on the Menu Bar. 2. Click on Annotations Editor… in the SmartView Tools dropdown menu. 3. Click the ”Open annotations file” icon. The Open Annotation File window
opens to the last location where an annotations file was opened or saved. 4. Navigate to another location if necessary and select the file you want to
open. For this tutorial, open the file ”notations.txt" that comes in the SmartView installation.
5. Highlight the file ”notations.txt” and click Open. B. To add a New Annotation Category
1. Click the "Create new category” icon. This opens the Edit Category window and enables you to create a new category.
2. In the Name box, change New Category to "Location". Leave the Selection box set at ”One."
3. Click OK. C. To add a New Annotation
1. Click the Location category to highlight it if it is not already. 2. Click the ”Create new annotation” icon. This opens the Edit Annotation
window and enables you to create a new annotation in the Location category. Change New Annotation to Basement.
3. Click OK. 4. Repeat steps 2-3 to add two more new annotations: First Floor and Top
Floor. D. To Edit an Annotation Category:
1. Click the Location category to highlight it if it is not already. 2. Click the "Edit the selected category or annotation” icon. The Edit
Category window opens. 3. Change the name to Equipment Location. Click the Select box, and then click
Many. 4. Click OK.
E. To Edit an Annotation:
31
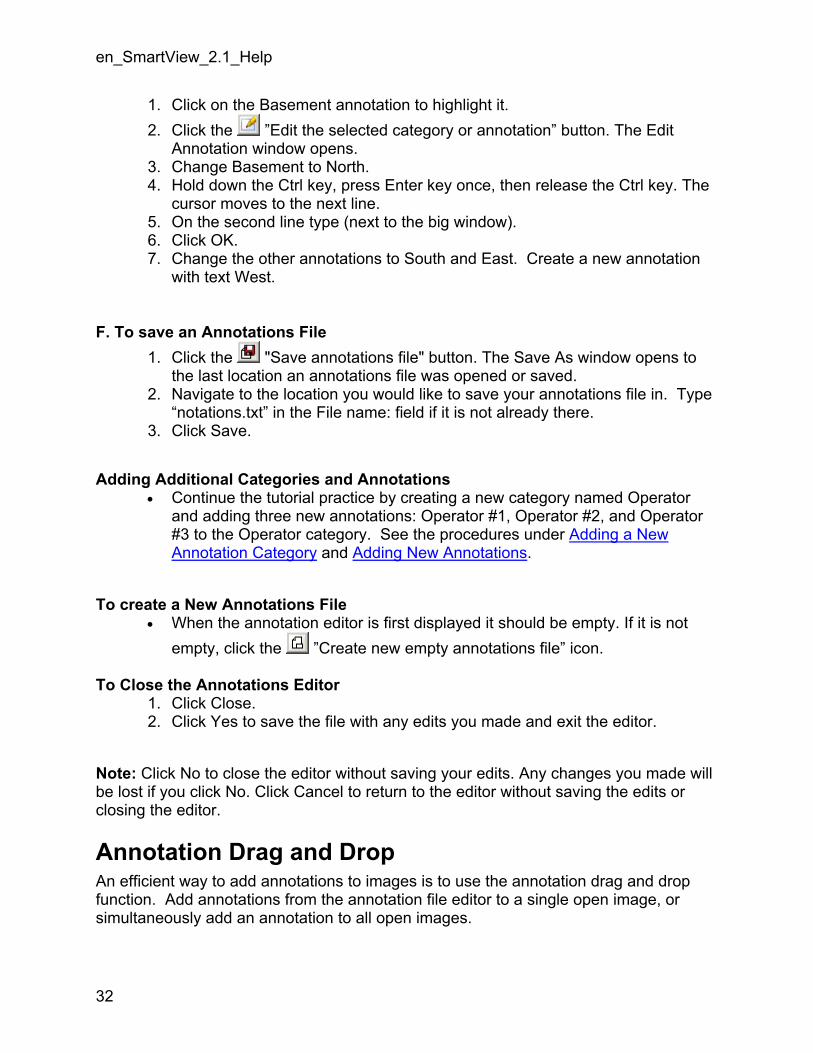
en_SmartView_2.1_Help
1. Click on the Basement annotation to highlight it. 2. Click the ”Edit the selected category or annotation” button. The Edit
Annotation window opens. 3. Change Basement to North. 4. Hold down the Ctrl key, press Enter key once, then release the Ctrl key. The
cursor moves to the next line. 5. On the second line type (next to the big window). 6. Click OK. 7. Change the other annotations to South and East. Create a new annotation
with text West. F. To save an Annotations File
1. Click the "Save annotations file" button. The Save As window opens to the last location an annotations file was opened or saved.
2. Navigate to the location you would like to save your annotations file in. Type “notations.txt” in the File name: field if it is not already there.
3. Click Save. Adding Additional Categories and Annotations
• Continue the tutorial practice by creating a new category named Operator and adding three new annotations: Operator #1, Operator #2, and Operator #3 to the Operator category. See the procedures under Adding a New Annotation Category and Adding New Annotations.
To create a New Annotations File
• When the annotation editor is first displayed it should be empty. If it is not empty, click the ”Create new empty annotations file” icon.
To Close the Annotations Editor
1. Click Close. 2. Click Yes to save the file with any edits you made and exit the editor.
Note: Click No to close the editor without saving your edits. Any changes you made will be lost if you click No. Click Cancel to return to the editor without saving the edits or closing the editor.
Annotation Drag and Drop An efficient way to add annotations to images is to use the annotation drag and drop function. Add annotations from the annotation file editor to a single open image, or simultaneously add an annotation to all open images.
32
Annotations
33
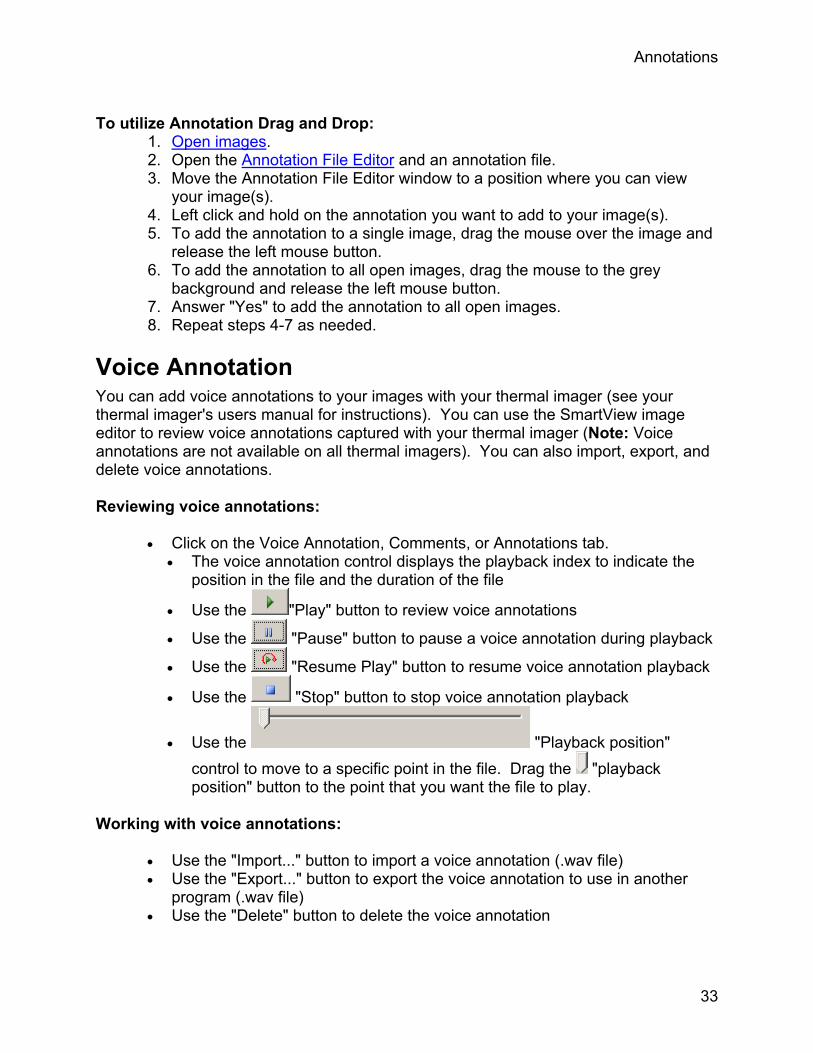
To utilize Annotation Drag and Drop:
1. Open images. 2. Open the Annotation File Editor and an annotation file. 3. Move the Annotation File Editor window to a position where you can view
your image(s). 4. Left click and hold on the annotation you want to add to your image(s). 5. To add the annotation to a single image, drag the mouse over the image and
release the left mouse button. 6. To add the annotation to all open images, drag the mouse to the grey
background and release the left mouse button. 7. Answer "Yes" to add the annotation to all open images. 8. Repeat steps 4-7 as needed.
Voice Annotation You can add voice annotations to your images with your thermal imager (see your thermal imager's users manual for instructions). You can use the SmartView image editor to review voice annotations captured with your thermal imager (Note: Voice annotations are not available on all thermal imagers). You can also import, export, and delete voice annotations. Reviewing voice annotations:
• Click on the Voice Annotation, Comments, or Annotations tab. • The voice annotation control displays the playback index to indicate the
position in the file and the duration of the file
• Use the "Play" button to review voice annotations
• Use the "Pause" button to pause a voice annotation during playback
• Use the "Resume Play" button to resume voice annotation playback
• Use the "Stop" button to stop voice annotation playback
• Use the "Playback position" control to move to a specific point in the file. Drag the "playback position" button to the point that you want the file to play.
Working with voice annotations:
• Use the "Import..." button to import a voice annotation (.wav file) • Use the "Export..." button to export the voice annotation to use in another
program (.wav file) • Use the "Delete" button to delete the voice annotation

Generating Reports SmartView Reports: Overview SmartView allows you to create and print detailed, professional reports that contain images you capture with your thermal imager, comments, recommendations, and other related information you wish to analyze and/or share with others. You can configure reports in various ways to include a main infrared (IR) image, IR reference image(s), visible light (VL) reference image(s), and/or other output options you select. You can also include a summary table and description and can customize the report title page, if you choose to include one, and other report appearance settings. You may also modify or create the report templates used to generate your report. Generate reports by using either the Quick Report function to create a standard report format you can use over and over with the push of a button, or the Report Wizard to deviate from the Quick Report settings. In both the Quick Report Settings and the Report Wizard, you can choose from three standard report templates: basic, comparison, and thumbnail. You may also select any customized report templates. You can generate a report in either .PDF or .docx format. The PDF format can be utilized in Adobe Acrobat software or similar. The .docx format is natively supported by Microsoft Word 2007. See Report Generation Options for more details.
Generating Reports Using Quick Report Use Quick Report to set up a standard report configuration you can use over and over and can generate quickly with a single mouse click. Quick Report and Report Wizard configuration options are the same, but you can choose different settings for each (see, Changing Quick Report Settings). Note: Quick Report includes all open images. To generate one report with all open images using Quick Report:
1. Change the Quick Report Settings if necessary. 2. Open the image(s) you want to include in the report. 3. Click the Quick report on all images icon on the SmartView Tool Bar. (Or
click Report, then Quick Report from the SmartView Menu Bar). A report will generate based on your Report Generation preferences.
Changing Quick Report Settings To view and change Quick Report settings:
1. Click Report on the SmartView Menu Bar, then select Quick Report Settings….
2. Select the report template you want to use (basic, comparison, thumbnail, or custom) from the drop down menu.
35
en_SmartView_2.1_Help
3. Configure the report by checking or typing in various output options from the title page, layout, appearance, and summary tabs. Leave the options you do not want to include in the report unchecked.
4. Click OK. Quick ReportNow you are ready to generate a .
Using the Report Wizard Use the Report Wizard to customize a report and deviate from the standard Quick Report Settings. The Report Wizard allows you to select a report template and which of the open images you want to include in a report. To generate a report using the Report Wizard:
1. Open the image(s) you want to include in the report. 2. Click Report on the SmartView Menu Bar, then select Wizard…. The Report
Wizard window opens. Uncheck the box beside any images you do not want to include in the report.
3. Click Next, then click on the report template you want to use (basic, comparison, thumbnail, or custom).
Note: You may adjust the Report Template Directory setting in the "Select Report
Template" step. 4. Click Next, then configure the report by checking or typing in various output
options from the title page, layout, appearance, and summary tabs. Leave the options you do not want to include in the report unchecked.
Note: On the layout tab, if you select ”Include visible reference” and then select ”Use
view settings” the image appears in the report exactly as it appears in the SmartView image viewer. The ”Use view settings” option applies only to IR Fusion images. For the main image, if you select ”Use view settings” then the ”Visible light only” setting is used for the visible reference image. If you select ”Infrared only” for the main image, then ”Use view settings” is used for the visible reference image. 5. Click Finish.
Report Generation preferences6. A report will generate based on your . Including a Title Page To ensure a professional look to your report, add a title page. To include a title page in your report:
1. Open the image(s) you want to include in the report. 2. Change the Quick Report Settings or use the Report Wizard. 3. Select the report template you want to use (basic, comparison, thumbnail, or
custom). a. Click on the title tab to configure the title page:
i. Check the ”Include Title Page” box. Note: The title page is included in the report only when the ”Include Title
Page” box is checked.
36
Generating Reports
ii. Add a report title, report subtitle, your company name and contact information, your client's name and contact information (when appropriate), your company logo, and a title page image by using the appropriate fields and associated controls.
Note: SmartView saves the15 most recent entries in each of the title
page fields for fast recall of frequently used text and files. 5. Click OK (from Quick Report) or Finish (from Report Wizard). 6. A report will generate based on your Report Generation preferences.
Including a Summary Page Make your reports easy to understand at a glance by creating a summary page that includes a table and/or paragraph description that summarizes the entire report. You can include the summary table only, the paragraph description only, or both. To include a summary table and/or description in your report:
1. Open the image(s) you want to include in the report. 2. Change the Quick Report Settings or use the Report Wizard. 3. Select the report template you want to use (basic, comparison, thumbnail, or
custom). 4. Configure the report by checking or typing in various output options from the
title page, layout, appearance, and report summary tabs. Leave the options you do not want to include in the report unchecked.
a. Click on the summary tab to configure the report summary page: i. Check the ”Include report summary” box.
Note: The report summary page is included in the report only when the
”Include report summary” box is checked. ii. Create a summary table by typing a field name in the ”Field”
column. (Sample field names: ”Electrical” ”Mechanical”). iii. Then, click in the ”Summary” column to type a comment specific to
that field. (Sample comment: ”Some electrical wires are overheating.” Or ”Schedule maintenance and monitor as indicated.”)
iv. Continue adding fields and comments as needed to create the summary table.
v. Check the box in the ”Include” column for each row you want to include in your summary table. Uncheck the box beside any row you decide not to include.
vi. Click in the ”Report summary text” area to type a summary paragraph description. (Sample summary paragraph: ”Maintenance team should follow up where indicated. Monitor all other components regularly. Perform a follow up inspection on all equipment where maintenance is performed.”)
5. Click OK (from Quick Report) or Finish (from Report Wizard). Report Generation preferences6. A report will generate based on your .
Opening a Report Generated from SmartView 1.9 or Earlier
37
en_SmartView_2.1_Help
To open a report generated with SmartView 1.9 or earlier: 1. Click "Report" on the SmartView Menu Bar, then select "Open Legacy
Report..." 2. Select the location on the computer/hard drive where the report is saved. 3. In the "File name:" box, select the report you want to open. 4. Click "Open."
Report Templates For each report template, you can customize the report title page, layout, appearance, and report summary from the Report Wizard or Quick Report Settings.
• Title Page—Allows you to choose to include a title page and add the
information you want to include on the report title/cover page. • Layout—Allows you to choose information you want to include in the report,
such as page numbers, a table of contents, reference images, and image-related details such as annotations, marker data, and image information.
• Appearance—Allows you to choose accent colors and the header and/or footer you want to include in the report.
• Summary—Allows you to choose to include a table and/or paragraph description that summarizes the entire report on one page.
Basic Report Use this general-purpose report to describe the results of an inspection and provide recommendations for follow-up action. In a basic report, you can include:
• Up to three images: a main IR image, a VL reference image, and an IR
reference image. • Comments and marker details for the main IR image. • Image information for the main IR image including annotations that
categorize the object’s location, problem, severity, and recommended action; the image calibration range, emissivity, and background temperature; and the camera serial number.
You can also customize the report title page, layout, appearance, and report summary. Comparison Report Use this report to compare two IR images, for example: one image captured before a repair and one captured after, or one image showing an object in good or working condition and one image showing an object in bad or nonworking condition. In a comparison report, you can include:
• Two images: a main IR image and an IR reference image.
38
Generating Reports
• Comments and marker details for both IR images. • Image information for both IR images including annotations that categorize
the object’s location, problem, severity, and recommended action; the image calibration range, emissivity, and background temperature; and the camera serial number.
You can also customize the report title page, layout, appearance, and report summary. Thumbnail Report Use this general summary report to display thumbnail—that is, reduced-size—versions of all IR and IR Fusion images captured during an inspection. In a thumbnail report, you can include:
• Up to 9 IR/IR Fusion images on one page. • Comments for all IR images.
You can also customize the report title page, layout, appearance, and report summary. Custom Use the template editing tools to create a customized report template based on one of the three provided templates or create one of your own. Note: It is recommended that you customize an existing report template. Note: You must have Microsoft Word 2007 to customize report templates.
Activating Report Template Editing Note: You must have Microsoft Word 2007 to create or modify a report template. To activate report template editing:
1. Open Microsoft Word 2007
2. Click the Microsoft Office Button . 3. Click Word Options. 4. Click Popular. 5. Check the box next to "Show Developer tab in the Ribbon". 6. Click OK. 7. Click on the "Developer" tab on the ribbon at the top of the Microsoft Word
window. 8. Click on the "Schema" button in the XML section. A Templates and Add-ins
window will appear. 9. Select the XML Schema tab. 10. Click "Add Schema". An "Add Schema" window will appear.
39
en_SmartView_2.1_Help
11. Navigate to the "Report Templates" folder. Note: With a typical installation, the directory will be, "C:\Program
Files\Fluke\SmartView 2.0\Report Templates\en" where en is the two character language code. 12. Select the .xsd file. The file is named "en.xsd", where en is the two character
language code. 13. Click Open. 14. Type a meaningful name in the "Alias" field. The recommended name is
"Fluke Infrared". 15. Click OK. 16. Click OK. 17. A "XML Structure" window pane will appear. If it is not visible, click the
"Structure" button on the XML section of the Developer ribbon.
Modifying Report Templates Modify one of the provided report templates (basic, comparison, or thumbnail) to create a customized template. You have complete control over the report template. Note: You must have Microsoft Word 2007 to create or modify a report template. Note: After modifying a template, save the customized report template file as a new name to preserve the integrity of the default template. Modifying a report template To open a report template for editing:
1. Open Microsoft Word 2007. 2. Make sure template editing is activated. 3. Open the report template you want to modify.
Note: With a typical installation, the directory will be, "C:\Program Files\Fluke\SmartView 2.0\Report Templates\en" where en is the two character language code.. 4. Click on the "Developer" tab. 5. Click on the "Structure" button. A "XML Structure" window pane will appear.
To move report objects:
Open a report template for editing1. . 2. Use the right-click menu or keyboard shortcuts (Ctrl + C for copy and Ctrl + V
for paste) to move a report element using copy and paste. You may also highlight and drag a report element to a different location.
To add report objects:
40
Generating Reports
1. Open a report template for editing. 2. Right-click in the location where you want to add a report element. 3. Select Apply XML Element. A list of available report elements will appear. 4. Left-click on the report element you want to add to the template.
Adjust5. the report element attributes as needed.
To delete report objects:
1. Open a report template for editing. 2. Highlight the element you wish to delete. 3. Press the backspace or delete button on your keyboard.
To re-size an image in the template:
1. Open a report template for editing. 2. Left-click on the image you want to re-size. 3. To increase or decrease the size in one or more directions, drag a sizing
handle away from or toward the center. To adjust the font of text or text elements in the template:
1. Open a report template for editing. 2. Locate the text or text report element you want to modify. 3. Left-Click at the beginning of the text or text report element. 4. Hold down the left mouse button, and then drag the pointer over the text or
text report element you want to select. 5. Use the formatting Mini toolbar to adjust the font size, type, color, and more.
The Mini toolbar appears automatically when you select text or a text report element. It also appears with the menu when you select text and then right-click.
To adjust report element attributes:
Open a report template for editing1. . 2. Right-click on the report element you want to adjust. 3. Select Attributes. An attributes window will appear. 4. Left click on the attribute you want to add to the report element. 5. Choose the value/option you want from the Value field. 6. Click on Add. The attribute will be listed in the Assigned attributes section. 7. Click OK.
Note: To remove an attribute, follow steps 1-3, then highlight the attribute in the Assigned attributes section and click Delete. Note: Some report elements do not have attributes.
41
en_SmartView_2.1_Help
To save the changes to the report template:
1. Open a report template for editing. 2. Modify the report template.
3. Click the Microsoft Office Button , and then click Save As. 4. In the File name box, enter a new name for the file. 5. Click Save.
Note: To save a copy in a different folder, click a different drive in the "Save in" list or
a different folder in the folder list. To save a copy in a new folder, click the Create New Folder button . Adjust the report template directory to reflect the new location of a report template.
Creating a Report Template Create custom report templates using Microsoft Word. Note: It is recommended that you create a report template by modifying an existing report template. Note: You must have Microsoft Word 2007 to create report templates. To create a report template:
1. Open Microsoft Word 2007. 2. Make sure template editing is activated. 3. Add the template elements you want to the document.
Note: Refer to the Modifying a Report Template section for instructions on adding,
deleting, moving, or re-sizing image report elements.
4. Save the report template to the report template directory.
Report Template Elements Report Template Elements: There are several report template elements available for inclusion on the template. Glossary of Report Template Elements Default Non-repeating sections. These sections only appear once on a report.
• Title page
42
Generating Reports
• Title_Page_Section - this is a section that contains all the subsequent title page elements. All information is entered in the Title page tab in the Quick Report Settings or Report Wizard
• Title_Page_Image - title page image • Client_Contact_Info - client contact information • Client_Name - client company name • Company_Contact_Info - your contact information • Company_Logo - your company logo • Company_Name - your company name • Report_Subtitle - subtitle for the report • Report_Title - title for the report • Report_Date - date the report was generated (not included in any of the
provided report templates)
• Table of contents • Table_Of_Contents_Section - table of contents that includes the file name
and associated page number in the report
• Summary page - All information is entered in the Summary tab in the Quick Report Settings or Report Wizard
• Summary_Section - this is a section that contains all the subsequent summary page elements. All information is entered in the Summary tab in the Quick Report Settings or Report Wizard
• Summary - paragraph style summary • Summary_Table - table style summary
Default Repeating sections. These sections repeat for every image included in the report.
• Main Infrared Image • Image_Section - this is a section that contains all the subsequent main
infrared image elements • Image_Annotations_Table - text annotations associated with the image • Image_Comment - comments from the Comments tab in the image editor • Image_Graph - graph from the Graph tab in the image editor (line, X, Y,
histogram, or 3D-IR™) • Image_Header - header from the Comments tab in the image editor • Image_Marker_Table - table that includes the statistics for image markers • Image_Time - date and time the image was captured • Main_Image - main infrared image • Image_Name - main infrared image file name
Note: An image is placed in the location of an image on the template to define the size of the image on the report. If an image is not placed on the template, the image is presented in the native image size. It is recommended to place an image on the template because visible light images will be very large without one.
43

en_SmartView_2.1_Help
• Image_Info_Table_Section - this is a section that contains all the
subsequent main infrared image information elements • Image_Emissivity - Main infrared image's emissivity • Image_File_Location - file directory on the computer hard drive or
server • Image_Average_Temperature - Main infrared image's average
temperate • Image_Background_Temperature - Main infrared image's
background temperature • Image_Calibration_Range - Main infrared image's calibration range • Image_Range - Main infrared image's temperature range • Image_Time - date and time the image was captured • Camera_DSP_Version - thermal imager's DSP version (firmware) • Camera_Lens_Description - lens used to capture the image • Camera_Lens_Serial_Number - serial number of the lens • Camera_Manufacturer - Manufacturer of the thermal imager used
to capture the image • Camera_Model - model of the thermal imager used to capture the
image • Camera_OCA_Version - thermal imager's OCA version (firmware) • Camera_Serial_Number - serial number of the thermal imager used
to capture the image
• Reference Image(s) • Reference_Image_Section - this is a section that contains all the
subsequent reference image elements • Image_Info_Compare_Table - reference image information • Reference_Image_Comment - reference image comments from the
Reference Images tab in the image editor • Reference_Infrared - infrared reference image • Reference_Visible - visible light reference image
• Page Elements
• Page_Break - page break • Page_Footer - page footer • Page_Header - page header
• Thumbnail_Table - this element is used in the thumbnail report template as a
section that contains all the images used in the report and their associated information
Report Template Element Attributes Several report template elements have attributes that can be set in the template. When an attribute is added to a template element, the report will over ride any selections in the Quick Report Settings or Report Wizard.
44
Generating Reports
• Main_Image - the following attributes apply to the main infrared image
• Blend_Percent - this attribute controls the blend level for IR-Fusion images • 0 - 100 (100 = 100% infrared contribution, 0 = 100% visible light
contribution) • Palette - this attribute controls the infrared image's palette
• Amber • Amber_Inverted • Blue_Red • Grayscale • Grayscale_Inverted • High_Contrast • Hot_Metal • Ironbow
• Show_Color_Bar - this attribute controls the presence of the palette bar • yes • no
• Image_Graph • Profile_Settings - this attribute controls the type of graph displayed
• Histogram • Line • 3D-IR™ • X_Profile • Y_Profile
• Image_Display_Settings - this attribute only applies to IR-Fusion images and
controls how the infrared and visible light images are displayed • Full_Frame - displays the visible light reference image in the full image
size. More pixels are displayed than are available on the thermal imager. • Match_Infrared_Size - displays the visible light reference image in the size
corresponding to the infrared portion of the IR-Fusion image • Picture_In_Picture - displays the infrared image as an infrared window
surrounded by a visible light image frame. The visible light reference image will match the size of the picture in picture image combination.
• View_Settings - default. The infrared image is displayed according to the image's display settings saved with the file. The visible light reference image will match the size corresponding to the display settings of the infrared image.
• Save_Format - this attribute applies to all images in the report
• jpg - with compression • png - without compression
• Units - this attribute applies to all infrared images
• Celsius • Fahrenheit
45

en_SmartView_2.1_Help
46
• Kelvin
Using the Clipboard Copying and Pasting an Image To copy and paste an image (bitmap format) into a different application:
1. Open the image you want to copy, or click on an open image to activate. 2. Right-click on the active image to open the image popup window. 3. Select Copy from the menu to place the bitmap on the Windows clipboard. 4. Open an application, such as Microsoft Word, that can accept bitmap images
from the clipboard. 5. Paste the bitmap graphic into the application. A common keyboard shortcut to
paste an image is to press and hold the control (Ctrl) key, then press the V key. Note: The bitmap graphic no longer contains any temperature information.
Copying and Pasting a Graph To copy and paste a graph into a different application:
1. Open the image you want to copy a graph from, or click on an open image to activate.
2. Right-click on an active image window to open the image popup menu. 3. Select View graph on the menu. 4. Select the graph type from the "Type" control. 5. Right-click on the graph window to open another popup menu. 6. Select Copy to place the graph on the clipboard. You can now paste the
graph into a different application (press and hold the control (Ctrl) key, then press the V key). You may have to select Paste Special in the application to which you are pasting the image in order to paste a graphic rather than text.
Note: You cannot adjust the bar width of a histogram image you paste into a different application.
47

Exporting Images and Temperature Data To export an image or temperature data:
1. Open the image you want to export, or click on an open image to activate. 2. Click File on the Tool Bar, then click Export…, or right-click and select
Export. 3. An Export dialog window appears. 4. Click the appropriate radio button to export the image or the image
temperature data. 5. Click the Format down arrow to select the file format you want to export. 6. If you chose Image, check the "Include Date Time Stamp" box to add a date
time stamp to image; check also "Include Scale" to add the color palette to the image.
• For IR-Fusion images, select the image presentation using the "Type" down arrow
• Select "Current View" to export the image using the current IR-Fusion image settings
• Select "Infrared Only" to export the infrared component of the image
• Select "Visible Light Only" to export the visible light component of the image
7. If you chose Temperature Data, check the "Include Markers" box to include markers in the exported file; check also "Markers Only" to export only the marker data.
8. Click the Location browse button (…) to open a Save As dialog window, then specify the location (folder) to which you want to export the image or data and press Save.
9. Click OK to export the image or data to the specified location. To export all open images or temperature data:
1. Open the images you want to export. 2. Click File on the Tool Bar, then click Export All…. An Export dialog window
appears. 3. Click the appropriate radio button to export the images or the images’
temperature data. 4. Click the Format down arrow to select the file format you want to export. 5. If you chose Image, check the "Include Date Time Stamp" box to add a date
time stamp to image; check also "Include Scale" to add the color palette to the image.
• For IR-Fusion images, select the image presentation using the "Type" down arrow
• Select "Current View" to export the image using the current IR-Fusion image settings
• Select "Infrared Only" to export the infrared component of the image
49

en_SmartView_2.1_Help
50
• Select "Visible Light Only" to export the visible light component of the image
6. If you choose Temperature Data, check the Include Markers box to include markers in the exported image; check also Markers Only to export only the marker data; check also Single File if you want to export the marker data from all exported images to one file versus separate files.
7. Click the Location browse button (…) to open a Save As dialog window, then specify the location (folder) to which you want to export the images or data and press Save.
8. Click OK to save the images or data to the specified location. Note: You can also copy and paste an image using the Windows clipboard.
Getting Accurate Temperatures Basic Infrared Radiometry The thermal imager measures the temperature of target materials by measuring the amount of infrared energy radiating from the target’s surface. This energy may be emitted directly from the target into the thermal imager. The energy of other objects may be reflected off the surface of the target and into the thermal imager. In the case of translucent materials some of the energy may be transmitted through the target to the camera. The thermal imager ”sees” energy from all three of these sources and produces a corresponding temperature measurement that may or may not reflect the true temperature of the target object. In order to obtain accurate temperature readings, the thermal imager measurement for reflected energy, that is, the energy not emanating directly from the target object, must be corrected. Since most materials of interest in maintenance and building related applications are opaque to infrared radiation, the transmitted energy can be ignored. Thus, we have to deal only with the directly emitted and reflected radiation when measuring temperatures. In order to understand how we correct for a material’s characteristics to get accurate temperature measurements, you need to be familiar with a material property called emissivity. All materials can be compared to an ideal object called a black body. A black body does not reflect or transmit any energy. All energy that reaches the thermal imager from a perfect black body is directly emitted; therefore, the thermal imager will read the true temperature of the black body. By definition, the emissivity of a perfect black body is 1.0. In the real world, materials do not behave as perfect black bodies. They reflect some energy from their surroundings as well as emit radiation directly. Emissivity is expressed as the ratio of the material’s direct energy emittance as compared with the energy emittance of a black body when both are at the same temperature. For example, given a black body and a target object both at the same temperature, if the emissivity of the target object is 0.5, the target object is directly emitting half the energy that the black body is and reflecting half the energy of the surroundings, or background. If the background temperature is less than that of the object, the thermal imager shows that the object is cooler than it really is because the thermal imager sees less radiation than it sees from the black body. In order to get an accurate reading of the target object, the thermal imager must correct its measurement based on the emissivity of the target object and background temperature being reflected off of the target. Your thermal imager and SmartView software allow you to specify the emissivity of the target and background temperature in order to get a more accurate temperature reading.
51
en_SmartView_2.1_Help
SmartView contains a table of emissivity values for a wide variety of materials you can use for reference. Generally, the emissivity of shiny metal materials is low, usually less than 0.25, increasing dramatically with surface texture or oxidation; the emissivity of nonmetal materials is high, usually more than 0.8. Radiation from an opaque material originates within a few microns of the surface. So, the emissivity of painted surfaces is characteristic of the coating rather than the underlying materials. Most organic paints have very high emissivity values of around 0.95. For most common applications, you do not need to know the exact temperature of an object, but rather that it is warmer or cooler than neighboring objects. For these general applications, we recommend you set the emissivity of your thermal imager to 0.95 and set the background temperature to room temperature. For applications that require precise temperature measurements, or where target materials have very low emissivity values, you need to correct the target emissivity and background temperature measurements. You can find the appropriate values in the Emissivity Values table, or you can measure them using your camera. It can be difficult to precisely measure the temperatures of target objects that have extremely low emissivity values, because most of the radiation is reflected; therefore, radiation from hot objects near the target may be reflected off the objects and appear in an image as hot or cold spots. Think of a mirror, for example: When you look into a mirror, you see the room behind you, but you do not see the mirror itself. We recommend that you apply extreme care when interpreting measured temperatures of target objects with low emissivity values.
Understanding Technology Limitations In certain situations, such as those in the following examples, it is difficult or even impossible to get an accurate temperature reading
• When viewing a distant scene through an atmosphere containing significant water vapor, for example, during high humidity conditions. Water vapor and water droplets in the atmosphere absorb and scatter infrared radiation.
• When viewing a target with a temperature outside the calibration range of your thermal imager. For example, when viewing the sun or a ”clear” sky.
• When viewing a target with an apparent diameter too small to fill a full pixel. For example, when looking at a power line from a distance.
• When viewing a target material, such as shiny metal, with low emissivity. In some situations, you may be able to get around this problem by attaching a small piece of thermal-conducting, high-emissivity material to the target object surface.
• When viewing targets, such as gasses, that are semi-transparent to infrared radiation.
• When viewing a target that does not reflect or emit infrared radiation evenly in all directions. These objects may sometimes act as a mirror over all or
52
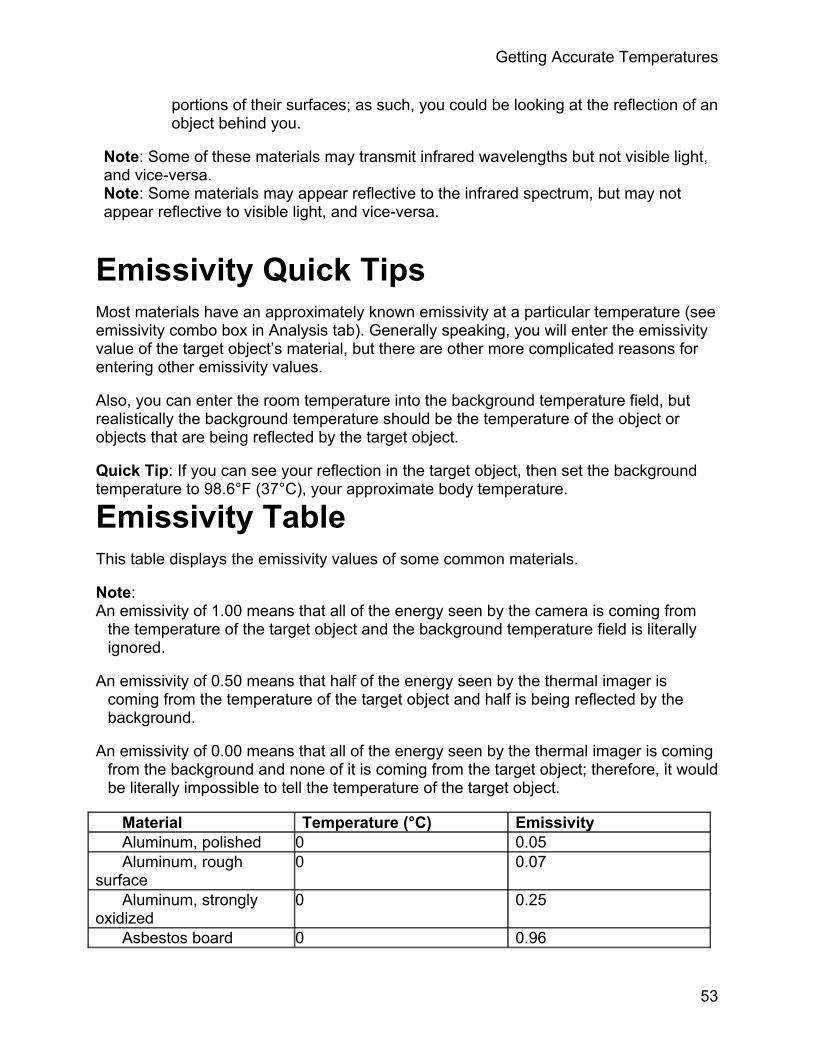
Getting Accurate Temperatures
portions of their surfaces; as such, you could be looking at the reflection of an object behind you.
Note: Some of these materials may transmit infrared wavelengths but not visible light, and vice-versa. Note: Some materials may appear reflective to the infrared spectrum, but may not appear reflective to visible light, and vice-versa.
Emissivity Quick Tips Most materials have an approximately known emissivity at a particular temperature (see emissivity combo box in Analysis tab). Generally speaking, you will enter the emissivity value of the target object’s material, but there are other more complicated reasons for entering other emissivity values. Also, you can enter the room temperature into the background temperature field, but realistically the background temperature should be the temperature of the object or objects that are being reflected by the target object. Quick Tip: If you can see your reflection in the target object, then set the background temperature to 98.6°F (37°C), your approximate body temperature.
Emissivity Table This table displays the emissivity values of some common materials. Note: An emissivity of 1.00 means that all of the energy seen by the camera is coming from
the temperature of the target object and the background temperature field is literally ignored.
An emissivity of 0.50 means that half of the energy seen by the thermal imager is
coming from the temperature of the target object and half is being reflected by the background.
An emissivity of 0.00 means that all of the energy seen by the thermal imager is coming
from the background and none of it is coming from the target object; therefore, it would be literally impossible to tell the temperature of the target object.
Material Temperature (°C) Emissivity Aluminum, polished 0 0.05 Aluminum, rough surface
0 0.07
Aluminum, strongly oxidized
0 0.25
Asbestos board 0 0.96
53
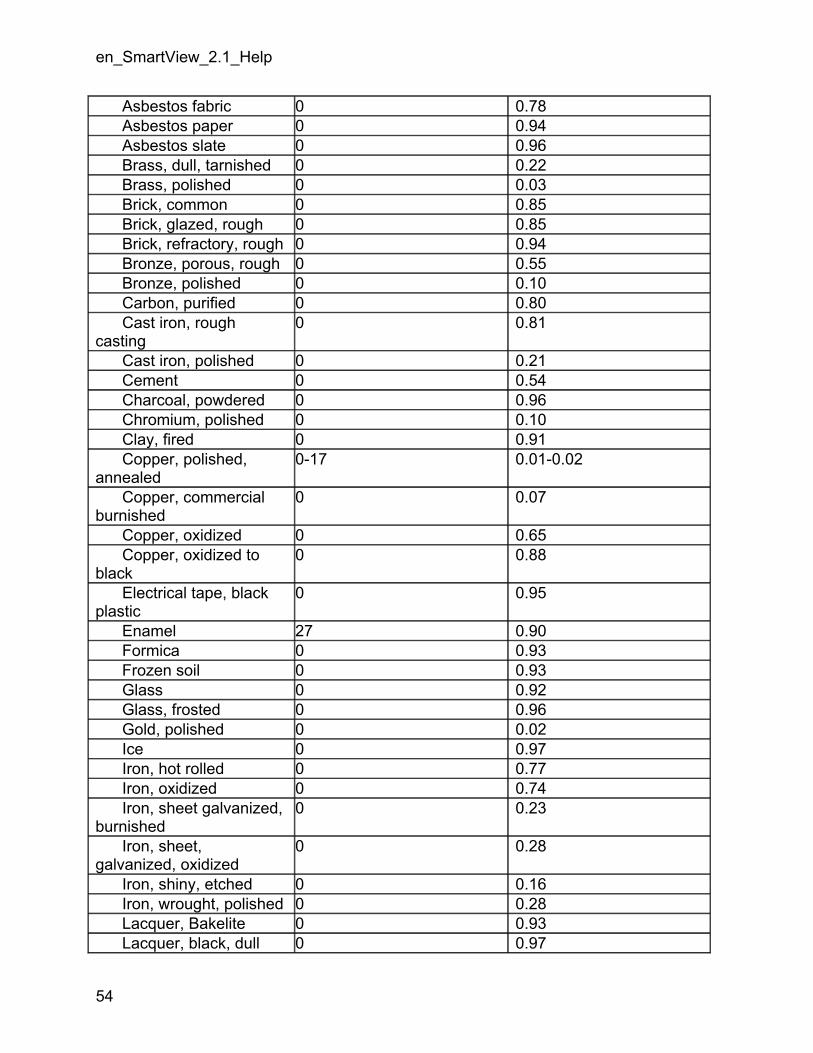
en_SmartView_2.1_Help
Asbestos fabric 0 0.78 Asbestos paper 0 0.94 Asbestos slate 0 0.96 Brass, dull, tarnished 0 0.22 Brass, polished 0 0.03 Brick, common 0 0.85 Brick, glazed, rough 0 0.85 Brick, refractory, rough 0 0.94 Bronze, porous, rough 0 0.55 Bronze, polished 0 0.10 Carbon, purified 0 0.80 Cast iron, rough casting
0 0.81
Cast iron, polished 0 0.21 Cement 0 0.54 Charcoal, powdered 0 0.96 Chromium, polished 0 0.10 Clay, fired 0 0.91 Copper, polished, annealed
0-17 0.01-0.02
Copper, commercial burnished
0 0.07
Copper, oxidized 0 0.65 Copper, oxidized to black
0 0.88
Electrical tape, black plastic
0 0.95
Enamel 27 0.90 Formica 0 0.93 Frozen soil 0 0.93 Glass 0 0.92 Glass, frosted 0 0.96 Gold, polished 0 0.02 Ice 0 0.97 Iron, hot rolled 0 0.77 Iron, oxidized 0 0.74 Iron, sheet galvanized, burnished
0 0.23
Iron, sheet, galvanized, oxidized
0 0.28
Iron, shiny, etched 0 0.16 Iron, wrought, polished 0 0.28 Lacquer, Bakelite 0 0.93 Lacquer, black, dull 0 0.97
54
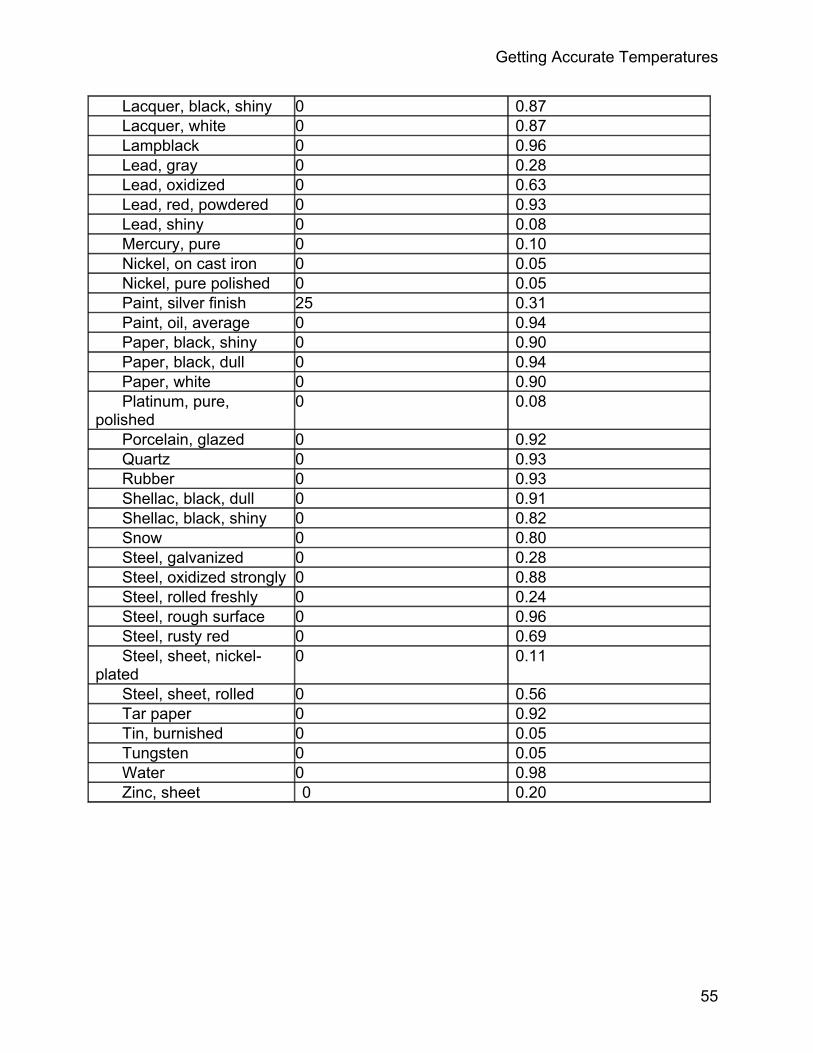
Getting Accurate Temperatures
55
Lacquer, black, shiny 0 0.87 Lacquer, white 0 0.87 Lampblack 0 0.96 Lead, gray 0 0.28 Lead, oxidized 0 0.63 Lead, red, powdered 0 0.93 Lead, shiny 0 0.08 Mercury, pure 0 0.10 Nickel, on cast iron 0 0.05 Nickel, pure polished 0 0.05 Paint, silver finish 25 0.31 Paint, oil, average 0 0.94 Paper, black, shiny 0 0.90 Paper, black, dull 0 0.94 Paper, white 0 0.90 Platinum, pure, polished
0 0.08
Porcelain, glazed 0 0.92 Quartz 0 0.93 Rubber 0 0.93 Shellac, black, dull 0 0.91 Shellac, black, shiny 0 0.82 Snow 0 0.80 Steel, galvanized 0 0.28 Steel, oxidized strongly 0 0.88 Steel, rolled freshly 0 0.24 Steel, rough surface 0 0.96 Steel, rusty red 0 0.69 Steel, sheet, nickel-plated
0 0.11
Steel, sheet, rolled 0 0.56 Tar paper 0 0.92 Tin, burnished 0 0.05 Tungsten 0 0.05 Water 0 0.98 Zinc, sheet 0 0.20

Glossary A
Active Image: The image that is open in a window in the SmartView workspace and whose window is activated (highlighted and brought to the front of the workspace if more than one image open). To activate a window, left-click on it.
B Background Temperature: The temperature of the 'surroundings', as seen by the
target object. In practical terms, this is often considered to be the ambient or 'room' temperature. The effects of very hot and cold objects in the background may influence the image.
C Color Alarm: A color alarm is an advanced form of an isotherm and is available on IR-
Fusion images. Palette colors mark the image where the color alarm temperature criteria are met. The color alarm function allows you to highlight target object areas of thermal interest by selectively blending visible light and infrared images. You can enable a color alarm based on high, low, or high and low temperature values. You can also specify a temperature range and enable a color alarm for temperatures within that range. With the color alarm function enabled, target object temperatures are highlighted in the infrared color (based on the color palette settings) that corresponds to the color alarm temperature(s) you’ve set.
Color Palette: Color representation of the temperatures (temperature range) in displayed image.
D Dirty Image: An image whose properties have been modified, but not saved. An
asterisk appears on the right side of the image name indicating the image has been modified, but not saved.
Double-Click: Quickly press and release the left mouse button twice.
E Emissivity: The ratio of the actual emitted radiance to that of an ideal blackbody at the
same temperature. In practical terms, this means that objects with lower emissivity will be more affected by background radiation.
H
57

en_SmartView_2.1_Help
58
Histogram: A bar chart representing a frequency distribution; heights of the bars represent observed frequencies.
I IR-Fusion: Infrared and visible light images fused together to create a single image.
There are five IR-Fusion viewing modes: full (traditional) IR, full visual (visible light), alpha blending, picture-in-picture, and color alarm.
Isotherm: In general scientific terminology, an isotherm is set of curves on a thermogram (an image you capture with your Camera), that mark different points that have the same temperature. In SmartView, an isotherm is an image that highlights all image pixels within a specified temperature range. These ”in-range” pixels are displayed in a single color so that they stand out from the rest of the image.
L Left-Click: Click (press and release) the left mouse button. Level: The center value of the color palette (temperature scale).
R Right-Click: Click (press and release) the right mouse button.
S Span: The temperature range across which the color palette is mapped.
T Target: An object being thermally photographed. Temperature Range: The temperatures represented by the color palette (palette
temperatures).
W Workspace: A workspace is a collection of image(s). A workspace is generated every
time an image is open. You may utilize this feature to group images together (See "Using Workspaces").

Index Using the Marker Properties Window ....................................... 23
A Annotations ........................................ 27
Annotation Drag and Drop .............. 32 Viewing the IR-Fusion Visible Light Image .......................................... 14 Annotations editor tutorial ............... 30
Editing Image Annotations .............. 24 Voice_Annotation ............................ 33 Exploring the annotations editor ....................................... 28
Infrared Basics Basic Infrared Radiometry .............. 51 Understanding Technology
Limitations ................................... 52 B Background Temperature ............ 19
Installing SmartView .................. 1 C Uninstalling SmartView .......... 2 Contact Us ........................................ 2
Copy and Paste IR-Fusion Images ............................... 23 Copying and Pasting a Graph
.................................................... 47 L License Agreement ......................... 3
Copying and Pasting an Image .................................................... 47
O Opening Images for Viewing ... 11
E R Editing Reports .............................................. 35 Multiple Images At Once ...... 26 Activating Report Template Editing . 39 Single Image .............................. 17 Creating a Report Template ........... 42
Emissivity ...................................... 19 Modifying Report Templates ........... 40 Report ............................................ 35 Emissivity Quick Tips........... 53 Report Template Elements ............. 42 Emissivity Table ..................... 53 Report Templates ........................... 38 Exporting
S Images and Temperature Data .................................................... 49 Sample Images ............................... 11
Saving and Transferring Your Images ............................................. 5
I Image Editor ................................. 17
U Editing Image Comments ............... 26 Using the Image Popup Menu ... 11 Image Info .................................. 12 Using the SmartView Main Window ............................................. 5
Markers......................................... 20 Palette......................................... 17
Understanding the Image Window ....................................... 11
Reference Images ..................... 25 Removing Markers ..................... 22
Viewing Pixel Temperatures 12 Using Color Alarms and Isotherms ................................. 18 W
Workspace Using Graphs .............................. 13 Using Workspaces ....................... 6 Using the Marker Data Window
.................................................... 13 Y Your Card Reader ........................... 2
59

60