en · pellets biomass for energy which has been dried and compressed in the form of pellets, with...
TRANSCRIPT
EN EN
EUROPEAN COMMISSION
Brussels, 30.11.2016 SWD(2016) 418 final
PART 4/4
COMMISSION STAFF WORKING DOCUMENT
IMPACT ASSESSMENT
Sustainability of Bioenergy
Accompanying the document
Proposal for a Directive of the European Parliament and of the Council on the promotion of the use of energy from renewable sources (recast)
{COM(2016) 767 final} {SWD(2016) 419 final}
2
Table of Contents
GLOSSARY ........................................................................................................................ 5
ACRONYMS ...................................................................................................................... 7
1. CONTEXT OF THE INITIATIVE ............................................................................. 8
2. WHAT IS THE PROBLEM AND WHY IS IT A PROBLEM?............................... 10
2.1. Climate impacts of bioenergy.......................................................................... 14
2.1.1. Greenhouse gas emissions from the supply chain ........................................... 14
2.1.2 Biogenic greenhouse gas CO2 associated with forest-based biomass for energy 15
2.2. Impacts on biodiversity, water, soil and air quality ........................................ 18
2.3. Efficiency of biomass conversion and increasing competition for the resource ........................................................................................................... 20
2.4. Fragmentation of the internal market .............................................................. 22
3. SUBSIDIARITY: WHY SHOULD THE EU ACT? ................................................ 24
3.1. Legal basis ....................................................................................................... 24
3.2. Necessity test: Can the Member States solve the problems on their own? ..... 24
3.3. EU added value: What would be the added value of action at EU level? ....... 24
4. OBJECTIVES: WHAT SHOULD BE ACHIEVED? ............................................... 25
4.1. General objectives: .......................................................................................... 25
4.2. Specific objectives ........................................................................................... 25
5. POLICY OPTIONS ................................................................................................... 27
5.1. Baseline (option 1) .......................................................................................... 27
5.1.1. Modelling framework ...................................................................................... 28
5.1.2. EU Biomass demand and supply in the baseline ............................................. 29
5.1.3. Evolution of the problems under the baseline ................................................. 30
5.2. Policy options .................................................................................................. 35
6. WHAT ARE THE IMPACTS OF THE POLICY OPTIONS AND WHO WILL BE AFFECTED? ....................................................................................................... 43
6.1. Modelling of the options ................................................................................. 43
6.2. Impacts of the policy options on the supply and demand of biomass for energy .............................................................................................................. 44
6.3. Environmental impacts .................................................................................... 45
6.3.1. Greenhouse gas emissions ............................................................................... 45
3
6.3.1.1. Greenhouse gas emissions from the supply chain ............................. 45
6.3.1.2. Biogenic CO2 emissions and impact on forest carbon sinks ............. 47
6.3.2. Land use and biodiversity................................................................................ 48
6.3.3. Summary of environmental impacts................................................................ 49
6.4. Economic impacts ........................................................................................... 50
6.4.1. Contribution to gross added value ................................................................... 50
6.4.2. Costs for economic operators (including capital investment costs) ................ 51
6.4.3. Effects on EU industry of wood for materials ................................................. 52
6.4.4. Costs for public administration ....................................................................... 53
6.4.5. Administrative costs for economic operators .................................................. 53
6.4.6. Impacts on SMEs............................................................................................. 53
6.4.7. Impacts on rural development ......................................................................... 54
6.4.8. Impacts on the internal market and intra-EU trade ......................................... 55
6.4.9. Impacts on external trade ................................................................................ 55
6.4.10. Energy security .................................................................................. 55
6.4.11. Innovation and research ..................................................................... 56
6.4.12. Summary of economic impacts ......................................................... 56
6.5. Social impacts.................................................................................................. 56
6.5.1. Employment .................................................................................................... 56
6.5.2. Social impacts in third countries ..................................................................... 57
6.5.3. Summary of social impacts ............................................................................. 58
6.6. Impact of the criterion regarding the minimum size of installations submitted to sustainability requirements ......................................................... 58
7. COMPARING THE OPTIONS ................................................................................ 60
7.1. How effective are the policy options in addressing the identified problems? . 60
7.2. Are the policy options proportionate in addressing the problems? ................. 63
7.3. How are the policy options coherent with the wider policy agenda of the College? ........................................................................................................... 64
8. HOW WILL MONITORING AND EVALUATION BE ORGANISED? ............... 65
ANNEX 1. PROCEDURAL INFORMATION CONCERNING THE PROCESS TO PREPARE THE IMPACT ASSESSMENT REPORT ..................... 66
ANNEX 2. STAKEHOLDER CONSULTATION .............................................. 72
ANNEX 3. WHO IS AFFECTED BY THE INITIATIVE AND HOW .............. 83
ANNEX 4. ANALYTICAL MODELS USED IN PREPARING THE IMPACT ASSESSMENT ......................................................................................... 84
4
ANNEX 5. DEMAND AND SUPPLY OF BIOENERGY .................................. 93
ANNEX 6. GREENHOUSE GAS EMISSIONS FROM THE SUPPLY CHAIN 98
ANNEX 7. BIOGENIC CARBON — FINDINGS FROM REVIEWS OF SCIENTIFIC LITERATURE .................................................................................. 103
ANNEX 8. SUMMARY OF THE RESULTS OF THE STUDY ‘CARBON IMPACTS OF BIOMASS CONSUMED IN THE EU’ (BIOIMPACT) ................ 108
ANNEX 9. CLIMATE CHANGE IMPACTS OF FOREST BIOENERGY — TIME HORIZON AND NON-GREENHOUSE GAS CLIMATE FORCERS ...... 121
ANNEX 10. DISCARDED OPTIONS ................................................................ 126
ANNEX 11. IMPACT OF POLICY OPTIONS ON PRICE OF WOOD-BASED MATERIALS ............................................................................................ 129
5
GLOSSARY
Bioenergy All energy produced from biomass sources
Biofuels Liquid or gaseous fuel for transport produced from biomass
Biogenic emissions (and removals)
Greenhouse gas emissions and removals from various biological pools. In the case of bioenergy this includes emissions/removals from plant growth, combustion, decay, etc.
Biomass
The biodegradable fraction of products, waste and residues from biological origin from agriculture (including vegetal and animal substances), forestry and related industries including fisheries and aquaculture, as well as the biodegradable fraction of industrial and municipal waste
Black liquor By-product from the chemical process of digesting pulpwood into pulp. It is used for energy in the pulp industry.
Carbon sink Removal of CO2 from the atmosphere by vegetation and soil.
Carbon stock The amount of carbon contained in the vegetation and soil of an area of forest or agricultural land
Co-firing
The combustion of two different types of materials at the same time. In the biomass context, co-firing generally means the partial replacement of coal by wood in existing coal-fired power plants
Feedstock
Biomass raw material which can be directly used as fuel or converted to another form of energy. Examples of biomass feedstocks include forest residues, straw, roundwood, short rotation coppice, maize, etc.
Forest residues Biomass usually left in the forest after the harvest, such as tree tops, branches, bark, coarse dead wood, stumps and roots
Industrial residues (industrial by-products)
By-products or residues from the wood-processing industry (for example sawdust, shavings, trimmings and bark) and from the pulp and paper industry (black liquor)
Lifecycle emissions
Emissions generated by a product over its lifetime, from its creation until its disposal. In the case of biomass, the term refers to the emissions from the time the biomass material is initially cultivated or collected (in the case of wastes and residual biomass), until the final commodity is produced (being it energy, fuel or other materials).
Particleboard Panel manufactured from small pieces of wood. These include for example low- and medium-density fibre boards, particle boards and oriented strandboard (OSB)
6
Pellets
Biomass for energy which has been dried and compressed in the form of pellets, with high energy density and low moisture content. Pellets can be made e.g. from wood or agricultural material. Pellets are produced for households and industrial market. They are traded commodities with standardized properties.
Pulpwood
Roundwood (excluding tops and branches) not satisfying the quality and/or dimensional requirements for the sawmill, veneer or plywood industries, but of sufficient size and industrial quality to be usable for the panels and pulp production.
(Industrial) Roundwood Stemwood of industrial quality (i.e. sawlog or small industrial roundwood e.g. pulpwood)
Sawlog Large diameter roundwood of sufficient length, straightness and other qualities, which can be used by the sawmilling industry
Short rotation coppice Tree plantations established and managed under an intensive, short-rotation regime, typically on agricultural land. They can be established with quickly growing species such as willow.
Solid biomass Biomass in solid form (currently mostly made from wood), by opposition to biomass in gaseous (biogas) or liquid (biofuels and bioliquids) form
Stemwood Tree stems (excluding stumps, roots, tops and branches)
Thinnings
Trees removed during thinning operations, the purpose of which is to enhance the properties (composition, stability, quality, growth) of the residual stand through the selective removal of trees. It (temporarily) reduces stand density (volume), but can increase the increment of the remaining stand and reduce future losses due to mortality. This also includes trees removed to reduce fire hazard
Supply-chain emissions
Greenhouse gas emissions associated with the production of the bioenergy commodity. They include emissions from fossil sources used throughout the life cycle of the biomass, including cultivation, processing and transport. They also include emissions from direct land use change (according to methodology in Directive 2009/28/EC and COM(2010)11). They exclude biogenic CO2 emissions and removals.
Wood chips Wood that has been reduced to small pieces (typically several centimetres across) and can be used for material production (pulp/panels) or as fuel.
7
ACRONYMS
CHP Combined Heat and Power ETS Emissions Trading Scheme GHG Greenhouse gas INDC Intended Nationally Determined Contribution IPCC Inter-governmental Panel on Climate Change JRC Joint Research Centre of the European Commission LCA Life Cycle Analysis LULUCF Land Use, Land Use Change and Forestry
REDD Reducing emissions from deforestation and forest degradation
NGOs Non-Governmental Organizations UNFCCC United Nations Framework Convention on Climate Change
8
1. CONTEXT OF THE INITIATIVE
The 2009 Climate and Energy Package introduced a legislative framework to deliver a number of climate and energy objectives by 2020, namely a 20 % reduction in greenhouse gas (GHG) emissions, a 20 % share of renewable energy of all energy consumed in the EU and a 20 % reduction in energy consumption. The Directive 2009/29/EC on renewable energy sources (RES) was a key element of the 2009 package. It aims, in particular, to promote renewable energy sources, including bioenergy, and to deliver greenhouse gas emissions reductions as part of the EU’s policy to tackle climate change.
The RES Directive established two objectives: (i) a 20 % target for renewable energy as a proportion of the total energy consumed in the EU; and (ii) a 10 % target for renewable energy as a share of energy used in the transport sector. This latter target has been implemented by Member States through various measures, including subsidies or obligations to blend biofuels into conventional petrol and diesel transport fuels.
The 2009 Climate and Energy Package also added a requirement to reduce the greenhouse gas intensity of the EU fuel mix by at least 6 % by 2020 compared to a 2010 baseline into the Fuel Quality Directive. Biofuels are expected to deliver most of this reduction.
Both, the Renewable Energy Directive and the Fuel Quality Directive contain binding sustainability requirements for biofuels that are accounted towards the above targets.
In January 2014, the Commission set out its views on a new policy framework on climate and energy for 2030, which was broadly endorsed by the European Council. The Commission indicated that it would not propose new targets for the share of renewable energy in the transport sector or for the decarbonisation of transport fuels. The European Council subsequently agreed three new targets for 2030: (i) a target to reduce the EU greenhouse gas emissions by 40 % relative to emissions in 1990, (ii) a renewable energy target of at least 27 % at Union level; and (iii) an indicative target for energy efficiency of at least 27 % at Union level. The implementation of these targets will be supported through the actions described in the Energy Union Framework Strategy in pursuit of its key objective — to provide households and businesses in the EU with secure, sustainable, competitive and affordable energy.
The EU has also an objective to decarbonise its economy by 2050 with an 80-95 % reduction of GHG emissions compared to 1990.1 The Paris Agreement2 established the goal to limit global warming to well below 2 °C relative to the pre-industrial level. In addition, the Agreement has an aspirational goal to pursue efforts to limit the temperature increase to 1.5 °C.
This initiative is closely related to several others:
– The Commission has adopted a legislative proposal on the distribution of effort between Member States in reducing national emissions of greenhouse gases outside
1 http://www.consilium.europa.eu/uedocs/cms_data/docs/pressdata/en/ec/119175.pdf 2 http://unfccc.int/paris_agreement/items/9485.php.
9
sectors covered by the EU’s emissions trading system.3 The use of bioenergy is one of the tools available to Member States to meet those objectives.
– The Commission has adopted a legislative proposal on reducing emissions of greenhouse gases in the EU’s emissions trading system (ETS).4 The use of bioenergy is one of the tools available to ETS installations to comply with their obligations.
– The Commission has also adopted a proposal for a regulation on emissions in the land use, land use change and forestry (LULUCF) sector5 which ensures that emissions from this sector are fully included in the EU’s 2030 climate commitments, and makes the link between the use of wood for energy and forestry carbon stocks6 in the EU.
– The Commission is preparing in parallel an initiative to promote sources of renewable energy in relation to the EU’s target of 27 % of renewable energy by 2030. The current initiative can affect the use of bioenergy in the renewable energy mix, on the one hand by setting out sustainability restrictions, and on the other hand by giving more certainty to operators and acceptance to the public.
– The European strategy for low-emission mobility7 provides analysis and scenarios regarding the use of bioenergy in the transport sector in the coming decades.
– The initiative on the future design of electricity markets, in conjunction with the reviewed renewables directive, will address the generation of electricity with the aim of reforming the markets in order to maximise the revenues and reduce the need for public intervention.
– The Commission has adopted an action plan for the circular economy, which encourages resource and energy efficiency, including through the cascading use of bio-based materials, such as wood.
This impact assessment therefore examines the need and options for a policy on the sustainability of bioenergy in the context of these other policy proposals.
3 COM(2016)482. 4 Revision of the ETS Directive :2015/148 (COD) 5 COM(2016)479 6 In national inventories, greenhouse gas emissions from wood combustion are accounted as zero in the energy sector because these emissions are accounted in the LULUCF sector – see more explanations in section 0. 7 COM(2016)501
10
2. WHAT IS THE PROBLEM AND WHY IS IT A PROBLEM?
Bioenergy represents a significant part in the renewable energy mix in Europe. Traditionally, it has been used mostly for heat, but its use for transport and electricity production increased in the early 2000s, following the adoption of the 2001 Renewable Electricity Directive and the 2003 Biofuels Directive8. This increase was further driven by the adoption of the 2009 Renewable Energy Directive9, which sets out national renewable energy targets for each Member State. Each Member States has prepared a National Renewable Energy Action Plan presenting how they intend to reach their national target, and in particular the planned mix of renewable energy technologies, including biomass. For renewables in transport, the policy was further complemented by the revised Fuel Quality Directive10 requiring a reduction in the greenhouse gas intensity of the EU fuel mix by at least 6% by 2020. Public support in different forms, including subsidies, has then been put in place to implement these plans.
Although the recent development of bioenergy is mostly due to targeted policies implemented through public support, in some cases it has also been market driven. Although a precise quantification is difficult, model projections11 for the period 2016-2020 show for example an increased capacity for biomass electricity in that period of 21 GW due to support schemes, and 5 GW market driven.
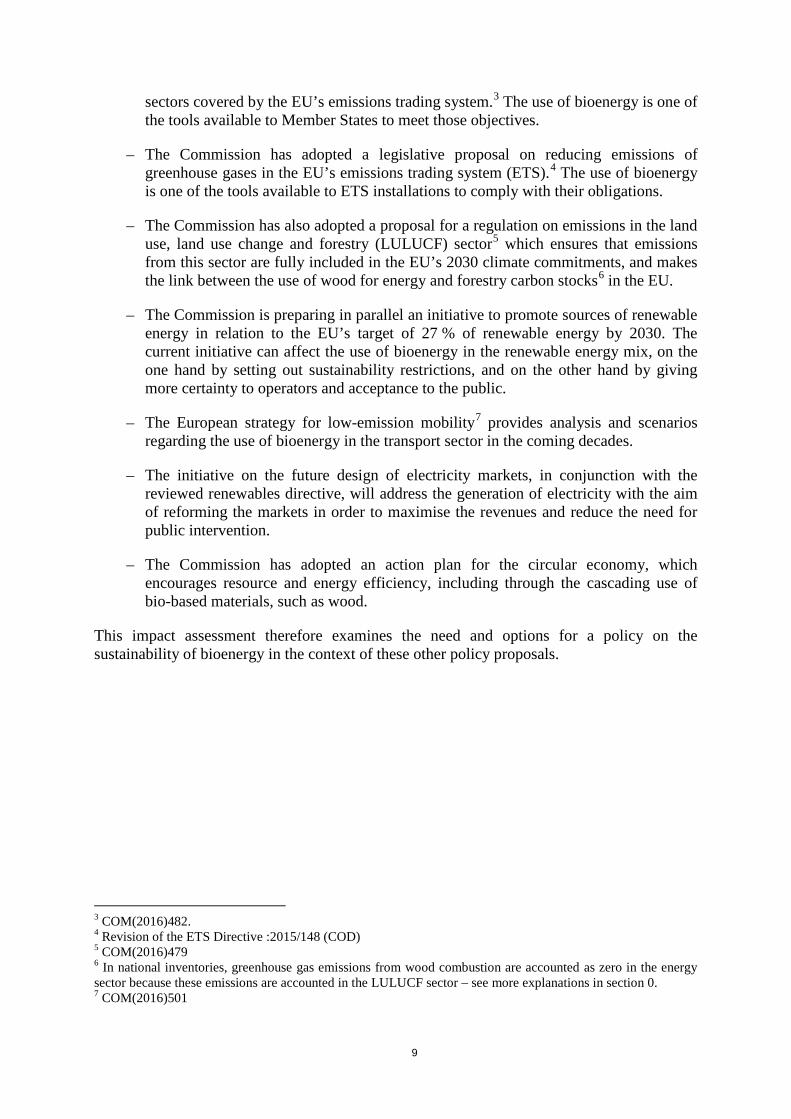
In 2014, bioenergy represented 60% of the final renewable energy consumed in the EU12 and about 10% of the gross final energy consumed. Bioenergy is used mostly for heat, followed by electricity generation, and transport. It provided in 2014 88% of renewable energy in heating, and 19% of renewable electricity. Most of the bioenergy is used in solid form; biogas and liquid biofuels represent smaller shares (see Figure 1). Annex 5 provides more information and quantitative data about the production, use, and trade of bioenergy in the EU.
8 Directive 2003/30/EC 9 Directive 2009/28/EC 10 Directive 2009/30/EC 11 Projections by PRIMES, see description of the modelling framework in section 0 12 Bioenergy represented 103.6 Mtoe out of 174.5 Mtoe for renewable energy
11
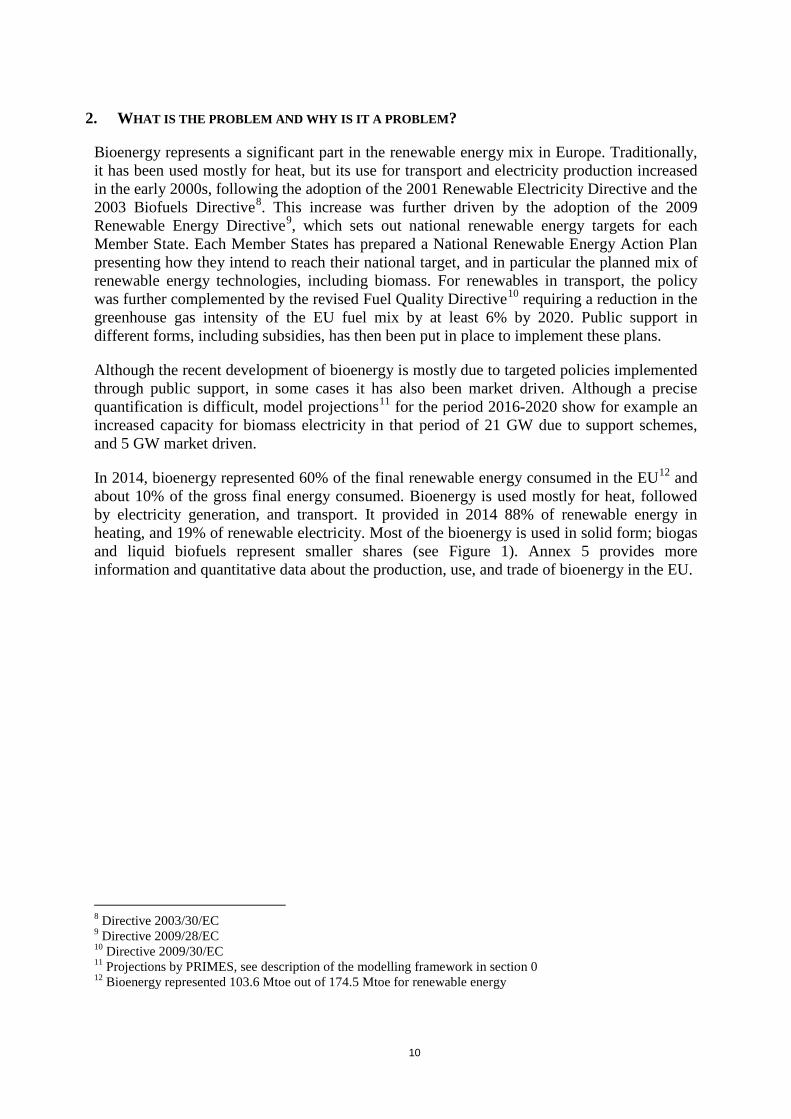
Figure 1: Gross inland energy consumption, EU 28, 2014 (source: Eurostat) The use of bioenergy varies widely across Member States, as shown in Figure 2. In absolute terms, Germany, France, Sweden and Italy have the highest consumption of biomass for energy, whereas in relative terms, the highest share of bioenergy compared to other energy sources is found in Latvia, Finland and Sweden (in these three countries, bioenergy represents more than 30% of final energy consumption).
Figure 2- Final energy consumption of bioenergy in 2014 (Mtoe) per Member State in 201413
The analytical modelling undertaken to support the 2030 climate and energy framework14 projects an increasing role for bioenergy by 2020 and 2030 in order to meet the EU's climate and energy targets, as well as in the longer term to meet the 2050 climate objectives. Figure 3
13 13 Source: Eurostat/ JRC NREAPs Data Portal 14 Projections for future use of bioenergy in the EU have been made in the context of the modelling work carried out in preparation of the 2030 climate and energy policy package, using the PRIMES model (see Annex 4).
Fossil fuels 73%
Nuclear 14%
Hydropower 2% Wind 1.36%
Solar 0.75%
Geothermal 0.38%
Woody biomass & other solid biomass 76.6%
Biogas 11.6% Liquid biofuels
in transport 11.8%
Bioenergy 8.0%
02468
1012141618
BE
BG CZ
DK DE EE IE EL ES FR IT CY LV LT LU HU
HR
MT
NL
AT PL PT RO SI SK FI SE UK
Mto
e
Bioheat Bioelectricity Biofuels
12
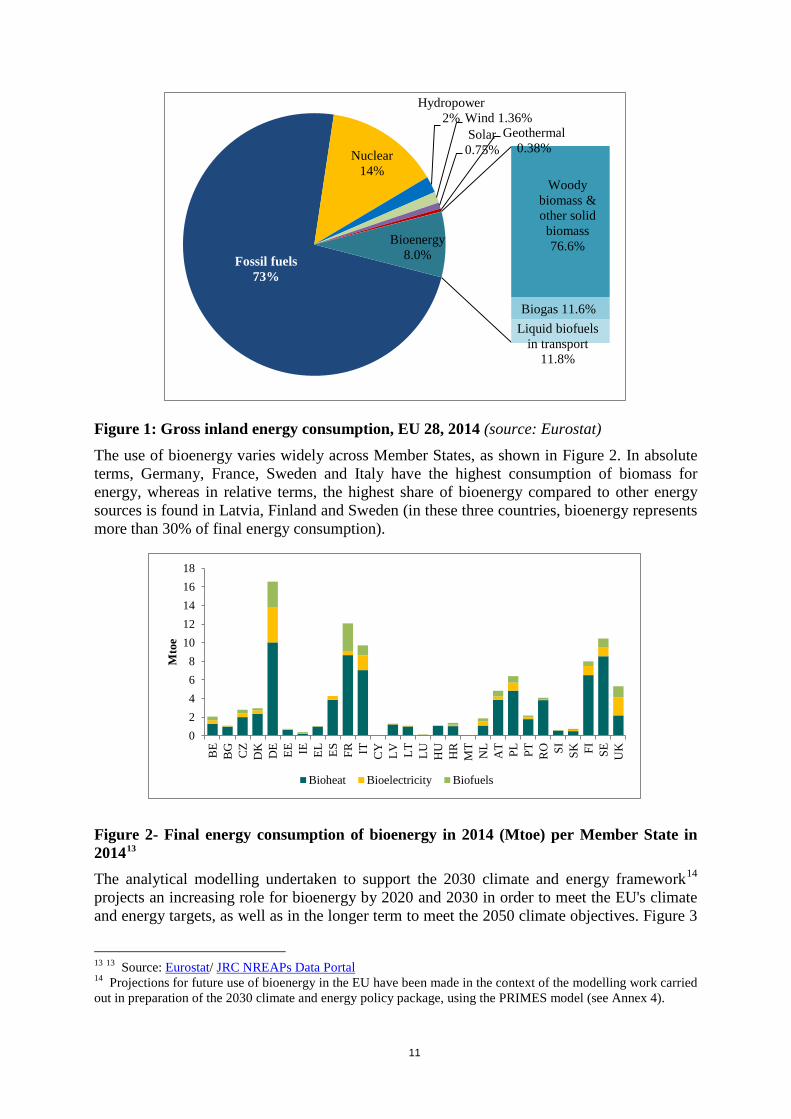
shows the model projections for bioenergy use with the full implementation of the 2030 climate and energy targets, including a target for energy efficiency of 27% (EUCO27) or 30% (EUCO30).
The model projects that the use of bioenergy would grow steeply between 2015 and 2020 (increase of 27%), as a result of the implementation of EU and national binding renewable targets for 2020 by EU Member States. Between 2020 and 2030, bioenergy use would level off, due on the one hand to energy efficiency measures (reducing in particular demand in the heating sector), and on the other hand to a drop in the cost of other sources of renewable electricity. If the EU achieves a 27% energy efficiency target by 2030, bioenergy use would increase by 4% between 2020 and 2030. With a 30% energy efficiency target, bioenergy use would decrease by 2%. The modelling also shows that there could be an increase in the post-2030 period in particular in the transport sector (advanced biofuels), driven by the 2050 objective of -80 % greenhouse gas emissions.15
Figure 3: Historical and projected EU bioenergy demand as modelled by PRIMES
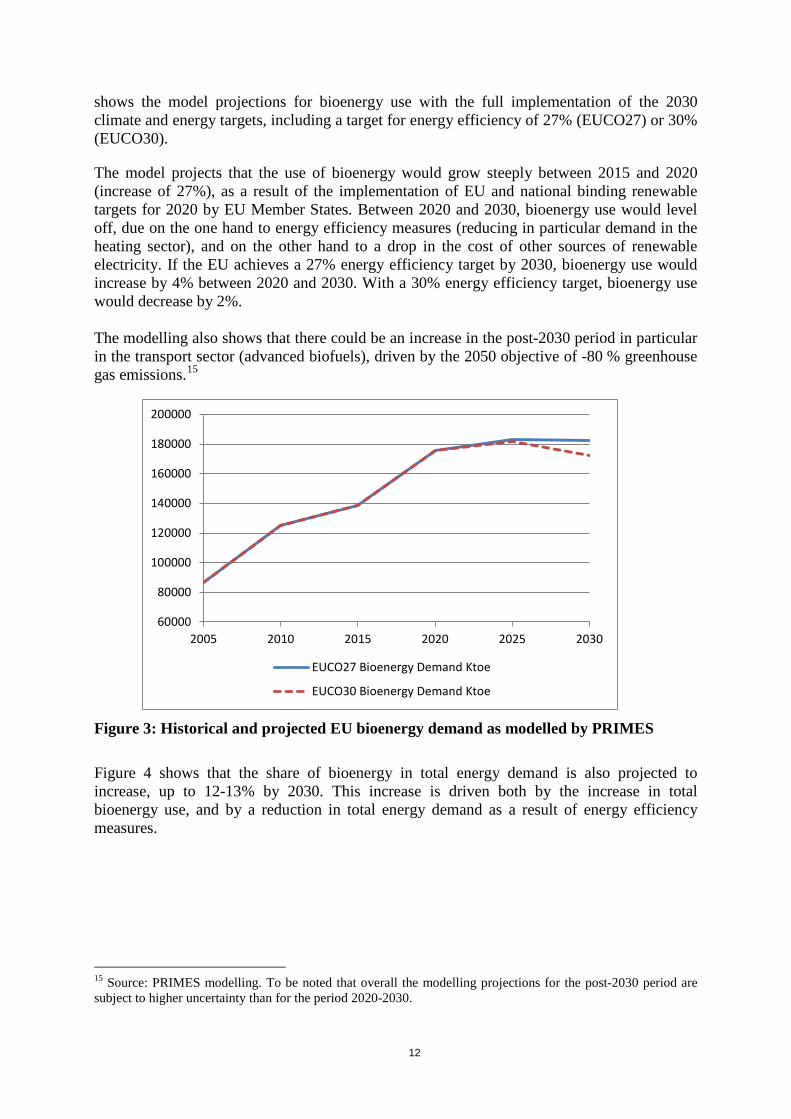
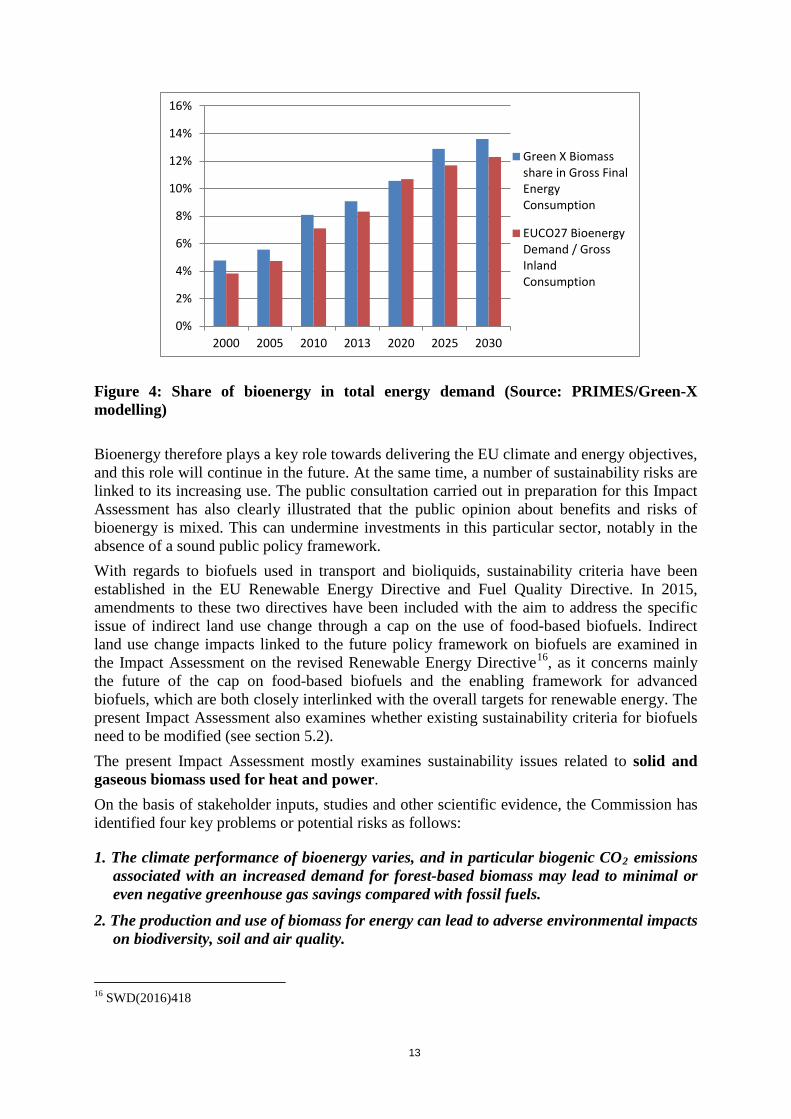
Figure 4 shows that the share of bioenergy in total energy demand is also projected to increase, up to 12-13% by 2030. This increase is driven both by the increase in total bioenergy use, and by a reduction in total energy demand as a result of energy efficiency measures.
15 Source: PRIMES modelling. To be noted that overall the modelling projections for the post-2030 period are subject to higher uncertainty than for the period 2020-2030.
60000
80000
100000
120000
140000
160000
180000
200000
2005 2010 2015 2020 2025 2030
EUCO27 Bioenergy Demand Ktoe
EUCO30 Bioenergy Demand Ktoe
13
Figure 4: Share of bioenergy in total energy demand (Source: PRIMES/Green-X modelling) Bioenergy therefore plays a key role towards delivering the EU climate and energy objectives, and this role will continue in the future. At the same time, a number of sustainability risks are linked to its increasing use. The public consultation carried out in preparation for this Impact Assessment has also clearly illustrated that the public opinion about benefits and risks of bioenergy is mixed. This can undermine investments in this particular sector, notably in the absence of a sound public policy framework. With regards to biofuels used in transport and bioliquids, sustainability criteria have been established in the EU Renewable Energy Directive and Fuel Quality Directive. In 2015, amendments to these two directives have been included with the aim to address the specific issue of indirect land use change through a cap on the use of food-based biofuels. Indirect land use change impacts linked to the future policy framework on biofuels are examined in the Impact Assessment on the revised Renewable Energy Directive16, as it concerns mainly the future of the cap on food-based biofuels and the enabling framework for advanced biofuels, which are both closely interlinked with the overall targets for renewable energy. The present Impact Assessment also examines whether existing sustainability criteria for biofuels need to be modified (see section 5.2). The present Impact Assessment mostly examines sustainability issues related to solid and gaseous biomass used for heat and power. On the basis of stakeholder inputs, studies and other scientific evidence, the Commission has identified four key problems or potential risks as follows:
1. The climate performance of bioenergy varies, and in particular biogenic CO2 emissions associated with an increased demand for forest-based biomass may lead to minimal or even negative greenhouse gas savings compared with fossil fuels.
2. The production and use of biomass for energy can lead to adverse environmental impacts on biodiversity, soil and air quality.
16 SWD(2016)418
0%
2%
4%
6%
8%
10%
12%
14%
16%
2000 2005 2010 2013 2020 2025 2030
Green X Biomassshare in Gross FinalEnergyConsumption
EUCO27 BioenergyDemand / GrossInlandConsumption
14
3. The increasing combustion of large volumes of biomass in low-efficiency installations, driven by public support, can create additional pressure on resources, in particular in the case of electricity only plants.
4. Increased administrative burden and related costs for operators induced by differing binding sustainability requirements across EU Member States.
2.1. Climate impacts of bioenergy17
In the public consultation undertaken for the preparation of this initiative (see Annex 2), a vast majority of respondents supported climate change mitigation as the most important objective of the policy on the sustainability of bioenergy. However, their analysis of how to reach this objective varied: many of the respondents considered bioenergy as a risk to the climate, while many others considered it as an important contribution to climate change mitigation. The impacts on climate change of solid and gaseous biomass used for heat and electricity are complex and can vary significantly (from very positive to very negative impacts, i.e. reducing or increasing emissions compared to fossil fuels). However, a growing body of scientific evidence is available to understand these impacts. A recent study18 carried out for the European Commission has for example shown that, taken as a whole, bioenergy can make a significant contribution to greenhouse gas emission reductions, but that the level of this contribution depends on the scale and type of bioenergy considered: more specifically an increase in forest feedstock can result in net greenhouse gas emissions (as detailed in section 2.1.2). The greenhouse gas performance of bioenergy from a lifecycle perspective depends on the emissions from the supply chain of bioenergy (which include emissions from direct land use change, cultivation, transport, processing19), as well as on biogenic CO2 emissions, which include the emissions from combustion of the biomass source and the CO2 absorbed due to plant regrowth. For agricultural biomass, supply chain emissions provide a good proxy for the lifecycle emissions20 (excluding indirect land use change). For forest biomass, on the other hand, biogenic CO2 emissions and removals — i.e. emissions and removals from the biological pools — need to be taken into account, and can have a critical role in the overall climate performance. Annexes 7, 8 and 9 give more in-depth information on biogenic carbon from forest biomass.
2.1.1. Greenhouse gas emissions from the supply chain
Emissions from the supply chain form a part of bioenergy's net greenhouse gas performance. In the case of biofuels for transport and of bioliquids, a specific requirement is set out as part of the existing sustainability criteria21 in order to discourage the worst performing biofuels pathways in terms of supply chain emissions. This current requirement includes a
17 This section does not include climate impacts due to indirect land use change 18 Described in section 2.1.2 and Annex 8 19 E.g. transformation into wood pellets 20 Given that plant regrowth takes place over a short period. 21 Included in the Renewable Energy Directive and the Fuel Quality Directive
15
methodology for calculating supply chain emissions as well as a binding minimum threshold for supply chain emission reduction compared to fossil fuels. Additional criteria were set to avoid the conversion of high carbon stock areas for biofuels cultivation. A similar methodology (although non-binding) was developed by the Commission for solid and gaseous biomass used for heating and electricity production.22 Supply chain emissions are compared against reference values for greenhouse gas emissions of fossil fuels (including both supply chain and combustion emissions) used for electricity and heating. The performance of different pathways is presented in Annex 6. Supply chain emissions vary significantly for agricultural feedstocks23, from a small fraction of fossil greenhouse gas emissions to much larger share, or even in a few cases higher emissions than those of the fossil comparator. Hence, in some cases involving suboptimal technologies (such as biogas produced from energy crops with an open digestate storage), the greenhouse gas savings associated with the production of bioenergy from agricultural feedstocks are small or negative.
For forest-based feedstocks, supply chain emissions are usually low compared to the fossil fuel emissions, for most of the pathways commonly used today (including imports of pellets from third countries).
The supply chain emissions associated with bioenergy are generally24 accounted for in national greenhouse gas inventories, primarily in the non-ETS sector (e.g. emissions from transport or cultivation). Drivers For solid biomass (including forest-based and short rotation coppice feedstocks), the main factors influencing greenhouse gas emissions from the supply chain are conversion efficiency, processing (technology and efficiency), the use of fertilisers, and (to a lesser degree) the distance and mode of transport. For biogas, emissions vary significantly depending on the feedstock (e.g. emissions of biogas from energy crops are similar or even slightly higher than fossil fuels) and, mainly, the conversion technology (with methane leakage – both structural and accidental - playing an important role). Biogas production from animal manure on the other hand can reduce methane emissions which would otherwise be emitted into the atmosphere, provided that appropriate technological solutions are used (e.g. use of a gas-tight tank for the storage of the residual digestate).25
2.1.2 Biogenic greenhouse gas CO2 associated with forest-based biomass for energy
The assessment of the greenhouse gas performance over the entire lifecycle of bioenergy sources often only include emissions linked to the supply chain (described in the previous 22 See in particular COM(2010)11 final and SWD(2014)259. 23 Agricultural feedstocks include short rotation coppice 24 To the extent they occur domestically and do not involve international maritime transport. 25 Manure management is responsible for significant greenhouse emissions in the livestock sector. Anaerobic digestion and collection of the produced methane can reduce these emissions substantially.
16
section) and do not include the CO2 released by the combustion of biomass. This is because it is assumed that the CO2 emitted will be compensated by the CO2 captured during plant regrowth.
However, compared to crops which regrow over short periods, forest biomass is part of a much longer carbon cycle. A forest stand typically takes between decades and a century to reach maturity. Recent studies have found that when greenhouse gas emissions and removals from combustion, decay and plant growth (so-called biogenic emissions from various biological pools) are also taken into account, the use of certain forest biomass feedstocks for energy purposes can lead to substantially reduced or even negative greenhouse gas savings compared to the use of fossil fuels in a given time period (e.g. 20 to 50 years or even up to centuries)26
Currently, the majority of the solid biomass used for energy purposes in the EU can be considered to deliver substantial greenhouse gas benefits even when taking into account biogenic emissions. This is because the forest biomass that is used consists mostly of industrial residues27 as well as harvest residues (branches, tree tops) and traditional fuel wood. Studies show that these feedstocks generally deliver a beneficial greenhouse gas performance when compared to fossil fuels.28
However, this may change in the future if the demand for forest biomass continues to grow. In particular, the availability of industrial residues in the EU is limited and there is currently little spare capacity. There are also uncertainties over the types, amount and geographical origin of forest feedstocks which will be supplied in response to increased demand, but these could increasingly come from additional harvesting, rather than forest residue removal, and include feedstocks or forest management practices which are more risky in terms of their biogenic emissions, such as an increased use of small industrial roundwood29 or stumps.30 Hence, and as shown by a recent study31 (detailed in ANNEX 8), an increase in use of forest biomass for energy may lead to limited greenhouse gas savings or to an increase in emissions.
The issue of biogenic carbon from forest biomass is one the most debated among stakeholders. The industry and forest owners generally see forest biomass overall as supporting climate change mitigation, whereas NGOs point to biogenic carbon emissions as one of the main risks from using forest biomass for energy.
Drivers
The contribution of biogenic carbon to greenhouse gas emissions of forest bioenergy is sensitive to the scale of consumption: a significant increase in forest biomass use is more likely to generate high biogenic emissions32 (as discussed in ANNEX 7). Biogenic emissions could therefore be higher by 2030 and 2050, if a significant amount of forest biomass is used 26 See in particular JRC, 2014 'Carbon accounting of forest bioenergy' and Forest research, 2014 ‘Review of literature on biogenic carbon and life cycle assessment of forest bioenergy’. 27 More than half of solid biomass use in the EU in 2013. 28 See Annex 7 29 E.g. roundwood of pulpwood quality 30 See Annex 7 31 ‘Carbon impacts of biomass consumed in the EU: quantitative assessment’ – Forest Research, 2015. 32 Forest research, 2014 ‘Review of literature on biogenic carbon and life cycle assessment of forest bioenergy’. and Forest Research, 2015 'Carbon impacts of biomass consumed in the EU: quantitative assessment'
17
to meet the EU’s climate targets. The scale of use of forest biomass will also depend on how other, non-forest feedstocks are used for bioenergy (e.g. agricultural residues, short rotation coppice, etc.) as well as on the overall bioenergy demand.
Uncertainties exist on the market response to an increased demand of wood for energy, which in turn can have an effect on its climate impacts. This concerns in particular the behaviour of forest owners: indeed, an increase in the demand for forest biomass for energy and the resulting increase in wood price can result in a higher harvesting intensity (leading to a decreased carbon stock in the forest), but also in better preservation of carbon stocks through avoided deforestation or increased investments in the forest (in order to secure future revenues)33. The responses are also subject to site-specific conditions and may be different for EU and non-EU forests. There is a lack of empirical data today that would allow for a more accurate assessment and quantification of these phenomena.
ANNEX 8 also discusses other issues related to the climate impacts of forest bioenergy, such as long-term impacts and non-greenhouse gas climate forcers.
Sustainable forest management practices (e.g. implemented through national legislation or in the context of certification schemes) play a role in mitigating the risk of overharvesting of forests. As such, they cannot guarantee that an increase in forest biomass for energy will deliver greenhouse gas savings,34 but they can avoid excessive wood removals which would result in a decrease in carbon sinks.
Box: Forest biomass for energy and the accounting of GHG emissions in the land use, land use change and forestry (LULUCF) sector
Under international guidance35 for the preparation of national greenhouse gas inventories, CO2 emissions from biomass combustion are not reported in the energy sector (‘zero rating’). This is to avoid double counting, because it is assumed that these emissions are accounted as part of the emissions from the land use, land use change and forestry (LULUCF) sector36 in the same national inventory.37 This zero rating has often been misinterpreted as meaning that biomass combustion emissions are always compensated by regrowth (‘carbon neutrality’).
The proposed EU 2030 climate framework mirrors international rules: biomass combustion counts as zero emissions under the EU ETS and the Effort Sharing Regulation because, to the extent they lead to carbon stock changes on land, emissions would be accounted for under the LULUCF sector.38 Most of the domestic forest biomass harvest will come from the ‘managed forest land’ category, where emissions and sinks are accounted for by comparison to a projected reference level. Because the LULUCF sector is included in the EU’s economy-wide objectives for greenhouse gas reduction by 2030, if emissions occur in the LULUCF sector 33 Biomass for energy is generally a lower value product for forest owners, at the same time it can generate additional revenue and influence investment and/or harvest decisions. 34 As shown in Forest research, 2015, where all scenarios examined assume that the level of forest harvest is less than the annual forest growth. 35 From the Intergovernmental Panel on Climate Change (IPCC) 36 For annual crops, the IPCC Guidelines assume that biomass carbon stock lost through harvest and mortality equal biomass carbon stock gained through regrowth in that same year and so there are no net CO2 emissions or removals from biomass carbon stock changes. See also http://www.ipcc-nggip.iges.or.jp/faq/faq.html 37 They are accounted as occurring instantaneously at the moment of harvest of the wood. 38 COM(2016)479
18
from biomass used for energy, they would have to be compensated by emission reductions elsewhere in the economy.
Hence, after 2020 biogenic emissions from the use of EU-produced forest-based feedstocks for energy will be accounted by Member States in their national LULUCF inventories and towards their 2030 commitments, while supply chain emissions occurring in the EU (cultivation, transport etc.) will be accounted under the EU ETS and the Effort Sharing sectors.
This would also be the case for non-EU countries that have included the LULUCF sector in their overall GHG reduction objectives and account for these emissions towards their internationally agreed commitments.
2.2. Impacts on biodiversity, water, soil and air quality
The production and use of biomass for energy can cause harmful environmental impacts in certain cases. These concern mainly biodiversity, soil, and air quality.
The production of agricultural biomass can result in negative impacts on soils (e.g. loss of nutrients and soil organic matter, erosion, peatland drainage), water availability (in particular in water scarce areas39 ) and biodiversity40. A 2013 study41 concluded that ‘considerable potential risks to sustainability from biofuel cultivation exist, particularly risks to soils and to water quality and water availability’.42 The use of agricultural residues (such as straw) can also cause negative impacts on soils (fertility and structure) and on biodiversity if extracted in excessive amounts. On the other hand, the use of waste (for example manure) to produce biogas can significantly reduce methane and other emissions. In the EU, the rules of cross-compliance under the Common Agricultural Policy ensure the implementation of existing environmental requirements and the requirement of maintaining land in good agricultural and environmental condition.
An increased production and use of forest biomass for energy can also cause negative environmental impacts.43 For example, an excessive removal of harvest residues, or the removal of stumps, can harm soil productivity, biodiversity, and water flows.44 If done sustainably, additional mobilisation of forest biomass can also have positive impacts (e.g. removal of early thinnings beneficial to biodiversity, improvement of forest structure, prevention of fires, pests and diseases, afforestation on eroded land, etc.). Often, such practices incur barriers (such as higher costs) compared to traditional forest management.
39 http://publications.jrc.ec.europa.eu/repository/bitstream/JRC102696/jrc102696%20online.pdf 40 Study on Impacts on Resource Efficiency of Future EU Demand for Bioenergy, 2016, task 2: http://ec.europa.eu/environment/enveco/resource_efficiency/pdf/bioenergy/Task%202.pdf . 41 https://ec.europa.eu/energy/sites/ener/files/documents/2013_tasks3and4_requirements_soil_air_water.pdf . 42 The same study also states: ‘It is evident that the soil, water and air risks from feedstock cultivation for biofuel are on the whole the same as the risks from any kind of agricultural expansion. However, the study has found that in many situations, biofuel markets bring additional pressure on the areas under existing agricultural use and have acted as an important driver in the intensification and expansion of intensive agriculture into areas with challenging soil conditions in particular.’ 43 Study on Impacts on Resource Efficiency of Future EU Demand for Bioenergy, 2016, task 2: http://ec.europa.eu/environment/enveco/resource_efficiency/pdf/bioenergy/Task%202.pdf 44 Deadwood and in particular coarse deadwood has an important role in preserving biodiversity in forests.
19
In the EU, sustainable forest management (SFM) is actively promoted in the context of the EU Forest Strategy45 and in the Forest Europe process.46 Most Member States have in place legislation and other measures to promote sustainable forest management practices.47 There are however no EU-wide binding standards ensuring an equal and high level of sustainable forest management practices across the EU Member States, and such standards don’t necessarily exist in non-EU countries that supply biomass to the European market.
Deforestation or other land use change (for example conversion of land with high biodiversity to cropland) is also a risk linked to biomass production48. It can happen directly or indirectly as a result of a higher demand for bioenergy. With regards more specifically to wood used for energy, it has been shown that an increase in demand and prices can lead to an increase in harvesting intensity, but at the same time to a reduction in deforestation due to the higher value of the standing forest.49
In the EU, the risk of deforestation is low given existing national legislation on forests. Restrictions for the conversion of grassland also exist (with variations among EU Member States). However these can take place outside of the EU, as a direct or indirect effect of EU bioenergy demand.
Finally, biomass combustion is a source of air pollution.50 According to the World Health Organisation, residential heating with solid fuels (coal or wood) is an important source of particulate matters and carcinogenic compounds in particular in Central Europe.51 Increasing the use of solid biomass for energy, in particular in domestic combustion and small and medium-sized installations, can therefore compromise air quality locally or regionally, particularly given the fact that most residential heating systems used today are relatively inefficient.
In the EU, Ecodesign requirements will enter into force in 2020 for solid fuel boilers and local space heaters52 and ensure the efficiency of new devices. In addition, existing EU legislation on air pollution includes requirements on medium53 and large combustion plants.54
The importance of risks to biodiversity and air quality from the use of biomass for energy has been highlighted by about one third of the respondents to the public consultation. These views
45 COM(2013)659. 46 http://www.foresteurope.org/ 47 http://ec.europa.eu/agriculture/forest/publications/pdf/sfcci-report_en.pdf and Forest Europe – State of Europe’s Forests 2015 48 The existing sustainability criteria for biofuels forbid the conversion of land with high carbon stock (such as wetlands or forests) for biofuels production, as well as the cultivation of biofuels feedstocks on land with high biodiversity such as primary forest or highly biodiverse grassland. No such criteria exist for biomass used for heat and electricity. 49 http://ec.europa.eu/environment/enveco/resource_efficiency/pdf/bioenergy/Task%204.pdf 50 For all air impacts, see the impact assessment on air policy (2013): http://ec.europa.eu/environment/archives/air/pdf/Impact_assessment_en.pdf and the impact assessment for solid fuel boilers and room heaters ecodesign regulation (2015): http://ec.europa.eu/smart-regulation/impact/ia_carried_out/docs/ia_2015/swd_2015_0092_en.pdf 51http://www.euro.who.int/__data/assets/pdf_file/0009/271836/ResidentialHeatingWoodCoalHealthImpacts.pdfAccording to this report, each year 61 000 premature deaths are attributable to ambient air pollution from residential heating with wood and coal in Europe. 52 Commission Regulation (EU) 2015/1189 and 2015/1185. 53 Directive (EU) 2015/2193. 54 Directive 2010/75/EU.
20
were present across the stakeholder spectrum, but were particularly frequent among civil society organizations, followed by public authorities and academic institutions.
Drivers
Environmental risks from the production of biomass for energy are driven by the fact that the increased demand for this biomass comes in addition to land and biomass needs for other uses, thus bringing additional pressure on resources.
With regards to air pollution, the increased use of solid biomass for heating in urban areas is a key driver, combined with the fact that most of the existing stock of domestic boilers and stoves is inefficient and polluting.55 Ecodesign requirements will improve the situation, but the replacement of the existing stock will take time given the lifetime of such devices. More generally, the scale and location of biomass combustion also strongly influences its impacts on air pollution.
2.3. Efficiency of biomass conversion56 and increasing competition for the resource
The efficiency of conversion of solid biomass to energy varies significantly depending on the type of conversion (i.e. to deliver electricity, heat, or combined heat and power) and the inherent efficiency of the plant. 57 The efficiency is generally in the range of 15-40 % to produce electricity only, 60 % and more in plant that combines heat and electricity production (combined heat and power – CHP), and up to 90-95 % in recent efficient CHP and heat only biomass boilers. Burning biomass in an installation with a lower efficiency means that more feedstock is needed for a given energy output. Given that a number of sustainability risks linked to biomass production are sensitive to the scale of demand, a lower efficiency of conversion to energy will tend to accentuate these impacts; it also leads to higher air pollution. This issue has been raised by the NGOs and civil society, also pointing out its inconsistency with the goal of using resources efficiently. In the EU, half of the EU Member States produced more than 80% of their bioelectricity in CHP plants in 2014. Nonetheless, approximately 40% of all the electricity generated from biomass is produced without making use of the heat58, which corresponds to around 2% of total electricity production in the EU. In the EU, a number of policies and measures exist to promote a more efficient energy production. In particular, the Energy Efficiency Directive encourages Member States to introduce measures promoting higher energy efficiency in energy production, including cogeneration of heat and power.
55 For example, almost half of EU buildings have boilers installed before 1992, with an efficiency rate below 60% - see COM(2016) 51 final. 56 This section looks at the efficiency of combustion facilities for biomass transformed into heat and power, but does not cover lifecycle efficiencies in bioenergy pathways, such as production and use of biofuels in combustion engines nor the efficiency of transmission of various energy types (electricity, heat) to final consumers. 57 The same applies to the combustion of other solid fuels such as coal 58 AEBIOM statistical report 2016
21
The efficiency of conversion of biomass to energy has also been raised in the context of the competition for the use of feedstocks, and wood in particular. The wood industry (including pulp and paper and wood panels producers) have expressed concerns around the development of large plants burning wood with low efficiency, and therefore requiring significant amounts of feedstock. Because these plants receive public support, this increases their capacity to pay for wood, which could cause market distortion (including an increase in wood prices) as industries do not receive such support. This applies particularly to sawmill residues (i.e. sawdust, used for panels), waste wood, and small industrial roundwood.59 These concerns have also been expressed for certain non-EU countries exporting wood pellets to the EU. 60 Currently there is no clear trend of wood price increase: global pulpwood prices have been falling, and overall in the EU pulpwood prices have been stable in the last few years, although this hides regional and local differences (such as substantial local price increases and even shortages of supply)61. In general, stakeholders from the above-mentioned industries do not observe major economic difficulties at the moment, however they see a risk if the demand for biomass continues to grow significantly. Stakeholders have also raised concerns linked to the emergence of competition for the use of wood already today at local or regional level, as well as in some non-EU countries62. Drivers An important driver for the development of low efficiency conversion of biomass to energy is the fact that replacing coal by wood in existing coal-based power plants is an easy way to increase the use of renewable energy at national level without major additional investments or changes to the existing infrastructure. The national policies are in turn driven by the legally binding requirement to reach the 2020 targets. A number of Member States have therefore followed this path and given public support to such practices. Large-scale electricity-only biomass plants often receive state aid in order to be economically viable, as well as other advantages such as priority dispatch63. A recent study64 found that subsidies to the use of wood for energy increase the purchasing capacity for energy use of feedstocks, and thereby can exacerbate competition between the energy sector and the panel and paper sectors. This concerns particularly the use of industrial residues (i.e. sawdust) and waste wood. Competition for pulpwood can happen when a pulp mill or a wood panel plant and a bioenergy plant are geographically close to each other so that their raw material catchment areas overlap. The same study points out that the impacts of subsidy regimes can vary depending on specific situations, in particular due to the subsidy scheme design, aid intensity, duration, etc. In 2014, the amount of subsidies for electricity produced from biomass was equal to approximately a fifth of all subsidies received by renewable energy in the EU. See more information on the level of subsidy in Annex 5. 59 Sawnwood is generally not used for energy due to its higher price. 60 See for example COWI, 2016: Environmental Implications of Increased Reliance of the EU on Biomass from the South East US - http://bookshop.europa.eu/en/environmental-implications-of-increased-reliance-of-the-eu-on-biomass-from-the-south-east-us-pbKH0116687/?CatalogCategoryID=DSoKABstDacAAAEjA5EY4e5L 61 Modelling results show that there could be an increase in prices for harvested wood and semi-finished forestry
products by 2030 ( see Recebio, task 3 fig 8: http://ec.europa.eu/environment/enveco/resource_efficiency/pdf/bioenergy/Task%203.pdf )
63 i.e. priority access to the electricity grid independently of the marginal cost of producing this electricity 64 Vis M., U. Mantau, B. Allen (Eds.) (2016) Study on the optimised cascading use of wood
22
In addition, for installations covered by the EU Emissions Trading Scheme, burning biomass is counted as zero greenhouse gas emissions (because emissions would be accounted for in the land-use and forestry sector65) – in itself, this does not constitute an incentive for an efficient combustion of biomass. Another factor relevant for the competition between different uses of feedstocks is the challenge to increase wood biomass supply in response to increased demand. A number of measures to increase wood biomass supply in the EU have long lead time (e.g. afforestation), require upfront investment (e.g. the cost of land and planting) or face other difficulties such as fragmented forest ownership structures or forest owners’ lack of interest in harvesting, which slow down the response of the sector to market signals.
2.4. Fragmentation of the internal market
Most of the biomass in the EU is currently consumed within its country of origin,66 because the bulkiness and relative low energy density and low value of the feedstocks makes it costly to transport over large distances.67 Pellets, the most easily transportable and hence tradable form of solid biomass currently represent only 6 % of the biomass consumed for energy in the EU. Projections however show that the level of import of solid biomass from non-EU countries, mostly in the form of pellets, could rise from around 3 % of solid biomass today to 10-20 % in 2030,68 although significant uncertainties remain over this level. The 2014 report on the state of play of sustainability of solid and gaseous biomass notes that barriers to trade of biomass in and to the EU seem limited today, and there is no evidence that such barriers occur to a significant degree. However concerns related to the fragmentation of the internal market have been voiced by some stakeholders, in view of the fact that differing national schemes for the sustainability of solid biomass used for energy might impede intra-EU and/or international trade in biomass in the future. Currently, there is indeed no harmonised sustainability scheme at EU level for solid and gaseous biomass. In 2010, the Commission issued a recommendation on sustainability criteria for solid and gaseous biomass, leaving Member States free to implement it. On that basis, several Member States who import large volumes of biomass from non-EU countries, such as the United Kingdom, the Netherlands, and Belgium have put in place mandatory sustainability requirements for solid and gaseous biomass used for electricity and heat. In Denmark, a voluntary sustainability scheme has been established in cooperation between industry and NGOs. The establishment of these schemes has been motivated by the need for these national governments to address public concerns about environmental impacts of the biomass originating from non-EU countries, particularly in the absence of an EU-wide scheme.
65 see more explanations in the box in section 0 66 In 2013, the biomass traded across borders (both within the EU and imports from non-EU countries) represented less than 7% of the total solid biomass consumed. Source: AEBIOM statistical report 2015. 67 For example, according to a research by the Finnish forest research institute in 2013, the average procurement distance of woodfuels for heating plants in Finland was as follows: 2MW heating plant: 30km radius, 5MW heating plant: 60km radius, 20MW heating plant: 100km radius. http://www.metla.fi/julkaisut/workingpapers/2013/mwp267.pdf. 68 Source: modelling results from PRIMES, GLOBIOM and Green-X – see section 5.
23
In order to face these potential barriers, a number of large bioenergy companies have developed a voluntary, industry-led sustainability certification scheme (the Sustainable Biomass Partnership). The scheme is designed with the aim to ensure compliance with the differing national schemes that are in place. It is already recognised in UK and Denmark and has applied to be recognised in the Netherlands. Following the setting up of the scheme in 2015, 50 organisations have been certified by September 2016.69 Whilst projections show that the level of import of solid biomass from non-EU countries, mostly in the form of pellets, could increase substantially between now and 2030,70 this increase in imports would mostly go to a small number of Member States, which in general already have a sustainability scheme in place71. It is also unlikely that Member States that mostly depend on domestic sources of biomass would develop such schemes, as for those Member States national policies on sustainable forest management are the main instrument to address sustainability risks. Considering the proactive action taken by the industry, prospects for future imports and reliance on national forest management policies by most of the EU Member States, it is rather unlikely that the risk of fragmentation of the internal market, leading in turn to increased administrative burden for bioenergy operators, will materialise in the future.
69 http://www.sustainablebiomasspartnership.org/ . 70 Source: modelling results from PRIMES, GLOBIOM and Green-X – see section 5. 71 In PRIMES projections, most of the increase in imports of solid biomass go to the UK
24
3. SUBSIDIARITY: WHY SHOULD THE EU ACT?
3.1. Legal basis
The Treaty on the Functioning of the European Union provides legal bases to act in the field of energy (art. 194), environment (art. 191) and the internal market (Article 114).
3.2. Necessity test: Can the Member States solve the problems on their own?
The EU renewable and climate change targets are set at EU level, and in particular the EU renewable energy target has been driving the significant increase in biomass consumption for energy in the EU over the past decade. It is therefore also necessary to ensure at EU level that the use of bioenergy to fulfil renewable energy targets is supporting the overall climate objective.
Some of the sustainability risks linked to the development of bioenergy have a cross border dimension and hence can be more efficiently addressed at EU level. This is in particular the case for environmental impacts such as climate change, biodiversity or air pollution. Market-mediated effects can also occur across borders, as is the case for example for indirect land use change and competition issues for biomass feedstocks.
Although cross border trade of solid biomass for energy is currently limited, it is expected to grow to some extent in the future. Hence internal market considerations are also relevant.
Member States can set their own sustainability schemes for solid and gaseous biomass to address the issues identified in Section 2. So far, only a minority of Member States have set up such schemes (mostly Member States which import biomass from non-EU countries).
On the other hand, all EU Member States have developed national policies on sustainable forest management, which are also relevant for sustainability of forest-based bioenergy.
3.3. EU added value: What would be the added value of action at EU level?
Action at EU level would:
- reinforce consistency with the different policies mentioned in Section 1 in the area of climate and energy, and in particular with the objective of climate change mitigation, as well as with other policy areas such as the Circular Economy ;
- provide a minimum assurance of sustainability for biomass used in all Member States and thereby provide reassurance to the EU operators, public authorities and the wider public;
- provide legal certainty to investors and operators.
In addition, it could prevent a possible fragmentation of the internal market.
At the same time, subsidiarity considerations will need to be adequately taken into account, in particular with respect to:
- the Member States’ freedom to determine their energy mix as guaranteed by the Treaty on the Functioning of the European Union (Article 194);
- the clear wish of EU Member States to keep their national prerogatives to determine their policies for forest management.
25
4. OBJECTIVES: WHAT SHOULD BE ACHIEVED?
The development of bioenergy needs to be seen in the wider context of a number of Energy Union priorities, including the ambition for the EU to become the world leader in renewable energy, to lead the fight against global warming, to ensure security of supply and integrated and efficient energy markets, as well as other objectives such as to reinforce Europe’s industrial base, stimulate research and innovation and promote competitiveness and job creation, including in rural areas. The commitment of the EU to meeting the 2030 Sustainable Development Goals should also be taken into account, as well as the compatibility with the circular economy. It is likely that the policy will require certain trade-offs; the policy options will therefore need to be carefully assessed against the various objectives presented below.
4.1. General objectives:
• Promote the prudent and rational utilisation of biomass as a natural resource • Ensure bioenergy’s positive contribution to reducing greenhouse gas emissions in the
economy in the context of objectives set by the EU for 2030 and 2050 • Avoid or limit harmful impacts of bioenergy on the environment • Ensure a stable legislative framework based on a functioning single market, security of
energy supply in the EU and promote new and renewable sources of energy supply.
4.2. Specific objectives
For problem 1 (climate change impacts)
• Ensure that bioenergy use in the EU delivers a significant contribution to climate change mitigation, taking into account the full lifecycle emissions including biogenic carbon
For problem 2 (impacts on biodiversity, soil, water and air)
• Discourage practices that lead to harmful impacts on the environment, in particular on biodiversity and ecosystems, air emissions, soil fertility, and water. Promote practices with positive impacts thereon.
For problem 3 (inefficient use of biomass resources)
• Promote efficient uses of biomass for energy, including in the process of conversion to energy, taking into account competition and/or synergies between the energy and non-energy uses of biomass, as well as the potential for innovation;
Other
• Ensure coherence with other EU policies, in particular on climate, energy and agriculture, as well as environment and circular economy, and compatibility with international trade rules.
• Avoid disproportionate administrative burden, in particular for small economic operators
In the public consultation, respondents were asked to rank policy objectives for this policy in order of importance. The contribution of bioenergy to climate change objectives was by far the most important objective for all stakeholder categories. Other objectives that were seen as particularly important by stakeholders included long-term certainty for operators, the efficient

26
use of biomass (including efficient energy conversion), the avoidance of environmental impacts, and the promotion of energy security.
27
5. POLICY OPTIONS
5.1. Baseline (option 1)
Under the baseline, no additional safeguard is set out at EU level on the sustainability of bioenergy for the heat and power sectors. Existing policies remain in place; however the baseline includes also a number of other elements of the 2030 Climate and Energy framework relevant for bioenergy sustainability. In addition, the existing policies remain in place.
In addition, a number of developments not included in the baseline will take place in other policy areas which are likely to have an effect on the way biomass is produced and used and hence on associated sustainability risks (although the outcome of these cannot be pre-judged). These include the review of the Regional Development Policy, as well as the Common Agricultural Policy. Public support schemes will also have an impact on bioenergy development; these would have to comply with the Environment and Energy State Aid Guidelines, which will be reviewed for the period after 2020.
The baseline scenario also includes relevant national policies (in particular national schemes for the sustainability of biomass for heat and power as well as national policies on sustainable forest management) and industry-led sustainability certification schemes for bioenergy or forest management.
Box: relevant policies included in the baseline (option 1)
Existing EU policies
- The legality of wood-based biomass placed on the EU market continues to be subject to the Timber Regulation and the Forest Law Enforcement, Governance and Trade action plan (FLEGT)
- Ecodesign rules for small solid fuel boilers (<0,5 MW) are implemented as of 2020 (2022 for solid fuel local space heaters)
- Existing EU legislation on environmental protection continues to apply (including on air emissions, biodiversity, and water protection)
- The EU Rural Development policy continues to apply and in particular the possibilities to support wood mobilisation under the European Agricultural Fund for Rural Development (EAFRD)72
New EU policies as part of the Energy Union Strategy and the 2030 Climate and Energy Framework
- the revised Renewable Energy Directive
- the new framework on the internal market for electricity,
72 In particular through the sub-measure "Investments in forestry technologies and in processing, mobilising and marketing of forest products." For the new 2014-2020 programming period more than 80 Rural Development Programmes (out of 118) have included this sub-measure.
28
- the revised Energy Efficiency Directive
- the regulation on the governance of the Energy Union
- the regulation on emissions from Land Use, Land Use Change and Forestry
- Bioenergy will also continue to benefit from a zero rating under the Commission proposals reviewing the EU Emission Trading Scheme and the Effort Sharing Regulation.
Member States policies
- Member States can continue to set their own sustainability requirements for biomass used for heat and power.
- Member States continue to apply national rules and legislations on sustainable forest management
International agreements
- The Paris Agreement on climate change is implemented by the EU and by non-EU countries that are parties to it.
In the public consultation, 35% of stakeholders responding to the public consultation considered the current policy framework to be sufficient for addressing these risks. The bulk of replies going in this direction came from private and public enterprises and from public authorities. To be noted that within the sub-group of public and private enterprises, about two-thirds of forestry enterprises considered the current framework as sufficient and only one third called for a new policy. Inversely, only one-third of energy enterprises were content with the current rules and two-thirds demanded a new policy. SMEs were more often supporting the current framework, whilst two thirds of large enterprises were in favour of a new policy. Professional association representing European forest owners supported the status quo, as well as several forest-rich Member States.
5.1.1. Modelling framework
In preparation for this impact assessment, three complementary modelling exercises have been performed, in order to understand the impacts of the baseline scenario as well as of the policy options (the modelling tools are described in more detail in Annex 4):
• The overarching PRIMES modelling carried out in preparation of the implementation of the 2030 climate and energy framework (including projections for supply and demand of bioenergy). The baseline is represented by the EUCO 27 scenario, which achieves by 2030 the 40% target for the reduction of greenhouse gas, a 27 % share of renewable energy, and 27 % energy efficiency improvements (a scenario with 30% energy efficiency improvement is also modelled). These projections reflect a cost-effective achievement of the various targets and in particular a technology-neutral way to achieve the share of renewable energy, taking into account existing policies.
• A modelling exercise with GLOBIOM (global economic land use model) and G4M (forestry sector model), which uses the total bioenergy demand and production results projected by the PRIMES biomass module for the above-mentioned EUCO 27
29
scenario as an input. Nevertheless GLOBIOM provides its own detailed projections in term of the material and energy use of woody feedstocks (roundwood, industrial by-products, pellets imports, etc.73) and gives projections on commodity prices, land impacts, and greenhouse gas emissions from the land use, land use change and forestry sector.
• A modelling exercise with Green-X (EU renewable energy model), combined with ArcGIS Network (geospatial model for biomass transport chains) and MULTIREG (input-output model), which models the breakdown of renewable energy sources and bioenergy feedstocks as well as greenhouse gas emissions from the energy sector, and economic and social impacts such as gross value added, investment, and jobs.
In the case of PRIMES and GLOBIOM, the results presented include projections to 2030 as well as trends for the period from 2030 to 2050 (for 2050, a greenhouse gas target of -80% is applied in PRIMES). The modelling results are presented in this impact assessment, but it is important to note that the period post-2030 is subject to significantly higher uncertainties.
5.1.2. EU Biomass demand and supply in the baseline
The projections presented on this section are based on the modelling exercises presented in section 5.1.1.
Overall demand and supply of bioenergy
By 2030, the demand for bioenergy is driven by the targets for greenhouse gas emissions reductions and renewable energy. The target on renewable energy by 2030 is set out at EU level, with each Member State delivering a national contribution. Public support will likely be based on the national plans and the choice of Member States for their renewable energy mix; however the modelling only considers the most cost-effective way to reach the target at EU level74.
PRIMES finds that the steepest increase is projected to take place between 2015 and 2020, in order to meet the 2020 renewable energy target (+27 % increase in bioenergy use in the period). After 2020, bioenergy increase levels off (+4 % for the period), particularly between 2025 and 2030 where no increase is observed. If energy efficiency reaches 30%, the total demand of bioenergy would decrease slightly (decrease of 2% between 2020 and 2030).
Green-X finds a somewhat different trajectory whereby total bioenergy demand is lower than projected by PRIMES in 2020, and would still increase by 17 % between 2020 and 2025, and then no longer increase until 2030.
The overall supply in 2030 is very similar for both models, although the growth in the period is higher for Green-X due to a lower level in 2020. Another notable difference is the level of domestic forestry use, which is significantly higher in Green-X.
73 The level of use of short rotation coppice is taken directly from the PRIMES projections 74 However in the modelling investments financed up to 2020 based on support schemes still benefit from these support schemes after 2020
30
The share of bioenergy vs other renewable energy sources is found to decrease slightly over the period both by Green-X (53.7 % in 2020 to 50.4 % in 2030) and by PRIMES (61 % in 2020 to 54 % in 2030).
By 2050, the objective of reducing greenhouse gas emissions by 80% further drives an increase in bioenergy use. For the period 2030-2050, PRIMES results show a steep increase of bioenergy demand (+46 % increase), driven by the transport sector,75 and the share of bioenergy in renewable energy decreases further (50 % in 2050).
Both PRIMES and Green-X find little variation in absolute levels of biofuels consumption between 2015 and 2030. The share in 2030 is around 12-13 % of total bioenergy use.
After 2030, PRIMES projects the share of biofuels to increase significantly (constituted mostly of advanced biofuels) to reflect the need to decarbonise the transport sector, including the aviation sector. On the other hand, the growth in the use of solid and gaseous biomass needed for electricity and heating is limited in particular by improvements in energy efficiency in the residential sector (for heating), and by the stronger development of other renewable energy sources such as wind and solar (for electricity). Hence, PRIMES projects that the demand for solid biomass for heating and electricity would stay stable between 2030 and 2050.
Feedstocks and geographical origins for solid and gaseous biomass
Regarding biomass produced in the EU, Green-X projects a rise between 2020 and 2030 mostly driven by an increase in agricultural residues (doubling over the period) and forestry products (including forest and industrial residues). GLOBIOM/PRIMES find a less marked increase in agricultural residues, but a substantial increase in industrial residues use for energy.76 GLOBIOM also finds a doubling of domestic roundwood use for energy over the period, but this feedstock remains under 1 % of total bioenergy demand.
The models also project different levels of imports of solid biomass from non-EU countries: up to 20 % in 2030 for PRIMES, 8 % for both Green-X and GLOBIOM. PRIMES and Green-X find that most of the increase in imports would take place between 2015 and 2020 while GLOBIOM still foresees an increase of 60 % in imported pellets between 2020 and 2030. Future levels of imports of solid biomass are particularly difficult to estimate given that the development of the wood pellets market is very recent, and that the future demand for biomass in non-EU countries is difficult to predict.
Green-X also projects an increase in intra-EU trade, which by 2030 is at a level comparable to imports from third countries.
5.1.3. Evolution of the problems under the baseline
Climate impacts
75 There is a high uncertainty after 2030 on the cost and availability of technologies for such a development of advanced biofuels as well as on land availability, hence these findings must be taken with precaution. 76 Due to the increase in demand for sawnwood, as well as an increase in their profitability. This rise is modelled by GLOBIOM, whereas the share of agricultural residues is projected by PRIMES.
31
In the baseline scenario, no specific measures are taken to address greenhouse gas emissions from the supply chain for biomass used for power and heat, nor on biogenic emissions from forest bioenergy. In the EU, these emissions are accounted for in national inventories and will be included in the EU 2030 targets with specific tools (supply chain under the Emission Trading Scheme/Effort Sharing and biogenic under the LULUCF sector), which however does not guarantee that pathways with a higher greenhouse gas performance will be promoted.
The evolution of these emissions will depend on the magnitude of the demand for bioenergy and the type of biomass feedstocks that will be used to fulfil this demand.
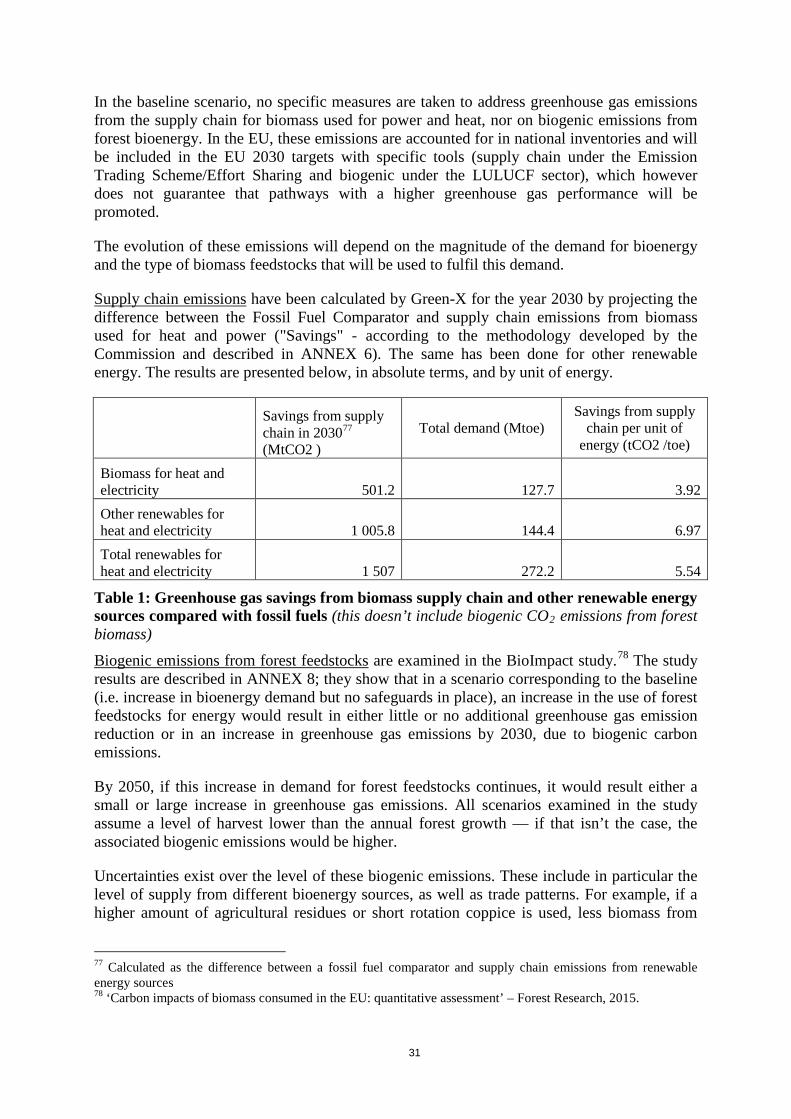
Supply chain emissions have been calculated by Green-X for the year 2030 by projecting the difference between the Fossil Fuel Comparator and supply chain emissions from biomass used for heat and power ("Savings" - according to the methodology developed by the Commission and described in ANNEX 6). The same has been done for other renewable energy. The results are presented below, in absolute terms, and by unit of energy.
Savings from supply chain in 203077 (MtCO2 )
Total demand (Mtoe) Savings from supply
chain per unit of energy (tCO2 /toe)
Biomass for heat and electricity 501.2 127.7 3.92 Other renewables for heat and electricity 1 005.8 144.4 6.97 Total renewables for heat and electricity 1 507 272.2 5.54
Table 1: Greenhouse gas savings from biomass supply chain and other renewable energy sources compared with fossil fuels (this doesn’t include biogenic CO2 emissions from forest biomass) Biogenic emissions from forest feedstocks are examined in the BioImpact study.78 The study results are described in ANNEX 8; they show that in a scenario corresponding to the baseline (i.e. increase in bioenergy demand but no safeguards in place), an increase in the use of forest feedstocks for energy would result in either little or no additional greenhouse gas emission reduction or in an increase in greenhouse gas emissions by 2030, due to biogenic carbon emissions.
By 2050, if this increase in demand for forest feedstocks continues, it would result either a small or large increase in greenhouse gas emissions. All scenarios examined in the study assume a level of harvest lower than the annual forest growth — if that isn’t the case, the associated biogenic emissions would be higher.
Uncertainties exist over the level of these biogenic emissions. These include in particular the level of supply from different bioenergy sources, as well as trade patterns. For example, if a higher amount of agricultural residues or short rotation coppice is used, less biomass from
77 Calculated as the difference between a fossil fuel comparator and supply chain emissions from renewable energy sources 78 ‘Carbon impacts of biomass consumed in the EU: quantitative assessment’ – Forest Research, 2015.

32
forests would be used and biogenic impacts from forest feedstocks would diminish.79 A sensitivity analysis was run for a scenario where the development of short rotation coppice is significantly faster than in the baseline using the GLOBIOM/G4M model, this resulted in a decrease in total emissions from land use and forests compared to the baseline (the results are described in section 6.3.1.2).
Other uncertainties exist due to the limitations of the modelling and the assumptions used (see ANNEX 8).
In the baseline scenario, these biogenic emissions would be accounted for in the national greenhouse gas inventories of the country where the harvest took place, as emissions from the LULUCF sector. This will be the case for harvest both in the EU as well as in non-EU countries which account for these emissions in the context of economy-wide greenhouse gas reduction targets post-2020 (this is likely to include all of our current main trading partners, but might not be the case if trade develops with other non-EU countries). This means that where forest biomass is used for energy, the related changes in forest sink would have to be compensated by emission reductions elsewhere (in the land use and forestry or other sectors). Overall, therefore, the country in question would still meet their greenhouse gas target, though it may be at a higher cost.
Accounting for biogenic emissions in the LULUCF sector could reduce the incentives for harvesting certain types of forest biomass for energy that would reduce the forest sink. This phenomenon is difficult to assess, as it will largely depend on the degree to which the negative impact of the harvest on national greenhouse gas inventories will be passed on to operators, and how these would counterbalance positive incentives (e.g. the additional income from the sale of biomass for energy). In some cases, split incentives could occur between different operators (such as the zero rating for an ETS operator vs LULUCF accounting for a national government, or production in a country and consumption in a different one).
In conclusion, under the baseline scenario there is a risk that biogenic emissions would increase as a result of a rise in forest biomass use for energy. This increase in emissions could negate the benefits of a higher use of forest biomass to substitute fossil energy, but the degree to which this would happen is uncertain.
Environmental impacts
In the baseline scenario, Member States would still be able to introduce sustainability criteria for solid and gaseous biomass at national level. Other EU and national policies related to environmental protection would stay in place, as well as the EU Timber Regulation to reduce the risk of using illegally harvested forest biomass for energy in the EU. At the same time, legality checks do not automatically ensure safeguards on biodiversity or land use.
The GLOBIOM/G4M modelling projections show an intensification in the use of forests in the EU in the baseline scenario, both due to material and energy use. An increased use of imports of forest biomass could also lead to intensification of forest harvesting in non-EU countries and/or conversion of unused forests to used forests. Increased imports can also be a
79 The total demand for domestic and imported primary biomass (excluding waste and black liquor) in the BioImpact study is higher in 2030 than the amounts modelled by PRIMES, but for 2050 the total for PRIMES falls in the same range as the BioImpact scenarios.
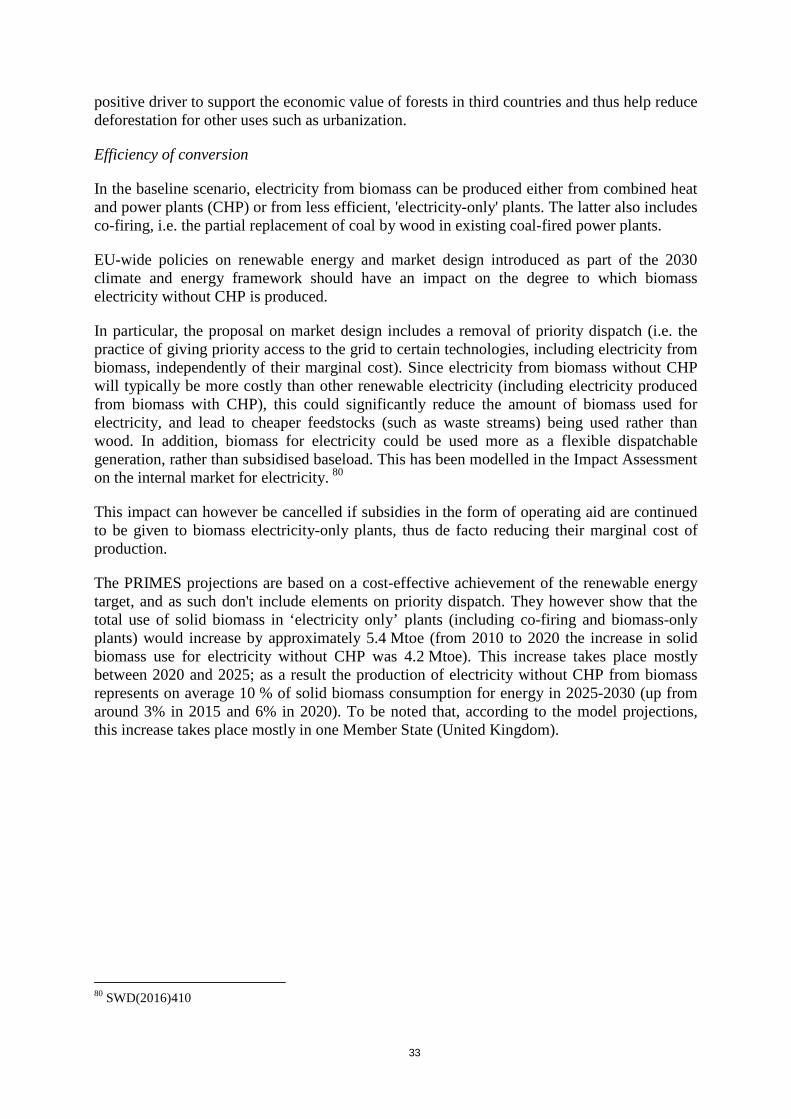
33
positive driver to support the economic value of forests in third countries and thus help reduce deforestation for other uses such as urbanization.
Efficiency of conversion
In the baseline scenario, electricity from biomass can be produced either from combined heat and power plants (CHP) or from less efficient, 'electricity-only' plants. The latter also includes co-firing, i.e. the partial replacement of coal by wood in existing coal-fired power plants.
EU-wide policies on renewable energy and market design introduced as part of the 2030 climate and energy framework should have an impact on the degree to which biomass electricity without CHP is produced.
In particular, the proposal on market design includes a removal of priority dispatch (i.e. the practice of giving priority access to the grid to certain technologies, including electricity from biomass, independently of their marginal cost). Since electricity from biomass without CHP will typically be more costly than other renewable electricity (including electricity produced from biomass with CHP), this could significantly reduce the amount of biomass used for electricity, and lead to cheaper feedstocks (such as waste streams) being used rather than wood. In addition, biomass for electricity could be used more as a flexible dispatchable generation, rather than subsidised baseload. This has been modelled in the Impact Assessment on the internal market for electricity. 80
This impact can however be cancelled if subsidies in the form of operating aid are continued to be given to biomass electricity-only plants, thus de facto reducing their marginal cost of production.
The PRIMES projections are based on a cost-effective achievement of the renewable energy target, and as such don't include elements on priority dispatch. They however show that the total use of solid biomass in ‘electricity only’ plants (including co-firing and biomass-only plants) would increase by approximately 5.4 Mtoe (from 2010 to 2020 the increase in solid biomass use for electricity without CHP was 4.2 Mtoe). This increase takes place mostly between 2020 and 2025; as a result the production of electricity without CHP from biomass represents on average 10 % of solid biomass consumption for energy in 2025-2030 (up from around 3% in 2015 and 6% in 2020). To be noted that, according to the model projections, this increase takes place mostly in one Member State (United Kingdom).
80 SWD(2016)410
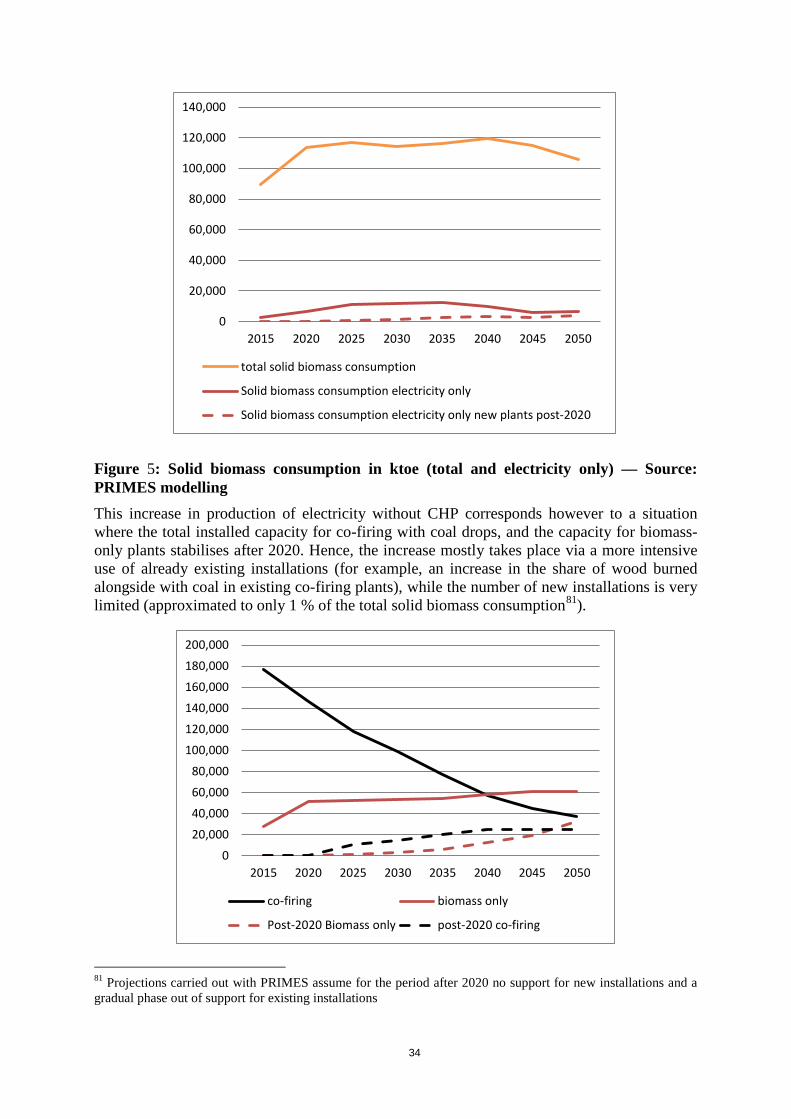
34
Figure 5: Solid biomass consumption in ktoe (total and electricity only) — Source: PRIMES modelling This increase in production of electricity without CHP corresponds however to a situation where the total installed capacity for co-firing with coal drops, and the capacity for biomass-only plants stabilises after 2020. Hence, the increase mostly takes place via a more intensive use of already existing installations (for example, an increase in the share of wood burned alongside with coal in existing co-firing plants), while the number of new installations is very limited (approximated to only 1 % of the total solid biomass consumption81).
81 Projections carried out with PRIMES assume for the period after 2020 no support for new installations and a gradual phase out of support for existing installations
0
20,000
40,000
60,000
80,000
100,000
120,000
140,000
2015 2020 2025 2030 2035 2040 2045 2050
total solid biomass consumption
Solid biomass consumption electricity only
Solid biomass consumption electricity only new plants post-2020
0
20,000
40,000
60,000
80,000
100,000
120,000
140,000
160,000
180,000
200,000
2015 2020 2025 2030 2035 2040 2045 2050
co-firing biomass only
Post-2020 Biomass only post-2020 co-firing
35
Figure 6: Capacity (MW) for solid biomass electricity plants — Source: PRIMES modelling Competition for biomass resources
In the baseline, the increase in wood consumption for energy has impact on the price of wood and wood products, as shown by the GLOBIOM model82:
- EU prices for sawlogs and pulplogs increase more as a result of bioenergy consumption, as well as the price of particleboards. The increase is particularly sharp for pulpwood (+15 % in 2030 and +37 % in 2050). However in the same period the increase of price of sawnwood is less marked (-3 to 6 % compared to a scenario with constant bioenergy), as a result of the increase in the price that sawmills can sell the industrial residues (due to increased demand for these from the energy sector);
- the increases in prices for sawlogs and pulpwood would however not occur or be significantly lower in a scenario where imports of wood for energy from non-EU countries would increase significantly83 compared to the projected estimates for the baseline.
5.2. Policy options
Based on existing studies, on the inputs from stakeholders and on internal analysis, a range of policy options were screened to respond to the problems identified in the problem definition. Five policy options (including the baseline) were further developed. The common denominator for all the options except the baseline is that compliance with the requirements set out for bioenergy would be a condition for bioenergy to be accounted towards the 2030 renewable energy target or national targets or to receive public support (including the zero accounting for emissions under the EU ETS). More far-reaching policy options, such limiting biomass use for energy or removing all public support for bioenergy, were not considered as i) it was considered disproportionate to the magnitude of the identified risks and ii) it would go against the principle of leaving primary responsibility to Member States on the choice of instruments to reduce emissions.
Each policy option contains elements that respond to some or all of the problems identified in Section 2. Table 2 summarises how each policy option addresses the problems.
Among the policy options that were screened at the beginning of the process, a number were examined but discarded at an early stage. This was mainly linked to concerns regarding their implementability at the EU level, as well as issues with proportionality and effectiveness. Further explanation on the main discarded options is presented in the box below and information on additional discarded options is presented in Annex 10.
Regarding biofuels, it was examined whether the existing sustainability criteria should be modified. Based on the results of the recent REFIT evaluation and of the stakeholders' consultation, it was concluded that improvements are needed that facilitate the 82 http://ec.europa.eu/environment/enveco/resource_efficiency/pdf/bioenergy/Task%203.pdf – in line with baseline scenario 83 Imports of pellets increase by 2.4 times in 2030 and more than 4 times in 2050 compared to the baseline scenario.
36
implementation of the criteria avoiding duplication and overlaps with other policies, but that the level of environment protection should not be changed in substance (more details in the box below). Further, the competences of the Commission with regard to the supervision of voluntary schemes should be strengthened in order to ensure a harmonised implementation of the sustainability framework with a low administrative burden.
Box: Main discarded options — overview
• Modifying the sustainability criteria for biofuels (problems 1 and 3)
The sustainability criteria for biofuels have been introduced in 2009 and updated in 2015. The REFIT evaluation84 of the Renewable Energy Directive finds that these criteria have effectively reduced direct environmental impacts of the biofuels used in most of the EU, but also point to the associated administrative burden for putting in place verification systems and ex-post monitoring tools.
In the public consultation, stakeholders pointed to three issues related to biofuels. The first one concerns indirect land use change (problem 2). Stakeholders were also of the view that sustainability criteria haven’t adequately addressed the protection of soil and water (see discarded option on introducing requirements on soil and water quality in Annex 10).
Finally, many industry stakeholders pointed to the administrative burden of the existing sustainability criteria, particularly concerning the implementation of the criteria at national level (e.g. mutual recognition of the schemes between Member States or risk of fraud), but also regarding the design of certain criteria. The content of the criteria as such was not put into question. Therefore, it is not deemed necessary to substantially reopen the biofuels criteria, although improvements in the definitions and verification systems in particular will be explored85.
• Capping the overall amount of bioenergy
This option is supported in particular by environmental NGOs, who point to the fact that sustainability issues for bioenergy are sensitive to scale. However, this option would indiscriminately cap all bioenergy feedstocks and origins, without distinguishing between the feedstocks which deliver benefits and the ones that don’t. It doesn’t seem justified to cap feedstocks that are clearly beneficial for climate mitigation and the environment. Therefore this option is discarded, and instead a partial cap on specific feedstocks (roundwood and stumps) is explored in option 5.
• Introducing biogenic carbon emissions in the methodology on lifecycle emissions from solid biomass
This option would ensure that biogenic CO2 emissions are included in the lifecycle greenhouse gas performance of forest biomass, on top of supply-chain emissions. This would allow for a full picture of climate impacts from these feedstocks. This is in line with the agreement in the scientific community that adequate account of biogenic CO2 emissions is needed.
37
As described in the problem definition, biogenic emissions and removals are often not accounted in standard lifecycle analysis (LCA) because it is implicitly assumed that the plant regrowth will compensate them. However, because of the time lag between emissions and regrowth, a number of studies have started to include both biogenic emissions and removals in the LCA analysis. The findings86 show a wide variation of greenhouse gas impacts (from very positive to very negative), depending on a number of factors, as well as on the time horizon considered. Studies also stress that it is very difficult to attribute a greenhouse gas performance to a specific consignment of forest biomass. While the combustion emissions are easy to calculate, the benefits accruing to biomass production are difficult and uncertain to estimate, and certain feedstocks can have positive or negative impacts, depending in particular on the counterfactual scenario (i.e. what would otherwise have happened with the wood and with the land).
Hence, while an assessment of the overall greenhouse gas impact of an increase of demand in forest biomass is possible and has been modelled (with the inherent limitations to any prospective modelling exercise), a reliable assessment of lifecycle biogenic emissions of specific consignments or pathways of forest biomass would be extremely difficult, notably because it would have to be based on subjective choices. In addition, it would pose difficulties linked to verification. Therefore, this option is discarded.
• Applying requirements on sustainable forest management to all forest biomass, regardless of its origin
For forest biomass, the land criteria would be replaced by a criterion on Sustainable Forest management in order to demonstrate that forest biomass is sourced through sustainable forest management practices and this should be demonstrated by means of certification.
The option was discarded due to its proportionality (high increase of costs for forest owners) and subsidiarity concerns. The requirement to certify all the forest will be a heavy burden for the number of private forest owners, in particular for small forest owners. The strict requirements of the sustainable forest management criteria are less consistent with the subsidiarity principle and do not respect the competence of EU Member States on forests. In addition, transposition of such requirements will also be burdensome for public administration
Details on the reasons for discarding other policy options is given in Annex 10, they include:
• introducing requirements on soil and water protection for agricultural feedstocks; • removing the requirement for a minimum greenhouse gas performance on supply chain
emissions for biofuels; • requirements on the level of harvest of forest residues; • mandatory requirements for the cascading use of wood (i.e. prioritisation to the material
use of wood before its conversion to energy) • requirements for air pollution; • application of sustainability requirements to all biomass users, including residential.
86 See in particular ‘Carbon accounting of forest bioenergy’ JRC, 2014 and Forest research, 2014 ‘Review of
literature on biogenic carbon and life cycle assessment of forest bioenergy’.
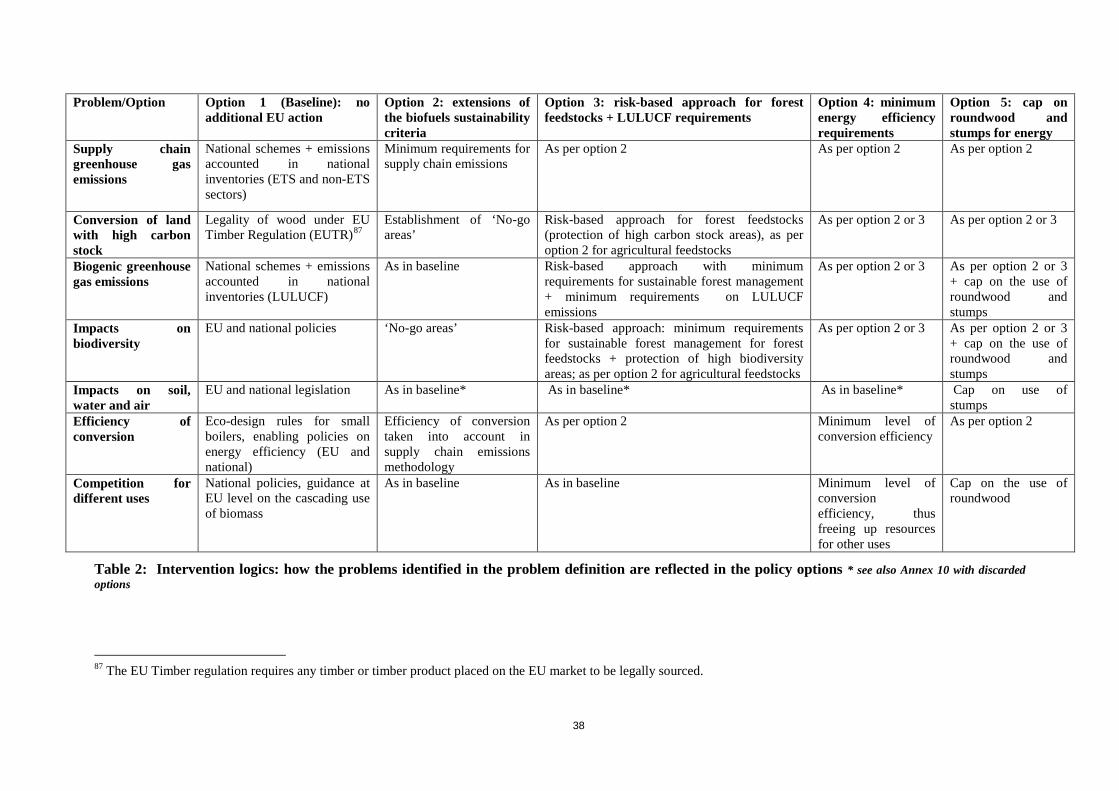
38
Problem/Option Option 1 (Baseline): no additional EU action
Option 2: extensions of the biofuels sustainability criteria
Option 3: risk-based approach for forest feedstocks + LULUCF requirements
Option 4: minimum energy efficiency requirements
Option 5: cap on roundwood and stumps for energy
Supply chain greenhouse gas emissions
National schemes + emissions accounted in national inventories (ETS and non-ETS sectors)
Minimum requirements for supply chain emissions
As per option 2 As per option 2 As per option 2
Conversion of land with high carbon stock
Legality of wood under EU Timber Regulation (EUTR)87
Establishment of ‘No-go areas’
Risk-based approach for forest feedstocks (protection of high carbon stock areas), as per option 2 for agricultural feedstocks
As per option 2 or 3 As per option 2 or 3
Biogenic greenhouse gas emissions
National schemes + emissions accounted in national inventories (LULUCF)
As in baseline Risk-based approach with minimum requirements for sustainable forest management + minimum requirements on LULUCF emissions
As per option 2 or 3 As per option 2 or 3 + cap on the use of roundwood and stumps
Impacts on biodiversity
EU and national policies ‘No-go areas’ Risk-based approach: minimum requirements for sustainable forest management for forest feedstocks + protection of high biodiversity areas; as per option 2 for agricultural feedstocks
As per option 2 or 3 As per option 2 or 3 + cap on the use of roundwood and stumps
Impacts on soil, water and air
EU and national legislation As in baseline* As in baseline* As in baseline* Cap on use of stumps
Efficiency of conversion
Eco-design rules for small boilers, enabling policies on energy efficiency (EU and national)
Efficiency of conversion taken into account in supply chain emissions methodology
As per option 2 Minimum level of conversion efficiency
As per option 2
Competition for different uses
National policies, guidance at EU level on the cascading use of biomass
As in baseline As in baseline Minimum level of conversion efficiency, thus freeing up resources for other uses
Cap on the use of roundwood
Table 2: Intervention logics: how the problems identified in the problem definition are reflected in the policy options * see also Annex 10 with discarded options
87 The EU Timber regulation requires any timber or timber product placed on the EU market to be legally sourced.
39
Option 2: Extend existing sustainability criteria for biofuels to solid and gaseous biomass for heat and electricity
Under option 2, the sustainability criteria for biofuels are extended to solid and gaseous biomass used for heat and power. In particular:
- Existing provisions for biofuels restricting the production of feedstocks from certain areas88 would be applied to all biomass used for heat and electricity (e.g. no biomass from conversion of wetlands or from deforestation)
- A requirement for minimum performance in terms of greenhouse gas supply chain emissions would be introduced for biomass used for heat and electricity. Impacts of several levels of this minimum performance have been modelled (60%, 70 % and 75% compared to lifecycle fossil fuel emissions). and the possibility of higher levels is also assessed in the impacts section.
In the consultation, many stakeholders have asked for consistency of treatment when imposing measures that concern specific feedstocks, regardless of their final use: this means for example that the rules should be the same for agricultural biomass that is used for producing biofuels or for biogas for heat and power. This option would respond to these concerns.
Option 3: Option 2 + risk-based approach for forest feedstocks (replacing land-based criteria) + requirements on LULUCF emissions
Option 3 would build on option 2, but the land-based criteria for forest biomass included in option 2 would be replaced by requirements on forest management, for which compliance would follow a so-called 'risk-based approach': it could be demonstrated at national level through relevant legislation (low-risk areas), or at the level of the forest holding. Compared to option 2, this would alleviate the administrative burden on operators in case of biomass sourced in areas with existing relevant legislation on forest management.
In addition, option 3 would include requirements on the inclusion of LULUCF emissions in national accounting systems and climate policies in the producing country, in order to ensure that the zero rating of biomass in the energy sector in the EU is justified. This feature could also be implemented on its own, but for the purpose of this impact assessment it was assessed as a complement to the risk-based approach for forest management.
A risk-based approach is currently being used several Member States (United Kingdom, Denmark and the Netherlands). A similar approach is also used by the industry-led Sustainable Biomass Partnership (SBP).
Risk-based approach for sustainable forest management
The risk-based approach works on two levels of evidence (national/regional and forest holding level). The operator gathers the evidence firstly at national level. Only if additional evidence is required, is it to be gathered at forest holding level, with the possibility to use certification or other third party verified schemes as means of proof.
88 No production from primary forest or highly biodiverse grassland; no production from protected areas unless evidence is provided that the production of the raw material did not interfere with the nature protection purposes; no conversion/drainage of land with high carbon stock i.e. wetland, peatlands, forested areas.
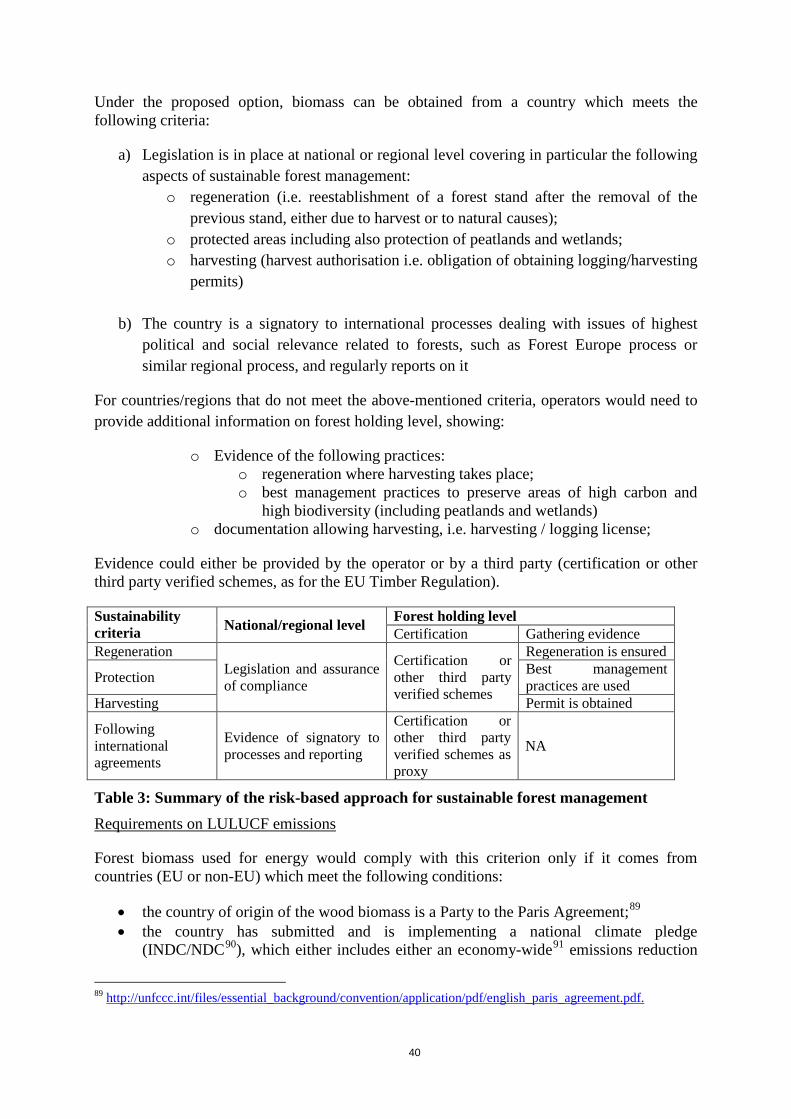
40
Under the proposed option, biomass can be obtained from a country which meets the following criteria:
a) Legislation is in place at national or regional level covering in particular the following aspects of sustainable forest management:
o regeneration (i.e. reestablishment of a forest stand after the removal of the previous stand, either due to harvest or to natural causes);
o protected areas including also protection of peatlands and wetlands; o harvesting (harvest authorisation i.e. obligation of obtaining logging/harvesting
permits)
b) The country is a signatory to international processes dealing with issues of highest political and social relevance related to forests, such as Forest Europe process or similar regional process, and regularly reports on it
For countries/regions that do not meet the above-mentioned criteria, operators would need to provide additional information on forest holding level, showing:
o Evidence of the following practices: o regeneration where harvesting takes place; o best management practices to preserve areas of high carbon and
high biodiversity (including peatlands and wetlands) o documentation allowing harvesting, i.e. harvesting / logging license;
Evidence could either be provided by the operator or by a third party (certification or other third party verified schemes, as for the EU Timber Regulation).
Sustainability criteria National/regional level Forest holding level
Certification Gathering evidence Regeneration
Legislation and assurance of compliance
Certification or other third party verified schemes
Regeneration is ensured
Protection Best management practices are used
Harvesting Permit is obtained
Following international agreements
Evidence of signatory to processes and reporting
Certification or other third party verified schemes as proxy
NA
Table 3: Summary of the risk-based approach for sustainable forest management Requirements on LULUCF emissions
Forest biomass used for energy would comply with this criterion only if it comes from countries (EU or non-EU) which meet the following conditions:
• the country of origin of the wood biomass is a Party to the Paris Agreement;89 • the country has submitted and is implementing a national climate pledge
(INDC/NDC90), which either includes either an economy-wide91 emissions reduction
89 http://unfccc.int/files/essential_background/convention/application/pdf/english_paris_agreement.pdf.
41
target, or explicitly includes LULUCF or REDD+92 policies and measures reducing emissions and/or enhancing removals.
Option 3 is supported by a number of EU bioenergy producers and users, as well as by a few Member States. In the view of these stakeholders, the main benefit of the option lies with low administrative burden for areas fulfilling the requirement It was also supported in a recent opinion of the Standing Forestry Committee,as the most appropriate way to demonstrate sustainability, should such policy requirement be needed .93
Option 4: option 2 or 3 + energy efficiency requirement for heat and power installations
In addition to the features in option 2 or 3, this option would include a requirement for a minimum level in efficiency of conversion of biomass to heat and electricity. This minimum level would be fixed at 60 % efficiency94. This requirement would apply only to new plants conversion of existing plants, in order to protect existing investments. This means in particular that electricity without CHP produced from biomass in new installations would not fulfil the sustainability requirements.
This approach is based on resource efficiency considerations, since biomass is a finite and limited resource, although it is renewable. It would aim at reducing the overall amount of biomass needed for a given amount of energy produced.
On the grounds of the above argument, stakeholders that support taking into account conversion efficiency in sustainability requirements include mainly environmental NGOs and the wood-processing industries.
Option 5: Option 2 or 3 + cap on certain feedstocks for solid biomass
Under option 5, the sustainability requirements under option 2 or 3 would be complemented by a cap fixed at national level on the use of roundwood and stumps for energy95. Regarding roundwood, the cap would grandfather existing volumes in the period 2015-202096. Salvage logging97 would not be included in the cap. Only roundwood over a certain diameter would be targeted by this cap; this diameter would be chosen at Member State level in order to reflect the diversity of national situations regarding wood use and forestry, the objective being to cap the use for energy of roundwood of industrial quality. The cap would also apply to imports. Regarding stumps, the cap would be fixed at zero.
This option aims at limiting the most risky feedstocks in terms of biogenic carbon emissions, according to recent studies (see section 0 and ANNEX 7), as well as, in the case of roundwood, feedstocks that present a risk in terms of competition with other uses. In the case of stumps, this would also aim at reducing biodiversity impacts. Grandfathering existing
90 http://www4.unfccc.int/submissions/indc/Submission%20Pages/submissions.aspx. 91 Economy wide includes the LULUCF sector 92 http://unfccc.int/land_use_and_climate_change/redd/items/7377.php 93 http://ec.europa.eu/agriculture/forest/standing-committee/opinions_en.htm 94 Other levels could be envisaged, however the main relevant factor for choosing such a level would be the distinction between electricity only and heat/CHP, with the former being below 40% efficiency and the latter generally above 60%. 95 Either used directly for energy or first transformed e.g. into pellets. 96 On the basis of average annual volumes for that period 97 I.e. wood from storms, pests and diseases.
42
amounts would aim at protecting existing investments, while limiting future growth for these feedstocks. The use of these feedstocks for energy over the level of the cap would still be possible but wouldn't count towards a renewable energy target or be granted public support. This option can be viewed as similar in design to the cap applied on food-based biofuels in the ILUC directive98
Environmental NGOs that support an overall cap on bioenergy point out to the use of roundwood of industrial quality (e.g. pulpwood) for energy as particularly problematic and therefore are expected to also support this option. Several Member States have already put in place schemes that include similar requirements or are considering it.99
Minimum size of plants to comply with the requirements for solid biomass used in heat and power generation (as part of options 2 and 3)
For the purpose of implementing option 2 and 3 (and of the options built on top of these), it is examined what should be the minimum size of the plants that would have to comply with the sustainability requirements.
The solid biomass sector is relatively fragmented and heterogeneous, with on the one hand small scale heating systems used in households, and on the other hand installations of more than 20 or 50 MW. Currently, half of the solid biomass used in the EU is used for household heating100. On the other hand, around 75 % of the wood burned in commercial or industrial installations (in the form of wood chips or pellets) for energy is consumed in installations over 20 MW. In addition, the increase in demand for solid biomass up to 2030 is expected to come mostly from these larger plants.101In defining the options for the minimum size of plants to be covered by the requirements set out in options 2 and 3 in particular, a balance must be found between minimising administrative burden and ensuring a good coverage of the biomass consumed in the EU.
The sub-options retained for the application of the sustainability requirements in options 2 and 3 are the following:
– application to installations above 1 MW;
– application to installations above 5 or 10 MW;
– application to installations above 20 MW.
An option of applying the requirements to all biomass users, including the residential sector, is discarded (see Annex 10).
This set of sub-options does not apply to biogas given that typical size of a biogas plant is around 0.5MW and great majority of installations are below 1 MW.
98 Directive (EU)2015/1513 99 Belgium (Flanders), Poland, Netherlands, Italy, France. 100 With variations across Member States 101 Source: PRIMES modelling.
43
6. WHAT ARE THE IMPACTS OF THE POLICY OPTIONS AND WHO WILL BE AFFECTED?
6.1. Modelling of the options
The impacts of the policy options have been modelled using the tools described in section 5.1.1 and ANNEX 4. Because of the respective characteristics of the modelling suites, each of them was able to model a subset of the options and of their features, as well as of the impacts:
• Green-X gave information regarding greenhouse gas emissions from the supply chain, as well as economic impacts and impacts on jobs;
• GLOBIOM/G4M gave results focussed on land-use, biogenic carbon, as well as price and production levels for wood products (e.g. wood panels)
• For option 2 (extension of the biofuels criteria), Green-X modelled the impacts of the minimum requirement on greenhouse gas emissions from the supply chain, while GLOBIOM/G4M focussed on the land-based criteria.
• Option 3 (risk-based approach for forest biomass) was particularly complex to model given the uncertainties regarding which countries or regions would be considered "low risk". As a proxy, Green-X considered reduced biomass supply availability for non-EU countries (equivalent to a decrease of 65% in availability), whereas GLOBIOM/G4M increased the cost of imports (with three scenarios: +5 %, +10 %, +15 % compared to the baseline102).
• Option 4 (minimum efficiency of conversion) was modelled by Green-X, but not by GLOBIOM/G4M. This is because GLOBIOM/G4M is primarily a land-use and economic model, hence not able to distinguish between efficient or inefficient plants in the conversion of biomass to energy.
• In order to model option 5 (cap on certain feedstocks), Green-X used as a proxy an increase in the price of roundwood after 2020, whereas GLOBIOM/G4M directly modelled a cap on the total amount of roundwood used for energy. In modelling this cap, different assumptions were tested regarding the share of roundwood in imported pellets.103
As described in section 5.2, options 4 and 5 can be implemented based on the features of option 2 or 3. In the modelling exercises, they have been considered to be built on top of option 2.
Modelling projections are presented for 2030; for GLOBIOM/G4M trends for 2050 are also available, but are subject to a higher level of uncertainty.
102 This is based on available data showing that the premium for certified wood vs non-certified wood would be in this range, although in some cases it could be higher or lower. Sources for these figures include https://www.unece.org/fileadmin/DAM/timber/publications/Final_FPAMR2009.pdf and http://www.cefcoproject.org/fileadmin/cefco/pdf/6-Analysis_of_market_demand_of_FSC_products-EN.pdf 103 With a central assumption of 75% of roundwood in imported pellets, and a sensitivity analysis around that number.
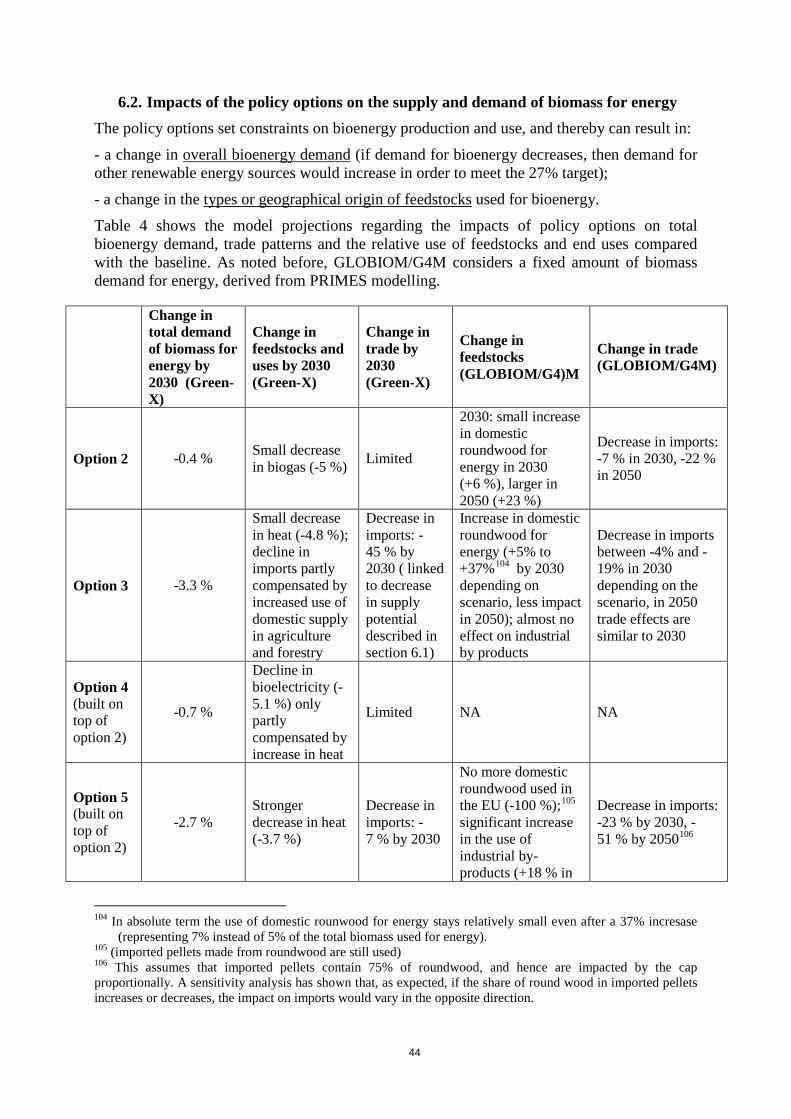
44
6.2. Impacts of the policy options on the supply and demand of biomass for energy The policy options set constraints on bioenergy production and use, and thereby can result in:
- a change in overall bioenergy demand (if demand for bioenergy decreases, then demand for other renewable energy sources would increase in order to meet the 27% target);
- a change in the types or geographical origin of feedstocks used for bioenergy.
Table 4 shows the model projections regarding the impacts of policy options on total bioenergy demand, trade patterns and the relative use of feedstocks and end uses compared with the baseline. As noted before, GLOBIOM/G4M considers a fixed amount of biomass demand for energy, derived from PRIMES modelling.
Change in total demand of biomass for energy by 2030 (Green-X)
Change in feedstocks and uses by 2030 (Green-X)
Change in trade by 2030 (Green-X)
Change in feedstocks (GLOBIOM/G4)M
Change in trade (GLOBIOM/G4M)
Option 2 -0.4 % Small decrease in biogas (-5 %) Limited
2030: small increase in domestic roundwood for energy in 2030 (+6 %), larger in 2050 (+23 %)
Decrease in imports: -7 % in 2030, -22 % in 2050
Option 3 -3.3 %
Small decrease in heat (-4.8 %); decline in imports partly compensated by increased use of domestic supply in agriculture and forestry
Decrease in imports: -45 % by 2030 ( linked to decrease in supply potential described in section 6.1)
Increase in domestic roundwood for energy (+5% to +37%104 by 2030 depending on scenario, less impact in 2050); almost no effect on industrial by products
Decrease in imports between -4% and -19% in 2030 depending on the scenario, in 2050 trade effects are similar to 2030
Option 4 (built on top of option 2)
-0.7 %
Decline in bioelectricity (-5.1 %) only partly compensated by increase in heat
Limited NA NA
Option 5 (built on top of option 2)
-2.7 % Stronger decrease in heat (-3.7 %)
Decrease in imports: -7 % by 2030
No more domestic roundwood used in the EU (-100 %);105 significant increase in the use of industrial by-products (+18 % in
Decrease in imports: -23 % by 2030, -51 % by 2050106
104 In absolute term the use of domestic rounwood for energy stays relatively small even after a 37% incresase
(representing 7% instead of 5% of the total biomass used for energy). 105 (imported pellets made from roundwood are still used) 106 This assumes that imported pellets contain 75% of roundwood, and hence are impacted by the cap proportionally. A sensitivity analysis has shown that, as expected, if the share of round wood in imported pellets increases or decreases, the impact on imports would vary in the opposite direction.
45
2030, +51 % in 2050)
Table 4: Impacts on total demand, trade and feedstocks of the policy options compared to the baseline, according to Green-X and GLOBIOM/G4M modelling The modelling projections show that all policy options considered would result in a small or negligible decrease in total bioenergy demand, compensated by an increase in other renewable energy sources. The smallest effect concerns option 4: this is because this option only applies to newly built plants, and very little new capacity is projected for power only after 2020 (for example, PRIMES finds that new capacity for power only would represent around 1% of total solid biomass consumption between 2020 and 2030). This means that overall, option 4 would only have minimal impacts.
The effect on feedstocks and end-use of bioenergy is also relatively small, except for option 5 where GLOBIOM finds a significant increase in the use of industrial by-products (partly diverted from their use for the panel industry), and a complete disappearance of the use of EU-produced roundwood for energy (which was used at relatively low levels in the baseline) as the level of the cap is met exclusively with imported pellets.
The most significant effect seems to be a decrease of imports from non-EU countries for options 2, 3 and 5, but the two models find somehow different magnitudes for this decrease. To be noted in the case of option 3 that the very significant decrease in imports projected by Green-X is largely influenced by the assumption on biomass supply from non-EU countries (-65%, as described in section 6.1).
6.3. Environmental impacts
6.3.1. Greenhouse gas emissions
6.3.1.1. Greenhouse gas emissions from the supply chain
All the policy options examined include a requirement for a maximum level of greenhouse gas emissions from the supply chain, calculated based on the methodology described in previous Commission documents and on the values calculated by the Commission's Joint Research Centre and described in ANNEX 6. Impacts of several levels have been further modelled, in particular corresponding to a 60%, 70% or 75% reduction in greenhouse gas emissions if compared with the full lifecycle emissions of fossil fuels. Further in-depth analysis of supply chain emissions is also presented in SWD(2014)259.
As described in ANNEX 6, the performance of different pathways107 for biomass for heat and power in terms of greenhouse gas emissions from their supply chain is as follows:
• For forest feedstocks, all of the commonly used pathways are compatible with a threshold for their supply chain emissions equivalent to 70 % less than the reference emissions from fossil fuels. The two pathways leading to higher supply chain emissions (drying of wood with natural gas and transporting feedstocks over 10,000
107 A pathway is defined as the chain of processes that constitute the supply chain, including the choice of feedstocks, the type of process, etc.
46
km), are extremely rare in practice. In order to comply with a high threshold (75% or above) pathways will have to employ more efficient technologies, such as the use of wood-fuelled CHPs in pellet mills, and higher final conversion efficiency or co-generation of power and useful heat.
• For agricultural feedstocks, certain pathways using intensely cultivated short rotation coppice feedstocks (e.g. eucalyptus plantations from South America) would be incompatible with threshold of 60% or above. Other pathways based on less intensely cultivated, domestic species (e.g. poplar) would generally pass a 75% threshold, especially for pathways with high efficiencies and best practices for pellet mills. Other excluded pathways would be the ones based on agricultural residues transported over long distances (which is very unlikely to happen), as well as certain biogas pathways (in particular those using exclusively of maize crops).
• If a more ambitious requirement is set out (80 or 85% threshold), then more pathways would be affected. In particular, many feedstocks would be restricted to regional production (less than 2500 km distance) and/or to cogeneration of power and heat or heat use (vs electricity-only plants). Pellets would be more affected than wood chips as more processing energy is needed for their production; with a 85% threshold most pellets produced with current technology would not qualify. However, pellets produced using a renewable energy and utilized in co-generating plants would still be able to pass even the highest threshold.
Therefore, in the case of forest-based bioenergy, almost all of the biomass used would comply with a minimum threshold of 70%, and only a few pathways would be excluded if that threshold was raised to 75%. In the case of agriculture-based feedstocks, the worst performing pathways would be excluded. A higher threshold would have more significant impacts on installations in Member States that are most dependent on imports from outside the EU and/or produce electricity-only rather than heat or CHP from biomass. Installations in Member States that are rich in forestry resources or import from short distances, and favour heat or co-generation production, would in principle not be affected. A higher threshold could also favour the upgrade of supply chains to apply more efficient pellet mills using only renewable resources.
Projections of supply-chain emissions from the Green-X model show in all options a combination of two effects:
- An effect on bioenergy emissions due to the establishment of the threshold,
- A (modest) shift from bioenergy to other renewable energy sources, resulting in an increase in greenhouse gas savings
Regarding the first effect, Green-X examines several sensitivity analyses concerning the level of the threshold (60%, 70% or 75%) combined with different minimum sizes of installations (1 MW or 5 MW). However, in all cases the results show that the effects of the minimum requirement in terms of greenhouse gas savings per unit of bioenergy used in heat and power are negligible.
When examining the savings in emissions from the supply chain for all renewable energy sources (hence including the effect of the shift to other types of renewable energy), all options
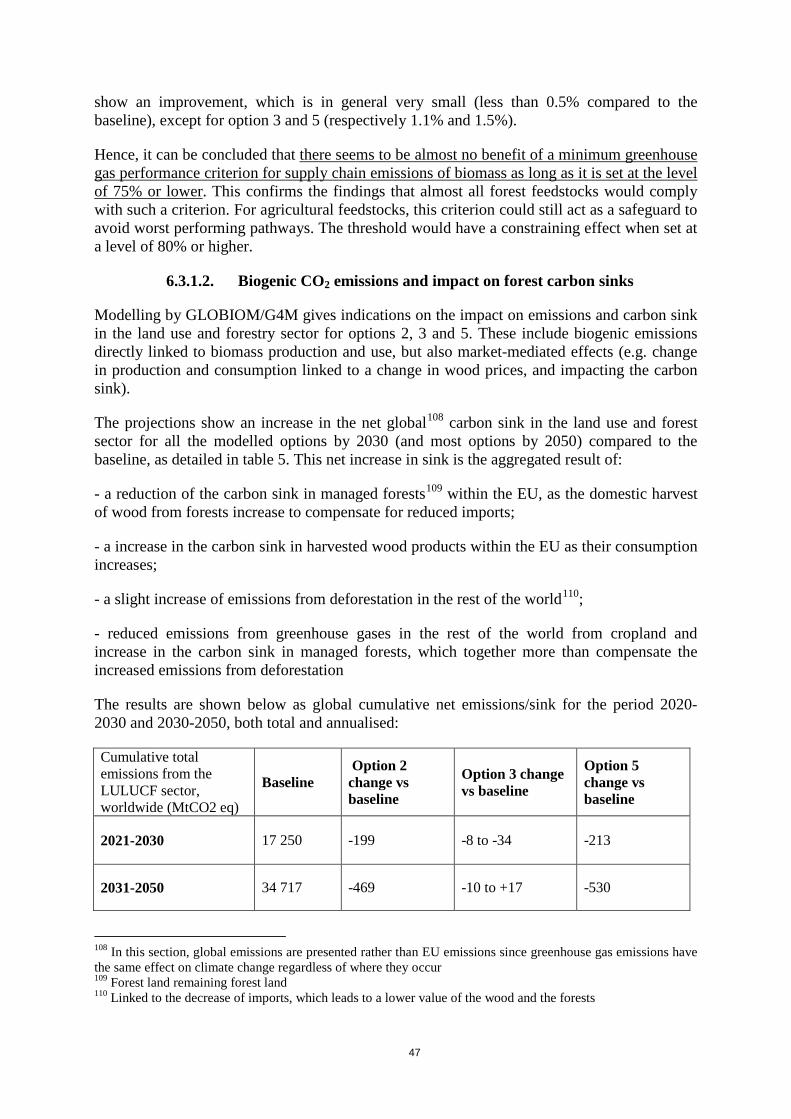
47
show an improvement, which is in general very small (less than 0.5% compared to the baseline), except for option 3 and 5 (respectively 1.1% and 1.5%).
Hence, it can be concluded that there seems to be almost no benefit of a minimum greenhouse gas performance criterion for supply chain emissions of biomass as long as it is set at the level of 75% or lower. This confirms the findings that almost all forest feedstocks would comply with such a criterion. For agricultural feedstocks, this criterion could still act as a safeguard to avoid worst performing pathways. The threshold would have a constraining effect when set at a level of 80% or higher.
6.3.1.2. Biogenic CO2 emissions and impact on forest carbon sinks
Modelling by GLOBIOM/G4M gives indications on the impact on emissions and carbon sink in the land use and forestry sector for options 2, 3 and 5. These include biogenic emissions directly linked to biomass production and use, but also market-mediated effects (e.g. change in production and consumption linked to a change in wood prices, and impacting the carbon sink).
The projections show an increase in the net global108 carbon sink in the land use and forest sector for all the modelled options by 2030 (and most options by 2050) compared to the baseline, as detailed in table 5. This net increase in sink is the aggregated result of:
- a reduction of the carbon sink in managed forests109 within the EU, as the domestic harvest of wood from forests increase to compensate for reduced imports;
- a increase in the carbon sink in harvested wood products within the EU as their consumption increases;
- a slight increase of emissions from deforestation in the rest of the world110;
- reduced emissions from greenhouse gases in the rest of the world from cropland and increase in the carbon sink in managed forests, which together more than compensate the increased emissions from deforestation
The results are shown below as global cumulative net emissions/sink for the period 2020-2030 and 2030-2050, both total and annualised:
Cumulative total emissions from the LULUCF sector, worldwide (MtCO2 eq)
Baseline Option 2 change vs baseline
Option 3 change vs baseline
Option 5 change vs baseline
2021-2030 17 250 -199 -8 to -34 -213
2031-2050 34 717 -469 -10 to +17 -530
108 In this section, global emissions are presented rather than EU emissions since greenhouse gas emissions have the same effect on climate change regardless of where they occur 109 Forest land remaining forest land 110 Linked to the decrease of imports, which leads to a lower value of the wood and the forests
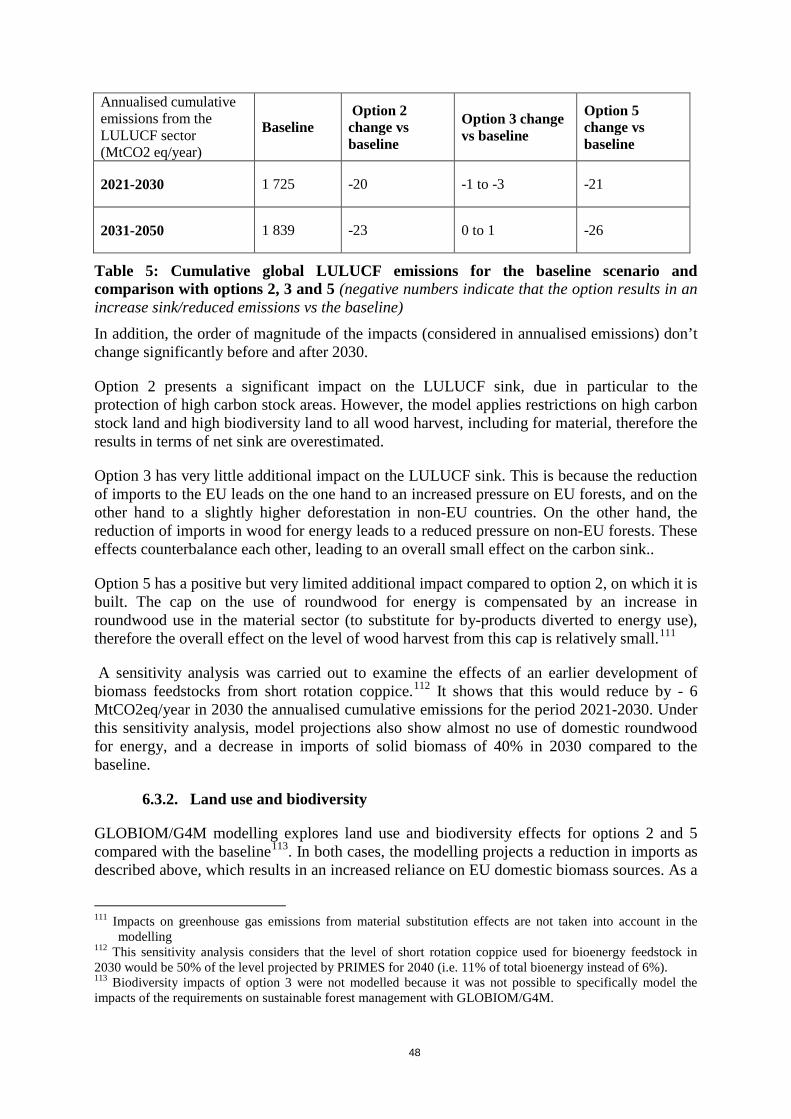
48
Annualised cumulative emissions from the LULUCF sector (MtCO2 eq/year)
Baseline Option 2 change vs baseline
Option 3 change vs baseline
Option 5 change vs baseline
2021-2030 1 725 -20 -1 to -3 -21
2031-2050 1 839 -23 0 to 1 -26
Table 5: Cumulative global LULUCF emissions for the baseline scenario and comparison with options 2, 3 and 5 (negative numbers indicate that the option results in an increase sink/reduced emissions vs the baseline) In addition, the order of magnitude of the impacts (considered in annualised emissions) don’t change significantly before and after 2030.
Option 2 presents a significant impact on the LULUCF sink, due in particular to the protection of high carbon stock areas. However, the model applies restrictions on high carbon stock land and high biodiversity land to all wood harvest, including for material, therefore the results in terms of net sink are overestimated.
Option 3 has very little additional impact on the LULUCF sink. This is because the reduction of imports to the EU leads on the one hand to an increased pressure on EU forests, and on the other hand to a slightly higher deforestation in non-EU countries. On the other hand, the reduction of imports in wood for energy leads to a reduced pressure on non-EU forests. These effects counterbalance each other, leading to an overall small effect on the carbon sink..
Option 5 has a positive but very limited additional impact compared to option 2, on which it is built. The cap on the use of roundwood for energy is compensated by an increase in roundwood use in the material sector (to substitute for by-products diverted to energy use), therefore the overall effect on the level of wood harvest from this cap is relatively small.111
A sensitivity analysis was carried out to examine the effects of an earlier development of biomass feedstocks from short rotation coppice.112 It shows that this would reduce by - 6 MtCO2eq/year in 2030 the annualised cumulative emissions for the period 2021-2030. Under this sensitivity analysis, model projections also show almost no use of domestic roundwood for energy, and a decrease in imports of solid biomass of 40% in 2030 compared to the baseline.
6.3.2. Land use and biodiversity
GLOBIOM/G4M modelling explores land use and biodiversity effects for options 2 and 5 compared with the baseline113. In both cases, the modelling projects a reduction in imports as described above, which results in an increased reliance on EU domestic biomass sources. As a
111 Impacts on greenhouse gas emissions from material substitution effects are not taken into account in the
modelling 112 This sensitivity analysis considers that the level of short rotation coppice used for bioenergy feedstock in 2030 would be 50% of the level projected by PRIMES for 2040 (i.e. 11% of total bioenergy instead of 6%). 113 Biodiversity impacts of option 3 were not modelled because it was not possible to specifically model the impacts of the requirements on sustainable forest management with GLOBIOM/G4M.
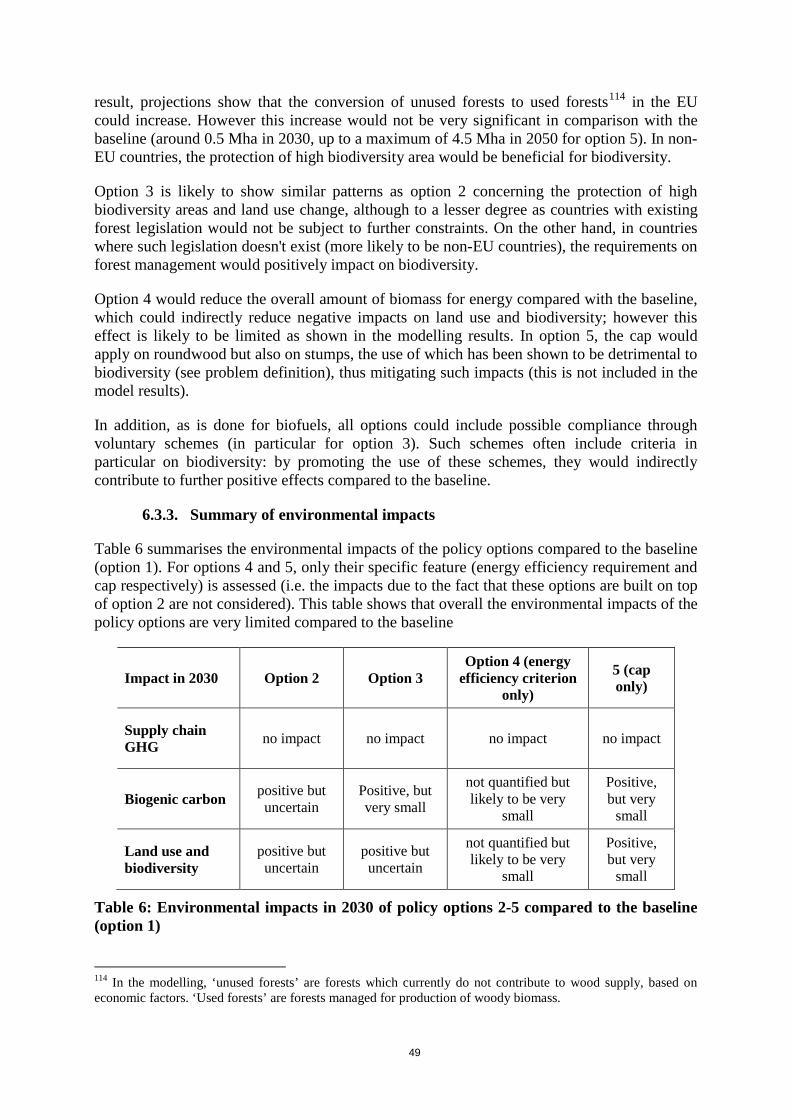
49
result, projections show that the conversion of unused forests to used forests114 in the EU could increase. However this increase would not be very significant in comparison with the baseline (around 0.5 Mha in 2030, up to a maximum of 4.5 Mha in 2050 for option 5). In non-EU countries, the protection of high biodiversity area would be beneficial for biodiversity.
Option 3 is likely to show similar patterns as option 2 concerning the protection of high biodiversity areas and land use change, although to a lesser degree as countries with existing forest legislation would not be subject to further constraints. On the other hand, in countries where such legislation doesn't exist (more likely to be non-EU countries), the requirements on forest management would positively impact on biodiversity.
Option 4 would reduce the overall amount of biomass for energy compared with the baseline, which could indirectly reduce negative impacts on land use and biodiversity; however this effect is likely to be limited as shown in the modelling results. In option 5, the cap would apply on roundwood but also on stumps, the use of which has been shown to be detrimental to biodiversity (see problem definition), thus mitigating such impacts (this is not included in the model results).
In addition, as is done for biofuels, all options could include possible compliance through voluntary schemes (in particular for option 3). Such schemes often include criteria in particular on biodiversity: by promoting the use of these schemes, they would indirectly contribute to further positive effects compared to the baseline.
6.3.3. Summary of environmental impacts
Table 6 summarises the environmental impacts of the policy options compared to the baseline (option 1). For options 4 and 5, only their specific feature (energy efficiency requirement and cap respectively) is assessed (i.e. the impacts due to the fact that these options are built on top of option 2 are not considered). This table shows that overall the environmental impacts of the policy options are very limited compared to the baseline
Impact in 2030 Option 2 Option 3 Option 4 (energy
efficiency criterion only)
5 (cap only)
Supply chain GHG no impact no impact no impact no impact
Biogenic carbon positive but uncertain
Positive, but very small
not quantified but likely to be very
small
Positive, but very
small
Land use and biodiversity
positive but uncertain
positive but uncertain
not quantified but likely to be very
small
Positive, but very
small
Table 6: Environmental impacts in 2030 of policy options 2-5 compared to the baseline (option 1)
114 In the modelling, ‘unused forests’ are forests which currently do not contribute to wood supply, based on economic factors. ‘Used forests’ are forests managed for production of woody biomass.
50
6.4. Economic impacts
Overall, the economic impacts of policy options will be affected by the volume of bioenergy used for each option.
As described above, models shows that the reduction of total bioenergy demand due to the effects of policy options should be very small. Where such reductions occur, they will lead to compensation with other renewable energy sources in order to meet the renewable energy targets, with effects on gross added value, investment costs and employment. The effect observed in general is that a small decrease in bioenergy accompanied with a small increase in other renewable energy sources leads to an increase in gross added value and employment. This would not necessarily be the case if the shift from bioenergy to other renewable energy was higher in magnitude115.
Creating a sustainability framework would also provide more certainty to investors and increased acceptance of the use of bioenergy to the general public — two issues that were pointed out by economic operators in their response to the public consultation when asking for the development of an EU-wide framework. The degree to which these two effects will result in an increase in biomass use for energy is very difficult to ascertain, however it is likely that it will be a factor for further developments.
To be noted that in the modelling carried out using Green X/MULTIREG, the impacts on non-energy sectors are not included. The effect on the sectors using wood for materials is described through GLOBIOM/G4M.
6.4.1. Contribution to gross added value116
In the baseline scenario, the deployment of renewable energy sources is projected to generate a total value added of almost €122 billion as an annual average. Bioenergy deployment accounts for almost half of that total value added (48%), with the other half related to other renewable technologies.
The results of the Green-X/MULTIREG modelling show that the (modest) shift between bioenergy and other renewables in the policy option brings a net, small positive effect to the gross added value to the EU economy, as displayed in Table 7. This effect is the highest for option 5, followed by option 3, but remains overall very modest.
This positive impact on gross added value is a combination of:
- a positive "deployment effect": the increase in other renewable energy sources leads to more investments and therefore a larger positive impact in the economy as a whole
- a positive "income effect": the additional jobs created by this shift leads to additional income for households, which is spent in consumption
- a negative "indirect effect": other renewable energy sources require higher level of public support, either directly through subsidies, or through feed-in tariffs. This can impact
115 As shown for example in the results of the BioImpact study – see Annex 8 116 Gross added value is the measure of the value of goods and services produced in the economy.
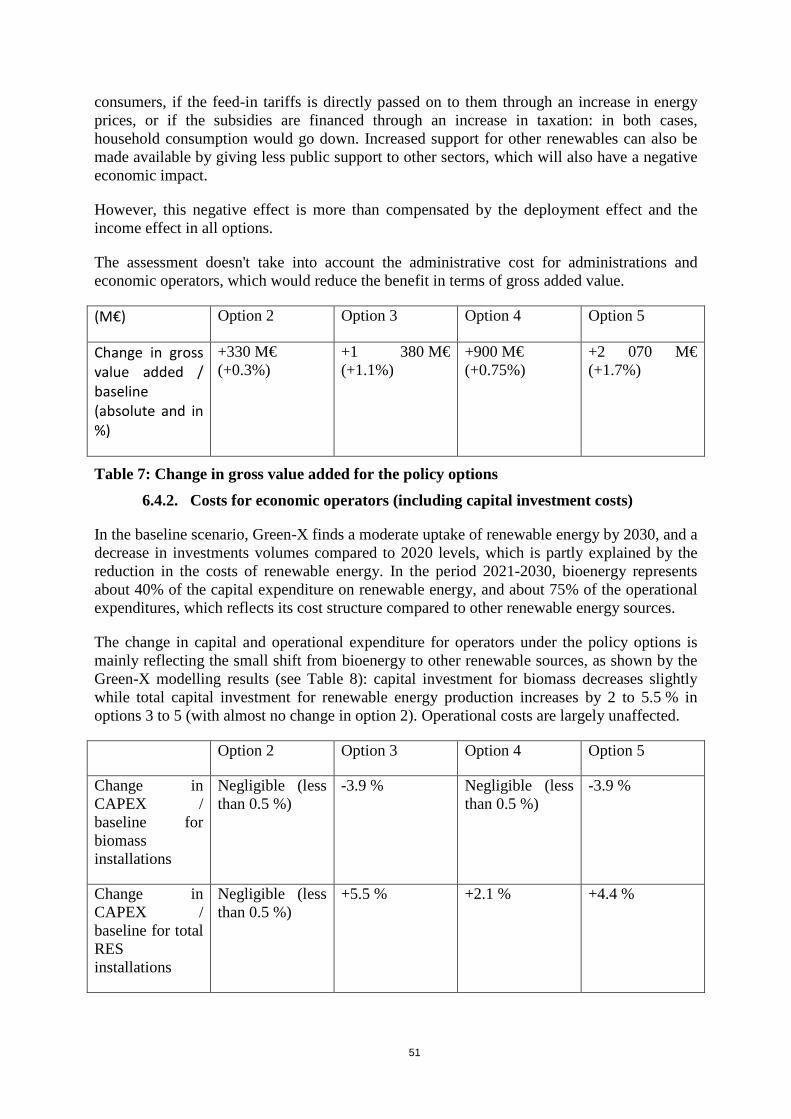
51
consumers, if the feed-in tariffs is directly passed on to them through an increase in energy prices, or if the subsidies are financed through an increase in taxation: in both cases, household consumption would go down. Increased support for other renewables can also be made available by giving less public support to other sectors, which will also have a negative economic impact.
However, this negative effect is more than compensated by the deployment effect and the income effect in all options.
The assessment doesn't take into account the administrative cost for administrations and economic operators, which would reduce the benefit in terms of gross added value.
(M€) Option 2 Option 3 Option 4 Option 5
Change in gross value added / baseline (absolute and in %)
+330 M€ (+0.3%)
+1 380 M€ (+1.1%)
+900 M€ (+0.75%)
+2 070 M€ (+1.7%)
Table 7: Change in gross value added for the policy options 6.4.2. Costs for economic operators (including capital investment costs)
In the baseline scenario, Green-X finds a moderate uptake of renewable energy by 2030, and a decrease in investments volumes compared to 2020 levels, which is partly explained by the reduction in the costs of renewable energy. In the period 2021-2030, bioenergy represents about 40% of the capital expenditure on renewable energy, and about 75% of the operational expenditures, which reflects its cost structure compared to other renewable energy sources.
The change in capital and operational expenditure for operators under the policy options is mainly reflecting the small shift from bioenergy to other renewable sources, as shown by the Green-X modelling results (see Table 8): capital investment for biomass decreases slightly while total capital investment for renewable energy production increases by 2 to 5.5 % in options 3 to 5 (with almost no change in option 2). Operational costs are largely unaffected.
Option 2 Option 3 Option 4 Option 5
Change in CAPEX / baseline for biomass installations
Negligible (less than 0.5 %)
-3.9 % Negligible (less than 0.5 %)
-3.9 %
Change in CAPEX / baseline for total RES installations
Negligible (less than 0.5 %)
+5.5 % +2.1 % +4.4 %
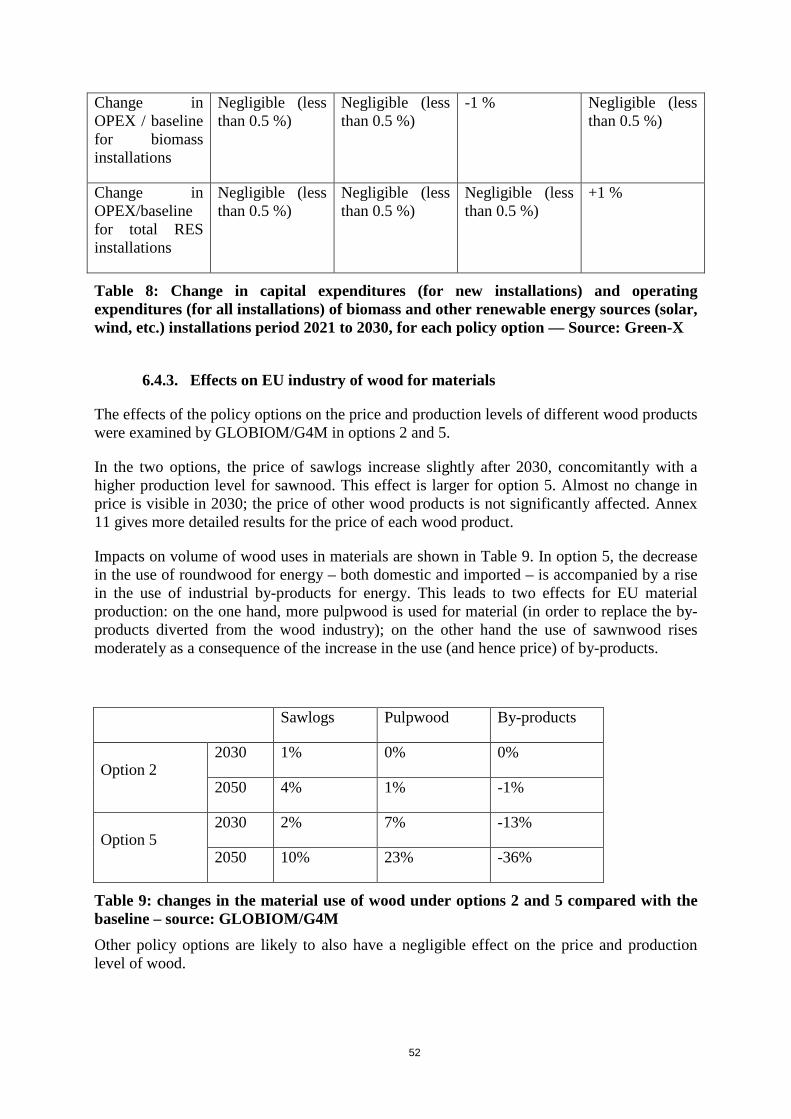
52
Change in OPEX / baseline for biomass installations
Negligible (less than 0.5 %)
Negligible (less than 0.5 %)
-1 % Negligible (less than 0.5 %)
Change in OPEX/baseline for total RES installations
Negligible (less than 0.5 %)
Negligible (less than 0.5 %)
Negligible (less than 0.5 %)
+1 %
Table 8: Change in capital expenditures (for new installations) and operating expenditures (for all installations) of biomass and other renewable energy sources (solar, wind, etc.) installations period 2021 to 2030, for each policy option — Source: Green-X
6.4.3. Effects on EU industry of wood for materials
The effects of the policy options on the price and production levels of different wood products were examined by GLOBIOM/G4M in options 2 and 5.
In the two options, the price of sawlogs increase slightly after 2030, concomitantly with a higher production level for sawnood. This effect is larger for option 5. Almost no change in price is visible in 2030; the price of other wood products is not significantly affected. Annex 11 gives more detailed results for the price of each wood product.
Impacts on volume of wood uses in materials are shown in Table 9. In option 5, the decrease in the use of roundwood for energy – both domestic and imported – is accompanied by a rise in the use of industrial by-products for energy. This leads to two effects for EU material production: on the one hand, more pulpwood is used for material (in order to replace the by-products diverted from the wood industry); on the other hand the use of sawnwood rises moderately as a consequence of the increase in the use (and hence price) of by-products.
Sawlogs Pulpwood By-products
Option 2 2030 1% 0% 0%
2050 4% 1% -1%
Option 5 2030 2% 7% -13%
2050 10% 23% -36%
Table 9: changes in the material use of wood under options 2 and 5 compared with the baseline – source: GLOBIOM/G4M Other policy options are likely to also have a negligible effect on the price and production level of wood.
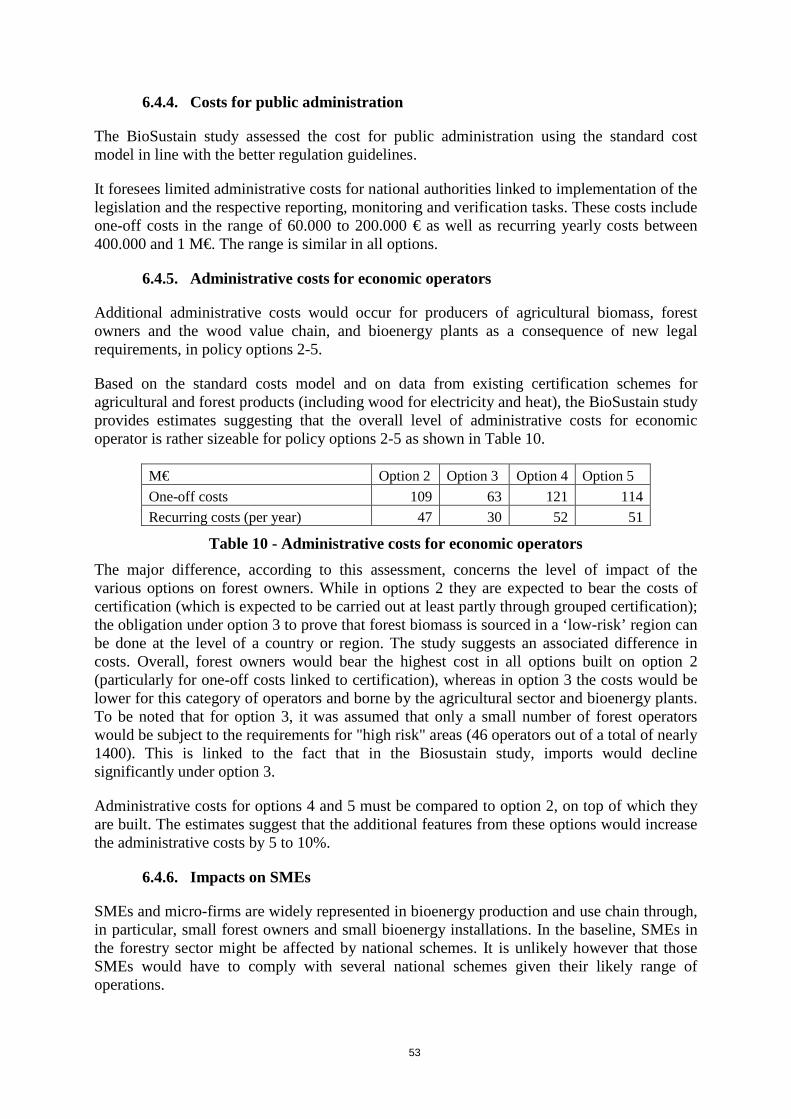
53
6.4.4. Costs for public administration
The BioSustain study assessed the cost for public administration using the standard cost model in line with the better regulation guidelines.
It foresees limited administrative costs for national authorities linked to implementation of the legislation and the respective reporting, monitoring and verification tasks. These costs include one-off costs in the range of 60.000 to 200.000 € as well as recurring yearly costs between 400.000 and 1 M€. The range is similar in all options.
6.4.5. Administrative costs for economic operators
Additional administrative costs would occur for producers of agricultural biomass, forest owners and the wood value chain, and bioenergy plants as a consequence of new legal requirements, in policy options 2-5.
Based on the standard costs model and on data from existing certification schemes for agricultural and forest products (including wood for electricity and heat), the BioSustain study provides estimates suggesting that the overall level of administrative costs for economic operator is rather sizeable for policy options 2-5 as shown in Table 10.
M€ Option 2 Option 3 Option 4 Option 5 One-off costs 109 63 121 114 Recurring costs (per year) 47 30 52 51
Table 10 - Administrative costs for economic operators The major difference, according to this assessment, concerns the level of impact of the various options on forest owners. While in options 2 they are expected to bear the costs of certification (which is expected to be carried out at least partly through grouped certification); the obligation under option 3 to prove that forest biomass is sourced in a ‘low-risk’ region can be done at the level of a country or region. The study suggests an associated difference in costs. Overall, forest owners would bear the highest cost in all options built on option 2 (particularly for one-off costs linked to certification), whereas in option 3 the costs would be lower for this category of operators and borne by the agricultural sector and bioenergy plants. To be noted that for option 3, it was assumed that only a small number of forest operators would be subject to the requirements for "high risk" areas (46 operators out of a total of nearly 1400). This is linked to the fact that in the Biosustain study, imports would decline significantly under option 3.
Administrative costs for options 4 and 5 must be compared to option 2, on top of which they are built. The estimates suggest that the additional features from these options would increase the administrative costs by 5 to 10%.
6.4.6. Impacts on SMEs
SMEs and micro-firms are widely represented in bioenergy production and use chain through, in particular, small forest owners and small bioenergy installations. In the baseline, SMEs in the forestry sector might be affected by national schemes. It is unlikely however that those SMEs would have to comply with several national schemes given their likely range of operations.
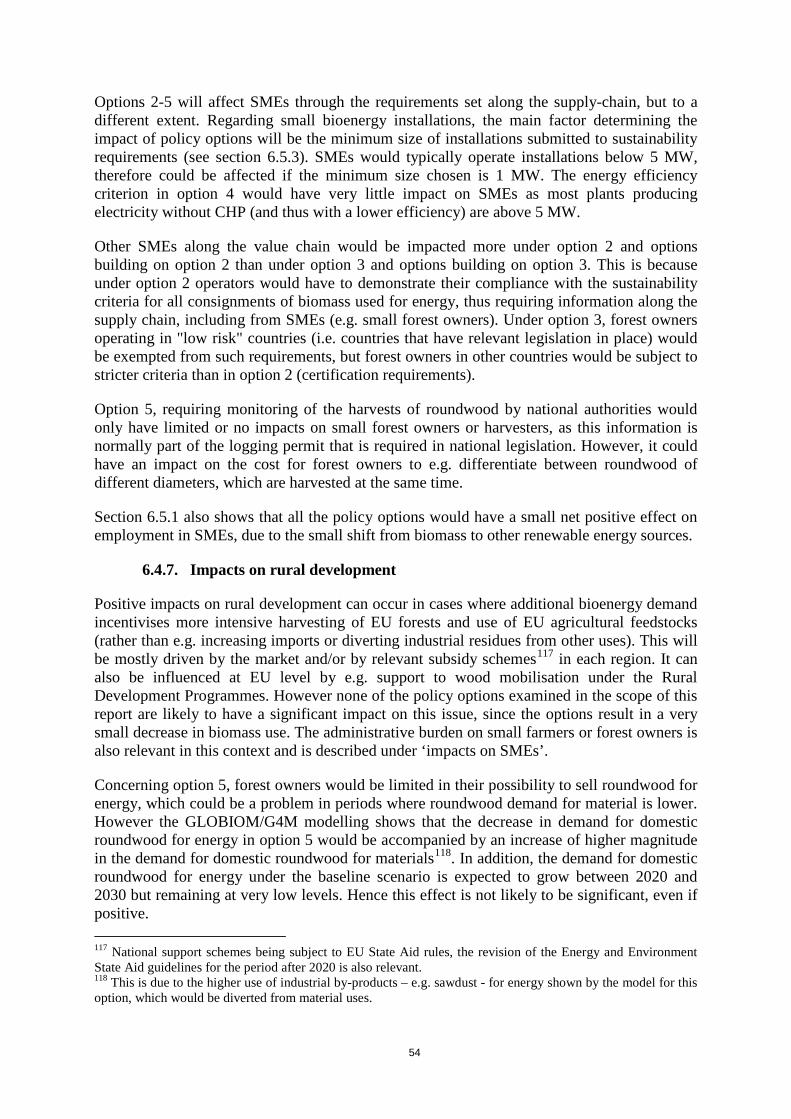
54
Options 2-5 will affect SMEs through the requirements set along the supply-chain, but to a different extent. Regarding small bioenergy installations, the main factor determining the impact of policy options will be the minimum size of installations submitted to sustainability requirements (see section 6.5.3). SMEs would typically operate installations below 5 MW, therefore could be affected if the minimum size chosen is 1 MW. The energy efficiency criterion in option 4 would have very little impact on SMEs as most plants producing electricity without CHP (and thus with a lower efficiency) are above 5 MW.
Other SMEs along the value chain would be impacted more under option 2 and options building on option 2 than under option 3 and options building on option 3. This is because under option 2 operators would have to demonstrate their compliance with the sustainability criteria for all consignments of biomass used for energy, thus requiring information along the supply chain, including from SMEs (e.g. small forest owners). Under option 3, forest owners operating in "low risk" countries (i.e. countries that have relevant legislation in place) would be exempted from such requirements, but forest owners in other countries would be subject to stricter criteria than in option 2 (certification requirements).
Option 5, requiring monitoring of the harvests of roundwood by national authorities would only have limited or no impacts on small forest owners or harvesters, as this information is normally part of the logging permit that is required in national legislation. However, it could have an impact on the cost for forest owners to e.g. differentiate between roundwood of different diameters, which are harvested at the same time.
Section 6.5.1 also shows that all the policy options would have a small net positive effect on employment in SMEs, due to the small shift from biomass to other renewable energy sources.
6.4.7. Impacts on rural development
Positive impacts on rural development can occur in cases where additional bioenergy demand incentivises more intensive harvesting of EU forests and use of EU agricultural feedstocks (rather than e.g. increasing imports or diverting industrial residues from other uses). This will be mostly driven by the market and/or by relevant subsidy schemes117 in each region. It can also be influenced at EU level by e.g. support to wood mobilisation under the Rural Development Programmes. However none of the policy options examined in the scope of this report are likely to have a significant impact on this issue, since the options result in a very small decrease in biomass use. The administrative burden on small farmers or forest owners is also relevant in this context and is described under ‘impacts on SMEs’.
Concerning option 5, forest owners would be limited in their possibility to sell roundwood for energy, which could be a problem in periods where roundwood demand for material is lower. However the GLOBIOM/G4M modelling shows that the decrease in demand for domestic roundwood for energy in option 5 would be accompanied by an increase of higher magnitude in the demand for domestic roundwood for materials118. In addition, the demand for domestic roundwood for energy under the baseline scenario is expected to grow between 2020 and 2030 but remaining at very low levels. Hence this effect is not likely to be significant, even if positive. 117 National support schemes being subject to EU State Aid rules, the revision of the Energy and Environment State Aid guidelines for the period after 2020 is also relevant. 118 This is due to the higher use of industrial by-products – e.g. sawdust - for energy shown by the model for this option, which would be diverted from material uses.
55
6.4.8. Impacts on the internal market and intra-EU trade
Policy options 2 and 3 would have certain benefits in terms of replacing national sustainability schemes by a harmonised EU scheme, although as discussed previously the barriers to intra-EU trade are limited. However, as the option 3 is based on a risk-assessment undertaken by operators, it may happen that different operators come to different results regarding sustainability of biomass in one region. This may create additional barriers to intra-EU trade.
The combustion efficiency requirement under option 4 would not have any impact on trading with the biomass resources. The "cap" feature of option 5 would be implemented at the national level through supervision on harvested feedstocks and therefore it would not have any further effect on circulation of these feedstocks in the market.
6.4.9. Impacts on external trade
As shown previously, in the baseline scenario imports from non-EU countries are projected to increase by 2020, and stabilise between 2020 and 2030. The policy options could impact the level of imports, in particular for option 3 and option 5. However, the degree to which this would happen is very uncertain.
For example, under option 3, biomass from countries or regions that don’t have legal requirements for sustainable forest management would need to demonstrate sustainability at a forest holding level. It is unlikely that the affected forest owners would undertake certification only in relation to the energy market. Therefore, the costs of such requirement could discourage the imports of biomass from countries or regions that do not have certified forests. At the same time, many operators from non-EU countries already comply with requirements from individual EU Member States.119 Given the fact that imports are not projected to increase significantly between 2020 and 2030, option 3 would affect mostly existing operators that already face these compliance costs. To be noted that it would be particularly important to develop option 3 in a way that is compatible with international trade rules and avoid that it is perceived as discriminatory. Option 5 would limit the use of roundwood for energy to levels used between 2015 and 2020. The impact on import levels would depend on the availability of wood pellets made from other sources than roundwood, in particular from industrial residues. This is subject to uncertainty: the BioSustain study suggests that a significant potential for industrial residues to be used for wood pellets exists e.g. in the United States while a study examining specifically the US South-East market120 (where most of the pellets exported to the EU are currently produced) found on the contrary that the availability of industrial residues for energy was very limited.
6.4.10. Energy security
The impacts on energy security in the baseline scenario (option 1) would depend on the relative contribution of bioenergy to electricity and heating on the one hand, and to the
119 Such requirements exist in the Member States that import the most solid biomass in the EU. 120 COWI, 2016: Environmental Implications of Increased Reliance of the EU on Biomass from the South East US; http://bookshop.europa.eu/en/environmental-implications-of-increased-reliance-of-the-eu-on-biomass-from-the-south-east-us-pbKH0116687/?CatalogCategoryID=DSoKABstDacAAAEjA5EY4e5L

56
geographical location of the increase in biomass. Indeed, there are alternative ways to produce electricity from renewable sources whereas options in the heating sector are less numerous. In addition, energy security in countries that are particularly reliant on imported gas or coal for heating (e.g. Eastern Europe) would benefit particularly from an increase of biomass of EU origin in the heating sector.
In this light, none of options 2-4 is likely to have any significant impacts compared to the baseline on energy security, as they either put very limited constraints on biomass use for energy (option 2) or would mostly affect imports (option 3) and large power generation installations which are mostly based in Western European Member States (option 4). Option 5 could have a negative impact on Eastern European Member States wishing to increase their use of roundwood for energy, although this use is not projected to be significant by 2030. This increase would still be possible but could not be linked to public support or the achievement of renewable energy targets.
6.4.11. Innovation and research
While bioenergy has an important innovation angle (for example with regards to advanced biofuels for transport), the policy options are unlikely to make a fundamental difference to innovation and research since the sustainability requirements would only have an impact on well-established technologies (i.e. the use of solid and gaseous biomass for heat and power).
6.4.12. Summary of economic impacts
Overall, the economic impacts by 2030 of policy options 2-5 are modest compared to the baseline (option 1).
The most significant impacts include:
- impact on wood use for materials from option 5
- administrative costs for operators, for all options (lowest costs for option 3)
- decrease in imports from third countries for all options, in particular options 3 and 5
- possible risk in perceived trade discrimination for option 3
6.5. Social impacts
6.5.1. Employment
Employment in the bioenergy economy is most significant in the solid biomass sector, where 306 800 Europeans had a job in 2014. In addition, 110 350 people were employed in the biofuels sector, 66 200 in the biogas sector and 8 410 in the renewable urban waste sector.121
In the baseline scenario, the Green-X/MULTIREG modelling projects that the development of renewable energy sources would support 1.4 million jobs, including direct and indirect jobs,
121 15th EurObserv’ER Report on State of Renewable Energies in Europe. Both direct and indirect jobs are captured in the statistics. .
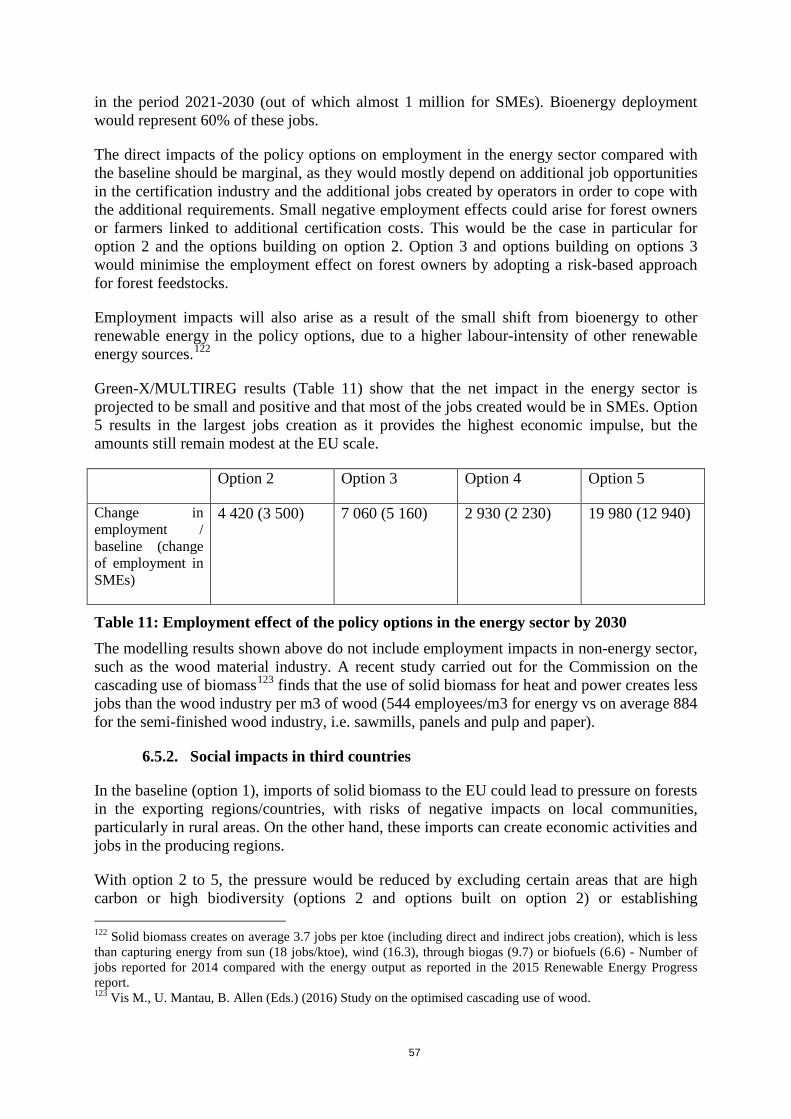
57
in the period 2021-2030 (out of which almost 1 million for SMEs). Bioenergy deployment would represent 60% of these jobs.
The direct impacts of the policy options on employment in the energy sector compared with the baseline should be marginal, as they would mostly depend on additional job opportunities in the certification industry and the additional jobs created by operators in order to cope with the additional requirements. Small negative employment effects could arise for forest owners or farmers linked to additional certification costs. This would be the case in particular for option 2 and the options building on option 2. Option 3 and options building on options 3 would minimise the employment effect on forest owners by adopting a risk-based approach for forest feedstocks.
Employment impacts will also arise as a result of the small shift from bioenergy to other renewable energy in the policy options, due to a higher labour-intensity of other renewable energy sources.122
Green-X/MULTIREG results (Table 11) show that the net impact in the energy sector is projected to be small and positive and that most of the jobs created would be in SMEs. Option 5 results in the largest jobs creation as it provides the highest economic impulse, but the amounts still remain modest at the EU scale.
Option 2 Option 3 Option 4 Option 5
Change in employment / baseline (change of employment in SMEs)
4 420 (3 500) 7 060 (5 160) 2 930 (2 230) 19 980 (12 940)
Table 11: Employment effect of the policy options in the energy sector by 2030 The modelling results shown above do not include employment impacts in non-energy sector, such as the wood material industry. A recent study carried out for the Commission on the cascading use of biomass123 finds that the use of solid biomass for heat and power creates less jobs than the wood industry per m3 of wood (544 employees/m3 for energy vs on average 884 for the semi-finished wood industry, i.e. sawmills, panels and pulp and paper).
6.5.2. Social impacts in third countries
In the baseline (option 1), imports of solid biomass to the EU could lead to pressure on forests in the exporting regions/countries, with risks of negative impacts on local communities, particularly in rural areas. On the other hand, these imports can create economic activities and jobs in the producing regions.
With option 2 to 5, the pressure would be reduced by excluding certain areas that are high carbon or high biodiversity (options 2 and options built on option 2) or establishing 122 Solid biomass creates on average 3.7 jobs per ktoe (including direct and indirect jobs creation), which is less than capturing energy from sun (18 jobs/ktoe), wind (16.3), through biogas (9.7) or biofuels (6.6) - Number of jobs reported for 2014 compared with the energy output as reported in the 2015 Renewable Energy Progress report. 123 Vis M., U. Mantau, B. Allen (Eds.) (2016) Study on the optimised cascading use of wood.
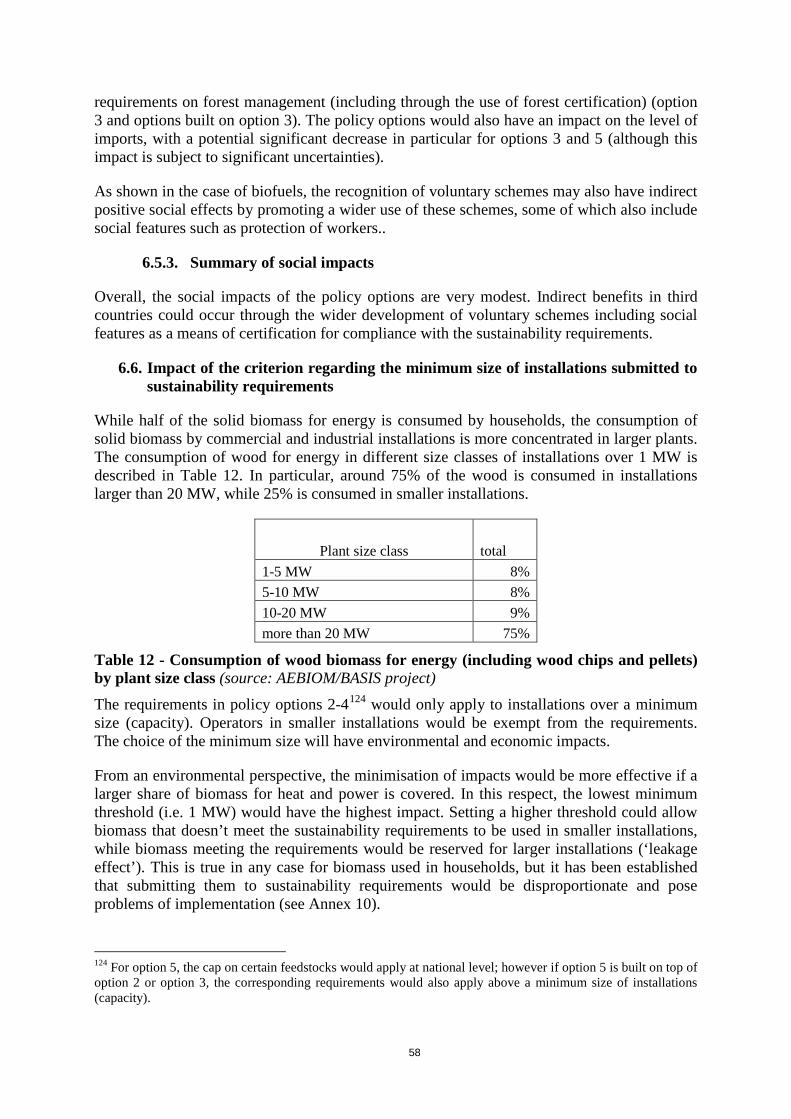
58
requirements on forest management (including through the use of forest certification) (option 3 and options built on option 3). The policy options would also have an impact on the level of imports, with a potential significant decrease in particular for options 3 and 5 (although this impact is subject to significant uncertainties).
As shown in the case of biofuels, the recognition of voluntary schemes may also have indirect positive social effects by promoting a wider use of these schemes, some of which also include social features such as protection of workers..
6.5.3. Summary of social impacts
Overall, the social impacts of the policy options are very modest. Indirect benefits in third countries could occur through the wider development of voluntary schemes including social features as a means of certification for compliance with the sustainability requirements.
6.6. Impact of the criterion regarding the minimum size of installations submitted to sustainability requirements
While half of the solid biomass for energy is consumed by households, the consumption of solid biomass by commercial and industrial installations is more concentrated in larger plants. The consumption of wood for energy in different size classes of installations over 1 MW is described in Table 12. In particular, around 75% of the wood is consumed in installations larger than 20 MW, while 25% is consumed in smaller installations.
Plant size class total 1-5 MW 8% 5-10 MW 8% 10-20 MW 9% more than 20 MW 75%
Table 12 - Consumption of wood biomass for energy (including wood chips and pellets) by plant size class (source: AEBIOM/BASIS project) The requirements in policy options 2-4124 would only apply to installations over a minimum size (capacity). Operators in smaller installations would be exempt from the requirements. The choice of the minimum size will have environmental and economic impacts.
From an environmental perspective, the minimisation of impacts would be more effective if a larger share of biomass for heat and power is covered. In this respect, the lowest minimum threshold (i.e. 1 MW) would have the highest impact. Setting a higher threshold could allow biomass that doesn’t meet the sustainability requirements to be used in smaller installations, while biomass meeting the requirements would be reserved for larger installations (‘leakage effect’). This is true in any case for biomass used in households, but it has been established that submitting them to sustainability requirements would be disproportionate and pose problems of implementation (see Annex 10).
124 For option 5, the cap on certain feedstocks would apply at national level; however if option 5 is built on top of option 2 or option 3, the corresponding requirements would also apply above a minimum size of installations (capacity).
59
From an economic perspective, and in particular in terms of administrative burden for economic operators, setting a higher threshold would be more beneficial, as less installations would have to comply with the sustainability requirements. In particular, there are a high number of small installations using biomass for energy – for wood chips, over half of the installations are below 5 MW125. A higher minimum threshold would also imply less impacts on other actors in the supply chain, although to a lesser degree as the impact would be proportional to the volume of biomass concerned (rather than to the number of bioenergy installations). Finally, the level of the threshold would also impact SMEs: a threshold set at a level of 5 MW or above would exempt most SMEs in the energy sector.
As mentioned in section 5.2, the minimum threshold would not apply to biogas installations, as most of them are below 1 MW.
125 Source: BASIS project
60
7. COMPARING THE OPTIONS
The Commission Services have not identified a preferred policy option, as all of the policy approaches, including the baseline scenario, could be valid for addressing the problems identified to various extents. The main reason that does not allow for a straightforward identification of the best policy approach is as follows:
• On the one hand, many stakeholders involved in the bioenergy sector claim that its future development, which is important for combating climate change, is hampered by public doubts about the environmental benefits of bioenergy;
• On the other hand, it is clear from the scientific evidence that the overall impacts of using biomass for energy on greenhouse gas emissions and on biodiversity are based on too many variables and cannot therefore be assessed or ensured with general prescriptions, but rather should be examined on a case by case and site-specific basis.
None of the policy options is therefore able to meet the main expectation of citizens and stakeholders on this initiative, in particular to reliably distinguish between ‘sustainable’ and ‘unsustainable’ sources of bioenergy for the heat and power sectors and set out this distinction in legislation, as was done for biofuels used in transport. The policy options are however able to address or mitigate some of the problems and risks as identified in this document, as described below.
7.1. How effective are the policy options in addressing the identified problems?
The impact assessment identified three main sustainability risks (climate impacts, other environmental impacts, and efficiency of conversion/competition with other uses of wood) which are all linked to the increasing use of in particular forest biomass for energy. In addition, some aspects concerning the production of heat and power from agricultural biomass are also covered in the following section.
A) Under the Baseline Scenario (option 1), the three risks can be addressed through other elements of the 2030 climate and energy framework and existing policies as follows:
i. The 2030 climate and energy framework includes proposed policies that would result in moderating the increase in biomass demand for energy after 2020. This includes in particular energy efficiency, the removal of priority dispatch under the Market Design proposal, and the discontinuation of binding renewable energy targets at national level. Since the increase in biomass demand is a major driver of the sustainability risks identified, this moderation in demand could help mitigate these risks.
ii. Regarding the climate risks, the accounting of biogenic emissions from forest biomass towards the EU’s economy-wide climate target through the proposed LULUCF regulation126 can reduce incentives to harvest certain types of forest biomass for energy that would reduce the LULUCF sink, and could guarantee that a decrease of the EU forest sink would be compensated by emission reductions elsewhere in the
126 COM/2016/479
61
economy. Emissions related to changes in land use in non-EU countries exporting to the EU are likely to be accounted for by many countries implementing the Paris Agreement (in particular the largest emitters), but not necessarily by all countries.
iii. Other environmental impacts related to biodiversity, and soil and water quality can be partly addressed through policies promoting sustainable forest management in the EU and beyond. These include EU policy on biodiversity (and particularly the Birds and Habitats Directives127), as well as Member States’ policies on sustainable forest management. EU action towards developing countries, including the FLEGT action plan, has a potential to encourage sustainable forest management in developing countries.128
iv. A more efficient conversion of biomass to energy in households will be promoted through the new Ecodesign measures for domestic boilers, effective as of 2020, and will also be encouraged under the revised Energy Efficiency Directive and Renewable Energy Directive. The conversion of biomass to energy in electricity-only plants is also likely to be discouraged through the disappearance of priority dispatch to the grid for renewables, as proposed in the Market Design Initiative129.
v. In addition, strengthened monitoring of both supply side and demand for bioenergy in the context of the proposed Regulation on the Governance of the Energy Union would allow to follow biomass developments relevant for the three risks identified.
B) Under option 2 (extension of existing sustainability criteria for biofuels to biomass used for heat and power), additional safeguards would be put in place as follows:
i. This option sets minimum greenhouse gas performance for supply chain emissions only (not including biogenic carbon). The analysis carried out for the impact assessment shows that such a requirement would not drive emission reductions overall (unless the threshold is set above 75% compared to fossil fuels). For forest-based feedstocks, this would prevent the most extreme practices (such as drying of wood in pellet mills with natural gas and their transportation over very long distances). Nonetheless, these are not common pathways used in the EU today and are not likely to develop in the future. Furthermore, the option does not address the impacts of biogenic CO2 emissions. It would therefore have at best very marginal impact in guaranteeing on climate change mitigation from forest bioenergy, unless a higher threshold is considered. For agricultural feedstocks, it would prevent some practices already existing (e.g. use of energy crops for biogas) or which could develop in future. The option would also prevent the conversion of high carbon stock land for biomass production, a practice which is not currently common, but would be detrimental if it occurred.
ii. The option would provide some minimum safeguards regarding the production of biomass in certain high biodiversity areas. It does not provide additional constraints regarding other environmental issues, such as air, soil and water quality.
127 Council Directive 92/43/EEC and Directive 2009/147/EC 128 In its Conclusions from 28 June 2016, the Council called on the Commission to ‘examine options to tackle the drivers of deforestation and forest degradation in the world and examine how the EU FLEGT Action Plan can continue to contribute to address these challenges. 129 Reference to the Market Design initiative
62
iii. The option would not deliver significant additional effects to the efficient conversion of biomass to energy. Although conversion efficiency is reflected indirectly to some degree in the calculation of GHG emissions from the supply chain, this does not significantly affect the ability of the respective biomass pathways to pass the proposed minimum greenhouse gas performance, unless this threshold is set at 75% savings or above.
C) Under option 3 (risk-based approach for forest management and requirements on LULUCF emissions), the three risks would be addressed as follows (in addition to the baseline scenario and the effects of a threshold for supply chain emissions as described in option 2):
i. The risk of adverse climate effects would be further mitigated by ensuring that all biomass producing countries supplying the EU account for their LULUCF emissions towards an economy-wide target, and also through the effect of this policy on volumes of biomass sourced in areas where there is lack of assurance regarding sustainable forest management.
ii. The same reasoning applies to other environmental impacts. While biodiversity protection will be improved to some degree, there would be no additional effects of this policy option to air, water and soil quality.
iii. There would be no direct effects of this policy on efficiency of conversion, but depending on the impacts on the level of imports,130 there may be a negative effect on competition for resources in the EU if the use of domestic feedstocks increases.
D) Under option 4 (minimum energy efficiency for new installations), the modelling projections show very little effect due to the low projected new capacity. However in principle, the option would have the following effect on the three risks:
i. If the option results in lower volumes of biomass required to produce a given amount of energy, this would result in lowering to some extent the risk of adverse climate effects, as well as the risks on biodiversity, soil and water quality. It would also lower air pollution through more efficient combustion.
ii. This option would partly mitigate the issues of competition for raw material by ensuring that no public support is given to new inefficient installations; however, it would not impact existing plants which already benefit from support and use inefficient conversion technologies.
E) Under option 5 (cap on the use of certain biomass feedstocks) the three risks would be further addressed as follows:
i. This policy option would in principle provide the most direct safeguard regarding climate impacts of bioenergy, by putting a constraint on the biomass feedstocks whose use entails higher risks of limited GHG savings compared to fossil fuels. However, the modelling has shown that this effect could be compensated by market effects in the material sector.
130 The impact of option 3 on the level of imports is uncertain, as shown by the differing results from the
modelling.
63
ii. The impact on biodiversity would be as in option 2 or 3 on which it builds, with additional impacts through the limitation of the use of stumps and the possible lower increase in demand for biomass for heat and power. This could lead to reducing pressure on air, water and soil quality.
iii. There could be indirect effects on competition with other wood-using industries under this policy option, in particular by increasing competition for industrial by-products in the EU, at the same time as reducing competition for roundwood, including pulpwood.
7.2. Are the policy options proportionate in addressing the problems?
The four regulatory policy options involve a certain level of administrative cost. This cost is comparable for the four options with regards to public authorities and operators of bioenergy plants; for forest owners these costs are significantly lower for option 3131 compared to options 2 and the options that build on it. In addition, all regulatory options result in a small shift from bioenergy to other renewable energy sources, leading to a higher level of public support.
By comparison, option 1 (baseline) does not entail any additional cost for Member States or operators.
As discussed previously, options 2 to 5 seem to have a limited effect under the conditions projected by the models. This is notably due to the fact that other elements of the 2030 climate and energy framework will already play a role in moderating the increase in biomass demand (a main driver for sustainability risks), as well as to the difficulty of adequately addressing the issue of biogenic carbon. Indirect market effects triggered by the policy options also play a role in minimising their impact (for example in option 5).
In this light, policy option 1 (baseline scenario) appears as the most efficient policy option in terms of balance between results and the administrative burden (Option 1).
On the other hand, options 2 to 5 would act as additional "safeguards" in case practices that exacerbate the problems develop more strongly than identified in the modelling work. This is relevant in view of the level of uncertainty on future biomass development, including trade patterns and feedstock choice.
In this scenario, option 2 would be the most direct safeguard against the risks of production of biomass in high biodiversity areas or through deforestation.
An ambitious minimum performance requirement for supply chain emissions (75% or higher) would be the most effective way to prevent inefficient practices.
Option 3 would be the most effective safeguard against the risks of increased biomass sourcing through unsustainable forest management or from countries that do not have in place accounting systems for emissions from land use, land-use change and forestry.
Option 4 would be the most straightforward precautionary measure against the risk of further deployment of new installations combusting biomass with low efficiency.
131 Assuming that option 3 results in a significant decrease in imports of biomass from third countries
64
Option 5 would provide the most effective safeguard against a risk of increased use of roundwood and stumps for bioenergy, which are the most risky feedstocks in terms of climate impacts.
7.3. How are the policy options coherent with the wider policy agenda of the College?
On top of the policy objectives linked to climate action, environmental protection, resource efficiency and a functioning internal market as discussed above, the Commission has also defined more overarching objectives that may be affected by the future deployment of bioenergy. These include in particular i) growth, jobs and investment and 2) the ambition for the EU to become the world leader in renewable energies. As follows from the section on economic and social impacts, renewable technologies such as those that capture energy from wind and sun require larger investment input, but at the same time provide more jobs per unit of energy compared to bioenergy, which is in many cases a less costly source of renewable energy. The actual net-jobs benefit is therefore diminished in the analysis by the so-called ‘budget effect’ (loss of jobs in other parts of the economy, driven by higher consumer spending on energy), which will last as long as the cost of electricity from particularly solar and wind technologies remains higher than the cost of bioelectricity.
The impact assessment on the Renewable Energy Directive132 suggests that by 2030, the EU is likely to attain the level of 24 % renewable energy in absence of new policies. It will therefore make a difference in terms of the amount of investments in the sector, as well as the number of jobs created, whether the additional 3 % is achieved through encouraging bioenergy or other RES technologies.
While bioenergy is crucial for attaining the above-mentioned binding objective, a marginally higher share of bioenergy versus other renewable sources will result in a marginally lower incentive for emerging technologies. The policy options that establish constraints for bioenergy use (2, 3, 4 and 5) will therefore indirectly stimulate focus of the energy sector on other renewable energy sources.
In order to ensure coherence within the EU acquis, the four policy options were designed as a complement to the already existing policies and new initiatives, where these cannot fully address the defined problems.
132 SWD(2016)418
65
8. HOW WILL MONITORING AND EVALUATION BE ORGANISED?
Monitoring and evaluation of progress towards the policy objectives can be done partly using monitoring tools under existing instruments or existing Eurostat data, and partly through other means, including the new Energy Union governance framework.
In particular, monitoring of the overall quantities of biomass used for energy as well as the type of biomass, type of feedstocks, geographical origin and final use will be important. Reporting requirements already exist under the Renewable Energy Directive and will be streamlined through the Energy Union governance framework. In the context of this framework, the contribution of biomass use to the climate and energy targets as well as on its efficient use will be monitored through the national plans and measured against the 2030 objectives set for greenhouse gas emissions, renewable energy and energy efficiency.
Regarding the specific policy objectives, the monitoring should take place as follows:
- Objective: contribution of bioenergy to climate change mitigation o Reporting under the EU regulation on Land use, Land use change and forestry
greenhouse gas emissions133 and in particular under the provisions for forest management
o Disaggregated reporting on the type of feedstocks used for bioenergy and their geographical origin
- Objective: reduce impacts on biodiversity, soil, water and air o Reporting under existing EU environmental legislation in particular concerning
biodiversity and air pollution o Reporting on forest management practices in the EU through the Forest Europe
process o (In the case of option 3 or options building on option 3): reporting on how the
requirements concerning sustainable forest management under the risk-based approach are implemented (in EU and non-EU countries)
- Objective: promote efficient uses of biomass for energy o Reporting on final use of solid and gaseous biomass (electricity only,
electricity with CHP, heating and cooling) o Monitoring of prices of wood raw materials in the EU
133 COM/2016/479
66
ANNEX 1. PROCEDURAL INFORMATION CONCERNING THE PROCESS TO PREPARE THE IMPACT ASSESSMENT REPORT
The interservice group (ISG) on sustainability of bioenergy was set up on 1 July 2015, as a sub-group of the ISG preparing the review of the Directive on renewable energy sources. Its objective is to prepare, with the participation of all interested services, an impact assessment and a legislative proposal and/or other instruments as appropriate. The ISG is chaired by the Secretariat-General, who also acts as the leading service on this file. Five DGs (AGRI, CLIMA ENER, ENV, GROW) act as associated services in order to support SG in preparing the work of the ISG and the JRC has provided scientific advice and support all along the process.
In the Agenda Planning, the initiative on sustainability of bioenergy is considered as one of the issues within the Renewable Energy Package (2016/ENER/025). As such, it also features in the Commission Work Programme for 2016 as part of the Energy Union Package (action No 7).
The ISG met six times for the purpose of preparing and discussing this impact assessment. As a follow-up to the first meeting, services were in particular invited to provide information on all evidence, studies, and processes relevant for the work of this ISG. The ISG also discussed specific sections of the impact assessment as well as the preparation of the stakeholder consultation. The five associated DGs and the JRC made substantial contributions to the preparation of this impact assessment throughout the process, including by providing quantified input through dedicated modelling and studies (more details below).
Consultation of the RSB:
The draft IA was submitted to the Regulatory Scrutiny Board (RSB) on 27 July and wasdiscussed at the RSB hearing on 14 September 2016, following which the RSB gave a positive opinion. The issues raised by the RSB, with the relevant actions undertaken on the text of the Impact Assessment, are summarised in the following table. Revised Impact Assessment on sustainability of bioenergy
Issues Raised Changes introduced in the revised version
Issues cross cutting to other impact assessments
Support schemes have played an important role in promoting bioenergy and are key drivers of the future sustainability of bioenergy. The problem definition and baseline should assess and integrate the influence of existing and future support schemes for renewable energy. The report
The issue has been addressed in further details in sections 2 (problem definition) and particularly 5.1.3 (baseline) where more details have been given on the way changes to the Renewable Energy Directive and Market Design will affect bioenergy demand. The modelling work examines post-2020 a least cost approach at EU level, while taking into account the
67
should integrate how changes to the Renewables Directive and the market design initiative will affect the demand for bioenergy. Given the importance of support schemes in driving the demand for bioenergy, the IA should explore the need for policy options explicitly covering the design of support schemes.
discontinuation of national binding targets for renewable energy.
Biofuels: This IA assesses sustainability requirements for bioenergy, but it explicitly excludes biofuels included in the IA on renewable energy. Given that the issues for biofuels are not different from the issues for other sources of bioenergy, the reference to the impact assessment on renewables should demonstrate the coherence or the possible differences in policy approach.
Section 2 now explains more clearly the way biofuels are examined in the Impact Assessment on renewable energy (addressing notably indirect land use change, the cap on food-based biofuels and the development of advanced biofuels) and in the present Impact Assessment. (addressing the current sustainability criteria for biofuels).
Issues specific to the present impact assessment The IA addresses all forms of bioenergy, but the analysed options mostly concern solid biomass. The IA should explain and justify this focus better. In addition, the report characterises some issues as problems without much support from evidence, including stakeholder views. One such example is fragmentation of the internal market. While the report should explain the issues it considers, it should only retain the most relevant ones throughout the analysis (objectives, options and impacts).
Section 2 now explains the treatment of biomass vs biofuels more clearly. The issue of fragmentation of the internal market has been substantially reworked in the problem definition (section 2.4) as well as in the impacts (section 6.4.8); this issue has also been removed from the specific objectives, as the evidence does not indeed point it out as a major risk.
The IA should explain better its choices regarding examined and discarded policy options. It should explain whether other policy options (like more restrictive support schemes) could have been considered.
The section on policy options (section 5.2) now goes more into depth into discarded options, complemented by Annex 10. It also explain why more far-reaching options were not considered.
The report does not explicitly present a preferred option. While this is not obligatory,
The section on the comparison of the options and the way they are fit for the purpose (section 7.2) has been reworked to
68
doing so would enhance the usefulness of the IA in the subsequent decision making process. At least, the report should reduce the number of potential "preferred options" to a few realistic ones.
explain more clearly why there is no clearly preferrable option that could be identified by Commission services purely on the basis of evidence.
Main recommendations for improvements Problem analysis and baseline The report should better structure the problem analysis and explain the links with other initiatives, such as the revision of the Renewables Directive and the future design of electricity markets. In this context, the baseline should reveal the role played by renewable energy targets, dispatch priority and support schemes for bioenergy in the likely evolution of bioenergy use and its impact on emissions. Moreover, the report should clarify whether it deals with bioenergy in general (as currently in the problems analysis) or rather focusses on solid biomass (as in the policy options; although biofuels appear in the discarded options). Finally, the report should re-examine in how far internal market aspects (mentioned by some stakeholders) constitute a relevant problem to be addressed in the context of this initiative (as biomass is mainly locally consumed).
The problem definition has been substantially reworked and includes more elements on the link with other initiatives. The baseline (section 5.1.3) has been developed to include more specific elements in particular on the removal of priority dispatch and on elements linked to support schemes. The section on policy options now explains why it was chosen not to reopen the biofuels sustainability criteria on substance, but rather to improve the way they are implemented. Elements on the internal market have been reworked both in the problem definition (section 2.4) and in the impacts (section 6.4.8)
Policy options The report should clarify on the basis of which criteria a number of policy options have been discarded (in particular when some of them could tackle administrative burden concerns) while others have been kept for further examination. Given that the overall impacts of the policy options are found to be rather limited, the report should explain why it has not considered more far-reaching policy options (e.g. moderating the demand for biomass). Moreover, in light of the consideration of support schemes in the problem analysis (see above), the report should reflect why policy options to reform or ban such support schemes have not been examined.
Section 5.2 on policy options now gives more details on the most important policy options that were discarded at an early stage. This is further complemented by Annex 10 with explanations for discards of a number of other potential policy approaches; the report now also looks into the possible effects of a more stringent threshold for supply chain emissions. Finally, it also gives further explanations on why some more far-reaching policy options are not examined.
Impact analysis The report should clearly set out the most
In section 6, a summary has been
69
significant impacts and separate limited from uncertain impacts. The report currently does not identify a preferred policy option; however, as section 7.2 indicates that the policy options have only limited impacts, the report should evaluate, taking into account the analytical uncertainties, whether the baseline is itself a viable policy option. In the absence of a preferred policy option, the report should clearly present how the different options compare, including stakeholders’ views when available and at least reduce the number of potential "preferred options" to the most credible ones.
introduced for each category of impacts (environmental, economic, social), summarising the impacts and identifying the ones that could be significant. Section 7 and in particular 7.2 (proportionality) have been reworked to better explain how the baseline is a viable policy option. The account of stakeholder preferences regarding various options was further streamlined in the sections describing the policy options. The section 7.2 now also compares the options in terms of the effectiveness with which they address the identified risks.
Procedure and presentation
The report needs to be more reader-friendly. Non-expert readers should easily be able to discern the main policy trade-offs. The issues and the examined policy options should be easy to recognise and understand. Policy makers should have straightforward access to the main arguments in a way that allows them to rank the various policy options. The report should be shorter and better structured, with minimal use of jargon and acronyms.
The various sections of the report have been significantly redrafted for clarity, while at the same time introducing the additional elements requested. Also the glossary has been expanded and a list of acronyms has been introduced. Section 7 in particular (comparing the options) has been reworked to make the conclusions clearer. At the same time, conciseness was sought across the whole report so that its length is not significantly affected even after introduction of all the requested additional analysis.
Studies The European Commission contracted several studies, in order to gather further evidence on the main risks and opportunities linked to bioenergy. Work on these studies was in most cases carried out in parallel with the impact assessment process. Nevertheless, either the final versions of these studies or at least their final drafts were available to Commission services before the submission of the draft IA to the Regulatory Scrutiny Board. In particular:
1. Sustainable and optimal use of biomass for energy in the EU beyond 2020. By a consortium led by PricewaterhouseCoopers. The draft final report was made available to Commission services on 29 June 2016.
2. Carbon impacts of biomass consumed in the EU: quantitative assessment. By a consortium led by The Research Agency of the Forestry Commission (United Kingdom). The final study was delivered in December 2015.
70
3. Study on impacts on resource efficiency on future EU demand for bioenergy. By a consortium led by the International Institute for Applied Systems Analysis (Austria). The final study was delivered in May 2016.
4. Environmental Implications of Increased Reliance of the EU on Biomass from the South East US. By a consortium led by COWI (Denmark). Published in July 2016.
As the above studies examined the bioenergy sustainability issues from different angles. The first three studies provided a range of analytical outcomes that were not, in some cases, consistent across the three studies, while they were at the same time based on slightly different baseline scenarios or assumption inputs. In order to make sure that the underlying assumptions, the modelling results, as well as the strengths and limitations of the models used are well understood by policy makers when reading the results of these studies, the Joint Research Centre organised a conference addressing this challenge with the three consortia, researchers from European universities and think-tanks and the Commission services. The event took place in Ispra, Italy, on 21-22 April 2016. Further detail on the underlying modelling exercise is then available in the Annex 4. In addition, Commission services were informed by other studies that have been conducted in the course of other policy work streams, but with high relevance for sustainability of bioenergy:
1. Climate benefits of material substitution by forest biomass and harvested wood products: perspective 2030. Consortium led by Thünen Institute of Wood Research (Germany). The revised draft of the Final Report was made available to Commission services in March 2016.
2. Study on the optimised cascading use of wood. Vis M., U. Mantau, B. Allen (Eds.) 2016
3. Study on the wood raw material supply and demand for the EU wood-processing industries. 2013.
4. Study on Renewable Energy and Research and Innovation Capacity of Sub-Saharan Africa: Theme report — Biomass. By a consortium led by Ecorys. The final report was delivered in April 2015.
The interservice group also profited from the scientific input by the Joint Research Centre, in particular through the following reports:
1. Biomass study 2015/2016. By the Joint Research Centre, pursuant to the mandate on the provision of data and analysis on a long-term basis on biomass supply and demand. The Interim Report has been made available in December 2015.
2. Solid and gaseous bioenergy pathways: input values and GHG emissions. Giuntoli et al. Version 1a available to Commission services as of xx. 2015.
3. Carbon accounting of forest bioenergy. Agostini et al. 2014. Apart from its direct inputs through its studies, the Joint Research Centre played a key role in verifying the robustness of the studies provided to the Commission by external experts. There are indeed a number of other recent studies addressing the challenges related to bioenergy, notably its climate impacts. These have been thoroughly mapped through two

71
literature reviews (one by Joint Research Centre (JRC) study on carbon accounting, the other in the Study on Carbon Impacts) that are summarised in ANNEX 7.
72
ANNEX 2. STAKEHOLDER CONSULTATION
Since launching the impact assessment process in July 2015, Secretariat-General as the leading service on the file participated in a broad stakeholder outreach. This has been taken forward at three levels:
i) Bilateral meetings with stakeholders in order to discuss bioenergy sustainability from their specific point of view. This was particularly pertinent for gathering the evidence for the problem definition.
ii) An online public consultation allowing a broad range of stakeholders to express their views and suggestions on all elements of the impact assessment process, in particular risks and benefits of bioenergy, policy objectives to be pursued, the ability of existing legal framework to cope with the challenges and the possible policy approaches.
iii) A stakeholder conference providing for an exchange of views between representatives of civil society, professional organisations, businesses, public authorities, scientists and researchers. The particular added value of this event was that stakeholders from the full spectre of interests discussed questions and challenges from the expert audience in the conference plenary.
In addition, as of the end of April 2016 the Commission has received over 58 000 emails as part of a campaign. These emails originate predominantly from US citizens, with a small fraction of these messages also from EU Citizens. With a few exceptions, these messages were coordinated through a communication campaign lead by US-based environmental NGOs Natural Resources Defence Council, National Wildlife Federation and Dogwood Alliance
The campaign focused on the impact of EU bioenergy demand on US forests. Concerns were expressed that the increase in pellet productions in the US, driven by EU demand, was leading to unsustainable practices with impacts in particular on climate change and biodiversity. The campaigners ask the EU to take action to remedy these concerns.
I) Bilateral meetings In the period between July 2015 and June 2016, Secretariat-General met with a wide range of stakeholders at their request. Other services (in particular the five associated DGs) also met with a wide array of stakeholders.
II) Online consultation II.1. Introduction
The online public consultation was open for 12 weeks, from 10 February until 10 May 2016. During this period, the Commission received in total 971 replies, with a few belated responses arriving after the deadline.134
Through the online consultation, the Commission meant to gather the views of all interested stakeholders and citizens, across the European Union and beyond, as well as across public,
134 Whilst all contributions were fully considered in Commission’s analysis, the statistical data in this Annex
only reflect the 971 contributions received within the deadline.
73
private, academic and NGO sectors. The aim of the consultation was to inform the policy making process on the future bioenergy sustainability policy and contribute to the underlying analysis.
The following sections present the main features of the consultation as well as some of the key results. A detailed analysis of the EU Survey has been carried out by VITO NV.135
II.2. Organisation of the questionnaire
The questionnaire was designed in the way that allowed reaching out to a wide range of interested stakeholders, including individuals, while at the same time giving space for in-depth analytical input by stakeholders with significant expertise/experience in the field. The web tool also provided for a possibility to upload position papers or other material.
The online consultation was composed of 28 questions, including open and closed ones. 11 questions were aimed at gathering information about respondents, i.e. whom they represent, their sector of activity, size (where appropriate), country of residence etc. This allowed drawing more detailed analysis from the responses on the substantial questions.
The next group of questions focused on broad perceptions of bioenergy and assessment of the related risks and opportunities. In particular, participants were asked to rate the contribution of bioenergy to a range of benefits as well as the significance and relevance of a number of risks that have been raised concerning bioenergy production and use.
The following set of questions asked stakeholders to appreciate the environmental and administrative effectiveness of the existing EU sustainability scheme for biofuels and bioliquids, its role in promoting market uptake of advanced biofuels and the obstacles to faster development of innovative technologies. Similarly, respondents were also invited to review the effectiveness of the existing policy framework in addressing the risks linked with solid and gaseous biomass used for heat and power.
Finally, the questionnaire asked respondents to rank nine policy objectives for the future policy. Building on responses to the previous questions, stakeholders were then asked about the need for additional EU policy on bioenergy sustainability, either for biofuels and bioliquids, for solid and gaseous biomass, or for both, and their views on what this policy should entail.
II.3. Respondents
Out of the 971 replies: • The largest contribution came from individuals (278 respondents). The background of
these respondents in a number of cases overlap with some of the other stakeholder groups below, as they often involve researchers in think-tanks and universities, employees in private and public enterprises or retired practitioners.
• 207 replies were sent by private enterprises and 55 by public enterprises. The energy and forestry sectors were the most represented in these answers (110 and 78 answers respectively). 39 % of the respondents in this category defined themselves as large enterprises, 25 % as micro-enterprises, 21 % as small enterprises and 14 % as medium-sized enterprises.
• Moreover, there were 155 replies from professional organisations representing stakeholders in one or more sectors. The sectors that were most often listed in the scope activity were energy (83 respondents), forestry (54 respondents), agriculture (42),
135 Insert reference to the report, once finalised.

74
followed by food (19), biotechnology (18), woodworking industry (16), pulp and paper (13).
• a total of 73 public authorities participated in the consultation — these included national, regional and local authorities.
• there were also 110 civil society organisations, mostly active in the area of environmental protection, 51 academic/research institutions and 22 ‘international organisations’136 who contributed to the survey.
II.4. Representativeness of the online consultation
The level of response to the online consultation is considered satisfactory, as well as the representation of a wide range of stakeholders and citizens from a range of sectors and geographical origins in the responses. It has to be noted however that certain geographical areas were over-represented in the number of responses, while on the other hand some countries are less represented. In particular almost half of all responses (46 %) came from Germany and Austria. A large number of contributions (at least 20) were received from Sweden, Finland, Belgium, the Netherlands, United Kingdom, Spain and France. At the same time, the Commission received only 67 replies from the EU12 countries combined.
A significant number of stakeholders answered open questions as well as the closed ones, providing more detailed comments. For instance, more than half of respondents provided views regarding the content of the future EU policy framework on sustainability of bioenergy. About a third of all respondents answered question 9 which allowed for other specific views that could not be expressed in the context of the replies to the previous questions.
II.5. Bioenergy and its future role in the EU’s Renewable energy mix
The survey started with an inquiry about general perceptions of bioenergy and the various forms its takes. Firstly, stakeholders were asked whether bioenergy should i) continue to play a dominant role as it does today (over 60 % of share in RES), ii) continue to play an important role in the renewable energy mix, but the share of other renewable energy sources (such as solar, wind, hydro and geothermal) should increase significantly, or iii) play an important role in the renewable energy mix, but with other renewable energy sources becoming dominant.
These results can be interpreted in two principal ways. On the one hand, there are more than 80 % of respondents who underline the importance of bioenergy in the future energy mix. At 136 The subsequent analysis showed that respondents who defined themselves as international organizations are
in majority of cases professional associations acting at the international level.
0100200300400500
Dominant (45 %) Important but withsignificat increase of
other RES (36%)
Other RES dominant(14%)
No answer (5%)
Role of bioenergy in the renewable energy mix
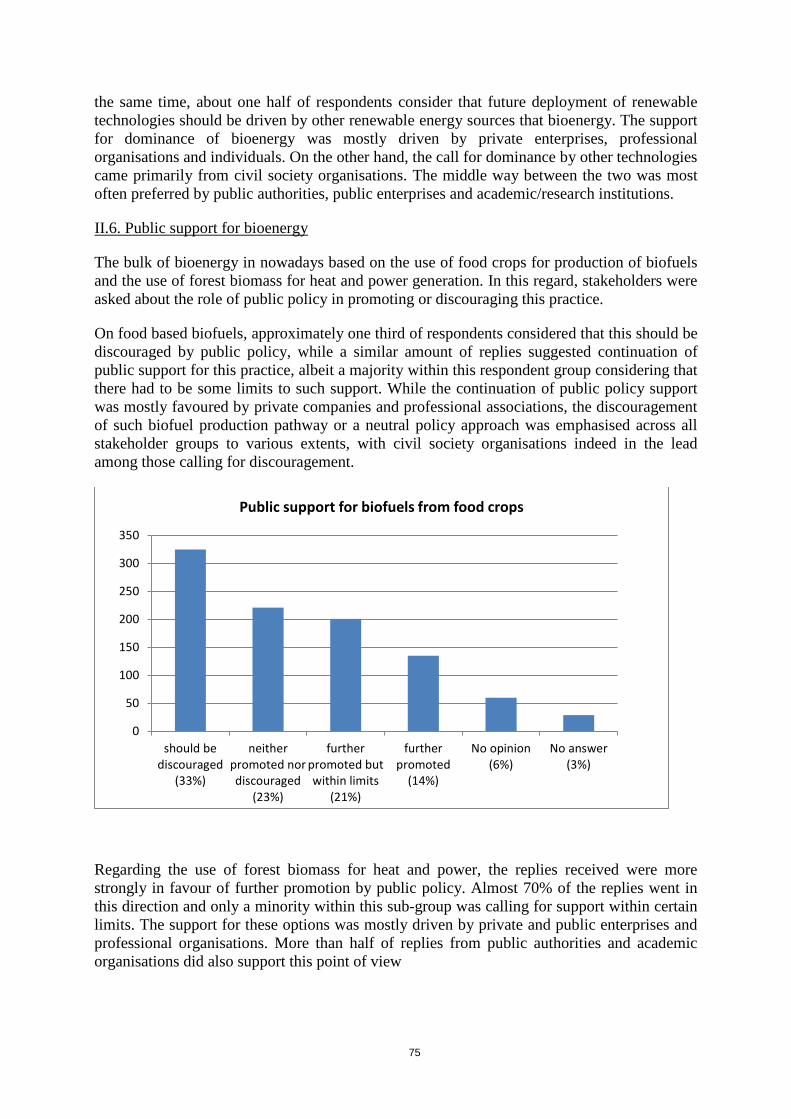
75
the same time, about one half of respondents consider that future deployment of renewable technologies should be driven by other renewable energy sources that bioenergy. The support for dominance of bioenergy was mostly driven by private enterprises, professional organisations and individuals. On the other hand, the call for dominance by other technologies came primarily from civil society organisations. The middle way between the two was most often preferred by public authorities, public enterprises and academic/research institutions.
II.6. Public support for bioenergy
The bulk of bioenergy in nowadays based on the use of food crops for production of biofuels and the use of forest biomass for heat and power generation. In this regard, stakeholders were asked about the role of public policy in promoting or discouraging this practice.
On food based biofuels, approximately one third of respondents considered that this should be discouraged by public policy, while a similar amount of replies suggested continuation of public support for this practice, albeit a majority within this respondent group considering that there had to be some limits to such support. While the continuation of public policy support was mostly favoured by private companies and professional associations, the discouragement of such biofuel production pathway or a neutral policy approach was emphasised across all stakeholder groups to various extents, with civil society organisations indeed in the lead among those calling for discouragement.
Regarding the use of forest biomass for heat and power, the replies received were more strongly in favour of further promotion by public policy. Almost 70% of the replies went in this direction and only a minority within this sub-group was calling for support within certain limits. The support for these options was mostly driven by private and public enterprises and professional organisations. More than half of replies from public authorities and academic organisations did also support this point of view
0
50
100
150
200
250
300
350
should bediscouraged
(33%)
neitherpromoted nordiscouraged
(23%)
furtherpromoted butwithin limits
(21%)
furtherpromoted
(14%)
No opinion(6%)
No answer(3%)
Public support for biofuels from food crops
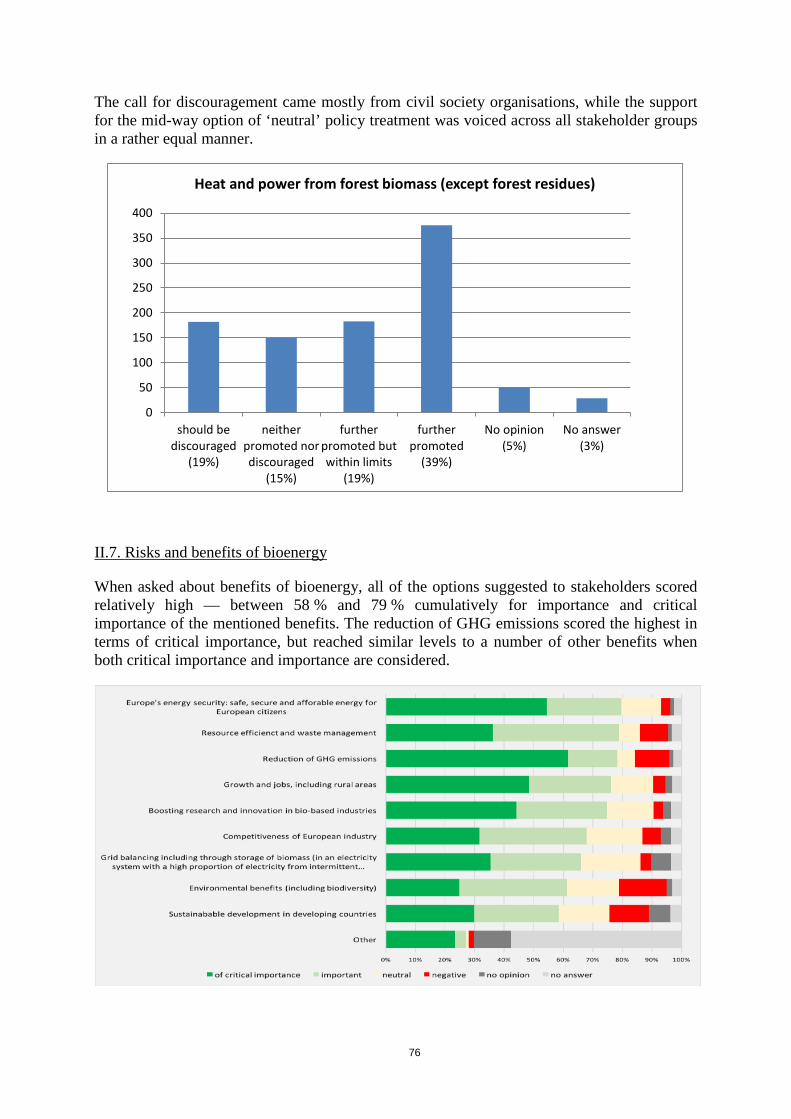
76
The call for discouragement came mostly from civil society organisations, while the support for the mid-way option of ‘neutral’ policy treatment was voiced across all stakeholder groups in a rather equal manner.
II.7. Risks and benefits of bioenergy
When asked about benefits of bioenergy, all of the options suggested to stakeholders scored relatively high — between 58 % and 79 % cumulatively for importance and critical importance of the mentioned benefits. The reduction of GHG emissions scored the highest in terms of critical importance, but reached similar levels to a number of other benefits when both critical importance and importance are considered.
0
50
100
150
200
250
300
350
400
should bediscouraged
(19%)
neitherpromoted nordiscouraged
(15%)
furtherpromoted butwithin limits
(19%)
furtherpromoted
(39%)
No opinion(5%)
No answer(3%)
Heat and power from forest biomass (except forest residues)
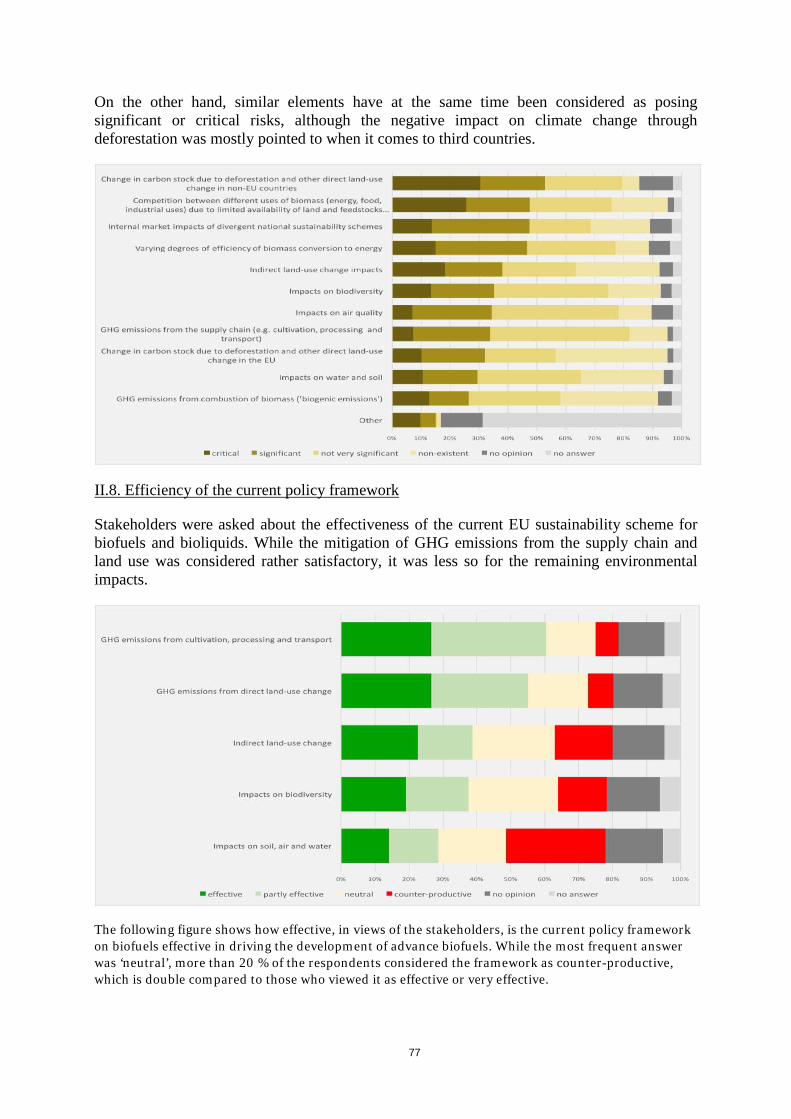
77
On the other hand, similar elements have at the same time been considered as posing significant or critical risks, although the negative impact on climate change through deforestation was mostly pointed to when it comes to third countries.
II.8. Efficiency of the current policy framework
Stakeholders were asked about the effectiveness of the current EU sustainability scheme for biofuels and bioliquids. While the mitigation of GHG emissions from the supply chain and land use was considered rather satisfactory, it was less so for the remaining environmental impacts.
The following figure shows how effective, in views of the stakeholders, is the current policy framework on biofuels effective in driving the development of advance biofuels. While the most frequent answer was ‘neutral’, more than 20 % of the respondents considered the framework as counter-productive, which is double compared to those who viewed it as effective or very effective.
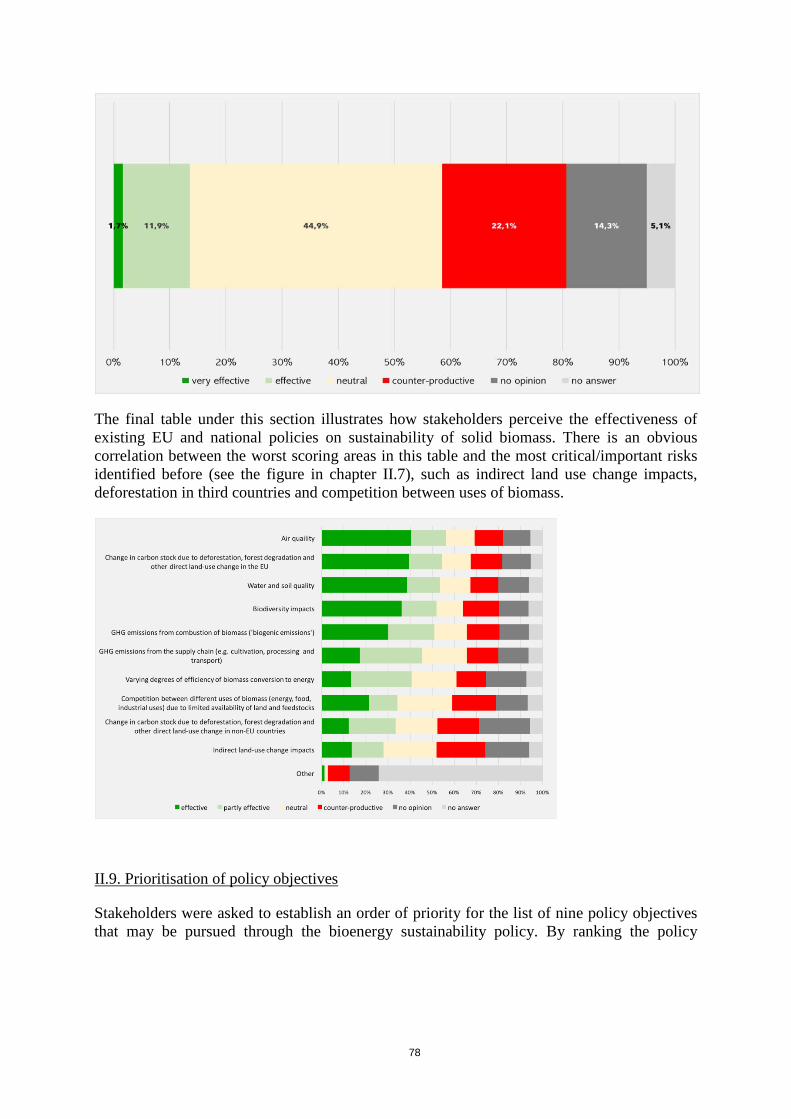
78
The final table under this section illustrates how stakeholders perceive the effectiveness of existing EU and national policies on sustainability of solid biomass. There is an obvious correlation between the worst scoring areas in this table and the most critical/important risks identified before (see the figure in chapter II.7), such as indirect land use change impacts, deforestation in third countries and competition between uses of biomass.
II.9. Prioritisation of policy objectives
Stakeholders were asked to establish an order of priority for the list of nine policy objectives that may be pursued through the bioenergy sustainability policy. By ranking the policy
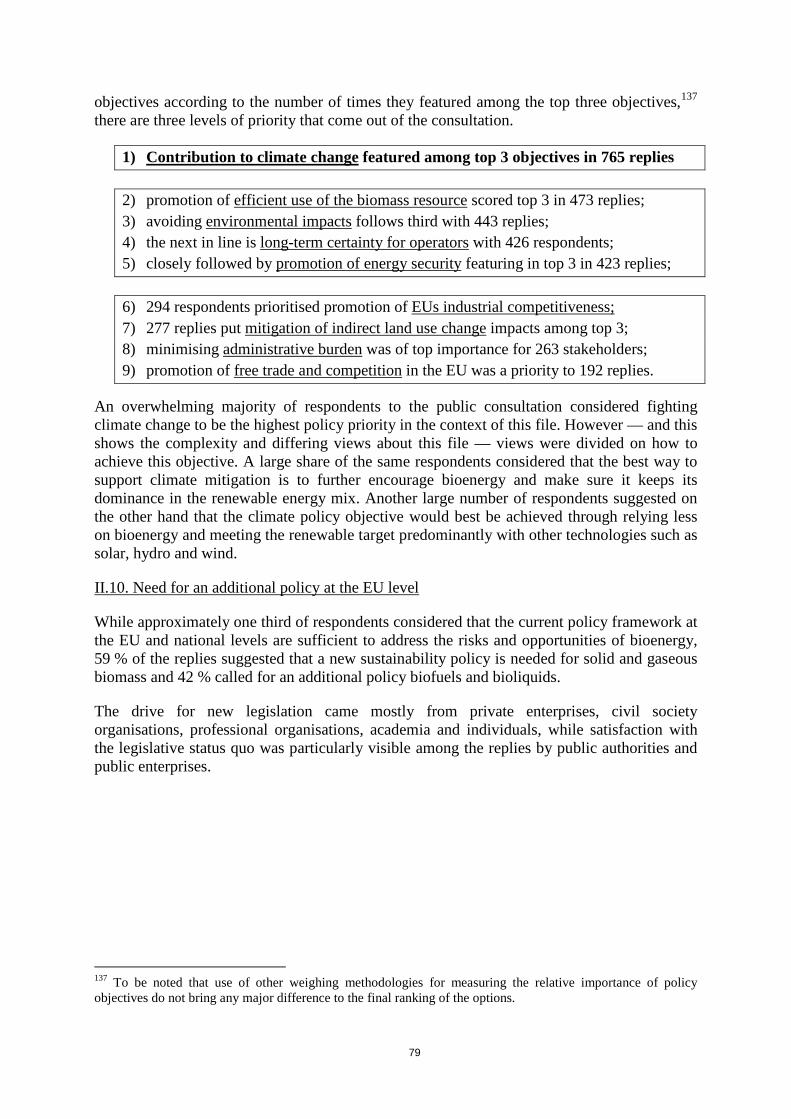
79
objectives according to the number of times they featured among the top three objectives,137 there are three levels of priority that come out of the consultation.
1) Contribution to climate change featured among top 3 objectives in 765 replies
2) promotion of efficient use of the biomass resource scored top 3 in 473 replies; 3) avoiding environmental impacts follows third with 443 replies; 4) the next in line is long-term certainty for operators with 426 respondents; 5) closely followed by promotion of energy security featuring in top 3 in 423 replies;
6) 294 respondents prioritised promotion of EUs industrial competitiveness; 7) 277 replies put mitigation of indirect land use change impacts among top 3; 8) minimising administrative burden was of top importance for 263 stakeholders; 9) promotion of free trade and competition in the EU was a priority to 192 replies.
An overwhelming majority of respondents to the public consultation considered fighting climate change to be the highest policy priority in the context of this file. However — and this shows the complexity and differing views about this file — views were divided on how to achieve this objective. A large share of the same respondents considered that the best way to support climate mitigation is to further encourage bioenergy and make sure it keeps its dominance in the renewable energy mix. Another large number of respondents suggested on the other hand that the climate policy objective would best be achieved through relying less on bioenergy and meeting the renewable target predominantly with other technologies such as solar, hydro and wind.
II.10. Need for an additional policy at the EU level
While approximately one third of respondents considered that the current policy framework at the EU and national levels are sufficient to address the risks and opportunities of bioenergy, 59 % of the replies suggested that a new sustainability policy is needed for solid and gaseous biomass and 42 % called for an additional policy biofuels and bioliquids.
The drive for new legislation came mostly from private enterprises, civil society organisations, professional organisations, academia and individuals, while satisfaction with the legislative status quo was particularly visible among the replies by public authorities and public enterprises.
137 To be noted that use of other weighing methodologies for measuring the relative importance of policy objectives do not bring any major difference to the final ranking of the options.
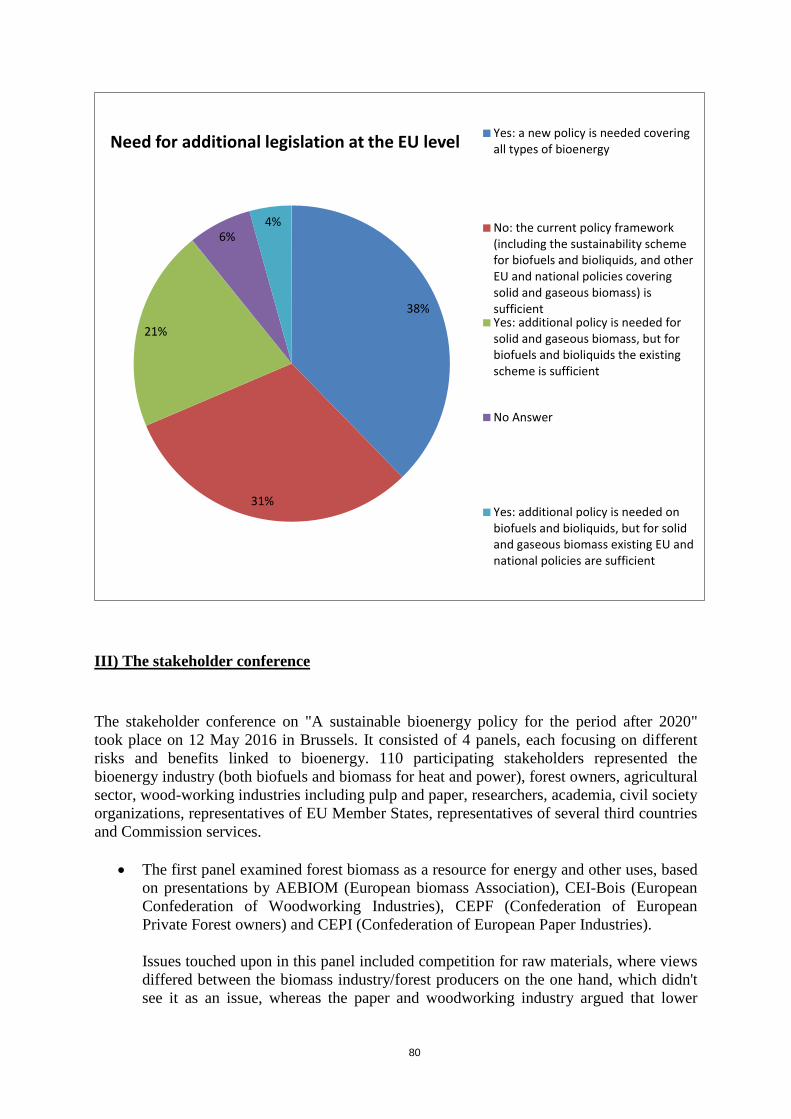
80
III) The stakeholder conference
The stakeholder conference on "A sustainable bioenergy policy for the period after 2020" took place on 12 May 2016 in Brussels. It consisted of 4 panels, each focusing on different risks and benefits linked to bioenergy. 110 participating stakeholders represented the bioenergy industry (both biofuels and biomass for heat and power), forest owners, agricultural sector, wood-working industries including pulp and paper, researchers, academia, civil society organizations, representatives of EU Member States, representatives of several third countries and Commission services.
• The first panel examined forest biomass as a resource for energy and other uses, based on presentations by AEBIOM (European biomass Association), CEI-Bois (European Confederation of Woodworking Industries), CEPF (Confederation of European Private Forest owners) and CEPI (Confederation of European Paper Industries). Issues touched upon in this panel included competition for raw materials, where views differed between the biomass industry/forest producers on the one hand, which didn't see it as an issue, whereas the paper and woodworking industry argued that lower
38%
31%
21%
6% 4%
Need for additional legislation at the EU level Yes: a new policy is needed coveringall types of bioenergy
No: the current policy framework(including the sustainability schemefor biofuels and bioliquids, and otherEU and national policies coveringsolid and gaseous biomass) issufficientYes: additional policy is needed forsolid and gaseous biomass, but forbiofuels and bioliquids the existingscheme is sufficient
No Answer
Yes: additional policy is needed onbiofuels and bioliquids, but for solidand gaseous biomass existing EU andnational policies are sufficient
81
availability of raw material could be observed in certain regions or sectors and were concerned by public subsidies for bioenergy (although these would not be an issue if focused on encouraging further mobilization of the resource, rather than shifting the use of the already harvested raw material). In the ensuing discussion, stakeholders with business interests in bioenergy highlighted the opportunities of the increased use of bioenergy for the whole supply chain (opportunities for forest owners, saw mills, etc.), whilst civil society organizations pointed out negative impacts of bioenergy on climate and biodiversity.
• The second panel examined impacts of bioenergy on climate. All speakers on the panel (representatives of the Joint Research Centre, UK Forest Research and University of Wageningen) recognised that biogenic emissions from combustion of wood were an important factor to be taken into account in policy making. At the same time, though with different nuances, all the three scientists considered that the carbon neutrality of forest bioenergy depends on a number of variables and cannot therefore be automatically assumed in all cases. In the ensuing discussion, a number of civil society organizations underlined the in their view false assumption of carbon neutrality and saw this as a reason for addressing biogenic carbon emissions in the future policy initiative. At the same time, the complexity of the assessment of biogenic carbon emissions and hence the difficulty to address it through a policy based on robust carbon accounting also emerged from the debate.
• The third panel assessed the contribution of the agricultural sector and in particular the perspectives for advanced biofuels and biogas. In the panel, Copa-Cogeca (representing agricultural producers) outlined the potential of the agricultural sector and called for encouragement for all bioenergy sources, including food-based biofuels, advanced biofuels, biogas and heat and power from forestry biomass. The European Biogas Association outlined the opportunities of biogas, as it can serve multiple uses (heat, power, transport) and can be easily transported and stored. Representative of St1 Nordic Oy (on behalf of the Leaders of Sustainable Biofuels) underlined the essential role of advanced biofuels in decarbonisation of transport and called for a blending mandate in order to create a stable market for this technology. The following discussion confirmed the controversial nature of biofuels, where in particular civil society organizations are very critical about food-based biofuels and call for caution regarding the advanced ones, whilst stakeholders representing business interests pointed out the economic benefits and synergies between biofuels production and other agricultural economic streams. An extensive debate also took place on modelling tools used to quantify the effects of indirect land-use change.
• In the final panel, the speakers were invited to examine possible streams for the future EU policy on sustainable energy in the post-2020 period. The representative of the US Forest Service emphasized the consequences of imposing unnecessary administrative burden on US forest owners, and pointed that the demand for wood products, in particular wood pellets for export to Europe, did help to promote the economic value of forests in the South-East US and to prevent conversion of these forests due to urbanization. Birdlife Europe outlined a number of negative aspects of bioenergy and suggested an overall cap on its use in the EU, coupled with restrictions on specific
82
categories of biomass (such as roundwood and stumps) as well as on final uses (through a minimum conversion efficiency). A representative of Swedish Government outlined a national consensus (including Swedish NGOs) over bioenergy and its role in decarbonising energy and transport systems. He advocated the use of a risk-based approach, which would provide the necessary sustainability guarantees for the bioenergy sector, without undue administrative burden. A Representative of Sustainable Biomass Partnership (SBP) certification scheme explained how their scheme complemented the existing standards for wood based products (FCS, PEFC). This Framework is primarily based on regional risk assessments and was particularly designed to meet regulatory requirements in several EU Member States (UK, NL, DK and BE). The brief discussion that followed was particularly dominated by a controversial exchange of views about the overall benefits of bioenergy in transformation of the economy from one based on fossil-fuels into a low-carbon one.
83
ANNEX 3. WHO IS AFFECTED BY THE INITIATIVE AND HOW
If a new legislation is adopted, it will affect economic actors such as solid biomass producers from agriculture, forest biomass producers and operators of medium and/or large bioenergy plants, depending on the 'de minimis' threshold for the size of installation, and users of wood biomass in other sectors. This will be notably linked to conducting activities necessary to pursue a certification in order to show compliance with sustainability requirements. In addition, public authorities would have to conduct administrative efforts linked to implementation of the sustainability requirements in their national legislation and the subsequent monitoring and enforcement of the compliance and the reporting to the European Commission.
84
ANNEX 4. ANALYTICAL MODELS USED IN PREPARING THE IMPACT ASSESSMENT
PRIMES
The PRIMES model is an EU energy system model which simulates energy consumption and the energy supply system. It is a partial equilibrium modelling system that simulates an energy market equilibrium in the European Union and each of its Member States. This includes consistent EU carbon price trajectories.
Decision making behaviour is forward looking and grounded in micro economictheory. The model also represents in explicit and detailed way energy demand, supply and emission abatement technologies, and includes technology vintages.
The core model is complemented by a set of sub-modules, of which the biomass supply module is described below.
PRIMES has been used for the analysis underpinning the Commission’s proposal on the EU 2020 targets (including energy efficiency), the Low Carbon Economy and Energy 2050 Roadmaps as well as the 2030 policy framework for climate and energy.
PRIMES is a private model and has been developed and is maintained by E3M Lab/ICCS of National Technical University of Athens138 in the context of a series of research programmes co-financed by the European Commission.
The model has been successfully peer reviewed,139 most recently in 2011140
PRIMES Biomass Supply
The PRIMES biomass model is a modelling tool aimed at contributing to the energy system projections for the EU Member States and the impact assessment of policies promoting renewable energy sources and addressing climate change mitigation. The detailed numerical model simulates the economics of supply of biomass and waste for energy purposes through a network of processes, current and future, which are represented at a certain level of engineering detail for which a very detailed database of biomass and waste processing technologies and primary resources has been developed.
The model transforms biomass feedstock — primary energy — into bioenergy commodities — secondary or final form — which undergo further transformation in the energy system, e.g. as input into power plants, heating boilers or as fuels for transportation.
The model calculates the inputs in terms of primary feedstock of biomass and waste to satisfy a given demand for bioenergy commodities. The model further estimates the land use and the imports necessary and provides quantification of the amount of production capacity required. Furthermore, all the costs resulting from the production of bioenergy commodities and the resulting prices of the commodities are quantified.
138 http://www.e3mlab.National Technical University of Athens.gr/e3mlab/ . 139 http://ec.europa.eu/clima/policies/strategies/analysis/models/docs/primes_model_2013-2014_en.pdf. 140 https://ec.europa.eu/energy/sites/ener/files/documents/sec_2011_1569_2.pdf .
85
The model covers all EU28 Member States individually and covers the entire time period from 2000 to 2050 in five year periods. It is calibrated to Eurostat statistics wherever possible, data from Eurostat is complemented by other statistical sources to fill in the database necessary for the model to function.
The model can operate as a standalone model provided that the demand for bioenergy commodities is given exogenously, but is more often used together with the PRIMES Energy System Model as a closed loop system.
EUCO scenarios Two central policy scenarios reflecting the 2030 targets and main elements of the 2030 climate and energy framework agreed by the European Council in 2014141 have been developed, EUCO 27 and EUCO 30. This recognises that for the energy efficiency target a review will still be undertaken to set the level of ambition. These scenarios also aim to provide consistency across a number of impact assessments underpinning 2016 Energy Union policy proposals. Using two central scenarios increases the robustness of policy conclusions.
Both scenarios start from the EU reference scenario 2016 and add the targets and policies described in detail below. In addition, coordination policies are assumed which enable long-term decarbonisation of the economy. Coordination policies replace the ‘enabling conditions’ which have been modelled in 2030 framework IA and the 2014 IA on 2030 EE targets.
Coordination policies relate to ongoing infrastructure developments that will enable a larger exploitation of cost-effective options after 2020, such as grid developments, and relate to R&D and public acceptance that are expected to be needed to meet long-term decarbonisation objectives.
The table below summarises the assumptions on climate, renewable energy and specific energy efficiency policies in the EUCO 27 scenario that have been modelled.
EUCO 27 This scenarios is designed to meet all 2030 targets set by the European Council:
• at least 40 % GHG reduction (wrt 1990); • 43 % GHG emissions reduction in ETS sectors (wrt 2005); • 30 % GHG emissions reduction in Effort Sharing Decision sectors
(wrt 2005); • At least 27 % share of RES in final energy consumption • 27 % primary energy consumption reduction (i.e. achieving
1 369 Mtoe in 2030) compared to PRIMES 2007 baseline (1 887 Mtoe in 2030). This equals a reduction of primary energy consumption of 20 % compared to historic 2005 primary energy consumption (1 713 Mtoe in 2005).
Main policies and incentives additional to Reference: Revised EU ETS
• increase of ETS linear factor to 2.2 % for 2021-2030; 141 http://www.consilium.europa.eu/uedocs/cms_data/docs/pressdata/en/ec/145397.pdf. .
86
• after 2030 cap trajectory to achieve -90 % emission reduction in 2050 in line with Low Carbon Economy Roadmap.
Renewables policies • renewables policies necessary to achieve 27 % target, reflected by
RES values applied in electricity, heating and cooling and transport sectors.
Energy efficiency policies: Residential and services sector
• increasing energy efficiency of buildings via increasing the rate of renovation and depth of renovation. In this model, better implementation of EPBD and EED, continuation of Art 7 of EED and dedicated national policies are depicted by the application of energy efficiency values.
• financial instruments and other financing measures on the European level facilitating access to capital for investment in thermal renovation of buildings. This, together with further labelling policies for heating equipment, is depicted by a reduction of behavioural discount rates for households from 12 % to 11.5 %.
• more stringent (than in Reference) eco-design standards banning the least efficient technologies.
Industry
• more stringent (than in Reference) eco-design standards for motors. Transport
• CO2 standard for cars: 85 g/km in 2025; 75 g/km in 2030 and 25 gCO2 /km in 2050;142
• CO2 standards for vans: 135 g/km in 2025; 120 g/km in 2030; 60 g/km in 2050;143
• 1.5 % average annual energy efficiency improvements for new conventional and hybrid heavy duty vehicles between 2010-2030 and -0.7 % between 2030-2050;
• measures on management of transport demand: - recently adopted/proposed measures for road freight, railways
and inland navigation;144 gradual internalisation of transport local externalities145 as of 2025 and full internalisation by 2050 on the inter-urban network. Non-CO2 policies
• in 2030 carbon values of €0.05 applied to non-CO2 GHG emissions in order to trigger cost-effective emissions reductions in these sectors
142 On NEDC test-cycle. 143 On NEDC test-cycle. 144 Directive on Weights & Dimensions, Fourth railway package, NAIADES II package, Ports Package. 145 Costs of infrastructure wear & tear, congestion, air pollution and noise.
87
including in agriculture; • after 2030 carbon values set at EU ETS carbon price level.
In the EUCO 27 scenario, energy efficiency delivers a large part of GHG emissions reduction in the ESD/ESR sectors. This reduction is complemented by cost-effective reductions in non-CO2 emissions — mostly in agriculture.
GLOBIOM-G4M
The GLOBIOM-G4M is a private model and has been developed and is maintained by the International Institute of Applied Systems Analysis.146
In the analysis performed in support to this impact assessment, an economic land use model GLOBIOM147 is utilized together with a detailed forestry sector model G4M148. GLOBIOM is an economic model that jointly covers the forest, agricultural, livestock, and bioenergy sectors, allowing it to consider a range of direct and indirect causes of biomass use. The wood demand estimated by GLOBIOM is used as input in G4M, a detailed agent-based forestry model that models the impact of wood demand in terms of forestry activities (afforestation, deforestation, and forest management) and the resulting biomass and carbon stocks. In essence, G4M is a geographically explicit model which in combination with GLOBIOM helps to evaluate changes in national silvicultural forest practices related to changing demand and price information. GLOBIOM-G4M is also used in the impact assessment for agriculture and LULUCF to assess the options (afforestation, deforestation, forest management, cropland and grassland management) and costs of enhancing the LULUCF sink for each Member State.
GLOBIOM is a global model of the forest and agricultural sectors, where the supply side of the model is built-up from the bottom (land cover, land use, management systems) to the top (production/markets). The GLOBIOM model has a long history of publication149 and has previously been used in several European assessments150. The model computes market equilibrium for agricultural and forest products by allocating land use among production activities to maximise the sum of producer and consumer surplus, subject to resource, technological and policy constraints. The level of production in a given area is determined by the agricultural or forestry productivity in that area (dependent on suitability and management), by market prices (reflecting the level of supply and demand), and by the conditions and cost associated to conversion of the land, to expansion of the production and, when relevant, to international market access. Trade flows are computed endogenously in GLOBIOM, following a spatial equilibrium approach so that bilateral trade flows between individual regions can be traced for the whole range of the traded commodities.
146 http://www.iiasa.ac.at/ . 147. See also: www.iiasa.ac.at./GLOBIOM 148. See also: www.iiasa.ac.at/G4M 149. See Havlík, P., Valin, H., Herrero, M., Obersteiner, M., Schmid, E., Rufino, M.C., Mosnier, A., Thornton, P.K., Böttcher, H., Conant, R.T., Frank, S., Fritz, S., Fuss, S., Kraxner, F., Notenbaert, A., 2014. Climate change mitigation through livestock system transitions. Proc. Natl. Acad. Sci. 111, 3709–3714. 150. See EC, (2013). EU Energy, Transport and GHG Emissions Trends to 2050: Reference Scenario 2013. European Commission Directorate-General for Energy, DG Climate Action and DG Mobility and Transport., Brussels, p. 168. and EC, (2014). A policy framework for climate and energy in the period from 2020 to 2030. Communication from the Commission to the European Parliament, the Council, the European Economic and Social Committee and the Committee of the Regions. European Commission, Brussels, p. 18.
88
The following modelling features are reflected in the GLOBIOM integrated framework used for this assessment:
• All bioenergy demand projections are exogenously defined. They stem from PRIMES and POLES modelling results developed for previous Commission work. GLOBIOM uses these bioenergy demand projections as exogenous inputs, they always have to be fulfilled, even if it reduces the availability of biomass resources for other purposes.
• There is no feedback from price signals of feedstocks upon total bioenergy demand i.e. increases in bioenergy use may well push up prices for feedstocks, however, this will not feedback to reduce demand for bioenergy (over other energy technologies). The demand of food and feed commodities is on the other hand price elastic and therefore changes depending on consumers’ willingness to pay. The same applies to material production, which is also price elastic and hence varies depending on the changes in the total demand.
• During the modelling, change in GHG emissions and removals due to increased or reduced biomass demand linked to land use and land use change (LULUCF) is not accounted for in the efforts needed for reaching an overall EU GHG emission reduction target for each scenario. Therefore, there is no feedback loop from increasing or decreasing forest carbon stocks in relation to the forest management levels to bioenergy demand. GHG consequences are, however, analysed as outputs of the study.
• The starting year of the modelling is that of the year 2000, and the potential impact of bioenergy demand is being assessed for years 2010–2050. Bioenergy demand and model outcome are presented on a ten-year basis.
• Material and energy substitution effects are not assessed in this work. The emissions and removals from the LULUCF sector that are reported covers the Harvest Wood Products (HWP) carbon pool development, but does not cover change in emissions and removal related to a decrease or increase in the production and consumption of materials substituted by woody products.
• The availability of recovered wood for the production of wood based panels and/or energy production is fixed over time and a change in availability of recovered wood from an increase or decrease in consumption of woody products are not accounted for in the framework. Therefore, there is no feedback loop from a change in the consumption of HWP commodities and the future availability of recovered wood for material and/or energy purposes.
• In terms of Common Agriculture Policies (CAP) within the EU, the following is assumed for this study. It is assumes that direct payments under the CAP stay constant throughout the modelling timeframe. The Ecological Focus Areas (EFA) policy is assumed to have no further impacts on EU agricultural production and the level of set-aside land is here considered to remain constant.
• As compared to EU LULUCF and Agriculture GHG projections, it should be noted that a number of project specific updates of the GLOBIOM and G4M models has been done for this project and not the same input data is being used as for the earlier projection published with the European Commission Trends to 2050 Report that describes the EU Reference scenario projection 2013.
For the forestry sector, emissions and removals as well as biomass supply are projected by the Global Forestry Model (G4M), a geographically explicit model that assesses afforestation-deforestation-forest management decisions. Forest area change and associated emissions and removals from afforestation, deforestation and forest management are reported based on
89
estimated by the G4M model. By comparing the income of managed forest (difference of wood price and harvesting costs plus income by storing carbon in forests) with income by alternative land use on the same place, a decision of afforestation or deforestation is made. The G4M model receives information from GLOBIOM on the development of land use, wood demand, wood prices and land prices, and is initially is calibrated to historic data reported by Member States on afforestation and deforestation rates and therefore includes policies on these activities.
By comparing the income of managed forest (difference of wood price and harvesting costs) with income by alternative land use on the same place, a decision of afforestation or deforestation is made by G4M. Land and wood prices that G4M receives from GLOBIOM are used for the decision concernign land use change through contrasting the Net Present Value (NPV) generated by land use activities toward forestry with the NPV generated by alternative land use activities. The increased value of forests driven by an increase in wood prices thereby reduces deforestation activities and increases afforestation activitites. An increase in NPV of agriculture activites acts in the opposite direction and induces land use change through increased deforestation activities and reduced afforestation activitites.
The following modelling features are reflected in the G4M are used for this assessment:
• The afforestation and deforestation rates in G4M have been calibrated to forest area changes for the period of 2000 to 2010 based on data provided by FAO FRA 2010. Historical harvest removals from 1960 onwards taken from FAOSTAT data have been considered in the calculation of the harvested wood sink and the forest area was set to match the reported forest area in 2000 according to FAO FRA 2010.
GREEN-X The Green-X model is a specialized energy system model, geographically bounded to the European Union and its neighbours, that has been used in several impact assessments and research studies related to RES. The core strengths of this tool are its detailed representation of renewable resources and technologies, and its comprehensive incorporation of energy policy instruments, including also sustainability criteria for bioenergy. This allows various policy design options to be assessed with respect to resulting costs, expenditures and benefits, as well as environmental impacts.
Identified potentials for bioenergy supply (incl. domestic and imported supply) combined with trends concerning biomass demand for material use as discussed above serve as basis for the modelling works as well as information on related costs. For the incorporation of biomass trade in the Green-X database and the subsequent model-based analysis, a well-established linkage between the Green-X model / database and Utrecht University’s geospatial network model is used. The extended database includes for example feedstock specific costs and GHG emissions for cultivation, pre-treatment (for instance, chipping, pelletisation) and country-to-country specific transport chains.
Brief characterisation of the Green-X model The model Green-X has been developed by the Energy Economics Group (EEG) at TU Wien under the EU research project “Green-X–Deriving optimal promotion strategies for increasing the share of RES-E in a dynamic European electricity market" (Contract No. ENG2-CT-2002-
90
00607). Initially focussed on the electricity sector, this modelling tool, and its database on renewable energy (RES) potentials and costs, has been extended to incorporate renewable energy technologies within all energy sectors. The model is privately owned (by TU Wien) but a public demo version is available to allow for a simplified use and to a better understanding of the functionality.
Green-X covers geographically the EU-28, the Contracting Parties of the Energy Community (West Balkans, Ukraine, Moldova) and selected other EU neighbours (Turkey, North African countries). It allows for detailed assessments of demand and supply of RES as well as of accompanying cost (including capital expenditures, additional generation cost of RES compared to conventional options, consumer expenditures due to applied supporting policies) and benefits (for instance, avoidance of fossil fuels and corresponding carbon emission savings). Results are calculated at both a country- and technology-level on a yearly basis. The time-horizon allows for in-depth assessments up to 2050. The Green-X model develops nationally specific dynamic cost-resource curves for all key RES technologies within all energy sectors. Besides the formal description of RES potentials and costs, Green-X provides a detailed representation of dynamic aspects such as technological learning and technology diffusion.
Through its in-depth energy policy representation, the Green-X model allows an assessment of the impact of applying (combinations of) different energy policy instruments (for instance, quota obligations based on tradable green certificates / guarantees of origin, (premium) feed-in tariffs, tax incentives, investment incentives, impact of emission trading on reference energy prices) at both country or European level in a dynamic framework. Sensitivity investigations on key input parameters such as non-economic barriers (influencing the technology diffusion), conventional energy prices, energy demand developments or technological progress (technological learning) typically complement a policy assessment.
Within the Green-X model, the allocation of biomass feedstock to feasible technologies and sectors is fully internalised into the overall calculation procedure. For each feedstock category, technology options (and their corresponding demands) are ranked based on the feasible revenue streams as available to a possible investor under the conditioned, scenario-specific energy policy framework that may change on a yearly basis. Recently, a module for intra-European trade of biomass feedstock has been added to Green-X that operates on the same principle as outlined above but at a European rather than at a purely national level. Moreover, Green-X was extended throughout 2011 to allow an endogenous modelling of sustainability regulations for the energetic use of biomass. This comprises specifically the application of GHG constraints that exclude technology/feedstock combinations not complying with conditioned thresholds.
The Green-X database on potentials and cost for renewable energy sources The input database of the Green-X model offers a detailed depiction of the achieved and feasible future demand and supply of the individual RES technologies, initially constraint to the European Union (EU28) but within the course of recent projects extended to the EU’s neighbouring countries / regions (i.e. Western Balkans, North Africa and Turkey). This comprises in particular information on costs and penetration in terms of installed capacities or actual & potential generation. Realisable future potentials (up to 2050) are included by technology and by country. In addition, data describing the technological progress such as learning rates are available. Both serve as crucial input for the modelling of future RES deployment. Note that several expert reviews and validation processes of this comprehensive
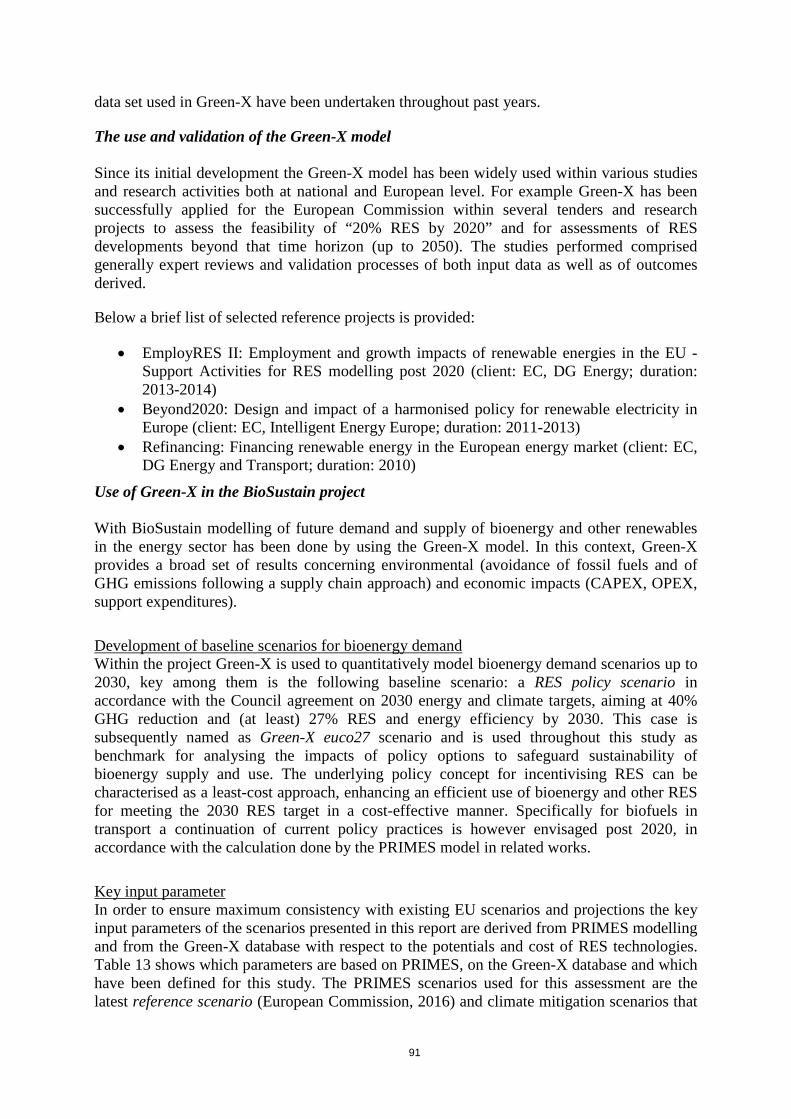
91
data set used in Green-X have been undertaken throughout past years.
The use and validation of the Green-X model Since its initial development the Green-X model has been widely used within various studies and research activities both at national and European level. For example Green-X has been successfully applied for the European Commission within several tenders and research projects to assess the feasibility of “20% RES by 2020” and for assessments of RES developments beyond that time horizon (up to 2050). The studies performed comprised generally expert reviews and validation processes of both input data as well as of outcomes derived.
Below a brief list of selected reference projects is provided:
• EmployRES II: Employment and growth impacts of renewable energies in the EU - Support Activities for RES modelling post 2020 (client: EC, DG Energy; duration: 2013-2014)
• Beyond2020: Design and impact of a harmonised policy for renewable electricity in Europe (client: EC, Intelligent Energy Europe; duration: 2011-2013)
• Refinancing: Financing renewable energy in the European energy market (client: EC, DG Energy and Transport; duration: 2010)
Use of Green-X in the BioSustain project With BioSustain modelling of future demand and supply of bioenergy and other renewables in the energy sector has been done by using the Green-X model. In this context, Green-X provides a broad set of results concerning environmental (avoidance of fossil fuels and of GHG emissions following a supply chain approach) and economic impacts (CAPEX, OPEX, support expenditures).
Development of baseline scenarios for bioenergy demand Within the project Green-X is used to quantitatively model bioenergy demand scenarios up to 2030, key among them is the following baseline scenario: a RES policy scenario in accordance with the Council agreement on 2030 energy and climate targets, aiming at 40% GHG reduction and (at least) 27% RES and energy efficiency by 2030. This case is subsequently named as Green-X euco27 scenario and is used throughout this study as benchmark for analysing the impacts of policy options to safeguard sustainability of bioenergy supply and use. The underlying policy concept for incentivising RES can be characterised as a least-cost approach, enhancing an efficient use of bioenergy and other RES for meeting the 2030 RES target in a cost-effective manner. Specifically for biofuels in transport a continuation of current policy practices is however envisaged post 2020, in accordance with the calculation done by the PRIMES model in related works.
Key input parameter In order to ensure maximum consistency with existing EU scenarios and projections the key input parameters of the scenarios presented in this report are derived from PRIMES modelling and from the Green-X database with respect to the potentials and cost of RES technologies. Table 13 shows which parameters are based on PRIMES, on the Green-X database and which have been defined for this study. The PRIMES scenarios used for this assessment are the latest reference scenario (European Commission, 2016) and climate mitigation scenarios that
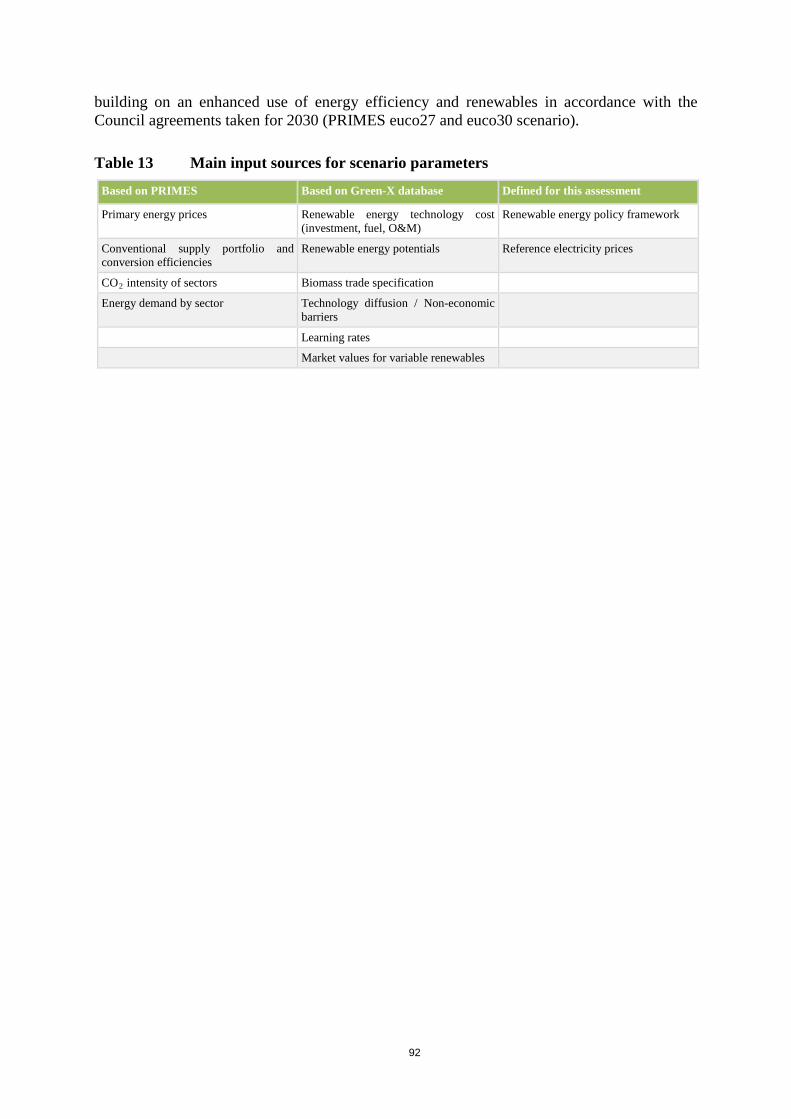
92
building on an enhanced use of energy efficiency and renewables in accordance with the Council agreements taken for 2030 (PRIMES euco27 and euco30 scenario).
Table 13 Main input sources for scenario parameters
Based on PRIMES Based on Green-X database Defined for this assessment
Primary energy prices Renewable energy technology cost (investment, fuel, O&M)
Renewable energy policy framework
Conventional supply portfolio and conversion efficiencies
Renewable energy potentials Reference electricity prices
CO2 intensity of sectors Biomass trade specification
Energy demand by sector Technology diffusion / Non-economic barriers
Learning rates
Market values for variable renewables
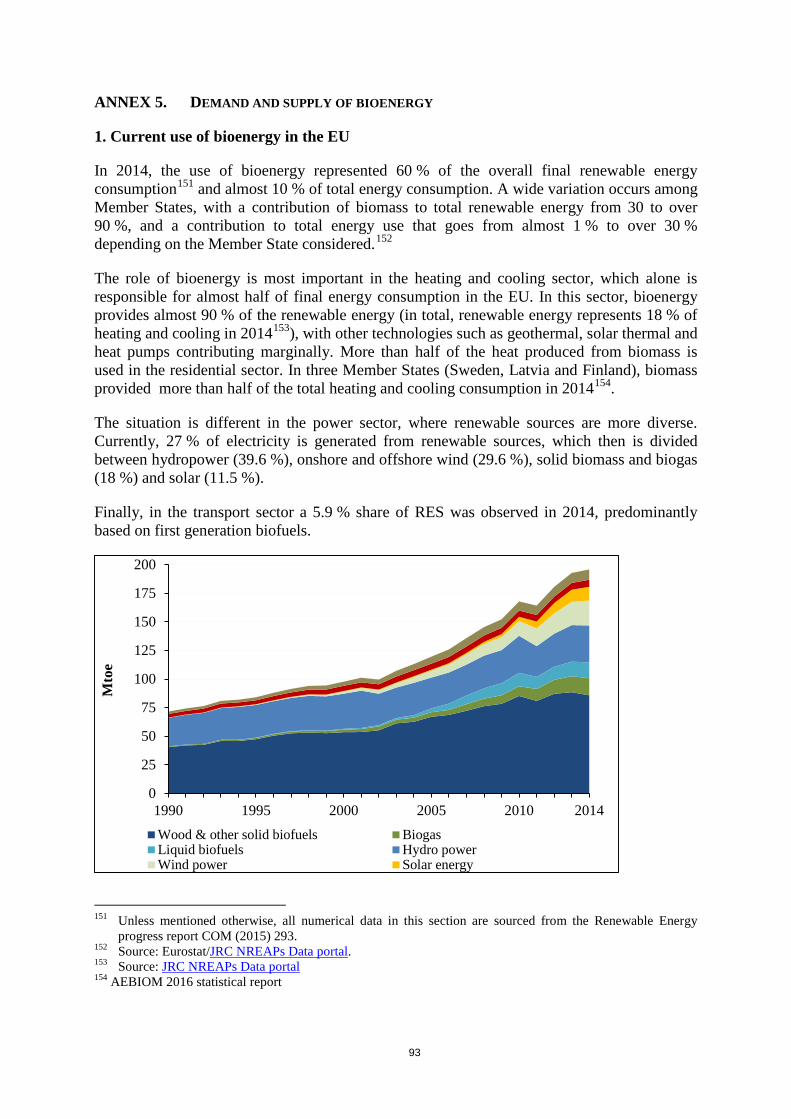
93
ANNEX 5. DEMAND AND SUPPLY OF BIOENERGY
1. Current use of bioenergy in the EU
In 2014, the use of bioenergy represented 60 % of the overall final renewable energy consumption151 and almost 10 % of total energy consumption. A wide variation occurs among Member States, with a contribution of biomass to total renewable energy from 30 to over 90 %, and a contribution to total energy use that goes from almost 1 % to over 30 % depending on the Member State considered.152
The role of bioenergy is most important in the heating and cooling sector, which alone is responsible for almost half of final energy consumption in the EU. In this sector, bioenergy provides almost 90 % of the renewable energy (in total, renewable energy represents 18 % of heating and cooling in 2014153), with other technologies such as geothermal, solar thermal and heat pumps contributing marginally. More than half of the heat produced from biomass is used in the residential sector. In three Member States (Sweden, Latvia and Finland), biomass provided more than half of the total heating and cooling consumption in 2014154.
The situation is different in the power sector, where renewable sources are more diverse. Currently, 27 % of electricity is generated from renewable sources, which then is divided between hydropower (39.6 %), onshore and offshore wind (29.6 %), solid biomass and biogas (18 %) and solar (11.5 %).
Finally, in the transport sector a 5.9 % share of RES was observed in 2014, predominantly based on first generation biofuels.
151 Unless mentioned otherwise, all numerical data in this section are sourced from the Renewable Energy
progress report COM (2015) 293. 152 Source: Eurostat/JRC NREAPs Data portal. 153 Source: JRC NREAPs Data portal 154 AEBIOM 2016 statistical report
0
25
50
75
100
125
150
175
200
1990 1995 2000 2005 2010 2014
Mto
e
Wood & other solid biofuels BiogasLiquid biofuels Hydro powerWind power Solar energy
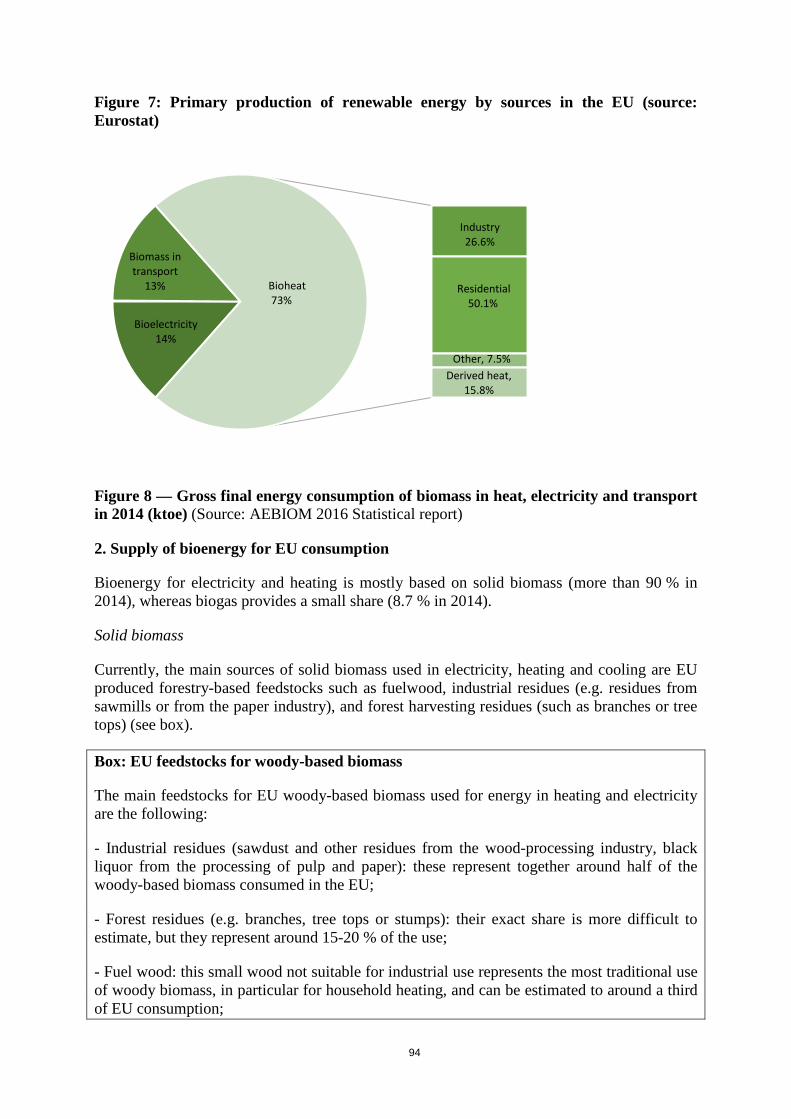
94
Figure 7: Primary production of renewable energy by sources in the EU (source: Eurostat)
Figure 8 — Gross final energy consumption of biomass in heat, electricity and transport in 2014 (ktoe) (Source: AEBIOM 2016 Statistical report)
2. Supply of bioenergy for EU consumption
Bioenergy for electricity and heating is mostly based on solid biomass (more than 90 % in 2014), whereas biogas provides a small share (8.7 % in 2014).
Solid biomass
Currently, the main sources of solid biomass used in electricity, heating and cooling are EU produced forestry-based feedstocks such as fuelwood, industrial residues (e.g. residues from sawmills or from the paper industry), and forest harvesting residues (such as branches or tree tops) (see box).
Box: EU feedstocks for woody-based biomass
The main feedstocks for EU woody-based biomass used for energy in heating and electricity are the following:
- Industrial residues (sawdust and other residues from the wood-processing industry, black liquor from the processing of pulp and paper): these represent together around half of the woody-based biomass consumed in the EU;
- Forest residues (e.g. branches, tree tops or stumps): their exact share is more difficult to estimate, but they represent around 15-20 % of the use;
- Fuel wood: this small wood not suitable for industrial use represents the most traditional use of woody biomass, in particular for household heating, and can be estimated to around a third of EU consumption;
Bioelectricity 14%
Biomass in transport
13%
Industry 26.6%
Residential 50.1%
Other, 7.5% Derived heat,
15.8%
Bioheat 73%
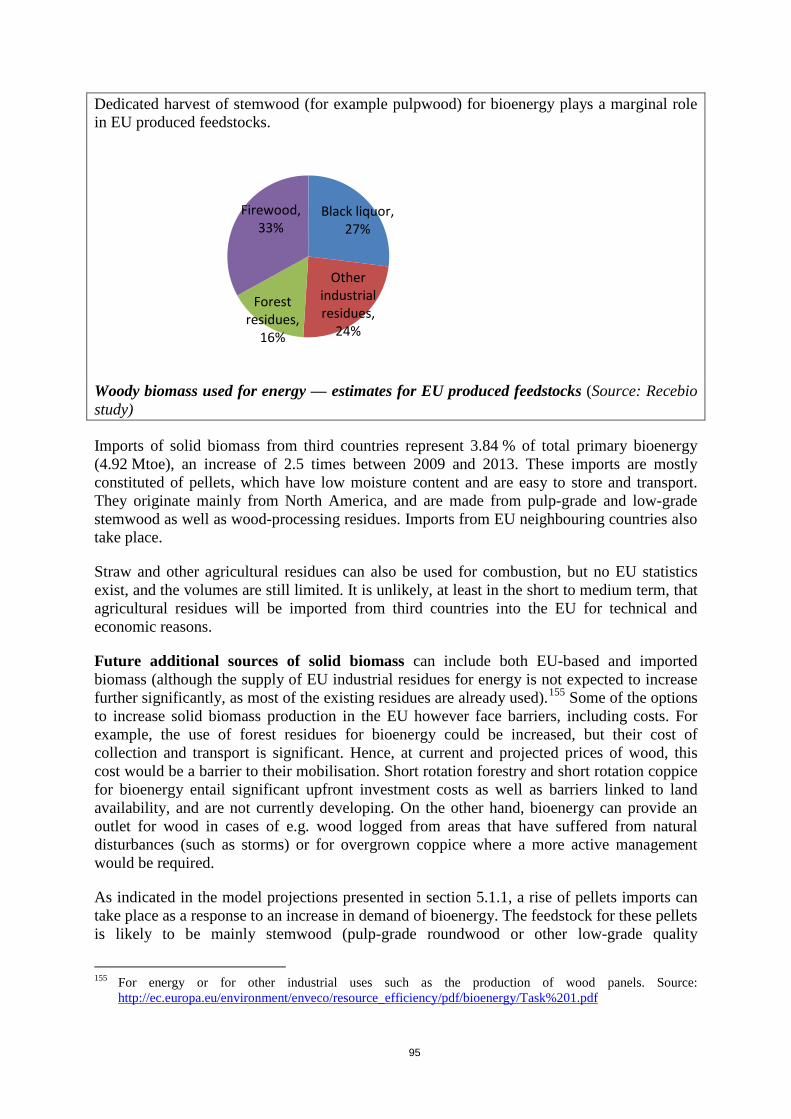
95
Dedicated harvest of stemwood (for example pulpwood) for bioenergy plays a marginal role in EU produced feedstocks.
Woody biomass used for energy — estimates for EU produced feedstocks (Source: Recebio study)
Imports of solid biomass from third countries represent 3.84 % of total primary bioenergy (4.92 Mtoe), an increase of 2.5 times between 2009 and 2013. These imports are mostly constituted of pellets, which have low moisture content and are easy to store and transport. They originate mainly from North America, and are made from pulp-grade and low-grade stemwood as well as wood-processing residues. Imports from EU neighbouring countries also take place.
Straw and other agricultural residues can also be used for combustion, but no EU statistics exist, and the volumes are still limited. It is unlikely, at least in the short to medium term, that agricultural residues will be imported from third countries into the EU for technical and economic reasons.
Future additional sources of solid biomass can include both EU-based and imported biomass (although the supply of EU industrial residues for energy is not expected to increase further significantly, as most of the existing residues are already used).155 Some of the options to increase solid biomass production in the EU however face barriers, including costs. For example, the use of forest residues for bioenergy could be increased, but their cost of collection and transport is significant. Hence, at current and projected prices of wood, this cost would be a barrier to their mobilisation. Short rotation forestry and short rotation coppice for bioenergy entail significant upfront investment costs as well as barriers linked to land availability, and are not currently developing. On the other hand, bioenergy can provide an outlet for wood in cases of e.g. wood logged from areas that have suffered from natural disturbances (such as storms) or for overgrown coppice where a more active management would be required.
As indicated in the model projections presented in section 5.1.1, a rise of pellets imports can take place as a response to an increase in demand of bioenergy. The feedstock for these pellets is likely to be mainly stemwood (pulp-grade roundwood or other low-grade quality
155 For energy or for other industrial uses such as the production of wood panels. Source:
http://ec.europa.eu/environment/enveco/resource_efficiency/pdf/bioenergy/Task%201.pdf
Black liquor, 27%
Other industrial residues,
24%
Forest residues,
16%
Firewood, 33%
96
stemwood156), and industrial residues. Currently, pellet imports are mostly used for large electricity plants, but are starting to be used also in smaller installations such as district heating. In the event of a significant increase in bioenergy demand, and in the absence of additional mobilisation of domestic biomass, imports of pellets might play an increasing role in the EU.
Therefore, there are a number of uncertainties as to which forest feedstocks would develop in response to an increase in demand. Factors such as the magnitude of EU demand as well as of the demand from third countries, the design of support schemes in the energy and forest sectors in particular, the availability of recycled wood, the development of woody biomass produced on agricultural land (short rotation coppice), will play a role in shaping the market response.
The level of public subsidies for production of bioelectricity differs significantly among EU Member States. Whilst in some countries it has been close to zero (such as in Finland, Sweden and Denmark), it has been rather high in Austria, Belgium, Netherlands, Germany, Italy, Estonia, Poland, Portugal and Romania (in the range of 60-90 EUR per MWh, which was above the EU average of 60 EUR per MWh). The low levels of required subsidy in the mentioned countries can be explained by high efficiency in their bioelectricity production (virtually all of the bioelectricity being produced in CHP installations), as well as good availability of the raw material.
This should be seen in the contrast with public subsidies for other technologies, which were significantly lower for coal (13 EUR per MWh) and gas (15 EUR per MWh), where the costs are, just like for bioelectricity, mainly driven by high operational expenses on fuel.
When compared to other renewable technologies, whose costs are mostly driven by capital investments, the lowest level of public subsidy has been reported for hydroelectricity (10 EUR per MWh). Whilst the support for on shore wind has been slightly lower than the one for bioelectricity (50 EUR per MWh), it has been significantly higher for offshore wind (120 EUR per MWh) and solar electricity (220 EUR per MWh).
All the above data refer to the levels of public support in 2012, as per the report by the European Commission on Subsidies and Costs of EU Energy published in 2014.157 This report is subject to an update in the course of 2016.
Biogas
While biogas has been produced mainly from annual energy crops (e.g. maize), there is a large potential in producing biogas from agricultural waste, residues, by-products (e.g. manure), sewage sludge, separated household waste, as well as industrial household waste.
Biofuels
156 COWI 2016, Environmental implications of increased reliance of the EU on biomass from the South East US
- http://bookshop.europa.eu/en/environmental-implications-of-increased-reliance-of-the-eu-on-biomass-from-the-south-east-us-pbKH0116687/?CatalogCategoryID=DSoKABstDacAAAEjA5EY4e5L
157 https://ec.europa.eu/energy/sites/ener/files/documents/DESNL14583%20Final%20report%20annexes%201-3%2011%20Nov.pdf
97
Currently, biofuels are mostly produced from agricultural crops. In 2015, an amount equivalent to 61 % of domestic oilseed production, and 3.7 % of domestic cereal production were used for the production of biofuels; in the case of sugar beet an amount equivalent to 13% of domestic sugar beet production went to the production of ethanol, of which virtually all was used for biofuels158
The existing sustainability framework on biofuels provides some incentives and constraints for the production and use of biofuels up to 2020. In particular, biofuels made from food crops are limited to 7 % in terms of their contribution to the 2020 target of renewable energy in transport (although the 7 % cap does not apply to the target on the greenhouse gas intensity of fuels set in the Fuel Quality Directive159 and to state aid or other forms of support). In addition, biofuels made from waste and advanced biofuels count twice towards the 10 % target. This has mostly encouraged the use of certain waste sources such as used cooking oil for biofuels.
For the future production of biofuels, the state of development of technologies to produce biofuels from lignocellulosic sources160 will be an important factor. For the moment, lignocellulosic ethanol is at advanced stage of demonstration phase with several industrial scale plants operating in Europe and the US, while second generation biodiesel is developing very slowly. Therefore, and in particular given the high need for diesel substitutes, there are uncertainties regarding the level of contribution of second generation biofuels up to 2030. It is also important to note that second generation biofuels will use not only feedstocks from agricultural sources (such as agricultural residues) but also from forestry (i.e. wood, forest residues). The development of biofuels from waste and residues could play an important role in the future biofuels supply, in particular for diesel substitutes using waste oils.
Third generation biofuels (algae, micro-organisms) are still at a very early stage of research and development and their production cost is still very high.
The production of biofuels feedstocks (e.g. food crops) on marginal land faces the same difficulties as short rotation coppice in terms of fragmentation of the land and lower yields. It is currently not taking place and is unlikely to develop unless a dedicated supportive framework is put in place.
158 MTO 2915, DG AGRI 159 Directive 98/70/EC 160 Often referred to as ‘second-generation’ biofuels.
98
ANNEX 6. GREENHOUSE GAS EMISSIONS FROM THE SUPPLY CHAIN
To estimate the performance of different biomass pathways in terms of their supply chain emissions, the Joint Research Centre (JRC) carried out an attributional Life Cycle Assessment (LCA) analysis of the most common biomass feedstock, following the EU harmonised methodology contained in the 2010 Biomass Report and in SWD(2014)259 final.161 This methodology doesn’t take into account biogenic carbon, therefore the CO2 emissions due to biomass combustion are considered as zero in the calculation.
The figures below show the comparison of these supply chain emissions to a representative set of lifecycle emissions of fossil fuels for the most commonly used pathways. This methodology considers the greenhouse gas emissions from the cultivation of raw materials, harvesting, processing and transport of the biomass feedstocks. Emissions from carbon stock changes caused by direct land use change (if they occurred) should also be taken into account.
The supply chain greenhouse gas emissions are calculated on the basis of final energy (i.e. MJ of electricity or of heat); a standard efficiency of conversion has been applied (25 % electrical efficiency and 85 % thermal efficiency). In order to obtain the comparison of greenhouse gas performance, supply chain emissions from bioenergy pathways are assessed against the emissions of a reference value (Fossil Fuel Comparator), which represent a marginal mix of present and perspective EU fossil power production technologies and feedstocks. The FFCs considered for power and heat production are respectively 186 gCO2 /MJ and 80 gCO2 /MJ. The logic behind the conceptual and numerical choice for the Fossil Fuel Comparator is explained in the related Commission documents (COM(2010) 11 and SWD(2014) 259). It is worth remembering, though, that these values are simply reference numbers used to benchmark the various bioenergy pathways against each other and exclude, through a GHG savings threshold criterion, the worst performing pathways in terms of resource efficiency and GHG emissions. The GHG savings calculated with this methodology do not reflect actual climate change mitigation obtained by the use of bioenergy. For a full description of the possible misinterpretations of these results see Plevin et al., 2014162 and the other Annexes in the Impact Assessment.
Figure 9 shows supply chain greenhouse gas emission compared to the lifecycle emissions of the fossil fuels replaced for the most representative forest-based solid biomass pathways. It can be concluded from the figure that most of the forest biomass pathways deliver high levels of supply-chain greenhouse gas emissions savings compared to the Fossil Fuel Comparator, with the exception of some pathways using feedstock imported from distances above 10 000 km and using natural gas to dry the wood in pellet mills.
Figure 10 illustrates greenhouse gas savings for the most representative biogas and biomethane pathways, from manure and an energy crop (silage maize). The figure shows that
161 All the results are available in the 2015 report ‘Solid and gaseous bioenergy pathways: input values and GHG emissions’ - https://ec.europa.eu/energy/sites/ener/files/documents/Solid%20and%20gaseous%20bioenergy%20pathways.pdf 162 Plevin, RJ., et al., Using Attributional Life Cycle Assessment to Estimate Climate-Change Mitigation Benefits Misleads Policy Makers. J Ind Ecol, 2014. 18(1): p. 73-83
99
the use of a gas-tight tank for the storage of the residual digestate is needed to obtain higher greenhouse gas savings for all pathways. Manure-based pathways have always better greenhouse gas performances than energy crops-based pathways. This is mainly due to the emissions credits for the avoided GHG emissions linked to the management of raw manure as organic fertilizer; this can lead to GHG savings higher than 100%. Therefore manure digestion or its co-digestion in high shares with energy crops, is the most efficient way to reduce greenhouse gas emissions.
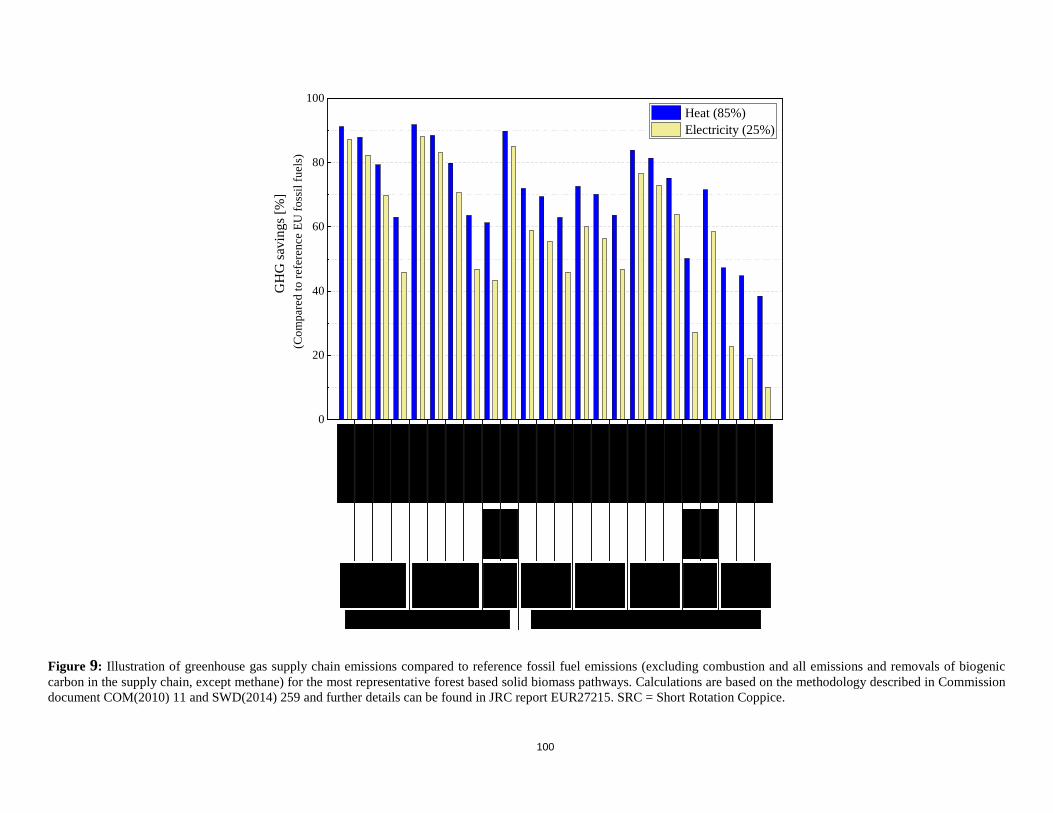
100
Figure 9: Illustration of greenhouse gas supply chain emissions compared to reference fossil fuel emissions (excluding combustion and all emissions and removals of biogenic carbon in the supply chain, except methane) for the most representative forest based solid biomass pathways. Calculations are based on the methodology described in Commission document COM(2010) 11 and SWD(2014) 259 and further details can be found in JRC report EUR27215. SRC = Short Rotation Coppice.
0
20
40
60
80
100 Heat (85%) Electricity (25%)
GH
G sa
ving
s [%
](C
ompa
red
to re
fere
nce
EU fo
ssil
fuel
s)
101
a) The calculations are based on greenhouse gas data from eucalyptus cultivation in tropical areas. b) Data are based on poplar cultivated in EU without any synthetic fertilization. c) Stemwood (NG) = pellets produced using natural gas as process fuel, all the other pathways are based on wood as process fuel

Figure 10: Illustration of greenhouse gas supply chain emissions (excluding combustion and all emissions and removals of biogenic carbon in the supply chain, except methane) compared to reference fossil fuel emissions for the most representative biogas and biomethane pathways. Calculations are based on the methodology described in Commission document COM(2010) 11 and SWD(2014) 259 and further details can be found in JRC report EUR27215. Values higher than 100% represent systems in which credits from improved agricultural management more than offset any supply chain emission. Values lower than 0% indicate systems which emit larger amounts of greenhouse gas than the fossil fuel comparator. For illustrative purposes, values obtained for the co-digestion of a mixture of 70% (wet mass) manure and 30% (wet mass) maize are also included.
The linked image cannot be displayed. The file may have been moved, renamed, or deleted. Verify that the link points to the correct file and location.
ANNEX 7. BIOGENIC CARBON — FINDINGS FROM REVIEWS OF SCIENTIFIC LITERATURE
Two literature reviews on biogenic carbon from forest biomass used for energy have been carried out for the Commission.163 Their main findings are the following:
• The assumption of ‘carbon neutrality’ of bioenergy is not generally valid when considering forest biomass used for energy
Lifecycle assessments of greenhouse gas emissions from bioenergy often consider the emissions of biomass combustion as zero and considers supply chain emissions as equal to (or a proxy of) the total CO2 impact of bioenergy. This assumes that the CO2 emitted by the production and use of bioenergy (combustion emissions, soil C loss, etc.) is fully and immediately compensated by the land use benefits (regrowth of the plant).
Both literature reviews find that this assumption is not generally valid in the case of forest biomass and that biogenic emissions must be considered in the assessment of climate impacts of forest.
This conclusion is also backed for example by the US EPA164 and the European Environmental Agency Scientific Committee.165 The IPCC also supports the view that biomass used for energy is not automatically carbon neutral.166167
The combustion of woody biomass releases, in most cases, more CO2 in the atmosphere, per unit of delivered energy, than the fossil fuels they replace. This is mostly because biomass normally has less energy per kg of carbon and also lower conversion efficiency. Therefore, the bulk of the scientific literature suggests that all together these phenomena create an emission of biogenic-CO2 from forest bioenergy which may be higher than the emissions from a reference fossil system in the short term. If the forest productivity increases because of the bioenergy production, the continuous substitution of fossil fuels may, in time, recover the additional emissions of bioenergy production.
• In assessing lifecycle GHG emissions from forest biomass used for energy, the best approach is a consequential lifecycle analysis including all carbon pools
Assessing the potential of bioenergy technologies to mitigate climate change is a complex task. Bioenergy systems can influence directly and indirectly, local and global climate through a complex interaction of perturbations, including: 163 JRC, 2014, ‘Carbon accounting of forest bioenergy’ and Forest research, 2014 ‘Review of literature on
biogenic carbon and life cycle assessment of forest bioenergy’. 164 https://www3.epa.gov/climatechange/ghgemissions/biogenic-emissions.html. 165 Opinion of the EEA Scientific Committee on Greenhouse Gas Accounting in Relation to Bioenergy,
September 2011. 166 http://www.ipcc-nggip.iges.or.jp/faq/faq.html - q2-10. 167 Under international climate change guidelines for the preparation of national GHG emission inventories,
CO2 emissions from biomass combustion are not accounted in the energy sector (e.g. they are zero rated). This is to avoid double counting, because it is assumed that these emissions are accounted as part of the emissions from the land use, land use sector and forestry (LULUCF) sector in the same national inventory.
104
o emissions of CO2 and other long and short-lived climate forcers from biomass combustion;
o alteration of biophysical properties of the land surface; o influence on land use and land management; o substitution of other energy sources (including fossil fuels) with biomass and
other commodities (such as food crops and wood products).
Life Cycle Assessment (LCA) has emerged as the main tool used to inform policy makers about potential environmental impacts of products and policies, and has been applied also to bioenergy pathways. Two approaches for LCA can be defined:
o attributional LCA (A-LCA), which is used to quantify and allocate impacts among existing products and activities. It is related to ‘micro-level decision support’168 (i.e. typically for questions related to specific products).
o consequential LCA (C-LCA) which is instead appropriate for ‘Meso/macro-level decision support’169 (i.e. for a strategic level with consequences for example on the production capacity).
A-LCA is static and descriptive, while C-LCA is dynamic and predictive. Both reviews find that traditional attributional LCAs focusing on supply chain emissions and assuming carbon neutrality of biomass, have been unable to capture the above-mentioned complexities of bioenergy climate impacts, in particular as they relate to impacts on land use, land-based products and their substitution. LCA studies have recently started to include explicitly biogenic-C flows and the use of biomass and land in the baseline170 system so that the climate change mitigation potential of bioenergy is better captured.
Nonetheless, both reviews find that when the goal of the assessment is to assess the consequences of a policy, then impacts caused by various policy choices against one (or multiple) baselines (biomass alternative uses to bioenergy) should be investigated through consequential LCA. This assessment usually involves the use of integrated assessment models and ideally it should:
• assess impacts at a global geographic scale;
• assess impacts on all market sectors of the economy;
168. ‘Micro-level decisions’ are assumed to have limited and no structural consequences outside the decision-context, i.e. they are supposed not to change available production capacity. 169 Life cycle based decision support at a strategic level (e.g. raw materials strategies, technology scenarios, policy options). ‘Meso/macro-level decisions’ are assumed to have structural consequences outside the decision-context, i.e. they are supposed to change available production capacity. 170 A baseline or counterfactual is defined in this context as ‘the hypothetical situation without the studied
product system’ (Soimakallio et al., 2015).
105
• assess impacts on all relevant carbon pools, including biogenic carbon emissions and removals;171
• The contribution of biogenic carbon to emissions from forest bioenergy is very variable, going from negligible to very significant levels, and the variation is systematic rather than due to uncertainty
Both reviews find that biogenic carbon can make a very variable contribution to greenhouse gas emissions from forest biomass used for energy, depending on a number of factors (see below). While these emissions vary a lot, the net outcome of a certain combination of factors is predictable to a great extent. As the results depend on assumptions for the counterfactual scenarios (see below), they can be difficult to verify.
• Biogenic emissions are sensitive to the scale of consumption
The review by Forest Research finds that the contribution of biogenic carbon to GHG emissions of forest bioenergy is likely to be more important if the demand is higher. This is because the scale of demand is expected to affect the forest management regimes and the type of feedstocks used for bioenergy production
• The variation of net biogenic emissions depends on a number of factors:
The two reviews find that the level of net biogenic emissions depends on a certain number of factors and in particular:
o the type of feedstock (e.g. forest residues, stemwood/roundwood, etc.) (see more details below);
o the type and change in forest management.
Forest research for example finds that increased harvesting involves reductions in forest carbon stocks on the short term (few years to decades), but in some cases can be consistent with increased forest carbon stocks (e.g. in the case of extension of the length of rotations or enrichment of degraded or relatively unproductive forests).
o market-mediated effects.
JRC finds that market-mediated effects can play a role in the level of biogenic CO2 emissions. These include for example the displacement of wood from products to bioenergy. It also includes the impact that an increased demand and price for wood would have on the use of the land. The forest management is also relevant, either by adding pressure on forests, or on the other hand by incentivising more investments in the forest. Market-mediated effects can also occur through competition between different sources of energy. The evidence available to adequately understand and quantify such market-mediated impacts is currently limited.
171 Examples of this type of assessment include the studies Recebio and BioImpact performed for the
Commission.
106
o counterfactual for land use and biomass use.
Both reviews find that biogenic emissions vary depending on what would be the alternative fate of the land (in particular what type of forest management would occur and whether the land would remain forest), and also what would be the alternative use of the wood (e.g. left standing in the forest, decay, burned, used for materials,…). This is strongly linked to market-mediated effects.
o counterfactual for energy.
Although this is not directly related to the absolute level of biogenic emissions but rather to the climate performance of forest bioenergy, both reviews find that the GHG performance of forest biomass for energy is sensitive to the assumption on which type of energy it replaces (e.g. coal, natural gas, other renewables), and the rate of substitution.
• Biogenic emissions from forest bioenergy vary depending on the time horizon considered
Both reviews find that biogenic emissions vary over time and different results are obtained for GHG emissions depending on the time horizon considered. An immediate increase in GHG emissions compared to using fossil fuels is almost inevitable, as combustion emissions of biomass are higher than those of fossil alternatives, eventually leading to reductions in GHG emissions. The initial period of increased GHG emissions can vary from less than one year to hundreds of years (or even to infinity in the worst cases, if no savings can be realised), depending on the type of forest bioenergy pathway.
• The same feedstock used for energy can result in low or high biogenic emissions, depending on other factors
Both reviews find that while the type of feedstock used plays an important role in the amount of biogenic emissions, in many cases it is not a sufficient predictor of biogenic emissions, as these emissions can be small or large depending on other factors (e.g. the alternative fate of the biomass and/or forest, which, in turn, can change with the scale in demand) This is particularly true with small roundwood (including pulpwood), but also for certain other feedstocks.
• While the results vary, certain trends can be observed for specific feedstocks or practices
The reviews find that in general:
o biogenic emissions are low for forest residues (except for stumps/coarse dead wood), waste wood, industrial residues (as long as they are not diverted from use as material), salvage wood (i.e. from pest/storm, to the extent they are not suitable for industrial use), pre-commercial thinnings, wood from afforestation;
o biogenic emissions remain high (higher than emissions from fossil fuels) beyond a policy-relevant timeframe for sawnwood, stumps, coarse dead wood;

107
o biogenic emissions vary depending on situations (they can be low or high) for small stemwood including pulpwood.
• Certain forest management practices can enhance the carbon sink, but
ensuring that the harvest level stays below the growth rate of the forest is not sufficient to ensure climate change mitigations
Forest Research finds that increased harvest and removals typically involve a reduction in carbon stocks. In some specific cases interventions to increase biomass production may involve increased forest carbon stocks. Examples of relevant activities include extension of rotations or afforestation (avoiding organic soils and risks of indirect land use change) and the ‘enrichment’ of the growing stock of existing forest areas.
The JRC literature review also highlighted that, even if with sustainable forest management practices forest removals are lower or equal to the net annual increment of the forest, and carbon stocks are preserved or increasing in time in absolute terms, the total carbon stored in the forest will be in any case lower than the reference scenario of the unmanaged forest and the resulting difference translates into increased net emissions.
108
ANNEX 8. SUMMARY OF THE RESULTS OF THE STUDY ‘CARBON IMPACTS OF BIOMASS CONSUMED IN THE EU’ (BIOIMPACT) 172
Background
The study was carried out for the Commission (DG ENER), by a consortium led by Forest Research173.
The objectives of the study were to carry out a qualitative and quantitative assessment of the GHG emissions associated to different uses of solid biomass for electricity and heating/cooling in the EU, under a number of defined scenarios focusing on the period to 2030 and to 2050. The assessment aims to quantify the GHG emissions at global level including all relevant sources of emissions, in particular covering the effects of:
o Carbon stock/sequestration changes; o Indirect Land Use Change (iLUC)174; o Impacts of using land for energy crops; o Indirect impacts of diverting woody biomass to energy; o The full biomass/bioenergy life cycle and key GHGs; o Specified time horizons, notably 2030 and 2050.
Policy scenarios were compared to a reference scenario considering no additional policy targets after 2020.
The project therefore considered impacts on global GHG emissions due to consumption of bioenergy in the EU, i.e. not only the GHG emissions occurring in the EU regions, or reported by Member States.
The modelling tools used for this project are described more in details in Annex 4.
Baseline and policy scenarios assessed
The project assessed six scenarios for the supply and consumption of biomass for energy within the EU:
o Reference (or baseline) scenario A, considering existing 2020 policy targets for energy consumption and reductions in GHG emissions and no further policies after 2020.
o Five decarbonisation scenarios, which consider the EU climate and energy targets for 2030. The following scenarios were defined: Scenario B “Carry on/unconstrained use”: highest use of biomass for
energy, from all sources, no constraints;
172 The report and its appendixes can be found here: https://ec.europa.eu/energy/sites/ener/files/documents/EU%20Carbon%20Impacts%20of%20Biomass%20Consumed%20in%20the%20EU%20final.pdf and https://ec.europa.eu/energy/sites/ener/files/documents/EU%20Carbon%20Impacts%20of%20Biomass%20Consumed%20in%20the%20EU%20Appendices%20final.pdf 173 Project partners included members of three different research institutes, namely: North Energy
Associates (UK); Alterra (Netherlands) and VTT (Finland). 174 By setting constraints to avoid that feedstocks causing indirect land use change are used in the scenarios
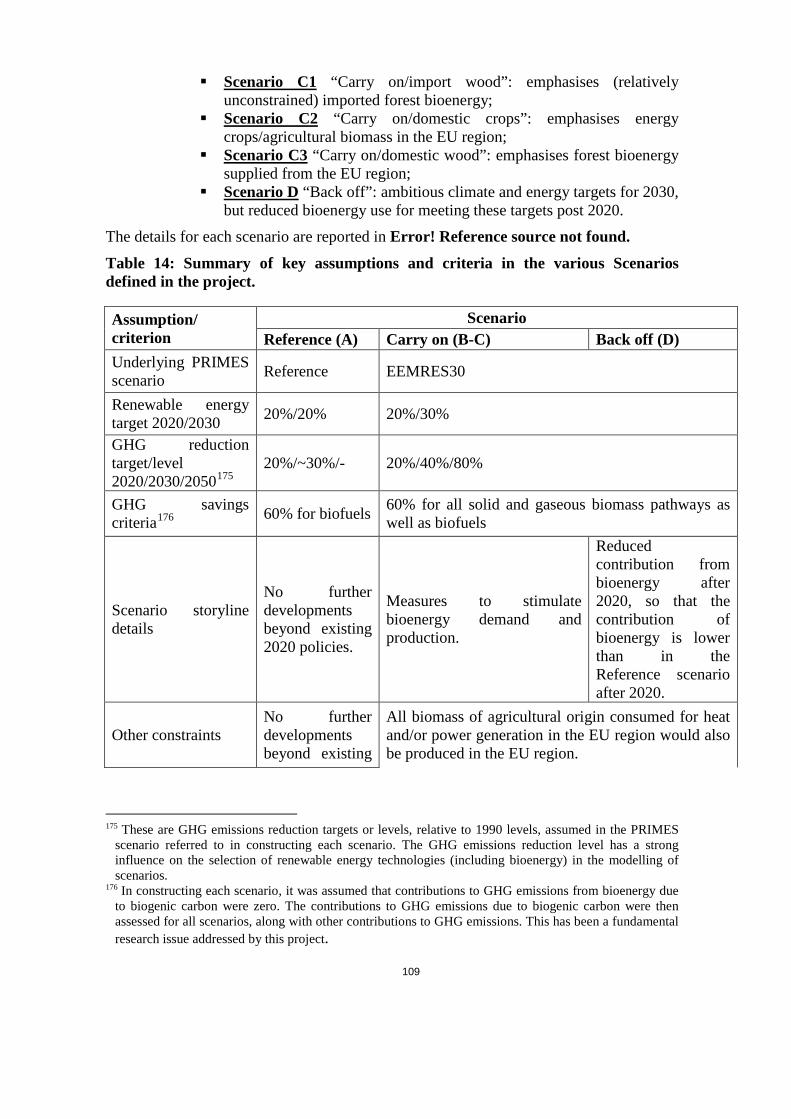
109
Scenario C1 “Carry on/import wood”: emphasises (relatively unconstrained) imported forest bioenergy;
Scenario C2 “Carry on/domestic crops”: emphasises energy crops/agricultural biomass in the EU region;
Scenario C3 “Carry on/domestic wood”: emphasises forest bioenergy supplied from the EU region;
Scenario D “Back off”: ambitious climate and energy targets for 2030, but reduced bioenergy use for meeting these targets post 2020.
The details for each scenario are reported in Error! Reference source not found.
Table 14: Summary of key assumptions and criteria in the various Scenarios defined in the project.
Assumption/ criterion
Scenario Reference (A) Carry on (B-C) Back off (D)
Underlying PRIMES scenario Reference EEMRES30
Renewable energy target 2020/2030 20%/20% 20%/30%
GHG reduction target/level 2020/2030/2050175
20%/~30%/- 20%/40%/80%
GHG savings criteria176 60% for biofuels 60% for all solid and gaseous biomass pathways as
well as biofuels
Scenario storyline details
No further developments beyond existing 2020 policies.
Measures to stimulate bioenergy demand and production.
Reduced contribution from bioenergy after 2020, so that the contribution of bioenergy is lower than in the Reference scenario after 2020.
Other constraints No further developments beyond existing
All biomass of agricultural origin consumed for heat and/or power generation in the EU region would also be produced in the EU region.
175 These are GHG emissions reduction targets or levels, relative to 1990 levels, assumed in the PRIMES
scenario referred to in constructing each scenario. The GHG emissions reduction level has a strong influence on the selection of renewable energy technologies (including bioenergy) in the modelling of scenarios.
176 In constructing each scenario, it was assumed that contributions to GHG emissions from bioenergy due to biogenic carbon were zero. The contributions to GHG emissions due to biogenic carbon were then assessed for all scenarios, along with other contributions to GHG emissions. This has been a fundamental research issue addressed by this project.
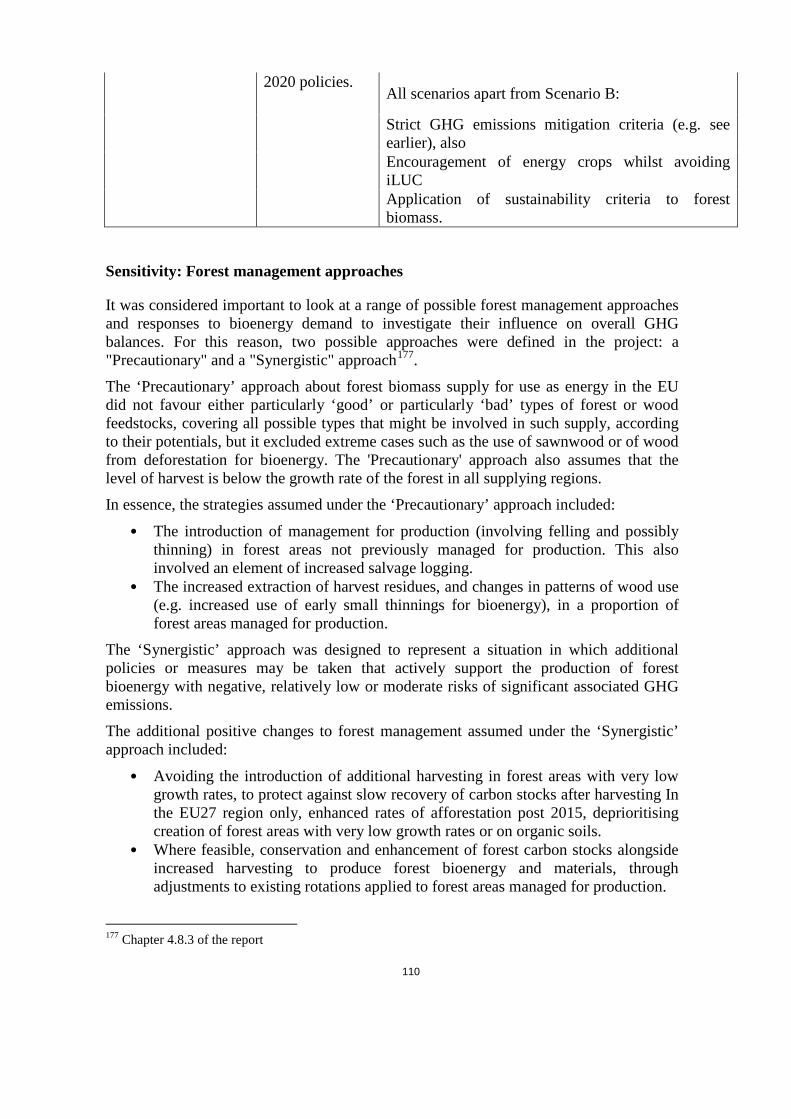
110
2020 policies. All scenarios apart from Scenario B:
Strict GHG emissions mitigation criteria (e.g. see earlier), also Encouragement of energy crops whilst avoiding iLUC Application of sustainability criteria to forest biomass.
Sensitivity: Forest management approaches
It was considered important to look at a range of possible forest management approaches and responses to bioenergy demand to investigate their influence on overall GHG balances. For this reason, two possible approaches were defined in the project: a "Precautionary" and a "Synergistic" approach177.
The ‘Precautionary’ approach about forest biomass supply for use as energy in the EU did not favour either particularly ‘good’ or particularly ‘bad’ types of forest or wood feedstocks, covering all possible types that might be involved in such supply, according to their potentials, but it excluded extreme cases such as the use of sawnwood or of wood from deforestation for bioenergy. The 'Precautionary' approach also assumes that the level of harvest is below the growth rate of the forest in all supplying regions.
In essence, the strategies assumed under the ‘Precautionary’ approach included:
• The introduction of management for production (involving felling and possibly thinning) in forest areas not previously managed for production. This also involved an element of increased salvage logging.
• The increased extraction of harvest residues, and changes in patterns of wood use (e.g. increased use of early small thinnings for bioenergy), in a proportion of forest areas managed for production.
The ‘Synergistic’ approach was designed to represent a situation in which additional policies or measures may be taken that actively support the production of forest bioenergy with negative, relatively low or moderate risks of significant associated GHG emissions.
The additional positive changes to forest management assumed under the ‘Synergistic’ approach included:
• Avoiding the introduction of additional harvesting in forest areas with very low growth rates, to protect against slow recovery of carbon stocks after harvesting In the EU27 region only, enhanced rates of afforestation post 2015, deprioritising creation of forest areas with very low growth rates or on organic soils.
• Where feasible, conservation and enhancement of forest carbon stocks alongside increased harvesting to produce forest bioenergy and materials, through adjustments to existing rotations applied to forest areas managed for production.
177 Chapter 4.8.3 of the report
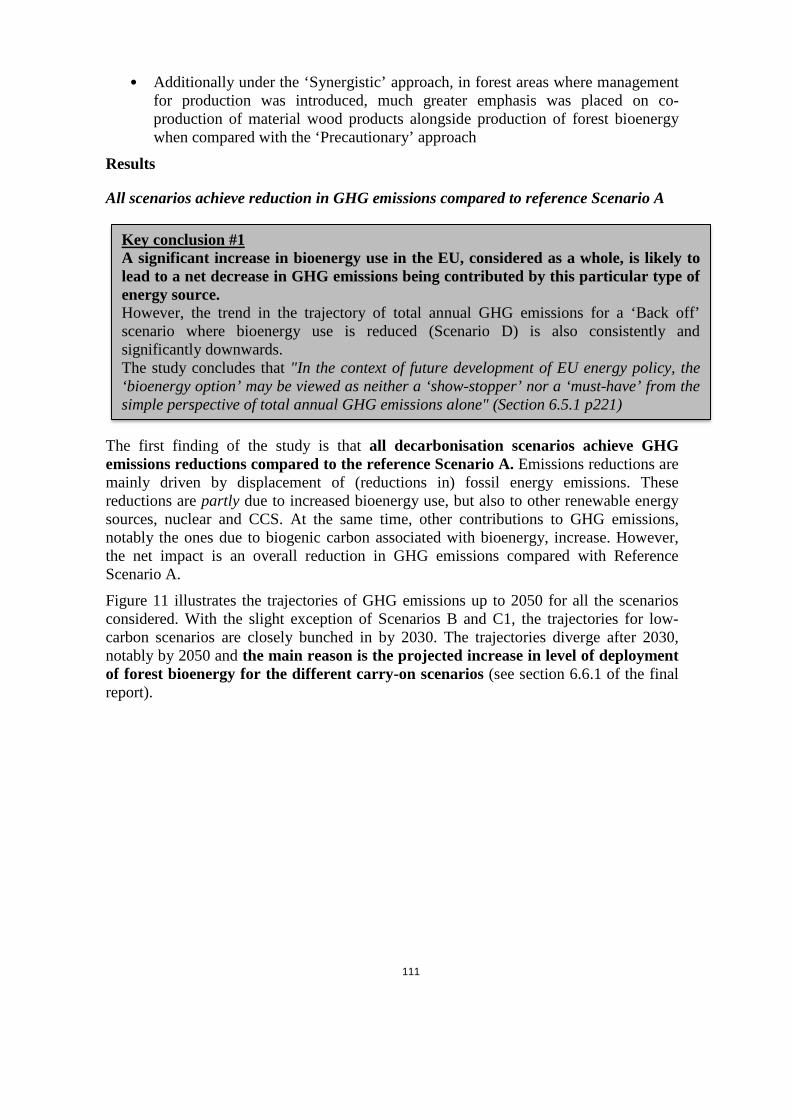
111
• Additionally under the ‘Synergistic’ approach, in forest areas where management for production was introduced, much greater emphasis was placed on co-production of material wood products alongside production of forest bioenergy when compared with the ‘Precautionary’ approach
Results
All scenarios achieve reduction in GHG emissions compared to reference Scenario A
The first finding of the study is that all decarbonisation scenarios achieve GHG emissions reductions compared to the reference Scenario A. Emissions reductions are mainly driven by displacement of (reductions in) fossil energy emissions. These reductions are partly due to increased bioenergy use, but also to other renewable energy sources, nuclear and CCS. At the same time, other contributions to GHG emissions, notably the ones due to biogenic carbon associated with bioenergy, increase. However, the net impact is an overall reduction in GHG emissions compared with Reference Scenario A.
Figure 11 illustrates the trajectories of GHG emissions up to 2050 for all the scenarios considered. With the slight exception of Scenarios B and C1, the trajectories for low-carbon scenarios are closely bunched in by 2030. The trajectories diverge after 2030, notably by 2050 and the main reason is the projected increase in level of deployment of forest bioenergy for the different carry-on scenarios (see section 6.6.1 of the final report).
Key conclusion #1 A significant increase in bioenergy use in the EU, considered as a whole, is likely to lead to a net decrease in GHG emissions being contributed by this particular type of energy source. However, the trend in the trajectory of total annual GHG emissions for a ‘Back off’ scenario where bioenergy use is reduced (Scenario D) is also consistently and significantly downwards. The study concludes that "In the context of future development of EU energy policy, the ‘bioenergy option’ may be viewed as neither a ‘show-stopper’ nor a ‘must-have’ from the simple perspective of total annual GHG emissions alone" (Section 6.5.1 p221)
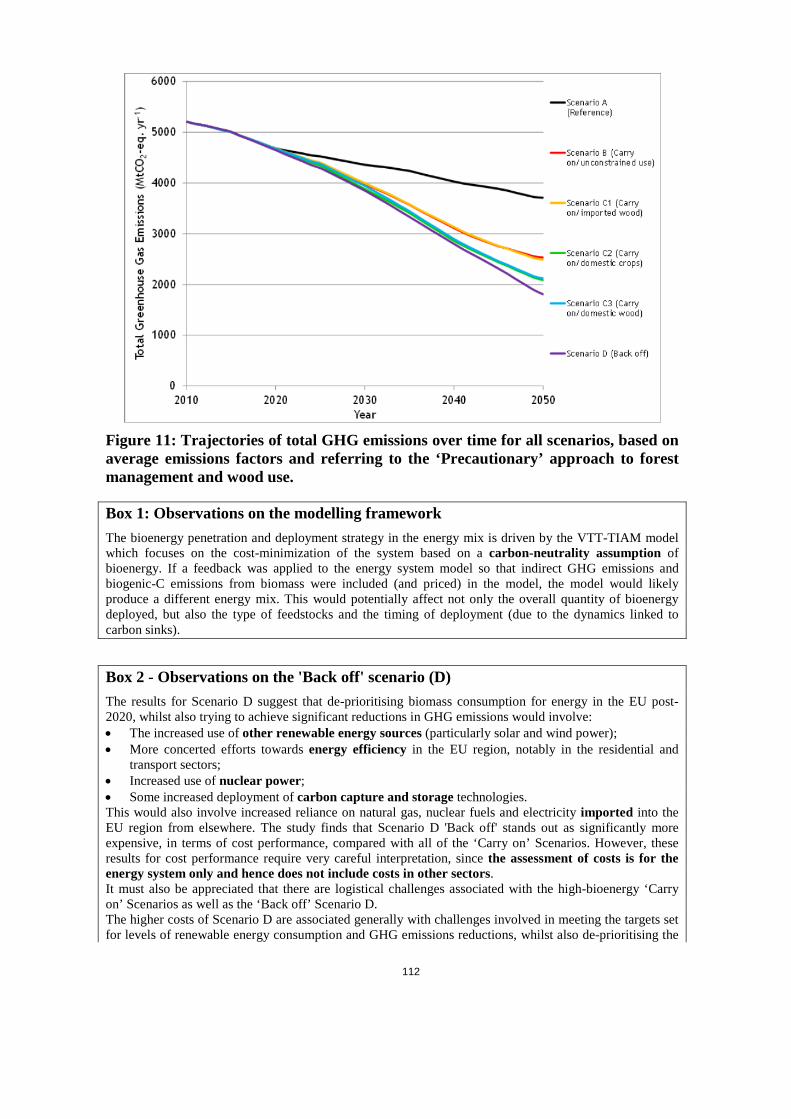
112
Figure 11: Trajectories of total GHG emissions over time for all scenarios, based on average emissions factors and referring to the ‘Precautionary’ approach to forest management and wood use.
Box 1: Observations on the modelling framework The bioenergy penetration and deployment strategy in the energy mix is driven by the VTT-TIAM model which focuses on the cost-minimization of the system based on a carbon-neutrality assumption of bioenergy. If a feedback was applied to the energy system model so that indirect GHG emissions and biogenic-C emissions from biomass were included (and priced) in the model, the model would likely produce a different energy mix. This would potentially affect not only the overall quantity of bioenergy deployed, but also the type of feedstocks and the timing of deployment (due to the dynamics linked to carbon sinks).
Box 2 - Observations on the 'Back off' scenario (D) The results for Scenario D suggest that de-prioritising biomass consumption for energy in the EU post-2020, whilst also trying to achieve significant reductions in GHG emissions would involve: • The increased use of other renewable energy sources (particularly solar and wind power); • More concerted efforts towards energy efficiency in the EU region, notably in the residential and
transport sectors; • Increased use of nuclear power; • Some increased deployment of carbon capture and storage technologies. This would also involve increased reliance on natural gas, nuclear fuels and electricity imported into the EU region from elsewhere. The study finds that Scenario D 'Back off' stands out as significantly more expensive, in terms of cost performance, compared with all of the ‘Carry on’ Scenarios. However, these results for cost performance require very careful interpretation, since the assessment of costs is for the energy system only and hence does not include costs in other sectors. It must also be appreciated that there are logistical challenges associated with the high-bioenergy ‘Carry on’ Scenarios as well as the ‘Back off’ Scenario D. The higher costs of Scenario D are associated generally with challenges involved in meeting the targets set for levels of renewable energy consumption and GHG emissions reductions, whilst also de-prioritising the
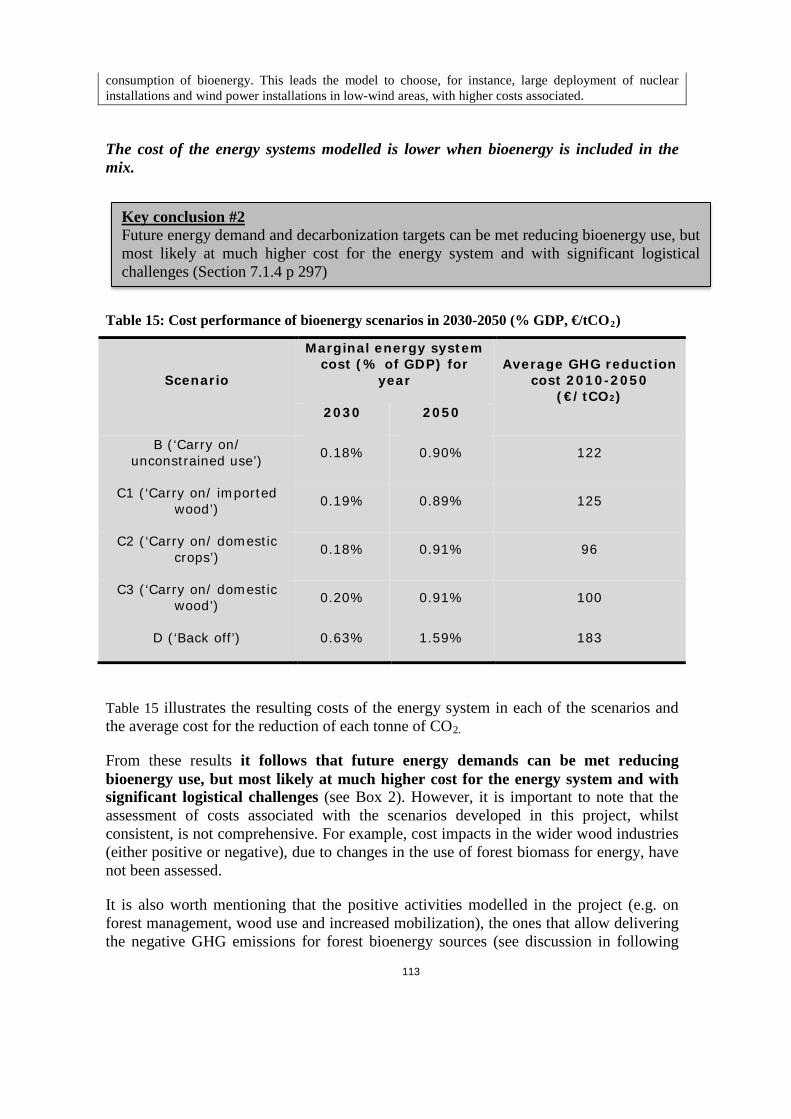
113
consumption of bioenergy. This leads the model to choose, for instance, large deployment of nuclear installations and wind power installations in low-wind areas, with higher costs associated.
The cost of the energy systems modelled is lower when bioenergy is included in the mix.
Table 15: Cost performance of bioenergy scenarios in 2030-2050 (% GDP, €/tCO2)
Scenario
Marginal energy system cost (% of GDP) for
year Average GHG reduction
cost 2010-2050 (€/tCO2)
2030 2050
B (‘Carry on/ unconstrained use’) 0.18% 0.90% 122
C1 (‘Carry on/ imported wood’) 0.19% 0.89% 125
C2 (‘Carry on/ domestic crops’) 0.18% 0.91% 96
C3 (‘Carry on/ domestic wood’) 0.20% 0.91% 100
D (‘Back off’) 0.63% 1.59% 183
Table 15 illustrates the resulting costs of the energy system in each of the scenarios and the average cost for the reduction of each tonne of CO2.
From these results it follows that future energy demands can be met reducing bioenergy use, but most likely at much higher cost for the energy system and with significant logistical challenges (see Box 2). However, it is important to note that the assessment of costs associated with the scenarios developed in this project, whilst consistent, is not comprehensive. For example, cost impacts in the wider wood industries (either positive or negative), due to changes in the use of forest biomass for energy, have not been assessed.
It is also worth mentioning that the positive activities modelled in the project (e.g. on forest management, wood use and increased mobilization), the ones that allow delivering the negative GHG emissions for forest bioenergy sources (see discussion in following
Key conclusion #2 Future energy demand and decarbonization targets can be met reducing bioenergy use, but most likely at much higher cost for the energy system and with significant logistical challenges (Section 7.1.4 p 297)

114
sections and last row of Table 17) were not included in the costs. The costs for certain positive outcomes for forest bioenergy are thus underestimated.
The GHG benefits achieved depend on the type of bioenergy used and on the scale of deployment
The results presented in Figure 12require careful interpretation and they do not allow an understanding of the role that bioenergy plays in overall GHG savings, i.e. whether GHG benefits are obtained thanks to bioenergy or despite bioenergy. Table 16 and Figure 14 help to understand this issue.
The answer to this question differ significantly between 2030 and 2050. The scenarios consider an ambitious decarbonisation target for 2050 (85% GHG emissions in the energy sector compared to 1990178. After 2030, thus, the energy system model (VTT-TIAM) relies very heavily on bioenergy to comply with the GHG target and the differences between the scenarios in terms of bioenergy strategies and types, become more evident.
Figure 12: Total quantity of forest bioenergy supplied (i.e. total primary forest bioenergy supplied internally and externally) to the EU region for all scenarios.
Figure 12 highlights the increasing reliance on forest biomass supply in all the scenarios except for scenario D. In order to quantify the sustainability of the harvest levels predicted by the model, the removals in EU27 forests under different scenarios have been compared to the maximum theoretical long-term potential (details in section 4.10.4 of the project report), see Figure 13. It is assumed that a safe threshold for sustainable-yield production of industrial and fuel wood is equal to 70% of the theoretical potential shown
178 Consistent with the 80% reduction economy-wide target
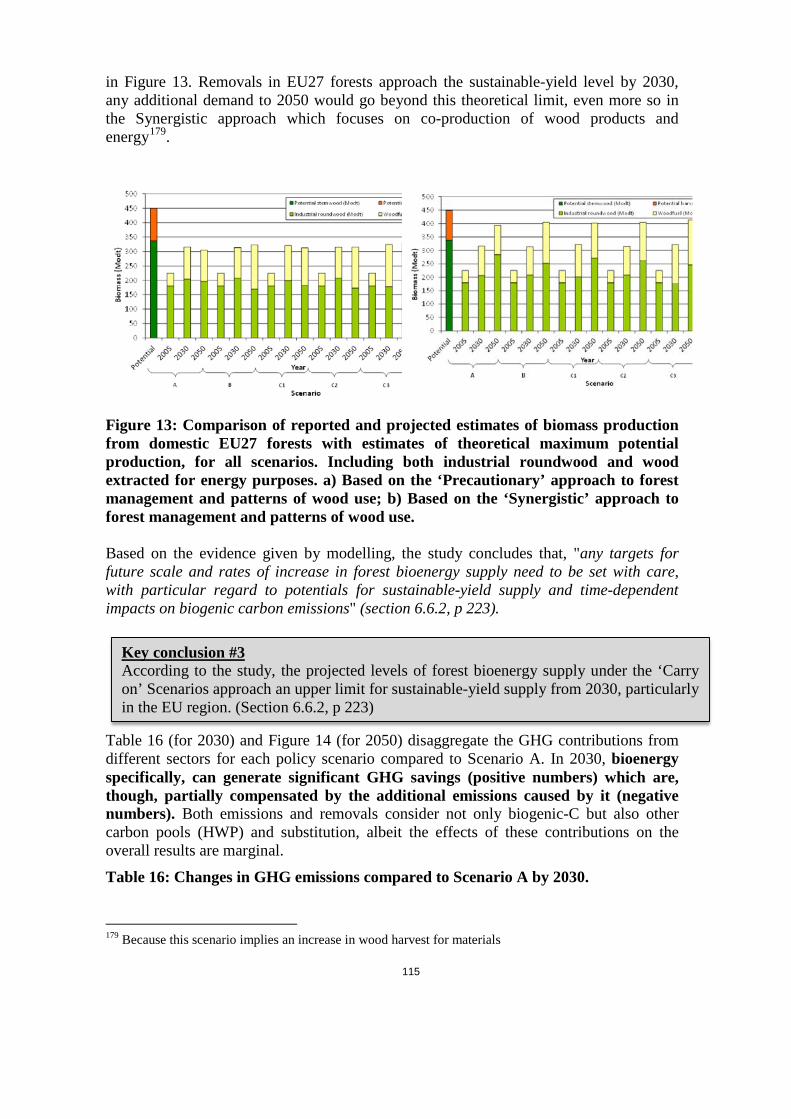
115
in Figure 13. Removals in EU27 forests approach the sustainable-yield level by 2030, any additional demand to 2050 would go beyond this theoretical limit, even more so in the Synergistic approach which focuses on co-production of wood products and energy179.
Figure 13: Comparison of reported and projected estimates of biomass production from domestic EU27 forests with estimates of theoretical maximum potential production, for all scenarios. Including both industrial roundwood and wood extracted for energy purposes. a) Based on the ‘Precautionary’ approach to forest management and patterns of wood use; b) Based on the ‘Synergistic’ approach to forest management and patterns of wood use. Based on the evidence given by modelling, the study concludes that, "any targets for future scale and rates of increase in forest bioenergy supply need to be set with care, with particular regard to potentials for sustainable-yield supply and time-dependent impacts on biogenic carbon emissions" (section 6.6.2, p 223).
Table 16 (for 2030) and Figure 14 (for 2050) disaggregate the GHG contributions from different sectors for each policy scenario compared to Scenario A. In 2030, bioenergy specifically, can generate significant GHG savings (positive numbers) which are, though, partially compensated by the additional emissions caused by it (negative numbers). Both emissions and removals consider not only biogenic-C but also other carbon pools (HWP) and substitution, albeit the effects of these contributions on the overall results are marginal.
Table 16: Changes in GHG emissions compared to Scenario A by 2030.
179 Because this scenario implies an increase in wood harvest for materials
Key conclusion #3 According to the study, the projected levels of forest bioenergy supply under the ‘Carry on’ Scenarios approach an upper limit for sustainable-yield supply from 2030, particularly in the EU region. (Section 6.6.2, p 223)
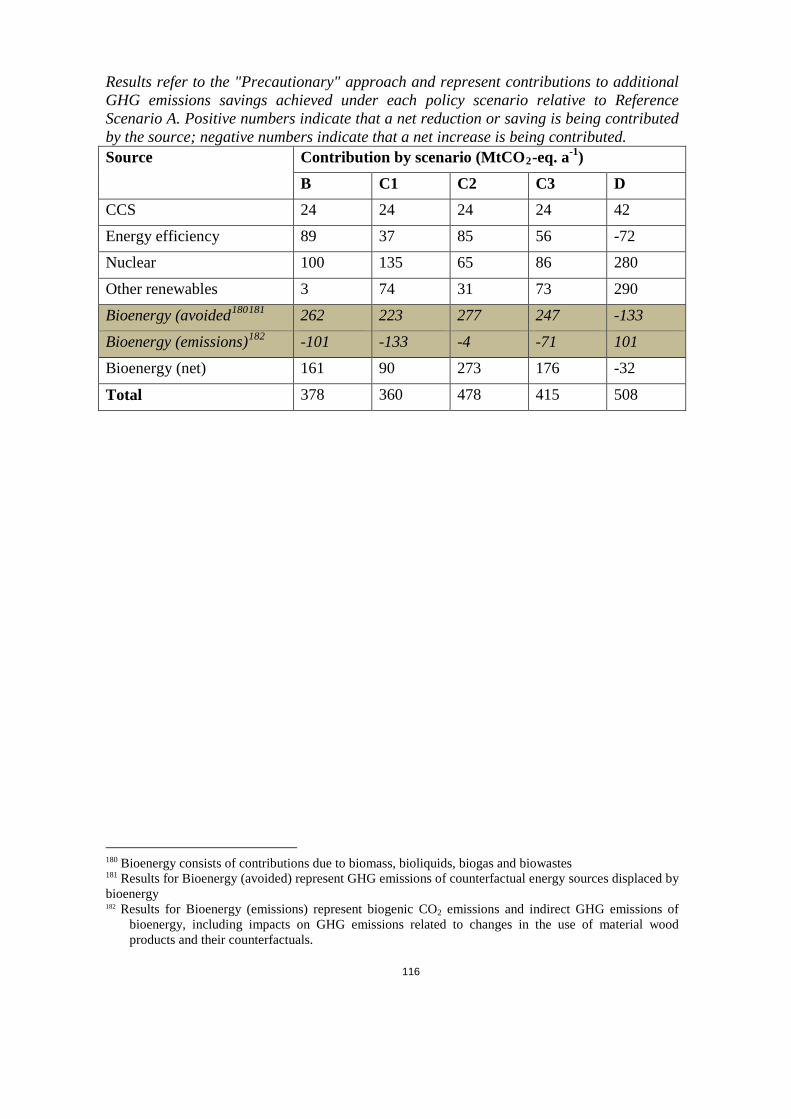
116
Results refer to the "Precautionary" approach and represent contributions to additional GHG emissions savings achieved under each policy scenario relative to Reference Scenario A. Positive numbers indicate that a net reduction or saving is being contributed by the source; negative numbers indicate that a net increase is being contributed. Source Contribution by scenario (MtCO2-eq. a-1)
B C1 C2 C3 D CCS 24 24 24 24 42
Energy efficiency 89 37 85 56 -72
Nuclear 100 135 65 86 280
Other renewables 3 74 31 73 290
Bioenergy (avoided180181 262 223 277 247 -133
Bioenergy (emissions)182 -101 -133 -4 -71 101
Bioenergy (net) 161 90 273 176 -32
Total 378 360 478 415 508
180 Bioenergy consists of contributions due to biomass, bioliquids, biogas and biowastes 181 Results for Bioenergy (avoided) represent GHG emissions of counterfactual energy sources displaced by bioenergy 182 Results for Bioenergy (emissions) represent biogenic CO2 emissions and indirect GHG emissions of
bioenergy, including impacts on GHG emissions related to changes in the use of material wood products and their counterfactuals.
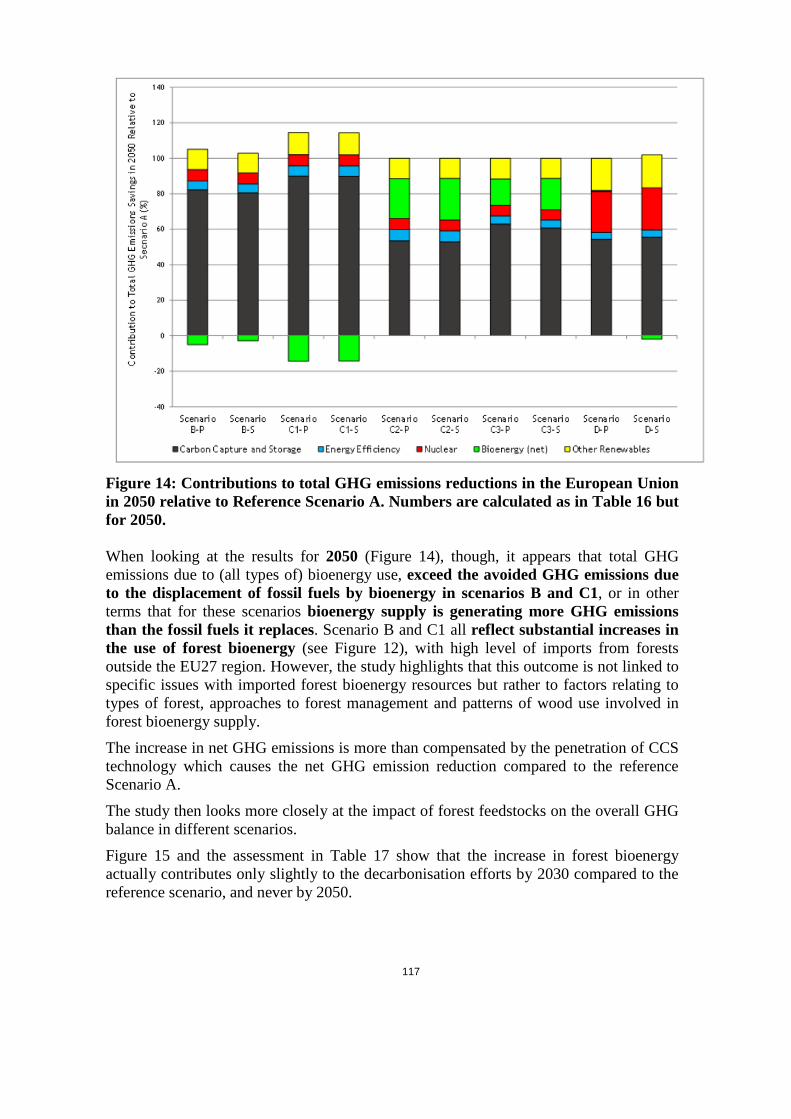
117
Figure 14: Contributions to total GHG emissions reductions in the European Union in 2050 relative to Reference Scenario A. Numbers are calculated as in Table 16 but for 2050. When looking at the results for 2050 (Figure 14), though, it appears that total GHG emissions due to (all types of) bioenergy use, exceed the avoided GHG emissions due to the displacement of fossil fuels by bioenergy in scenarios B and C1, or in other terms that for these scenarios bioenergy supply is generating more GHG emissions than the fossil fuels it replaces. Scenario B and C1 all reflect substantial increases in the use of forest bioenergy (see Figure 12), with high level of imports from forests outside the EU27 region. However, the study highlights that this outcome is not linked to specific issues with imported forest bioenergy resources but rather to factors relating to types of forest, approaches to forest management and patterns of wood use involved in forest bioenergy supply.
The increase in net GHG emissions is more than compensated by the penetration of CCS technology which causes the net GHG emission reduction compared to the reference Scenario A.
The study then looks more closely at the impact of forest feedstocks on the overall GHG balance in different scenarios.
Figure 15 and the assessment in Table 17 show that the increase in forest bioenergy actually contributes only slightly to the decarbonisation efforts by 2030 compared to the reference scenario, and never by 2050.
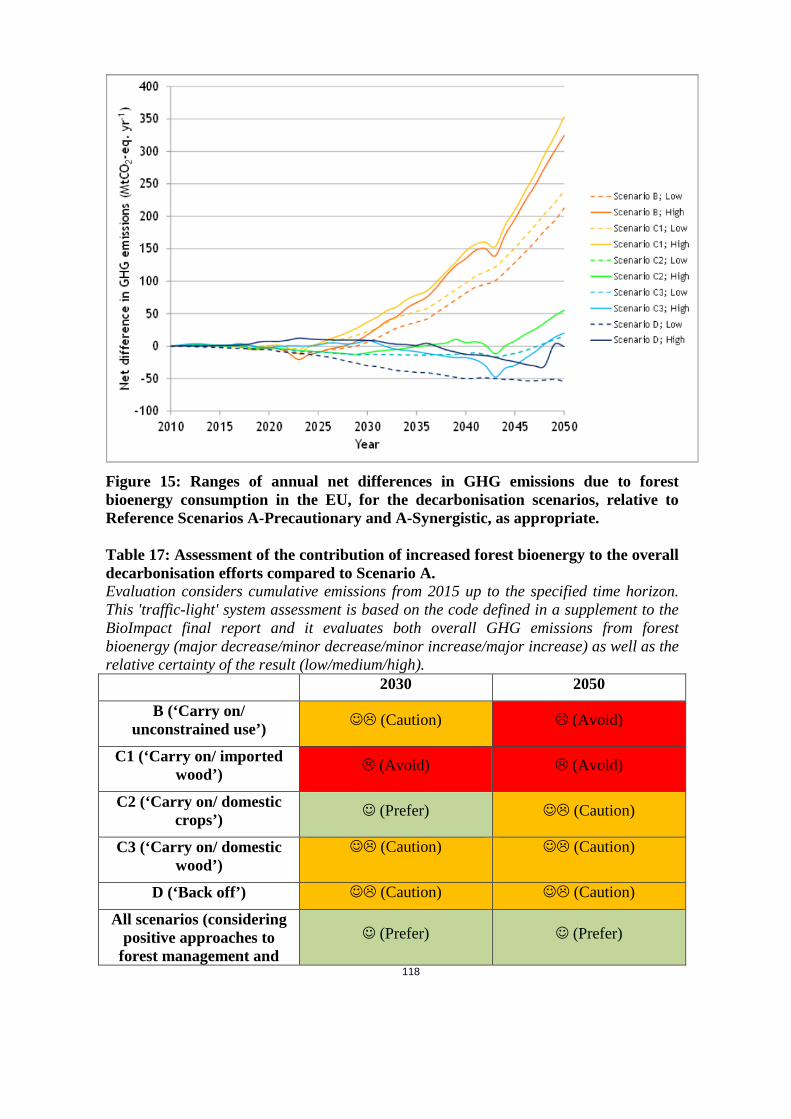
118
Figure 15: Ranges of annual net differences in GHG emissions due to forest bioenergy consumption in the EU, for the decarbonisation scenarios, relative to Reference Scenarios A-Precautionary and A-Synergistic, as appropriate. Table 17: Assessment of the contribution of increased forest bioenergy to the overall decarbonisation efforts compared to Scenario A. Evaluation considers cumulative emissions from 2015 up to the specified time horizon. This 'traffic-light' system assessment is based on the code defined in a supplement to the BioImpact final report and it evaluates both overall GHG emissions from forest bioenergy (major decrease/minor decrease/minor increase/major increase) as well as the relative certainty of the result (low/medium/high).
2030 2050
B (‘Carry on/ unconstrained use’) (Caution) (Avoid)
C1 (‘Carry on/ imported wood’) (Avoid) (Avoid)
C2 (‘Carry on/ domestic crops’) (Prefer) (Caution)
C3 (‘Carry on/ domestic wood’)
(Caution) (Caution)
D (‘Back off’) (Caution) (Caution)
All scenarios (considering positive approaches to
forest management and (Prefer) (Prefer)
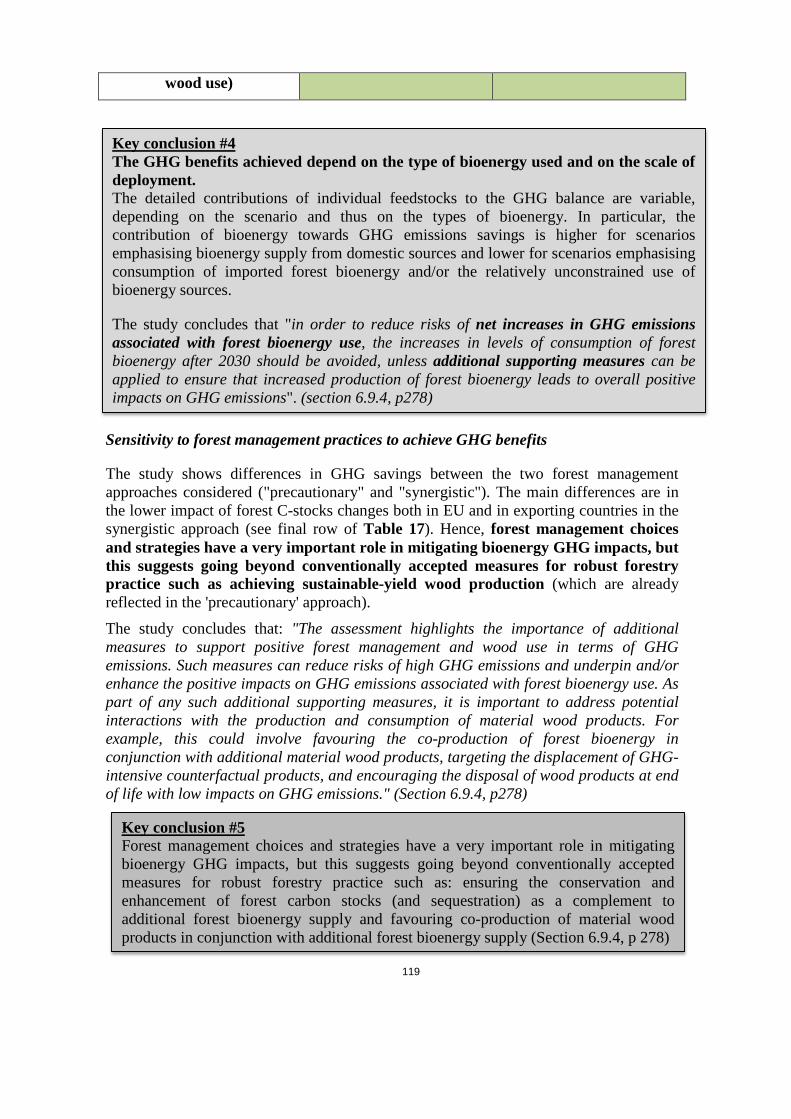
119
wood use)
Sensitivity to forest management practices to achieve GHG benefits
The study shows differences in GHG savings between the two forest management approaches considered ("precautionary" and "synergistic"). The main differences are in the lower impact of forest C-stocks changes both in EU and in exporting countries in the synergistic approach (see final row of Table 17). Hence, forest management choices and strategies have a very important role in mitigating bioenergy GHG impacts, but this suggests going beyond conventionally accepted measures for robust forestry practice such as achieving sustainable-yield wood production (which are already reflected in the 'precautionary' approach).
The study concludes that: "The assessment highlights the importance of additional measures to support positive forest management and wood use in terms of GHG emissions. Such measures can reduce risks of high GHG emissions and underpin and/or enhance the positive impacts on GHG emissions associated with forest bioenergy use. As part of any such additional supporting measures, it is important to address potential interactions with the production and consumption of material wood products. For example, this could involve favouring the co-production of forest bioenergy in conjunction with additional material wood products, targeting the displacement of GHG-intensive counterfactual products, and encouraging the disposal of wood products at end of life with low impacts on GHG emissions." (Section 6.9.4, p278)
Key conclusion #4 The GHG benefits achieved depend on the type of bioenergy used and on the scale of deployment. The detailed contributions of individual feedstocks to the GHG balance are variable, depending on the scenario and thus on the types of bioenergy. In particular, the contribution of bioenergy towards GHG emissions savings is higher for scenarios emphasising bioenergy supply from domestic sources and lower for scenarios emphasising consumption of imported forest bioenergy and/or the relatively unconstrained use of bioenergy sources.
The study concludes that "in order to reduce risks of net increases in GHG emissions associated with forest bioenergy use, the increases in levels of consumption of forest bioenergy after 2030 should be avoided, unless additional supporting measures can be applied to ensure that increased production of forest bioenergy leads to overall positive impacts on GHG emissions". (section 6.9.4, p278)
Key conclusion #5 Forest management choices and strategies have a very important role in mitigating bioenergy GHG impacts, but this suggests going beyond conventionally accepted measures for robust forestry practice such as: ensuring the conservation and enhancement of forest carbon stocks (and sequestration) as a complement to additional forest bioenergy supply and favouring co-production of material wood products in conjunction with additional forest bioenergy supply (Section 6.9.4, p 278)

120
121
ANNEX 9. CLIMATE CHANGE IMPACTS OF FOREST BIOENERGY — TIME HORIZON AND NON-GREENHOUSE GAS CLIMATE FORCERS
This annex focuses on discussing two important factors affecting the climate change mitigation potential of bioenergy from forest biomass resources: the time-horizon and biophysical (non-GHG) forcers. These aspects are treated separately from the sections dealing with biogenic carbon emissions and supply-chain GHG emissions because they are currently not quantified in the studies forming the basis for this IA. These phenomena are still the subject of scientific research and uncertainties are higher; however, since they are generally linked to an overall worsening of climate change, should be taken into account when defining bioenergy sustainability criteria. Time horizon Forest systems inertia Studies based on partial and general equilibrium models tend to assess GHG emission temporal development and economic interactions up to 2030 or 2050. This represents the timeframe for current EU climate policies and it is also in line with the timeframe by which, according to the IPCC AR5 Representative Concentration Pathways (RCP) models, the global peak of GHG emissions should be achieved to have higher probability of maintaining the temperature anomaly below 2°C. It is important to point out that the frameworks used in modelling studies, including recent projects mandated from the Commission (BioImpact183, ReceBio184), are based on macro and micro economic drivers; this implies that any result of simulations spanning very long timeframes (e.g. 2100 and beyond) would be characterized by a high level of uncertainty (e.g. over the long-term extrapolation of meaningful price-elasticities, macro-economic drivers, technical and economical biomass potentials etc.), which makes difficult to draw any policy conclusion. Nonetheless, changes in forest management and structure caused in the short/medium-term will have an inertia effect on forests carbon stocks and sinks because of the long time horizons involved in forest management. This means that even for policies carried out until 2030, the changes in forest management will cause changes in forest sinks that will reverberate for many years after the policy target. Those effects, which should be considered as independent from future management changes, should also be attributed to the policy choices examined. This is not usually done in modelling exercises. Moreover, while the modelling studies underpinning this IA attempt to simulate the management effects on the GHG balance of the land system (LULUCF), the RCP models underpinning the long-term trajectories and targets assume that the residual terrestrial carbon sink (dominated by forests remaining forest) is driven primarily by biophysical factors (CO2 fertilisation and climate change) and not by management. Therefore, harvest-driven reductions in the net forest sink can create discrepancies with the airborne 183https://ec.europa.eu/energy/sites/ener/files/documents/EU%20Carbon%20Impacts%20of%20Biomass%2
0Consumed%20in%20the%20EU%20final.pdf 184 http://ec.europa.eu/environment/enveco/resource_efficiency/index.htm#bioenergy
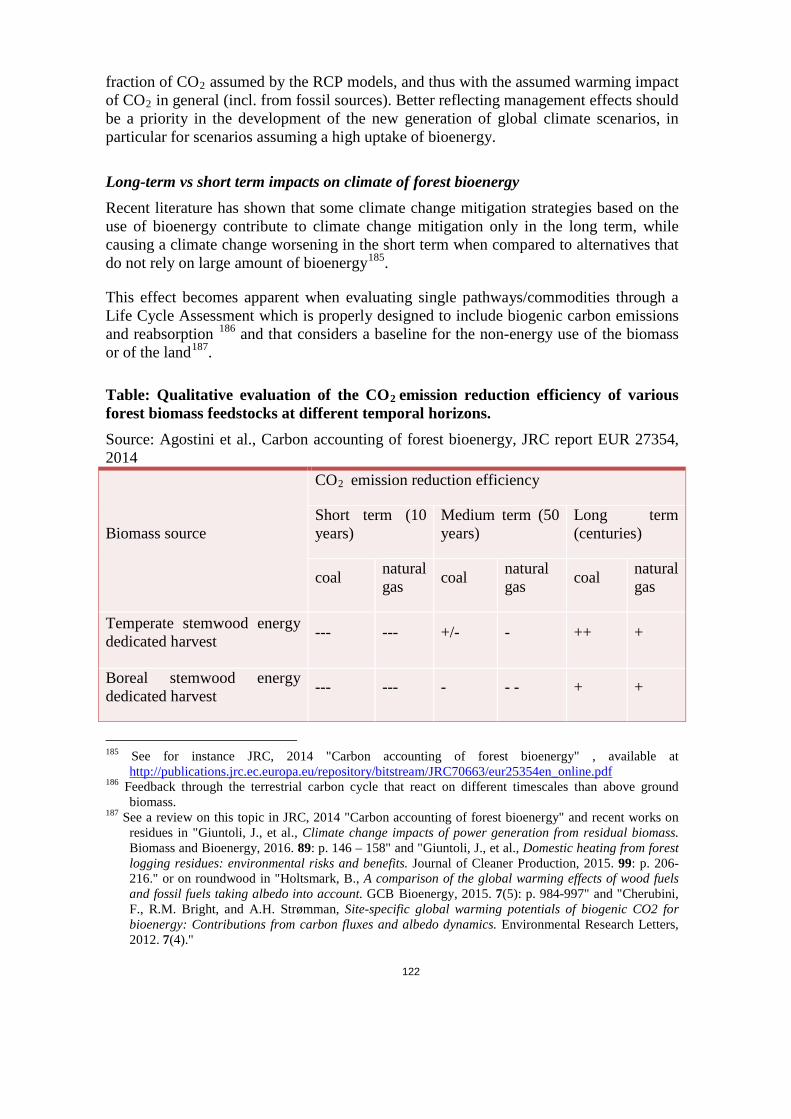
122
fraction of CO2 assumed by the RCP models, and thus with the assumed warming impact of CO2 in general (incl. from fossil sources). Better reflecting management effects should be a priority in the development of the new generation of global climate scenarios, in particular for scenarios assuming a high uptake of bioenergy. Long-term vs short term impacts on climate of forest bioenergy Recent literature has shown that some climate change mitigation strategies based on the use of bioenergy contribute to climate change mitigation only in the long term, while causing a climate change worsening in the short term when compared to alternatives that do not rely on large amount of bioenergy185.
This effect becomes apparent when evaluating single pathways/commodities through a Life Cycle Assessment which is properly designed to include biogenic carbon emissions and reabsorption 186 and that considers a baseline for the non-energy use of the biomass or of the land187.
Table: Qualitative evaluation of the CO2 emission reduction efficiency of various forest biomass feedstocks at different temporal horizons. Source: Agostini et al., Carbon accounting of forest bioenergy, JRC report EUR 27354, 2014
Biomass source
CO2 emission reduction efficiency
Short term (10 years)
Medium term (50 years)
Long term (centuries)
coal natural gas coal natural
gas coal natural gas
Temperate stemwood energy dedicated harvest --- --- +/- - ++ +
Boreal stemwood energy dedicated harvest --- --- - - - + +
185 See for instance JRC, 2014 "Carbon accounting of forest bioenergy" , available at
http://publications.jrc.ec.europa.eu/repository/bitstream/JRC70663/eur25354en_online.pdf 186 Feedback through the terrestrial carbon cycle that react on different timescales than above ground
biomass. 187 See a review on this topic in JRC, 2014 "Carbon accounting of forest bioenergy" and recent works on
residues in "Giuntoli, J., et al., Climate change impacts of power generation from residual biomass. Biomass and Bioenergy, 2016. 89: p. 146 – 158" and "Giuntoli, J., et al., Domestic heating from forest logging residues: environmental risks and benefits. Journal of Cleaner Production, 2015. 99: p. 206-216." or on roundwood in "Holtsmark, B., A comparison of the global warming effects of wood fuels and fossil fuels taking albedo into account. GCB Bioenergy, 2015. 7(5): p. 984-997" and "Cherubini, F., R.M. Bright, and A.H. Strømman, Site-specific global warming potentials of biogenic CO2 for bioenergy: Contributions from carbon fluxes and albedo dynamics. Environmental Research Letters, 2012. 7(4)."
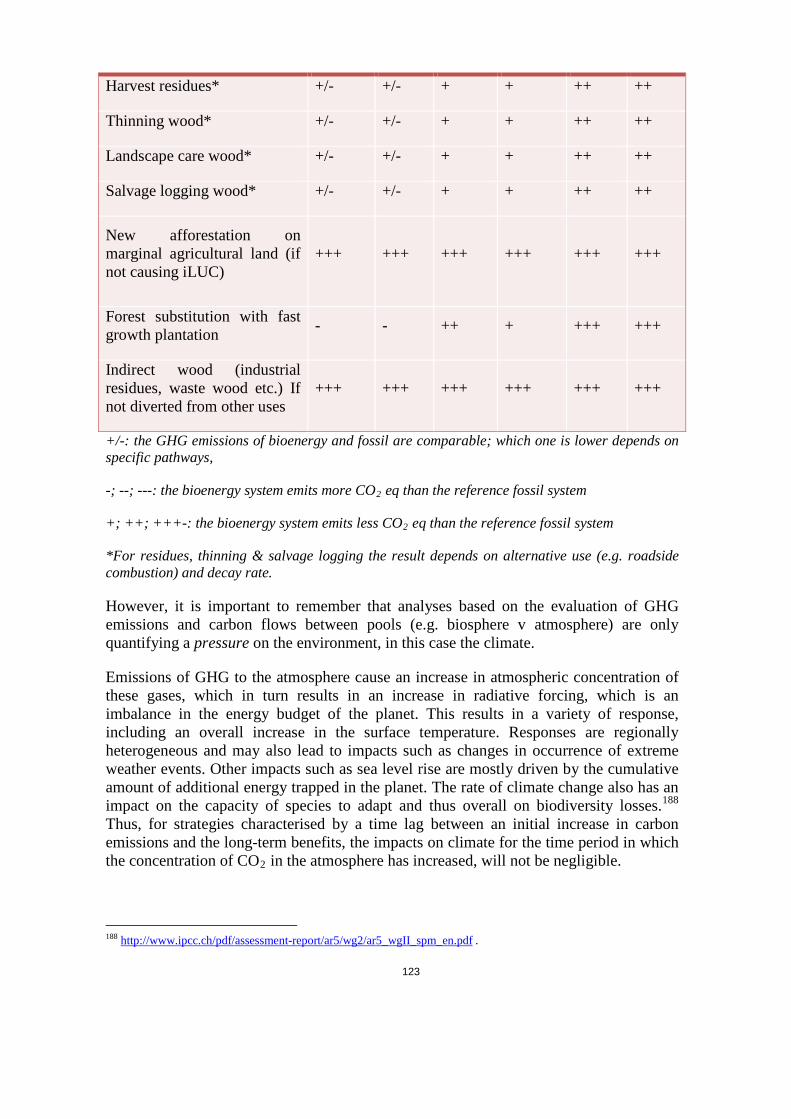
123
Harvest residues* +/- +/- + + ++ ++
Thinning wood* +/- +/- + + ++ ++
Landscape care wood* +/- +/- + + ++ ++
Salvage logging wood* +/- +/- + + ++ ++
New afforestation on marginal agricultural land (if not causing iLUC)
+++ +++ +++ +++ +++ +++
Forest substitution with fast growth plantation - - ++ + +++ +++
Indirect wood (industrial residues, waste wood etc.) If not diverted from other uses
+++ +++ +++ +++ +++ +++
+/-: the GHG emissions of bioenergy and fossil are comparable; which one is lower depends on specific pathways,
-; --; ---: the bioenergy system emits more CO2 eq than the reference fossil system
+; ++; +++-: the bioenergy system emits less CO2 eq than the reference fossil system
*For residues, thinning & salvage logging the result depends on alternative use (e.g. roadside combustion) and decay rate.
However, it is important to remember that analyses based on the evaluation of GHG emissions and carbon flows between pools (e.g. biosphere v atmosphere) are only quantifying a pressure on the environment, in this case the climate.
Emissions of GHG to the atmosphere cause an increase in atmospheric concentration of these gases, which in turn results in an increase in radiative forcing, which is an imbalance in the energy budget of the planet. This results in a variety of response, including an overall increase in the surface temperature. Responses are regionally heterogeneous and may also lead to impacts such as changes in occurrence of extreme weather events. Other impacts such as sea level rise are mostly driven by the cumulative amount of additional energy trapped in the planet. The rate of climate change also has an impact on the capacity of species to adapt and thus overall on biodiversity losses.188 Thus, for strategies characterised by a time lag between an initial increase in carbon emissions and the long-term benefits, the impacts on climate for the time period in which the concentration of CO2 in the atmosphere has increased, will not be negligible.
188 http://www.ipcc.ch/pdf/assessment-report/ar5/wg2/ar5_wgII_spm_en.pdf .
124
Therefore, the impact of biogenic carbon emissions and removals on the temperature increase depends on the trajectory of emissions and not only on the total cumulative emissions over a given timeframe.189 Hence the type of biomass feedstock used, the rate, and the timing at which bioenergy technologies are deployed, all influence the overall climate impact of various mitigation strategies: the same long-term target on GHG emissions can be achieved with different trajectories and types of bioenergy penetration but the impact on climate change magnitude and rate will be different.
Biogeophysical climate forcers International and EU climate targets cover GHG emissions, but not other important climate forcers which can influence global temperature change. Some of these forcers - the biophysical forcers - are particularly relevant for forest management and provision of bioenergy by forests. This is because the change in land management (i.e. harvest) and land cover (i.e. deforestation) influences global and local climate through surface albedo change, as well as through modifications in evapotranspiration, surface roughness, latent heat flux etc190.
The result of the interaction between all these forcing mechanisms is still not fully understood191, but recent studies192 indicate that:
- in boreal regions, the overall effect of permanent land cover change is close to zero, (because changes in surface albedo compensate the warming due to decreased evapotranspiration)
- in other climatic zones, permanent land cover change results in a warming effect
- a temporary change during harvest and regrowth of forest stands (clearfelling) could also result in a warming response in temperate regions, while in boreal regions the effect is still neutral
Therefore, in temperate areas the effect of including biophysical forcers could cause a relatively strong warming response in the case of clearfelling or deforestation, which materializes mostly on local/regional scales. This would come in addition to effects from greenhouse gas emissions, which have a more global reach.
- Emissions and deposition of black carbon on ice and snow-covered land is another important source of increased warming.
Increased emissions of black carbon increases warming by reducing the albedo (in particular on ice and snow) and greatly increase the melting of icesheets.
189 Cherubini, F., et al., Linearity between temperature peak and bioenergy CO2 emission rates. Nature
Climate Change, 2014. 4(11): p. 983-987. 190 Luyssaert, S., et al., Land management and land-cover change have impacts of similar magnitude on
surface temperature. Nature Clim. Change, 2014. 4(5): p. 389-393 191 Stocker, T.F., et al., Technical Summary, in Climate Change 2013: The Physical Science Basis.
Contribution of Working Group I to the Fifth Assessment Report of the Intergovernmental Panel on Climate Change 2013, Cambridge University Press: Cambridge, United Kingdom
192 In particular Alkama, R. and A. Cescatti, Climate change: Biophysical climate impacts of recent changes in global forest cover. Science, 2016. 351(6273): p. 600-604

125
Biomass burning is an important source of black carbon, whether this is in wildfires, open air combustion of agricultural residues or the use as traditional or modern bioenergy. An increased bioenergy demand could have positive consequences by promoting the substitution of inefficient wood stoves with modern pellet stoves. On the other hand the combustion of solid biomass will inevitably cause higher emissions of particulate matter, and consequently of black carbon, than other renewable technologies such as solar and wind.
126
ANNEX 10. DISCARDED OPTIONS
Introducing requirements on soil and water protection for agricultural feedstocks
In the sustainability criteria for biofuels and bioliquids, no requirement was set out concerning soil and water protection. This is because such requirements would mostly consist of good agricultural practices, which can vary depending on a number of factors including geographical circumstances, making it difficult to define, apply and enforce mandatory criteria. At EU level, it is more efficient to approach such risks through agricultural policy. For non-EU countries, there are no mandatory requirements, but many of the voluntary certification schemes which have been recognised by the Commission for demonstrating compliance with the sustainability criteria require farmers to apply good agricultural practices.
In addition, the future use of agricultural feedstocks for heat and power is expected to mostly consist of:
- agricultural residues (e.g. straw): these cannot be transported over long distances hence they will come mostly from within the EU territory, where they are covered by cross-compliance requirements under EU agricultural policy;
- perennial crops (e.g. grasses or short rotation coppice): these have generally a positive impact on soil and water compared to annual crops.
For biofuels, the use of food crops is expected to decrease and be gradually replaced by other sources, including agricultural residues and perennial crops.
Hence, it is not proposed to introduce specific requirements for the protection of soil and water for agricultural feedstocks for heat and power.
Removing the supply chain greenhouse gas methodology and threshold for biofuels, and not introduce one for other agricultural feedstocks for heat and power
Supply chain greenhouse gas emissions for biofuels are accounted for in national inventories (for example in the EU, cultivation emissions and transport emissions are accounted in the non-ETS sector, and processing emissions either in the non-ETS or ETS sector depending on the size of the installation). Hence, it could be envisaged to remove altogether the lifecycle calculation and minimum performance standards for supply chain emissions that exist for biofuels. However, this would go against the objective of ensuring a contribution to greenhouse gas reductions from bioenergy by allowing biofuels with poor or negative direct lifecycle savings (for example where coal is used in the transformation process) to be considered sustainable.
Introducing requirements concerning the level of harvest of residues in forest (to protect biodiversity and soil fertility)
A specific issue related to forest feedstocks and biodiversity concerns the harvesting of forest residues: as described in the problem definition, excessive harvesting of forest residues, and in particular coarse dead wood and stumps, can have negative effects for biodiversity as these residues provide habitat for different species. In addition, such
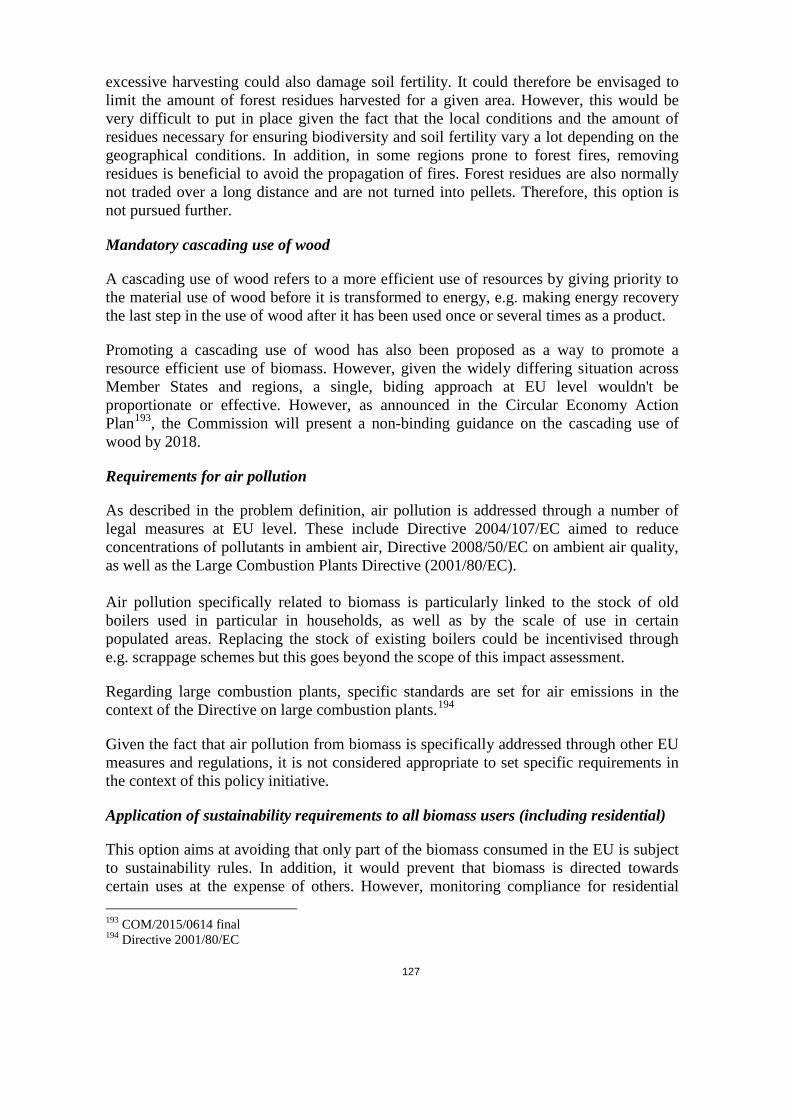
127
excessive harvesting could also damage soil fertility. It could therefore be envisaged to limit the amount of forest residues harvested for a given area. However, this would be very difficult to put in place given the fact that the local conditions and the amount of residues necessary for ensuring biodiversity and soil fertility vary a lot depending on the geographical conditions. In addition, in some regions prone to forest fires, removing residues is beneficial to avoid the propagation of fires. Forest residues are also normally not traded over a long distance and are not turned into pellets. Therefore, this option is not pursued further.
Mandatory cascading use of wood
A cascading use of wood refers to a more efficient use of resources by giving priority to the material use of wood before it is transformed to energy, e.g. making energy recovery the last step in the use of wood after it has been used once or several times as a product.
Promoting a cascading use of wood has also been proposed as a way to promote a resource efficient use of biomass. However, given the widely differing situation across Member States and regions, a single, biding approach at EU level wouldn't be proportionate or effective. However, as announced in the Circular Economy Action Plan193, the Commission will present a non-binding guidance on the cascading use of wood by 2018.
Requirements for air pollution
As described in the problem definition, air pollution is addressed through a number of legal measures at EU level. These include Directive 2004/107/EC aimed to reduce concentrations of pollutants in ambient air, Directive 2008/50/EC on ambient air quality, as well as the Large Combustion Plants Directive (2001/80/EC). Air pollution specifically related to biomass is particularly linked to the stock of old boilers used in particular in households, as well as by the scale of use in certain populated areas. Replacing the stock of existing boilers could be incentivised through e.g. scrappage schemes but this goes beyond the scope of this impact assessment.
Regarding large combustion plants, specific standards are set for air emissions in the context of the Directive on large combustion plants.194
Given the fact that air pollution from biomass is specifically addressed through other EU measures and regulations, it is not considered appropriate to set specific requirements in the context of this policy initiative.
Application of sustainability requirements to all biomass users (including residential)
This option aims at avoiding that only part of the biomass consumed in the EU is subject to sustainability rules. In addition, it would prevent that biomass is directed towards certain uses at the expense of others. However, monitoring compliance for residential 193 COM/2015/0614 final 194 Directive 2001/80/EC

128
heating installation would be particularly challenging, particularly in those Member States that have significant auto-consumption of biomass for heating which is not registered in the commercial markets. It should be recalled that biomass use in the residential market is accounted by Member States towards their renewable energy target by means of statistical surveys. Making all bioenergy installations (including residential ones) subject to an EU-wide sustainability scheme would imply additional administrative burden on Member States to verify the compliance of a high number of small scale installations.
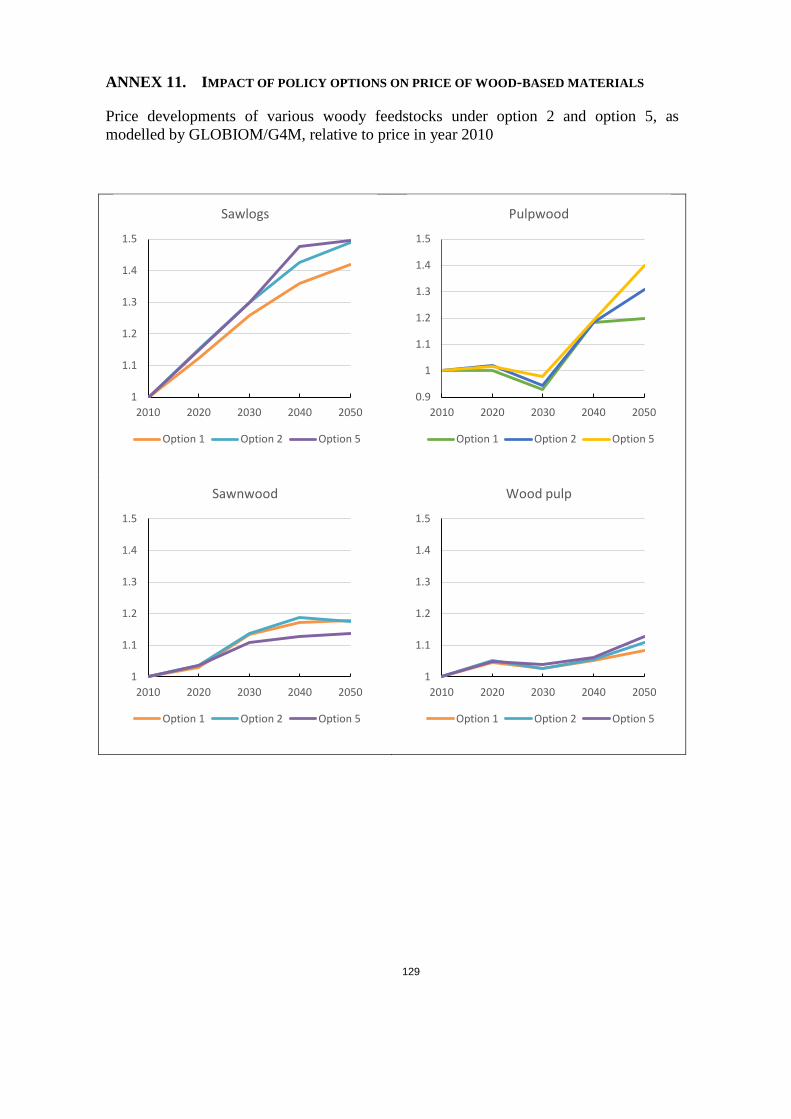
129
ANNEX 11. IMPACT OF POLICY OPTIONS ON PRICE OF WOOD-BASED MATERIALS
Price developments of various woody feedstocks under option 2 and option 5, as modelled by GLOBIOM/G4M, relative to price in year 2010
1
1.1
1.2
1.3
1.4
1.5
2010 2020 2030 2040 2050
Sawlogs
Option 1 Option 2 Option 5
0.9
1
1.1
1.2
1.3
1.4
1.5
2010 2020 2030 2040 2050
Pulpwood
Option 1 Option 2 Option 5
1
1.1
1.2
1.3
1.4
1.5
2010 2020 2030 2040 2050
Sawnwood
Option 1 Option 2 Option 5
1
1.1
1.2
1.3
1.4
1.5
2010 2020 2030 2040 2050
Wood pulp
Option 1 Option 2 Option 5
130
Sawlogs: Large diameter roundwood of sufficient length, straightness and other qualities, which can be used by the sawmilling industry
Sawnwood: Wood product produced from sawlogs (planks, beams, etc)
Pulpwood: Roundwood (excluding tops and branches) not satisfying the quality and/or dimensional requirements for the sawmill, veneer or plywood industries, but of sufficient size and industrial quality to be usable for the panels and pulp production.
Wood pulp: Pulp produced from wood
1
1.1
1.2
1.3
1.4
1.5
2010 2020 2030 2040 2050
Particleboard
Option 1 Option 2 Option 5
11.11.21.31.41.51.61.71.81.9
2010 2020 2030 2040 2050
Wood pellets
Option 1 Option 2 Option 5