en - european commission · en error! unknown document property name. en 6 ... ouverture 5 october...
TRANSCRIPT

EN Error! Unknown document property name. EN 1
TABLE OF CONTENTS- ANNEXES OF THE IAR FOR THE REFORM OF THE COMMON FISHERIES POLICY
ANNEX 1 - GLOSSARY AND DEFINITIONS ............................................................ 2
ANNEX 2 - LISTS OF CONSULTATIONS ORGANISED SINCE THE PUBLICATION OF THE GREEN PAPER.................................................................. 5
ANNEX 3 - SUMMARY TABLE O F THE PROBLEMS-SPECIFIC OBJECTIVES- REFORMS TOOLS AND OUTCOMES.................................................................... 13
ANNEX 4 - DESCRIPTION OF THE OPTIONS....................................................... 16
ANNEX 5 - LIST OF INDICATORS.......................................................................... 26
ANNEX 6 - MODELLING METHODS AND ASSUMPTIONS .................................. 27
ANNNEX 7 - IMPACTS OF THE DIFFERENT OPTIONS ON BRITTANY, GALICIA, SCOTLAND AND SICILY ........................................................................................ 42
ANNEX 8 - SUMMARY OF THE IMPACT OF EACH OPTION ON INDICATORS.. 48
ANNEX 9 - EXTRAPOLATIONS OF THE RESULTS TO THE WHOLE EU CATCHING SECTOR .............................................................................................. 95
ANNEX 10 - MARKETS DEVELOPMENT............................................................... 97
ANNEX 11 – EXTERNAL DIMENSION ................................................................. 100
ANNEX 12 – INDIVIDUAL TRANSFERABLE RIGHTS (ITR) ............................... 173

EN Error! Unknown document property name. EN 1
Other available documents and Studies
- Synthesis of the consultation on the reform of the Common Fisheries Policy- COMMISSION STAFF WORKING DOCUMENT- SEC ( 2010) 428 FINAL- 16 APRIL 2010
- Environmental, economic, social and governance impacts of the STATUS QUO scenario for the 2012 revision of the Common Fisheries Policy
- Environmental, economic, social and governance impacts of the 2012 CFP revision –Impact Assessment Phase II
- Environmental, economic, social and governance impacts of the STATUS QUO scenario for the 2012 revision of the Common Fisheries Policy – Four Regions SQ. Specific results for 4 case studies: Brittany, Galicia, Scotland and Sicily
- Environmental, economic, And SOCIAL and governance impacts of the 2012 revision of the Common Fisheries Policy. Four regions 2nd Phase Specific results for 4 case studies: Brittany, Galicia, Scotland and Sicily-
- Environmental, economic, social and governance impacts of the 2012 CFP revision –Impact Assessment- Task 7 additional studies -
- Regional social and economic impacts of change in fisheries-dependent communities.
- An analysis of existing Rights Based Management (RBM) instruments in Member States and on setting up best practices in the EU http://ec.europa.eu/fisheries/documentation/studies/rbm/rbm_2009_part1.pdf

EN Error! Unknown document property name. EN 2
ANNEX 1 - GLOSSARY AND DEFINITIONS
1. Acronyms ACFM Advisory Committee on Fishery Management
ACP African, Caribbean and Pacific
AER Annual Economic Report
B Maximum biomass
BER Break-even revenue (or break even point). Point at which income or turnover is equal to costs (excluding depreciation and interest). An indicator grater than 1 provides some confidence in economic sustainability.
Bmsy Biomass of the population at which MSY is taken
Bpa Target biomass set as a precautionary approach
CAP Common Agricultural Policy
CFCA Community Fisheries Control Agency
CFP Common Fisheries Policy
CIF Cost Insurance and Freight
CMO Common Market Organisation for fisheries and aquaculture products.
DCR Data Collection Regulation
DG MARE Directorate-General for Maritime Affairs and Fisheries
EC European Commission
EEC European Economic Community
EEZ Exclusive Economic Zone
EFF European Fishing Fund
EPA Economic Partnership Agreements
ERDF European Regional Development Fund
ETC/BD European Topic Centre on Biological Diversity
EU European Union
F Fishing mortality
Fmsy F giving maximum sustainable yield
Fmax F where total yield is highest
F0.1 F where slope of yield per recruit is one-tenth of its value near the origin. Proxy for Fmsy.
FIFG Financial Instrument for Fisheries Guidance
FPAs Fisheries Partnership Agreements
FTE Full Time Equivalent. Depending on the regions it amounts to either 1,600 or 1,800 working hours per year.

EN Error! Unknown document property name. EN 3
GCFM General Fisheries Commission for the Mediterranean
GDP Gross Domestic Product
GT Gross Tonnage
GVA Gross Value Added. Net profit from fishing (or processing), plus crew/labour earnings, plus depreciation costs, plus interest.
HACCP Hazard Analysis and Critical Control Point
HCR Harvest control rule
ICES International Council for the Exploration of the Sea
IE Individual Non-Transferable Effort Quotas
IMF International Monetary Fund
IQ Individual Non-Transferable Quotas
ITE Individual Transferable Effort Quotas
ITQ Individual Transferable Quota
ITR Individual Transferable Rights
IUU Illegal, Unregulated and Unreported
JDP Joint Deployment Plan of the CFCA
LSF Large scale fleet
LTMP Long term management plan
MAGP Multi-annual Guidance Programmes
MPA Marine Protected Area
MS Member States
MSFD Marine Strategy Framework Directive
MSY Maximum Sustainable Yield
NUTS Nomenclature of Territorial Units for Statistics
OECD Organisation for Economic Co-operation and Development
PCD Policy Coherence for Development
PO Producer organisations
RBM Rights based management
ROI Return on Investment. Operating profit (or gross cash flow) divided by total investment
SAC Special Areas of Conservation
SBL Safe biological limits
SCI Sites of Community Importance
SCM Standard Cost Model
SGECA Sub-Group on Economic Assessment
SMS Stochastic Multi-Species Model

EN Error! Unknown document property name. EN 4
SPA Special Protection Areas
SRP Simplification Rolling Programme
SSB Spawning Stock Biomass
SSCF Small scale coastal fleet
STECF Scientific, Technical and economic Committee for Fisheries
TAC Total Allowable Catch
UNCLOS United Nations Convention on the Law of the Sea
WTO World Trade Organization
AER Sector types DFN Drift nets and fixed nets NONACTIVE Non active vessels DRB Dredges PG Passive gears DTS Demersal trawl and demersal seiner PGO Other passive gears FPO Pots and traps PGP Polyvalent passive gears HOK Gears using hooks PMP Combining mobile & passive gears MGO Other mobile gears PTS Pelagic trawls and seiners MGP Polyvalent mobile gears TBB Beam trawl VL0012 <12 m length vessels VL2440 24-40 m length vessels VL1224 12-24 m length vessels VL40XX >40 m length vessels

EN Error! Unknown document property name. EN 5
ANNEX 2 - LISTS OF CONSULTATIONS ORGANISED SINCE THE PUBLICATION OF THE GREEN PAPER
Events in 2009
When? Where? MS Fisheries Administrations 1 DK - All-purpose meeting 11 May Copenhague 2 ES -Specific mission 26 May Madrid 3 DK - EFF Monitoring Committee 28 May 4 IE - EFF Monitoring Committee 28 May
5 DK - Annual Fisheries Policy Meeting 4 June Kolding, Denmark
6 SK - EFF Monitoring Committee 12 June
7 ES - Multi-purpose meeting 18-19 June
8 CZ - EFF Monitoring Committee 19 June
9 NL - EFF Monitoring Committee 19 June Netherlands
10 ES - EFF Monitoring Committee 23-24 June
11 PT - EFF Monitoring Committee 26 June
12 FR - Multi-purpose meeting 29-30 June
13 All Members States (DGs) 2-3 July Ronneby
14 BE - Specific meeting 6 July Ostende
15 PT - Ad-hoc meeting 7 July Lisbon
16 BE - EFF Monitoring Committee 8 July
17 FR - Specific mission 8 July Paris
18 UK - Multi-purpose meeting 13-14 July 19 GR - Conference on the Green Paper 30 Aug-1 Sept. Thessalonique 20 AT - EFF Monitoring Committee 17-18 September Illmitz
21 PL - Multi-purpose meeting 22-23 September Warsaw, Gdynia
22 RO - Conference on the CFP Reform October Bucharest
23 IE - Ad-hoc meeting + The Marine Institute
7-8 October Dublin
24 DK - Danfish Conference " A new Fisheries Policy for fishers"
8 October Ålborg, Denmark
25 IT - Ad-hoc meeting (Adm. + Stakeholders)
12 October Sardaigne
26 SV - EFF Monitoring Committee 15 October Gothenburg 27 EE - EFF OP Annual Examination 18 November Brussels
28 SV - EFF OP Annual Examination 24 November Brussels
29 DE - EFF OP Annual Examination 25 November Brussels
30 DK - EFF OP Annual Examination 26 November Brussels
31 PL - EFF OP Annual Examination 1 December Brussels
32 NL - EFF OP Annual Examination 3 December Brussels
33 GR - Conference on the Green Paper 4 December Kamena Vourla, Greece

EN Error! Unknown document property name. EN 6
34 BG - Multi-purpose meeting 7-8 December Sofia
35 IT - Special event 10 December Italy
36 BE - EFF OP Annual examination 10 December Ostend
MS Administrations other than fisheries, regions and other events
37 Chambre de Commerce de Granville, Basse Normandie
14 May Brussels
38 AG Commission Arc Atlantique 15 May Santander
39 Devon Maritime Forum 20 May Brixham
40 EFARO Annual directors meeting 26 May Göteborg
41 Fundación Galicia Europa - Presentation to all ES regions
3 June Brussels
42 EFF Axis 4 seminar with Baltic MS 4-5 June Parnü - Estonia
43 Lower Normandy 4 June Caen
44 CRPM - Adonis A4719 9 June Brussels
45 "Inquiry into Future Fisheries Management" - Scottish Government
15/16 June Edimburg Videoconference
46 CPMR Working Group "Aquamarina" 18 June Brussels
47 5th meeting with MS experts on Maritime Policy
23 June Brussels
48 Biolfish 25 June Monopoli
49 Coastal Management for Sustainability 30 June London
50 ES - Specific mission 9-10 July Granada
51 EU Fisheries Advisor meeting 17-18 September Göteborg
52 Five French major maritime regions 29 September Brussels
53 CPMR - General Assembly 30 Sept. 1-2 Oct. Göteborg
54 Assises de la pêche - ouverture 5 October Paris
55 The East of England Regional Assembly's (EERA)
5 October Brussels
56 DE - Presentation at the EU representation
7 October Berlin
57 Bretagne - Journée d'échange sur la réforme de la PCP
20 October La Forêt Fouesnant
58 Environment Policy Review Group 26 October Brussels
59 Assises de la pêche - PACA 3 November France
60 Galicia - Meeting between Galician Minister for Fisheries and Commissioner Borg
5 November Brussels
61 Scotland 4-5 November Scotland
62 EFARO workshop on CFP Reform 24 November Ostende
63 DE - COM representation with Land Schleswig-Holstein
26 November Buesum
64 ES - Specific mission 26-27 November Canary Islands
65 ES - Specific mission 27 November Bilbao

EN Error! Unknown document property name. EN 7
66 Assises de l'économie de la mer 1 December Brest
67 PT - Meeting with Azores Government 4 December Ponta Delgada
68 ES - Specific mission 18 December Santiago
European Institutions
69 Committee of the Regions 30 June Brussels
70 European Economic and Social Committee
15 July Brussels
71 European Parliament - Fisheries Committee
1 September Brussels
72 European Parliament - Fisheries Committee
30 Sept/1 Oct Brussels
73 European Economic and Social Committee - Specialised section
8 October Brussels
74 European Parliament - Working lunch with the Rapporteur
15 October Brussels
75 European Parliament - Workshop "Reforma da Política Comum de Pesca: O Futuro da Pesca em Portugal"
21 November Porto
76 European Parliament - Fisheries Committee
1 December Brussels
77 Committee of the Regions 4 December Brussels 78 European Economic and Social
Committee 10 December Brussels
Stakeholders, including NGOs 79 BSRAC - General Assembly 8 May Gdynia, Poland
80 PelRAC working groups 14-15 May Leiden
81 MedRAC 3-4 June Marseille 82 BSRAC Demersal & Pelagic WK 9 June Denmark
83 IEEP 8 June Brussels 84 WWFEPO 10 June Brussels 85 Green Party 15 June Berlin
86 ACFA - Plenary Session 17 June Brussels
87 BSRAC ExCom 22-23 June Finland
88 PelRAC working group I on reform 23 June Schiphol
89 EAPO Seminar on the Green Paper 26 June Bénodet - France
90 NSRAC ExCom 29-30 June Netherlands
91 SWWRAC - General Assembly 6-7 July Paris
92 NWWRAC 10 July Paris 93 ACFA - Ad-hoc Group on the Reform +
Danish Administration 8 September Copenhague
94 NWWRAC ExCom 8 September Madrid
95 Natural England 11 September Brussels
96 PelRAC GA and ExCom 16-17 September Amsterdam

EN Error! Unknown document property name. EN 8
97 ICSF - Small-scale fisheries, coastal communities and CFP Reform
28 September Brussels
98 PEW - WWF - Fisheries Secretariat - Ocean2012 - Dinner on US regional fisheries management
28 September Brussels
99 PEW - WWF - Fisheries Secretariat - Ocean2012 - Regional Fisheries Management Conference
29 September Brussels
100 AGLIA - La pêche et les institutions européennes
29 September Brussels
101 ClientEarth and Marine Conservation Society
30 September Brussels
102 BSRAC Conference on best practices 1 October Sweden 103 Federation of Irish Fishermen 9 October Dublin
104 ACFA - Groups 2 & 3 (Aquaculture & Markets)
13 October Brussels
105 PELRAC WGs 14 October Leiden, Netherlands
106 Eurocommerce 21 Ocotber Brussels
107 Seas at Risk 21 October Brussels
108 NWWRAC - AG 28 October Dublin 109 Inter-RACs Seminar 3-4 November Edimburg 110 Social Dialogue + Harvesting sector 5-6 November Split
111 Federación Nacional de Cofradías de Pescadores
7 November Madrid
112 ACFA - Ad-hoc Group 10 November Brussels
113 Trade Unions 12-13 November Málaga
114 Oceans Symposium 13 November Oxford
115 LPN (= ONG) 16 November Lisbon
116 SWWRAC - Executive Committee 19 November Madrid
117 XIV Jornadas de Pesca Celeiro 21 November Celeiro, Spain
118 PelRAC - Executive Committee 23 November Amsterdam
119 WWFEPO 24 November Brussels
120 ADAPI 3 December Lisbon 121 Natural England 8-9 December London 122 ACFA Plenary Session 9 December Brussels
123 Conférence Coopération regionale de l'océan Indien
10 December St Denis, Réunion
External events
124 Nordic Council of Ministers 1-3 July Isafjorden - Iceland 125 XIXth meeting of the European
Association of Fisheries Economists (EAFE)
6-8 July Malta
126 Conference "Efficient Fisheries Management - Fishing rights and flexibility"
27/28 August Reykjavik
127 ESIN - General Assembly 9 September Elba, Italy

EN Error! Unknown document property name. EN 9
128 World Fishing Exhibition 16-19 September Vigo
129 Nordic Council of Ministers 13 October Copenhague
130 Northern Norway 10 December Brussels

EN Error! Unknown document property name. EN 10
Events in 2010 When? Where? Conference organised by the Commission 1 Conference MARE/REGIO on innovation 19 October Vigo 2 Conference on the CFP Reform 16 November Brussels Thematic meetings organised by the Commission 3 Meeting with the stakeholders, Member States and
other Institutions on CFP Reform in general 19/20 January Brussels
4 Meeting with the stakeholders, Member States and other Institutions on Right-Based Management
25 January Brussels
5 Meeting with the stakeholders, Member States and other Institutions on Small-scale Fisheries
25 February Brussels
6 Meeting with the stakeholders, Member States and other Institutions on EFF and future financial perspectives
13 April Brussels
7 Meeting with the stakeholders, Member States and other Institutions on External Dimension
28 April Brussels
8 Meeting with the stakeholders, Member States and other Institutions on discards and selectivity
19 May? Brussels
9 Meeting with the stakeholders, Member States and other Institutions on technical conservation measures
21 June Brussels
10 Meeting with the stakeholders, Member States and other Institutions on Markets and Trade
7 July Brussels
11 Meeting with Member States and other Institutions on future EFF
8-9 December Brussels
Co-organised with the Spanish Presidency 12 Supply to the EU market of fishery and aquaculture
products 15 April Madrid
13 Conference on the CFP Reform 2/3 May La Coruña, Spain
MS Fisheries Administrations 14 IT - Ad-hoc Meeting 28/29 January Rome 15 SV - Seminar "Our seas, our fisheries - our food" 11 February Göteborg 16 HU - EFF OP annual examination 17 February Brussels 17 SV - 7th EFF Monitoring Committee Meeting -
European Fisheries Programme 24 March Hönö, Sweden
18 SV - FISKE 2020 8 July Brussels
19 PL - Common Fisheries Policy - opportunities and development perspectives
20 September Gdynia
20 HU - 1st Workshop of Landlocked Countries 25 - 26 October Budapest Szarvas
21 IE - Meeting with Mr. Cecil Beamish 4 November Dublin
22 Under BE Presidency: Improved Fisheries and Science Partnerships as Policy Drivers
9/10 November Ostend
MS Administrations other than Fisheries, regions and other events
23 Nordic Council in Parliament 27 January Copenhague 24 Researchers from the Scottish Parliament 16 February Brussels 25 Catalonia - One-day meeting on CFP Reform 16 february Barcelona

EN Error! Unknown document property name. EN 11
26 UK - Royal Institute of International Affairs "Achieving ecological sustainability through increased wealth generation of a reformed Common Fisheries Policy"
25/26 February London
27 5th European Annual Symposium EU Funds 2010 22-24 March Germany 28 Gobierno Vasco - "Nuevos modelos de gestión de la
PPC: experiencias para el desarrollo de los municipios pesqueros"
9 July San Sebastián
29 Istituto nazionale per il Commerico Estero - La pêche et l'aquaculture en Europe - L'organisation commune des marchés
12 October Brussels
European Institutions 30 European Economic and Social Committee 8 February Brussels 31 European Parliament - Plenary session with the
presence of Ms. Damanaki 25 February Brussels
32 European Parliament - Study visit by national parliaments' officials to PECH
26 February Brussels
33 European Economic and Social Committee 25 March Brussels 34 Council - Conclusions on the public consultation 19/20 April Luxemburg
35 S. Stevenson MEP - Fisheries Hearing 28 April Brussels
36 Informal Council of Ministers 4/5 May Vigo, Spain 37 EP in Sweden-Debate on the CFP Reform 27 May Gothenburg 38 EP - Inter-parliamentary Committee meeting with
National parliaments 1 June Brussels
39 Comité des Régions - PCP et développement de la Politique maritime intégrée
15 October Malte
40 EP - Public Hearing on "Conservation and Management of the fishery resources of the fleet in view of the reform of the CFP"
9 June Brussels
41 EP - Hearing on "Reform of the CFP: the external dimension (Fisheries Agreements)"
22 June Brussels
42 Council - Exchange of views on reform options 29 June Luxemburg
43 EP - Greens/EFA public hearing - Who should have the right to fish?
2 September Brussels
Stakeholders, including NGOs 44 German League for Nature and Environment (DNR)
and Forum for the Enviroment and Development with the European Enviromental Bureau - "Environmentally harmful subsidies - a real threat to biodiversity"
11 January Brussels
45 Seafood Summit 2010 31 January/1 February Paris 46 WWF 8 February Brussels 47 OCEAN2012 Coalition 9 February Brussels 48 EFTA Parliamentary Committee 23 February Brussels 49 External dimension seminar April Brussels 50 WWF & AIPCE-CEP 27 April Brussels 51 CRPM - Inter-commissions Pêche 17 May Brussels 52 Shellfish Association of Great Britain 25 May London 53 Meeting with the French industry (and
administration) 26 May Paris
54 Comité de Dialogue social sectoriel 2,3 June Bamio, Spain
55 Ocean2012 - CFP Reform Workshop 22 June Vilnius

EN Error! Unknown document property name. EN 12
56 WWF's Marine Breakfast Meeting 22 June Brussels
57 MED RAC 22 June Brussels 58 ACFA - Plenary meeting 1 July Brussels 59 Progetto FARO - Le Perspettive di Riforma della
Politica comune della pesca 9-10 July Ortona, Pescara
60 Commission with IIFET (International Institute for Fisheries Economics and Trade) - Policy Day - Fisheries Policy Reform in the European Union
17 July Montpellier
61 University of Santander - Fisheries sustainability in marine ecosystems
1-3 September Santander
62 Hanse-Office 15 September Brussels 63 European Center for Parliamentary Studies 29 September Brussels 64 Joint Workshop Pelagic RAC and ICES 29-30 September Amsterdam 65 PEW - Dinner dialogue on fisheries management 29 September Brussels 66 Baltic Sea 2020: Conference in Berlin on CFP 30 September Berlin 67 IEEP Fisheries Governance Workshop - October
2010 1 October Brussels
68 University of Corunna - Jornada sobre la reforma de la Política pesquera común
15 October Corunna
69 Seas At Risk - Low impact fisheries and CFP Reform
28 October Brussels
70 Westminster Food & Nutrition Forum Seminar 10 November London 71 IEEP Fisheries Governance Workshop - October
2010 15 November Brussels
72 European Center for Parliamentary Studies - International Symposium on Common Fisheries Policie
8 December Brussels
Other events 73 West Nordic Council 8 June Iceland

EN Error! Unknown document property name. EN 13
ANNEX 3 - SUMMARY TABLE O F THE PROBLEMS-SPECIFIC OBJECTIVES- REFORMS TOOLS AND OUTCOMES
Problems Specific objectives Reform tools Outcomes
Lack of environmental sustainability: Overfishing • Overcapacity. • A policy characterised
by micromanagement at the central level and by the lack of prioritisation of objectives.
• The existence of discards.
• Relative Stability. • Insufficient scientific
and economic data
Environmental sustainability • To eliminate overfishing
in the short term. • To reduce overcapacity
and discards as much as possible.
• To put in place a decision-making system consisitent with long term sustainability,
• flexible and adaptable to local conditions
• To improve responsibility and compliance by the industry.
• To improve the availability of scientific advise and economic data
Conservation and fleet policies • MSY strategy (including
rules for mixed fishery) • Fleet policy: Individual
Transferable Rights (with safeguards for SSF)
• Reduction of fishing pressure; ITR and regionalisation
• Active anti-discard policy (likely catch quota + discard bans).
Conservation • The continuous decline
of catches of the EU fleet has been stopped around 2015
• The UE fish stocks have been restored to their MSY
• Numerus fisheries stocks have grown (> 2010 size)
• The UE fleet is environmentally friendly and its size is adequate
Lack of economic sustainability • Economic performance
indicators for mane fleet segments are decreasing. The same goes to ancillary services. Processing and aquaculture perform better, but aquaculture production stagnates.
• The catching sector is very vulnerable to external shocks
• The CMO has been ineffective Public financial support has not improved economic performances
Economic sustainability • Increase the long-term
resilience of the sector. • Reorient public financial • Support towards
innovation, value added and marketing.
Economy • Subsidies • CMO reform
Economic • The production and
marketing chain offers full transparency from 'net to plate‘
• The EU fisheries sector has become far more financially robust
• The EU industrial fleet is performing and no longer dependant from subsidies
• The SSF continue to produce high quality fresh fish consumed locally and marketed under labels of quality and origin
• EU aquaculture industry is an important provider of fish to EU consumers
• EU aquaculture industry remains at the forefront of technological development and continue to export know-how and technology
Lack of social sustainability• Employment declines,
Social sustainability • To increase the quality
Social • Specific measures for
Social • The fisheries sector is

EN Error! Unknown document property name. EN 14
particularly in the catching sector,.
• Employment in the catching sector is not attractive for locals.
• Some fisheries-dependent coastal communities decline.
of employment (wages, safety and working conditions)
• To make it an attractive source of employment.
• To give alternative development options to coastal communities.
SSF and subsidies • Specific social measures
(safety & labour legislation).
• Improvements in environmental and economic sustainability should improve attractiveness
• Coherence with IMP and other coastal policies (jobs outside fisheries sector)
better integrated to the coastal economies
• The social attractiveness of the sector has been restored (in terms of job quality, level of wages and incomes, working conditions and training)
A very complex framework • Makes compliance
difficult and reduces industry responsibility
• Difficult to automatically incorprorate environmental considerations
A better governance • Simplify the CFP • Foster regionalisation
Governance • Regionalised approaches • Control regulation, IUU
regulation
Governance • The CFP has become
streamlined and is cheaper and simpler to manage
• Stakeholders fully participate in decisions and debates on policy implementation
• Fisheries control has become far more effective
An external dimension of CFP less effective than expected • Weak link between
FPAs and sustainable fishing in third countries and
• Lack of governance in the RFMOs
A more efficient dimension of the CFP • To review the division
of the costs of access to third countries' waters between public and private actors and to decouple the allocation of sectoral support to third countries from the fishing opportunities in their waters
• To improve international governance of RFMOs in order to achieve sustainable management of fish stocks, by 2020 with overcapacity reduced to levels commensurate with fishing opportunities, improved and streamlined compliance and control, reliable scientific advice and efficient decision-making (while maintaining consensus as the most preferable way of taking decisions).
External dimension • Next-generation
Fisheries Partnership Agreements between the EU and third countries
• EU involvement in RFMOs
External dimension • Outside Europe, the EU
promotes good maritime governance and responsible fishing
• The international governance (through the FPAs, RFMOs or the multilateral level is improved)

EN Error! Unknown document property name. EN 15
Factors beyond the CFP: Integrated Maritime Policy, Pollution, climate change,
EN Error! Unknown document property name. EN 16
ANNEX 4 - DESCRIPTION OF THE OPTIONS
1. The continuation of the current CFP (SQ Option) This option involves a continuation of the current CFP policies, including the 2002 regulation (2371/2002) and the newer regulations developed under it, including the various LTMPs, the Control Regulation and the IUU Regulation1. The SQ Option amounts to the CFP as it would be in place by January 2013. This option forms the baseline scenario to compare impacts of the different options for the reform.
Concerning overfishing, the SQ Option includes the continuation of current LTMPs for specific stocks, and the development of additional ones over the course of the 10 years from 2012. In particular, all LTMP in the pipeline or planned are assumed to be adopted by 2017. In addition, it is assumed that two more LTMPs will be adopted annually until 2017, a pace which seems to be in line with the development of scientific advice and the capacity of the Commission. Furthermore, it is anticipated that the ordinary legislative procedure under the Treaty of Lisbon (TEU, TFEU) would lengthen the time required for LTMPs adoption. As a result, 32 LTMPs are expected to be in place by 2017, up from the 22 at the beginning of 2010. It is also assumed that these LTMP will have FMSY or a proxy (F0.1) as the harvest control rule (HCR).
Regarding overcapacity, access rights policy, a patchwork of different types of rights-based mechanisms (TFSs) has developed across the EU for the management of quota stocks, some of which also include transferability. Other rights systems have been developed to manage non-quota stocks (e.g. transferable effort systems, territorial use rights). In the SQ Option the incremental development of this patchwork of rights would continue. Some MS have indicated recently that they will be moving towards such systems (Sweden, Poland), and it was assumed that this would actually happen.
Still concerning overcapacity, targets for fleet reduction are assumed to be in line with the EFF national operational programs, to be achieved by 2015. Otherwise, fleet size was assumed to decline at an average nominal rate of 2% per year. The evidence, from Denmark and from countries outside the EU, is that transferable rights systems result in significant and accelerated fleet rationalisation. Based on the Danish experience, the fleets of Sweden, Poland and Estonia (where transferable rights exist or will be put in place) were assumed to decrease by 30% before 2017.
Technological improvements are also counted. Recent studies of EU fleets suggest that the rate of technological improvement in fishing power varies between segments, depending on the current level of technology and incentives, and may be around 1% per year2.
Concerning the dependence on subsidies, the assumption was that the new EFF for years 2014-2020 will be equivalent to the current one in scope and size. Similar assumption was made with respect to the CMO policy and tariff regime.
Concerning governance, the assumption is that regionalisation will be based on the current Regional Advisory Councils (RAC).
1 It is relevant to refer also to the elimination since 2004 of aid for new vessel cosnstruction
2 R. Banks (RBL), S. Cunningham (IDDRA), W.P. Davidse (LEI), E. Lindebo (SJFI), A. Reed (RBL), E. Sourisseau (IDDRA), J.W. de Wilde. The impact of technological progress on fishing effort. The Hague, LEI, 2002, Report PR.02.01; ISBN

EN Error! Unknown document property name. EN 17
Regarding external dimension, the number of agreements would remain, and there would be no changes regarding RFMOs.
Concerning FPAs, their current scheme would be kept. However, fewer vessels would be involved due to suppression of fishing categories for which there is no scientific evidence of a surplus and to a "natural" decrease of the EU external fleet.
The following assumptions were also made:3
• Based on historical series and given the difficulty of anticipating the outcome of the interplay of the external and internal factors, it was assumed that fish prices will remain unchanged in real terms.
• Fuel prices are supposed to increase by 50%, which will be translated into a 45% increase in fuel costs for vessels (accounting for changes in behaviour) by 2012, in relation to the baseline period (2005-07).
• the control regulation will be partially effective and it will reduce the level of unreported catches, in any fishery in which they are currently estimated, by 65% of their current level.
• Finally, the current area exceptions, such as the Plaice box or the Shetland box, are to be maintained in its current form, and the legal structure will not be changed.
2. Option 1: Achieving environmental sustainability within a flexible time horizon in order to strike a balance between environmental, economic and social sustainability
As regards overfishing, Option 1 would aim to achieve MSY for all assessed fish stocks, but allowing a degree of flexibility regarding the date at which the target will be achieved in order to (a) attenuate the expected negative, short-term economic an social impacts of moving towards a fishing mortality level consistent with MSY (FMSY) and (b) account for the time required to get the missing scientific advice. This would be achieved by the following mechanisms:
– All current LTMPs would be changed to aim at the FMSY target. Inter-annual TAC reduction would need to stay within the 25% margin (maximum)4 included in the Commission’s Communication of 12 May 20095 .
– For stocks that are not included in LTMPs, the FMSY rule would be applied as long as their assessments are possible. For all currently assessed stocks, including those in LTMPs, the objective would be to reduce their fishing mortality to FMSY within a maximum of four years (i.e. by 2016), except where the 25% inter-annual TAC variation rule applies. For stocks for which assessments are not possible, assessments and the application of the agreed FMSY rule would take place over a period of eight years after the new CFP comes into effect (by the end of 2020), so that all these stocks are brought into the FMSY management regime in three batches (depending on the information available), each with a
3 Alternative SQ assumptions were also tested, including the effectiveness of the Control regulation, and
changes to fish and fuel prices. See Annex 4, pages 163-175.
4 This figure has been used for modelling purposes only and does not prejudge the possibility that the Commission could on occasions propose higher figures.
5 COMMUNICATION FROM THE COMMISSION Consultation on Fishing Opportunities for 2010 Brussels, 12 May 2009, COM(2009) 224

EN Error! Unknown document property name. EN 18
four year reduction in FMSY. By this mechanism all stocks will be assessed and FMSY achieved before the end of the period considered for this reform (2022)6.
– For stocks in multispecies fisheries, FMSY would be met only for the most valuable stocks, reflecting their socio-economic importance. The practical implication of such a rule is that roughly equal numbers of these species would be under- and over- exploited.
A positive impact on discarding is likely to result from some of the other policies, mainly the mixed fisheries rule, the move to TFSs (in particular the possibility of short-term leases of quotas) the increased effectiveness and efficiency of control, greater responsibility of the industry and the reinforced regionalisation.
Regarding overcapacity, TFS is the main tool to deal with it Under Option 1 the move to TFS would be mandatory for the large scale fleet, after a phasing-in implementation period of four years, in order not to overlap with the current EFF. For the SSCF the move to TFS would be optional. This system would both allow rights to be leased in the short term (i.e. annual fishing authorisations), or to be transferred to a new owner. Member States would allocate their national rights (as corrected through quota swaps) as they see fit. Transfers would be limited to within MS. The introduction of TFSs would be accompanied by a number of safeguards addressing issues such as concentration of rights and ring fencing of fishing rights allocated to fleet segments.
Fleet capacity reductions would result from already planned EFF reductions, or 2% per year if the EFF plans are not defined, up to 2015 (the last year in which the payments from the current EFF can be made). After that date the reduction in capacity would be achieved through trading of rights under the TFS system. Any fleet entering TFS will experience a reduction in size similar to that observed in the Danish case, by 10% per year over three years if the sector is unprofitable7 or is operating at less than 70% of its potential fishing days. The starting point for this decline will be as from 2016, and would last for three years (2016-2018). After 2018, the reductions will follow the SQ Option's assumption of a continuing decline at 2% per year.
Under the FMSY policy there will be heterogeneity in the rate of recovery for different stocks, which will lead to a variation in the timescale of changes in economic performance across fleet segments. It is reasonable to assume therefore that some segments will remain unprofitable for longer, depending on which stock(s) they target, and this lagging profitability could still trigger a second round of TFS uptake, albeit a modest one, even once all stocks are expected to have reached MSY.
Technological improvements will be counted as in the SQ scenario (1% per year). However, the percentage will increase to 2% per year in the fleets under TFSs, due to their increased profitability allowing for new investment in technology.
6 The model approaches this by assuming that these stocks have a similar current state (Fcurrent/Fmsy) to
similar assessed stocks, and will take similar trajectories as Fmsy policy is implemented. The assessed stocks currently have an Fcurrent/Fmsy ratio of 1-4, with low ratios generally being seen with pelagic stocks and high ratios with high value whitefish such as cod. Thus in this method we would assign an unassessed cod stock a high ratio of Fcurrent/Fmsy, and allow catches and biomass of the unassessed stock to follow the average future trajectory that we obtained from assessed stocks with this ratio of Fcurrent/Fmsy.
7 Defined as <10% profitability, at which point it is statistically probable that at least some vessels in the fleet are working unprofitably.

EN Error! Unknown document property name. EN 19
Regarding the SSCF, the experience of the Danish small scale fleet suggests that up to 30% of vessels may choose to enter TFS. This is modelled by assuming that 30% of the SSCF vessels experience the same trends in vessel numbers and capacity as the large scale fleets.
Regarding economic sustainability, there would be a far reaching reform of the CMO. The reform process would reinforce the role of both Producer and Inter-branch Organisations, in particular in the marketing (i.e. market interventions, market analysis, market standards) management and control of fishing activities, as well as placing and marketing of fisheries products). There would also be a revision of information provided to consumers (i.e. the scope and contents of mandatory and voluntary product labelling). No changes to the current tariff regime are assumed.
Concerning the dependence on public support, fleet subsidies including scrapping (current Axis 1) will be discontinued. This will also be helpful in the area of overcapacity. The new EFF would focus on two areas of intervention8:
• Smart green fisheries and aquaculture. This would cover measures fostering innovation, environment and knowledge. The type of actions to be supported would include: innovation in capacity building; innovation in technologies, processes, marketing and products – which do not increase fishing capacity or effort; incentives for selectivity, reducing environmental impacts, establishment of MPAs; safety; collective actions (industry, regional); and financial engineering (e.g. SME access to finance).
• Inclusive territorial development. This pillar would support socio-economic viability of coastal communities and would replace the current Axis 4, becoming more important than under the current EFF.
It is too early to have a clear view about the total future expenditure of the new financial instrument; however, for the purposes of this IA, it is assumed that the size of EFF-2 would be 70% of the current EFF (i.e. 70% of 4.3 billion Euro = 3 billion Euro). The amounts available to two main areas of intervention are assumed to be equal.9
Option 1 does not address any other forms of subsidies that may be used by MS to support the fisheries sector e.g. management costs, social security systems, other investment support, etc. The de minimis rule is assumed to continue unchanged.
The social sustainability component is mainly articulated around a differentiated regime for the SSCF, which would have a bearing on access to funding and TFSs. Such a differentiated regime would cover also the outermost regions. Most of the fleets in these regions are SSCF.
Under the future funding, the territorial development would benefit mostly SSCF through its focus on fishing dependent communities. The experience up to now demonstrates also the large potential of this approach for gender mainstreaming. Under smart green fisheries, SSCF will be mostly addressed in terms of aid-intensity and some measures addressing safety and working conditions.
8 It is likely that current expenses on control, data collection and governance (contributions to RACs) will
also be covered by the new Axis 1. However, for the purposes of the quantitative analysis whether they are or not included can be left open, because they will not result in any differential impact significant enough to be measured. The inclusion in the EFF-2 of current CMO and IMP expenses goes beyond the scope of the current IA.
9 Smart green axis (47.5% of total funds), territorial development axis (47.5%) and technical assistance (5%).

EN Error! Unknown document property name. EN 20
As stated under the access rights policy, the move to TFS in the SSCF would be voluntary, and various safeguards will be put in place to reconcile the expected economic benefits with social objectives relevant for the SSCF.
As regards simplification and administrative burden, in the area of regionalisation the EP and the Council will establish the targets, standards, timelines and wanted outcomes. However, the choices for detailed solutions would then be left to the Member States. They would implement the legislation having room for making reasoned choice in adapting the available management instruments to particular circumstances. MS will then be obliged to cooperate to reach agreement on coordinated, regionalized approaches, ensuring sufficient level of harmonization in implementation.
The Commission would have an auditing role with regard to the results to be obtained, instead of detailed legislation. This modality also would allow for more industry involvement in the choices for implementation, including forms of co-management by stakeholders.
The role of the RACs would be enhanced. Additionally the RACs would have better representation and more access to scientific support for their work.
In the external dimension, FPAs would remain the preferred framework for bilateral fisheries relations with third countries in the "South" and with Greenland. The costs of access to these countries' Exclusive Economic Zones would eventually be borne entirely by ship-owners, after a gradual phasing-out of the EU's contribution. The EU would retain the responsibility for negotiating the costs of access and the conditions associated with fishing, so as to ensure transparency and a level playing field for the European operators.
As of 2013, the transition period would start for each agreement as soon as its protocol expires and a new one enters into force. Every new protocol would provide for a stepwise linear decrease of the EU's contribution to access costs, until it reaches zero at the end of a transition period, in principle of four years. A longer transition period might be necessary for agreements with significantly larger EU payments under the SQ Option.
Shipowners' contributions would increase in parallel, without however reaching the level of the current total payment (EU and ship-owners' payments combined) for access costs in most cases. This is because the EU fleet as a whole is not economically capable to bear the current EU contributions to third countries10. Instead, it is assumed that the costs of access will eventually be fixed at a level close to what is paid for commercial licences.
With regard to mixed agreements, fishing categories other than tuna would be negotiated to the extent that they are environmentally and economically sustainable; otherwise they would be adapted or eliminated in the course of the regular renegotiation of the protocols to them.
It is not excluded that new agreements are concluded in the future with additional countries.
The EU would continue to provide financial support to third countries' sectoral fisheries policy. This support would be separated from access costs, and the criteria for its provision would be revised. In particular, rather than calculating the amount of support in proportion to access costs, it would be determined as a function of (a) the third country's needs as regards fisheries policy development, and (b) its capacity to absorb the support, given its institutional and macro-economic situation. It is assumed that a portion of the EU's savings made on access costs will be available for this revised scheme for sectoral support. This scheme would
10 See Annex 10.

EN Error! Unknown document property name. EN 21
also be phased in gradually, beginning with each new protocol negotiated after 2012 and reaching full effect when the EU’s access-cost payments have been fully phased out.
With regard to RFMOs, Option 1 would aim at enhanced involvement of the EU, with a view to strengthening RFMOs and bringing them in line with modern instruments and principles of responsible management of resources11. Some of these processes are currently ongoing, e.g. through the process of performance reviews of the RFMOs12. The EU, in cooperation with the international partners, would drive these processes forward. This would ensure consistency between the internal and external dimensions of the reformed CFP. RFMOs remain the main fora for global fisheries management and the benefits of enhanced involvement would be that the EU could continue being an increasingly significant player in RFMOs and therefore playing a leading role in their re-launching. A more integrated approach amongst EU policies should be sought; in order to ensure a sustainable management and defend EU economic interests, converging policies need to be further integrated with the EU action in RFMOs (development, trade, and environment).
It would be considered how the industry could contribute to the costs of involvement in RFMOs. Such payments could be based on a fee to register the vessels in the lists of authorised vessels in RFMOs13. The level of payment for shipowners from different Contracting Parties of RFMOs could be based on the general principles of payment for the obligatory contributions, which apply in most RFMOs, such as national wealth, reflecting the state of development, as well as the total catches taken.
It is assumed that a stronger involvement of the EU Commission and scientists from Member States in the scientific bodies of RFMOs as well as more investment in the field of research requires increased coordination by the Commission and clear and shared programming of activities. This would be essential to ensure that EU scientific views are represented at a level corresponding to the EU's economic and political weight.
Furthermore, the EU would push for a new approach on control and compliance in all RFMOs, where flag State, port State, coastal State and market State performances are closely scrutinised. The EU would also ensure that the global capacity level is commensurate with the available fishing opportunities, taking into consideration the legitimate aspirations of developing countries in this respect. Extra sources of funding, such as stakeholder payment, could be utilized to fund and coordinate specific programmes to the benefit of all parties.
The following additional assumptions are also made:
11 UNFSA, FAO Compliance Agreement, Code of Conduct, principles of ecosystem approach, science-based
decision-making, precautionary approach principle, etc
12 ICCAT: http://www.iccat.int/Documents/Meetings/Docs/Comm/PLE-106-ENG.pdf
CCSBT: http://www.ccsbt.org/docs/pdf/meeting_reports/ccsbt_15/report_of_PRWG.pdf
IOTC: http://www.iotc.org/files/misc/performance%20review/IOTC-2009-PRP-R%5BE%5D.pdf
NEAFC: http://neafc.org/system/files/performance-review-final-edited.pdf
SEAFO:http://www.seafo.org/The%20Commission/members-files2010/COMM/DOC%20COMM%2004%202010%20Performance%20Review%20Report10%20June%2010.pdf
13 See Annex 9

EN Error! Unknown document property name. EN 22
• As regards first sale prices the changes in fish price in real terms is assumed, in the model, to be 20% in Option 1; 10% in 2012, with the introduction of the new CMO direction, and 10% in 2016 as stocks recover, and 10% in Options 2, 3 and 4.
• The evolution of fuel prices is assumed to be the same as in the SQ option.
• The combination of new FMSY policy, the capacity reduction through the TFSs, and the reinforced cooperation at the regional level (allowing for better adaptation of technical conservation measures to the objectives of management) will improve compliance and reduce discarding. Discards will be reduced to 50% of their current levels and level of unreported catches to 95% of their current levels.
• All of the current exceptions, such as the Plaice and the Shetland boxes, are eliminated, as the evaluation shows they have had negligible environmental, economic and social effects.
• The legal structure of the CFP will be simplified.
3. Option 2: Achieving environmental sustainability without any flexibility regarding time horizon
As regards overfishing, no deviation from the four year implementation of Fmsy policy would be allowed, whether for assessed or not assessed stocks. This would mean that the assessment of these stocks would have to take place much earlier than is anticipated by current research and science delivery plans, incurring additional costs. No deviation from the 4 year reduction in fishing mortality would be allowed, even where the TAC variation would be greater than 25%.
In multispecies fisheries, all species are managed at FMSY level or below, i.e. the fishing effort would be determined by the most sensitive stock. This implies that about 66% of stocks in these fisheries would be underexploited by at least 20%.
A positive impact on discarding is likely to result from some of the other policies, mainly the mixed fisheries rule, the move to TFSs (in particular the possibility of short-term leases of quotas) the increased effectiveness and efficiency of control, greater responsibility of the industry and the reinforced regionalisation.
Regarding overcapacity, TFSs would be mandatory for the large scale fleet and remain optional for the SSCF, as in Option 1. However, transfer of rights would be possible across the EU, between MS and individual enterprises regardless of nationality. Such transfers would be introduced on a management unit basis during a 4 years phasing-in period. This means that, once the validity of rights expires, they would remain with the MS of the last rights holder. Consequently the concept of Relative Stability would become gradually irrelevant, as the transfer of rights between owners of different nationalities would affect their geographical distribution.
Changes in fleet size are the same as in Option 1. Additional reductions are likely to affect these national fleets losing rights to other MS, but the model do not allow for taking this effect into account.
Regarding economic sustainability, the CMO would be dismantled. In addition, Option 2 envisages a deregulation of the supply policy by extending tariff quotas and suspensions to all imported products, raw and processed.
Regarding the dependence on public financial support, there would be a complete cessation of EFF funding, and CFP objectives would be addressed through other structural funds (e.g. social objectives through the European Social Fund).

EN Error! Unknown document property name. EN 23
Social sustainability will also be articulated mainly around a differentiated regime for SSCF, but it would be limited to the voluntary nature of TFSs and accompanying safeguards.
Simplification and administrative burden will be addressed as in Option 1, including the enhanced role of RACs.
Concerning the external dimension, FPAs will be terminated as of 2013, as soon as the protocols of the agreements in force at that time expire. The fleet would have to bear its own access costs.
The EU would be the main leader in RFMOs for their transformation as the main instruments of good global governance of fisheries. This would translate into leadership on the provision of scientific advice, adoption of measures to significantly reduce fishing capacity as well as providing substantial support to developing States for capacity building either by direct funding, funding in the framework of Regional Programmes, or through RFMOs. This would imply a strong commitment from the Member States and industry to support the implementation of/adherence to enhanced RFMO management measures. As in Option 1, the industry would contribute to the costs of involvement in RFMOs.
The additional assumptions made are very similar to these under Option 1, with the only difference that the changes of fish prices in real terms are 10% by 2017. This is the result of upwards pressures resulting from improved results in environmental policy (in particular in terms of quality) and downwards pressures resulting from the elimination of the CMO and the full liberalisation of the trade policy.
4. Option 3: Achieving environmental sustainability within a time framework consistent with the minimisation of negative social impacts
This Option goes beyond Option 1 in terms of flexibility, particularly in the fields of MSY target date and the transition to TFSs.
The policy against overfishing is similar to Option 1, but allows smaller annual reductions in TACs as fishing mortalities are reduced. Thus the objective would be to reach FMSY in four years, as in Option 1, but allowing for a 15% inter-annual TAC14 variation, rather than 25%. As in Options 1 and 2, a positive impact on discarding is likely to result from the mixed fisheries rule, the move to TFSs (in particular the possibility of short-term leases of quotas) the increased effectiveness and efficiency of control, greater responsibility of the industry and the reinforced regionalisation.
Action against overcapacity are identical to those under Option 1, with the only difference that the phasing-in period for the introduction of TFSs will be five years.
Regarding economic sustainability, Option 3 would be equivalent to the SQ Option: the continuation of the Market Policy with some limited adjustment. Some form of markets interventions would remain, and organisation of the sector and normative structure would remain unchanged. The main change would come through better implementation and control within the market, including traceability.
Action in the area of the dependence on public financial support is equivalent to Option 1, but includes also be an emergency reserve released in exceptional situations, because the risk of stock collapse under Option 3 is the greatest, as the transition to environmental objectives is the longest among all the options.
14 This figure has been used for modelling purposes only and does not prejudge the possibility that the
Commission could on occasions propose higher figures.

EN Error! Unknown document property name. EN 24
The social sustainability component is the same as in Option 1 with the addition of an emergency reserve which might address social concerns associated with potential stock collapse.
As regards simplification and administrative burden, unlike Options 1 and 2, the regionalisation component will be limited to the expansion of the role of the RACs. RACs would be reinforced by increased representation of stakeholders and by improved scientific capacity of RAC working groups though increased funding.
Under Option 3, the external dimension would be the same as in Option 1 as far as the RFMOs are concerned.
For FPAs, under this option, shipowners would have to bear without any transition the entire cost of fishing rights for tuna agreements for each new protocol that would be negotiated as of 2013. In addition, mixed agreements would be terminated, also as of 2013, at the expiry of the protocols in force at that time.
The additional assumptions made are very similar to those under Option 1, with the only difference that the changes of fish prices in real terms are 10% by 2017. Contrary to Option 2, this is the result of upwards pressure resulting from the maintenance of the CMO and the trade regime and downwards or neutral pressure resulting from the worse environmental results as compared to Options 1 and 2.
5. Option 4: Achieving environmental sustainability within a flexible time horizon in order to strive a balance between environmental, economic and social sustainability without EU-led TFS
This option amounts to Option 1, but without active EU policy in favour of the implementation of TFSs. MS will be free to decide on implementing them or not, as in SQ.
Under Option 4, action against overfishing would be the same as under Option 1. The result of a lacking tools to address overcapacity – TFSs and EU funded scrapping – would be maintaining significant overcapacity even in the middle of the time period. This can tend to reduce compliance, which in turn may hamper the ability of the management system to achieve environmental sustainability.
Regarding overcapacity, the assumption is similar to the SQ scenario. However, the difference will be lack of fleet subsidies after 2015 under Option 4, nor for scrapping neither for modernisation. Therefore, the SQ assumption of continued 2% per year reductions in fleet size, and 1% per year increases in technological progress are unlikely to apply. Instead, it is assumed for any fleet not subject to TFS that there will be no reduction in fleet size and a small (0.5% per year) increase in fishing capacity.
It is further assumed that some fleets might enter TFS on a MS basis, following the example of other MS, but that they will choose to do this later than if there was an EU policy on TFSs.
Actions in the field of the economic sustainability will be the same as in Option 1.
The social sustainability componen will be practically non-existent as its two main elements – differentiated access to funding and TFS regime will not exist. Some social concerns might be addressed by intervention of other Structural Funds in the coastal communities dependent on fishing.
Simplification and administrative burden and the external dimension will be the same as in Option 1.

EN Error! Unknown document property name. EN 25
The additional assumptions made are very similar to those under Option 1, with the only difference that the changes of fish prices in real terms are 10% by 2017. This is the result of upwards pressure resulting from the reform of the CMO and the continuation of the trade regime and downwards or neutral pressure resulting from the significantly worse environmental results as compared with any other option.

EN Error! Unknown document property name. EN 26
ANNEX 5 - LIST OF INDICATORS Areas Indicators Environmental 1) Stock situation in terms of fishing mortality in relation to MSY
2) Percentage of stocks and/or catches covered by LTMP 3) Average size (length and weight) of fish 4) Fleet evolution 6) Area covered by protection regimes (Natura 2000) or special measures EU EEZ.
Economic 7) Gross valued added 8) Economic sustainability: Ratio current revenue-Break even revenue point 9) Net profit margin 10) Economic performance: Return on investment 11) Fish prices, market orientation 12) Level of subsidies
Social 13) Employment 14) Status of fisheries dependent communities/regions/ MS/EU 15) Value added dependency levels 16) Social sustainability: Gross value added per employee 17) Attractiveness of the sector: Distribution of incomes 28) Safety
Governance 18) Departure from quotas by Council (scientific advices in decision making) 19) Management costs for the sector 20) Regions and MS having adopting RBM system 21) Data provided by MS 22) Rate of utilization of allocations (quotas) 23) Level of quotas exchanges 29) Time taken to reach a decision
Coherence 24) Level of coherence with WTO and other EC policy Administrative burden 25) Impact for the private sector Simplification 26) Level of implementation simplification process by MS and industry External* 27) Governance of EC fishing activities in external waters Aquaculture 29) Development of Aquaculture
EN Error! Unknown document property name. EN 27
ANNEX 6 - MODELLING METHODS AND ASSUMPTIONS This annex describes the modelling methods and assumptions used in the analysis of impacts.
Two bioeconomic models (FLR-EIAA and BIRDMOD) were developed to assist with some aspects of the Impact Assessment. The full impact assessment makes use of model outputs and additional analyses, both qualitative and quantitative, to understand what the combined impacts of the various policy Options is likely to be.
These models are described in the following sections.
1.1. FLR-EIAA
Stock dynamic assumptions
The FLR-EIAA model was a combined bioeconomic model created specifically for this project using established FLR (Fisheries Library in R; Kell et al., 200715) code and the most recent version of the EIAA model (Economic Interpretation of ACFM Advice; Frost et al, 200916). This model is outlined below.
Twenty-one stocks were explicitly modelled in FLR. Stocks were projected from the most recent ICES assessment (2009, which provided their 2008 stock status) through 2022 with standard assumptions about recruitment (a geometric mean of the last 10 years) and other stock dynamic parameters, and relevant harvest control rules (HCRs). Projections were aligned with current regulations, such that calculated TACs in 2009 corresponded to the actual TACs set for 2009. These stocks are: Baltic herring 22-24 Cod 25-30 North Sea Plaice
Baltic sprat Cod northeast Arctic North Sea Saithe
Bay of Biscay sole VIIIab Eastern channel sole VIId North Sea Sole
Blue whiting Irish Sea sole VIIa Northern hake
Celtic Sea sole VIIfg North Sea Cod Southern hake
Central Baltic herring North Sea haddock North East Atlantic mackerel
Cod 22-24 North Sea Herring Western horse mackerel
In the SQ Option, it is assumed that long term management plans will be introduced for all species that the Commission currently has plans for. In addition to the current LTMPs, it was assumed that the following additional plans were implemented, using Fmsy as their targets, in the period 2010 – 2017. For the stocks that were explicitly modelled, we give below the date on which we assumed that LTMP would come into effect.
15 Kell, L. T., I. Mosqueira, P. Grosjean, J-M. Fromentin, D. Garcia, R. Hillary, E. Jardim, S. Mardle, M. A.
Pastoors, J. J. Poos, F. Scott, and R. D. Scott. 2007. FLR: an open-source framework for the evaluation and development of management strategies. ICES J. Mar. Sci. 64 (4):640-646.
16 Frost H, Andersen J.L, Hoff A and Thøgersen The EIAA model, methodology definitions and model outline, Institute of Food and Resource Economics, Report No, 200, 2009

EN Error! Unknown document property name. EN 28
Table 1 - Assumed year of implementation of LTMP for modelled stocks with planned LTMPs
Stock Year of Implementation
Herring Baltic Sea 2010
Sprat Baltic Sea 2010
Western Horse Mackerel 2011
Furthermore, it was assessed that by 2017 LTMPs will exist for about 32 stocks, compared to the 22 at present and slightly more than the number of analytically assessed stocks (about 30).
Further assumptions were required about discard mortality, the level of unreported fishing (compliance with regulations) and an allowance for relatively poor governance through a lag in implementation of regulations. These three issues reflect the situation as currently seen with LTMP stocks. The SQ assumptions were
• Discarding is reduced, in LTMPs under the SQ, by only 5% of its current level, because of a lack of discard policy
• Unreported catches are reduced, in LTMPs under the SQ Option, by 65% of their current level as the Control Regulation becomes effective, particularly combined with the JDPs now demonstrating an impact in particular fisheries.
• If a management plan is in place, with no significant overcatch, changes in the catch were assumed to lag behind reductions in the TAC by two years. There was no lag in implementation if the TAC was increased.
For stocks that are of key importance to fleets, but for which explicit age-structured assessments and models do not exist, future trends were either assumed to be constant (i.e. at 2009 TACs and stock size) or, in the case of Nephrops and anglerfish, some extrapolation of current trends in stock size and biomass were made. These stocks are: Anglers IV Nephrops IIa, IV (EU zone) Nephrops Vb, VI
Anglers VIIb-k and VIII a, b, d (2 species) Nephrops IIIa, IIIbcd Nephrops VII
For Options 1-4 we assumed that significant benefits to compliance and discarding would occur from the combination of new Fmsy policy, the RegBods and for Options 1-3 from the capacity reduction arising from the implementation of TFSs. Consequently we made the following changes
• increase the level of discard reduction to 50% in all Options, resulting from better discard practice under RegBod or strengthened RAC governance and TFSs, which is likely to result in a decline in over-quota catches and highgrading.
o Note that the large decline in discarding that would be associated with a move to a catch quota system (new mesh sizes, changes in regulations on landing size, requirements for observation on vessels) is explored separately in the impact assessment for Option 2. Due to the difficulty of predicting the responses of individual stocks within multispecies complexes this example was not extrapolated to the whole of the EIAA model.
• change the level of unreported catches to experience a 95% reduction on previous levels arising from changes to governance and TFSs
• eliminate the lag period between decision and implementation, again as a result of improved governance

EN Error! Unknown document property name. EN 29
The biggest challenge with the new Options is the requirement that all stocks move to Fmsy. The majority of EU stocks are currently unassessed, and therefore moving them to Fmsy harvest control rules is problematic. We have approached this by assuming that these stocks have a similar current state (Fcurrent/Fmsy) to similar assessed stocks, and will take similar trajectories as Fmsy policy is implemented. The assessed stocks currently have an Fcurrent/Fmsy ratio of 1-4, with low ratios generally being seen with pelagic stocks and high ratios with high value whitefish such as cod. Thus in this method we would assign an unassessed cod stock a high ratio of Fcurrent/Fmsy, and allow catches and biomass of the unassessed stock to follow the average future trajectory that we obtained from assessed stocks with this ratio of Fcurrent/Fmsy.
0.00
1.00
2.00
3.00
4.00
5.00
6.00
7.00
8.00
9.00
10.00
2000 2005 2010 2015 2020 2025
B/B 2
008
Yearcod_2224 cod_2532 cod_NEA cod_NSherr_NS hke_N hke_S mac_NEAple_IV sai_NS sol_NS sol_VIIasol_VIId sol_VIIfg sol_VIIIab whb_com
Figure 1 - Trajectory of biomass in modelled stocks with the implementation of Fmsy policy in 2013 under Option 1

EN Error! Unknown document property name. EN 30
0.00
2.00
4.00
6.00
8.00
10.00
12.00
2000 2005 2010 2015 2020 2025
F/F 0
.1
Yearcod_2224 cod_2532 cod_NEA cod_NS herr_NShke_N hke_S mac_NEA ple_IV sai_NSsol_NS sol_VIIa sol_VIId sol_VIIfg sol_VIIIabwhb_com sol_VIIa sol_VIIfg
Figure 2 - Trajectory of fishing mortality (F) in modelled stocks with the implementation of Fmsy policy in 2013 under Option 1
0
500
1000
1500
2000
2500
2000 2005 2010 2015 2020 2025
TAC ('0
00 t)
Yearcod_2224 cod_2532 cod_NEA cod_NS herr_NShke_N hke_S mac_NEA ple_IV sai_NSsol_NS sol_VIIa sol_VIId sol_VIIfg sol_VIIIabwhb_com sol_VIIa sol_VIIfg
Figure 3 - Trajectory of TAC in modelled stocks with the implementation of Fmsy policy in 2013 under Option 1

EN Error! Unknown document property name. EN 31
There is a difference in the timing of implementation of conservation policy between Options 1-4. Under Option 1 we assume that all assessed stocks move to Fmsy over a 4 year period, unless limited by the 25% interannual TAC variation rule, and 30% of unassessed stocks have science developed and reach Fmsy in each of the years 2016, 2018 and 2020. Under Option 2 we assume that all stocks reach Fmsy in 2016. Under Option 3 we assume the same as Option 1, except for the 15% interannual TAC variation rule.
Under Option 4 we assume that although the objective is to achieve Fmsy within the same time frame as Option 1, in reality there is likely to be a slight reduction in compliance in the medium term, as a result of the much fewer fleets entering TFS-stimulated reductions (see text below) in capacity in 2016, even though in the short term (2012-2015) capacity reduction is supported by EFF Axis 1. Thus in the medium term it is unlikely that TAC reductions of 25% will be achieved for assessed stocks. We therefore use the same assumptions for stock trajectories as under Option 3 (i.e. a maximum 15% interannual TAC variation).
Options 1-4 contain two different approaches to multispecies fisheries: adOption of a socio-economic optimum (managing the fishery to ensure Fmsy for the most valuable species); or adOption of a conservation optimum (managing the fishery ensure Fmsy for the most vulnerable/sensitive species). Undertaking such modelling for all available multispecies fisheries in the EU would be beyond the scope of this project, because it is not simply a biological problem, but also clearly a socio-economic one requiring full analysis of the behaviour of individual metiers of the fleet. However, analysis of this problem suggested that in the socio-economic optimum, roughly equal numbers of species would be under- and over- exploited. Thus for Options 1, 3 and 4 the analytical result obtained above by managing to Fmsy for all stocks was retained. For Option 2, analysis suggested that about 2/3 (66%) of stocks in multispecies fisheries would be underexploited by at least 20%. Accordingly, in the EIAA model, the catch of 2/3 of the stocks judged to be in multispecies fisheries were reduced by 20% in 2017 and 2022 to reflect their underexploitation in this state.
Economic considerations
The results of these projections – stock size, exploitation rate, catches, quotas, and average age in the stock over the period 2007 – 2022 – were used to drive a modified EIAA model.
The EIAA model takes as its inputs variables for each vessel segment: gross vessel earnings as determined by annual volume of catches per species and price of those species, fuel costs, other variable costs (which vary as a function of gross sales or effort), crew share, fixed costs (constant costs such as maintenance, insurance and administration), depreciation and catch data (weight and value) for the top 5 species. Other variables include employment, capital costs and vessel characteristics (GT, kW and effort).
57 fleets were included in the model, with between two and eight fleets per country depending on the relative size of GVA and employment in each Member State (MS). These fleets represent on average more than 80% of the value-added for MSs (58%-100%) and on average more than 70% of employment for MSs. Fleets proposed represent a good balance of vessel sizes (14 of 0-12m, 15 of 12-24m, 16 of 24-40m, and 12 of 40+m).
The approach taken to select the fleet segments was as follows:
• Review total value of landings, GVA, employment, and number of vessels for each MS as available in the AER data.
• Rank fleets in each MS by value of landings, GVA, employment, and number of vessels.
• Select the most important fleets in each MS based on GVA and employment.

EN Error! Unknown document property name. EN 32
• Calculate the contribution of the fleets selected in each MS to the total a) GVA and b) employment in that MS, to ensure that the fleets provide sufficient coverage
Indicate the main species caught by each fleet in value terms (to assist with the validation of the stocks proposed for modeling).
The linkages between the FLR and EIAA models were stock size (Spawning Stock Size) and TAC (Figure 4).
Figure 4 - Schematic diagram of the linkages between components of the FLR-EIAA model We estimate upstream and downstream multipliers as part of the modelling exercise in Section 4, with a methodology described in section 4.2.1. Downstream processing multipliers (GVA and employment) were assumed to respond to changes in the income from catches, and upstream ancillary multipliers to respond to the size of the fleet.
The EIAA model had the following features:
(a) Calculations of the expected changes in effort required for each sector in each of the years 2012, 2017 and 2022 arising from increasing quotas and stock sizes, based on their catch composition in the reference period 2007-2009. The standard stock flexibilities for different species were used, as estimated by STECF (0.8 for demersal species, 0.1 for pelagic species), and the uptake ratios calculated from the reference period were maintained.
(b) Fish prices were calculated individually by species and sector. Price flexibilities (the relationship between supply volume and price) were assumed to be 0.2 for all species unless other values could be derived from the literature.
Species Flexibility Species Flexibility Species Flexibility
Herring 0.3 Norway lobster 0.2 Turbot 0.3
Anchovy 0.6 Northern prawn 0.2 Lemon Sole 0.2
Cod 0.35 Plaice 0.25 Dab 0.2

EN Error! Unknown document property name. EN 33
Species Flexibility Species Flexibility Species Flexibility
Megrim 0.2 Pollack 0.2 Skates and rays 0.2
Anglerfish 0.2 Saithe 0.2 Norway pout 0.2
Haddock 0.4 Mackerel 0.4 Sandeel 0.2
Whiting 0.3 Common sole 0.5 Atlantic salmon 0.2
Hake 0.4 Sprat 0.2 Other 0.2
Blue whiting 0.2 Horse mackerel 0.2
(c) All prices, costs and values are expressed in real terms (i.e. with no inflationary component) relative to the reference period (2005-2007). In some sensitivity scenarios fish and fuel prices were raised/lowered.
(d) Variable costs were adjusted in proportion to fleet size, whereas fuel costs were adjusted in proportion to effort.
(e) Crew share was defined as a percentage of the gross revenue less variable costs (fuel and running costs). This covers payments to crew members, including the skipper. The percentage relevant to a particular sector was derived from historic crew share calculations. Note that the default EIAA model calculates future wages by maintaining the ratio of average wage to turnover in the reference period. This calculation differs to the standard share remuneration system, and does not allow for the independent performance of the various components of costs to be modelled effectively.
(f) In addition to crew share, the following were calculated: Gross value added, net profit, return on investment.
Fleet trend assumptions
In the SQ Option, fleet size from 2007 to 2015 (the final date allowed for fleet reductions under the EFF) was modified according to current trends and MS declared objectives for fleet reductions (informed by use of the fuel package by some MS for Fleet Adaptation Schemes17) except where TFSs were implemented in a few fleets. At the end of this period, and for fleets where MS had not explicitly defined fleet decommissioning schemes in their EFF plans, an average 2% per year decline was assumed. Increases in technological development (“effort creep”) were introduced through assuming a 1% per year increase in vessel capacity. Reference levels of fleet size, number of days fishing per vessel per year, and employment (FTE) were calculated.
In some cases increasing catches and declining fleet size led to an increase in the number of days fishing that each vessel would have to undertake in a year. Examination of AER data indicated that the maximum number of days that vessels should be able to fish was 190 days for vessels in the 00-12m class, 220 days for vessels 12-24m, 250 days for 24-40m and 290 days for 40m+ vessels. When average days at sea per vessel reached these levels, vessel numbers were increased.
Experience obtained in various European TFS systems (ITQ and ITE) appears to suggest that they are accompanied by a rapid reduction in fleet size at the time that they are implemented, but that this may last for only 3 years, at rates of about 10% of vessels per year. This is higher than the normal rate of fleet reduction under MAGP and Entry / Exit regime (2%) both
17An emergency package of measures to tackle the fuel crisis in the fisheries sector. An ad hoc special, temporary regime which will derogate from some provisions of the European Fisheries Fund (EFF) regulation for a limited period (up to the end of 2010).

EN Error! Unknown document property name. EN 34
supported by structural aid for leaving the fleet register (decommissioning, support to joint-venture until 2004).
• Spain ITQ: 7.5% p.a. reduction over 5 years up to 1997, then 1.2% reduction after this18
• Estonia ITQ and ITE: 8% p.a. reduction over 5 years up to 2001, then slower1920
• Denmark demersal ITQ: 15% reduction over one year, with further 30% reduction in active capacity2122
• Norway23:
‐ pre-ITQ 1990-2001, reduction in vessel numbers and employment 3.5% p.a.
‐ initial ITQ period: 2001-2005 (with ITQ) reduction in vessel numbers 10.1% p.a., capacity 1.7%, employment 6.1%
‐ later ITQ period: 2005-7 vessels 3.9%, capacity 0.9%, employment 3.6%
Experience has also shown that where fleets undergo restructuring, the least efficient vessels are removed and the most efficient vessels retained, so leading to an increase in efficiency across the fleet as a whole. This has been demonstrated by the Norwegian cod trawl fleet, in which a decrease in horse power lagged behind the reduction in vessel numbers following implementation of the Structural Quota Scheme (SQS). In this case, the eventual declining trend in total horsepower was delayed by around three years24.
Furthermore, ITQ/E-induced restructuring appears to be most likely where sectors of the fleets are unprofitable or where they are fishing for relatively few of their available days (for instance if a fleet is fishing for only 100 days of the year per vessel when it would normally be able to fish for 250 days of the year, weather permitting). These are indicators of overcapacity.
We have translated this experience into the following assumptions about the relationship of TFSs to capacity.
• All fleets undergo current planned EFF reductions, or 2% per year if the EFF plans are not specified, up to 2015.
• In the SQ and Option 4, only certain nominated fleets enter TFS (Poland, Estonia, Sweden – Denmark and the Netherlands already have TFS systems – and some other potential exceptions – see below). In Options 1-3 all LSF enter TFS, and some of the
18 OECD (2004) Further Exmination [sic] of Economic Aspects Relating to the Transition to Sustainable Fisheries – A Case
Study of Spain, France, OECD.
19 Ulmas, H. (2003) The Cost of Fisheries Management in Estonia. Tokyo, The United Nations University.
20 European Commission (2009) Facts and Figures on the EU Fishing Fleet – Estonia (internet). Available at URL: http://ec.europa.eu/fisheries/fleetstatistics/index.cfm?ctyCode=EST (accessed: 19/03/2010).
21 Ministry of Food Agriculture and Fisheries (2009) Annual Report on Fishing Fleet Capacity 2008 – Denmark. Denmark, Ministry of Food Agriculture and Fisheries.
22 MRAG Consortium (2007) An Analysis of Existing Rights Based Management (RBM) Instruments in Member States and on Setting up Best Practices in the EU: Part 2. London, EC – MRAG.
23 Directorate of Fisheries: Norway (2010) Norwegian Fishing Vessels, Fisherman and Licenses (internet). Available at URL: http://www.fiskeridir.no/english/statistics/norwegian-fisheries/norwegian-fishing-vessels-fishermen-and-licenses
24 Danielsen, J F. (2010) Introduction of RBM in Norway [workshop presentation]. Brussels, DG MARE.

EN Error! Unknown document property name. EN 35
SSCF depending on their choice. For Options 1-3, any fleet entering TFS will experience an immediate reduction in size by 10% per year over 3 years if the sector is unprofitable (defined as <10% profitability, at which point it is statistically probable that at least some vessels in the fleet are working unprofitably) or is operating at less than 70% of its potential fishing days, in 2012. The start point for this decline will be after the end of the EFF decommissioning schemes, for which the last year will be 2015, i.e. 2016, and lasting for 3 years (2016-2018). Following this time the reductions will follow the SQ assumption of continuing decline at 2% per year.
• Under Fmsy policy there will be heterogeneity in the rate of recovery for different stocks, which will lead to a variation in the timescale of changes in economic performance across fleet segments. It is reasonable to assume therefore that some segments will remain unprofitable for longer, depending on which stock(s) they target, and this lagging profitability could still trigger a second round of TFS uptake, albeit a modest one, even once all stocks are expected to have reached MSY.
• In Option 4 it is assumed that the SQ situation pertains for most fleets, with the following exceptions:
o For all the fleets, there will be no fleet decommissioning or modernisation support after 2015, although there would be some support for innovative green technology developments under the “smart green fisheries” axis. The SQ assumption of continued 2% per year reductions in fleet size, and 1% per year increases in technological capacity, are unlikely to apply when Axis 1 subsidies are removed. Instead, we assume for any fleet not subject to TFS that there will be no reduction in fleet size and a small (0.5% per year – see below for rationale) increase in vessel fishing capacity.
o For Option 4 it is assumed that some other fleets might enter TFS on a MS basis, following the example of Denmark, Sweden, Estonia, Poland and the Netherlands, but that they will choose to do this later than if there was an EU policy for compulsory TFSs. From the review of MS responses to the Green Paper consultation, and from their current close relationships with those MS listed above which have implemented TFSs, it would appear that perhaps some fleet segments in Spain and Germany would be favourably disposed to TFSs even in the absence of an EU-wide mandatory application for the large scale fleet.
o Thus, for Option 4 we assume that the large scale fleet in Spain and Germany will enter TFS, but will make this decision based on their profitability or operating capacity (defined as <10% profitability or <70% of potential fishing days) considering the situation in 2017, rather than 2012 as in Options 1-3. These fleet would follow the same trajectory as for the SQ Option and Options 1-3 TFS fleets, i.e. an immediate reduction in fleet size by 10% per year over a 3 year period starting in 2018.
• Any fleet not undergoing 10% decline per year under an TFS scheme will revert to 2% per year (i.e. the assumption is that even an TFS fleet will hold this general level of decline after its initial rapid decline, and in any case all fleets not in TFS will conform to this reduction).
• Accounting for technological improvements. The result of decommissioning and TFS removals of vessels, and technological advancements through investments by more

EN Error! Unknown document property name. EN 36
profitable vessels, will mean that for any TFS fleet, individual vessel capacity will increase, at a rate that is modelled as 1% per year under normal circumstances and 2% per year under conditions of rapid buy-out associated with the 3 years of TFS fleet reductions. The continuation of EFF Axis 1 funding assumed under the SQ Option means that the same 1% increase in capacity would apply to non-TFS fleets under the SQ Option. However, non-TFS fleets in Option 4 would not experience the same level of improvement (see above: our assumption of 0.5% improvement).
• In Options 1-3 the SSCF also has the Option of entering TFS. We assume that under Option 4 none of them will enter TFS. The experience of the Danish small scale fleet suggests that 30% of vessels in this sector may do so. This is modelled by assuming that 30% of the vessels in small scale fleets meeting the capacity triggers in the first bullet experience the same trends in vessel numbers and capacity as the large scale fleets.
Price assumptions
The SQ assumption for fish prices is that they stay the same, in real terms, as the baseline period 2005-07.
There are two aspects of the reform that are expected to deliver increased prices. The first is the direct impacts from the use of market policy, and the other is the indirect impacts associated with increasing environmental stability.
Gains to prices are expected to be strongest with the re-direction of CMO policy in Option 1, but also positive with its retention in Option 3. A decline in prices is anticipated in Option 2 with the removal of tariffs and the CMO.
Gains to real prices can be expected from environmental policy in several ways. Firstly, the size of fish in the stock, and in the catch, will increase as stocks recover, delivering slightly increased prices. Increased prices can be expected as the image of fishermen as custodians of the sea improves, particularly resulting from increasing stocks but also, in Options 1 and 2, arising from lower rates of discarding with the increased uptake of TFSs and activities of strengthened regional bodies. There are also likely to be differences in the times at which these increases are seen, associated with the differences in timing of stock recovery. Increases in catches could reduce first sale prices in accordance with the above price flexibilities but it is likely that substitution effects (for instance, gaining back markets lost to other products) could compensate for such price decreases.
Taken overall, the changes in fish price in real terms is assumed, in the model, to be 20% in Option 1 (10% in 2012, with the introduction of the new CMO direction, and 10% in 2016 as stocks recover), and 10% in Options 2, 3 and 4.
Fuel prices are almost certain to return to the levels seen in 2008 by 2012, and perhaps to greater levels. An analysis of the 2008 AER data shows that although fuel price increased by 40% in 2008 compared to 2005-2007, the increase in fuel costs experienced by vessels was 35%. This difference is due to the tendency of vessels to change their fishing patterns and behaviour as fuel prices increase, with strategies designed to minimise fuel use (e.g. fishing closer to home ports or landing closer to fishing grounds, switching to use of other gears like from trawl to Danish seine).
There are already signs that fuel price is increasing once again, and we anticipate that it will reach the peak experienced in 2008 by 2012. This peak was a 50% increase on 2005-2007 levels. Taking into account the experience in 2008, we assumed that in 2012 and afterwards,
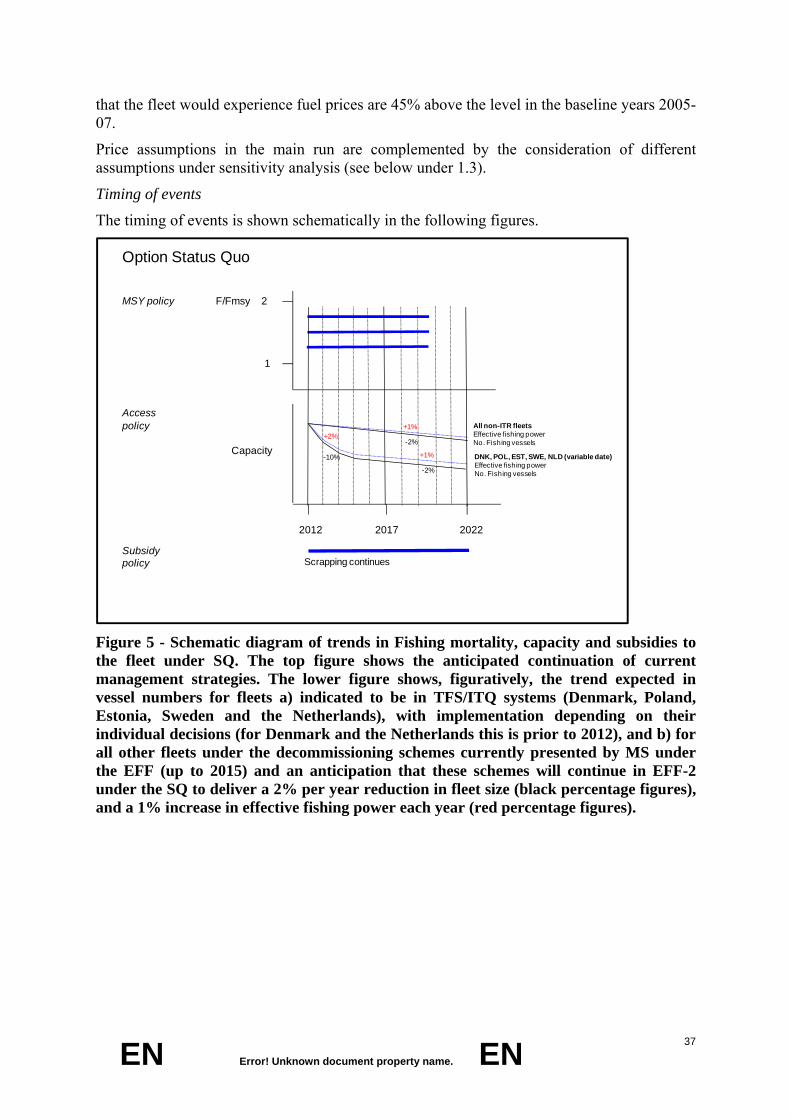
EN Error! Unknown document property name. EN 37
that the fleet would experience fuel prices are 45% above the level in the baseline years 2005-07.
Price assumptions in the main run are complemented by the consideration of different assumptions under sensitivity analysis (see below under 1.3).
Timing of events
The timing of events is shown schematically in the following figures.
F/Fmsy 2
1
Capacity DNK, POL, EST, SWE, NLD (variable date)Effective fishing powerNo. Fishing vessels
2012 2017 2022
MSY policy
Access policy
Subsidy policy Scrapping continues
Option Status Quo
All non-ITR fleetsEffective fishing powerNo. Fishing vessels
+1%
-2%
-10%
+2%
+1%
-2%
Figure 5 - Schematic diagram of trends in Fishing mortality, capacity and subsidies to the fleet under SQ. The top figure shows the anticipated continuation of current management strategies. The lower figure shows, figuratively, the trend expected in vessel numbers for fleets a) indicated to be in TFS/ITQ systems (Denmark, Poland, Estonia, Sweden and the Netherlands), with implementation depending on their individual decisions (for Denmark and the Netherlands this is prior to 2012), and b) for all other fleets under the decommissioning schemes currently presented by MS under the EFF (up to 2015) and an anticipation that these schemes will continue in EFF-2 under the SQ to deliver a 2% per year reduction in fleet size (black percentage figures), and a 1% increase in effective fishing power each year (red percentage figures).

EN Error! Unknown document property name. EN 38
F/Fmsy 2
1
Capacity
2012 2017 2022
MSY policy
Access policy
Subsidy policy Scrapping continues
(but current scrapping plans EFF by MS will pertain until 2015)
25% TAC variation constraint
Option 1
+1%
-2%
-10%
+2%+1%
-2%
All ITR fleets except DNK...NLDEffective fishing powerNo. Fishing vessels(DNK...NLD follow SQ trajectory)
All non-ITR fleetsEffective fishing powerNo. Fishing vessels
Figure 6 - Schematic diagram of trends in Fishing mortality, capacity and subsidies to the fleet under Option 1. The top figure shows the anticipated 4 year decline in fishing mortality to Fmsy for all assessed stocks (green) except where the decline would create an interannual TAC variation of greater than 25%, and the blue lines show the trends expected for the unassessed stocks as they move in three separate time periods along the 4-year Fmsy pathway. These time periods reflect the time taken to develop assessments and management advice for the stocks. The lower figure shows, figuratively, the trend expected in vessel numbers for a) fleets not entering TFSs and b) unprofitable TFS fleets or TFS fleets operating at fewer than 70% of their available days which are expected to undergo a reduction in fleet size. The dotted line shows the trend in capacity/fishing power that accompanies the reduction in vessel numbers, with legend as in the previous figure. Trends up to 2016 follow MS operational plans under the current EFF, or to have entered TFSs already in the case of DNK, SWE, EST, POL and NLD (these latter trajectories are not shown on this figure)

EN Error! Unknown document property name. EN 39
F/Fmsy 2
1
Capacity
2012 2017 2022
MSY policy
Access policy
Subsidy policy Scrapping continues
(but current scrapping plans EFF by MS will pertain until 2015)
Option 2
+1%
-2%
-10%
+2%+1%
-2%
All ITR fleets except DNK...NLDEffective fishing powerNo. Fishing vessels
All non-ITR fleetsEffective fishing powerNo. Fishing vessels
Figure 7 - Schematic diagram of trends in Fishing mortality, capacity and subsidies to the fleet under Option 2. Legend as with Figure 5.
F/Fmsy 2
1
Capacity
2012 2017 2022
MSY policy
Access policy
Subsidy policy Scrapping continues
(but current scrapping plans EFF by MS will pertain until 2015)
15%
Option 3
+1%
-2%
-10%
+2%+1%
-2%
All ITR fleets except DNK...NLDEffective fishing powerNo. Fishing vessels
All non-ITR fleetsEffective fishing powerNo. Fishing vessels
Figure 8 - Schematic diagram of trends in Fishing mortality, capacity and subsidies to the fleet under Option 3. Legend as with Figure 5.

EN Error! Unknown document property name. EN 40
F/Fmsy 2
1
Capacity
2012 2017 2022
MSY policy
Access policy
Subsidy policy Scrapping continues
(but current scrapping plans EFF by MS will pertain until 2015)
15%
Option 4
+.5%
-0%
-10%
+2%+1%
-2% All ITR fleets except DNK...NLDEffective fishing powerNo. Fishing vessels
All non-ITR fleetsEffective fishing powerNo. Fishing vessels
+1%
-2%+.5%
-0%
Figure 9 - Schematic diagram of trends in Fishing mortality, capacity and subsidies to the fleet under Option 4, where after 2016, in the absence of decommissioning through EFF-2, fleets are expected to continue at present sizes unless they decide, on a MS basis, to enter TFSs which we assume to be at a later stage than in Option 1. Other aspects of legend as with Figure 5.
1.2. HDA-BIRDMOD BIRDMOD lends itself ideally to the exploration of multispecies fishery issues. A BIRDMOD model for Sicily and GSA 17, two of the most important fishing areas in the Mediterranean, was implemented. The model covers two management areas (GSA-10 and GSA-16), 8 Italian fleets and 10 species for Sicily, while 10 Italian fleets and 10 species are covered under GSA 17.
BIRDMOD25 was implemented without the age structured Aladyn model described in Prellezo et al (2009)26. Instead a biomass-dynamic production model was implemented, fitted to the latest stock assessments available from SG-MED27 (based on data from MEDITS and GRUND Programmes). A few adjustments have also been applied to the economic module for estimating additional indicators specifically requested for this study. The new version of BIRDMOD, named the HDA model, was implemented to cover
25 IREPA. – 2005. A working proposal for the economic and biological data collection of the small scale fisheries.
Workshop on Small Scale Fisheries. Kavala, Greece 12th-16th September 2005. Accadia, P. and M. Spagnolo. – 2006. A bio-economic simulation model for the Italian fisheries. 13th IIFET Conference: “Rebuilding Fisheries in an Uncertain Environment”, Portsmouth, UK, 11-14 July 2006.
26 Prellezo, R., Accadia, P., Andersen J. L, Little, A., Nielsen R., Andersen, B.S., Röckmann C., Powell J. and Buisman, E. (2009) Survey of existing bioeconomic models: Final report. Sukarrieta: AZTI-Tecnalia. 283 pages. 27 Report of the SGMED-09-02 Working Group on the Mediterranean Part I. 8-12 JUNE 2009, Villasimius, Sardinia,
ITALY

EN Error! Unknown document property name. EN 41
• 6 fleets operating in GSA 16 and 8 fleets (2 of them located outside Sicily but exploiting the same stocks) operating in GSA 10 (south and north of Sicily, respectively) (purse seine 12-24m, longline 12-24m, small fishery <12m, demersal trawlers 12-24m and 24-40m, passive polyvalent 12-24m, polyvalent 12-24m). These fleets operate within a variety of mixed fisheries, targeting both demersal and pelagic stocks. The demersal species included in the model for simulating landings and revenues are European hake, nephrops, striped mullet, red mullet, deepwater rose shrimp, giant red shrimp, and blue and red shrimp. Pelagic species are European anchovy, European pilchard, swordfish and bluefin tuna. With the exception of the fisheries for swordfish and tuna, all other fisheries are regulated by effort control and mesh size, the latter being determined by the Mediterranean Regulation (Council Regulation (EC) No 1967/2006).
• 10 fleet segments operating in GSA 17: demersal trawlers <12, demersal trawlers 12-24m and 24-40m, beam trawlers 12-24m and 24-40m, pelagic trawlers and seiners 12-24m and 24-40m, polyvalent passive <12, vessels using hooks 12-24m and dredges 12-24m. These fleets operate within a variety of mixed fisheries, targeting both demersal and pelagic stocks. The demersal species included in the model for simulating landings and revenues are European hake, striped mullet, Norway lobster, common cuttlefish, common sole and musky octopus. Pelagic species are European anchovy, European pilchard, bluefin tuna and swordfish. With the exception of the fisheries for swordfish and tuna, all other fisheries are regulated by effort control and mesh size, the latter being determined by the Mediterranean Regulation (Council Regulation (EC) No 1967/2006).
Future scenarios were generated principally through reductions in effort associated with the planned reduction in Italian fleet size indicated by the Italian Operational Programme under the EFF, and by reductions in the catch of smaller fish and shrimps likely to be affected by the move to the required 40mm mesh size under regulation 1967/2006. This methodology was adequate for simulating changes in stock status as a response to changing fishing effort. For the quota stocks, tuna and swordfish, catches were pro-rated according to the likely prognosis of the stocks and catches anticipated by ICCAT and SG-MED.
Similar assumptions about fuel and fish prices (described above) were introduced into the BIRDMOD model. Stock responses were modelled by adjusting demersal trawl fleet sizes according to the fleet size rules described above, with the introduction of TFSs for the large scale fleet.
EN Error! Unknown document property name. EN 42
ANNNEX 7 - IMPACTS OF THE DIFFERENT OPTIONS ON BRITTANY, GALICIA, SCOTLAND AND SICILY
As stated in Section 7.1, the global IA was completed by the comparison of impacts in Brittany, Galicia, Scotland and Sicily. These regions cover the most important Sea basins for the EU fleets and are more dependent on fisheries activities than their respective national averages. Together they account for 20% of EU employment in catching, processing and aquaculture, 28% of total landings and 36% of landing value28.
The main impacts follow the same direction for all 4 regions, with some minor differences due to the relative importance of the local stocks for the regional fleets. See the results in annex 6.
1.1. Brittany The fishing and aquaculture industry in Brittany, including associated upstream and downstream sectors represents 0.7% of the regional value added, and 0.8% of total regional employment. Some 52% of Brittany landings in weight and 64% in value are composed of species managed through EU quotas. In 2008, there were 1,448 fishing vessels in Brittany crewed by 4,800 persons. While the small-scale fleet represents the majority of the fleet in number (70%), the economy of the sector relies to a large extent on a trawler fleet of nearly 400 vessels targeting nephrops and monkfish in the Celtic sea (25%), and also on a distant-water fleet exploiting tropical tuna in the Atlantic and the Indian oceans. Landings of the Brittany fleet (in Brittany) represented a total weight of 90,000 tonnes in 2008, for a value of € 254 million. Both fleet size and employment have significantly decreased in the last 4-5 years.
Status Quo
None of the modelled stocks caught by the Brittany fleets will be exploited at or under FMSY by 202029. As regards the status of species managed at national level, some are assumed to be already now at MSY level30.
The economic indicators are expected to nearly stabilise over the whole period (+1%). Concerning social indicators, employment in the catching sector would decrease in line with the anticipated decrease in fleet size (-13%). Crew wages will only see a marginal increase (+3%). Hence the attractiveness of the sector would not increase. The poor environmental results will impact employment in primary processing. The continuation of the current problems affecting part of the aquaculture sector (oysters) could also reduce employment in that sector.
Option 1
Regarding environmental sustainability, Option 1 would improve the situation of Brittany fisheries, but less than the EU. This is a consequence of the large number of unassessed stocks exploited by Brittany fleets, in particular as regards stocks not under direct EU management. Economic impacts will be positive and significant, but generally speaking somewhat lower than these at EU level. As for social indicators, the reduction of employment
28 The full analysis is included in Annexes 6 and 7 below.
29 However, two stocks, western Channel sole and northern hake, will reach or be close to fishing mortality targets set under their respective LTMP by 2017.
30 i.e.: scallops, the Bay of Biscay sardine stock, and the Channel seabass.

EN Error! Unknown document property name. EN 43
is predicted to be larger than that of the EU as a whole both for 2017 and 2022. This could be explained by the fact that the trawler fleets will get very significantly reduced (-32% by 2022 compared to 2012). Both GVA per FTE and crew wage per FTE will increase very significantly but still a bit less than the EU average. External governance is crucial for the Brittany distant water fleets, and all initiatives to strengthen the role of RFMOs in fisheries management would be useful, provided they do not generate additional costs for the sector compared to its competitors.
Option 2
Economic indicators will perform worse than for the EU. Furthermore, performance will be also lower than under Option 1. Regarding social impacts, performance will be similar to that under Option 1, although crew shares would be lower. Social performance is expected to be lower than that of the whole of the EU.
The EU-wide TFS transferability could have significant impacts on the Brittany fishing to the extent that fishing rights held by Brittany fishing companies could be bought by fleets of other MS, or vice versa. However, the seriousness of impacts on coastal communities would depend on the extent to which local fishermen are replaced, landings moved away and primary processing losses access to local product.
Option3
It is expected that impacts for Brittany will be broadly similar to those estimated at EU level. Option 3 performs slightly below Option 1 and marginally better than Option 2.
1.2. Galicia The Galician catching sector represents around 16% of the total employment and 10% of the total production in the EU. The catching sector employs around 22,300 people directly. The fisheries sector contributes 2.4% of the total regional economy. The Galician fishing sector targets third country waters, international waters, EU waters and Spanish inshore and offshore waters. In any event, the coastal fleet is the most important within Galicia. Galicia accounted for 90% of the Spanish marine aquaculture production (18% of the EU production) with 310,435 tons produced in 2006, particularly mussels and turbot. The processing sub-sector has a turnover two times larger than the catching sub-sector, generating a gross value added to the Galician economy of 326 million Euros. In terms of employment the processing industry amounts to 10,698 FTE, mainly women
Status Quo
Environmental indicators would show some progress due to the expected recovery of fish stocks associated with LTMPs (Northern and Southern hake), but is insufficient to reach Fmsy. Fleet size will continue to decline at an average rate of at least 2% per year.
Economic indicators will also show some gradual improvement. 8 of the 10 Galician fleets modelled show an increase in GVA equivalent to that of the EU as a whole with no clear distinction between performance of large and small vessels or gear type. Break-even revenue will increase only marginally (+2% over the period).
Regarding social indicators, in contrast to the EU, modelling for Galicia shows an overall increase in employment in the region of 4% over the period. This increase can be attributed almost entirely to the PTS1224 segment. Employment across other Galician fleets remains roughly constant over this period. Crew wage per FTE would decrease by 4% in 2022.
EN Error! Unknown document property name. EN 44
Option 1
Regarding environmental indicators, stocks relevant for the Galician fleet would reach FMSY by 2020. Fleet size is expected to decrease by 8% on average, although higher fleet size reductions are expected for industrial fleets (-24%).
Economic performance is expected to exceed the EU average by 2017 and to equal it by 2022. The modelled fleets show an increase in GVA of 73% by 2022. SSCF fleets are expected to have the smallest increase in GVA. Regarding industrial fleets, the largest improvements are shown by fleets involved in the main southern fisheries.
Concerning social indicators, catching sector employment would decrease by 10% by 2022, less than that of the EU as a whole. Average wage per FTE will be 90% higher in 2022 than in 2012. In addition, the removal of Axis-1 type of subsidies may have significant negative short term effects, but the greater focus on development of territorial areas dependent on fisheries could be particularly important for Galicia given the relatively high dependency on fisheries.
Option 2
Whereas environmental results are basically the same as in Option 1, in economic terms results of Option 2 fall short of these in Option 1. This is mainly because income and GVA generation would be reduced across the board due to the "most sensitive" approach applied in mixed fisheries.
The complete elimination of EFF funding may have significant, negative effects as the region is the one receiving most EFF funding in the EU. Social indicators in Option 2 perform marginally worse than under Option 1, but still better than the EU as a whole.
The EU-wide TFS transferability could have significant impacts on the Galician fleets and coastal communities to the extent that fishing rights held by Galician fishing companies could be bought by fleets of other MS, or vice versa. However, the size of these impacts on coastal communities would depend on the extent to which local fishermen are replaced, landings moved away and local primary processing losses access to local product.
Option 3
Environmental impacts are predicted to be equivalent to these under Option 1. Economic indicators show improvements but remain lower than under Options 1 and 2. Social indicators are similar to these under Option 2 (employment reduction by 19%). This reduction of employment will result in increases in GVA per employee and crew wage per employee equivalent to these under Option 2, but lower than under Option 1.
1.3. Scotland Around 80% of Scottish landings in weight are from stocks managed under quota31. Only crab, lobster and scallops are key fisheries (mainly inshore) not managed under quota. Scotland receives 74% of UK landings by weight and 68% by value. Scotland’s fisheries sector contributes around 9% of the total value of fish produced in the EU and 4% of fisheries employment in the EU, with around 5,500 employed in the catching sector. The majority of the 2,200 vessels in the Scottish fleet are within demersal trawlers, pelagic trawlers and inshore potters & creelers. The demersal segment was significantly reduced in the decommissioning rounds of 2001 & 2003 with many remaining vessels making a shift from 31 Ccod, haddock, mackerel and herring are under Long Term Management Plans with cod stocks still under a
recovery plan.

EN Error! Unknown document property name. EN 45
whitefish to nephrops. The Scottish pelagic fleet has also reduced in number and now consists of 26 large vessels over 40m in length. The largest segment of the fleet is the inshore potters & creelers with over 1,500 vessels below 12m.
The processing sector employs over 6,000 people and is predominantly dependent upon local landings. Although employment in the Scottish salmon sector has decreased in recent years as economies of scale are developed, the Scottish aquaculture sector employs 2,700 people and accounts for 68% of UK employment in aquaculture.
Status Quo
Of the stocks caught by Scottish fleets which are modelled under the SQ Option, only herring is found to be at or above reference points, while haddock would achieve a fishing mortality lower than FMSY from 2017 onwards.
GVA is projected to increase by 21% by 2017 and then by a further 11% from 2017 to 2022 as improvements to stocks under LTMPs improve returns for the demersal trawl segment and the already highly profitable pelagic sector. Profitability for nephrops trawlers is affected by the stock status and price, which has been decreasing in real terms, in particular for the smaller nephrops tails. Economic performance in the inshore pots & creels fleet is expected to show improved performance as shellfish prices increase.
The assumed improvement in whitefish stocks means that dependent areas such as North East Scotland may show comparatively greater socio-economic benefits. Catching sector employment is predicted to reduce by 11% by 2022 as vessel numbers decrease, including in the inshore sector. This should result in increased profitability and attractiveness of the sector.
Option 1
The model predicts that by 2020 all stocks fished by the Scottish fleet will be fished at FMSY, including non-quota shellfish stocks. The high dependence on quota species will mean a short term reduction in fishing opportunities, but longer-term gains. However, MSY-equivalent biological reference points are not used in Nephrops stock assessment at present and the impact of a move to MSY could have major implications for the Scottish SSCF and the larger trawl fleet.
The model predicts a 20% fleet decrease by 2022. It predicts also a greater improvement for the Scottish fleet as a whole for all economic indicators compared to the EU average.
The Scottish primary processing sector remains reliant on local landings and therefore improved landings by the catching sector will lead to a positive result for processing. The model predicts a 35% increase in GVA from processing in 2022. However there is a 20% decline in GVA for the ancillary sector by 2022 due to the reduction in vessel numbers.
Employment in the catching sector would reduce by 27% in 2022, slightly over the EU average. However, the attractiveness of employment is predicted to increase with crew wages growing by 169% by 2022. This is a much larger increase than the predicted increase across the EU. Losses in ancillary services will follow the fleet reduction.
Concentration of landings beyond current levels risks that a number of Highland and East coast ports would effectively lose the critical mass required to maintain upstream ancillary sectors. Downstream sectors could import or over-land product from the remaining large-fleet ports, but this would create an additional cost. Within the SSCF the move to TFS may be limited as it is dependent on inshore non-quota species and nephrops, where the allocation of quota is managed from a central pool.

EN Error! Unknown document property name. EN 46
Contrary to the current situation, where the recent need for cost reduction across the Scottish fleet has resulted in that vessels going to sea short-handed, the model predicts an increase in employment per (remaining) vessel. This will have a positive effect on safety. This effects is not privy to the Scottish fleets, but it is more visible there than in other regions of in the EU as a whole.
Option 2
Overall the environmental impact of Option 2 is expected to be a positive one with a more rapid move to MSY. Economic performance is projected to be around 10% less than under Option 1 due to the catching constraints in mixed fisheries (e.g. in important cod-associated fisheries of haddock and whiting). Social impacts are very close but slightly worse than under Option 1, in terms of employment losses and crew wages. This result from the mixed fisheries rule and from the fact that the quicker move to MSY would prevent diversification into other stocks and many vessels in segments with marginal profitability could suffer. However, employment results are still better than for the EU as a whole. The loss of funding for innovation in gear selectivity and efficiency may have detrimental effects which would be most felt in isolated coastal communities.
The eventual impacts of the introduction of EU-wide TFS transferability are expected to be as in the other regions analysed.
Option 3
The more gradual transition and safeguards may give the Scottish sector more opportunity to adapt. The model predicts similar outcomes from Option 3 to the other options with a 20% reduction in vessels and employment, but the negative, additional socio-economic impacts expected under Option 2 would not occur.
1.4. Sicily The Sicilian catching sector represents 29% of that of Italy, with a downward trend in employment in the Sicilian fleet during the period 2004 – 2008. The fishing fleet consists of 3,196 vessels with a total tonnage of approximately 58,000 GT and an engine power of just over 270,000 kW. As much as 67% of the fleet is SSCF. Demersal trawlers represent the most important Sicilian fleet (66% of the total GT and 50% in terms of kW installed). Other important fleet segments are purse seiners and longlines. Among the 295 vessels registered as purse seiners and longliners, 14 are authorised to fish northern bluefin tuna. In 2008, the Sicilian fleet landed 43,000 tons, equivalent to €287 million. Sicily employs 17.3% of the people involved in the Italian processing sector and 2.8% of the people working in the Italian aquaculture sector.
Status Quo
For environmental indicators, an improvement in stocks status is likely. The reduction in fishing effort and the increase in mesh size are expected to produce an increase in stock sizes and a decrease in fishing pressure. However, this is not sufficient to reach FMSY.
Economic indicators show a gradual improvement for the catching sector, with significant differences across fleets. Employment would decline in proportion to the reduction of the fleet. However, remaining employment would benefit from modest increases in wages.

EN Error! Unknown document property name. EN 47
Option 1
The rule for mixed fisheries under each option will be a major driver for impacts, as most analysed fisheries are mixed32. Regarding environmental indicators, 50% of the analysed stocks will reach FMSY level by 2017 and close to 85% by 2020.
The implementation of an Individual Transferable Effort (ITE) would probably determine a concentration of fishing effort in fewer vessels and a reduction of overcapacity only when fisheries are or become unprofitable. Remaining vessels would increase their average days at sea to make fishing profitable.
Economic indicators show a positive performance for the Sicilian catching sector as a whole. In 2022, GVA will increase by 23%, revenue to break even revenue by 16% and profitability by 29%. However, as the target fishing mortality under the conservation policy is achieved by reducing mainly demersal stocks, this fleet segment would be the most affected. Contrary to the main IA, implications for the Sicilian processing sector will be negative given the decrease in landings expected as a consequence of the reduced fishing effort.
Employment is predicted to decrease by 16% in 2017 and by 23% in 2022. The average wage per FTE would see significant increases (35% in 2017 and 47% by 2022).
Option 2
Compared with Option 1, the only significant change is the mixed fisheries rule. It affects the status of demersal stocks,in particular that of European hake. Fishing mortality should be reduced by more than 80% to achieve this conservation target for hake. This objective should be obtained by a reduction of 99% in the total number of fishing days for demersal trawlers by 2017 and 2022. Overall, the fleet will reduce by 22% in 2017 and 29% in 2022.
Economic indicators show a positive performance for most of the fleet segments involved in the Sicilian catching sector, but for demersal trawlers. GVA by demersal trawlers in 2022 would decrease by 12%, while revenue to break even revenue and profitability will increase by 25% and 57% respectively. The Sicilian sector as a whole would be largely affected by the reduced profitability of demersal trawlers. However, the positive performance of the other fleet segments would partially counterbalance the negative component due to trawlers. Contrary to the main IA, implications for the Sicilian processing sector will be negative given the decrease in landings expected as a consequence of the reduced fishing effort.
Employment trends would be as in Option 1. The average wage per FTE is expected to grow less than under option 1. (12% in 2017 and 22% by 2022).
Option 3
Results are the same as in Option 1 as regards fleet reduction. Economic results are worse than under Option 1, but social impacts are the same.
32 The only single-species fishery is that for bluefin tuna.

EN Error! Unknown document property name. EN 48
ANNEX 8 - SUMMARY OF THE IMPACT OF EACH OPTION ON INDICATORS Key to scoring is :
- - : performance targets not met, and/or a significant worsening of the situation
- : performance targets not met, and/or a worsening of the situation
= : performance targets not met, but little change in the situation or only very small improvement
+ : performance targets substantially met, and/or significant improvement of the situation
++: performance targets met, and/or very significant improvements of the situation

EN Error! Unknown document property name. EN 55
Indictor Status Quo Option 1 Option 1a Option 2 Option 2a Option 3 Option 4 Risks and assumptions
Stock situation in terms of fishing mortality in relation to MSY
Number of northern stocks at Fmsy increases from 3 (2009) to 8 by 2022; no improvement in Mediterranean stocks (4 at Fmsy). Failure to set Fmsy targets in LTMPs and low uptake of LTMPs Discarding at high levels.
-
Number of northern stocks at Fmsy increases from 3 (2009) to 81 by 2022; improvement in Mediterranean stocks 4 at Fmsy to 15 in 2022; Only 40% (11) deep sea stocks reach Fmsy 30% of stocks in multispecies complexes are overexploited Discarding reduced by 50% due to quota pooling, regional body actions, technical measures
+
Number of northern stocks at Fmsy increases from 3 (2009) to 89 by 2022; improvement in Mediterranean stocks 4 at Fmsy to 18 in 2022; Only 50% (14) deep sea stocks reach Fmsy All stocks in multispecies complexes are at Fmsy Discarding reduced by 50% due to quota pooling, regional body actions, technical measures
++
Number of northern stocks at Fmsy increases from 3 (2009) to 89 by 2017; improvement in Mediterranean stocks 4 at Fmsy to 18 in 2022. Only 50%(14) deep sea stocks at Fmsy All stocks in multispecies complexes are at Fmsy Discarding almost eliminated with technical measures and introduction of catch quotas.
++
Number of northern stocks at Fmsy increases from 3 (2009) to 81 by 2017; improvement in Mediterranean stocks 4 at Fmsy to 15 in 2022. Only 40%(11) deep sea stocks at Fmsy All stocks in multispecies complexes are at Fmsy Discarding almost eliminated with technical measures and introduction of catch quotas.
++
As Option 1 Risk that lack of a RegBod will slow adoption of Fmsy management plans under Option 3
+
Although the objective is 25% interannual TAC variation, because the fleet will be overcapacity for longer it is likely that only 15% interannual TAC reductions are achieved. Other results as Option 1
+
Significant risk that the accelerated Fmsy objectives of Option 2 will not be supported by adequate science.

EN Error! Unknown document property name. EN 56
Indictor Status Quo Option 1 Option 1a Option 2 Option 2a Option 3 Option 4 Risks and assumptions
% of stocks and/or catches covered by LTMP
Only 27 out of 138 stocks covered by LTMPs
=
All stocks covered by LTMPs of some sort by 2017. LTMPs will be accepted by Council and EP due to actions of RegBod, although they will be more complicated to negotiate with this multispecies policy
+
All stocks covered by LTMPs of some sort by 2017. LTMPs will be accepted by Council and EP due to actions of RegBod, although they will be more complicated to negotiate with this multispecies policy
+
All stocks covered by LTMPs of some sort by 2017 LTMPs will be accepted by Council and EP due to actions of RegBod, although they will be more complicated to negotiate with this multispecies policy
+
All stocks covered by LTMPs of some sort by 2017 LTMPs will be accepted by Council and EP due to actions of RegBod, although they will be more complicated to negotiate with this multispecies policy
+
LTMPs will be accepted slowly due to dependence on RACs alone and the complex multispecies policy
=
As option 1; fleet overcapacity will have minimal impact on Regbod activities
+
Risk that lack of a RegBod will slow adoption of LTMP plans under Option 3 Risk that LTMPs will prove difficult to negotiate under Option 1 and 3 multispecies considerations
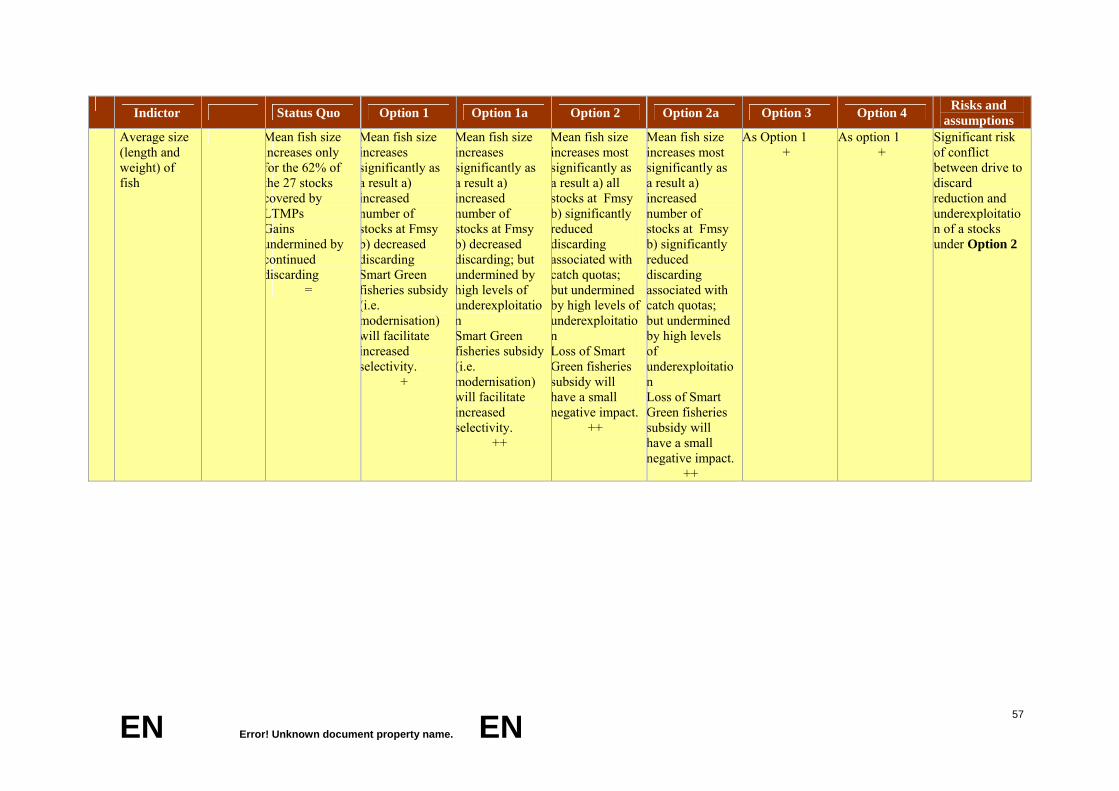
EN Error! Unknown document property name. EN 57
Indictor Status Quo Option 1 Option 1a Option 2 Option 2a Option 3 Option 4 Risks and assumptions
Average size (length and weight) of fish
Mean fish size increases only for the 62% of the 27 stocks covered by LTMPs Gains undermined by continued discarding
=
Mean fish size increases significantly as a result a) increased number of stocks at Fmsy b) decreased discarding Smart Green fisheries subsidy (i.e. modernisation) will facilitate increased selectivity.
+
Mean fish size increases significantly as a result a) increased number of stocks at Fmsy b) decreased discarding; but undermined by high levels of underexploitation Smart Green fisheries subsidy (i.e. modernisation) will facilitate increased selectivity.
++
Mean fish size increases most significantly as a result a) all stocks at Fmsy b) significantly reduced discarding associated with catch quotas; but undermined by high levels of underexploitation Loss of Smart Green fisheries subsidy will have a small negative impact.
++
Mean fish size increases most significantly as a result a) increased number of stocks at Fmsy b) significantly reduced discarding associated with catch quotas; but undermined by high levels of underexploitation Loss of Smart Green fisheries subsidy will have a small negative impact.
++
As Option 1 +
As option 1 +
Significant risk of conflict between drive to discard reduction and underexploitation of a stocks under Option 2

EN Error! Unknown document property name. EN 58
Indictor Status Quo Option 1 Option 1a Option 2 Option 2a Option 3 Option 4 Risks and assumptions
Fleet evolution
Decrease in fleets anticipated, but only at the existing rate reduction to 23% of 2007 levels by 2022.
=
Until 2015, fleet reduces in line with Operational Plans. In 2022 following TFS introduction the total EU fleet has declined by 25% from 2007 levels, LSF 24% and SSF 25%.
+
Similar to Option 1, though reduction in fleets necessary to meet “conservation optimum” in multispecies situations
+
Slight further decrease in fleet size over Option 1 due to reduced fish price stimulating more TFS reductions. Reduction in fleets necessary to meet “conservation optimum” in multispecies situations Additional small declines may result from inter-EU transfers
+
As for Option 2 +
Equal decreases with Option 1 No additional reductions anticipated from inter-EU transfers
+
The combination of lack of mandatory TFS and removal of scrapping and modernisation subsidies will mean that the fleet does not reduce much after the end of the operational plans in 2016. Only some
countries are expected to develop, later in the second decade, their own TFSs.
-
Current economic crisis may mean that current EFF plans are not met (i.e. anticipated declines to 2015 may not be realised) Risk that TFS policy won’t reduce fleet capacity as planned Given the likely increasing age of some of the fleets, there may be increasing pressure for exceptional decommissioning subsidies or the development of targeted TFSs for some unprofitable fleet segments, beyond the assumptions here (DNK, EST, POL, SWE, NLD, DEU, ESP)
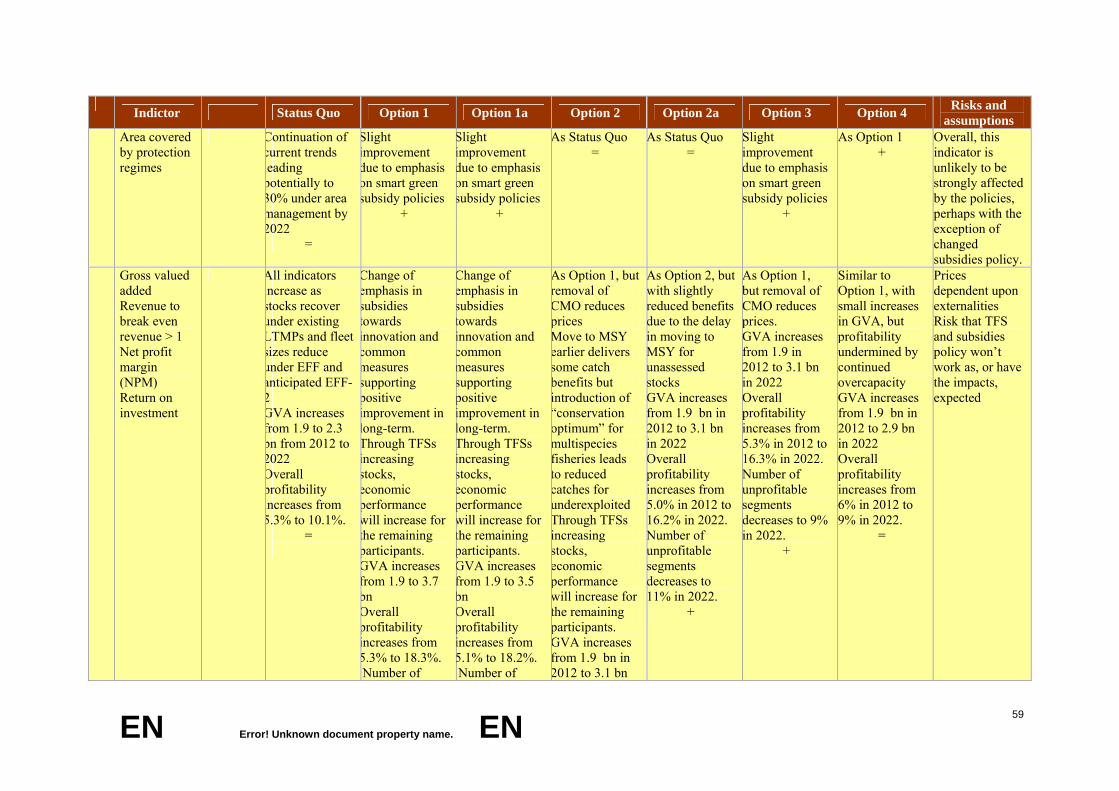
EN Error! Unknown document property name. EN 59
Indictor Status Quo Option 1 Option 1a Option 2 Option 2a Option 3 Option 4 Risks and assumptions
Area covered by protection regimes
Continuation of current trends leading potentially to 30% under area management by 2022
=
Slight improvement due to emphasis on smart green subsidy policies
+
Slight improvement due to emphasis on smart green subsidy policies
+
As Status Quo =
As Status Quo =
Slight improvement due to emphasis on smart green subsidy policies
+
As Option 1 +
Overall, this indicator is unlikely to be strongly affected by the policies, perhaps with the exception of changed subsidies policy.
Gross valued added Revenue to break even revenue > 1 Net profit margin (NPM) Return on investment
All indicators increase as stocks recover under existing LTMPs and fleet sizes reduce under EFF and anticipated EFF-2 GVA increases from 1.9 to 2.3 bn from 2012 to 2022 Overall profitability increases from 5.3% to 10.1%.
=
Change of emphasis in subsidies towards innovation and common measures supporting positive improvement in long-term. Through TFSs increasing stocks, economic performance will increase for the remaining participants. GVA increases from 1.9 to 3.7 bn Overall profitability increases from 5.3% to 18.3%. Number of
Change of emphasis in subsidies towards innovation and common measures supporting positive improvement in long-term. Through TFSs increasing stocks, economic performance will increase for the remaining participants. GVA increases from 1.9 to 3.5 bn Overall profitability increases from 5.1% to 18.2%. Number of
As Option 1, but removal of CMO reduces prices Move to MSY earlier delivers some catch benefits but introduction of “conservation optimum” for multispecies fisheries leads to reduced catches for underexploited Through TFSs increasing stocks, economic performance will increase for the remaining participants. GVA increases from 1.9 bn in 2012 to 3.1 bn
As Option 2, but with slightly reduced benefits due to the delay in moving to MSY for unassessed stocks GVA increases from 1.9 bn in 2012 to 3.1 bn in 2022 Overall profitability increases from 5.0% in 2012 to 16.2% in 2022. Number of unprofitable segments decreases to 11% in 2022.
+
As Option 1, but removal of CMO reduces prices. GVA increases from 1.9 in 2012 to 3.1 bn in 2022 Overall profitability increases from 5.3% in 2012 to 16.3% in 2022. Number of unprofitable segments decreases to 9% in 2022.
+
Similar to Option 1, with small increases in GVA, but profitability undermined by continued overcapacity GVA increases from 1.9 bn in 2012 to 2.9 bn in 2022 Overall profitability increases from 6% in 2012 to 9% in 2022.
=
Prices dependent upon externalities Risk that TFS and subsidies policy won’t work as, or have the impacts, expected
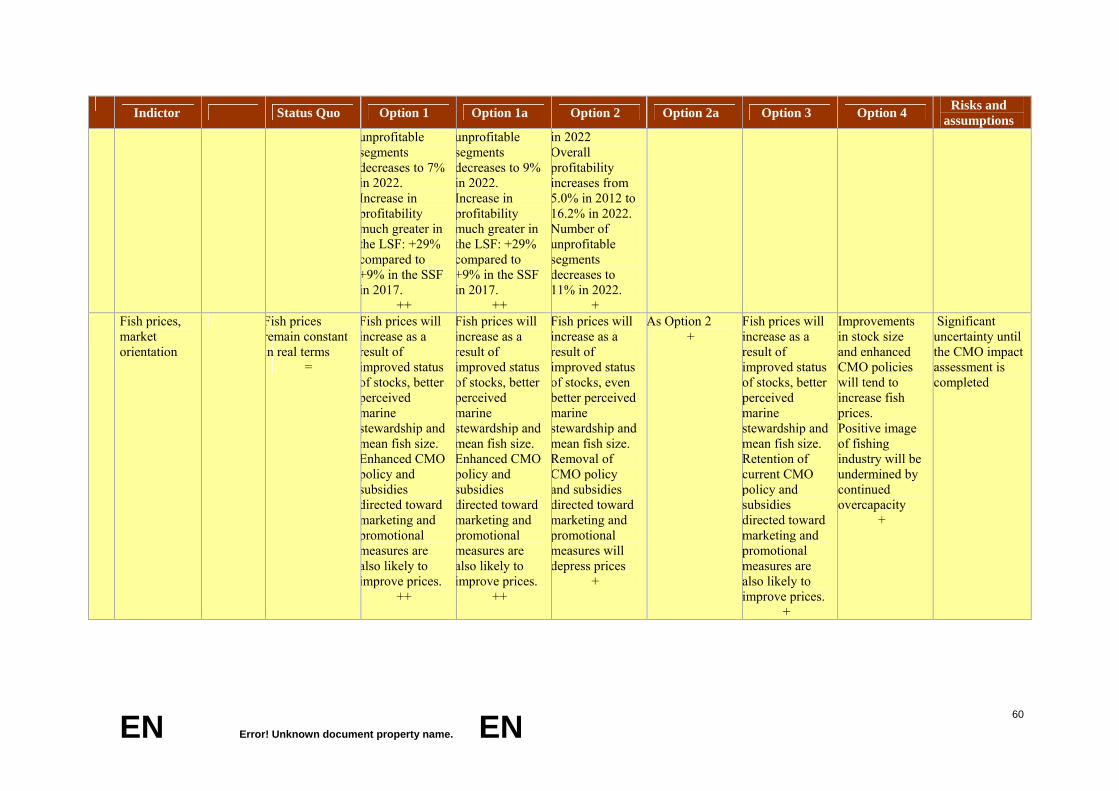
EN Error! Unknown document property name. EN 60
Indictor Status Quo Option 1 Option 1a Option 2 Option 2a Option 3 Option 4 Risks and assumptions
unprofitable segments decreases to 7% in 2022. Increase in profitability much greater in the LSF: +29% compared to +9% in the SSF in 2017.
++
unprofitable segments decreases to 9% in 2022. Increase in profitability much greater in the LSF: +29% compared to +9% in the SSF in 2017.
++
in 2022 Overall profitability increases from 5.0% in 2012 to 16.2% in 2022. Number of unprofitable segments decreases to 11% in 2022.
+ Fish prices, market orientation
Fish prices remain constant in real terms
=
Fish prices will increase as a result of improved status of stocks, better perceived marine stewardship and mean fish size. Enhanced CMO policy and subsidies directed toward marketing and promotional measures are also likely to improve prices.
++
Fish prices will increase as a result of improved status of stocks, better perceived marine stewardship and mean fish size. Enhanced CMO policy and subsidies directed toward marketing and promotional measures are also likely to improve prices.
++
Fish prices will increase as a result of improved status of stocks, even better perceived marine stewardship and mean fish size. Removal of CMO policy and subsidies directed toward marketing and promotional measures will depress prices
+
As Option 2 +
Fish prices will increase as a result of improved status of stocks, better perceived marine stewardship and mean fish size. Retention of current CMO policy and subsidies directed toward marketing and promotional measures are also likely to improve prices.
+
Improvements in stock size and enhanced CMO policies will tend to increase fish prices. Positive image of fishing industry will be undermined by continued overcapacity
+
Significant uncertainty until the CMO impact assessment is completed

EN Error! Unknown document property name. EN 61
Indictor Status Quo Option 1 Option 1a Option 2 Option 2a Option 3 Option 4 Risks and assumptions
Level of subsidies / value of landings
Subsidies remain a significant contribution to the catching sector as EFF-2 continues
-
Long- and short-term, positive impacts as “bad” subsidies are reduced and “good” subsidies increased Targeting of subsidies specifically on “smart green” issues, and removal of fleet subsidies, will be positive
=
Long- and short-term, positive impacts as “bad” subsidies are reduced and “good” subsidies increased Targeting of subsidies specifically on “smart green” issues, and removal of fleet subsidies, will be positive
=
Positive impacts on indicator (but note that potential negative impact on other indicators with reduction in “good” subsidies as well as “bad” subsidies)
+
As Option 2 +
As Option 1 Improvement in “good” subsidies provided with “reserve” fund
=
As Option 1 =
Assumptions made about levels of funding and balance of funds between axes, measures and actions

EN Error! Unknown document property name. EN 62
Indictor Status Quo Option 1 Option 1a Option 2 Option 2a Option 3 Option 4 Risks and assumptions
Employment Employment declines by 5% from 2012 to 2017 due to reduction in fleet size
=
Reduction in TACs will have short-term impacts on employment Introduction of TFS reduces total employment in capture fisheries. Declines are less in SSF than in LSF: decline of 10% in 2017, SSF: decline of 20% in 2017, LSF Ancillary employment likely to decrease as fleet declines processing employment likely to increase with increasing catches
-
As Option 1, but with slightly greater declines
-
As Option 1, but with greater declines
-
As Option 1, but with greater declines
-
As Option 1 -
Employment will decline less than Status Quo and much less than the other options.
=
Introduction of TFS reduces total employment in capture fisheries. SSF: decline of 10% in 2017 LSF: decline of 20% in 2017 Employment likely to decrease in ancillary sector and increase in processing services.
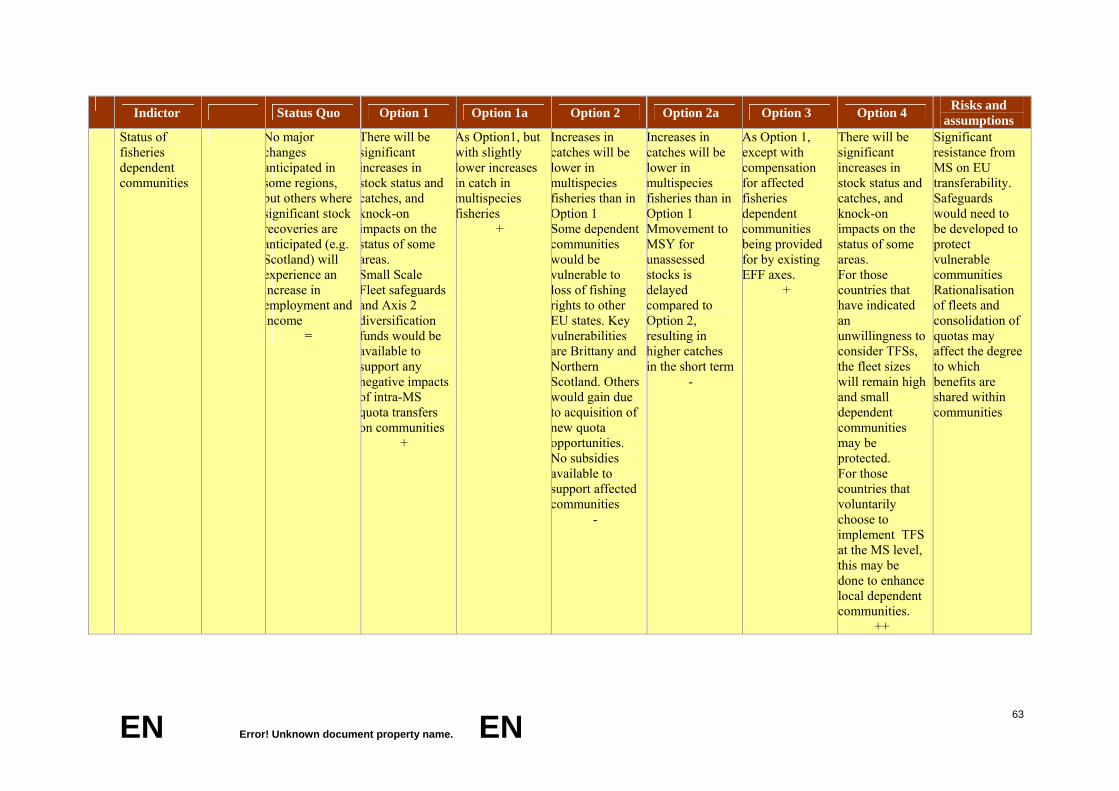
EN Error! Unknown document property name. EN 63
Indictor Status Quo Option 1 Option 1a Option 2 Option 2a Option 3 Option 4 Risks and assumptions
Status of fisheries dependent communities
No major changes anticipated in some regions, but others where significant stock recoveries are anticipated (e.g. Scotland) will experience an increase in employment and income
=
There will be significant increases in stock status and catches, and knock-on impacts on the status of some areas. Small Scale Fleet safeguards and Axis 2 diversification funds would be available to support any negative impacts of intra-MS quota transfers on communities
+
As Option1, but with slightly lower increases in catch in multispecies fisheries
+
Increases in catches will be lower in multispecies fisheries than in Option 1 Some dependent communities would be vulnerable to loss of fishing rights to other EU states. Key vulnerabilities are Brittany and Northern Scotland. Others would gain due to acquisition of new quota opportunities. No subsidies available to support affected communities
-
Increases in catches will be lower in multispecies fisheries than in Option 1 Mmovement to MSY for unassessed stocks is delayed compared to Option 2, resulting in higher catches in the short term
-
As Option 1, except with compensation for affected fisheries dependent communities being provided for by existing EFF axes.
+
There will be significant increases in stock status and catches, and knock-on impacts on the status of some areas. For those countries that have indicated an unwillingness to consider TFSs, the fleet sizes will remain high and small dependent communities may be protected. For those countries that voluntarily choose to implement TFS at the MS level, this may be done to enhance local dependent communities.
++
Significant resistance from MS on EU transferability. Safeguards would need to be developed to protect vulnerable communities Rationalisation of fleets and consolidation of quotas may affect the degree to which benefits are shared within communities

EN Error! Unknown document property name. EN 64
Indictor Status Quo Option 1 Option 1a Option 2 Option 2a Option 3 Option 4 Risks and assumptions
Social sustainability: GVA per employee
Small increases following increases in GVA per employee
=
Significant improvement in LSF following large improvements in GVA per employee; no change in SSF Increases in GVA per employee significantly more in LSF than in SSF: Increase of 43% in 2017 for SSF; increase of 92% in 2017 for LSF
++
As Option1, but with less improvement for both SSF and LSF due to; Increase of 42% in 2017 for SSF; increase of 90% in 2017 for LSF
++
As Option 1, but with less improvement for both SSF and LSF due to lower increase in landed value Increase of 26% for SSF and increase of 62% for LSF in 2017
+
As Option 1, but with less improvement for both SSF and LSF due to lower increase in landed value Increase of 25% for SSF and increase of 62% for LSF in 2017
+
As Option 1, but with less improvement for both SSF and LSF due to lower increase in landed value
+
Small improvements in GVA / employee compared to the SQ, but not as high as the other options.
=
Will largely follow impacts on economic indicators
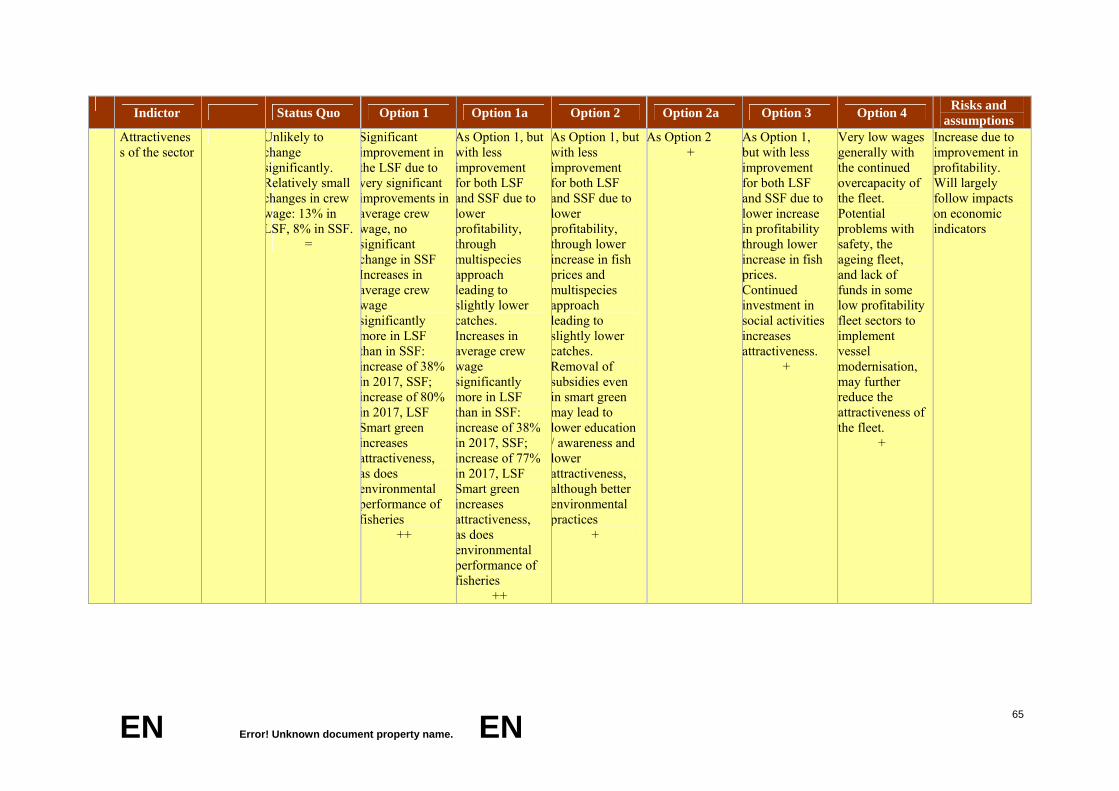
EN Error! Unknown document property name. EN 65
Indictor Status Quo Option 1 Option 1a Option 2 Option 2a Option 3 Option 4 Risks and assumptions
Attractiveness of the sector
Unlikely to change significantly. Relatively small changes in crew wage: 13% in LSF, 8% in SSF.
=
Significant improvement in the LSF due to very significant improvements in average crew wage, no significant change in SSF Increases in average crew wage significantly more in LSF than in SSF: increase of 38% in 2017, SSF; increase of 80% in 2017, LSF Smart green increases attractiveness, as does environmental performance of fisheries
++
As Option 1, but with less improvement for both LSF and SSF due to lower profitability, through multispecies approach leading to slightly lower catches. Increases in average crew wage significantly more in LSF than in SSF: increase of 38% in 2017, SSF; increase of 77% in 2017, LSF Smart green increases attractiveness, as does environmental performance of fisheries
++
As Option 1, but with less improvement for both LSF and SSF due to lower profitability, through lower increase in fish prices and multispecies approach leading to slightly lower catches. Removal of subsidies even in smart green may lead to lower education / awareness and lower attractiveness, although better environmental practices
+
As Option 2 +
As Option 1, but with less improvement for both LSF and SSF due to lower increase in profitability through lower increase in fish prices. Continued investment in social activities increases attractiveness.
+
Very low wages generally with the continued overcapacity of the fleet. Potential problems with safety, the ageing fleet, and lack of funds in some low profitability fleet sectors to implement vessel modernisation, may further reduce the attractiveness of the fleet.
+
Increase due to improvement in profitability. Will largely follow impacts on economic indicators

EN Error! Unknown document property name. EN 66
Indictor Status Quo Option 1 Option 1a Option 2 Option 2a Option 3 Option 4 Risks and assumptions
Safety Current trends imply the non-fatal accident rate will continue to decline. No indication that the fatal accident rate is declining
=
Positive for LSF because of reduced competition under TFS and significant improvements in profitability and GVA/vessel Smaller increase for SSF due to smaller improvements in profitability and GVA/vessel
++
As Option 1 ++
As Option 1 +
As Option 1 +
As Option 1 +
Safety compromised by the increasing age of the fleet and lack of funds in some unprofitable segments to engage in modernisation.
-
Positive because of reduced competition under TFS. Will largely follow impacts on economic indicators because of link between safety and profitability

EN Error! Unknown document property name. EN 67
Indictor Status Quo Option 1 Option 1a Option 2 Option 2a Option 3 Option 4 Risks and assumptions
Departure of quotas from Scientific advice
No indications of reversing the current situation where quotas are set 40% higher than scientific advice. The number of stocks for which scientific advice is zero TAC where the Council sets a positive TAC has increased significantly since 2003.
-
Regional Bodies obliged to propose appropriate conservation, technical and effort measures to deliver EU Fmsy targets Much lower departure of quotas and scientific advice following improved agreement at EP/Co level
+
As Option 1 +
As Option 1 +
As Option 1 +
Without RegBods likely to be continued disagreement about meeting “socioeconomic optima” for multispecies fisheries Increased time to develop proposals and increased potential for discussion at EC/Co level. Perhaps no better than Status Quo, depending on “enhancement”
-
As Option 1 +
Management costs for the sector
Unlikely to reduce in short-term Reductions in enforcement expected of 42% and 35% by 2017 and 2022 Management costs decrease with declining fleet size
+
Increased MS involvement in decision making process is likely to increase both financial and time costs through additional meetings, particularly negotiating LTMPs under “socio-
As Option 1. -
As Option 1 Increased science burden (not necessarily costs) to deliver MSY in reduced timescale Increased MCS costs associated with more rapid reduction in catches to Fmsy in 4 years for all stocks
As Option 1 Lower science burden and MCS costs associated with the delayed move to MSY management for unassessed stocks
-
As Option 1, but decreased costs associated with non-use of RegBods
=
As Option 1 -
Significant risk that science capacity in the EU cannot deliver new assessments, even with additional funds
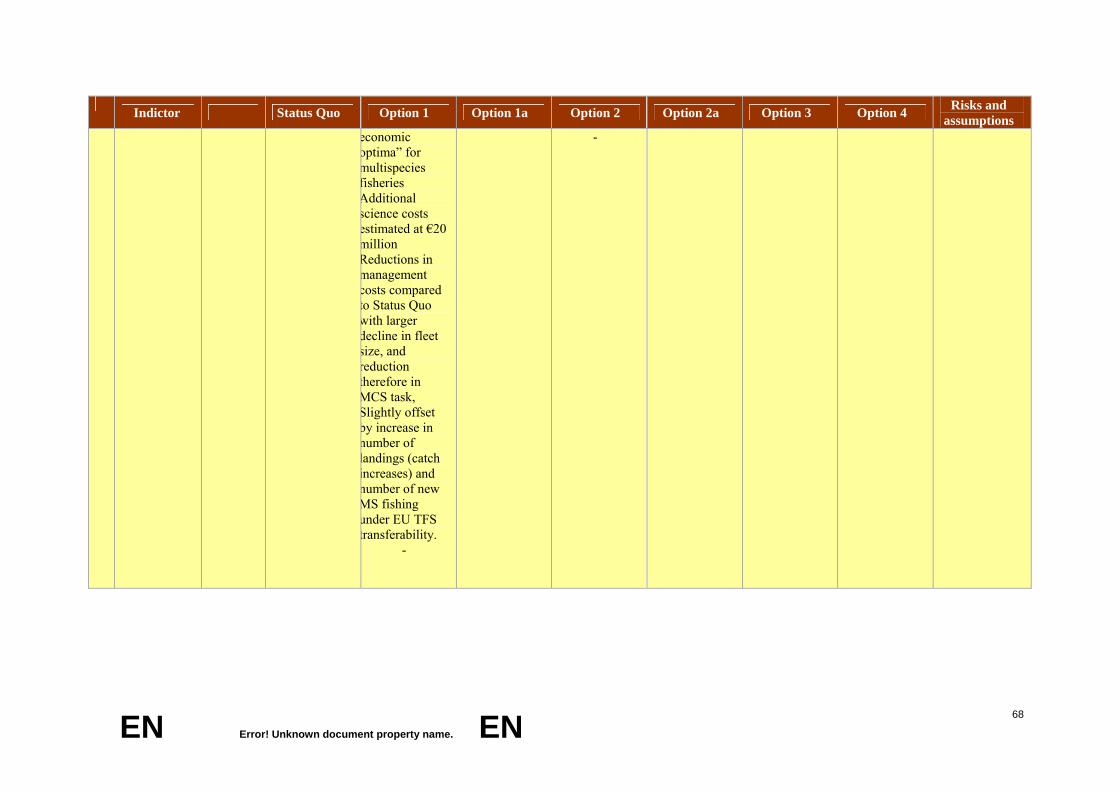
EN Error! Unknown document property name. EN 68
Indictor Status Quo Option 1 Option 1a Option 2 Option 2a Option 3 Option 4 Risks and assumptions
economic optima” for multispecies fisheries Additional science costs estimated at €20 million Reductions in management costs compared to Status Quo with larger decline in fleet size, and reduction therefore in MCS task, Slightly offset by increase in number of landings (catch increases) and number of new MS fishing under EU TFS transferability.
-
-

EN Error! Unknown document property name. EN 69
Indictor Status Quo Option 1 Option 1a Option 2 Option 2a Option 3 Option 4 Risks and assumptions
Regions and MS having adopting RBM system
Adoption of additional RBM systems is likely, but will stay at a low level within the EU, about 20% of the modelled fleet.
-
TFS uptake will be 100% in LSF. Uptake in SSF is likely to increase, although this is dependent on profitability. SSF: TFS uptake increase of 24% by 2017
+
As Option 1 +
As in option 1 +
As Option 1 +
Uptake of TFSs may be lower due to individual MS operation, essentially a continuation of the SQ
=
Some MS or fleet segments may, in the later stages of the decade, decide to voluntarily develop TFSs, but uptake will be lower than in Option 1.
=
inter-transferability of TFS systems across the EU (Options 1 and 2) may lead to RegBods implementing significant safeguards, slowing down TFS implementation.
Data provided by MS
Number of infringements expected to decline as the Control Regulation takes effect, and the DCF will significantly improve data reporting
+
Increase in DCF data required to develop scientific advice for all stocks Compliance may increase with RegBod involvement of all parties, and with TFSs
+
As Option 1 +
As in Option 1 +
As in Option 1 +
As in Option 1 +
As Option 1; there may be a small decrease in compliance associated with overcapacity, but Regbods will still be effective.
+
Assumption that impacts same across all options
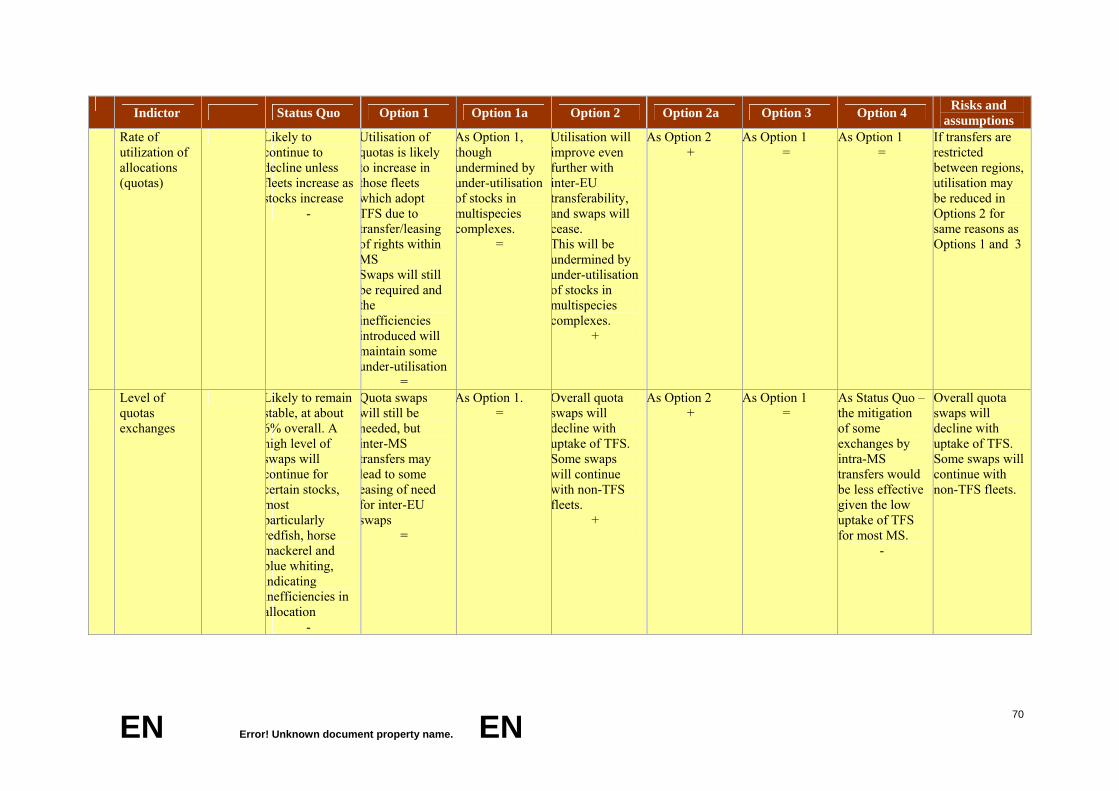
EN Error! Unknown document property name. EN 70
Indictor Status Quo Option 1 Option 1a Option 2 Option 2a Option 3 Option 4 Risks and assumptions
Rate of utilization of allocations (quotas)
Likely to continue to decline unless fleets increase as stocks increase
-
Utilisation of quotas is likely to increase in those fleets which adopt TFS due to transfer/leasing of rights within MS Swaps will still be required and the inefficiencies introduced will maintain some under-utilisation
=
As Option 1, though undermined by under-utilisation of stocks in multispecies complexes.
=
Utilisation will improve even further with inter-EU transferability, and swaps will cease. This will be undermined by under-utilisation of stocks in multispecies complexes.
+
As Option 2 +
As Option 1 =
As Option 1 =
If transfers are restricted between regions, utilisation may be reduced in Options 2 for same reasons as Options 1 and 3
Level of quotas exchanges
Likely to remain stable, at about 6% overall. A high level of swaps will continue for certain stocks, most particularly redfish, horse mackerel and blue whiting, indicating inefficiencies in allocation
-
Quota swaps will still be needed, but inter-MS transfers may lead to some easing of need for inter-EU swaps
=
As Option 1. =
Overall quota swaps will decline with uptake of TFS. Some swaps will continue with non-TFS fleets.
+
As Option 2 +
As Option 1 =
As Status Quo – the mitigation of some exchanges by intra-MS transfers would be less effective given the low uptake of TFS for most MS.
-
Overall quota swaps will decline with uptake of TFS. Some swaps will continue with non-TFS fleets.

EN Error! Unknown document property name. EN 71
Indictor Status Quo Option 1 Option 1a Option 2 Option 2a Option 3 Option 4 Risks and assumptions
Time taken to reach a decision
Time taken to reach decisions will increase significantly under EU co-decision of Lisbon treaty
-
Regional Bodies will reduce the time taken to reach a decision
+
Regional Bodies will reduce the time taken to reach a decision; Implementation of “conservation optimum” for multispecies fisheries may lead to harder decision making in RegBods and Co/EP with many loosers
=
Implementation of Fmsy policy will be difficult for some stocks in the short term due to lack of scientific data, which may lengthen time taken by RegBods to generate management plans Implementation of “conservation optimum” for multispecies fisheries may lead to harder decision making in RegBods and Co/EP with many loosers
=
Similar to Option 2, though delay in move to MSY for unassessed stocks will ease the burden on RegBods
=
Lack of authority of RegBods will mean reliance on RACs and return to SQ decision making
-
As Option 1 +
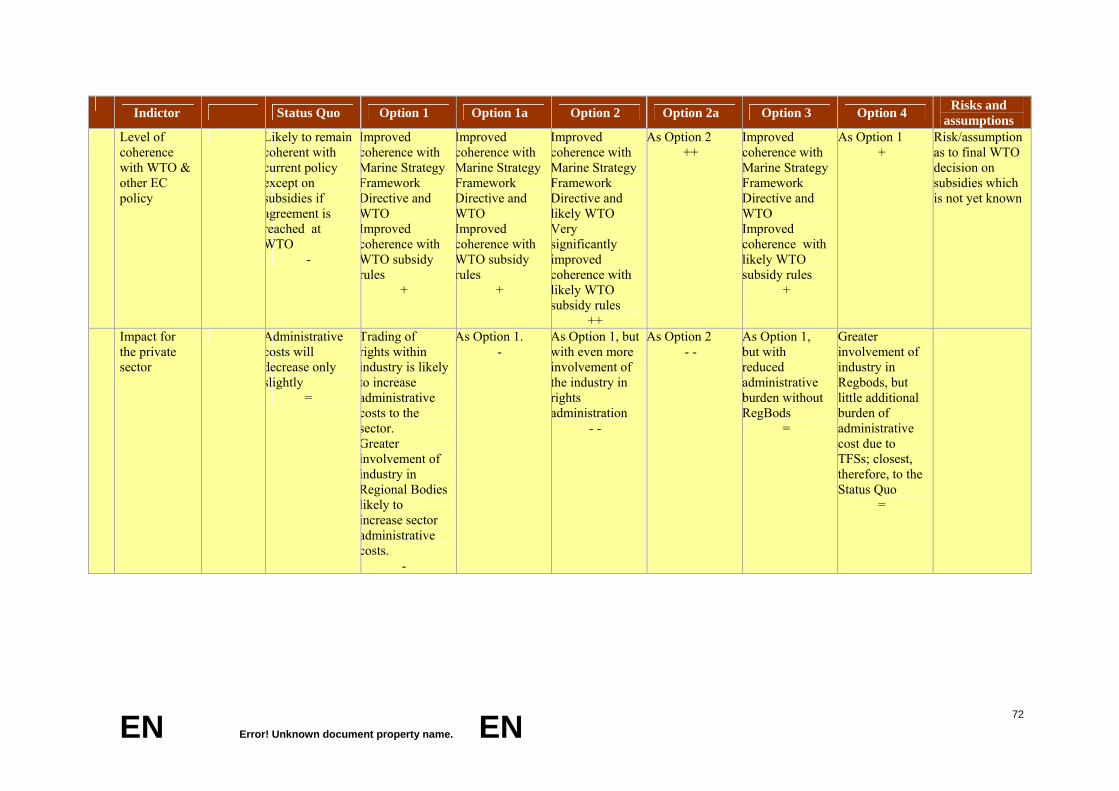
EN Error! Unknown document property name. EN 72
Indictor Status Quo Option 1 Option 1a Option 2 Option 2a Option 3 Option 4 Risks and assumptions
Level of coherence with WTO & other EC policy
Likely to remain coherent with current policy except on subsidies if agreement is reached at WTO
-
Improved coherence with Marine Strategy Framework Directive and WTO Improved coherence with WTO subsidy rules
+
Improved coherence with Marine Strategy Framework Directive and WTO Improved coherence with WTO subsidy rules
+
Improved coherence with Marine Strategy Framework Directive and likely WTO Very significantly improved coherence with likely WTO subsidy rules
++
As Option 2 ++
Improved coherence with Marine Strategy Framework Directive and WTO Improved coherence with likely WTO subsidy rules
+
As Option 1 +
Risk/assumption as to final WTO decision on subsidies which is not yet known
Impact for the private sector
Administrative costs will decrease only slightly
=
Trading of rights within industry is likely to increase administrative costs to the sector. Greater involvement of industry in Regional Bodies likely to increase sector administrative costs.
-
As Option 1. -
As Option 1, but with even more involvement of the industry in rights administration
- -
As Option 2 - -
As Option 1, but with reduced administrative burden without RegBods
=
Greater involvement of industry in Regbods, but little additional burden of administrative cost due to TFSs; closest, therefore, to the Status Quo
=
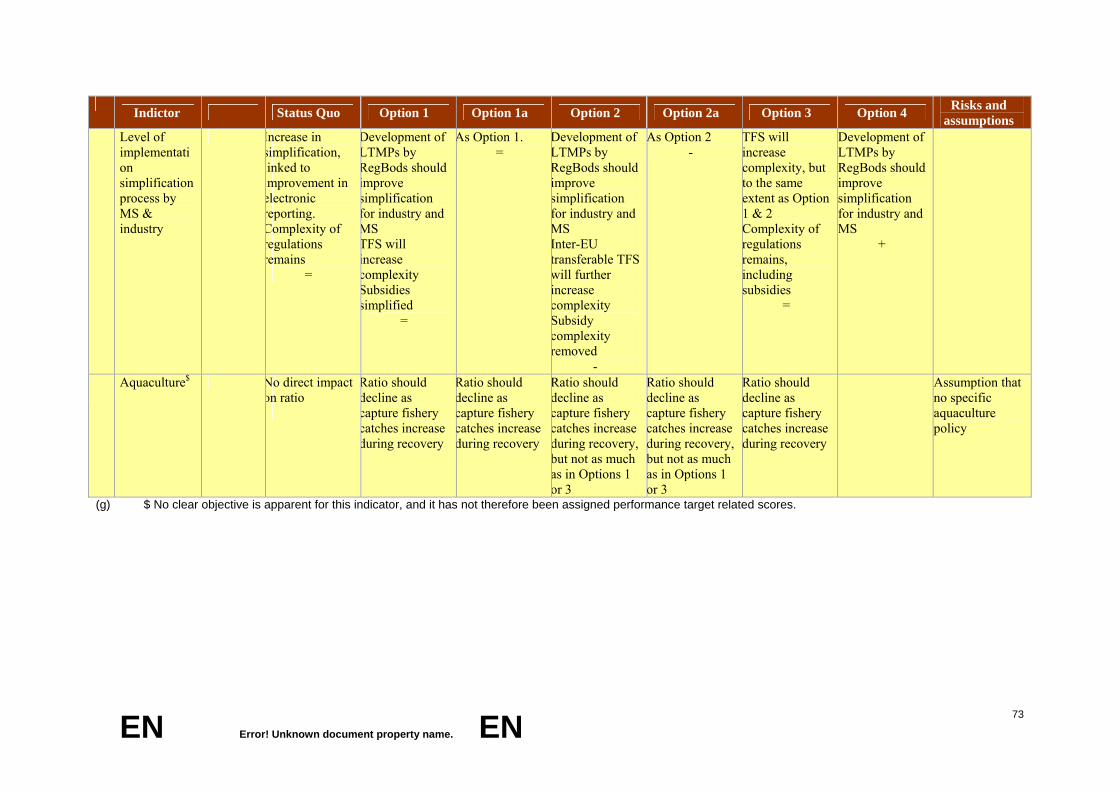
EN Error! Unknown document property name. EN 73
Indictor Status Quo Option 1 Option 1a Option 2 Option 2a Option 3 Option 4 Risks and assumptions
Level of implementation simplification process by MS & industry
Increase in simplification, linked to improvement in electronic reporting. Complexity of regulations remains
=
Development of LTMPs by RegBods should improve simplification for industry and MS TFS will increase complexity Subsidies simplified
=
As Option 1. =
Development of LTMPs by RegBods should improve simplification for industry and MS Inter-EU transferable TFS will further increase complexity Subsidy complexity removed
-
As Option 2 -
TFS will increase complexity, but to the same extent as Option 1 & 2 Complexity of regulations remains, including subsidies
=
Development of LTMPs by RegBods should improve simplification for industry and MS
+
Aquaculture$ No direct impact on ratio
Ratio should decline as capture fishery catches increase during recovery
Ratio should decline as capture fishery catches increase during recovery
Ratio should decline as capture fishery catches increase during recovery, but not as much as in Options 1 or 3
Ratio should decline as capture fishery catches increase during recovery, but not as much as in Options 1 or 3
Ratio should decline as capture fishery catches increase during recovery
Assumption that no specific aquaculture policy
(g) $ No clear objective is apparent for this indicator, and it has not therefore been assigned performance target related scores.
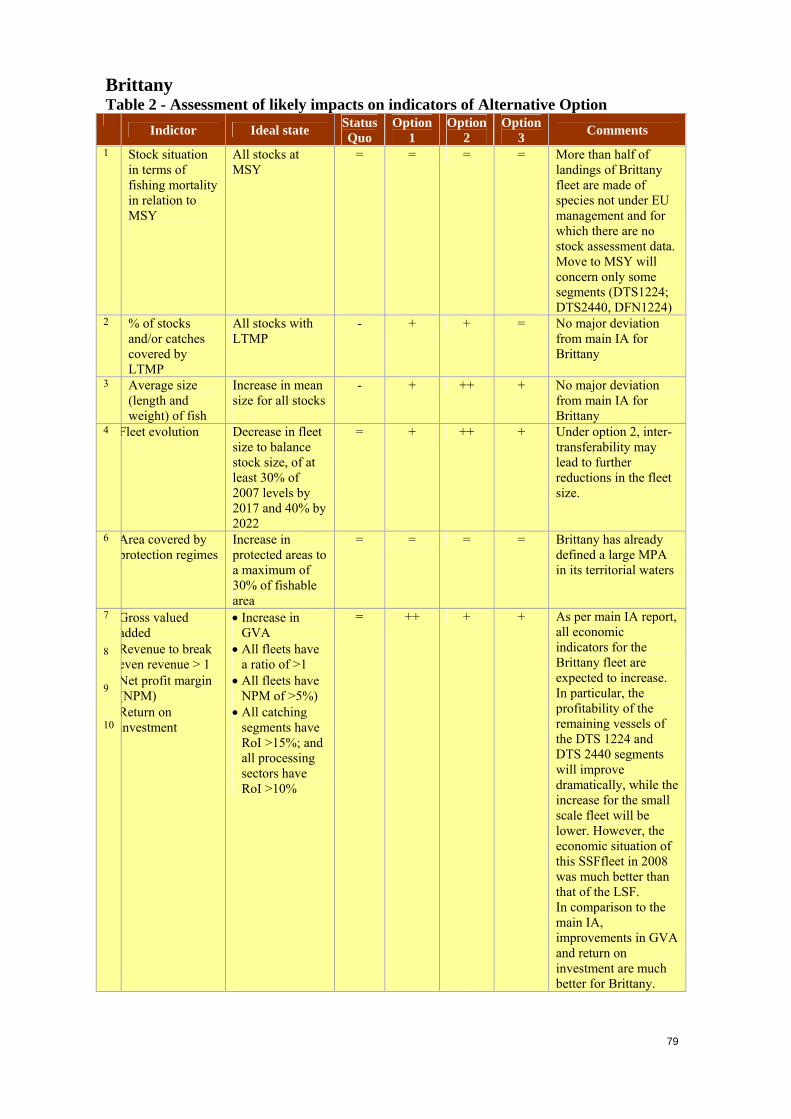
79
Brittany Table 2 - Assessment of likely impacts on indicators of Alternative Option
Indictor Ideal state Status Quo
Option 1
Option 2
Option 3 Comments
1 Stock situation in terms of fishing mortality in relation to MSY
All stocks at MSY
= = = = More than half of landings of Brittany fleet are made of species not under EU management and for which there are no stock assessment data. Move to MSY will concern only some segments (DTS1224; DTS2440, DFN1224)
2 % of stocks and/or catches covered by LTMP
All stocks with LTMP
- + + = No major deviation from main IA for Brittany
3 Average size (length and weight) of fish
Increase in mean size for all stocks
- + ++ + No major deviation from main IA for Brittany
4 Fleet evolution Decrease in fleet size to balance stock size, of at least 30% of 2007 levels by 2017 and 40% by 2022
=
+ ++ + Under option 2, inter-transferability may lead to further reductions in the fleet size.
6 Area covered by protection regimes
Increase in protected areas to a maximum of 30% of fishable area
= =
= = Brittany has already defined a large MPA in its territorial waters
7 8 9 10
Gross valued added Revenue to break even revenue > 1 Net profit margin (NPM) Return on investment
• Increase in GVA
• All fleets have a ratio of >1
• All fleets have NPM of >5%)
• All catching segments have RoI >15%; and all processing sectors have RoI >10%
=
++ + +
As per main IA report, all economic indicators for the Brittany fleet are expected to increase. In particular, the profitability of the remaining vessels of the DTS 1224 and DTS 2440 segments will improve dramatically, while the increase for the small scale fleet will be lower. However, the economic situation of this SSFfleet in 2008 was much better than that of the LSF. In comparison to the main IA, improvements in GVA and return on investment are much better for Brittany.

80
Indictor Ideal state Status Quo
Option 1
Option 2
Option 3 Comments
11 Fish prices, market orientation
Fish prices remain stable
= ++ + + Under option 2, possible negative impacts of the Brittany long distance fleet if EU customs tariffs are dismantled.
12 Level of subsidies / value of landings
Reduced and more targeted ’good’ subsidies
- = +
= No major deviation from main IA for Brittany
13 Employment Improved employment
= - -
- - - - Declines are more important in SSF than in LSF: -36% as opposed to -11% Contraction in fleet size has effect on the ancillary (upstream) industries. This is a sector that has been developed over the past few years to diversify coastal economies
14 Status of fisheries dependent communities
Reversal of declining importance of fishing
= - - - - Overall, the main pillar of the Brittany fishing fleet (the DTS1224 segment) will loose 35% of its vessels. This will impact on upstream and downstream industries in the medium term. Under option 2, inter MS transferability of fishing rights will probably be detrimental to Brittany fleets
16 Social sustainability: GVA per employee
Increase in GVA per employee
= ++
+ + Fairly high increase in GVA per employee, although lower on average than EU (90% as opposed to 100%). However, GVA per employee is expected to increase by 117% for the SSF under option1
17 Attractiveness of the sector
Income at least 100% of national average
- ++ ++ ++ Under all options, model prediction for Brittany suggest average wage almost twice as high as the national average

81
Indictor Ideal state Status Quo
Option 1
Option 2
Option 3 Comments
28 Safety The accident rate (accidents per FTE) should decrease to zero
= ++ + ++ Mostly as per IA main report. Brittany vessels are old. Improved financial situation will allow investments in new and safer vessels. However, safety at sea is already a priority. If option 2 removes subsidies for training programmes, impact of the reform on safety may be slightly lower than expected.
20 Regions and MS having adopting RBM system
RBM systems uptake should increase to more than 50% [TFS uptake in 100% of unprofitable fleets]
-
+ +
=
The Brittany fishing industry seems ready to accept TFS for LSF with transferability limited to MS. The SSF is not keen to move to TFS
21 Data provided by MS
Full compliance by all MS with reporting obligations
= + +
+
DCR requirements well accepted by the Brittany industry, helped by the presence in the region of the main operator of the French DCR (IFREMER)
22 Rate of utilization of allocations (quotas)
Utilisation increases to 100%
- = + = No major deviation from main IA for Brittany
23 Level of quotas exchanges
decrease in quota swaps33
= + +
+ Brittany fleets only marginally involved in swaps with other MS.
29 Time taken to reach a decision
Time taken should not increase significantly
- + = = Brittany is a maritime region at the crossroad of several fisheries. Already involved in three RACs
24 Level of coherence with WTO & other EC policy
All policies coherent with the EU’s WTO obligations
- + ++ + No regional particularity found
25 Impact for the private sector
Administrative cost and burden should decrease
= - - - = No regional particularity deviating fro main IA found
33. A reduction in swaps implies efficiency of the quota allocation system and decreasing administrative
burden. A need for swaps implies individual fleet specialisation and economic efficiency that is not realised by the current allocation system.
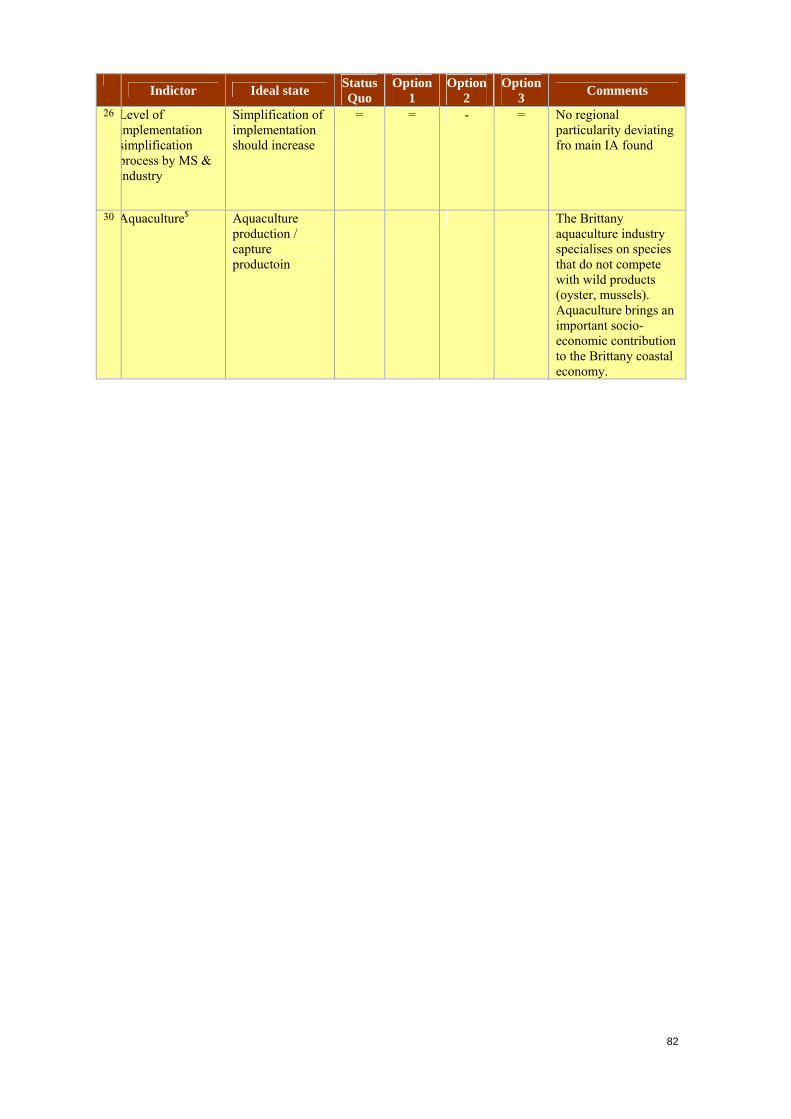
82
Indictor Ideal state Status Quo
Option 1
Option 2
Option 3 Comments
26 Level of implementation simplification process by MS & industry
Simplification of implementation should increase
= = - = No regional particularity deviating fro main IA found
30 Aquaculture$ Aquaculture production / capture productoin
The Brittany aquaculture industry specialises on species that do not compete with wild products (oyster, mussels). Aquaculture brings an important socio-economic contribution to the Brittany coastal economy.
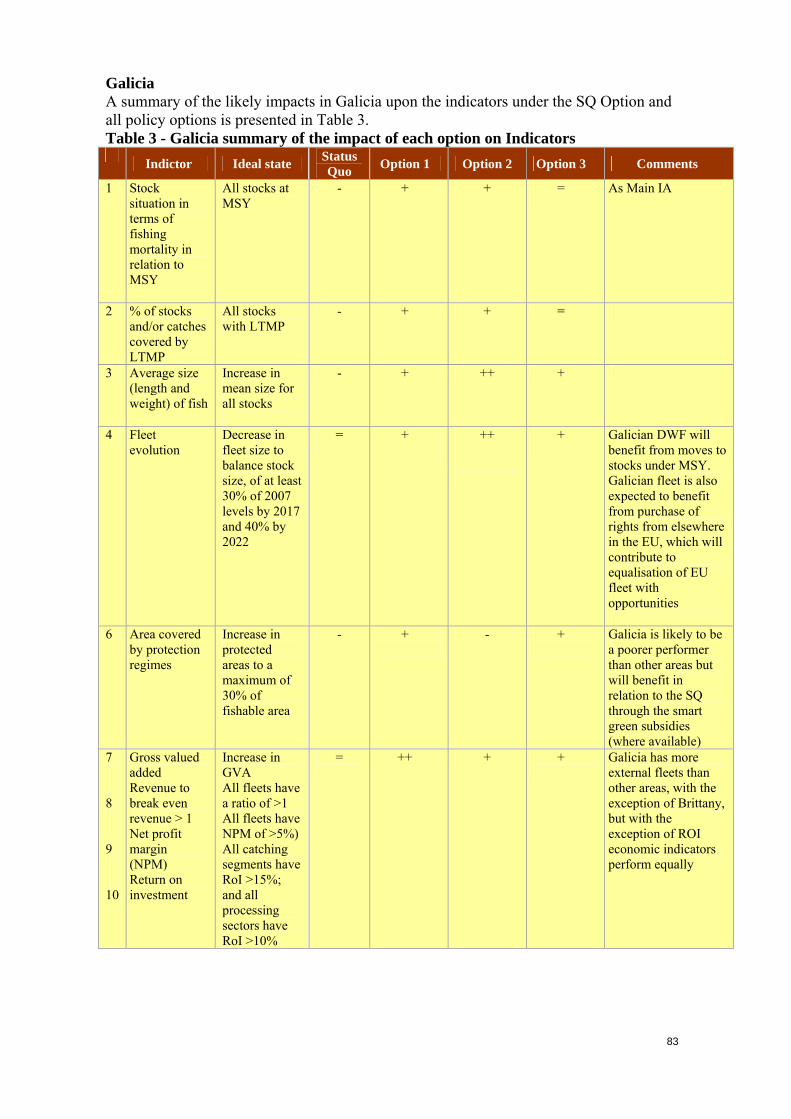
83
Galicia A summary of the likely impacts in Galicia upon the indicators under the SQ Option and all policy options is presented in Table 3. Table 3 - Galicia summary of the impact of each option on Indicators Indictor Ideal state Status
Quo Option 1 Option 2 Option 3 Comments
1 Stock situation in terms of fishing mortality in relation to MSY
All stocks at MSY
- + + =
As Main IA
2 % of stocks and/or catches covered by LTMP
All stocks with LTMP
- + + =
3 Average size (length and weight) of fish
Increase in mean size for all stocks
- + ++ +
4 Fleet evolution
Decrease in fleet size to balance stock size, of at least 30% of 2007 levels by 2017 and 40% by 2022
=
+
++
+
Galician DWF will benefit from moves to stocks under MSY. Galician fleet is also expected to benefit from purchase of rights from elsewhere in the EU, which will contribute to equalisation of EU fleet with opportunities
6 Area covered by protection regimes
Increase in protected areas to a maximum of 30% of fishable area
- +
- +
Galicia is likely to be a poorer performer than other areas but will benefit in relation to the SQ through the smart green subsidies (where available)
7 8 9 10
Gross valued added Revenue to break even revenue > 1 Net profit margin (NPM) Return on investment
Increase in GVA All fleets have a ratio of >1 All fleets have NPM of >5%) All catching segments have RoI >15%; and all processing sectors have RoI >10%
=
++ + +
Galicia has more external fleets than other areas, with the exception of Brittany, but with the exception of ROI economic indicators perform equally

84
Indictor Ideal state Status Quo Option 1 Option 2 Option 3 Comments
11 Fish prices, market orientation
Fish prices remain stable
= ++ = + Removal policy and subsidies directed toward marketing and promotional measures is likely to negatively affect prices under option 2, though this effect may be offset by fish price increases as a result of improved stock status.
12 Level of subsidies / value of landings
Reduced and more targeted ’good’ subsidies
- = + = The Galician fish possessing and marketing industry receives an important amount of EFF resources under axis 2 and 3, which contribute to keep prices and improve value added in the marketing/processing industry. Under option 2, this market/fish processing industry support is removed..
13 Employment Improved employment
= -
- - Employment likely to decrease under all policy options. Employment likely to decrease in ancillary sector and increase in processing services.
14 Status of fisheries dependent communities
Reversal of declining importance of fishing
= = ++ = Rationalisation of fleets and consolidation of quotas may affect the degree to which benefits are shared within communities. Loss of subsidies may affect fish prices although this may be offset by increased catches. Under option 2, fishing dependent communities in Galicia may benefit from gains of fishing rights from other countries.
16 Social sustainability: GVA per employee
Increase in GVA per employee
= ++
++
++ Significantly benefits from increases in GVA and profitability

85
Indictor Ideal state Status Quo Option 1 Option 2 Option 3 Comments
17 Attractiveness of the sector
Income at least 100% of national average
- ++ + ++ Increase due to improvement in profitability and crew wages.
28 Safety The accident rate (accidents per FTE) should decrease to zero
= ++ + + Positive because of reduced competition under TFS. Will largely follow impacts on economic indicators because of link between safety and profitability
30 Aquaculture No direct impact on ratio
+ - + There is no direct competition with farmed products to capture fisheries products. However, positive influences of market organisation to boost fish prices will ultimately positively impact prices of aquaculture products.
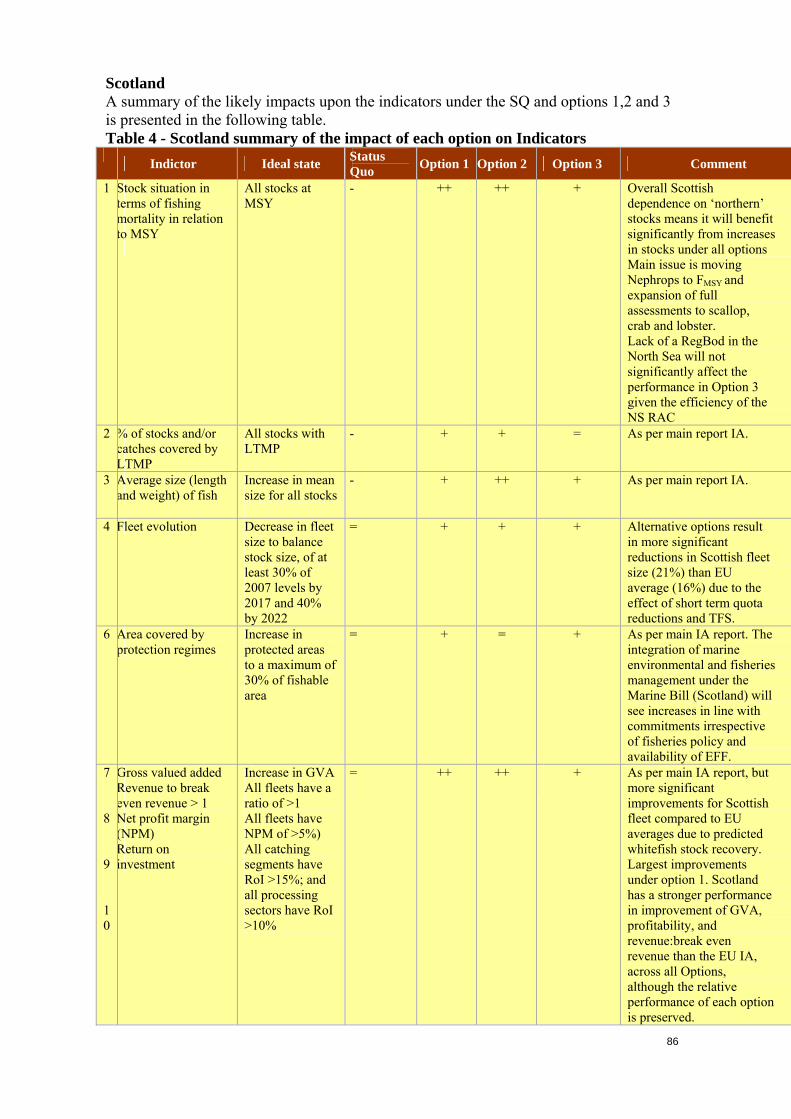
86
Scotland A summary of the likely impacts upon the indicators under the SQ and options 1,2 and 3 is presented in the following table. Table 4 - Scotland summary of the impact of each option on Indicators Indictor Ideal state Status
Quo Option 1 Option 2 Option 3 Comment
1 Stock situation in terms of fishing mortality in relation to MSY
All stocks at MSY
- ++ ++ + Overall Scottish dependence on ‘northern’ stocks means it will benefit significantly from increases in stocks under all options Main issue is moving Nephrops to FMSY and expansion of full assessments to scallop, crab and lobster. Lack of a RegBod in the North Sea will not significantly affect the performance in Option 3 given the efficiency of the NS RAC
2 % of stocks and/or catches covered by LTMP
All stocks with LTMP
- + + = As per main report IA.
3 Average size (length and weight) of fish
Increase in mean size for all stocks
- + ++ + As per main report IA.
4 Fleet evolution Decrease in fleet size to balance stock size, of at least 30% of 2007 levels by 2017 and 40% by 2022
= + + + Alternative options result in more significant reductions in Scottish fleet size (21%) than EU average (16%) due to the effect of short term quota reductions and TFS.
6 Area covered by protection regimes
Increase in protected areas to a maximum of 30% of fishable area
= + = + As per main IA report. The integration of marine environmental and fisheries management under the Marine Bill (Scotland) will see increases in line with commitments irrespective of fisheries policy and availability of EFF.
7 8 9 10
Gross valued added Revenue to break even revenue > 1 Net profit margin (NPM) Return on investment
Increase in GVA All fleets have a ratio of >1 All fleets have NPM of >5%) All catching segments have RoI >15%; and all processing sectors have RoI >10%
=
++ ++ +
As per main IA report, but more significant improvements for Scottish fleet compared to EU averages due to predicted whitefish stock recovery. Largest improvements under option 1. Scotland has a stronger performance in improvement of GVA, profitability, and revenue:break even revenue than the EU IA, across all Options, although the relative performance of each option is preserved.

87
Indictor Ideal state Status Quo Option 1 Option 2 Option 3 Comment
11
Fish prices, market orientation
Fish prices remain stable
= ++ + + As with main IA report
12
Level of subsidies / value of landings
Reduced and more targeted ’good’ subsidies
-
= + = No significant differences over Status Quo position from changes to subsidies policy except Option 2 where EFF subsidies removed.
13
Employment Improved employment
-
-
- - - Marginally larger decreases in employment seen in Scotland (-19%) than EU as a whole (-14%) through fleet contraction. Similar reductions for ancillary sector, but increase in processing employment through increased landings. Further reductions expected if inter EU transfers possible under Option 2.
14
Status of fisheries dependent communities
Reversal of declining importance of fishing
= - - - = Scottish coastal communities vulnerable to effects of further consolidation through TFSs resulting in some ports & infrastructure becoming non-viable even under Option 1. This would likely be exacerbated further if inter MS transfers possible under Option 2. The effects may be easier to mitigate and manage under Option 3 in which the changes can be expected to occur more gradually.
16
Social sustainability: GVA per employee
Increase in GVA per employee
= ++ + + As per main IA report – positive results but comparatively greater improvement for Scottish fleet (135%) compared to EU average (100%)
17
Attractiveness of the sector
Income at least 100% of national average
= ++ + + As per main IA report – positive results but greater improvement for Scottish fleet (135%) compared to EU average (100%)
28
Safety The accident rate (accidents per FTE) should decrease to zero
= ++ + + As per main IA report - Will largely follow impacts on economic indicators because of link between safety and profitability

88
Indictor Ideal state Status Quo Option 1 Option 2 Option 3 Comment
20
Regions and MS having adopting RBM system
RBM systems uptake should increase to more than 50% [TFS uptake in 100% of unprofitable fleets]
= + +
=
As per main IA report
21
Data provided by MS
Full compliance by all MS with reporting obligations
+ + + + Level of compliance in Scotland is now seen as high due to measures such as VMS and introduction of Registration of Buyers and Sellers
22
Rate of utilization of allocations (quotas)
Optimum utilisation at >70% [Utilisation increases to 100% in fleets under TFS]
+ + + + Utilisation levels already high for Scotland
23
Level of quotas exchanges
decrease in quota swaps34
= + + = As per main IA report
29
Time taken to reach a decision
Time taken should not increase significantly
- + + - As per main IA report
24
Level of coherence with WTO & other EC policy
All policies coherent with the EU’s WTO obligations
- + ++ + Risk/assumption as to final WTO decision on subsidies which is not yet known
25
Impact for the private sector
Administrative cost and burden should decrease
= - - = As per main IA report
26
Level of implementation simplification process by MS & industry
Simplification of implementation should increase
= + + = As per main IA report – development of LTMPs will improve long term planning for industry.
30
Aquaculture$ Aquaculture production / capture production
Assumed no specific aquaculture policy. Very important Scottish salmon sub-sector (and dependent processing) could be vulnerable to international competition via WTO/IMO trade policy changes.
34 A reduction in swaps implies efficiency of the quota allocation system and decreasing administrative
burden. A need for swaps implies individual fleet specialisation and economic efficiency that is not realised by the current allocation system.

89
Indictor Ideal state Status Quo Option 1 Option 2 Option 3 Comment
16b
Relative Stability$ There is no objective for this indicator
Relative stability maintained
Relative stability maintained
Relative stability would be eroded
Relative stability would be maintained
Scotland is strongly in favour of retaining relative stability.

90
Sicily A summary of the likely impacts in Sicily upon the indicators under the SQ and options 1, 2 and 3 is presented in the following table. Table 5 - Sicily Summary of the impact of each option on Indicators Indictor Ideal state Status
Quo Option
1 Optio
n 2 Optio
n 3 comment
1 Stock situation in terms of fishing mortality in relation to MSY
All stocks at MSY
= + + + As Sicilian fisheries are multi-species, MSY can be achieved for only a stock. Options 1 and 3 can achieve MSY for giant red shrimp. Option 2 can achieve MSY for European hake.
2 % of stocks and/or catches covered by LTMP
All stocks with LTMP
= = = = The current Bluefin tuna LTMP will remain as the only LTMP applicable to the Sicilian region.
3 Average size (length and weight) of fish
Increase in mean size for all stocks
= + + + As with main IA. A small improvement should come from the change in mesh size based on the Mediterranean regulation and increases in stock sizes with recovery.
4 Fleet evolution
Decrease in fleet size to balance stock size, of at least 30% of 2007 levels by 2017 and 40% by 2022
= + = + Decrease in fleet size would be stronger in the alternative scenarios rather than in Status Quo. In Options 1 and 3 this decline would be consistent with achieving balance with opportunities. However in Option 2, the entire Sicilian fleet will decrease by 25% from the 2008 level in 2017 and 32% in 2022, a greater decline than the ideal state defined at EU level, and would lead to the exit of almost all trawlers from the fleet. Option 2 is therefore not considered ideal.
6 Area covered by protection regimes
Increase in protected areas to a maximum of 30% of fishable area
= + = + As per main IA report.

91
Indictor Ideal state Status Quo
Option 1
Option 2
Option 3 comment
7 8 9 10
• Gross valued added
• Revenue to break even revenue > 1
• Net profit margin (NPM)
• Return on investment
• Increase in GVA
• All fleets have a ratio of >1
• All fleets have NPM of >5%)
• All catching segments have RoI >15%; and all processing sectors have RoI >10%
= ++ + ++ All scenarios show an improvement in economic indicators that is equal to or greater than the EU average. The only significant reduction in GVA for the catching sector is expected under Option 2 due to the exit of almost all trawlers from the fleet. However ROI, profitability and revenue:break even revenue perform well under Option 2. As a reduction in landings is expected in all scenarios, the economic performance of the processing sector will be negative. The worst performance is registered under Option 2.
11
Fish prices, market orientation
Fish prices remain stable
= ++ + + As with main IA report.
12
Level of subsidies / value of landings
Reduced and more targeted ’good’ subsidies
-
= + = As with main IA report.
13
Employment Improved employment
= -
- - - Decreases in employment are expected under all scenarios as employment is supposed to follow fleet evolution. Lower reductions are expected under Status Quo.
14
Status of fisheries dependent communities
Reversal of declining importance of fishing
= + = + Decrease in the importance of fishing sector is expected under all scenarios in terms of employment. However, with the exception of Option 2, fishing sector would increase its relevance in terms of GVA. This is particularly true under Option 1 and 3. Inter-EU transferability will not significantly impact the Sicilian situation, although the massive reduction in trawlers and lower catches under this option are expected to have an impact.

92
Indictor Ideal state Status Quo
Option 1
Option 2
Option 3 comment
16
Social sustainability: GVA per employee
Increase in GVA per employee
= ++ + ++ Strong increases are expected under Option 1 and 3, but also Option 2 (even if at lower extent). However, also Status Quo shows an increase, but lower than the other options.
17
Attractiveness of the sector
Income at least 100% of national average
= + = + Increasing trends are expected for the catching sector under all scenarios at different extent. The highest increase is expected under Option 1 and 3. However, average salaries in the catching sector remain lower than the average salary at national level.
28
Safety The accident rate (accidents per FTE) should decrease to zero
= ++ + + As with main IA report.
20
Regions and MS having adopting RBM system
RBM systems uptake should increase to more than 50% [TFS uptake in 100% of unprofitable fleets]
- + + = As with main IA report (If Generalized Licence Scheme is considered as a RBM system, 100% of fleet is managed under RBM system.)
21
Data provided by MS
Full compliance by all MS with reporting obligations
= + + + As with main IA report.
22
Rate of utilization of allocations (quotas)
Optimum utilisation at >70% [Utilisation increases to 100% in fleets under TFS]
Not applicable to Sicilian fleet.
23
Level of quotas exchanges
decrease in quota swaps35
Not applicable to Sicilian fleet.
35 A reduction in swaps implies efficiency of the quota allocation system and decreasing administrative
burden. A need for swaps implies individual fleet specialisation and economic efficiency that is not realised by the current allocation system.
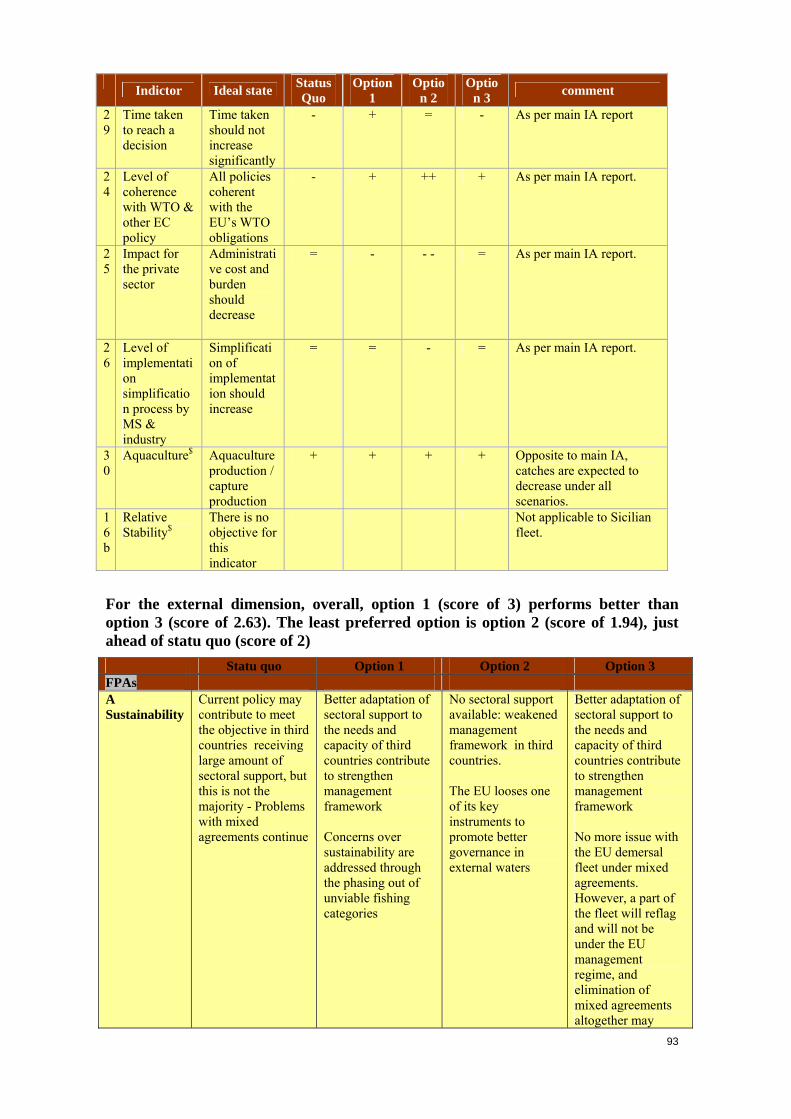
93
Indictor Ideal state Status Quo
Option 1
Option 2
Option 3 comment
29
Time taken to reach a decision
Time taken should not increase significantly
- + = - As per main IA report
24
Level of coherence with WTO & other EC policy
All policies coherent with the EU’s WTO obligations
- + ++ + As per main IA report.
25
Impact for the private sector
Administrative cost and burden should decrease
= - - - = As per main IA report.
26
Level of implementation simplification process by MS & industry
Simplification of implementation should increase
= = - = As per main IA report.
30
Aquaculture$ Aquaculture production / capture production
+ + + + Opposite to main IA, catches are expected to decrease under all scenarios.
16b
Relative Stability$
There is no objective for this indicator
Not applicable to Sicilian fleet.
For the external dimension, overall, option 1 (score of 3) performs better than option 3 (score of 2.63). The least preferred option is option 2 (score of 1.94), just ahead of statu quo (score of 2)
Statu quo Option 1 Option 2 Option 3 FPAs A Sustainability
Current policy may contribute to meet the objective in third countries receiving large amount of sectoral support, but this is not the majority - Problems with mixed agreements continue
Better adaptation of sectoral support to the needs and capacity of third countries contribute to strengthen management framework Concerns over sustainability are addressed through the phasing out of unviable fishing categories
No sectoral support available: weakened management framework in third countries. The EU looses one of its key instruments to promote better governance in external waters
Better adaptation of sectoral support to the needs and capacity of third countries contribute to strengthen management framework No more issue with the EU demersal fleet under mixed agreements. However, a part of the fleet will reflag and will not be under the EU management regime, and elimination of mixed agreements altogether may
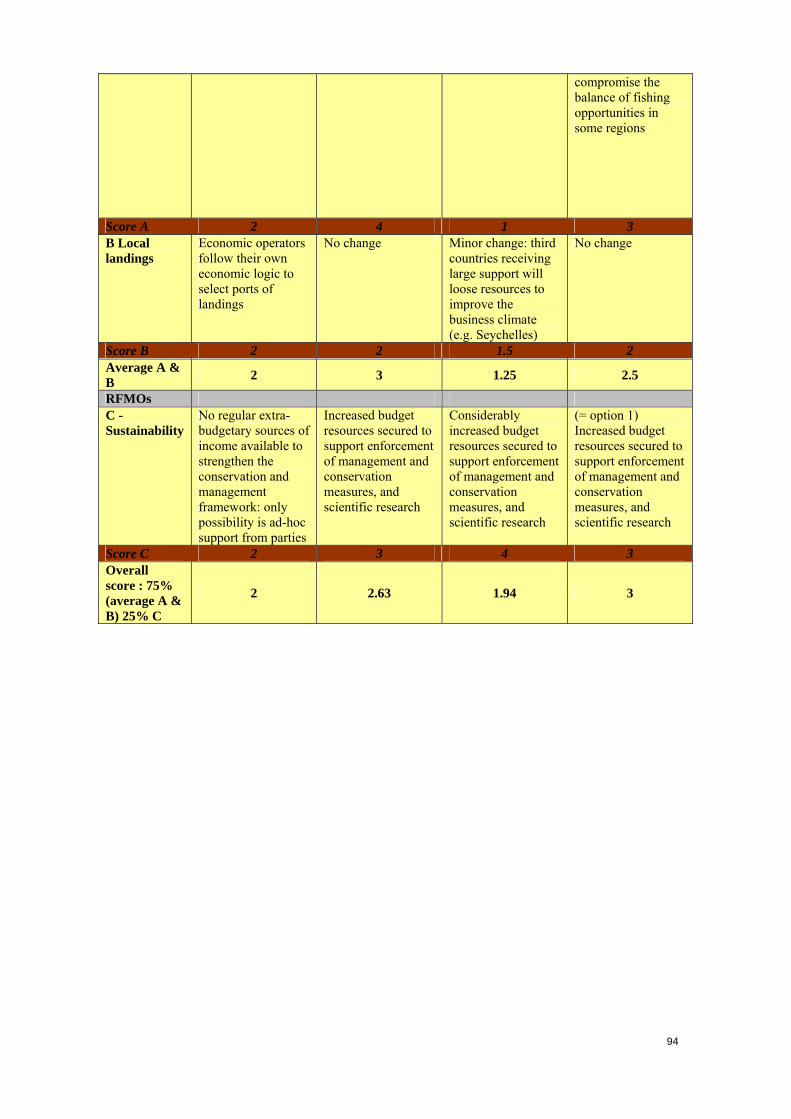
94
compromise the balance of fishing opportunities in some regions
Score A 2 4 1 3 B Local landings
Economic operators follow their own economic logic to select ports of landings
No change Minor change: third countries receiving large support will loose resources to improve the business climate (e.g. Seychelles)
No change
Score B 2 2 1.5 2 Average A & B 2 3 1.25 2.5
RFMOs C - Sustainability
No regular extra-budgetary sources of income available to strengthen the conservation and management framework: only possibility is ad-hoc support from parties
Increased budget resources secured to support enforcement of management and conservation measures, and scientific research
Considerably increased budget resources secured to support enforcement of management and conservation measures, and scientific research
(= option 1) Increased budget resources secured to support enforcement of management and conservation measures, and scientific research
Score C 2 3 4 3 Overall score : 75% (average A & B) 25% C
2 2.63 1.94 3

95
ANNEX 9 - EXTRAPOLATIONS OF THE RESULTS TO THE WHOLE EU CATCHING SECTOR If we extrapolate the results of the simulations to the whole EU catching sector, we would obtain the following results. As mentioned above, these values cannot be taken at face value but as trends:

96
Income
(millions €)
GVA (millions
€)
Net profit /income
(%)
Employment (number of
people)
Wage/ employee
(€)
VA/ Employee
(€) Reference
period 6851 3069 6,5 155000 12000 20000
2012 Status quo 6986,4 3065,2 10,1 140838,0 12859,3 21983,7 Option 1 6939,0 3071,1 10,1 138186,6 13141,5 22448,9 Option 1a 6727,1 2969,3 9,6 134480,8 13046,2 22305,7 Option 2 6726,6 2968,5 9,6 134445,0 13048,0 22303,5 Option 2a 6726,6 2968,5 9,6 134445,0 13048,0 22303,5 Option 3 6935,0 3069,2 10,1 138126,2 13140,9 22444,6 Option 4 6935,2 2978,9 9,6 141648,9 12472,7 21238,6
2017 Status quo 7057,4 3368,0 14,9 134152,4 14429,3 25359,4 Option 1 7931,6 4846,1 28,7 115404,5 23184,3 42417,1 Option 1a 7708,5 4670,0 28,7 113809,6 22565,3 41441,1 Option 2 7058,9 4005,9 23,7 113541,6 19667,0 35638,3 Option 2a 7096,2 4002,8 23,7 113881,1 19586,5 35505,2 Option 3 7246,2 4135,1 24,1 115643,5 19982,4 36118,6 Option 4 7245,7 3887,6 19,1 122905,5 18003,1 31957,3
2022 Status quo 7099,3 3632,5 19,3 127178,6 16183,6 28850,1 Option 1 8635,9 5850,0 35,0 106652,7 30297,5 55405,3 Option 1a 8356,1 5612,3 34,4 105124,8 29338,0 53923,7 Option 2 7671,2 4904,5 31,0 105142,7 25880,3 47117,4 Option 2a 7660,4 4891,1 31,0 105218,6 25780,1 46955,3 Option 3 7824,5 5023,1 31,2 106335,5 26260,2 47715,0 Option 4 7825,0 4705,2 17,2 116485,7 22806,9 40800,9
*.Average data from AER. Not all MS covered
Annex A: External Policy - CFP Impact Analysis
CFP Impact Assessment Phase II External Governance 97
ANNEX 10 - MARKETS DEVELOPMENT
Overview of EU market developments and trends for fisheries and aquaculture products Supply, trade and market structures and consumption preferences, have dramatically changed in the last decade in the EU and this should be integrated in the approach of reforming EU market policy.
The EU market is the first market for fisheries and aquaculture products (FAPs) in the world in value (55 billion euro representing 12 millions tonnes).
In terms of supply, whilst the market increased by nearly 2 million tonnes (equivalent live weight) between 1999 and 2007, the EU self-sufficiency rate fell from 57% to 39% in the same period. European fishery production has been steadily decreasing for ten years (-28% between 1996 and 2006, which represents a loss of more than 2 million tonnes36);. Aquaculture production in the EU, with a production of 1,300,000 tonnes in 2006, does not make up for the reduction in fishing fleet catches. Its production stabilises overall between 1996 and 2006 but registers changes in its structure. Freshwater aquaculture (-15%) declined, whilst saltwater aquaculture increased significantly (+20% between 1996 and 2005)37.
In terms of consumption, the EU is far from being a homogenous market: Spain, France and Italy alone make up 62% of expenditures. FAPs account on average for 4% of food expenditure across EU27, but are above 5% in France, 8% in Spain and 10% in Portugal. On average, European people get 15% of their protein intake from FAPs.
The majority of markets are going through a consumption growth phase, which is particularly strong in traditional markets such as France (increase of 5kg/year/inhabitant in 10 years) and in several Central and Eastern European markets which are experiencing a catch-up phenomenon in their levels of consumption of FAPs.
In terms of species of fish, demand has evolved over recent years according to several factors:
• reduction in availability of certain traditional species of fish (cod, plaice, haddock, redfish, etc);
• drop in herring consumption (Germany, Poland, etc);
• increase in availability of sea bass and sea bream in Southern European markets;
• increase in demand for salmon in new MS and tropical prawn;
• changes in qualitative and economic expectations of consumers (more fish fillets and less whole fish, ready to eat and processed food, new consumers for new products without a strong taste and at a low price)
• processors and retailers requirements in terms of volume and availability.
36 it affects above all species that are subject to quotas and for over a million tonne it is linked to the reduction in
Denmark's production, essentially for non-human uses. The demersal fish group has fallen more sharply (-36%) than that of pelagic fish (-21%).
37 Aquaculture production in the EU is dominated by the 3 large Mediterranean countries (Spain, France and Italy) and the United Kingdom, which between them account for two thirds of EU production. During the past few years alone, production of "Mediterranean" species has increased: +60% for turbot, +37% for sea bass and plus +24% for sea bream.

Annex A: External Policy - CFP Impact Analysis
CFP Impact Assessment Phase II External Governance 98
Consumption long term trends demonstrate that European markets are open to the arrival of new species of fish (for example Alaskan pollock in the 80’s, Nile perch in the 90’s, pangasius since mid 2000’s, etc.) which replace certain others (drop in availability of some white fish species and deep sea species for instance). There is a tendency towards homogenisation and harmonisation within the EU, with the spread of distribution networks.
Fresh fish continues to dominate in the majority of European countries, particularly in southern European countries (Spain, France and Italy) where more than 50% of FAPs are consumed in this form. There is an interesting increase in the consumption of fresh fish in Eastern European countries, led by the availability of fresh salmon and refrigerated pangasius fillets. Innovations in terms of packaging (fish or seafood packaged in a protective atmosphere) also help to improve mass-market availability. Deep-frozen products are attracting growing and consistent interest across almost all markets. Ready to eat meals, breaded fish and fillets are growth drivers in this segment. The canned and pickled fish market segment seems to have reached maturity, showing even signs of slight declines in several MS. Their very high penetration rates and their practicality do guarantee them a minimum market share in the long-term in spite of the greater dynamism of other segments. The salted/dried/smoked fish segment is experiencing different growth dynamics depending on the products. The smoked fish segment, led by salmon, is witnessing strong growth and still retains an image of luxury or festive product whilst offering generally affordable price levels. Demand for dried, salted cod remains strong in the Iberian Peninsula but is declining in Italy.
The out-of-home catering sector (HORECA for HOtels, REstaurants and CAfes) has experienced strong growth in recent years in the majority of MS due to lifestyle changes that favour eating out. FAPs are very widely available in out-of-home catering, which is becoming a significant purchaser and also an important player in terms of provision of information to consumer. This consumer shift benefits traditional restaurants and also less traditional as observed with the increased numbers of sushi bars.
Supermarkets have a majority share of FAP retail distribution that continues to grow in all major EU markets. This growth now essentially comes from the distribution of fresh products, given that domination is already almost total in the frozen and canned segments. Mass-market distribution of fresh fish is less significant in southern European countries than northern ones. Spain is the major market where supermarkets have a lower market share in selling fish products (55% in 2006, as against 67% for Italy, 77% for Germany, 78% for France and 83% for the United Kingdom).
The demand for FAPs in the EU is influenced by a combination of economic, sociological and marketing factors.
Prices and purchasing power are the most important elements related to fish consumption. FAPs are often considered as relatively expensive products and demand for them is elastic, according to price and purchasing power.
Health qualities and nutritional values of fish are important criteria for consumers throughout the EU. The current trend for consuming healthy and natural products benefits the fish sector also. Quality in the broadest sense (organoleptic features, guarantee of freshness and safety) is also taken into consideration by European consumers when purchasing FAPs. Lastly, respect for the environment and product origin is valued in certain countries, particularly in Northern Europe.
European quality marks (PDO, PGI) are very limited in the fishery and aquaculture sector in particular when comparing to other food sector. Development of distributor brands is

Annex A: External Policy - CFP Impact Analysis
CFP Impact Assessment Phase II External Governance 99
observed in this field. Regional quality labels and brands are also common in some countries (Spain and France); however, these quality labels are usually national in scope and register little recognition outside their countries of origin.
Environmental labels, particularly the Marine Stewardship Council (MSC) certification, have seen rapid increases, driven by Northern European countries so far and large retail chains. Many retailers have in fact committed to maximising their certified product range. Over 6% of fisheries products sold in the EU have already been certified in a sustainable fishing programme.
Growth in consumption in the EU is expected to continue in the future (+0.5% per year between now and 2030. A strong growth in demand is expected for prepared products, shellfish and fillets. On this assumption the EU would register an increase in demand of 1,500,000 tonnes in 2030 supplied to a very large extent by imports. Dependence on white fish imports already reaches 90%, is above 80% for salmon, and is generally high for all frozen and smoked products, while it represents some 30% for small pelagics.
Price and profit margin structure analysis is complex due to the multiplicity of products, sectors and markets, externalities, and the lack of consistency and continuity in systems for measuring prices at the various levels in the chain. The price of fish, as for the majority of goods, greatly exceeds the value of the physical product itself. It incorporates various services: grouping, transport, cold chain, preparation, waste, retails, marketing… provided by a supplier to the final buyer. First sale prices of fresh fish products are generally characterised by significant volatility. Several channels often co-exist to supply the various types of distribution, retail and HORECA, with specific pricing mechanisms and profit margins at each intermediary level. Prices of imported products appear to be much more stable, notably since they are linked to major commodities coming from aquaculture or major fisheries.
Profitability at the various stages in the fishery and aquaculture product chains is lower overall than that for other food supply chains.

Annex A: External Policy - CFP Impact Analysis
CFP Impact Assessment Phase II External Governance 100
ANNEX 11 – EXTERNAL DIMENSION
INTRODUCTION In the frame of the Impact Assessment of a reformed CFP, the impacts on the EU fishing fleet operating outside EU waters in the international waters or in the EEZ of third countries as well as impacts on international institutional partners have been considered separately given the specificities of this aspect of the CFP. The activities of the EU fleet operating outside EU waters (the so-called external fleet) are regulated by two types of governance instruments. For those EU fishing vessels operating in the high seas, the governance framework is the network of Regional Fisheries Management Organisations (RFMOs) that associates all parties having a legitimate interest in the fisheries concerned (a multilateral framework). For those EU fishing vessels operating in the EEZ of third countries, the governance framework is the series of Fisheries Partnership Agreements (FPA) concluded bilaterally between the EU and the partner coastal State concerned. The multilateral (RFMOs) and bilateral arrangements to which the EU is party include different provisions for access (financial, technical) but have in common the overall objective of promoting responsible fishing practices, including the fight against IUU fishing. In the frame of this Impact Assessment, the options considered focus on financial conditions for access. For bilateral agreements, the main option examines how to achieve a better balance between the private and public sector for payment of access. For RFMOs, the main option is to identify extra sources of budgetary incomes that would be made available to RFMOs to support strengthening of capacities to adopt and enforce improved management and conservation measures. The following options are considered: The evolution of these two types of multi and bilateral governance framework is not restricted to the financial side. The evolution should be also governed by the objectives set out by the international community and the EU under other policy agendas, including development issues. Concerning RFMOs, the ongoing process of external review of RFMO performances should be closely monitored as the reform of the CFP will have to include new initiatives adopted multilaterally to improve the conservation and management framework according to the results of the reviews. Concerning bilateral agreements, the EU has more flexibility to modify the overall framework. A comprehensive external overall evaluation of Fisheries Partnership Agreement has recently been completed, with conclusions and recommendations that should be useful to improve the performances of the instrument38. The European Commission has retained 3 options for the reform of the external strand of the Common Fisheries Policy. The options are presented in the next table.
38 “Overall Evaluation of Fisheries Partnership Agreements”, Revised final report published April 2009.
Prepared by Oceanic Développement / Megapesca under Framework Contract FISH 2006/20, specific convention n°17.

Annex A: External Policy - CFP Impact Analysis
CFP Impact Assessment Phase II External Governance 101
Option Option 1 (as per one of the possible pillar of the forthcoming CFP reform considering a decrease of level of public subsidies)
FPA: Cost of access borne by EU shipowners with a transitional period for all the agreements including the mixed agreements which are maintained for some limited fisheries categories RFMOs: Enhanced participation including financial contribution of EU ship owners
Option 2 (as a radical option, the EU involvement does not go beyond its minimal obligations under UNCLOS)
FPA: no bilateral agreements. RFMOs : EU leadership in RFMO with increased funding, including from financial contribution of EU ship owners
Option 3 (as a nuanced option between 1 & 2)
FPA: Cost of access borne by EU shipowners without transitional period. Termination of mixed agreements which would become tuna agreements or eventually pelagic agreements only RFMOs : as per option 1
Status quo (for memory)
FPA: No change but with fewer EU vessels RFMOs: No change (RFMOs are however in a review process)
This contribution is organised in two parts: 1- A framing section (starting page 102) to detail the current state of play and to assess to what extent the options are feasible as proposed, and when they are not, to set the limits of what is feasible or can be expected given the current state of play and economic considerations. It is a sort of feasibility study of the options, necessary as the options have wide-ranging implications on the EU (institutions and private sector) and the third countries. 2- An impact section (starting page 157) detailing the impacts on the parties concerned by a reformed bilateral agreement policy following a template proposed by the Commission.
Annex A: External Policy - CFP Impact Analysis
CFP Impact Assessment Phase II External Governance 102
1. The options: what is the current state of play and what are the implications of the options on the EU and the third countries
1.1. Current state of play
1.1.1. Financial contribution under FPAs: what amounts and what for ?
Since the 2002 reform of the CFP and the 2004 Council conclusions on bilateral agreements concluded by the EU, the budget transfers granted to partner third countries under FPAs are organised as follows : The amount of the contribution to be paid by the EU is one of the outputs of the negotiation. The value of the contribution takes into account i) the value of the fishing rights negotiated and ii) an additional amount granted to support the implementation of the national fisheries policy. Until now, the amount granted to the sectoral support was proportional with the value of fishing rights (+/- 20% of fishing rights). The two financial components i) and ii) are amalgamated into a single contribution. During the negotiation, the parties decide what amount (i.e. % of the single financial contribution) is allocated to support the implementation of the national fisheries policy under the framework of the partnership established by the head agreement and its protocols. This % may, and often, exceeds the value of component ii) of the single contribution. In parallel, the negotiation establishes the level of payments due by the EU private sector for access to the resources targeted present in the EEZ. According to 2004 Council conclusions, the EU contribution is deployed according to the budgetary procedures of the partner State. The amounts are transferred on a single account of the public treasury of the third country concerned and are to be retrieved in the annual financing regulations of the partner State. The following table indicates that under the current EU bilateral agreements, the EU granted a € 37 million / year budget to partner coastal States (component ii) of the single contribution) in addition to the value of the fishing rights negotiated (≈ € 104 million) forming component i) of the single contribution. As a result of the negotiations, the EU and the partner third countries accepted to allocate about € 47 million per year to the support of fisheries policy developments, roughly equivalent to € 37 million from the additional envelope plus € 12 million from the value of fishing rights. Note that when reference levels are exceeded in the case of tuna agreement, the third countries receive an additional financial contribution paid to the treasury and used at its full discretion.

Annex A: External Policy - CFP Impact Analysis
CFP Impact Assessment Phase II External Governance 103
Table 6: Total contribution, additional sectoral envelopes and budgets dedicated to policy support under each EU bilateral agreement. Source: Protocols as of March. 2010
Data in € per protocol year
Total contribution
Of which Additional envelope for sectoral support
Amount earmarked for sectoral support
Tuna agreements Cap Verde 385 000 60 000 385 000 Ivory Coast 595 000 140 000 595 000 Gabon 860 000 145 000 516 000 Sao Tome 663 000 110 500 331 500 Comoros 390 000 0 234 000 Madagascar 1 197 000 332 500 957 600 Mozambique 900 000 250 000 900 000 Seychelles 5 310 000 1 260 000 2 999 880 Kiribati 478 400 62 400 143 250 FSM 559 000 39 000 150 800 Solomon Isl. 400 000 140 000 200 000 Mixed agreements Guinea Bissau 7 500 000 1 500 000 2 950 000 Greenland 15 847 244 3 169 449 3 264 449 Mauritania* 70 000 000 20 000 000 20 000 000 Morocco 36 100 000 10 050 000 13 500 000 TOTAL 141 184 644 37 258 849 47 127 479 * Situation for 2011/2012 The amount of funding that is not earmarked for support to the fisheries policy (i.e. the difference between the value of the single contribution and the % allocated to policy support) is part of the third country regular budgetary income, like revenues from other industrial activities exploiting domestic national resources carried out by foreign interests in the territory (e.g. oil revenues, mining fees). It incorporated in the financing acts andused at the full discretion of the State to support its economic, social or environmental policies under the scrutiny of the national financial regulations. The amounts of funding dedicated to policy support are expected to be incorporated through the annual financial regulations in the budgets granted by the State to the institutions in charge of the fisheries sector. This includes the Ministry in charge of fisheries, but may also include other public or parastatal institutions having an institutional role in the management of the sector. These funds are additional to other State funding. According to the principle of the partnership, the EU monitors the use of the sectoral funding against the priorities set up during the joint committees governing the implementation of the agreement. The priorities are based on the fisheries policy with identification of measures aiming at promoting responsible fishing practices and promotion of investments in the industry. Each measure is associated with a multiannual budget and a set of verifiable indicators to monitor the progresses which are regularly examined during technical meetings and during the meetings of the joint committee which meets at least annually. In case the partner country does not use the sectoral funding up to expectation, the EU may review the payments. However, the safeguard clauses are variable across the various agreements and may not all be easily applicable. In Mauritania, the EU can suspend the application of the protocol in the event of failure by Mauritania to comply with commitments made with regard to implementation of its sectoral fisheries policy and reduce the contribution paid pro rata temporis according to the period during which application of the Protocol was suspended. In Morocco, the EU may pay only 50% of the sectoral support to adapt the amount allocated by Morocco to the actual results achieved in terms of implementing its fisheries policy. In Madagascar, Guinea Bissau and several other agreements, the EU

Annex A: External Policy - CFP Impact Analysis
CFP Impact Assessment Phase II External Governance 104
may ask for the amount for the support to be readjusted with a view to bringing the actual amount of financial resources allocated to implementation of the programme into line with its results. As far as we are aware, the safeguard clauses have been used only twice recently in Morocco and in Guinea Bissau. The contribution of the EU to RFMOs is approximately € 4 million per year (art. 11 03 02 of DG MARE budget). This budget line covers the compulsory contributions to RFMO as established by the internal financing regulation of the various RFMOs, taking into account level of catches and the economic ranking of the party. In addition, € 12 million per year (art. 11 03 03) are budgeted for non-compulsory contribution to RFMOs, i.e. funding of initiatives that are not mandatory including specific actions to support research or control, work on new international fisheries organizations. The current level of investment of DG MARE in RFMOs is therefore in the region of € 16 million per year. The investment in FPA is € 141 million with € 47 million on support for the implementation of responsible fishing practices.
1.1.2. Sustainability of fisheries in external waters
Promoting sustainable use of fisheries resources in domestic waters is a key objective of the CFP and will most probably remain one of the key objectives of the future CFP. This is also an overarching objective of the external strand of the CFP through its two main instruments: FPA and RFMOs. There are two different types of fisheries to be examined separately: The fisheries for highly migratory species, straddling fish stocks or discrete fish stocks in the high seas are generally managed in a multilateral context by RFMOs. The EU is a member of all RFMOs whose management mandate includes fisheries exploited by EU vessels and also member of RFMOs in which the EU has an indirect interest as leading world market for seafood products. Each RFMO has set up a scientific committee to assess and monitor the status of stocks and provide the plenary with recommendations of how best to achieve the management objectives which are in most cases the MSY objective. On the basis of these recommendations, the RFMOs adopt conservation and management measures that are binding for all the parties and therefore should be transposed in domestic law. The conservation and management measures (quotas, technical measures, fleet limitations) are generally applicable on a flag basis whether the vessel is in the high seas or in the waters under jurisdiction of a coastal state39. For these fisheries for highly migratory species, the EU strategy for promoting sustainability focuses on strengthening RFMOs (governance, quality of scientific advice, compliance) and management capacities of third countries (participation in RFMOs: provision of data, monitoring of own fleets, and monitoring of foreign fleets in their EEZ). The management of the fisheries for coastal resources comprised within the limits of the EEZ is an exclusive competency of the coastal states. The authorities are supposed to use the best scientific advices on the status of local stocks to adopt the relevant management and conservation measures, and determine stock surplus in the meaning of the Law of the Sea. Advices are formulated by the national scientific institutes individually or in the frame of dedicated working groups of international organizations having a consultative role (such as CECAF in Central-Eastern Atlantic). The management and conservation measures adopted are at the discretion of the coastal States. According to the Law of the Sea, coastal states are bound to maintain or restore populations of harvested species at levels which can produce the maximum sustainable yield. The table in appendix presents the most recent data on some of the key stocks of interest for the EU fleet operating under bilateral agreements. It shows that some stocks are exploited sustainably, but other stocks are overfished. More data would have been useful as the table does not include data on
39 However, coastal states may adopt specific management regimes in their sovereign waters, providing they are
compatible with the measures adopted in the multilateral context by RFMOs. This happens in the Western Central Pacific where coastal states have adopted their own management scheme of fishing capacity allowed in their EEZ.

Annex A: External Policy - CFP Impact Analysis
CFP Impact Assessment Phase II External Governance 105
key stocks in Guinea Bissau or Mauritania. The reason is that those data simply do not exist. There are considerable knowledge gaps on the status of the resources in some EEZ. Knowledge on the status of highly migratory species is sufficient, but not on other secondary species under the management of RFMOs (oceanic sharks, billfish, coastal tunas). Under the framework of bilateral fisheries agreements, the EU seeks to support sustainable exploitation through different actions supported by the FPA sectoral support, including:
• Identification of measures supporting National fisheries. Supporting research includes actions in favor of data collection (data on catches and effort, port sampling, research cruises), stock assessment methodologies and research facilities (upgrading of laboratories, maintenance and equipment of research vessels);
• Organisation of joint scientific committee gathering scientists from the partner country and from EU Member States to review information available on the status of stocks and adopt joint research programmes
• Identification of measures supporting monitoring, control and surveillance of the fisheries in the EEZ including inter alia investments in patrol means, implementation of MCS deployment plans, strengthening of MCS institutions (equipment, training).
• Provisions for organisation of joint deployment plans involving the coastal states and EU control authorities.
As Table 6 shows, the amount of funding available varies dramatically across third countries as a consequence of the EU internal rule requiring a proportionality between the fishing rights negotiated and the amount of sectoral support granted.
The axes of intervention under RFMOs are complementary. EU involvement in RFMOs materialize in the promotion of adequate conservation and management measures, increased support to science to improve the quality of scientific advice and increased compliance with conservation and management measures approved in the multilateral context. These initiatives at partner state level under the framework of bilateral fisheries agreements and at international level under RFMOs can be supplemented by other EU initiatives at regional level. This includes EDF programmes for support regional MCS programmes (West Africa, Indian Ocean) or research programmes (Western Central Pacific, Indian Ocean), support to MCS operations (DG MARE budget), support to research programmes involving scientific institutes from partner states (DG Research).

Annex A: External Policy - CFP Impact Analysis
CFP Impact Assessment Phase II External Governance 106
1.1.3. Promotion of economic integration of EU operators in the third countries
The second general objective of the current FPA policy is to encourage the economic integration of EU operators in the fishing industry of third countries through direct interactions with the local industry (use of ports facilities, landings of catches in the country, employment of local fishermen) and through the improvement of the investment climate. This later axis of intervention is supported by the partnership and financially by the EU sectoral support. It consists in supporting investments in port facilities to make them more attractive to private operators (equipment, efficiency of operations) and to support initiatives for closer cooperation between the private sectors of the two parties. As concerns direct interactions between EU vessels and the fishing industry in the third countries, some vessels of the EU fleet operating under bilateral fishing agreements land part of their catches in the ports of the third countries. The current situation needs to be reviewed according to the fleet segments concerned. EU fleet targeting highly migratory species (= EU tuna fleet). The EU purse seine fleet (flagged to Spain or France) targets tuna subsequently used for the manufacture of tuna cans. Tuna caught by this fleet is not suitable for direct human consumption as a consequence of SPS regulations. Since this fleet operates far from the ports of the EU in the tropical fishing zones, catches are all unloaded in the port of third countries. They can be unloaded directly quayside to supply the local canneries, or they can be unloaded onto reefers for utilization in other canneries which are located in third countries or in the EU (Spain still has a developed domestic caning industry in Galicia and in the Basque Country). Most canneries are located in third countries enjoying a preferential trade treatment with 0% duty granted to products complying with the rules of origin. Tuna catches by the EU fleet in the three oceans amount to 350,000 tonnes per year on average, of which 100,000 tonnes are caught in EEZ of coastal states under bilateral fishing agreement with the EU. The total catches include:
• 110,000 tonnes caught in the tropical Eastern Atlantic Ocean. The EU fleet uses Abidjan in Ivory Coast as main logistic place for unloading the catches. About 45,000 tonnes are sold to local canneries. The rest is unloaded onto reefers for processing in the EU or in other third countries like Ghana, Turkey or Morocco.
• 200,000 tonnes caught in the tropical Indian Ocean (Eastern mainly). The main logistic place is Victoria in Seychelles. The local cannery buys between 60 and 70,000 tonnes of tuna to the EU fleet. The remainder is unloaded onto reefers for sale to tuna processing industries located in the region (Madagascar, Mauritius, Kenya), outside the region (Thailand, Philippines, Ghana, as far as Ecuador) or in the EU.
• 40,000 tonnes caught in the Western Central Pacific Ocean and in the Eastern Pacific ocean. The EU fleet may use Manta (Ecuador) or Kiribati to unload the catches depending on its seasonal movements. Almost all catches in the Pacific are processed in canneries located in Ecuador, El Salvador or Colombia.
The impacts of the landings of the EU tuna fleet consist mainly in the creation of value-added in the countries where EU vessels transship or unload, and in the countries processing the catches, which are not necessarily the same countries that are under a bilateral fishing agreement with the EU (ex. of Ghana, Mauritius, Kenya, Ecuador, Turkey). Value added supports economic growth and employment (quantitatively and qualitatively). None or very little of the tuna catches by the EU fleet are used locally, and therefore have no impact on local food security. The final market for tuna cans processed out of the EU catches is almost exclusively the European market.

Annex A: External Policy - CFP Impact Analysis
CFP Impact Assessment Phase II External Governance 107
EU Fleet targeting small pelagic species At present, the external EU fleet has access to the West-African small pelagic stocks through the bilateral fishing agreements concluded with Morocco and Mauritania. Whilst the Morocco agreement includes some fishing possibilities for small pelagic vessels based in Andalusia, the bulk of the catches of small pelagics originate from the stocks of sardine, sardinella, horse mackerel or mackerel shared between Morocco in the North and Senegal in the South. Total catches have been highly variable these last few years, varying between 170,000 tonnes and 350,000 tonnes per year. This variability is linked to the environmental conditions (small pelagics are short living species) and the fishing effort deployed by the EU fleet which has alternative fishing grounds in the North East Atlantic or in South-East Pacific waters. At EU levels, the main Member States concerned by this fishery are Netherlands, Latvia and Lithuania. There are records of catches by some other Member States (inter alia Poland, France, United Kingdom) but for much smaller amounts. Catches are frozen onboard the fishing vessels. Although some of the catches from Latvian and Lithuanian vessels are processed in the EU, the main market for small pelagics caught by the EU fleet include West African countries (Nigeria, Cote d’Ivoire), Southern Africa countries (Angola, South Africa), Eastern Europe (Russia, Ukraine) or Asian countries. Utilisation of catches in Mauritania or in Morocco by the local industries concerns only fairly small share of total catches. The impacts of EU small pelagic catches on countries having a bilateral agreement with the EU (Morocco and Mauritania) are negligible. The main reasons are that the vessels use ports located in other countries to unload and transship, and that the catches are not used locally. The main impact of this activity is on the food security of countries importing the EU catches. As an example, imports of small pelagics into Nigeria (population of 145 million) from the EU represent 34% of imports of fisheries products into the country and cover 20% of domestic needs. EU Fleet targeting demersal species The bilateral fishing agreements concluded with Greenland, Morocco, Mauritania and Guinea Bissau include some fishing possibilities for EU vessels targeting demersal species with trawl, longline or other gears. The main agreement in this respect and as far as the number of vessels is concerned is the agreement with Mauritania. The main species targeted in the EEZ of this country and in Guinea Bissau are high-value species like octopus, squid, shrimp or hake. In Morocco, the species targeted are various demersal fish, while under the Greenland agreement; most catches consist in Greenland Halibut, Nordic shrimp and redfish. Total catches are estimated close to 35,000 tonnes under fishing agreements with Southern countries, plus 15,000 tonnes under the Greenland agreement, i.e. 50,000 tonnes in total. Most vessels concerned are trawlers equipped to freeze the catch onboard. Most catches of these segments are placed on the EU market where they obtain the best prices. Since catches are frozen onboard, they are not processed. The best value is obtained with whole products. Defrosting the catches to process them would lower the quality and consequently the price. As a consequence, catches of demersal species have little impacts on the partner countries, either in economic terms or in terms of satisfying domestic needs for fish proteins. Some fishing vessels use the ports in Mauritania, Morocco or Senegal to transship, but catches are transferred onto reefers for the EU market. The majority of the vessels use Las Palmas or Vigo as logistic bases. Under bilateral fishing agreements, the EU has the general objective to promote a better integration of the EU fishing fleet into the local economy, and a specific objective of encouraging the landings of the EU fleet in the ports of the partner states. The instruments available are:
‐ Compulsory landings in the ports of the partner states: applied only under the Morocco agreements, the compulsory landing rule sets a minimum of catches to be landed in the partner

Annex A: External Policy - CFP Impact Analysis
CFP Impact Assessment Phase II External Governance 108
country (i.e. 25% in the case of pelagic trawlers). It has been observed recently that the clause does not work. Under previous generations of fishing agreements, this rule was also applied to the tuna fleet with also obligation to sell the catches locally, but it has been abandoned since.
‐ Discounts on access costs : when EU vessels use the ports of the country, the protocols foresee that the cost of the license can be decreased according to the volume landed and/or the number of unloading operations. This is an economic incentive for EU shipowners.
‐ EU support to sectoral policy : under a general objective of promoting the private investment in the partner country, the financial support made available by the EU to the partner states can be used to modernize and equip fishing harbours. This contributes to increase port efficiency and make them more attractive for the fishing fleet.
The effectiveness of these instruments has proved to be disappointing so far. In the case of the tuna fleet, using the ports of third countries is a normal strategy since the ports in the EU are too remote. The EU shipowners have selected logistical bases from which they will commercialise the catches of their vessels, either locally or elsewhere. The selection of the logistical bases is the result of a cost benefit analysis that includes access possibilities, but not only (inter alia proximity with fishing grounds, costs of goods and services, efficiency of unloading / loading operations, connections with the EU, availability of freight). In the case of small pelagic trawlers, access to port is a constraint. Small pelagic trawlers are large vessels requiring sufficient depth and length of quays. In West Africa, very few ports can harbor these vessels, and a better efficiency / security is found in Las Palmas. For demersal trawlers, the EU is definitively the market on which they will obtain the best prices for their products. There is no interest to sell on markets of developing countries as prices would be too low in line with the lower purchasing power of consumers. Use of local ports can be strategically interesting to optimize the vessel’s use (less steaming time, more fishing time), but when catches are landed there, it is most often to be placed in freezer storage facilities before being re-exported to the EU market. Translating the options into figures The options retained for the CFP reform will have dramatic consequences on the EU budgets and on the economics of the fleet. Before going into the exploration of the impacts of the option, it is necessary to carry out an appraisal of the financial consequences of the options. As the next sections will prove, there is no simple answer. The financial consequences depend on the type of fleet concerned, the region in which the fleet operate, and on sensible policy sub-options which will need to be sorted out. 2. Translating the options into figures
2.1. FPA Option 1 Bilateral fishing agreements: Cost of access borne by EU shipowners with a transitional period for all the agreements including the mixed agreements which are maintained for some limited fisheries categories
Since the basis for payment of fishing rights are different between tuna agreements and mixed agreements, the two categories of agreements will be examined separately.
A- Tuna agreements
The current internal Commission rule for negotiating tuna agreements is to pay to the partner country a total contribution of € 100 for each tonne of highly migratory species (tuna and associated species) caught in the EEZ. The EU bears 65% of the access price, the private sector 35%40. The contributions to be paid under the agreements are based on the definition of reference tonnages which are supposed to represent the likely catches in the EEZ. The final single contribution negotiated includes an additional funding for support to the promotion of responsible fishing practices.
40 Except for pole and liners with a breakdown of 75 / 25. This is anyway a relatively secondary fishing category
compared to purse seiners and longliners.

Annex A: External Policy - CFP Impact Analysis
CFP Impact Assessment Phase II External Governance 109
The EU ship owners licence fees agreed under the 14 current bilateral agreements (the 11 tuna agreements plus the 3 mixed fishing agreements including tuna fishing possibilities) are shown in the table below. They are based on a reference tonnage per vessel category valued on the basis of € 35 per tonne. The licence fee for Seychelles is a notable exception: the licence fee applicable to the EU vessels has been renegotiated as a lump sum payment with no specific reference tonnage. Given the regional strategy of the tuna vessels, the total licence fees to be paid by EU ship owners to access the EEZ can be assumed to be equivalent to the sum of licence fees applicable in the ocean where they operate, €72,495 for example in the Indian Ocean. In addition, ship owners have to pay the licence fees agreed under each private agreement negotiated to complete access possibilities in EEZ of coastal States not covered by EU bilateral fishing agreements41. However, access fees in this latter case are unknown but are all based on lump sum payments.
41 According to information gathered from professional sources : for the purse seine fleet Angola, Sierra Leone,
Liberia, Guinea in the Atlantic, Kenya, Tanzania, Mauritius and French OCTs (for Spain) in the Indian Ocean, Ecuador, Colombia, Tuvalu and Nauru in the Pacific Ocean.

Annex A: External Policy - CFP Impact Analysis
CFP Impact Assessment Phase II External Governance 110
Table 7 Value of the annual licence fees applicable to the various types of EU tuna vessels under the bilateral agreements into force as of March 2010.
Purse seiners Surface longliners Pole and liners Ref. Ton. (t) Value (€) Ref. Ton. (t) Value (€) Ref. Ton. (t) Value (€)Morocco 200 5 000 Mauritania 50 1 750 100 3 500 100 2 500 Cap Verde 110 3 850 80 2 800 16 400 Guinea Bissau 90 3 150 90 3 150 20 500 Ivory Coast 110 3 850 40 1 400 Sao Tome 150 5 250 55 1 925 Gabon 130 4 550 58 2 030 Sub total Atlantic 640 22 400 423 14 805 336 8 400 Madagascar 112 3 920 100 3 500 Comoros 96 3 375 59 2 065 Seychelles 61 000 4 200 Mozambique 120 4 200 40 1 400 Sud-total Indian 72 495 11 165 Kiribati 600 21 000 120 4 200 FSM 428 15 000 120 4 200 Solomon Isl. 371 13 000 Sous-total Pacific 1 399 49 000 240 8 400 • Source: DG MARE
In all cases (except shipowner fees under the Seychelles agreements since 2009), the real payments are based on the quantities of highly migratory species actually caught during the protocol years. In the event the reference tonnages are not reached, the payments are those indicated. When catches are in excess of the reference tonnages, the ship owners pay € 35 / tonne for each additional tonne. The amounts reported in the foregoing table are therefore minimum payments. Under the assumption that EU ship owners would bear 100% of the current minimum payments for access, i.e. the current vessel reference tonnage multiplied by € 100, the nominal costs of licences would be as displayed in the following table. Overall, the change would represent a 186% increase in nominal access costs.

Annex A: External Policy - CFP Impact Analysis
CFP Impact Assessment Phase II External Governance 111
Table 8: Current minimum licence fees supported by the EU tuna vessels under the various FPAs, and projected minimum licence fees if the unit cost is increased from € 35 to € 100 per tonne. Source: Protocols
Purse seiners Longliners Pole and liners @ € 35 / t @ € 100 / t @ € 35 / t @ € 100 / t @ € 35 / t @ € 100 / tMorocco 0 0 5 000 10 000 Mauritania 1 750 5 000 3 500 10 000 2 500 5 000 Cap Verde 3 850 11 000 2 800 8 000 400 800 Guinea Bissau 3 150 9 000 3 150 9 000 500 1 000 Ivory Coast 3 850 11 000 1 400 4 000 Sao Tome 5 250 15 000 1 925 5 500 Gabon 4 550 13 000 2 030 5 800 Sub total Atlantic 24 900 64 000 14 805 42 300 8 400 16 800 Madagascar 3 920 11 200 3 500 10 000 Comoros 3 375 9 600 2 065 5 900 Seychelles 61 000 174 000 4 200 12 000 Mozambique 4 200 12 000 1 400 4 000 Sud-total Indian 72 495 206 800 11 165 31 900 Kiribati 21 000 60 000 4 200 12 000 FSM 15 000 42 800 4 200 12 000 Solomon Isl. 13 000 37 100 Sub-total Pacific 49 000 139 900 11 400 24 000 It remains to be clarified whether the licence fee considered by the reform would be a lump sum payment or if the current variable system will be kept, i.e. each additional tonne beyond a vessel reference tonnage would be also paid € 100 per tonne. If the EU strategy is to give up any responsibility concerning payments, one can assume that the new regime for licence fees would be on a lump sum basis. If not, the EU would still have responsibility to validate catch data of EU vessels which often caused problems in the past. The recent (2009) reform of the Seychelles licence fee regime indicates that the EU is keen to move toward a lump sum system. The two options (lumped or variable access fee) are reviewed separately. Two questions arise from this simulation: 1- Would the new licence fees be in line with access fees paid by other third country fleets ? 2- What would be the consequences on third countries public receipts from the EU bilateral agreement? 1- Comparison with other licence fees Licence fees paid by third countries are difficult to know as they are often discretionary and the result of a private negotiation between the Authority in charge and the representative of the ship owners seeking access. However, taking advantage of the various evaluations of EU bilateral agreements, it has been possible to collect relevant data on access costs to various EEZ of coastal States of the Indian Ocean and of the Pacific Ocean. No such data could be obtained for the coastal States of West Africa. Indian Ocean 1st scenario: the access fees are lump sum based on current individual reference tonnage as per protocols valued € 100 / tonne The following table shows the data available:

Annex A: External Policy - CFP Impact Analysis
CFP Impact Assessment Phase II External Governance 112
• The access fees column present the licence fees applying to a foreign flagged purse seiner as they could have been obtained from official or unofficial sources.
• The EUR equivalent is the basic figure converted into EUR using a 1:1.35 exchange rate for USD
• The Nominal licence fee @ € 100 per tonne reproduce the simulated licence fees calculated as the current vessels individual reference tonnage as defined in the protocols multiplied by € 100 per tonne (Table 8). In the particular case of Seychelles, the licence fee has been estimated assuming the current licence fee is based on a reference tonnage of 1,740 tonnes
• The current licence fees are an indication on how much the EU purse seiners ship owners actually paid in 2007 and 2008 given their actual catches made in the coastal State EEZs. The value presented is average of the licence fees paid taking into account catches above the vessel reference tonnage, but not including vessels having not declared any catches in the EEZ.
Table 9: Comparison between the access fees paid by other PS fleets, a reformed nominal access fee to be paid by EU ship owners based on current individual reference tonnage valued €100 / tonne and current average EU purse seiners payments given the catches made in the coastal states’EEZs
Access fees EUR equivalent Nominal licence fee@ 100 € tonne
Current licence fees
Year ESP FRA Madagascar USD 4,800 / month
+ 1000 USD registration fee
11 407 11 200 2008 8 572 10 090
2007 18 017 10 789 Comoros EUR 12,500 12 500 9 600 2008 4 815 4 204 2007 4 646 6 704 Seychelles USD 60,000 for
Seychelles flagged PS
44 444 for Seychelles PS
174 000 2008 40 527 51 525
USD 120,000 for other PS
88 888 for other PS 2007 40 930 56 461
Mozambique USD 20,000 14 815 12 000 2008 4 606 6 412 2007 4 346 4 488
• The data indicate that for the agreements with Comoros and Mozambique where EU purse seiners traditionally declare low catches (the average actual value of the licences paid in 2007 and 2008 is very close to the minimum payments as foreseen in the protocol of agreement), the reformed cost of access would represent a significant increase. However, the new licence fees would be more or less aligned with licence fees applying to other third country vessels. What is likely to happen is that few EU ship owners will buy what can be assumed to be a precautionary licence at that cost as long as their economic situation does not recover.
• For the agreement with Madagascar, the new licence fee would be broadly similar to the licence fee that other foreign flagged purse seiners have to pay to access the EEZ, and also similar to what the EU ship owners currently pay given their actual catches. Access would

Annex A: External Policy - CFP Impact Analysis
CFP Impact Assessment Phase II External Governance 113
even be cheaper in some cases (example of Spanish purse seiners in 2007). Therefore, the impact of an increase in licence fee will be neutral for the EU private sector.
• For the agreement with Seychelles, the licence fee as from 2009 is a lump sum set at €61,000. It is on average an increased payment compared to average actual payments made in 2007 and 2008, but a decreased access fee for 25% of the French fleet (in 2007 25% of the French fleet paid € 68,900 and more as actual licence fee ; in 2008 25% of the French fleet paid € 65,103 and more). However, applying a fee equivalent to 100 € per tonne to the fleet would set the licence fee at € 174,000; i.e. twice as much as the licence fee paid by foreign flagged vessels who never use Seychelles as landing / transhipment base, and 4 time as much as Seychelles flagged vessels who use Seychelles as landing / transhipment base, but less on average than the EU purse seine fleet (the EU fleet unload 90%+ of its catches in Victoria as opposed to 75%+ for the Seychelles flagged purse seiners). Consequently, and not withstanding the impact of a such high licence fee on the EU purse seiners economics, it is most likely that the cost of the access fee to Seychelles EEZ will not deviate very much from what it is now (€ 61,000 somehow midway between the licence fee applied to Seychelles PS and the licence fee applied to other flags).
2nd scenario: access fees are based on the actual catches made in the EEZ valued € 100 / tonne Under this scenario, the working hypothesis is that the EU shipowner would pay the access based on the catches declared valued € 100 per tonne. Note that in that case, the EU will still have responsibility to validate catch data and have them approved by the partner coastal State. This may become even more problematic and source of tensions with coastal States than it is now as the incentive for misreporting for the EU operators will be more important than with a base value of € 35 / tonne. Notwithstanding this important issue, the following table shows the value of the purse seine licence fee as they would have amounted in 2007 and 2008 if they were based on the actual catches declared valued € 100 / tonne but with no minimal front payment. The prospective value of the licence fees is compared with the value of licence fees paid by other purse seine operators and with licence fees paid in 2007 and 2008.

Annex A: External Policy - CFP Impact Analysis
CFP Impact Assessment Phase II External Governance 114
Table 10: Comparison between the access fees paid by other PS fleets, a reformed access fee to be paid by EU ship owners based on current individual catches valued € 100 / tonne and current EU purse seiners payments given the catches made in the coastal EEZs
EUR equivalent Projected licence fees based on actual catches paid € 100 / tonne
Current licence fees
Year ESP FRA Year ESP FRA Madagascar 11 407 2008 22 569 27 567 2008 8 572 10 090 2007 50 654 29 965 2007 18 017 10 789Comoros 12 500 2008 10 042 8 930 2008 4 815 4 204 2007 7 453 17 154 2007 4 646 6 704 Seychelles 44 444 for Seychelles PS
88 888 for other PS 2008 115 792 140 876 2008 40 527 51 525
2007 112 638 160 672 2007 40 930 56 461Mozambique 14 815 2008 5 275 16 135 2008 4 606 6 412 2007 5 320 5 918 2007 4 346 4 488
• For Madagascar, licence values will be much higher and equivalent to two or three time the value of licence fees applied to other foreign operators. This is because catches in 2007 and 2008 in the Malagasy EEZ have been high and consistently close or above the individual reference tonnage agreed in the current protocol of agreement. The likely consequence of such increase is difficult to anticipate, but it is a reasonable assumption to consider that EU shipowner will resist this increase and try to negotiate licence fees close to the official level and also close to what they pay currently. Madagascar, who derives some shore benefits from EU activities although considerably less than Seychelles (limited to some transhipment and processing in Diego Suarez) will be keen to negotiate alternative conditions to keep the EU purse seine fleet in its EEZ.
• For Seychelles, the EU purse seine licence fees would be higher than licence fees paid by any other purse seine vessel, especially for the French fleet (twice as much as licence fees paid by Thai vessels for example). For the same reasons as detailed above, it is most likely that EU operators will resist such increase with good chances of success as maintaining EU purse seine fleet activity in the EEZ is also the interest of Seychelles who derives substantial shore benefits from EU vessels.
• For Comoros and Mozambique, EU purse seine licence fees would be below (on average) licence fees paid by other foreign purse seiners with however some exceptions (ex. of French purse seiners in the Comoros EEZ in 2007 and of the French fleet in the Comoros EEZ in 2008). It can be expected that EU purse seine ship owners will be more selective when considering withdrawal of a licence to access these two relatively minor EEZs.
Impacts on fleet economics In both cases (lumped or variable access fee), the modified access cost will increase the average licence fees by approximately €120,000 (per vessel) in absolute value. To measure the economic impacts on the fleets concerned, AER data have been used. By taking the economic indicators for a given fleet segment, and by dividing these indicators by the number of vessels in the fleet, an average vessel cost and earning profile has been estimated, together with the specific economic indicators retained for the CFP impact assessment (indicator 8 revenue to break even revenue; indicator 9 net

Annex A: External Policy - CFP Impact Analysis
CFP Impact Assessment Phase II External Governance 115
profit margin, indicator 10 return on investment, and indicator 16 GVA per employee42). The impact of increased licence fees on the vessels have been estimated by adding the increase in licence fee per vessel to the variable costs, assuming that tuna fees which are based on catches are variable costs. The result of the simulation on FRA PTS40xx and ESP PTS 40xx segments are shown below. Overall, the increase could have been easily absorbed in productive years (2005) but worsens the economic results in already poor years (2007). FRA PTS40xx segment per vessel Base line 2005 2006 2007 VALUE ADDED (EUR) 2 718 788 2 462 895 1 844 167 CASHFLOW (EUR) 1 098 788 762 895 311 944 PROFIT (EUR) 448 182 87 895 -462 222 Revenue to B-E 127% 116% 107% Net Profit Margin 9% 2% -9% ROI 14% 9% 3% VA / FTE (EUR) 105 379 94 867 70 496 Increase VARCOST by €120,000 2005 2006 2007 VALUE ADDED (EUR) 2 598 788 2 342 895 1 724 167 CASHFLOW (EUR) 979 091 642 895 192 222 PROFIT (EUR) 328 485 -32 105 -581 944 Revenue to B-E 123% 113% 104% Net Profit Margin 6% -1% -11% ROI 12% 8% 2% VA/FTE (EUR) 100 728 90 245 65 909
42 Indicator 17 attractiveness of the sector could not been estimated as it is not possible to estimate how increased
fixed or variable costs impact on crew costs. This depends on the sharing system adopted for each fleet.

Annex A: External Policy - CFP Impact Analysis
CFP Impact Assessment Phase II External Governance 116
ESP PTS40xx segment per vessel Baseline 2005 2006 2007 VALUE ADDED (EUR) 512 208 435 033 1 547 429 CASHFLOW (EUR) 229 026 228 954 685 429 PROFIT (EUR) 165 843 187 499 95 621 Revenue to B-E 124% 125% 132% Net Profit Margin 11% 14% 2% ROI 7% 5% 4% VA / FTE (EUR) 31 289 31 157 32 870 Increase VARCOST by €120,000 2005 2006 2007 VALUE ADDED (EUR) 392 208 315 033 1 427 429 CASHFLOW (EUR) 109 026 108 954 565 429 PROFIT (EUR) 45 843 67 499 -24 379 Revenue to B-E 113% 113% 128% Net Profit Margin 3% 5% 0% ROI 3.2% 2.2% 2.9% VA/FTE (EUR) 23 959 22 562 30 321
More than the absolute value that can be biased in relation with the sampling strategy used by the Member States, the impact of the option should be considered in relative value: the simulated increased licence fee decreases the net profit margin / turnover ratio by 2 points, which may be economically difficult to sustain. For subsequent years, the impact of such increase is likely to be even worse. According to representatives of the EU tuna shipowners, 2008 has been overall an average fishing year (catch rates less than previous years, but fair prices) but with economic performances of the fleet plagued by the hike in fuel prices. Year 2009 and beginning of 2010 are reportedly very bad fishing seasons with low catches rates and poor prices (see figure below), compounded by adverse economic impact of the recent increase in fuel prices and the piracy issue off Somalia. According to information received from the sector, all EU purse seiners have currently negative cash flow, and at least 5 vessels are reportedly for sale.
Figure 10: Average world prices of tuna (purse seine = skipjack and yellowfin). Source: FFA
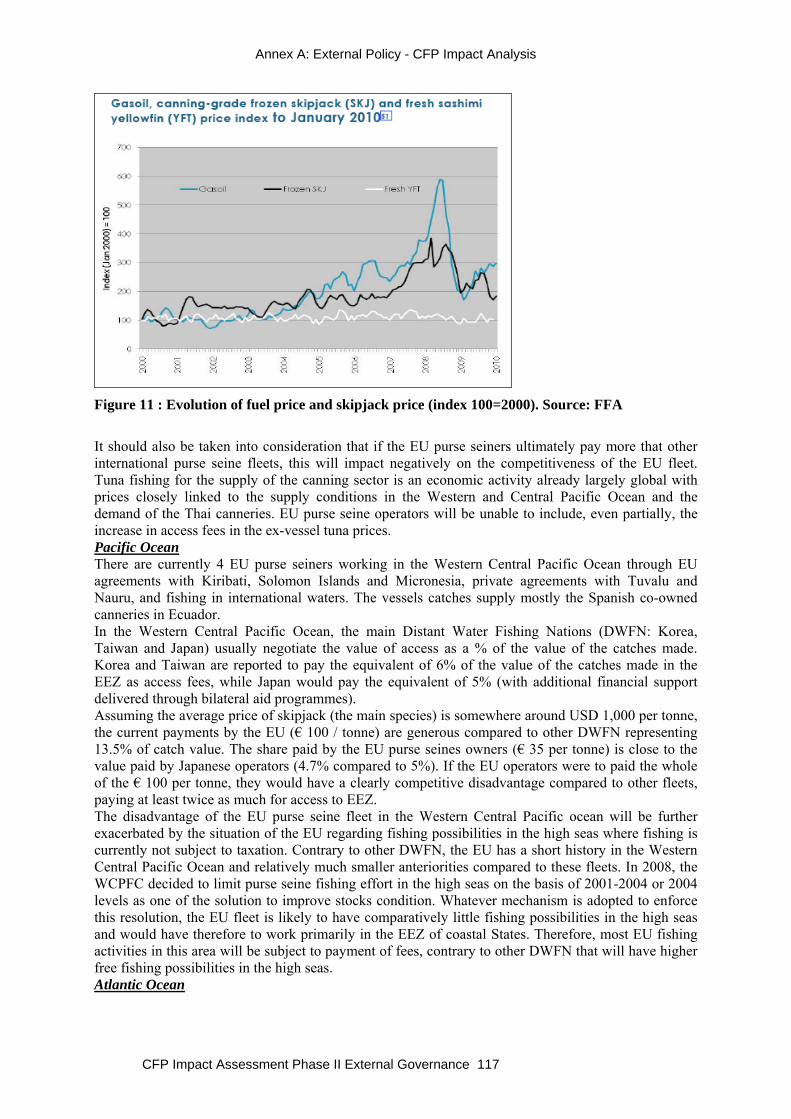
Annex A: External Policy - CFP Impact Analysis
CFP Impact Assessment Phase II External Governance 117
Figure 11 : Evolution of fuel price and skipjack price (index 100=2000). Source: FFA
It should also be taken into consideration that if the EU purse seiners ultimately pay more that other international purse seine fleets, this will impact negatively on the competitiveness of the EU fleet. Tuna fishing for the supply of the canning sector is an economic activity already largely global with prices closely linked to the supply conditions in the Western and Central Pacific Ocean and the demand of the Thai canneries. EU purse seine operators will be unable to include, even partially, the increase in access fees in the ex-vessel tuna prices. Pacific Ocean There are currently 4 EU purse seiners working in the Western Central Pacific Ocean through EU agreements with Kiribati, Solomon Islands and Micronesia, private agreements with Tuvalu and Nauru, and fishing in international waters. The vessels catches supply mostly the Spanish co-owned canneries in Ecuador. In the Western Central Pacific Ocean, the main Distant Water Fishing Nations (DWFN: Korea, Taiwan and Japan) usually negotiate the value of access as a % of the value of the catches made. Korea and Taiwan are reported to pay the equivalent of 6% of the value of the catches made in the EEZ as access fees, while Japan would pay the equivalent of 5% (with additional financial support delivered through bilateral aid programmes). Assuming the average price of skipjack (the main species) is somewhere around USD 1,000 per tonne, the current payments by the EU (€ 100 / tonne) are generous compared to other DWFN representing 13.5% of catch value. The share paid by the EU purse seines owners (€ 35 per tonne) is close to the value paid by Japanese operators (4.7% compared to 5%). If the EU operators were to paid the whole of the € 100 per tonne, they would have a clearly competitive disadvantage compared to other fleets, paying at least twice as much for access to EEZ. The disadvantage of the EU purse seine fleet in the Western Central Pacific ocean will be further exacerbated by the situation of the EU regarding fishing possibilities in the high seas where fishing is currently not subject to taxation. Contrary to other DWFN, the EU has a short history in the Western Central Pacific Ocean and relatively much smaller anteriorities compared to these fleets. In 2008, the WCPFC decided to limit purse seine fishing effort in the high seas on the basis of 2001-2004 or 2004 levels as one of the solution to improve stocks condition. Whatever mechanism is adopted to enforce this resolution, the EU fleet is likely to have comparatively little fishing possibilities in the high seas and would have therefore to work primarily in the EEZ of coastal States. Therefore, most EU fishing activities in this area will be subject to payment of fees, contrary to other DWFN that will have higher free fishing possibilities in the high seas. Atlantic Ocean

Annex A: External Policy - CFP Impact Analysis
CFP Impact Assessment Phase II External Governance 118
There are currently 23 EU purse seiners operating in the tropical zone of the Easter Atlantic Ocean. The number increased in 2008 and 2009 as a consequence of the impact to piracy in the Indian Ocean (there were 18 EU purse seiners in 2006). There are also 5 to 6 pole and liners, and between 60 and 70 surface longliners. EU purse seiners represent 60% of the catches of the EU tuna fleet (75,000 tonnes out of 130,000 tonnes per year on average). The EU purse seine fleet takes approximately 30% of its catches from the EEZ of third countries under bilateral agreement with the EU. The remainder is caught in the high seas or from EEZ of coastal States under private arrangements (Angola, Sierra Leone, Liberia; Guinea). There are no valid reference points of the cost of a private tuna licence in the EEZ of coastal States of the Atlantic Ocean. The reason is that for most countries, licensing foreign tuna vessels for access into the EEZ is a minor possible source of income compared to potential revenues from licensing of demersal vessels. It has not been possible to find any credible access fee schedule in third countries. Access costs under private agreements are negotiated directly between the shipowners and the authorities of the third countries. As an assumption, it will be considered that the 6% value of catches as access fee would also apply in the Atlantic, as in the Pacific.
2- Impact on third countries
Under the assumption that EU ship owners pay the whole of the access costs to third countries through licence payments, the receipts from coastal States from the EU bilateral will include more variability as currently as they will be function of actual utilisation of fishing possibilities and actual catches of EU vessels in the EEZ if licence fees are based on that parameter (scenario 2). For the purpose of this exercise, simulations on the likely level of utilisation in case of increased cost of access are presented below. The rational is to consider the utilisation of fishing possibilities as recorded for two recent years (2007 and 2009) and to estimate how many vessels would draw a licence in the event of increased access costs, taking as a working assumption that the vessels that did not declare any catches or very low catches in 2007 and 2008 in the EEZ of coastal States would not draw a licence at costs not compatible with a precautionary licence. This would have effects manly on the longline fleet that declares almost zero catches in most EEZ (except in Madagascar and Mozambique to a lesser extent) and some elements of the purse seine fleet that traditionally develop very low effort in minor EEZ like Comoros and Mozambique. For the purse seine segment, it is assumed that the Seychelles and Madagascar EEZs will remain attractive, if not pivotal in the Seychelles case.
Table 11: Projections on simulated level of utilisation of fishing possibilities in case of increased licence fees. Data for 2007 and 2009 are from DG MARE
Utilisation 2007 Utilisation 2009 Simulated PS LL PS LL PS LL Madagascar 39 57 30 37 30 31 Comoros 39 9 30 1 23 0 Seychelles 39 2 31 2 35 0 Mozambique 39 29 31 9 20 13 The next table presents the estimates of receipts by coastal States under different scenarios (scenario 1, scenario 2 and an additional scenario taking into account what is perceived as maximum acceptable licence fee based on current practices), and compare the amounts to what the coastal States currently receive as per the protocols of agreement (EU payments based on reference tonnage not taking into account the additional envelope granted to support the development of the National fishery policy ; plus expected EU ship owners payments). For each coastal States, the receipts are the sum of the simulated levels of utilisation for both fishing segments (table above) multiplied by the value of the access fee. The impacts vary according the coastal States concerned.

Annex A: External Policy - CFP Impact Analysis
CFP Impact Assessment Phase II External Governance 119
• For Mozambique, the country would loose significant amount of receipts whatever is the option retained. This is probably linked to a current fishing agreement including fishing possibilities and reference tonnage too high compared to actual activities of the EU fleet in the zone. It can be anticipated that this agreement will be revised downward after its expiration anyway (end 2011) to respect a better proportionality between EU payments and real fishing activity in the zone.
• Comoros would loose half of budget income as a result of the relatively minor importance of the EEZs. If licence fees were to increase dramatically to access the Comoros zone, it can be expected that fewer EU vessels would draw a licence. This would generate insufficient income compared to current payments under the EU bilateral fishing agreement.
• For Seychelles, the situation would be neutral under the two first scenarios. This mainly because access to this EEZ is pivotal and all purse seiners will have no other choice but to buy the licence. In that particular case, the EU private sector would cover the current access payment. However, as discussed above, the projected licence fee levels are likely to be unrealistic given the financial capacities of the fleet and the level of access fees paid by other fishing nations. The most likely situation would be that the licence fees remain close to current levels (€61,000) which can be assumed to be a fair compromise, resulting in a division by three of current budgetary incomes from the bilateral agreement, for similar fishing capacities.
• For Madagascar, the situation would be somewhat similar. Given the catches recorded in the EEZ, most ship owners would accept to buy a licence at prices as per scenario 1, but probably not as per scenario 2. Since the Madagascar EEZ is not exploited by all the PS and LL fleet, erosion in utilisation is to be expected. As a result, Madagascar may well see its budgetary incomes divided by two.
Table 12: Estimates of third countries receipts from reformed EU bilateral agreements based on assumptions on costs of licences and likely utilisation of fishing possibilities as per Table 11. Shaded cells: current payments received by third countries as per protocols of agreements.
Sc.1 : Lumped licence fees based on current individual tonnage @ € 100 / tonne TOTAL Receipts
PS LL
Madagascar 11 200 10 000 646 000
Comoros 9 600 5 900 220 800
Seychelles 174 000 12 000 6 090 000
Mozambique 12 000 4 000 292 000
Sc.2 : Variable licence fees based on current level of catches @ € 100 / tonne TOTAL Receipts
PS LL
Madagascar 32 690 10 000 1 290 700
Comoros 10 900 5 900 250 700
Seychelles 132 500 12 000 4 637 500
Mozambique 8 160 4 000 215 200
Atlernative sc. : Likely licence fees set at the level of current practices for foreign fleets TOTAL Receipts
PS LL
Madagascar 11 400 10 000 652 000
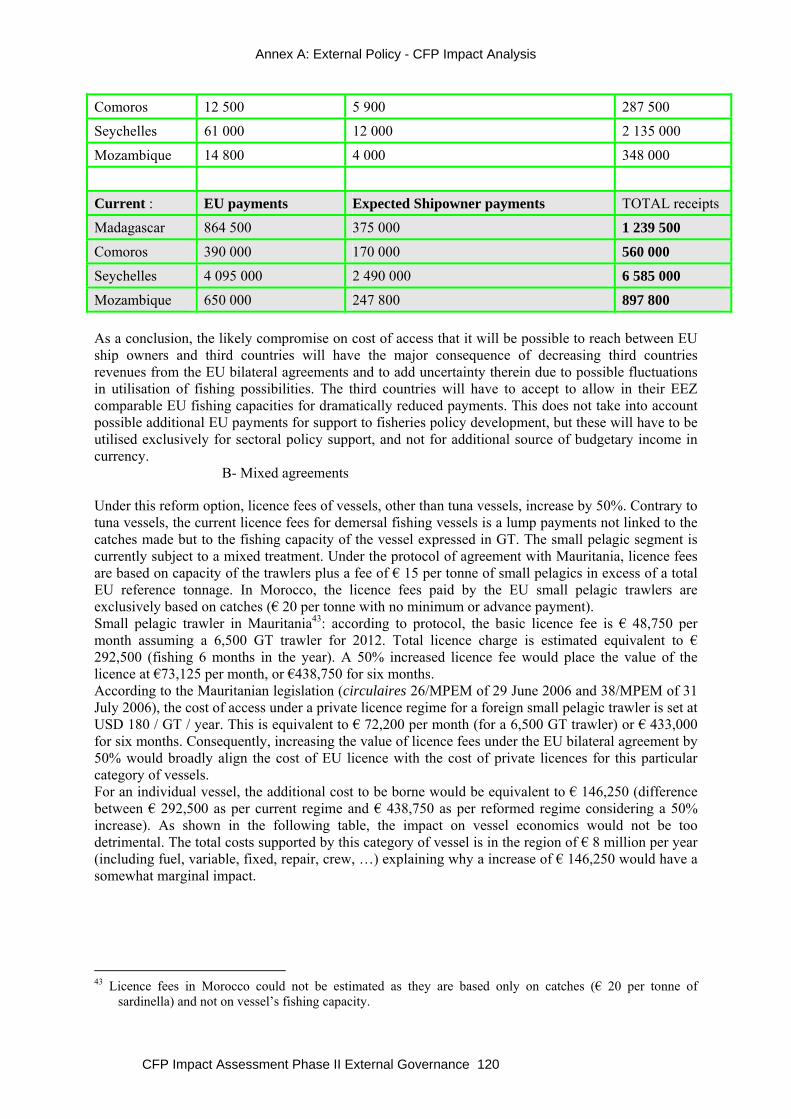
Annex A: External Policy - CFP Impact Analysis
CFP Impact Assessment Phase II External Governance 120
Comoros 12 500 5 900 287 500
Seychelles 61 000 12 000 2 135 000
Mozambique 14 800 4 000 348 000
Current : EU payments Expected Shipowner payments TOTAL receipts
Madagascar 864 500 375 000 1 239 500
Comoros 390 000 170 000 560 000
Seychelles 4 095 000 2 490 000 6 585 000
Mozambique 650 000 247 800 897 800 As a conclusion, the likely compromise on cost of access that it will be possible to reach between EU ship owners and third countries will have the major consequence of decreasing third countries revenues from the EU bilateral agreements and to add uncertainty therein due to possible fluctuations in utilisation of fishing possibilities. The third countries will have to accept to allow in their EEZ comparable EU fishing capacities for dramatically reduced payments. This does not take into account possible additional EU payments for support to fisheries policy development, but these will have to be utilised exclusively for sectoral policy support, and not for additional source of budgetary income in currency.
B- Mixed agreements
Under this reform option, licence fees of vessels, other than tuna vessels, increase by 50%. Contrary to tuna vessels, the current licence fees for demersal fishing vessels is a lump payments not linked to the catches made but to the fishing capacity of the vessel expressed in GT. The small pelagic segment is currently subject to a mixed treatment. Under the protocol of agreement with Mauritania, licence fees are based on capacity of the trawlers plus a fee of € 15 per tonne of small pelagics in excess of a total EU reference tonnage. In Morocco, the licence fees paid by the EU small pelagic trawlers are exclusively based on catches (€ 20 per tonne with no minimum or advance payment). Small pelagic trawler in Mauritania43: according to protocol, the basic licence fee is € 48,750 per month assuming a 6,500 GT trawler for 2012. Total licence charge is estimated equivalent to € 292,500 (fishing 6 months in the year). A 50% increased licence fee would place the value of the licence at €73,125 per month, or €438,750 for six months. According to the Mauritanian legislation (circulaires 26/MPEM of 29 June 2006 and 38/MPEM of 31 July 2006), the cost of access under a private licence regime for a foreign small pelagic trawler is set at USD 180 / GT / year. This is equivalent to € 72,200 per month (for a 6,500 GT trawler) or € 433,000 for six months. Consequently, increasing the value of licence fees under the EU bilateral agreement by 50% would broadly align the cost of EU licence with the cost of private licences for this particular category of vessels. For an individual vessel, the additional cost to be borne would be equivalent to € 146,250 (difference between € 292,500 as per current regime and € 438,750 as per reformed regime considering a 50% increase). As shown in the following table, the impact on vessel economics would not be too detrimental. The total costs supported by this category of vessel is in the region of € 8 million per year (including fuel, variable, fixed, repair, crew, …) explaining why a increase of € 146,250 would have a somewhat marginal impact.
43 Licence fees in Morocco could not be estimated as they are based only on catches (€ 20 per tonne of
sardinella) and not on vessel’s fishing capacity.
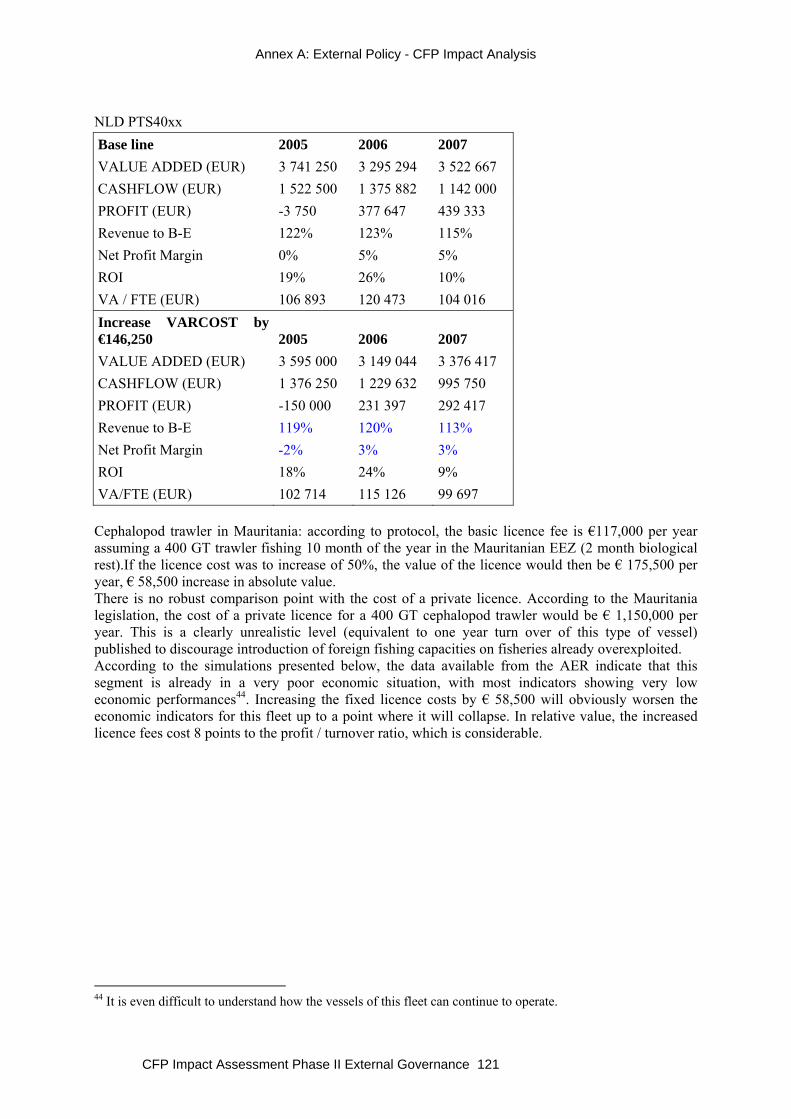
Annex A: External Policy - CFP Impact Analysis
CFP Impact Assessment Phase II External Governance 121
NLD PTS40xx Base line 2005 2006 2007 VALUE ADDED (EUR) 3 741 250 3 295 294 3 522 667 CASHFLOW (EUR) 1 522 500 1 375 882 1 142 000 PROFIT (EUR) -3 750 377 647 439 333 Revenue to B-E 122% 123% 115% Net Profit Margin 0% 5% 5% ROI 19% 26% 10% VA / FTE (EUR) 106 893 120 473 104 016 Increase VARCOST by €146,250 2005 2006 2007 VALUE ADDED (EUR) 3 595 000 3 149 044 3 376 417 CASHFLOW (EUR) 1 376 250 1 229 632 995 750 PROFIT (EUR) -150 000 231 397 292 417 Revenue to B-E 119% 120% 113% Net Profit Margin -2% 3% 3% ROI 18% 24% 9% VA/FTE (EUR) 102 714 115 126 99 697
Cephalopod trawler in Mauritania: according to protocol, the basic licence fee is €117,000 per year assuming a 400 GT trawler fishing 10 month of the year in the Mauritanian EEZ (2 month biological rest).If the licence cost was to increase of 50%, the value of the licence would then be € 175,500 per year, € 58,500 increase in absolute value. There is no robust comparison point with the cost of a private licence. According to the Mauritania legislation, the cost of a private licence for a 400 GT cephalopod trawler would be € 1,150,000 per year. This is a clearly unrealistic level (equivalent to one year turn over of this type of vessel) published to discourage introduction of foreign fishing capacities on fisheries already overexploited. According to the simulations presented below, the data available from the AER indicate that this segment is already in a very poor economic situation, with most indicators showing very low economic performances44. Increasing the fixed licence costs by € 58,500 will obviously worsen the economic indicators for this fleet up to a point where it will collapse. In relative value, the increased licence fees cost 8 points to the profit / turnover ratio, which is considerable.
44 It is even difficult to understand how the vessels of this fleet can continue to operate.

Annex A: External Policy - CFP Impact Analysis
CFP Impact Assessment Phase II External Governance 122
ESP DTS2440 Base line 2005 2006 2007 VALUE ADDED (EUR) 192 250 180 327 181 582 CASHFLOW (EUR) -59 256 -35 509 -34 331 PROFIT (EUR) -98 142 -72 387 -47 985 Revenue to B-E 98% 100% 98% Net Profit Margin -11% -10% -5% ROI -4% -2% -2% VA / FTE (EUR) 10 237 12 970 11 214 Increase VARCOST by €58,500 2005 2006 2007 VALUE ADDED (EUR) 133 750 121 827 123 082 CASHFLOW (EUR) -117 756 -94 009 -92 831 PROFIT (EUR) -156 642 -130 887 -106 485 Revenue to B-E 92% 93% 92% Net Profit Margin -18% -18% -12% ROI -7% -5% -4% VA/FTE (EUR) 7 122 8 763 7 601
The following Table 13 summarises what could be the EU payments to third countries if the EU private sector was to bear the cost of access alone. As developed in the previous sections of the report, the main constraining factor will be that the EU fleet will not be in an economic position to substitute for the EU payments as i) this would have unsustainable impacts on the fleet profitability, and ii) it will undermine EU vessels competitiveness compared to other third country fleets. No other foreign fleet would be in a capacity to support similar levels of access fees equivalent to current EU payments. In summary, the expected possible contributions of the EU fleet may be: For the EU tuna sector, the equivalent of € 50 / tonne. This corresponds to ≈ 5 to 6% of the average value of the catches (€ 900 / tonne) but importantly, this aligns with the costs of access paid to coastal State EEZ by other distant water tuna fleet. For the EU small pelagic sector, the current cost of access is low compared to known reference levels (Mauritania, Morocco). It is assumed that the small pelagic fleet can sustain a 50% increase in access fees without compromising its profitability and its international competitiveness. For the EU demersal sector, the current cost of access currently paid appears to correspond more or less to what the vessels can afford. The economic situation of the fleet prevents any increase in licence costs. It is assumed that payments from this fleet will remain similar to current payments.

Annex A: External Policy - CFP Impact Analysis
CFP Impact Assessment Phase II External Governance 123
Table 13 : Summary of estimates of transfers to third countries under option 1. All data in € million.
Likely payments Basis for estimates Currrent EU contribution of which sectorsupport
Perceived needs for sector support
CPV 0.2 Current EU catches of 3,000 t paid 50 €/t 0.4 0.3 1.0 CIV 0.2 Current EU catches of 3,500 t paid 50 €/t 0.6 0.6 1.4 GAB 0.4 Current EU catches of 8,000 t paid 50 €/t 0.9 0.5 2.4 STP 0.2 Current EU catches of 3,500 t paid 50 €/t 0.7 0.3 0.5 COM 0.3 Alignment with cost of private licences (see main text) 0.4 0.2 0.9 MAD 0.7 Alignment with cost of private licences (see main text) 1.2 1.0 11.1 MOZ 0.3 Alignment with cost of private licences (see main text) 0.9 0.9 5.6 SYC 2.1 Alignment with cost of private licences (see main text) 5.3 3.0 6.0 KIR 0.4 Current EU catches of 8,000 t paid 50 €/ 0.5 0.1 1.9 FSM 0.1 No catches so far, assumption is current cost of licences
(precautionary licence) 0.6 0.2 0.8
SLB 0.1 Fairly low catches so far, assumption is current cost of licences (precautionary licence)
0.4 0.2 2.1
GUB 1.3 Current payments + slight increase from the EU tuna fleet 7.5 3.0 1.5 GRN 3.5 Empirically set at 10% of fleet turnover (≈ € 35 M) 15.8 3.3 14.7 MRT 18.0 Current licence fees (€ 12 M) + increase from small pelagic vessels 70.0 20.0 10.4 MAR 3.0 Current licence fees (€ 1.5 M) + increase from small pelagic vessels 36.1 13.5 43.6 24.0 141.2 47.0 103.9

Annex A: External Policy - CFP Impact Analysis
CFP Impact Assessment Phase II External Governance 124
C. EU support to the implementation of responsible fishing practices in the coastal EEZ
Under option 1, it is assumed that the EU private sector will entirely bear the cost of access. The EU institution would still provide specific funding to the coastal States under agreements to support the partnership for implementation of responsible fishing practices in the EEZ (sectoral support). Under option 1, the EU would continue to provide additional funding to the partner coastal States. The current (loose) proportionality between fishing rights negotiated and the sectoral support envelope negotiated means that some partner coastal States (e.g. Mauritania, Morocco, Greenland) receive fairly high sectoral funding, while some other partner coastal States, essentially the one having concluded a small tuna agreement, receive low, and sometime insignificant, sectoral funding (e.g. Kiribati, Solomon Isl., Cape Verde or Sao Tome). For countries that have not a bilateral fishing agreement with the EU (e.g. Senegal, Guinea, Gambia etc.), the only sectoral support received in a recent past is through the EDF funded regional programmes. Assuming the reform will put an end to the principle of proportionality between fishing capacities negotiated and the amount of sectoral support, the following table tries to figure out what amount of sectoral support the third countries may need in the future. The estimate is based on two assumptions:
• The costs of managing the fisheries are approximately equivalent to 6% of the value of the catches in the EEZ. The 6% benchmark is the average management costs in OECD countries (inc. research, MCS, management)45. It may not be appropriate for third countries with development needs, but it is the only reference available.
• The funding is compatible with the absorption capacity of the institutions. According to the minutes of the joint-committees created under each bilateral fishing agreement, not all countries use the sectoral support up to expectations. This can be explained by the fact that some partner coastal States are affected by political instability and poor performances of the National budgetary framework compounded by a general weak administrative capacity (the sectoral support granted under FPA is a budgetary support programmes unlike most EDF projects in these regions which are project based)46. In some notable cases (Mauritania, Guinea Bissau), the funding provided appear to exceed by far the absorption capacity of the State administration. To take into account this factor, it assumed that the institutions in charge of fisheries cannot utilise more than 2% of the total budget income of the state.
The amount of support the countries may need is the lowest value between element 1 (6% of the value of landings) and element 2 (absorption capacity). In other words, the absorption capacity caps the amount of funding the third country may receive. The estimates are shown in the following table.
Table 14: Possible adjusted sectoral support under option 1
Country Value of catches (MEUR)
Budget income(MEUR)
1- 6% of catchvalue
2- 2% of budget income
Retained (lowest 1-2)
Current EU contribution
Cse
CPV 16.0 282 1.0 5.6 1.0 0.4 0CIV 22.8 2400 1.4 48.0 1.4 0.6 0GAB 39.9 2426 2.4 48.5 2.4 0.9 0STP 8.0 100 0.5 2.0 0.5 0.7 0
45 See OECD study at http://www.oecd.org/dataoecd/2/52/1917868.pdf
46 To be balanced on the causes of failed partnerships, it should be also mentioned that DG MARE is clearly understaffed to properly monitor all the partnership agreements. As an illustration, about 4.2 agents per € 10 million commitment are available for management of external EU aid while DG MARE has 1.5 agents per € 10 million commitment for management of sectoral support under FPAs.

Annex A: External Policy - CFP Impact Analysis
CFP Impact Assessment Phase II External Governance 125
COM 14.8 44 0.9 0.9 0.9 0.4 0MAD 184.9 620 11.1 12.4 11.1 1.2 1MOZ 92.8 824 5.6 16.5 5.6 0.9 0SYC 99.3 318 6.0 6.4 6.0 5.3 3KIR 31.9 113 1.9 2.3 1.9 0.5 0FSM 12.6 113 0.8 2.3 0.8 0.6 0SLB 42.2 103 2.5 2.1 2.1 0.4 0GUB 132.5 72.5 8.0 1.5 1.5 7.5 3GRN 245.0 1000 14.7 20.0 14.7 15.8 3MRT 192.6 522 11.6 10.4 10.4 70.0 20MAR 726.4 21083 43.6 421.7 43.6 36.1 1TOTAL 103.6 141.2 47 If the EU finances up to the estimated needs of the country, the budget needed will be in the region of € 80 million per year if Morocco is not taken into account, and € 103.6 million if the estimate for Morocco is retained. Without taking into account Morocco47, the funding would vary between €500,000 per year (Sao Tome) and € 14.7 million (Greenland), with an average of €3.5 million per year per country. Most countries would receive more sectoral support than they receive now, with the two notable exceptions of Mauritania and Guinea Bissau. These two countries are those were current support appears to clearly exceed the absorption capacities of the institutions. The main difference with the current situation will be that all the EU support under bilateral agreements will be earmarked for support to the fisheries policy, while currently a part of the contribution is used as part of the Government revenues for financing policies in other sectors. In certain cases (Mauritania, Guinea Bissau, Seychelles), this option may jeopardise the macro-economic stability of the third countries. Whilst the payments from the EU shipowners will still be used by the public treasury, the amounts concerned will not compensate for the loss of treasury income from the EU contribution. The needs of the partner third countries are evaluated at € 103 million. Current payments under FPAs are € 141 million of which € 47 million are dedicated to policy support. Under the reform, would the EU affect the whole of the current € 141 million to policy support? (a budget that is currently used in majority for payment of compensation for fishing rights). If yes, sectoral support as such would be tripled (from € 47 M to € 141 M). This assumption needs to be validated at political level. If budgets are kept constant compared to now (≈ € 141 million), the budgets unused at Country level could be used to support actions at regional level. This would help to strengthen regional integration and to give some supports to coastal States that have not concluded a bilateral fishing agreement with the EU (Senegal, Sierra Leone, Guinea, Kenya, Tanzania). Leaving those countries without support could help to create havens for IUU fishing. The regional approach is not necessarily easy. There are success stories (Indian Ocean through IOC, Pacific Ocean through FFA and SPC, Southern Africa through SADC), but also bad experiences (West Africa through the CSRP). The transition period The table on the next page shows what could be the transfers to third countries under option 1. The following assumptions have been taken to model the transition:
• The EU and the third countries are bound by the current protocols into force. A transition from the current situation to option 1 will only be possible when protocols, and probably the head bilateral agreements, will be renegotiated.
47 Morocco is a special case because of its advanced political relations with the EU and its status of middle
income country. It could be appropriate to support the sector up to this level of funding, depending on the priorities adopted under the association agreement.

Annex A: External Policy - CFP Impact Analysis
CFP Impact Assessment Phase II External Governance 126
• For all third countries, we consider that the EU will support the implementation of the fisheries policy up to the needs and capacities estimated (Table 14 page 124). The variations (upward or downward, depending on the third countries concerned) are progressive over three years. The duration of the transition period is therefore assumed to be 3 years.
• Mixed agreements are maintained, but some fishing categories that are facing major economic difficulties and/or that have fishing possibilities in fisheries potentially not viable are phased out. This includes part of the demersal EU demersal fleet currently under the agreements concluded with Mauritania, Guinea Bissau and Morocco, but to a lesser extent for the latter.
• For the three of the four major current fishing agreements into force (Mauritania, Morocco and Guinea Bissau), the protocols expire this year or next year. Although it is likely that the financial contribution will be decreased given the poor performances of these agreements (MAR & GUB have recently been evaluated as poorly efficient), there are no indications available on what will be the future contribution. We consider as an assumption that the next protocols starting before end 2012 will be identical to current protocols and extended for another 4 year period.
• As per the basis assumption under option 1, access costs borne by shipowners will be an ordinary budget resource, while EU support will be a budget support dedicated to the implementation of the national fisheries policy.
The following conclusions can be drawn from the simulation: Until 2015 included there will be at the same time third countries with bilateral agreements under the current framework and third countries under a reformed framework. Current framework will be phased out in 2016 when all current protocols have expired. EU budget resources will increase until 2014 and then decrease as a consequence of having reformed sectoral support (increased or decreased) progressively implemented over three years. At the end of the transition period, the EU budget requirement will be similar to the estimated needs and capacities of third countries. The budget figures estimated are strongly linked to the immediate future of the protocols of agreements with Mauritania, Morocco and Guinea Bissau. The reformed access agreements will be neutral for most of the third countries from a macro-economic perspective since their economies are not reliant on EU transfers under a bilateral fishing agreement. However, for Mauritania, Guinea Bissau, Greenland and possibly Seychelles, the reformed access option 1 will have adverse impacts on the macro-economic stability as a consequence of the important decrease in regular budget income. It is likely that the EU will have to mobilise other cooperation instruments to amortise the loss in budgetary income and/or the loss in currency earnings (balance of payments). There is a precedent in Mauritania where the protocol negotiated in 2008 included a possible additional EDF allocation to compensate for the loss of budget income. The assumption of a three year transition period will put all fishing agreements aligned in 2018 (the last transitional adjustments to sectoral support will occur in 2017). If a longer transition period was retained, 5 years for example, the end of the transition period will be 2019 and all agreements aligned in 2020.

Annex A: External Policy - CFP Impact Analysis
CFP Impact Assessment Phase II External Governance 127
Table 15: Modelling of receipts of third countries during a transition period of 3 years. All data in € million
2012 2013 2014 2015 2016 2017 2018
Thrid
co
untri
es
End
year
pr
otoc
ol
Like
ly
paym
ents
(b
udge
t)
EU
supp
ort
Cur
rent
pa
yem
ent
s(bu
dget
)EU
su
ppor
t
B S B S B S B S B S B S B S CPV 2012 0.2 1.0 0.1 0.3 0.2 0.5 0.2 0.8 0.2 1.0 0.2 1.0 0.2 1.0 0.2 1.0 0.2 1.0 CIV 2013 0.2 1.4 0.0 0.6 0.0 0.6 0.2 1.4 0.2 1.4 0.2 1.4 0.2 1.4 0.2 1.4 0.2 1.4 GAB 2012 0.4 2.4 0.3 0.5 0.4 1.1 0.4 1.8 0.4 2.4 0.4 2.4 0.4 2.4 0.4 2.4 0.4 2.4 STP 2014 0.2 0.5 0.3 0.3 0.3 0.3 0.3 0.3 0.2 0.5 0.2 0.5 0.2 0.5 0.2 0.5 0.2 0.5 COM 2014 0.3 0.9 0.3 0.3 0.3 0.3 0.3 0.3 0.3 0.5 0.3 0.7 0.3 0.9 0.3 0.9 0.3 0.9 MAD 2013 0.7 11.1 0.2 1.0 0.2 1.0 0.7 4.3 0.7 7.7 0.7 11.1 0.7 11.1 0.7 11.1 0.7 11.1 MOZ 2012 0.3 5.6 0.0 0.9 0.3 2.5 0.3 4.0 0.3 5.6 0.3 5.6 0.3 5.6 0.3 5.6 0.3 5.6 SYC 2014 2.1 6.0 3.4 2.2 3.4 2.2 3.4 2.2 2.1 3.5 2.1 4.7 2.1 6.0 2.1 6.0 2.1 6.0 KIR 2013 0.4 1.9 0.3 0.1 0.3 0.1 0.4 0.7 0.3 1.3 0.3 1.9 0.3 1.9 0.3 1.9 0.3 1.9 FSM 2016 0.1 0.8 0.4 0.2 0.4 0.2 0.4 0.2 0.4 0.2 0.4 0.2 0.1 0.4 0.1 0.6 0.1 0.8 SLB 2013 0.1 2.1 0.2 0.2 0.2 0.2 0.1 0.8 0.1 1.5 0.1 2.1 0.1 2.1 0.1 2.1 0.1 2.1 GUB 2015 1.1 1.5 4.6 3.0 4.6 3.0 4.6 3.0 4.6 3.0 1.1 2.5 1.1 2.0 1.1 1.5 1.1 1.5 GRN 2013 3.5 14.7 12.6 3.3 12.6 3.3 3.5 7.1 3.5 10.9 3.5 14.7 3.5 14.7 3.5 14.7 3.5 14.7 MRT 2016 18.0 10.4 50.0 20.0 50.0 20.0 50.0 20.0 50.0 20.0 50.0 20.0 18.0 16.8 18.0 13.6 18.0 10.4 MAR 2015 3.0 43.6 22.6 13.5 22.6 13.5 22.6 13.5 22.6 13.5 3.0 23.5 3.0 33.6 3.0 43.6 3.0 43.6 EU payments 143.7 142.0 150.4 142.7 100.3 106.9 103.9 As per current regime (budget and sectoral) 139.6 121.0 114.2 70.6 0 0 0.0 As per option 1 regime (sectoral only) 4.1 21.0 36.3 72.1 100.3 106.9 103.9 Keys: B: budget income S: sectoral support Transition from current regime to new option 1 regime Bold : EU payments as per current regime (budget and sectoral)
Normal : EU payment as per reformed regime (budget income = payments by the EU shipowners, sectoral support = payments by the EU)

Annex A: External Policy - CFP Impact Analysis
CFP Impact Assessment Phase II External Governance 128

Annex A: External Policy - CFP Impact Analysis
CFP Impact Assessment Phase II External Governance 129
2.2. RFMO Option 1: Enhanced involvement in RFMOs considering payments from shipowners
Improving RFMOs capacities to conserve and manage the stocks has always been a priority of the EU external policy. It can be acknowledged that the EU has always taken a proactive role in the debates, trying to promote ambitious conservation and management rules, as well as measures to increase compliance. However, the results are mixed with some examples (ICCAT, WCPCF, IOTC) demonstrating that not all parties are keen to improve the quality of management for various reasons. This is also a consequence of the consensus rule that prevails in most RFMOs. The current financial of the EU in RFMOs is € 16 million, including € 4 million as compulsory payment and € 12 million as additional non-compulsory participation to the work of RFMOs. Significant progresses have been made lately with the realisation of internal audits of RFMOs (including NAFO, NEAFC, IOTC, ICCAT with yet a large number of RFMOs to complete this exercise). These reviews identified structural deficiencies as well as specific areas where improvements could be achieved. Two major aspects supporting governance would deserve additional efforts: (i) control and enforcement of existing management and conservation measures (ex. ICCAT) and (ii) improvement of the quality of scientific advice for decision-making including integration of the ecosystem approach to fisheries management (ex. IOTC). The major reason underlying limited success in these two areas is the lack of capacities and resources of coastal States, especially developing coastal States, to improve control and data collection. This would need additional funding that is not available from the RFMOs core budgets. Such funding is however available but depending on donors strategies. For example, the EU has been active in the Indian Ocean, supporting notably research and MCS functions through a DG MARE subsidy to IOC and through the successive Regional EDF. The EU has also a long history of involvement in support to research in the Pacific Ocean also through the Regional EDF. In addition, DG MARE budget commits ≈ € 12 million per year for actions related to RFMOs strengthening. A possible solution to increase the capacities of RFMOs and their coastal States members could be to levy a fee on the fleets operating in the Regulatory area. For most (if not all) Flag States, fishing in the high seas is free, contrary to fishing in the EEZ for which access fees have to be paid to coastal States. Under this option 1, the payment of a registration fee to the RFMO is considered for the generation of extra-budget income. There is a precedent to consider in this respect. In the Western Central Pacific Ocean, the Forum Fisheries Agency (FFA), which not a RFMO per se, maintains a register of fishing vessels48 authorised to fish in the EEZ of its Member countries called the list of vessels in good standing. Registration on this list is compulsory if the vessel wish to engage in fishing activities in the EEZ of Pacific Costal States. According to Pacific countries rules, a vessel that is not on this list cannot obtain a licence. To be on this form of positive list, ship owners have to submit an application to FFA and pay a registration fees. In 2009, the registration fee was USD 2,448 + USD 800 if the vessel is to fish in the EEZ of the coastal States party to the Nauru Agreement (equivalent in total to € 2,500). Registration is valid for one year. No foreign fishing vessel shall be issued with a fishing licence unless the vessel and its operator have good standing on the FFA Vessel Register (i.e. the vessel has a good record of compliance with MTCs, including VMS - see below - catch reporting, transhipment rules) and the vessel is registered on the WCPCF record of Fishing Vessels. There are currently in excess of 1,200 vessels currently registered with FFA. The revenue generated is +/- USD 3 million per year. This amount is used by FFA to monitor compliance with minimum terms and conditions, including centralised VMS monitoring. Applying this principle to RFMOs worldwide would have some advantage compared to the second option (fee based on catches, see option 2). The first is that it is a rather simple administrative process that does not involve submission and verification of catch declarations. The second is that it would
48 A per FFA definitions, a fishing vessel includes any vessel that catch fish or support catching activities. This
definition encompasses therefore fish carriers or any type of support vessels in addition to real fishing vessels

Annex A: External Policy - CFP Impact Analysis
CFP Impact Assessment Phase II External Governance 130
probably help to sanitise the different white lists of RFMOs. According to current rules, registration on these lists is completely open. Vessels registered do not have to justify any activity in the regulatory area, and registration is seen as a precautionary in case the vessels would fish in the area. For example, the EU has 473 vessels registered on the IOTC white list while it can be estimated that only 150 (taking into account La Réunion fleet) are really active in this ocean. Applying the principle of charging €2,500 for registration on the white lists of the four tuna RFMOs is developed below considering two variants: the first being that all vessels pay the registration fee, the second being that only larger vessels (tentative limit set at 20 m and more for the purpose of this simulation) pay the registration fee. The impact of this minor additional charge of €2,500 per year on vessels account is not studied in details as it is likely to be insignificant. This additional charge will not jeopardise either the competitiveness of the EU fleet compared to other foreign fleets. The table below indicates the number of vessels registered on RFMOs white lists as from April 2010 showing separately vessels flying all flags (including an EU flag) and vessels flying a EU flag.
Table 16: Number of vessels registered on the lists of vessels authorised to fish in the tuna RFMOs regulatory areas
All flags ICCAT IOTC WCPFC IATTC Total number 4 586 3 550 6 091 4 522 Of which >= 20 m 3 757 2 442 1 520 1 941 Of which EU flag ICCAT IOTC WCPFC IATTC Total number 2 376 473 119 151 Of which >= 20 m 1 665 253 119 150 The following details what could be the revenue generated under three different situations: i) the numbers of vessels registered remain constant compared to current levels, which is an unlikely situation as ship owners having no interest in the fisheries will not pay for keeping their registration (although the amount considered of €2,500 is not a considerable amount of money), ii) having to pay for registering will discourage 60% of vessels less than 20 m and 40% of vessels of 20 m and more, et iii) same assumption but considering that the registration fee will discourage 80% of small vessels and 60% of vessels of 20 m and more.
Table 17: Simulated extra incomes of tuna RFMOs in case vessels from all parties pay a registration fee of € 2,500 under different situations
ICCAT IOTC WCPFC IATTC Numbers of registered vessels maintain as current A1- All vessels pay a fee 11 465 000 8 875 000 15 227 500 11 305 000 A2- Only larger vessels pay a fee 9 392 500 6 105 000 3 800 000 4 852 500 Erosion 60% of registration of small vessels, 40% large vessels B1- all vessels pay a fee 6 464 500 4 771 000 6 851 000 5 492 500 B2 - Only larger vessels pay a fee 5 635 500 3 663 000 2 280 000 2 911 500 Erosion 80% of registration of small vessels, 60% large vessels C1 - All vessels pay a fee 4 171 500 2 996 000 3 805 500 3 231 500 C2 - Only larger vessels pay a fee 3 757 000 2 442 000 1 520 000 1 941 000

Annex A: External Policy - CFP Impact Analysis
CFP Impact Assessment Phase II External Governance 131
The results indicate that substantial amounts of money could be recovered from the fleets. Assuming only larger vessels pay a fee with a 40% erosion of number as compared to current level (situation B2) which appear ex-ante as the most likely scenario, ICCAT could recover € 5.6 million annually, IOTC € 3.6 million, WCPCF € 2.3 million and IATTC € 2.9 million. Under the worst case scenario considered (situation C2), inflow of extra-budgetary income would remain significant. If the EU was the only party to apply this registration rule, which may be opposed by ship owners as it will undermine their competitiveness compared to other fleets, the extra income generated is still important for ICCAT (€ 2.5 million per year under scenario B2) but much more disappointing for other RFMOs, especially for IOTC where the EU has an important interest.
Table 18: Simulated extra incomes of tuna RFMOs in case only EU vessels pay a registration fee of € 2,500 under different situations
ICCAT IOTC WCPFC IATTC Lists maintain the numbers of registered vessels as current A1 - All vessels pay a fee 5 940 000 1 182 500 297 500 377 500 A2 - Only larger vessels pay a fee 4 162 500 632 500 297 500 375 000 Erosion 60% of registration of small vessels, 40% large vessels B1- All vessels pay a fee 3 208 500 599 500 178 500 226 000 B2 - Only larger vessels pay a fee 2 497 500 379 500 178 500 225 000 Erosion 80% of registration of small vessels, 60% large vessels C1 - All vessels pay a fee 2 020 500 363 000 119 000 150 500 C2 - Only larger vessels pay a fee 1 665 000 253 000 119 000 150 000 For other RFMOs, the simulation could not be applied. As concerns NAFO and NEAFC, there is no white list publicly available. Parties exchange the lists of vessels authorised to fish without placing them on a public internet web site. In 2007, there were 1,100 EU fishing vessels having a NEAFC special fishing permit, including 865 vessels of 20 m and more. A large number of Norwegian vessels is also likely to be authorised as well. Charging the licence to access the NEAFC regulatory area could generate a budget around € 2 million per year. Concerning NAFO, 70 EU vessels obtained a special fishing permit in 2007. The most numerous fleet is probably that of Canada (and Greenland potentially). These numbers are not known so it is difficult to estimate what budget could be levied. In any case, the EU will be a minor contributor. Finally, there are too few vessels authorised into the SEAFO and CCMALR regulatory areas (around 30) to make a taxation system worthwhile. Finally, the SPRFMO is not fully established as yet, pending additional ratifications. As a consequence no list of vessels is currently available. Summary of options for extra-budgetary support of RFMOs if a registration fee of €2,500 is paid annually to register on the white lists of vessels authorised to fish
Table 19: Summary of possible amounts of extra-budgetary support to RFMOs if fishing in the regulatory area is charged
All vessels (incl. EU) pay a registration fee of € 2,500
Only EU vessels pay a registration fee of € 2,500
ICCAT High : € 11.5 mln Low: € 3.8 mln
High : € 5.9 mln Low : € 1.6 mln
IOTC High: € 8.8 mln Low: € 2.4 mln
High : € 1.2 mln Low : € 0.2 mln
WCPFC High: € 15.2 mln Low: € 1.5 mln
High : € 0.3 mln Low : € 0.1 mln
IATTC High: € 11.3 mln (EU) High : € 0.4 mln

Annex A: External Policy - CFP Impact Analysis
CFP Impact Assessment Phase II External Governance 132
Low: € 1.9 mln (EU 0.2 mln) Low : € 0.2 mln SPRFMO Not possible to assess (High and low refer to maximum and minimum contributions generated under different hypothesis. For the registration fee alternative the variation is related to payment or not by vessels less than 20 m and possible erosion of the number of registered vessels.

Annex A: External Policy - CFP Impact Analysis
CFP Impact Assessment Phase II External Governance 133
2.3. FPA Option 2 : No bilateral fishing agreements
For tuna fishing vessels, the various world regulatory authorities (the tuna RFMOs) have all adopted limits setting maximum levels of fishing activity or catch. The EC tuna fleet is therefore limited to levels close to its existing levels. The current level of investment being made by vessel owners and the benefits of operating under Community flags, in particular in terms of fishing possibilities and status of originating material, rather than under other third country flags should ensure that the European tuna fleet remains stable in the near future. The tuna fleet needs access to fishing grounds under the jurisdiction of third countries in order to follow fish populations as they migrate. The current network of bilateral agreements is not sufficient to meet these needs, especially in the eastern Atlantic and the western Indian Ocean. If these bilateral agreements disappear, the European tuna fleet will continue to operate by negotiating private access to the EEZs of third countries. The fishing rights granted to the Community by the RFMOs mean that there will be no particular benefit to be gained through a change of flag. Under this option, the fleet would bear its own access costs like under option 1. These access costs will be probably negotiated as a compromise between current licence fees under FPA and fees applicable to foreign tuna fleet as per the National frameworks. In the absence of fishing agreement, the main consequence is that the EU tuna fleet will loose the legal security provided by a binding international (bilateral) agreement, and will loose predictability of the deployment strategy as private licenses are generally negotiated for the year current only49. For demersal trawlers, the situation is different. The status of the coastal stocks fished in the EEZs of West African countries and the negative environmental impacts stemming from the use of trawls means that this fleet must necessarily contract if sustainable fishing is to be restored. This move towards reduction began in the early years of the century with a contraction in the number of fishing opportunities available to this fleet by restrictions imposed on vessel numbers and even full retirement of vessels (renegotiation of mixed agreements to tuna agreements). If the agreements are terminated, it is likely that the vessels in this fleet will be faced with the following alternatives: to continue current deployment strategies under an EU flag and negotiate private access arrangements with coastal States, to leave the sector for good by accepting the scrapping incentive payments offered by the EFF, or take the risk of investing in a mixed company by leaving the European register to join that of a third country. The likely future of the external demersal fleet may be different for the two major fishing segments currently involved in demersal fishing opportunities, i.e. the shrimp trawler fleet and the cephalopod trawler fleet. Concerning the shrimp fleet, the current strategy of the EU fleet is to target both deep sea shrimp stocks (Parapeaneus or Aristeus species - gambas - present beyond 150 m depth) and coastal shrimp stocks (Penaeus species - lagostinos – caught in shallow waters). Fishing in the deep sea layers do not interact with local fisheries and the EU controlled shrimp fleet is almost the only one in the world with enough technology and knowledge to exploit these fisheries. On that ground, it is likely that the vessels will be in a position to negotiate private fishing rights. In the absence of bilateral fishing agreements, this fleet will not have any advantage of operating under the EU flag, so will probably reflag to other coastal States. Experience shows that Spanish shrimp operators have the necessary experience to reflag to other countries. In 2006, the production of the Andalucía shrimp fleet originated 56% from local vessels operating under a foreign flag (Morocco, Mauritania, Gabon for the main) as opposed to 44% originating from Spanish flagged vessels. There are currently around 30 such EU flagged shrimp trawlers operating off West Africa. Concerning the cephalopod fleet, the foreseeable future under a situation where there is no bilateral agreement seems more difficult. These trawlers exploit the coastal waters and are in direct competition with local artisanal or industrial fleets. Demersal stocks of fish or cephalopods in the EEZ of West African States are in a situation of overexploitation (Morocco, Mauritania, Senegal, Guinea). It can be therefore anticipated that it will be difficult for these vessels to obtain private access rights in the
49 As an example, Kenya reportedly granted licences to the EU purse seine fleet at a cost of € 15,000 per year
until now. The country unilaterally increased the access cost to USD 50,000 (≈ x 2.5) for the following year, what the EU purse seine fleet refused. The vessels have no longer access to the EEZ.

Annex A: External Policy - CFP Impact Analysis
CFP Impact Assessment Phase II External Governance 134
absence of bilateral agreement with the EU. The only alternative may well be scrapping. This concerns 30 to 35 EU flagged trawlers. Lastly, the main preferred resources targeted by EU pelagic trawlers remain those of the Northeast Atlantic. These stocks have entered low productivity cycles that are likely to lead to a long-term reduction in fishing opportunities. The following graph shows the evolution of EU TAC for the main target species of the EU pelagic fleet (horse mackerel, mackerel, blue whiting and herring). Fishing possibilities for EU vessels decreased cumulatively by 37% over 2005 and 2009.
0
500 000
1 000 000
1 500 000
2 000 000
2 500 000
3 000 000
2005 2006 2007 2008 2009
tonnes
Horse mackerel
Mackerel
Blue whiting
Herring
Figure 12 : Evolution of EU TACs for the main target species of the small pelagic fleet
In order to maintain profitability, vessels must consequently step up the use they make of alternative fishing opportunities in West African waters covered by agreements or in the South-East Pacific, where EC vessels have preferential fishing rights. The need to gain access to the EEZs of third countries is therefore likely to increase in the near future. In the absence of bilateral agreements, the pelagic trawler fleet will need to negotiate private access at costs similar to those offered under the current agreements. These vessels are not interested in changing flag, because such a move would result in them losing access to resources under Community jurisdiction in Northeast Atlantic waters, as well as the benefit of preferential rights in other fishing grounds (South East Pacific). Like the tuna fleet, in the absence of fishing agreement, the main consequence is that the EU small pelagic fleet will loose the legal security provided by a binding international (bilateral) agreement, and will loose predictability of the deployment strategy. Third countries receipts in case of no bilateral agreement will be broadly similar to estimated receipts under option 1 whereby EU shipowners bear the cost of access (whether they operate under the EU flag or under another flag as a consequence of the termination of the agreements). The main variation will be in Mauritania: in the absence of fishing agreement, the conservative assumption is to consider that the cephalopod fleet will withdraw, with the consequence of a loss of € 4 million in public receipts (approximately the licence fees paid by the operators of this vessel category). This income will be regular budget income that the third countries may or may not allocate to support the implementation policy. In this absence of binding agreement with the EU, the utilisation of the receipts will be at the full discretion of coastal States. Under the option, the major impact is that DG MARE will interrupt its current partnership strategy, including the financial support for the implementation of the fisheries policy. The partner countries will consequently have less funding available for this purpose, unless the EU mobilises other cooperation instruments to support the development of an economic sector that can contribute to elimination of poverty50. Since few NIPs
50 In most LDC, poverty is important in rural / coastal areas. The strategies for meeting Millennium Goals often
identify the fisheries sector as a potential source of national growth.
Annex A: External Policy - CFP Impact Analysis
CFP Impact Assessment Phase II External Governance 135
under the current 10th EDF (2008-2013) identify the fisheries sector in the focal A allocations, the revised strategies to be started in 2014 will have probably to consider inclusion of this element. The table on the following page estimates what would be the receipts of third countries if the EU bilateral fishing agreements were terminated altogether as from 2012. No transitional period is considered. The treasury receipts originate from the fleet having concluded private access agreements, be it under an EU or third country flag. Since a few ongoing bilateral agreements will still be into force after the entry into force of the reform, DG MARE budget will have to cater for ≈ € 140 million in 2012, decreasing to € 71 million in 2015. From 2016 onwards, all bilateral agreements will be expired, and DG MARE budget for this policy action will be nil. Not considering the impact of the suppression of the sectoral support, the termination of the bilateral agreements will have an impact on the macro-economic stability of Mauritania, Guinea Bissau, Greenland and Seychelles.

Annex A: External Policy - CFP Impact Analysis
CFP Impact Assessment Phase II External Governance 136
Table 20: Modelling of receipts of third countries under option 2 (no agreements). All data in € million
2012 2013 2014 2015 2016 2017 2018
Thrid
co
untri
es
End
year
pr
otoc
ol
Like
ly
paym
ents
(b
udge
t)
Like
ly
EU
supp
ort
(sec
tora
l)C
urre
nt
paye
men
ts (
budg
et)
Cur
rent
EU
su
ppor
t (s
ecto
ral)
B S B S B S B S B S B S B S CPV 2012 0.2 0.0 0.1 0.3 0.2 0.0 0.2 0.0 0.2 0.0 0.2 0.0 0.2 0.0 0.2 0.0 0.2 0.0 CIV 2013 0.2 0.0 0.0 0.6 0.0 0.6 0.2 0.0 0.2 0.0 0.2 0.0 0.2 0.0 0.2 0.0 0.2 0.0 GAB 2012 0.4 0.0 0.3 0.5 0.4 0.0 0.4 0.0 0.4 0.0 0.4 0.0 0.4 0.0 0.4 0.0 0.4 0.0 STP 2014 0.2 0.0 0.3 0.3 0.3 0.3 0.3 0.3 0.2 0.0 0.2 0.0 0.2 0.0 0.2 0.0 0.2 0.0 COM 2014 0.3 0.0 0.3 0.3 0.3 0.3 0.3 0.3 0.3 0.0 0.3 0.0 0.3 0.0 0.3 0.0 0.3 0.0 MAD 2013 0.7 0.0 0.2 1.0 0.2 1.0 0.7 0.0 0.7 0.0 0.7 0.0 0.7 0.0 0.7 0.0 0.7 0.0 MOZ 2012 0.3 0.0 0.0 0.9 0.3 0.0 0.3 0.0 0.3 0.0 0.3 0.0 0.3 0.0 0.3 0.0 0.3 0.0 SYC 2014 2.1 0.0 3.4 2.2 3.4 2.2 3.4 2.2 2.1 0.0 2.1 0.0 2.1 0.0 2.1 0.0 2.1 0.0 KIR 2013 0.4 0.0 0.3 0.1 0.3 0.1 0.4 0.0 0.3 0.0 0.3 0.0 0.3 0.0 0.3 0.0 0.3 0.0 FSM 2016 0.1 0.0 0.4 0.2 0.4 0.2 0.4 0.2 0.4 0.2 0.4 0.2 0.1 0.0 0.1 0.0 0.1 0.0 SLB 2013 0.1 0.0 0.2 0.2 0.2 0.2 0.1 0.0 0.1 0.0 0.1 0.0 0.1 0.0 0.1 0.0 0.1 0.0 GUB 2015 1.1 0.0 4.6 3.0 4.6 3.0 4.6 3.0 4.6 3.0 1.1 0.0 1.1 0.0 1.1 0.0 1.1 0.0 GRN 2013 3.5 0.0 12.6 3.3 12.6 3.3 3.5 0.0 3.5 0.0 3.5 0.0 3.5 0.0 3.5 0.0 3.5 0.0 MRT 2016 14.0 0.0 50.0 20.0 50.0 20.0 50.0 20.0 50.0 20.0 50.0 20.0 14.0 0.0 14.0 0.0 14.0 0.0 MAR 2015 3.0 0.0 22.6 13.5 22.6 13.5 22.6 13.5 22.6 13.5 2.3 0.0 2.3 0.0 2.3 0.0 2.3 0.0 139.6 121.0 114.2 70.6 0.0 0.0 0.0 EU payments (as per current regime : budget and sectoral) 139.6 121.0 114.2 70.6 0.0 0.0 0.0 Keys: B: budget income S: sectoral support Transition from current regime to new option 2 regime Bold : EU payments as per current regime (budget and sectoral)
Normal : EU payment as per reformed regime (budget income = payments by the EU shipowners, sectoral support = payments by the EU)

Annex A: External Policy - CFP Impact Analysis
CFP Impact Assessment Phase II External Governance 137
2.4. RFMOs option 2: EU leadership in RFMOs with increase funding, including from financial
contribution of EU shipowners
Under this option, the EU takes a leadership in RFMOs. The EU remains a politically active to promote stringent conservation and management measures, and keeps a dedicated budget line (currently € 12 million) for non-compulsory contribution to support institutional strengthening of research and MCS. As a possible source of increased extra-core budgetary resources, it is considered under this option that ship owners pay a fee proportional to catches in the RFMOs regulatory areas. This sub-option would require provision of validated catch data within a reasonable time frame Tuna fisheries in the Indian Ocean According to IOCT database, total catches of highly migratory species in the Indian Ocean average 1.5 million tonnes per year over the 2006-2008 period. Gill net catches mostly from Iran, Sri Lanka and Indonesia represent the majority of the catches (34%), just before purse seine catches which include 28% of the total catches (Spain, France and Seychelles being the main purse seine fishing nations). Table 21 : Total catches of highly migratory species in the IOTC area (all flags). Source: IOTC
2006 2007 2008 Av. 2006-2008 % Av. Baitboat 180 375 146 262 140 747 155 795 10% Gillnet 576 986 534 911 526 232 546 043 34% Line 125 699 134 825 126 941 129 155 8% Longline 283 745 282 603 233 321 266 556 17% Other 53 107 45 894 44 019 47 674 3% Purse Seine 540 395 378 539 404 136 441 023 28% 1 760 309 1 523 033 1 475 396 1 586 246 100% EU catches average 245,000 tonnes per year over the 2006-2008 period, most being made by the purse seine segment. On average, the EU represents 17% of total tuna catches in the Indian Ocean.
Table 22 : Catches of EU fleets (Member States, not including OCTs) by segment. Source : IOTC
2006 2007 2008 Av. 2006-2008 % Av. Line 483 305 305 364 0% Longline 20 980 19 474 13 704 18 053 7% Purse Seine 299 114 182 385 198 914 226 804 92% 320 577 202 164 212 923 245 221 100% EU catches originate from the high seas and from the EEZ of coastal States. Access to the EEZ of some coastal States (Seychelles, Madagascar, Comoros and Mozambique) is regulated through a bilateral agreement concluded with the EU, while access to other EEZ (Kenya, Tanzania, Mauritius, French OCTs) is regulated by the provisions of private access agreements. According to data held by DG MARE, approximately 70,000 tonnes (31% of purse seine catches) are caught in the EEZ of costal States under bilateral agreement with the EU. Hence, 157,000 tonnes are taken by purse seiners in the high seas and in the EEZ of other coastal States (table below).
Table 23: details of EU catches in EEZ of coastal States under bilateral access agreement with the EU (Seychelles, Madagascar, Comoros, Mozambique and Mauritius until end 2007). Source: DG MARE
2006 2007 2008 Av. 2006-2008 Total EU purse seine catches 299 114 182 385 198 914 226 804

Annex A: External Policy - CFP Impact Analysis
CFP Impact Assessment Phase II External Governance 138
FPA EEZ catches 77 351 72 716 57 914 69 327 % Total EU catches 26% 40% 29% 31% % Spain 17% 31% 19% 21% % France 43% 55% 45% 48% Under the assumption that a fee equivalent to € 35 / tonne is levied on catches made outside EEZs of coastal States with whom the EU has a bilateral access agreement (FPA EEZ), the additional payments across all EU fleet would be equivalent to € 5.5 million per year on average between 2006 and 2008, varying between € 3.8 million in 2007 and € 7.7 million in 2006. Most of these additional payments will be borne by the purse seine fleet which is at the origin of most catches, and by the Spanish fleets which show the highest proportion of catches outside FPA EEZ (69% compared to 52% for France). At Indian Ocean level, a fair solution would be to have all other Flag States applying an identical high-sea fee to their fleets. If this fee was to be applied only to fleets of developed countries (high income according to the World Bank: EU Member States, French OCTs, Taiwan, Japan, Korea and Australia), the total amount levied by year would be € 14.2 million per year on average between 2006 and 2008, varying between € 17.1 million in 2006, € 13 million in 2007 and € 12.4 million in 200851. If in addition to high income countries, middle income countries52 were to apply this access fee, the total fees collected would amount to € 39 million per year (€ 14.2 million from high income countries plus € 24.8 million from middle income countries). For comparison purpose, the budgets recently made available by the EU and other donors for strengthening governance in the Indian Ocean were as follows:
• EU support to MCS for IOC Member States: €M 7 over 2007-2010
• EDF SCS Project for IOC Member States: €M 3.5 over 2005-2008
• EDF tuna tagging programme for IOTC: €M 14 over 2005-2009
• World Bank + other donors SWIOFP: USDM 22.6
• One observer day ≈ € 200
A question is would the EU purse seine fleet able to support this increase in operating costs. On average and given the number of active purse seiners active each year (40 in 2006, 41 in 2007 and 35 in 2008), the additional payments per purse seiners would vary between € 194,000 (2006), € 94,000 (2007) and € 141,000 (2008). These would add to the € 73,500 currently paid to access the EEZ of coastal States under bilateral agreement with the EU (see Table 8). The impact of this additional payment on the purse seine fleet is not neutral. It will impact negatively the profitability of the vessels (see below the example of the French purse seine fleet for 2006 and 2007) with a loss of 3 points in the profit to turnover ratio. FRA PTS40xx Base line 2006 2007 VALUE ADDED (EUR) 2 462 895 1 844 167 CASHFLOW (EUR) 762 895 311 944 PROFIT (EUR) 87 895 -462 222 Revenue to B-E 116% 107%
51 Total catches of high income countries in the Indian Ocean are 405,000 tonnes (average 2006-2008),
dominated by EU (60%), Taiwan (21%) and Japan (13%)
52 Indonesia, China, Iran, Sri Lanka, Belize, Mauritius, Malaysia, Thailand, Oman, Philippines, Seychelles. Tuna catches of this economic grouping are +/- 710,000 tonnes per year on average.

Annex A: External Policy - CFP Impact Analysis
CFP Impact Assessment Phase II External Governance 139
Net Profit Margin 2% -9% ROI 9% 3% VA / FTE (EUR) 94 867 70 496 Increase VARCOST by € 194,000 in 2006 and € 94,000 in 2007 2006 2007 VALUE ADDED (EUR) 2 268 895 1 750 167 CASHFLOW (EUR) 568 895 218 222 PROFIT (EUR) -106 105 -555 944 Revenue to B-E 111% 104% Net Profit Margin -2% -11% ROI 7% 2% VA/FTE (EUR) 87 394 66 902
Another impact is that applying a high sea access fee at a level that would impact vessels economics (unlike the registration payment considered under option 1 that has no impact on vessels economics) will undermine the competitiveness of the tuna fleets. Ex-vessel prices of tuna are globalised. It will not be possible for the fleets operating in the Indian Ocean to recuperate at least part of this increase on prices, unless an identical fee structure is applied to international tuna fleets operating in the Western Central and Eastern Pacific Ocean and in the Atlantic Ocean. In addition to the EU, a total of 50 parties (contracting or cooperating) reported catches in the ICCAT regulatory area. Tuna fisheries in the Atlantic Ocean According to ICCAT catch records, total tuna catches (all species included: tropical tunas, temperate tuna incl. albacore and bluefin, associated species) were close to 520,000 tonnes per year on average between 2006 and 2008. Average EU catches represent an average of 163,000 tonnes per year equivalent to 31% of total tuna catches, with Spain (55% of EU total), France (21%) and Portugal (11%) as leading Member States. Eight other Member States report tuna catches in the ICCAT regulatory area (Atlantic and Mediterranean). After the EU, the main catching nations are Ghana (12% of total catches), Brazil (7%) Japan (6%), Panama (5%) and Taiwan (5%). The following table shows catches reported by entities. The grouped 35 other countries report catches between a few tonnes and 7,000 tonnes maximum.
Table 24: Total tuna catches (tonnes) by reporting entity in the ICCAT regulatory area. Source: ICCAT
Country 2006 2007 2008 Average % Average EU 174 292 155 484 158 951 162 909 31% Ghana 52 395 68 919 64 808 62 041 12% Brazil 36 722 38 357 31 463 35 514 7% Japan 27 509 33 704 33 472 31 562 6% Panama 28 402 33 308 17 494 26 401 5% Taiwan 19 719 29 767 23 784 24 423 5% U.S.A. 18 858 28 934 13 637 20 476 4% Turkey 33 240 9 936 9 831 17 669 3% Cape Verde 18 580 12 229 15 795 15 535 3% Senegal 11 365 14 036 10 661 12 021 2% Guatemala 12 709 9 843 11 127 11 226 2% Maroc 11 640 9 995 9 417 10 351 2%

Annex A: External Policy - CFP Impact Analysis
CFP Impact Assessment Phase II External Governance 140
Country 2006 2007 2008 Average % Average Mexico 10 495 9 781 9 538 9 938 2% China P.R. 9 907 9 736 7 126 8 923 2% Netherlands Antilles 5 547 3 313 15 993 8 284 2% Other (35 parties) 69 651 54 922 60 245 61 606 12% TOTAL 541 031 522 264 493 342 518 879 If all parties were to pay a fixed fee of € 35 / tonne caught, the total income would be around € 18 million per year, with contribution of the EU equivalent to € 5.7 million per year. Unlike the Indian Ocean, EU vessels involved include large scale industrial vessels (purse seiners and longliners greater than 40 m), but also a wide array of artisanal fleet segments targeting tuna and associated species on a permanent or seasonal basis. The rules adopted by ICCAT to establish the level of compulsory contribution to ICCAT core budget are based on the economic status of the countries and the level of catches in the ICCAT regulatory area. There are four groups of countries (A, B, C & D), A including the developed economies, D including poorer economies with low catch history in the ICCAT regulatory area53. The next table shows the historical catch records for each group and the level of an additional contribution to ICCAT that would be based on a fee of € 35 per tonne. If only Group A entities were to provide this additional funding, the annual income would vary between € 7 and 8 million and would be supplied up to 70% by the EU (by contrast, Japan contribution would be slightly in excess of € 1 million per year).
53 Group A: Members with developed market economy, as defined by the United Nations Conference on Trade
and Development (UNCTAD) / Group B: Members whose GNP per capita exceeds US$ 2,000 and whose combined catches and canning of tuna exceeds 5,000 t / Group C: Members whose GNP per capita exceeds US$ 2,000 or whose combined catches and canning of tuna exceeds 5,000 t / Group D: Members whose GNP per capita does not exceed US$ 2,000, and whose combined catches and canning of tuna does not exceed 5,000 t.

Annex A: External Policy - CFP Impact Analysis
CFP Impact Assessment Phase II External Governance 141
Table 25: Catches reported to ICCAT according to the contribution group and corresponding possible additional contribution if a fee of € 35 per tonne was levied on catches
Main countries in the Groups 2006 2007 2008 Average Catches (tonnes) Group A (EU, Japan, USA, Canada) 233 721 227 076 213 866 224 888 Group B (Brazil, Panama, Turkey, Mexico) 127 614 107 270 80 260 105 048
Group C (Ghana, Senegal, China, Guatemala, Morocco) 120 106 131 048 119 557 123 570
Group D (Cape Verde, Côte d'Ivoire, Vanuatu) 27 654 20 926 36 902 28 494
Unidentified group 31 936 35 944 42 757 36 879
TOTAL 541 031 522 264 493 342 518 879 Additional contribution (based on €35/tonne) 2006 2007 2008 Average Group A 8 180 235 7 947 660 7 485 310 7 871 068 Group B 4 466 490 3 754 450 2 809 100 3 676 680 Group C 4 203 710 4 586 680 4 184 495 4 324 962 Group D 967 890 732 410 1 291 570 997 290 Unidentified group 1 117 760 1 258 040 1 496 495 1 290 765
TOTAL (€) 18 936 085 18 279 240
17 266 970 18 160 765
Other Tuna RFMOs In the WCPCF, total average catches over the last three years amounted to 2,400,000 tonnes approximately. A substantial, but yet unknown, part of this catch is taken from the areas under jurisdiction of coastal States. The catches of countries classified as advanced economies as per IMF criteria (EU, Japan, Korea, Taiwan, USA, French OCTs, New Zealand, Australia) represented an average of 1,200,000 tonnes per year, mainly from Japan (1/3), Korea, Taiwan and USA (20% each)54. In case a € 35 tonne fee is applied to all catches, the income generated would be very substantial at € 84 million per year. If only developed economies provide this additional income, the amount will be also important at € 42 million per year. With its current relatively low catch levels (≈ 40,000 tonnes), the EU would be a relatively minor contributor (€ 1.4 million) to this additional extra-budgetary income. Catches of tuna and related species in the IATTC regulatory area (Eastern Pacific) amounted to 560,000 tonnes on average over the 2006-2008 period with Ecuador, Mexico, Panama and Venezuela as major fishing countries with catches of developed countries being comparatively low (the highest catches from developed counties are from Japan, approximately 12,000 tonnes in 2008) . The EU catches in the IATTC regulatory area are not in the public domain (statistical confidentiality rules) but are likely to be low (below 10,000 tonnes). Small pelagic fisheries in the South East Pacific A fisheries for small pelagic is developing in the South East Pacific. A dedicated RFMO (currently known as the South Pacific Regional Fishery Management Organisation - SPRFMO) is being installed to with mandate to manage the fishery in the International waters off Chile and Peru. According to
54 There are no country groupings at WCPFC. Obligatory contributions reflect a balance of National wealth plus
catch levels

Annex A: External Policy - CFP Impact Analysis
CFP Impact Assessment Phase II External Governance 142
statistics published by the SPRFMO, total small pelagic catches in the South East Pacific represent ≈ 2.1 million tonne per year. Chile is the major catching nation (81%) of catches, ahead of China (7%), Vanuatu (6%) and the EU (5% with ≈ 100,000 tonnes per year on average).
Table 26: Catches of small pelagics in the international waters of the South East Pacific. Source: SPRFMO
(tonnes) 2006 2007 2008 Average % Average Belize 0 13 551 0 4 517 0% Chile 1 712 443 1 926 532 1 594 566 1 744 514 81% China 160 000 140 582 143 182 147 921 7% EU 68 126 132 578 112 544 104 416 5% Feroe 0 38 700 0 12 900 1% Korea 11 934 12 180 13 568 12 561 1% Ukraine 0 22 067 0 7 356 0% Vanuatu 132 887 120 206 109 011 120 701 6% TOTAL 2 085 390 2 406 396 1 972 871 2 154 886 100% Applying a fee of € 20 per tonne55 to all catches in the international waters would generate an income of € 43 million per year on average. This would be mostly borne by Chile. The contribution of the EU fleet would be approximately worth € 2 million per year. Assuming 6 EU trawlers operated in the area over the 2006-2008 period, the addition payment would be equivalent to € 330,000 per vessel and per year. As shown in the following table, this will impact negatively on vessels’ profitability.
55 € 20 per tonne is the basis for payment of small pelagic catches of EU pelagic trawlers under the bilateral
agreement with Morocco.

Annex A: External Policy - CFP Impact Analysis
CFP Impact Assessment Phase II External Governance 143
NLD PTS40xx Base line 2006 2007 VALUE ADDED (EUR) 3 295 294 3 522 667 CASHFLOW (EUR) 1 375 882 1 142 000 PROFIT (EUR) 377 647 439 333 Revenue to B-E 123% 115% Net Profit Margin 5% 5% ROI 26% 10% VA / FTE (EUR) 120 473 104 016 Increase VARCOST by €330,000 2006 2007 VALUE ADDED (EUR) 2 965 294 3 192 667 CASHFLOW (EUR) 1 045 882 812 000 PROFIT (EUR) 47 647 108 667 Revenue to B-E 117% 110% Net Profit Margin 1% 1% ROI 20% 7% VA/FTE (EUR) 108 409 94 272
Table 27: Summary of possible amounts of extra-budgetary support to RFMOs if fishing in the regulatory area is charged
Basic assumption All vessels pay a catch fee of € 35 / t (tuna) or € 20 / t (small pelagics)
Only EU vessels pay a catch fee of € 35 / t (tuna) or € 20 / t (small pelagics)
ICCAT High : € 18 mln Low: € 8 mln
High : € 5.7 mln Low: € 5.7 mln
IOTC High: € 39 mln Low: € 14.2 mln
High : € 5.5 mln Low: € 5.5 mln
WCPFC High: € 84 mln Low: € 42 mln
High: €1.4 mln Low: € 1.4 mln
IATTC High: € 19 mln Low:
High: € 0.5 mln Low:
SPRFMO High € 43 mln High: € 2 mln High and low refer to maximum and minimum contributions generated under different hypothesis. For catch fee, the variation relates to whether only the richest economies pay or not.
2.5. FPA option 3: Cost of access borne by EU shipowners without transitional period. Termination of mixed agreements which would become tuna agreements or eventually pelagic agreements only
The most significant variation under this option is the elimination of mixed agreements. For various reasons, mixed agreements, and in particular the presence of demersal fishing vessels in the EEZ of coastal States, give rise to concerns about the impact on sustainability and on local population. As an option for the reform, the EU may wish to eliminate these agreements. Note in passing that this is an option that the EU has adopted over a recent past with the agreement with Angola stopped, the agreements with Ivory Coast, Mozambique and Gabon last renegotiated from mixed agreements into tuna agreements.

Annex A: External Policy - CFP Impact Analysis
CFP Impact Assessment Phase II External Governance 144
Under this option, the EU would however continue sectoral support for the implementation of the national fisheries policy up to the needs of the partner countries There are currently 4 mixed agreements, 2 with developing ACP countries (Mauritania, Guinea Bissau), 1 with a middle income country (Morocco) and one with an OCT (Greenland). Only the agreements with Mauritania and Guinea Bissau have a substantial tuna component. The agreement with Morocco includes some minor fishing possibilities for tuna, the Greenland agreement includes no possibilities for tuna, as there is no tuna in these Northern waters. The 4 mixed agreements represent 92% of the budget commitments for bilateral agreements (€ 130 million out of € 141 million). Transformation into tuna agreements If the mixed agreements with Morocco, Mauritania and Guinea Bissau were to be transformed into tuna agreement, the associated financial contribution would be fairly low as the EEZ concerned are secondary fishing zones for the EU tuna fleet. Over the recent years, tuna catches in the EEZ were: Morocco 300 t pole and liners Mauritania 5 000 t purse seiners, pole and liners, longliners Guinea Bissau 4 000 t purse seiners, pole and liners, longliners Greenland 0 t Assuming that the EU shipowners will be in economic capacity to pay the equivalent of € 50 / tonne as access cost, receipts by the above third countries will be: Morocco 15,000 € Mauritania 250,000 € Guinea Bissau 200,000 € Greenland 0 € These are fairly low amounts. If the agreements are negotiated on this basis (no small pelagic and no demersal possibilities), the application of the exclusivity rule will prevent the EU small pelagic fleet or the demersal fleet for negotiating an access in the EEZ of coastal States under tuna agreements with the EU. As far as Greenland and Morocco are concerned, the tuna possibilities are inexistent or very low. It is likely that there will be no EU tuna bilateral agreements concluded with these two partners. Therefore, the EU fleet of small pelagic and demersal vessels will be in a position to negotiate their own arrangements. Concerning Mauritania, a negotiation of a tuna agreement will have negative impacts on the EU fleet of small pelagic trawlers that will be excluded. As permanent reflagging is not a viable solution for this particular fleet, the consequences of not having access to small pelagic stocks in the Mauritania EEZ will be a problem. For the demersal fleet, it will not be possible to have access to the EEZ of Mauritania and Guinea Bissau under the EU flag (assuming there is no agreement with Greenland), with two possible alternatives: reflag or decommission. Transformation of bilateral agreements into tuna and small pelagic agreements If the option is to retain also small pelagic fishing opportunities (relevant only in Mauritania, Morocco and a minor part of the Greenland agreement56), the values of these agreements could be increased (but not for Guinea Bissau). The current fishing possibilities are 60,000 t in Morocco and 250,000 t in Mauritania. Assuming an average price of 500 € / t for small pelagics. Under the assumption that the shipowners would accept to pay 10% of possible turnover as access fees, the receipts of these two countries from the EU fleet would be € 3 million and € 12.5 million respectively. Under the Greenland agreement, the current quota obtained is 55,000 t of capelin (the only pelagic species, but this is a fairly low priced species (reference price of € 100 per tonne). Although the use of the fishing possibilities on capelin under the Greenland agreement have always been problematic, and assuming the EU shipowner would accept to pay 15% of the value, Greenland could receive € 0.8 million as access fees.
56 The only pelagic species under the Greenland agreement is Capelin. It represents a minor part of the
agreement value-wise and the fishing possibilities obtained are transferred entirely to Iceland in exchange for redfish fishing possibilities. Until now, Greenland has been unable to provide the capelin fishing possibilities and is indebted to the EU in this respect.

Annex A: External Policy - CFP Impact Analysis
CFP Impact Assessment Phase II External Governance 145
Under this configuration of eliminating demersal fishing possibilities, but maintaining pelagic possibilities, receipts by third countries from the EU fleet could be in the region of : Morocco 15,000 € (tuna) + € 3.0 million (small pel.) ≈ € 3.0 million Mauritania 250,000 € (tuna) + € 12.5 million (small pel.) ≈ € 12.8 million Guinea Bissau 200,000 € (tuna) + € 0 (small pel.) = 200,000 € Greenland 0 € (tuna) + € 0.8 million (small pel.) = € 0.8 million If the agreements are negotiated on this basis (no demersal possibilities), the application of the exclusivity rule will have impact on the EU fleet.(especially the shrimp vessels) to conclude private agreements in the productive EEZ of Mauritania and Guinea Bissau, which was the likely alternative in case of no agreements. This fleet will have to reflag or withdraw using the EFF possibilities. The tables on the following pages indicate the likely receipts of third countries under the two suboptions, one being the elimination of all non-tuna fishing possibilities (e.g. pelagic and demersal) and the other being the elimination of demersal fishing possibilities only (e.g. tuna and small pelagic fishing possibilities are maintained).

Annex A: External Policy - CFP Impact Analysis
CFP Impact Assessment Phase II External Governance 146
Table 28 : Summary of estimates of transfers to third countries under option 3a (tuna only fishing possibilities). All data in € million.
Likely payments Basis for estimates Currrent EU contribution of which sector support
Perceived needs for sector support
CPV 0.2 Current EU catches of 3,000 t paid 50 €/t 0.4 0.3 1.0 CIV 0.2 Current EU catches of 3,500 t paid 50 €/t 0.6 0.6 1.4 GAB 0.4 Current EU catches of 8,000 t paid 50 €/t 0.9 0.5 2.4 STP 0.2 Current EU catches of 3,500 t paid 50 €/t 0.7 0.3 0.5 COM 0.3 Alignment with cost of private licences (see main text) 0.4 0.2 0.9 MAD 0.7 Alignment with cost of private licences (see main text) 1.2 1.0 11.1 MOZ 0.3 Alignment with cost of private licences (see main text) 0.9 0.9 5.6 SYC 2.1 Alignment with cost of private licences (see main text) 5.3 3.0 6.0 KIR 0.4 Current EU catches of 8,000 t paid 50 €/ 0.5 0.1 1.9 FSM 0.1 No catches so far, assumption is current cost of licences
(precautionary licence) 0.6 0.2 0.8
SLB 0.1 Fairly low catches so far, assumption is current cost of licences (precautionary licence)
0.4 0.2 2.1
GUB 0.2 Current EU catches of 4,000 t paid 50 €/t 7.5 3.0 1.5 GRN 0.0 No agreement negotiated 15.8 3.3 14.7 MRT 0.3 Current EU catches of 5,000 t paid 50 €/t 70.0 20.0 10.4 MAR 0.0 No agreement negotiated (current EU catches of 300 t) 36.1 13.5 43.6 5.4 141.2 47.0 103.9

Annex A: External Policy - CFP Impact Analysis
CFP Impact Assessment Phase II External Governance 147
Table 29 : Summary of estimates of transfers to third countries under option 3a (tuna and small pelagic fishing possibilities). All data in € million
Likely payments Basis for estimates Currrent EU contribution of which sector support
Perceived needs
CPV 0.2 Current EU catches of 3,000 t paid 50 €/t 0.4 0.3 1.0 CIV 0.2 Current EU catches of 3,500 t paid 50 €/t 0.6 0.6 1.4 GAB 0.4 Current EU catches of 8,000 t paid 50 €/t 0.9 0.5 2.4 STP 0.2 Current EU catches of 3,500 t paid 50 €/t 0.7 0.3 0.5 COM 0.3 Alignment with cost of private licences (see main text) 0.4 0.2 0.9 MAD 0.7 Alignment with cost of private licences (see main text) 1.2 1.0 11.1 MOZ 0.3 Alignment with cost of private licences (see main text) 0.9 0.9 5.6 SYC 2.1 Alignment with cost of private licences (see main text) 5.3 3.0 6.0 KIR 0.4 Current EU catches of 8,000 t paid 50 €/ 0.5 0.1 1.9 FSM 0.1 No catches so far, assumption is current cost of licences
(precautionary licence) 0.6 0.2 0.8
SLB 0.1 Fairly low catches so far, assumption is current cost of licences (precautionary licence)
0.4 0.2 2.1
GUB 0.2 Only tuna possibilities as per previous suboption 7.5 3.0 1.5 GRN 0.8 Capelin fishing possibilities only paid 15% of their values 15.8 3.3 14.7 MRT 12.8 Tuna as per previous suboption plus 250,000 t small pelagic paid
10% of their value 70.0 20.0 10.4
MAR 3.0 Tuna as per previous suboption plus 60,000 t small pelagic paid 10% of their value
36.1 13.5 43.6
21.7 141.2 47.0 103.9

Annex A: External Policy - CFP Impact Analysis
CFP Impact Assessment Phase II External Governance 148
The following tables forecast the impacts of the two suboptions on third countries receipts. It is assumed that under option 3a (only tuna agreements), no agreements will be concluded with Greenland and Morocco. There will be no transitional period: new agreements as per option 3a or 3b will enter into force as and when current agreements expire, with third countries regular budget resources obtained from EU shipowners for fishing rights, and EU support under the agreement dedicated exclusively to sectoral support. Under option 3a, the budget needs of DG MARE will be ≈ € 46 million in the long term, consisting in sectoral support to third countries under agreements (i.e. without Morocco and Greenland). Under option 3b, budget requirements will be ≈ 104 million, corresponding to the estimated needs of third countries under agreements. In both cases, the reformed regime will fully applied as from 2016 when all ongoing bilateral agreements are expired. While most third countries will sustain the impacts of this option, the 4 countries the most reliant on revenues from fishing agreements will experience adverse impacts on macro-economic stability (Mauritania, Guinea Bissau, Greenland and Seychelles).
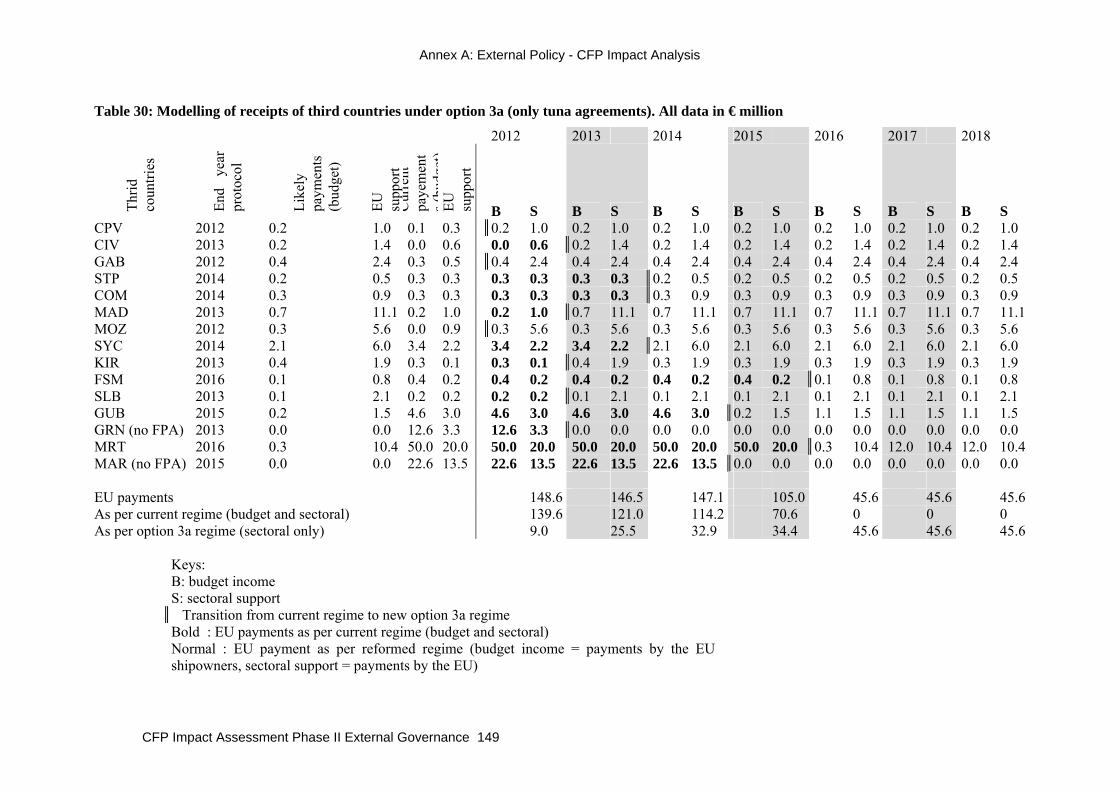
Annex A: External Policy - CFP Impact Analysis
CFP Impact Assessment Phase II External Governance 149
Table 30: Modelling of receipts of third countries under option 3a (only tuna agreements). All data in € million
2012 2013 2014 2015 2016 2017 2018 Th
rid
coun
tries
End
year
pr
otoc
ol
Like
ly
paym
ents
(b
udge
t)
EU
supp
ort
Cur
rent
pa
yem
ent
s(bu
dget
)EU
su
ppor
t
B S B S B S B S B S B S B S CPV 2012 0.2 1.0 0.1 0.3 0.2 1.0 0.2 1.0 0.2 1.0 0.2 1.0 0.2 1.0 0.2 1.0 0.2 1.0 CIV 2013 0.2 1.4 0.0 0.6 0.0 0.6 0.2 1.4 0.2 1.4 0.2 1.4 0.2 1.4 0.2 1.4 0.2 1.4 GAB 2012 0.4 2.4 0.3 0.5 0.4 2.4 0.4 2.4 0.4 2.4 0.4 2.4 0.4 2.4 0.4 2.4 0.4 2.4 STP 2014 0.2 0.5 0.3 0.3 0.3 0.3 0.3 0.3 0.2 0.5 0.2 0.5 0.2 0.5 0.2 0.5 0.2 0.5 COM 2014 0.3 0.9 0.3 0.3 0.3 0.3 0.3 0.3 0.3 0.9 0.3 0.9 0.3 0.9 0.3 0.9 0.3 0.9 MAD 2013 0.7 11.1 0.2 1.0 0.2 1.0 0.7 11.1 0.7 11.1 0.7 11.1 0.7 11.1 0.7 11.1 0.7 11.1 MOZ 2012 0.3 5.6 0.0 0.9 0.3 5.6 0.3 5.6 0.3 5.6 0.3 5.6 0.3 5.6 0.3 5.6 0.3 5.6 SYC 2014 2.1 6.0 3.4 2.2 3.4 2.2 3.4 2.2 2.1 6.0 2.1 6.0 2.1 6.0 2.1 6.0 2.1 6.0 KIR 2013 0.4 1.9 0.3 0.1 0.3 0.1 0.4 1.9 0.3 1.9 0.3 1.9 0.3 1.9 0.3 1.9 0.3 1.9 FSM 2016 0.1 0.8 0.4 0.2 0.4 0.2 0.4 0.2 0.4 0.2 0.4 0.2 0.1 0.8 0.1 0.8 0.1 0.8 SLB 2013 0.1 2.1 0.2 0.2 0.2 0.2 0.1 2.1 0.1 2.1 0.1 2.1 0.1 2.1 0.1 2.1 0.1 2.1 GUB 2015 0.2 1.5 4.6 3.0 4.6 3.0 4.6 3.0 4.6 3.0 0.2 1.5 1.1 1.5 1.1 1.5 1.1 1.5 GRN (no FPA) 2013 0.0 0.0 12.6 3.3 12.6 3.3 0.0 0.0 0.0 0.0 0.0 0.0 0.0 0.0 0.0 0.0 0.0 0.0 MRT 2016 0.3 10.4 50.0 20.0 50.0 20.0 50.0 20.0 50.0 20.0 50.0 20.0 0.3 10.4 12.0 10.4 12.0 10.4 MAR (no FPA) 2015 0.0 0.0 22.6 13.5 22.6 13.5 22.6 13.5 22.6 13.5 0.0 0.0 0.0 0.0 0.0 0.0 0.0 0.0 EU payments 148.6 146.5 147.1 105.0 45.6 45.6 45.6 As per current regime (budget and sectoral) 139.6 121.0 114.2 70.6 0 0 0 As per option 3a regime (sectoral only) 9.0 25.5 32.9 34.4 45.6 45.6 45.6 Keys: B: budget income S: sectoral support Transition from current regime to new option 3a regime Bold : EU payments as per current regime (budget and sectoral)
Normal : EU payment as per reformed regime (budget income = payments by the EU shipowners, sectoral support = payments by the EU)

Annex A: External Policy - CFP Impact Analysis
CFP Impact Assessment Phase II External Governance 150
Table 31: Modelling of receipts of third countries under option 3b (only tuna and small-pelagic agreements). All data in € million
2012 2013 2014 2015 2016 2017 2018 Th
rid
coun
tries
End
year
pr
otoc
ol
Like
ly
paym
ents
(b
udge
t)
EU
supp
ort
Cur
rent
pa
yem
ent
s(bu
dget
)EU
su
ppor
t
B S B S B S B S B S B S B S CPV 2012 0.2 1.0 0.1 0.3 0.2 1.0 0.2 1.0 0.2 1.0 0.2 1.0 0.2 1.0 0.2 1.0 0.2 1.0 CIV 2013 0.2 1.4 0.0 0.6 0.0 0.6 0.2 1.4 0.2 1.4 0.2 1.4 0.2 1.4 0.2 1.4 0.2 1.4 GAB 2012 0.4 2.4 0.3 0.5 0.4 2.4 0.4 2.4 0.4 2.4 0.4 2.4 0.4 2.4 0.4 2.4 0.4 2.4 STP 2014 0.2 0.5 0.3 0.3 0.3 0.3 0.3 0.3 0.2 0.5 0.2 0.5 0.2 0.5 0.2 0.5 0.2 0.5 COM 2014 0.3 0.9 0.3 0.3 0.3 0.3 0.3 0.3 0.3 0.9 0.3 0.9 0.3 0.9 0.3 0.9 0.3 0.9 MAD 2013 0.7 11.1 0.2 1.0 0.2 1.0 0.7 11.1 0.7 11.1 0.7 11.1 0.7 11.1 0.7 11.1 0.7 11.1 MOZ 2012 0.3 5.6 0.0 0.9 0.3 5.6 0.3 5.6 0.3 5.6 0.3 5.6 0.3 5.6 0.3 5.6 0.3 5.6 SYC 2014 2.1 6.0 3.4 2.2 3.4 2.2 3.4 2.2 2.1 6.0 2.1 6.0 2.1 6.0 2.1 6.0 2.1 6.0 KIR 2013 0.4 1.9 0.3 0.1 0.3 0.1 0.4 1.9 0.3 1.9 0.3 1.9 0.3 1.9 0.3 1.9 0.3 1.9 FSM 2016 0.1 0.8 0.4 0.2 0.4 0.2 0.4 0.2 0.4 0.2 0.4 0.2 0.1 0.8 0.1 0.8 0.1 0.8 SLB 2013 0.1 2.1 0.2 0.2 0.2 0.2 0.1 2.1 0.1 2.1 0.1 2.1 0.1 2.1 0.1 2.1 0.1 2.1 GUB 2015 0.2 1.5 4.6 3.0 4.6 3.0 4.6 3.0 4.6 3.0 0.2 1.5 1.1 1.5 1.1 1.5 1.1 1.5 GRN 2013 0.8 14.7 12.6 3.3 12.6 3.3 0.8 14.7 0.8 14.7 0.8 14.7 0.8 14.7 0.8 14.7 0.8 14.7 MRT 2016 12.8 10.4 50.0 20.0 50.0 20.0 50.0 20.0 50.0 20.0 50.0 20.0 12.8 10.4 12.8 10.4 12.8 10.4 MAR 2015 3.0 43.6 22.6 13.5 22.6 13.5 22.6 13.5 22.6 13.5 3.0 43.6 3.0 43.6 3.0 43.6 3.0 43.6 EU payments 148.6 161.2 161.8 163.3 103.9 103.9 103.9 As per current regime (budget and sectoral) 139.6 121.0 114.2 70.6 0.0 0.0 0.0 As per option 3b regime (sectoral only) 9.0 40.2 47.6 92.7 103.9 103.9 103.9 Keys: B: budget income S: sectoral support Transition from current regime to new option 3b regime Bold : EU payments as per current regime (budget and sectoral)
Normal : EU payment as per reformed regime (budget income = payments by the EU shipowners, sectoral support = payments by the EU)

Annex A: External Policy - CFP Impact Analysis
CFP Impact Assessment Phase II External Governance 151
Status quo, but with fewer numbers of EU vessels concerned by fishing possibilities and/or elimination of mixed agreements Under the status quo, it is understood that the current EU policy will continue as current, i.e. payments to coastal States shared between the EU and the shipowners and provisions for additional funding to support the development of a responsible fishery policy in the waters of the EEZ. The main variation is that EU negotiated fishing possibility would concern less EU fishing vessels than currently. The reasons for the decrease of the fleet are linked to suppression of demersal fishing possibilities under certain agreements for which there are no sufficient scientific evidences of a surplus (e.g. Guinea Bissau) and to a natural decrease of the external EU fleet as it can be projected from the Member States Operational Plans for decommissioning and economic situation of some external fleet segments. The following table shows the fleet projections made by DG MARE on the basis of the findings of a recent study and other more recent elements.
Table 32: Projections of the number of EU fishing vessels concerned by EU bilateral fishing agreements
Fishing category Capacity Average 2004-2008
2008 Situation 2010 Situation 2015
Projection 2020 Projection
Number 59 57 57 53 50 Tuna purse seiners Capacity (GT) 117 322 120 072 Number 107 123 91** 71 55 Longliners /
pole and liners Capacity (GT) 27 788 29 020 Number 135 154 145*** 105 72 Demersal trawlers Capacity (GT) 35 947 31 753 Number 10 12 12 12 12 Small pelagic trawlers* Capacity (GT) 41 600 44 282 Number 312 346 305 241 189 Total Capacity (GT) 222 656 225 127
* The fishing capacity retained for this fishing category is based on the number of vessels having used the fishing possibilities at least 6 month in a year ** Including 15 ES pole & liners and 27 La Réunion longliners *** including 50 artisanal vessels operating under the agreement with Morocco The following assumptions can be made: Tuna vessels: Over the last few years, the EU tuna sector and the purse seine fleet segment showed a dynamic investment policy with new boats built replacing older smaller boats. The activities of the EU fleet in the different oceans created historical rights that have been translated into the international legal framework through RFMOs. The tuna fleet has therefore an interest to continue to fly an EU flag. The tuna resource is present in the high seas and in the waters under coastal States jurisdiction. The EU tuna fleet needs to have access to these waters, supported as an as large as possible network of fishing agreements, public or private. Over the past few years, catch declarations show that approximately 100,000 t out of 400,000 t annual catches are caught in waters under jurisdiction of coastal States across the three oceans. Assuming this will be the catch level in the forthcoming years, the EU will have to pay these 100,000 t at € 65 per tonne, i.e. € 6.5 million per year. If the level of catches follow the predictions made for the purse seine fleet (-15% in 2020), the catches in coastal States jurisdictions may decrease to 85,000 t, with an associated EU payment of € 5.5 million. Demersal vessels: Most demersal resources in the EEZ of West African coastal States are depleted. Over the 2004-2008 period, the shrimp trawlers segments remained at fairly constant level (40) before decreasing to 30 approximately due to the increased competition of aquaculture products compounded by impacts of the economic downturn of EU consumer purchasing power. The cephalopod trawler segment decreased markedly during the 2004-2008 period in relation with the poor condition of the

Annex A: External Policy - CFP Impact Analysis
CFP Impact Assessment Phase II External Governance 152
resource in Mauritania and drop in prices. About 25% of the vessels of this fleet are older than 25 years old, and should not be replaced. About 20 such vessels may remain active in 2020. The prospects for the artisanal Spanish fleet operating in Morocco are unclear. Utilisation of fishing possibilities under the Morocco agreements is decreasing, suggesting that the artisanal fleet concerned decreases also (or is not dependant on an access to Morocco waters). In any case, the economic weight of these artisanal vessels is much lower than the economic weight of demersal shrimp and cephalopod trawlers. The best estimate is that about 50 industrial demersal trawlers may remain active in 2020, with a fleet of 20 - 30 artisanal vessels under the Morocco agreement. Assuming the turnover of one industrial vessel in € 1.2 million per year, and that the EU pays to the partner country the equivalent of 20% of turnover as contribution to the fishing rights, the budget required may be in the region of 50 x 1.2 x 20% = € 12 million per year, rounded up to € 15 million to include fishing rights of the artisanal fleet. For the Greenland agreement, the perspectives for the EU fleet concerned are difficult to forecast as the evolution of this fleet is also clearly linked to the situation of the stocks in the EU waters. Assuming the reformed CFP will have an objective to reach the MSY level and considering that the fleet concerned will loose fishing possibilities, the assumption of a 50% decrease is also retained as for the demersal fleet operating off Africa. The value of the Greenland agreement may therefore be divided by two, from € 15.8 million to € 7.9 million. Small pelagics: the future needs of the EU small pelagic fleet will depend to a large extent on the status of the EU small pelagic stocks (blue whiting, mackerel, herring, horse mackerel). At the moment, the productivity of these stocks is low, and management plans have been adopted for most of these species. With the reform and the ambition to bring stocks at MSY level, the condition of these stocks may improve. This will decrease the interests for small pelagic resources present in external waters (West Africa, South East Pacific). However, I may take some time before EU stocks are at MSY level. In the meantime, the small pelagic fleet will need alternative fishing possibilities under fishing agreements with Morocco and Mauritania. Over the last few years, EU catches in the Eastern Central Pacific have varied between 150,000 and 250,000 t per year. The working assumption could be that the EU bilateral agreements make a provision for this highest level of 3,000 t per year in Mauritania and 60,000 t per year in Morocco (310,000 t in total). Assuming an average value of € 500 per tonne, this would generate a potential turnover of € 155 million, with a corresponding EU payment (17.5% of catch value) of € 27 million.

Annex A: External Policy - CFP Impact Analysis
CFP Impact Assessment Phase II External Governance 153
In conclusion, the value of annual fishing rights to be borne by the EU under option 3 could be as follows: Tuna fleet € 5.5 million Demersal fleet Africa € 15 million Small pelagic fleet € 27 million TOTAL € 47.5 million To these payments for fishing rights, an additional sectoral envelope will be added to form the single financial contribution. Assuming, it is equivalent to 20% of fishing rights, the total EU budget for bilateral agreements with Southern countries should be in the region of € 57 million per year. With the Greenland agreement (forecast € 7.9 million), the total budget for bilateral fishing agreement will be close to € 65 million at the 2022 horizon. The table in the following page figure out how the various agreements may be impacted
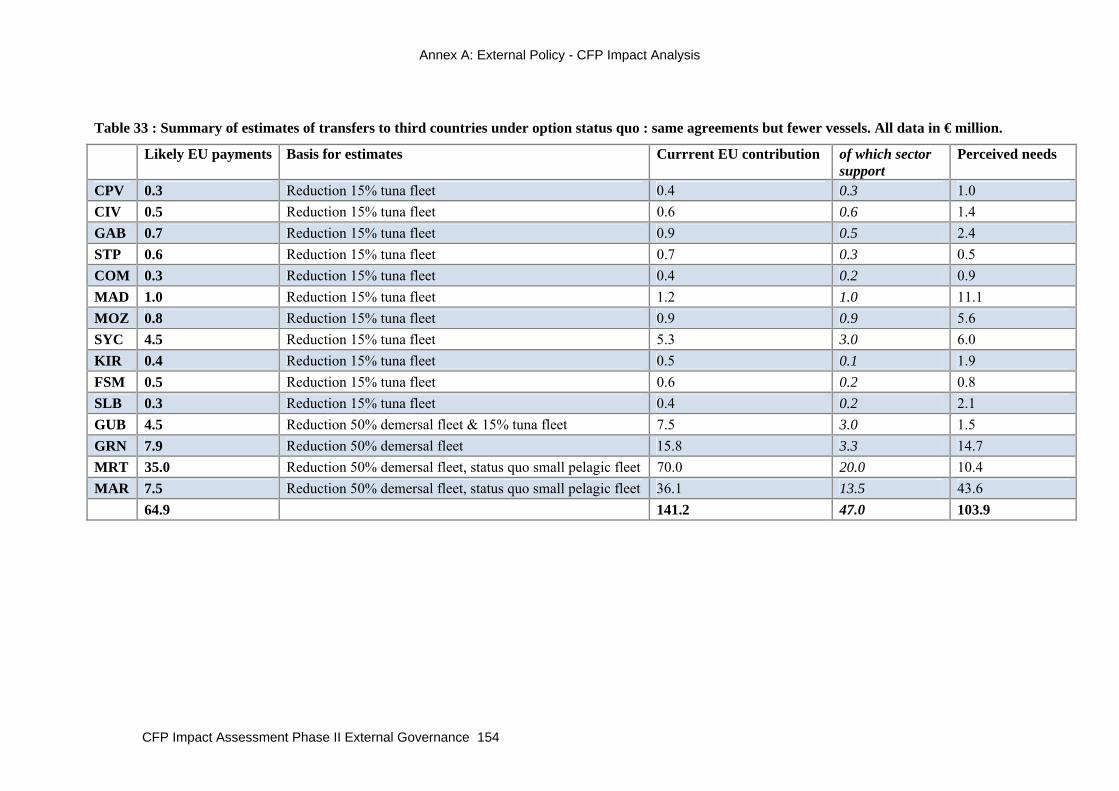
Annex A: External Policy - CFP Impact Analysis
CFP Impact Assessment Phase II External Governance 154
Table 33 : Summary of estimates of transfers to third countries under option status quo : same agreements but fewer vessels. All data in € million.
Likely EU payments Basis for estimates Currrent EU contribution of which sector support
Perceived needs
CPV 0.3 Reduction 15% tuna fleet 0.4 0.3 1.0 CIV 0.5 Reduction 15% tuna fleet 0.6 0.6 1.4 GAB 0.7 Reduction 15% tuna fleet 0.9 0.5 2.4 STP 0.6 Reduction 15% tuna fleet 0.7 0.3 0.5 COM 0.3 Reduction 15% tuna fleet 0.4 0.2 0.9 MAD 1.0 Reduction 15% tuna fleet 1.2 1.0 11.1 MOZ 0.8 Reduction 15% tuna fleet 0.9 0.9 5.6 SYC 4.5 Reduction 15% tuna fleet 5.3 3.0 6.0 KIR 0.4 Reduction 15% tuna fleet 0.5 0.1 1.9 FSM 0.5 Reduction 15% tuna fleet 0.6 0.2 0.8 SLB 0.3 Reduction 15% tuna fleet 0.4 0.2 2.1 GUB 4.5 Reduction 50% demersal fleet & 15% tuna fleet 7.5 3.0 1.5 GRN 7.9 Reduction 50% demersal fleet 15.8 3.3 14.7 MRT 35.0 Reduction 50% demersal fleet, status quo small pelagic fleet 70.0 20.0 10.4 MAR 7.5 Reduction 50% demersal fleet, status quo small pelagic fleet 36.1 13.5 43.6 64.9 141.2 47.0 103.9
Annex A: External Policy - CFP Impact Analysis
CFP Impact Assessment Phase II External Governance 155
CONCLUSIONS AND POSSIBLE WAYS FORWARD Option 1 - Revised bilateral EU agreement policy / RFMO strenthening The analysis shows that the EU shipowners can bear the entire cost of access to the EEZ of coastal States under certain modalities. For the largest fishing agreements financially speaking (e.g. Seychelles, Madagascar, Mauritania, Morocco), the EU shipowners will not be in an economic capacity to pay the equivalent of the current licence fees plus the share of EU contribution based on the value of fishing rights. It is likely, and even certain, that the final cost of access will be a compromise between current EU payments and costs of private licences charged by National Authorities to foreign or locally-based operators. In relation to licence payment, it is recommended to abandon the current system based on catches declared in the EEZ and introduce a generalised lumpsum system independent from catches like it is already the case under the Seychelles tuna agreement and for most fishing categories other than tuna under West African fishing agreement. The experience from the past shows that whilst proportional payments confer a certain competitive advantage to the EU fleets in case of low catches compared to other distant water fleets, this system is source of conflicts with the coastal States about the veracity of catch declarations, and an incentive to under/mis reporting with collateral impacts on the quality of data used for stock assessment purpose. Under this option, the role of the EU will be to negotiate the conditions of access with the coastal States (inter alia duration of the agreement, maximum allowable fishing capacities, applicable specific technical measures, various shipowners obligations, including payments of licence fees). Being responsible for the activities of the fishing vessels flying the flag of a Member State, the EU will also have to ensure that access conditions are complied with, and use regulatory instruments available to enforce them (e.g. Reg 1005/2008 ; Reg 1006/2008 ; Reg 1224/2009). The main consequence of this option is that third countries will receive less financial resources than under the current policy framework, as the expected payments of the EU fleet will be far less than current EU + shipowners payments. In order to maintain a budget dedicated to promotion of responsible fishing practices outside EU waters, the EU will have to find solutions to provide third countries with additional funding, now disconnected from the question of access as recommended by the overall evaluation of fisheries agreements57 recently completed (see footnote n°38 for reference of this study). The role of the EU in this respect will be to define the amounts and modalities of sectoral support granted to the coastal States for support to development and implementation of its fisheries policy, independently from the level of fishing rights negotiated. There should be also an internal debate within the Commission to figure out if DG MARE must remain the main coordinating service for sectoral aid delivery and monitoring, or if DG DEV or the coming European External Action Service may not be best placed instead to undertake this role given its decentralised organisation and possible synergies with the Regional EDF fisheries programmes58. Currently, the intra-institutional situation is that DG MARE has the technical expertise needed to promote sustainable fishing practices in external waters but not enough human resources59, while DG DEV has the human resources but not the technical expertise required. Four third-countries appear to be very reliant on the EU transfers agreed under the bilateral agreements: Mauritania, Guinea Bissau, Greenland and Seychelles. A reformed fisheries agreement 57 The recent experience demonstrates that the proportionality between fishing capacities negotiated and amount
of sectoral support leads to situation under which coastal States may receive more funding that they are able to absorb, or conversely, too few funding compared to their needs.
58 The growing importance of regional integration considered in the revised Cotonou agreement gives new impetus to research of regional approaches for strengthening fisheries management, including research and control.
59 DG MARE is clearly understaffed to properly monitor all the partnership agreements. As an illustration, about 4.2 agents per € 10 million commitment are available for management of external EU aid [source;: Rapport annuel sur les activités relevant des 7ème, 8ème et 9ème FED - 2008/C 286/02]while DG MARE has 1.5 agents per € 10 million commitment for management of sectoral support under FPAs.
Annex A: External Policy - CFP Impact Analysis
CFP Impact Assessment Phase II External Governance 156
policy may have negative impacts on their macro-economic stability as part of the transfer currently agreed under FPA are used as a regular budget income used to balance the budget expenditure toward other national policy, and as an important currency inflow necessary to cover the balance of payments. Should option 1 be retained, solutions will have to be found to minimise the collateral macro-economic impacts of the reform. This is a side comment, but one important aspect to reform also is the amount of Commission’s resources dedicated to properly monitor FPAs and enforcement of other key regulatory requirements such as Reg 1006/2008. Concerning RFMOs, the main issue is to improve their management capacities as their role will remain pivotal to strengthen governance in the high seas. The decision-making process is one of the major weaknesses of RFMOs. The consensus rule is not satisfactory and prevents adoption of strong conservation and management measures when they are needed. Although there is an ongoing internal audit process of RFMOs that can end up on adoption of improved decision-making process, it may take time before suitable solutions are adopted by all parties. Meanwhile, the EU can adopt unilateral measures to combat IUU fishing impacting matters under its competency (access to waters under its jurisdiction, access to its ports, access to its market, regulatory regime on its fleet and its nationals). The recent adoption of Reg 1005/2008 is a strong signal in this respect. The second weakness of RFMOs is the lack of capacities of parties to properly enforce conservation and management measures adopted (provision of data, enforcement of regulations on own vessels, MCS of own EEZ). Assuming such a lack of capacity is related to lack of financial resources, an option could be to provide to RFMOs extra sources of funding that would be utilised to fund and coordinate specific programmes to the benefit of all parties in need of dedicated support. Two options are considered: levying a fee on catches made in the regulatory area (option 2), or levying a fee for registration of the fishing vessels authorised to catch species under management in the regulatory area (option 1). This later option appears ex-ante to be the most suitable as charging fees on catches made will be administratively burdensome and an incentive to under-reporting. Extra-budgetary income generated would increase significantly the funding capacities of most tuna RFMOs. However, should such a measure be discussed, it should ideally apply on all fleets and not only to the EU fleet to preserve its competitiveness, and secondly, it should be generalised across all tuna RFMOs as the tuna industry is global. Under option 1, the registration fee considered (€2,500) will not compromise the EU fleet competitiveness. As a consequence, it can be applied unilaterally at EU level, before being extended to other contracting parties through the multilateral process of RFMOs. Option 2 - No EU bilateral agreement For the EU private sector, the impact of this option on the level of licence fees will be neutral, as the agreed access costs are likely to be a compromise as per option 1. However, the EU fleet will loose the legal security offered by an international binding instrument. According to EU shipowners, a stable and protective legal framework is of paramount importance for their deployment strategies under the flag of a Member State. Even if there are no fishing agreements, the EU tuna and small pelagic fleets will continue to operate under a flag of a Member States as most RFMOs have adopted conservation and management measures that apply on a flag basis. The absence of fishing agreement may be detrimental to the EU image and undermine its effort to promote responsible fishing practices. The fate of the demersal segment will be different as it has no particular interest to retain an EU flag is there are no fishing agreements. Under this option, DG MARE will lose its key instrument for delivering sectoral support to third countries. The EU support to fisheries policy development in developing countries will therefore fall under the development policy managed by DG DEV of the Commission (or other instruments for non-ACP countries like Greenland or Morocco), or globally by the instruments managed by the forthcoming European External Action Service. The current approach of DG DEV is to support fisheries management through all-ACP or Regional EDF programmes, with no specific programmes for fisheries support under the current National Indicative Programmes signed for the 2008-2013 (10th EDF) period. As far as RFMOs are concerned, the principle of levying a fee of € 35 per tonne caught in the regulatory area (or € 20 per tonne for small pelagic) will generate considerable source of extra-
Annex A: External Policy - CFP Impact Analysis
CFP Impact Assessment Phase II External Governance 157
budgetary income for RFMOs. However, a catch fee will have important negative impacts on vessel’s profitability. It will be also fairly difficult to enforce (verification of catches, incentive to under-declare, etc.). Option 3 – FPA cost of access borne by EU shipowners without transitional period. Termination of mixed agreements which would become tuna agreements or eventually pelagic agreements only This option is very similar to option 1 on the case of tuna agreements (currently 11 out of the 14 existing agreements, 8% of current DG MARE commitments). However, it will have impacts on the four partner States currently under a mixed agreement (Greenland, Morocco, Mauritania and Guinea Bissau). Should the option of retaining tuna agreement only be adopted, it can be expected that there will be no longer any agreement with Greenland and Morocco as the presence of tuna in these waters is low or inexistent. The macro-economic stability of Greenland will be jeopardised, as will be the whole balance of fishing possibilities negotiated with Norway, Iceland and the Faeroes. It will also decrease considerably the budget income of Mauritania and Guinea Bissau with also adverse consequences on macro-economic stability. Maintaining fishing possibilities for small pelagic in addition to tuna possibilities would be of interest for the EU fleet, and would also meet some of the needs of the third countries concerned (Greenland, Morocco and Mauritania). This reform option will have indirect impact on the EU external fleet segments not considered in the fishing possibilities negotiated (demersal and small pelagics fleets in case of tuna only agreements; demersal fleet in case of tuna plus small pelagic agreements). The exclusivity clause will prevent these fleet segments from obtaining an access in the productive EEZ concerned. The fishing vessels belonging to the barred segments will have to reflag or to be decommissioned using EFF funding. Status quo, but with fewer vessels involved / elimination of mixed agreements There will not be major changes under this option compared to the current situation. Given the likely anticipated decrease of the EU external fleet and the EU budget requirement to have payments proportionate to fishing rights negotiated, the major impact is that coastal States will receive decreased total financial contribution, including less support to fisheries policy development as the proportionality rule between EU payments and fishing capacities negotiated will remain into force. 3. Impacts
2.6. On the EU
2.6.1. Environment (repercussions of different options on internal fishing effort)
Most of the vessels of the external fleet and exploiting fishing possibilities under fishing agreement do not have access to stocks managed by the Council in the waters under the jurisdiction of Member States. Therefore, none of the options considered will have an impact on the internal fishing effort. The EU vessels that will loose for good fishing possibilities in the EEZ of third countries will not have a redeployment in EU waters as possible alternative (EU demersal fleet operating under the bilateral agreements in West Africa in particular). There are however one minor exception, the artisanal fleet operating in Morocco: the Morocco agreement is used by some Spanish and Portuguese fleet segments to extend their area of operation to the neighbouring waters of Morocco. Under option 2, this fleet (+/- 50 small vessels) will have to report its fishing effort on stocks in own waters. Some of these stocks are overexploited (small pelagics in the Gulf of Cadix) and under a specific management plan. The increase of fishing effort will have to be treated using structural funds (scrapping of vessels, temporary cessation of activities). For all other EU vessels, no return to EU waters is possible, except the small pelagic fleet but up to the limits currently imposed through quotas. This fleet already exploits its fishing possibilities in EU waters up to the maximum.

Annex A: External Policy - CFP Impact Analysis
CFP Impact Assessment Phase II External Governance 158
2.6.2. Social (employment)
Employment on the EU vessels fishing under the bilateral agreements concluded by the EU has been recently estimated at 7,000 including 2,300 EU nationals and 4,800 third countries nationals. Employment of EU nationals can be broken down as follows: 1,110 on tuna vessels, 400 on demersal vessels, 200 on small pelagic vessels and 530 on vessels operating in Greenland. The EU external fleet is a fleet where employment of third country national is fairly high (on average, there are 2.5 third country nationals for 1 EU national). For comparison purpose, there are ≈ 200,000 jobs in the catching sector in the EU. Under option 1, it is estimated that EU vessels will be in a position to continue their fishing activities as under the current model, under the assumption that final cost of access under this option remains compatible with financial possibilities of the fleet. The review has made clear that the EU fleet cannot sustain access costs up to the level of those currently paid by the EU. The acceptable compromise will be access costs comparable with access costs paid by other third country fleets. If this assumption is retained, there will be no impact on EU employment. If it is not, the option 1 will be equivalent to option 2: costs of access will be to expensive and the EU fleet will not be able to pay. Under option 2, it is expected that tuna vessels, small pelagic vessels and possibly vessels under the Greenland agreement will be able to negotiate their own access arrangements and keep exploiting the resources under the EU Flag. In both cases, it is not expected to have significant impacts on employment. Even when EU vessels operate under another flag, the management positions onboard the vessels (captain, second captain, chief engineer, ...) are occupied by EU nationals. For the demersal fleet, only the shrimp trawlers will negotiate their own access agreements. The cephalopod trawlers will cease activities. This will have a somewhat minor impact on employment, and it can be expected that only half of the 400 EU jobs on the demersal fleet will be negatively impacted. Under option 3, the impact on employment will be similar to option 1. However, if mixed agreements are eliminated, it may bear potential consequences on the 400 jobs onboard the demersal fleet and the 535 jobs on the demersal fleet operating in Greenland. However, some of these vessels will reflag (definitively or temporarily) and not all jobs will be equally impacted. As above, it can be expected that only half of the 400 EU jobs on the demersal fleet will be negatively impacted.
2.6.3. Budget (expenses)
The impacts of the various options will depend to a large extent on the future policy of the EU in relation to support to the implementation of the national fisheries policy. In other words, will the EU support the coastal States up to the current level of sectoral support (€ 47 million), up to the current level of contribution (€ 141 million) or up to the estimated need from third countries (€ 104 million), or will the EU disengage from sectoral support ? The following discussion should be put in perspective with the current level of DG MARE budget (€ 1 billion / year) and the current Commission budget (€ 130 billion / year.) Under option 1, the EU does not pay for access, but only for policy support to those coastal States having concluded a fishing agreement. The cost for the EU budget will depend on the policy suboption selected: €M 47; 103 or 141.

Annex A: External Policy - CFP Impact Analysis
CFP Impact Assessment Phase II External Governance 159
Under option 2, there will be an economy of € 141 million for the EU budget. However, is it realistic to consider that the EU will completely disengage from fisheries sectoral support ? The answer is probably no. As part of its cooperation strategy with neighbouring and/or developing countries, the EU will still have to earmark development assistance for fisheries, a sector that is a potential source of growth and employment in most developing countries. Budgets will have to be secured in this respect. Under option 3, assuming sectoral support is continued and adapted to the estimated needs of the third countries, the budget requirements will be in the region of € 104 million, as per option 1. Concerning RFMOs, the two options considered are neutral for the EU budget. The extra-budgetary sources of income identified to support international programmes will be sourced from the private sector.
2.6.4. Fleet (for tuna and mixed agreements)
Under option 1, and under the assumption that access costs are aligned with what the private sector can realistically pay, the fleet will not change. No specific impacts are expected. The EU fleet using the bilateral agreements (≈ 300 units) will remain at the same level. Under option 2, the tuna fleet and the small pelagic fleet are likely to negotiate private access agreements. Since the tuna fleet through RFMOs and the small pelagic fleet through EU regulations on TAC & quotas and through RFMOs have fishing possibilities linked to the flag, definitive reflagging is unlikely. Some segments of the demersal fleet will probably select this private arrangement alternative (shrimp trawlers operating off West Africa), while the demersal fleet will have to leave the register. However, demersal fishing vessels have no specific incentives to keep the EU flag in case there are no bilateral agreements. Therefore, the ≈ 50 shrimp trawlers may reflag, but the ≈ 50 demersal cephalopods trawlers will have to be decommissioned. If option 3 leading to elimination of mixed agreements is retained, the exclusivity clause will prevent the demersal fleet and possibly the small pelagic fleet from accessing EEZ where the EU has negotiated tuna or small pelagic / tuna agreements. The 150 or so EU demersal and small pelagics vessels will have therefore to leave the fleet or to change flag, with impacts broadly similar to option 2 (no agreements).
2.6.5. Administration (institutions: who does what?)
This question is not related to the impacts of the policy option, but rather to the existing intra-institutional arrangements. At present, DG MARE is responsible for the management and the implementation of bilateral agreements, including the delivery and the management of sectoral support. For countries that have not concluded a bilateral fishing agreement, development support targeted on the fisheries sector, when available, is managed and implemented by DG DEV or RELEX (and in the future by EEAS). Under option 1, if the EU retains the principle of delivering sectoral support to the fisheries sector, the question remains open. The modus operandi can be the same as currently with DG MARE implementing the sectoral support on the grounds that it has the expertise in fisheries, or DG DEV or RELEX implementing fisheries sectoral support as part of their own instruments on the ground that it

Annex A: External Policy - CFP Impact Analysis
CFP Impact Assessment Phase II External Governance 160
has the resources to do so. Providing that coherence is maintained, which is the case according to the latest coherence reports from DG DEV, the situation may remain similar to the current situation, with however a stringent need to reinforce DG MARE resources assigned on bilateral agreements. However, for those coastal States who do not have fishing agreements with the EU, there is currently no national support to the fisheries sector apart from the support delivered through regional programmes. This is not a viable situation as fight against IUU fishing needs to be global. Only DG DEV or RELEX or the forthcoming EEAS have the institutional mandate to address the case of those countries, not DG MARE. Under option 2 (no bilateral agreements), the DG MARE will loose its institutional legitimacy to deliver sectoral support. The institutional arrangements will have to be different with EEAS as leading entity. Under option 3, the situation is similar to option 1.
2.7. On third countries
2.7.1. Environment
Fish stocks exploited by EU vessels / Locally important fish stocks Under option 1, the situation will be similar to present if the EU address the fisheries policy development needs with adequate funding disconnected from the question of access. The institutional presence of the EU in the bilateral agreements and the partnership approach with its associated funding element will support the development of a fisheries policy that will have objective to preserve fish stocks. This policy has had positive impacts so far according to an evaluation of the FPA instrument carried out recently60. Under option 2, there will be no intellectual or financial support for third countries to implement management and conservation measures for sustainable fishing. Third countries may replace the EU fleet under agreement by other third countries fleet but only in exchange for public receipts and not for policy support. Funding for the development of research and MCS capacities will not be equivalent to current funding levels. This will undermine the EU fight against IUU fishing. Impacts under option 3 will be broadly similar to impacts under option 1 as the EU will continue sectoral support to third countries. However, the principle of negotiating tuna-only bilateral agreements will end the current relationship with Greenland, and also probably that with Morocco. One of the issues not addressed in this study is what indicator could be used for measuring progress towards sustainability. One possibility would be to monitor stock status indicators (F/Fmsy and B/Bmsy) against current reference points presented in the appendix. However, not all stocks are or will be assessed in comparison with their MSY reference points. Secondly, a stock status indicator does not take into account how the other environmental impacts of fishing are addressed (in particular discard levels, by-catches of protected species).
2.7.2. Society
Development of local industry 60 See « Overall evaluation of FPAs », SC 17 under Framework contract FISH/2006/20, April 2009

Annex A: External Policy - CFP Impact Analysis
CFP Impact Assessment Phase II External Governance 161
The main impact of the bilateral agreements on the development of the local industry is delivered through modernisation actions supported by the EU sectoral support. However, only the third countries where sectoral support reaches a critical volume can use the agreement to develop port infrastructure or the logistics and management (incl. SPS certification) of the industry (e.g. Greenland, Morocco, Mauritania, Guinea Bissau, Seychelles). In all other third countries, the funds available are not sufficient to support important investments in ports or logistics. Consequently, option 1 which retains sectoral support disconnected from access may have a positive impact on the development of the industries of the aforementioned coastal States, but also on others who do not have sufficient funding under the current FPA scheme. Under option 2, the needs for development of the industry will not be addressed any longer through the instruments available under the bilateral agreements, and Greenland, Morocco, Mauritania, Guinea Bissau, Seychelles may experience negative impacts in this respect, albeit at variable extent (Greenland, Morocco and Seychelles have probably funding alternatives, while Mauritania and Guinea Bissau may not have them). Under option 3, there will be still some funding available for the development of the industry of the designated countries, but decreasing - especially in Guinea Bissau if the option is to eliminate mixed bilateral agreements. There will be no impacts on the other partner third countries as current funding possibilities are to low to envisage significant investments. One other solution to develop the industry is to encourage EU landings in the country, as it creates value added and fosters an investment dynamic. According to the presentation developed page 106, the main driver for local landing is economic: EU vessels unload their catches where they will obtain the best cost - efficiency ratio given the markets targeted. It is not expected that any of the options will have an influence on this economic logic. Even in case there is not fishing agreement, the EU fleet will unload its tuna catches in Abidjan or Ecuador, the small pelagic fleet and demersal fleet will unload in Las Palmas or Dakar. The only exception may be Seychelles. If the EU tuna purse seiners have no fishing possibilities in the wide Seychelles EEZ (as a consequence of option 2, but unlikely as the Seychelles industry needs also the EU tuna fleets to develop), they may seek an alternative unloading port. Note that other externalities may have considerable influence on the strategy of the EU fleet and on its influence on the development of the local industry. One of these is the trade policy and the preferential regimes granted to some countries. If the trade preferences level out or are abolished, the strategy of the EU fleet may change completely, independently from the access possibilities. Stakeholder participation Stakeholder participation in the decision making process is an exclusive competency of the coastal State in question. It is the only entity that can decide what stakeholders organisations are representative in a given area and on the modalities of consultation. Therefore, bilateral agreements are not the most appropriate instrument to promote stakeholder participation in the national decision making process. However, the actions decided jointly under the frame of the partnership may identify measure to support professional associations (like in Morocco, the only example known), but it remains up to the partner country to decide what organisations should receive support and what for. No specific impacts on stakeholder participation are foreseen under any of the policy options considered.
2.7.3. Budget
Some preliminary considerations

Annex A: External Policy - CFP Impact Analysis
CFP Impact Assessment Phase II External Governance 162
The following table shows that while FPA contribution represent in general a small share of the National budget income (1% and less), it represents 15% and plus for Mauritania and Guinea Bissau, with associated macro-economic impacts on earnings in foreign currency. Concerning Seychelles, the contribution of the agreement, moderate in relative value, is essential for the economy in terms of inflow of foreign currency.
Table 34 : EU total contribution under FPAs as % of National budget income
Third country Contribution FPA/budget income Mauritanie 16.5% Guinée Bissau 15.6% Seychelles 1.7% Groenland 1.3% Sao Tome 1.0% Comores 0.9% Micronésie 0.5% Kiribati 0.4% Salomon 0.4% Madagascar 0.2% Maroc 0.2% Cap Vert 0.1% Mozambique 0.1% Cote d'Ivoire 0.0% Gabon 0.0% In Mauritania, € 50 million out of the € 70 million paid by the EU under the FPA is used by the Government at its own discretion to finance the national policies. € 20 million are used to support the fisheries policy under the partnership framework of the agreement. In Guinea Bissau, € 4.5 million out of the € 7.5 million paid under the FPA support the general budget income. In Seychelles, the amount is € 2.3 million out of total payments under the FPA of € 5.4 million. In Seychelles, the current account of the balance of payments is ≈ USD -450 million. The EU contribution represents approximately 13% of the Central Government credits in currency. In Mauritania, the EU contribution is equivalent to 15% of the Government income in currency. In most cases, the financial support from the EU (EDF or other specific instruments) is greater than the contribution of the EU under the FPA, with however tow notable cases: Mauritania where FPA contribution is more than 3 time greater than EDF support, and Seychelles where FPA contribution is 5 time greater than EDF support. In some other cases, the FPA contribution may be equivalent to a substantial part of EU support (e.g. Greenland, Guinea Bissau and Micronesia where FPA contribution is equivalent to 40-60% of other EU support.
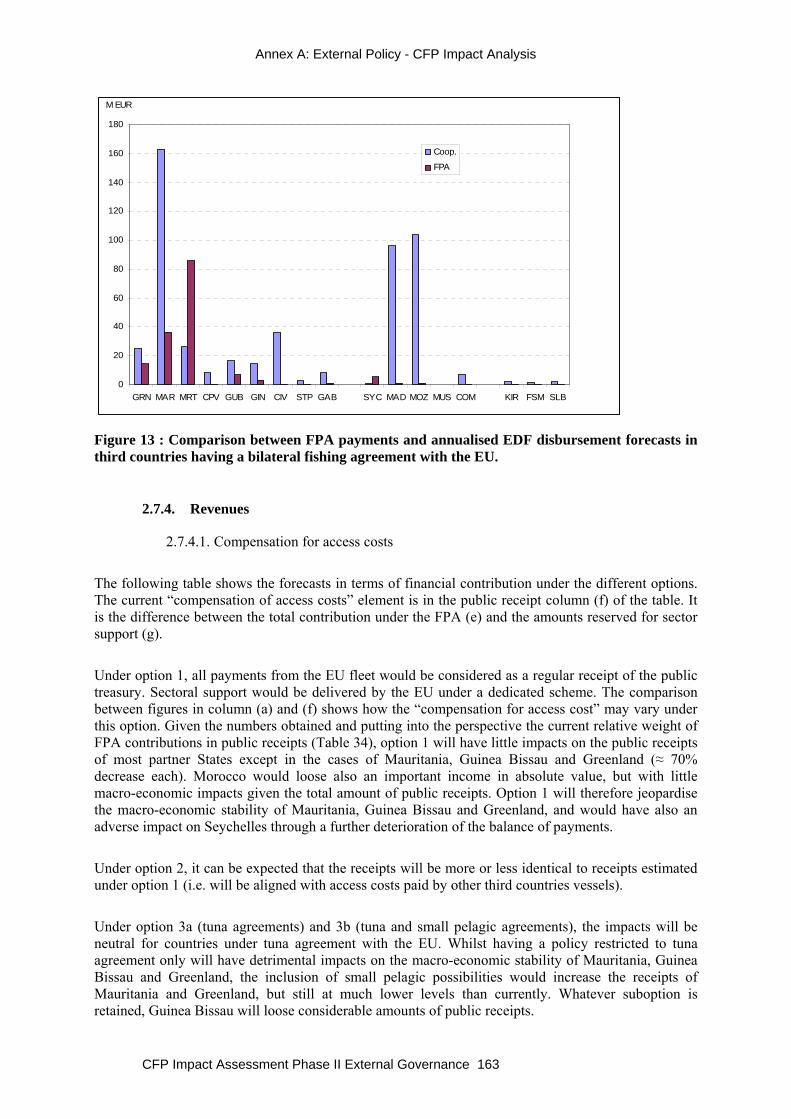
Annex A: External Policy - CFP Impact Analysis
CFP Impact Assessment Phase II External Governance 163
0
20
40
60
80
100
120
140
160
180
GRN MAR MRT CPV GUB GIN CIV STP GAB SYC MAD MOZ MUS COM KIR FSM SLB
Coop.
FPA
M EUR
Figure 13 : Comparison between FPA payments and annualised EDF disbursement forecasts in third countries having a bilateral fishing agreement with the EU.
2.7.4. Revenues
2.7.4.1. Compensation for access costs The following table shows the forecasts in terms of financial contribution under the different options. The current “compensation of access costs” element is in the public receipt column (f) of the table. It is the difference between the total contribution under the FPA (e) and the amounts reserved for sector support (g). Under option 1, all payments from the EU fleet would be considered as a regular receipt of the public treasury. Sectoral support would be delivered by the EU under a dedicated scheme. The comparison between figures in column (a) and (f) shows how the “compensation for access cost” may vary under this option. Given the numbers obtained and putting into the perspective the current relative weight of FPA contributions in public receipts (Table 34), option 1 will have little impacts on the public receipts of most partner States except in the cases of Mauritania, Guinea Bissau and Greenland (≈ 70% decrease each). Morocco would loose also an important income in absolute value, but with little macro-economic impacts given the total amount of public receipts. Option 1 will therefore jeopardise the macro-economic stability of Mauritania, Guinea Bissau and Greenland, and would have also an adverse impact on Seychelles through a further deterioration of the balance of payments. Under option 2, it can be expected that the receipts will be more or less identical to receipts estimated under option 1 (i.e. will be aligned with access costs paid by other third countries vessels). Under option 3a (tuna agreements) and 3b (tuna and small pelagic agreements), the impacts will be neutral for countries under tuna agreement with the EU. Whilst having a policy restricted to tuna agreement only will have detrimental impacts on the macro-economic stability of Mauritania, Guinea Bissau and Greenland, the inclusion of small pelagic possibilities would increase the receipts of Mauritania and Greenland, but still at much lower levels than currently. Whatever suboption is retained, Guinea Bissau will loose considerable amounts of public receipts.

Annex A: External Policy - CFP Impact Analysis
CFP Impact Assessment Phase II External Governance 164
Table 35 : Overview of anticipated third country receipts under the different options. All data in M€
(a) (b) (c) (d) (e) (f) (g) Option 1 Option 2 Option 3a Option 3b Current Of which public
receipt Of which sectoralsupport
CPV 0.2 0.2 0.2 0.2 0.4 0.1 0.3 CIV 0.2 0.2 0.2 0.2 0.6 0.0 0.6 GAB 0.4 0.4 0.4 0.4 0.9 0.3 0.5 STP 0.2 0.2 0.2 0.2 0.7 0.3 0.3 COM 0.3 0.3 0.3 0.3 0.4 0.2 0.2 MAD 0.7 0.7 0.7 0.7 1.2 0.2 1.0 MOZ 0.3 0.3 0.3 0.3 0.9 0.0 0.9 SYC 2.1 2.1 2.1 2.1 5.3 2.3 3.0 KIR 0.4 0.4 0.4 0.4 0.5 0.3 0.1 FSM 0.1 0.1 0.1 0.1 0.6 0.4 0.2 SLB 0.1 0.1 0.1 0.1 0.4 0.2 0.2 GUB 1.1 1.1 0.2 0.2 7.5 4.6 3.0 GRN 3.5 3.5 0.0 0.8 15.8 12.6 3.3 MRT 18.0 14.0 0.3 12.8 70.0 50.0 20.0 MAR 3.0 3.0 0.0 3.0 36.1 22.6 13.5 TOTAL 30.5 26.5 5.4 21.7 141.2 94.2 47.0
2.7.4.2. Sectoral support Under option 1, the sectoral support granted by the EU under the bilateral agreements would be disconnected from the access. Under the assumption that DG MARE keep the ≈ € 141 million budget line to sectoral support, it will be possible to contribute to the fisheries policy support up to the estimated needs of the countries (≈ € 104 million, Table 14 page 124). The disconnection from access will provide the opportunity to adapt the envelopes to the need, and change the current situation where some countries receive to much and other not enough. There will be some DG MARE budget resources available to support implementation of fisheries policies under new FPAs (there is a demand from the EU tuna sector for access in inter alia Senegal, Sierra Leone, Liberia, Nigeria, Kenya, Tanzania, Mauritius, Tuvalu, Nauru, Papua New Guinea) or to support regional initiatives similar to the MCS operational plan in the Indian Ocean. Under option 2, no sectoral support will be available. This will be detrimental in Madagascar, Mozambique Seychelles, Guinea Bissau, Mauritania and Greenland where the EU sectoral support reaches a critical mass of funding, but not in the other third country for which the sectoral support is relatively low in absolute value. However, the EU intervention in these other third countries supports the definition of a policy support framework with measures and associated funding (a matrix) which can be used by other international donors to target their support measures. Without this intervention frame, international aid will loose efficiency. Under option 3, the amount dedicated to sectoral support will be adapted up levels considered under option 1. However, the limitation of the EU policy to tuna only agreements will withdraw the

Annex A: External Policy - CFP Impact Analysis
CFP Impact Assessment Phase II External Governance 165
substance of the agreements with Greenland and Morocco. Greenland will be adversely impacted, as will be the balance of fishing possibilities exchanged between the EU, Norway, Iceland and the Feroes.
2.7.4.3. Management (transparency, budgetisation, …) The current rule is that i) FPA funding earmarked to support the implementation of the fishery policy is a budget support (Council decision). The EU monitors the utilisation of the financial resources and can use safeguard clauses if results are not up to expectation ii) FPA funding not ea earmarked to support the implementation of the fishery policy is also a budget support but used at the full discretion of the third country (like mining fees or oil revenues). These rules are fairly different from the rules of EDF or other instruments (neighbourhood instrument for Morocco, EU general budget for Greenland). As far as EDF is concerned, the main differences are as follows :
• EDF funding can be used only if the third country meets financial governance standards. Only a few countries under fisheries bilateral agreements meet those standards (Cape Verde, Mozambique, Morocco or Greenland). The other countries can only receive project based support. This is an important difference with EU sectoral support under bilateral agreements which are all budget supports.

Annex A: External Policy - CFP Impact Analysis
CFP Impact Assessment Phase II External Governance 166
Table 36 : Third countries under fisheries bilateral agreements that meet / do not meet AIDCO eligibility criteria for budget support.
Third countries
Eligible to budget support Not eligible to budget support
CPV x CIV x GAB x STP x COM x MAD x MOZ x SYC x KIR x FSM x SLB x GUB x GRN x MRT x MAR x
• EDF support can be suspended easily if support outputs are not up to expectations, what the Commission can also do under the FPA EU sectoral support, but less easily (suspension clauses are not all applicable given the commercial dimension of the access agreements, see Mauritania protocol for example). In addition, under EDF there are suspension clauses in case of violation of human rights (art. 96), a clause that is not considered under FPA. There are currently a number of countries with bilateral agreements subject to application of art. 96 (Madagascar, Mauritania, Guinea Bissau). This situation gave rise to controversy within the Commission in 2008 after the Mauritanian coup (EDF support was suspended, but the EU compensation under FPA which is 3 times greater than EDF support was paid).
Under option 1 and 3, while full payment of access from EU shipowners will be treated as a regular budget income and its utilisation under the full sovereignty of the State, the modalities of EU support to policy implementation, now disconnected from access, could be reformed to align with the rules applied under other EU cooperation instruments including inter alia clauses to adapt payments to actual utilisation of funds and human right clauses. Under option 2, the question is not relevant as there will be no funding.
*** *

Annex A: External Policy - CFP Impact Analysis
CFP Impact Assessment Phase II External Governance 167
4. Indicators External (RFMOs & FPAs): scoring the options Two indicators have been indentified to measure the performances of the reform options pertaining to the external strand of the Common Fisheries Policy:
• Sustainability: to what extent the reform options support the promotion of sustainability of fishing in external waters
• Local landings: to what extent the reform options promote interactions between the third countries and the EU fleet to create value added
The following table details the impacts of the various options on these two indicators. Each indicators has been scored empirically on a scale ranging from 1 (lowest impacts) to 4 (highest impacts). For an overall weighing of indicators, the following assumptions have been considered:
• For FPAs, equal weight is given to sustainability and local landings. The overall score of the FPA reform option is simply the average of the two indicators’ score.
• For RFMOs, an indicator reflecting local landings is not relevant (RFMOs are a management framework for shared resources). Only the sustainability indicator has been considered.
• An overall score for the external strand of the CFP is calculated giving 75% weight to FPA indicators and 25% to RFMOs. The reason is that RFMOs are relevant only to highly migratory species present in the international waters and in coastal States’ EEZs. RFMOs can only have influence on the management of commercial species under their management mandate. This leaves the coastal resources under the sovereignty of Costal States not addressed through this framework. The FPA policy potentially affects sustainability of all resources in the EEZ, and can thus bring higher benefits in terms of sustainability. Alternatively, FPA and RFMO indicators could have been weighted in proportion to the respective EU investment in both aspects, i.e. 90% - 10% (≈ €M 140 in FPA and ≈ €M 16 in RFMOs).
Overall, option 1 (score of 3) performs better than option 3 (score of 2.63). The least preferred option is option 2 (score of 1.94), just ahead of statu quo (score of 2) - see explanations and graphs overleaf.
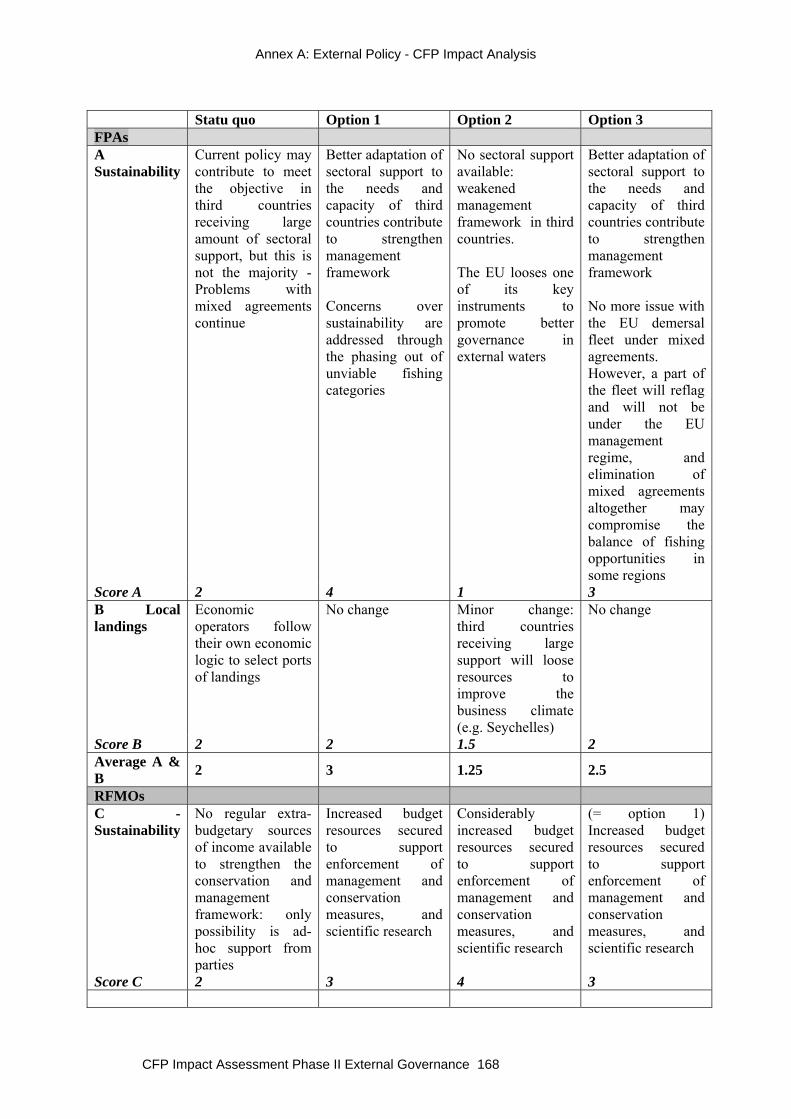
Annex A: External Policy - CFP Impact Analysis
CFP Impact Assessment Phase II External Governance 168
Statu quo Option 1 Option 2 Option 3 FPAs A Sustainability
Current policy may contribute to meet the objective in third countries receiving large amount of sectoral support, but this is not the majority - Problems with mixed agreements continue
Better adaptation of sectoral support to the needs and capacity of third countries contribute to strengthen management framework Concerns over sustainability are addressed through the phasing out of unviable fishing categories
No sectoral support available: weakened management framework in third countries. The EU looses one of its key instruments to promote better governance in external waters
Better adaptation of sectoral support to the needs and capacity of third countries contribute to strengthen management framework No more issue with the EU demersal fleet under mixed agreements. However, a part of the fleet will reflag and will not be under the EU management regime, and elimination of mixed agreements altogether may compromise the balance of fishing opportunities in some regions
Score A 2 4 1 3 B Local landings
Economic operators follow their own economic logic to select ports of landings
No change Minor change: third countries receiving large support will loose resources to improve the business climate (e.g. Seychelles)
No change
Score B 2 2 1.5 2 Average A & B 2 3 1.25 2.5
RFMOs C - Sustainability
No regular extra-budgetary sources of income available to strengthen the conservation and management framework: only possibility is ad-hoc support from parties
Increased budget resources secured to support enforcement of management and conservation measures, and scientific research
Considerably increased budget resources secured to support enforcement of management and conservation measures, and scientific research
(= option 1) Increased budget resources secured to support enforcement of management and conservation measures, and scientific research
Score C 2 3 4 3
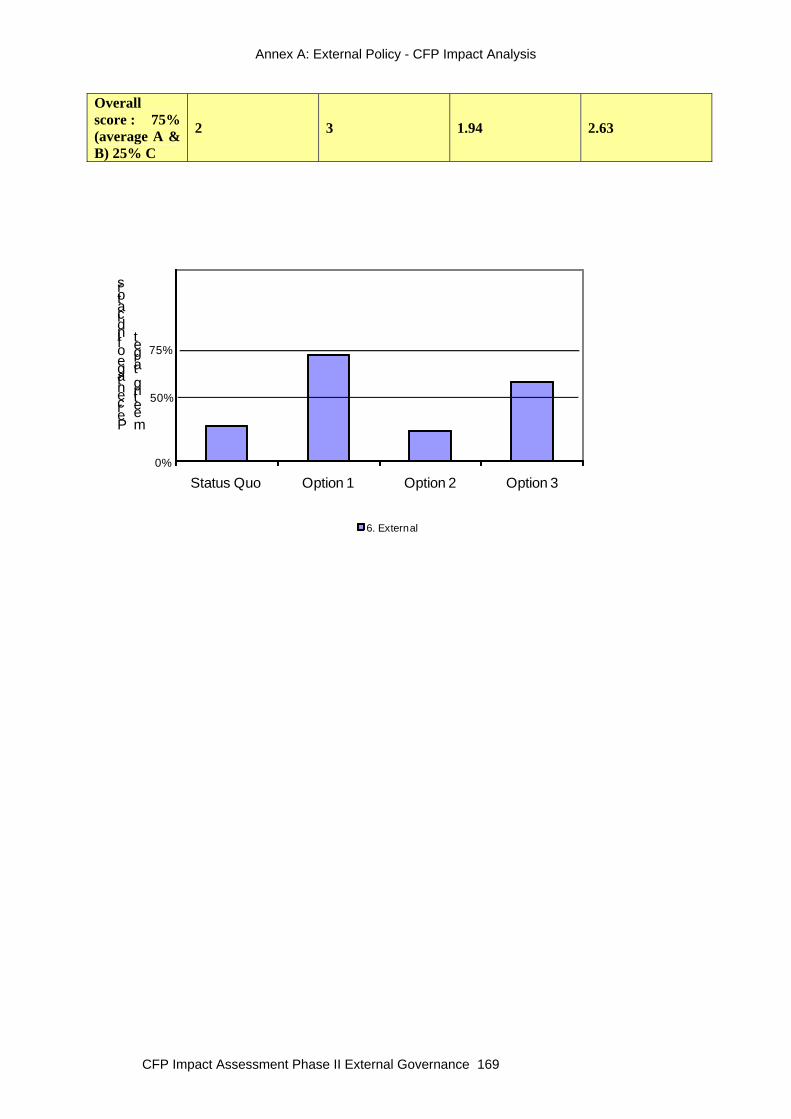
Annex A: External Policy - CFP Impact Analysis
CFP Impact Assessment Phase II External Governance 169
Overall score : 75% (average A & B) 25% C
2 3 1.94 2.63
Status Quo Option 1 Option 2 Option 3
6. External
0%
50%
75%
Percentage of indicators
meeting target

Annex A: External Policy - CFP Impact Analysis
CFP Impact Assessment Phase II External Governance 170
APPENDIX : STOCK STATUS INDICATORS FOR A SELECTION OF SPECIES OF INTEREST FOR THE EU EXTERNAL FLEET Stock indicators for highly migratory species (bold = species of interest for the EU fleet). Source: ICCAT and IOTC Region Stock Fishing Mortality
FCUR / FMSY Biomass BCUR / BMSY
Status
Albacore 1.04 (0.85-1.23) 0.62 (0.45-0.79) Bigeye 0.87 (0.70-1.24) 0.92 (0.85-1.07) Yellowfin 0.86 (0.71-1.05) 0.96 (0.72-1.22) Skipjack Likely <1 Likely >1 Bluefin 3.04-3.42 0.35-0.14
Atlantic Ocean
Swordfish 0.76 (0.67 - .96) 1.05 (0.94 - 1.24) Albacore 0.48-0.91 > 1 Bigeye 0.9 1.17 Yellowfin 1.16 1.12 Skipjack ? ?
Indian Ocean
Swordfish 0.79 1.31 (1.13-1.46) Selected demersal species in Morocco, Mauritania and Guinea Bissau. Source: COPACE 2010 Espèce (pays)
Fcur /F0.1
Bcur / B0.1
Pagellus acarne (Maroc)
252% 32%
Pagellus bellotii (Mauritanie, Senegal, Gambia)
53% 141%
Merluccius merluccius (Maroc)
371% 57%
Merluccius sp (Maurtianie)
43% 132%
Octopus vulgaris Stock Dakhla (26° N-20°50 N)
181 %
56 %
Cap Blanc 150% 79% Sepia spp. Dakhla (26° N-20°50 N)
298 %
25 %
Parapenaeus longirostris (Maroc)
255 %
34 %

Annex A: External Policy - CFP Impact Analysis
CFP Impact Assessment Phase II External Governance 171
Espèce (pays)
Fcur /F0.1
Bcur / B0.1
Mauritania Parapenaeus longirostris
77% 121%
Mauritania Peaneaus notialis
65% 60%
Small pelagic species off West Africa (all of interest for the EU fleet). Source : COPACE 2010 Stock
Bcur / B0.1
Fcur / F0.1
Etat d’exploitation
Sardine (S. pilchardus) Zone A+B
117%
87%
Stock pleinement exploité
Sardine (S. pilchardus) Zone C
160%
15%
Stock non pleinement exploité (exploitation modérée)
Sardinelle ronde (S. aurita) Sardinelle plate (S.maderensis) Sardinelles Ensemble de la sous-région
112% - 94%
223% - 195%
Stock de S. aurita surexploité Les captures de sardinelles devraient être réduites afin d’éviter une chute de stock
Chinchard européen (T. trachurus) Chinchard noir (T. trecae) Chinchards
72% 53%
164% 197%
Stocks de T. trachurus et de T. trecae surexploités

Annex A: External Policy - CFP Impact Analysis
CFP Impact Assessment Phase II External Governance 172
Stock
Bcur / B0.1
Fcur / F0.1
Etat d’exploitation
Ensemble de la sous-région Maquereau (Scomber japonicus) Ensemble de la sous-région
130%
77%
Stock pleinement exploité
Anchois (Engraulis encrasicolus)
NA
97% (LCA)
Stock pleinement exploité
Annex A: External Policy - CFP Impact Analysis
CFP Impact Assessment Phase II External Governance 173
ANNEX 12 – INDIVIDUAL TRANSFERABLE RIGHTS (ITR)
Introduction Individual Transferable Rights (ITR) are rights that entitle holders to a specific proportion (usually a fixed percentage) of a country's future annual fishing opportunities. This provides the rights holders with a secure long term stake in the fisheries.
ITR are increasingly used around the world Actually, close to 25% of global catches of fish are taken under an ITR system. Among the countries that have taken up ITR there are EU Member States, such as the Netherlands and Denmark.
The objective of implementing an ITR system is to promote fleet adaptation, to promote long term thinking in the fisheries sector and to improve its economic performance. This has to be obtained within the framework of environmental sustainability, and improves the basis for the fisheries sector to make positive social, economic and environmental contributions. Fishing rights do not endow their holder with property rights, and they should rather be looked at as user rights that can be revoked in accordance with appropriate procedures.
A recent Commission study on rights based management (including approaches that are in some ways different to ITR) identified 63 different rights based management systems in EU marine fisheries. Many of them are concentrated in the Baltic Sea. The most recent example is Sweden, which (following the Danish example), introduced ITR for its pelagic fleet and is examining options for the demersal fisheries. Germany already has relatively strong rights in place, although transfer of quotas on a permanent basis is not allowed. Poland has recently expressed their intention to implement a rights based approach for their national fisheries.
Experience (including in the USA, Norway, Iceland, Canada and Denmark) shows that a rights based approach that is built on strong (in terms of security, transferability, exclusivity and durability) use-rights reduces fleet overcapacity and leads to more economically sustainable fisheries. The increased long term thinking that is associated with secure long term fishing rights also contributes to a greater emphasis within the fisheries sector on environmental sustainability.
The common elements
The common elements in all ITR systems include the following:
• defining what fisheries resources fall under the system,
• defining who are the eligible participants,
• distributing ITRs to participants,
• allocating annual fishing opportunities (quotas or effort days) to rights holders, and
• ensuring that ITRs are transferable, subject to applicable limitations.
The variable elements In addition to the common elements, all ITR systems include other elements or safeguards measures that vary between different systems. There are no one-size-fits-all solutions, and different measures are appropriate in different circumstances.
Among the safeguarding measures that are used in some current ITR systems are the following:

Annex A: External Policy - CFP Impact Analysis
CFP Impact Assessment Phase II External Governance 174
Ceilings on the concentration of rights on a single vessel To prevent concentration of rights on too few vessels, the maximum level of rights that can be registered on a single vessel may be limited.
Ceilings on the concentration of rights for owners and operators To prevent concentration of rights into too few hands, the level of rights that may be held by the same or associated parties may be limited.
Limitation or prohibition of leasing MS may limit or prohibit leasing (i.e. transfers of annual fishing allocations without rights being a part of the transaction). This may be done for the purpose of: a) preventing rights holders from leasing out a large part of their fishing allocations
("slipper skippers") and/or b) ensuring that rights holders have a genuine long-term stake in the fishery (by
operating on the basis of rights held rather than on leased in annual fishing allocations).
Limitations on leasing may be in the form of setting ceilings on the level of leasing (e.g. vessel only being able to lease in or out 30 % of the annual fishing allocation it gets on the basis of the rights it holds). Limitations and/or prohibitions on leasing may be set for all fleet segments, or for only specific identified fleet segments.
Limitation or prohibition on transfers between fleet segments To prevent the decline of defined fleet segments (such as small scale coastal fleets) or to maintain pre-existing management divisions, transfers between specific fleet segments may be limited or prohibited. This can include simple prohibitions, ceilings on rights being transferred out of segments, curtailment of rights, or any other limitation that the MS considers appropriate. The limitation or prohibition will not affect transferability within the fleet relevant segment.
Reserves When reserves are used to provide temporary fishing allocations for young fishermen or to act as shock absorbers for coastal communities, this should be considered a safeguarding measure.
Economic link to fisheries To avoid rights being controlled by parties with little or no direct economic link to fisheries (e.g. being an active fisher, links to coastal communities, regions), sometimes transfers are limited to parties having a direct economic link to the fishery.
Limitations on the divisibility of rights MS may set limitations on the divisibility of rights. This may be in the form of thresholds on the level of rights held by vessels, i.e. requirements for vessels to have a minimum level of rights to maintain a valid permit to fish, or in any other form that the MS considers most appropriate.
Scrapping of vessels without fishing rights To ensure to the extent possible that vessels with no or insufficient rights do not contribute to fishing pressure on unregulated species or world-wide overcapacity, MS may implement a rule where a vessel must be scrapped if it has less rights than constitutes the threshold set under rules on the limitation on the divisibility of rights.