emro cps final patterns of drinking abstainers (15+ years), 2005 males females total lifetime...
TRANSCRIPT

1
PATTERNS OF DRINKING
ABSTAINERS (15+ years), 2005
Males Females Total
Lifetime abstainers
No information availableFormer drinkers
Abstainers*
* Persons who did not drink in the past 12 months.
DRINKERS ONLY
Adult (15+ years) per capita consumption*, total —
Adult (15+ years) per capita consumption*, males —
Adult (15+ years) per capita consumption*, females —
Heavy episodic drinkers** (15–85+ years), males —
Heavy episodic drinkers** (15–85+ years), females —
* (Recorded + unrecorded – tourist) in litres of pure alcohol, average 2003–2005.** Had at least 60 grams or more of pure alcohol on at least one occasion weekly.
PATTERNS OF DRINKING SCORE
Patterns of drinking score* LEAST RISKY No information available MOST RISKY
* Given the same level of consumption, the higher the patterns of drinking score, the greater the alcohol-attributable burden of disease for the country.
ALCOHOL POLICYExcise tax on beer / wine / spirits Total ban
National legal minimum age for off-premise sales of alcoholic beverages (selling) (beer / wine / spirits) Total ban
National legal minimum age for on-premise sales of alcoholic beverages (serving) (beer / wine / spirits) Total ban
Restrictions for on-/off-premise sales of alcoholic beverages:Time (hours and days) / location (places and density) Total banSpecifi c events / intoxicated persons / petrol stations Total ban
National maximum legal blood alcohol concentration (BAC) when driving a vehicle (general / young / professional), in % ZT / ZT / ZT
Legally binding regulations on alcohol advertising / product placement Total ban
Legally binding regulations on alcohol sponsorship / sales promotion Total ban
ZT = Zero tolerance.
HEALTH CONSEQUENCES
MORBIDITY
Prevalence estimates (12-month prevalence for 2004): Males Females
Alcohol use disorders (15+ years) 0.18% 0.02%
ALL CAUSE MORTALITY
Age-standardized deaths rates, 15+ years (per 100,000 population)
2000 2001 2002 2003 2004 2005
M F M F M F M F M F M F
Liver cirrhosisNo information availableRoad traffi c
accidents (1)
Data source: WHO Mortality Database, data as reported by countries (1) refer to transport accidents.
RECORDED ADULT (15+) ALCOHOL CONSUMPTION BY TYPE OF ALCOHOLIC BEVERAGE (IN % OF PURE ALCOHOL), 2005
Beer includes malt beers. Wine includes wine made from grapes. Spirits include all distilled beverages. Other includes one or several other alcoholic beverages, such as fermented beverages made from sorghum, maize, millet, rice, or cider, fruit wine, fortifi ed wine, etc.
Adult (15+) per capita consumption, average 2003–2005 (in litres of pure alcohol):
Recorded 0.00
Unrecorded 0.02
Total 0.02
WHO Eastern Mediterranean Region 0.67
Afghanistan
Total population: 26 088 000 ➤ Population 15+ years: 53% ➤ Population in urban areas: 23% ➤ Income group (World Bank): Low income
Data source: United Nations, data range 1990–2006.
SOCIOECONOMIC CONTEXT
Robust estimate of fi ve-year change in recorded adult(15+) per capita consumption,2001–2005:
INCREASE
➤ STABLE DECREASE
INCONCLUSIVE
ALMOST ZERO CONSUMPTION. APPEARS TO BE ALL SPIRITS.
2000 2002 2004
Litre
s of
pur
e al
coho
l
ENLARGEMENT OF RECORDED ADULT (15+) PER CAPITA CONSUMPTION, 2000–2005
Year
2003 20052001
ALCOHOL CONSUMPTION Population data (refer to the population 15 years and older and are in litres of pure alcohol).
1961 1966 1976
Litre
s of
pur
e al
coho
l
1991
RECORDED ADULT (15+) PER CAPITA CONSUMPTION, 1961–2005
Year
1971 1981 200119961986 2006
Change in data source from 2000
Beer Wine Spirits Total
0.01
15
5
10
20
0.02
0
0

2
PATTERNS OF DRINKING
ABSTAINERS (15+ years), 2005
Males Females Total
Lifetime abstainers
No information availableFormer drinkers
Abstainers*
* Persons who did not drink in the past 12 months.
DRINKERS ONLY
Adult (15+ years) per capita consumption*, total —
Adult (15+ years) per capita consumption*, males —
Adult (15+ years) per capita consumption*, females —
Heavy episodic drinkers** (15–85+ years), males —
Heavy episodic drinkers** (15–85+ years), females —
* (Recorded + unrecorded – tourist) in litres of pure alcohol, average 2003–2005.** Had at least 60 grams or more of pure alcohol on at least one occasion weekly.
PATTERNS OF DRINKING SCORE
Patterns of drinking score* LEAST RISKY No information available MOST RISKY
* Given the same level of consumption, the higher the patterns of drinking score, the greater the alcohol-attributable burden of disease for the country.
ALCOHOL POLICYExcise tax on beer / wine / spirits NA
National legal minimum age for off-premise sales of alcoholic beverages (selling) (beer / wine / spirits) NA
National legal minimum age for on-premise sales of alcoholic beverages (serving) (beer / wine / spirits) NA
Restrictions for on-/off-premise sales of alcoholic beverages:Time (hours and days) / location (places and density) NASpecifi c events / intoxicated persons / petrol stations NA
National maximum legal blood alcohol concentration (BAC) when driving a vehicle (general / young / professional), in % ZT / ZT / ZT
Legally binding regulations on alcohol advertising / product placement NA
Legally binding regulations on alcohol sponsorship / sales promotion NA
NA = No information.ZT = Zero tolerance.
HEALTH CONSEQUENCES
MORBIDITY
Prevalence estimates (12-month prevalence for 2004): Males Females
Alcohol use disorders (15+ years) 2.18% 0.00%
ALL CAUSE MORTALITY
Age-standardized deaths rates, 15+ years (per 100,000 population)
2000 2001 2002 2003 2004 2005
M F M F M F M F M F M F
Liver cirrhosis 10.1 4.1 10.6 3.6 — — — — — — — —
Road traffi c accidents (1)
20.1 2.0 20.7 3.7 — — — — — — — —
Data source: WHO Mortality Database, data as reported by countries (1) refer to transport accidents.
52%BEER
34%SPIRITS
RECORDED ADULT (15+) ALCOHOL CONSUMPTION BY TYPE OF ALCOHOLIC BEVERAGE (IN % OF PURE ALCOHOL), 2005
Beer includes malt beers. Wine includes wine made from grapes. Spirits include all distilled beverages. Other includes one or several other alcoholic beverages, such as fermented beverages made from sorghum, maize, millet, rice, or cider, fruit wine, fortifi ed wine, etc.
Adult (15+) per capita consumption, average 2003–2005 (in litres of pure alcohol):
Recorded 3.56
Unrecorded 0.10
Total 3.66
WHO Eastern Mediterranean Region 0.67
Bahrain
Total population: 739 000 ➤ Population 15+ years: 74% ➤ Population in urban areas: 97% ➤ Income group (World Bank): High income
Data source: United Nations, data range 1990–2006.
SOCIOECONOMIC CONTEXT
Robust estimate of fi ve-year change in recorded adult(15+) per capita consumption,2001–2005:
INCREASE
➤ STABLE DECREASE
INCONCLUSIVE
5
3
2000 2002 2004
Litre
s of
pur
e al
coho
lENLARGEMENT OF RECORDED ADULT (15+) PER CAPITA CONSUMPTION, 2000–2005
Year
2003 20052001
ALCOHOL CONSUMPTION Population data (refer to the population 15 years and older and are in litres of pure alcohol).
1961 1966 1976Li
tres
of p
ure
alco
hol
1991
RECORDED ADULT (15+) PER CAPITA CONSUMPTION, 1961–2005
Year
1971 1981 200119961986 2006
Change in data source from 2000
Beer Wine Spirits Other Total
4
2
1
15
5
10
20
0
0
14%WINE

3
PATTERNS OF DRINKING
ABSTAINERS (15+ years), 2005
Males Females Total
Lifetime abstainers
No information availableFormer drinkers
Abstainers*
* Persons who did not drink in the past 12 months.
DRINKERS ONLY
Adult (15+ years) per capita consumption*, total —
Adult (15+ years) per capita consumption*, males —
Adult (15+ years) per capita consumption*, females —
Heavy episodic drinkers** (15–85+ years), males —
Heavy episodic drinkers** (15–85+ years), females —
* (Recorded + unrecorded – tourist) in litres of pure alcohol, average 2003–2005.** Had at least 60 grams or more of pure alcohol on at least one occasion weekly.
PATTERNS OF DRINKING SCORE
Patterns of drinking score* LEAST RISKY 1 2 3 4 5 MOST RISKY
* Given the same level of consumption, the higher the patterns of drinking score, the greater the alcohol-attributable burden of disease for the country.
HEALTH CONSEQUENCES
MORBIDITY
Prevalence estimates (12-month prevalence for 2004): Males Females
Alcohol use disorders (15+ years) 0.75% 0.08%
ALL CAUSE MORTALITY
Age-standardized deaths rates, 15+ years (per 100,000 population)
2000 2001 2002 2003 2004 2005
M F M F M F M F M F M F
Liver cirrhosisNo information availableRoad traffi c
accidents (1)
Data source: WHO Mortality Database, data as reported by countries (1) refer to transport accidents.
14%BEER
81%SPIRITS
5%WINE
RECORDED ADULT (15+) ALCOHOL CONSUMPTION BY TYPE OF ALCOHOLIC BEVERAGE (IN % OF PURE ALCOHOL), 2005
Beer includes malt beers. Wine includes wine made from grapes. Spirits include all distilled beverages. Other includes one or several other alcoholic beverages, such as fermented beverages made from sorghum, maize, millet, rice, or cider, fruit wine, fortifi ed wine, etc.
Adult (15+) per capita consumption, average 2003–2005 (in litres of pure alcohol):
Recorded 1.37
Unrecorded 0.50
Total 1.87
WHO Eastern Mediterranean Region 0.67
Djibouti
Total population: 819 000 ➤ Population 15+ years: 62% ➤ Population in urban areas: 87% ➤ Income group (World Bank): Lower-middle income
Data source: United Nations, data range 1990–2006.
SOCIOECONOMIC CONTEXT
Robust estimate of fi ve-year change in recorded adult(15+) per capita consumption,2001–2005:
➤ INCREASE STABLE
DECREASE
INCONCLUSIVE
2.0
2000 2002 2004
Litre
s of
pur
e al
coho
l
ENLARGEMENT OF RECORDED ADULT (15+) PER CAPITA CONSUMPTION, 2000–2005
Year
2003 20052001
ALCOHOL CONSUMPTION Population data (refer to the population 15 years and older and are in litres of pure alcohol).
1961 1966 1976
Litre
s of
pur
e al
coho
l
1991
RECORDED ADULT (15+) PER CAPITA CONSUMPTION, 1961–2005
Year
1971 1981 200119961986 2006
Change in data source from 2000
Beer Wine Spirits Total
1.0
1.5
0.5
15
5
10
20
0
0
ALCOHOL POLICYExcise tax on beer / wine / spirits Yes / No / Yes
National legal minimum age for off-premise sales of alcoholic beverages (selling) (beer / wine / spirits) 16 / 16 / 18
National legal minimum age for on-premise sales of alcoholic beverages (serving) (beer / wine / spirits) 16 / 16 / 18
Restrictions for on-/off-premise sales of alcoholic beverages:Time (hours and days) / location (places and density) Yes / NoSpecifi c events / intoxicated persons / petrol stations Yes / No / No
National maximum legal blood alcohol concentration (BAC) when driving a vehicle (general / young / professional), in % 0.05 / 0.05 / 0.05
Legally binding regulations on alcohol advertising / product placement Yes / Yes
Legally binding regulations on alcohol sponsorship / sales promotion Yes / Yes
No information available

4
PATTERNS OF DRINKING
ABSTAINERS (15+ years), 2008
Males Females Total
Lifetime abstainers 60.2% 90.5% 75.5%
Former drinkers 37.8% 9.3% 23.4%
Abstainers* 98.0% 99.8% 98.9%
* Persons who did not drink in the past 12 months.
DRINKERS ONLY
Adult (15+ years) per capita consumption*, total 33.64
Adult (15+ years) per capita consumption*, males 35.23
Adult (15+ years) per capita consumption*, females 18.20
Heavy episodic drinkers** (15–85+ years), males —
Heavy episodic drinkers** (15–85+ years), females —
* (Recorded + unrecorded) in litres of pure alcohol, average 2003–2005.** Had at least 60 grams or more of pure alcohol on at least one occasion weekly.
PATTERNS OF DRINKING SCORE
Patterns of drinking score* LEAST RISKY 1 2 3 4 5 MOST RISKY
* Given the same level of consumption, the higher the patterns of drinking score, the greater the alcohol-attributable burden of disease for the country.
ALCOHOL POLICYExcise tax on beer / wine / spirits Yes / Yes / Yes
National legal minimum age for off-premise sales of alcoholic beverages (selling) (beer / wine / spirits) 18 / 18 / 18
National legal minimum age for on-premise sales of alcoholic beverages (serving) (beer / wine / spirits) 18 / 18 / 18
Restrictions for on-/off-premise sales of alcoholic beverages:Time (hours and days) / location (places and density) No / YesSpecifi c events / intoxicated persons / petrol stations No / No / No
National maximum legal blood alcohol concentration (BAC) when driving a vehicle (general / young / professional), in % ZT / ZT / ZT
Legally binding regulations on alcohol advertising / product placement No / No
Legally binding regulations on alcohol sponsorship / sales promotion No / No
ZT = Zero tolerance.
HEALTH CONSEQUENCES
MORBIDITY
Prevalence estimates (12-month prevalence for 2004): Males Females
Alcohol use disorders (15+ years) 0.44% 0.00%
ALL CAUSE MORTALITY
Age-standardized deaths rates, 15+ years (per 100,000 population)
2000 2001 2002 2003 2004 2005
M F M F M F M F M F M F
Liver cirrhosis 63.1 33.2 — — — — — — — — — —
Road traffi c accidents (1)
12.7 2.8 — — — — — — — — — —
Data source: WHO Mortality Database, data as reported by countries (1) refer to transport accidents.
56%BEER
33%SPIRITS
RECORDED ADULT (15+) ALCOHOL CONSUMPTION BY TYPE OF ALCOHOLIC BEVERAGE (IN % OF PURE ALCOHOL), 2005
Beer includes malt beers. Wine includes wine made from grapes. Spirits include all distilled beverages. Other includes one or several other alcoholic beverages, such as fermented beverages made from sorghum, maize, millet, rice, or cider, fruit wine, fortifi ed wine, etc.
Adult (15+) per capita consumption, average 2003–2005 (in litres of pure alcohol):
Recorded 0.27
Unrecorded 0.10
Total 0.37
WHO Eastern Mediterranean Region 0.67
Egypt
Total population: 74 166 000 ➤ Population 15+ years: 67% ➤ Population in urban areas: 43% ➤ Income group (World Bank): Lower-middle income
Data source: United Nations, data range 1990–2006.
SOCIOECONOMIC CONTEXT
Robust estimate of fi ve-year change in recorded adult(15+) per capita consumption,2001–2005:
INCREASE
➤ STABLE DECREASE
INCONCLUSIVE
11%WINE
0.4
0.3
2000 2002 2004
Litre
s of
pur
e al
coho
lENLARGEMENT OF RECORDED ADULT (15+) PER CAPITA CONSUMPTION, 2000–2005
Year
2003 20052001
ALCOHOL CONSUMPTION Population data (refer to the population 15 years and older and are in litres of pure alcohol).
1961 1966 1976Li
tres
of p
ure
alco
hol
1991
RECORDED ADULT (15+) PER CAPITA CONSUMPTION, 1961–2005
Year
1971 1981 200119961986 2006
Change in data source from 2000
Beer Wine Spirits Total
0.2
0.1
15
5
10
20
0
0

5
No information available
PATTERNS OF DRINKING
ABSTAINERS (15+ years), 2005
Males Females Total
Lifetime abstainers
No information availableFormer drinkers
Abstainers*
* Persons who did not drink in the past 12 months.
DRINKERS ONLY
Adult (15+ years) per capita consumption*, total —
Adult (15+ years) per capita consumption*, males —
Adult (15+ years) per capita consumption*, females —
Heavy episodic drinkers** (15–85+ years), males —
Heavy episodic drinkers** (15–85+ years), females —
* (Recorded + unrecorded – tourist) in litres of pure alcohol, average 2003–2005.** Had at least 60 grams or more of pure alcohol on at least one occasion weekly.
PATTERNS OF DRINKING SCORE
Patterns of drinking score* LEAST RISKY 1 2 3 4 5 MOST RISKY
* Given the same level of consumption, the higher the patterns of drinking score, the greater the alcohol-attributable burden of disease for the country.
ALCOHOL POLICYExcise tax on beer / wine / spirits Total ban
National legal minimum age for off-premise sales of alcoholic beverages (selling) (beer / wine / spirits) Total ban
National legal minimum age for on-premise sales of alcoholic beverages (serving) (beer / wine / spirits) Total ban
Restrictions for on-/off-premise sales of alcoholic beverages:Time (hours and days) / location (places and density) Total banSpecifi c events / intoxicated persons / petrol stations Total ban
National maximum legal blood alcohol concentration (BAC) when driving a vehicle (general / young / professional), in % ZT / ZT / ZT
Legally binding regulations on alcohol advertising / product placement Total ban
Legally binding regulations on alcohol sponsorship / sales promotion Total ban
ZT = Zero tolerance.
HEALTH CONSEQUENCES
MORBIDITY
Prevalence estimates (12-month prevalence for 2004): Males Females
Alcohol use disorders (15+ years) 0.50% 0.00%
ALL CAUSE MORTALITY
Age-standardized deaths rates, 15+ years (per 100,000 population)
2000 2001 2002 2003 2004 2005
M F M F M F M F M F M F
Liver cirrhosisNo information availableRoad traffi c
accidents (1)
Data source: WHO Mortality Database, data as reported by countries (1) refer to transport accidents.
RECORDED ADULT (15+) ALCOHOL CONSUMPTION BY TYPE OF ALCOHOLIC BEVERAGE (IN % OF PURE ALCOHOL), 2005
Beer includes malt beers. Wine includes wine made from grapes. Spirits include all distilled beverages. Other includes one or several other alcoholic beverages, such as fermented beverages made from sorghum, maize, millet, rice, or cider, fruit wine, fortifi ed wine, etc.
Adult (15+) per capita consumption, average 2003–2005 (in litres of pure alcohol):
Recorded 0.02
Unrecorded 1.00
Total 1.02
WHO Eastern Mediterranean Region 0.67
I ran (Islamic Republic of)
Total population: 70 270 000 ➤ Population 15+ years: 72% ➤ Population in urban areas: 67% ➤ Income group (World Bank): Lower-middle income
Data source: United Nations, data range 1990–2006.
SOCIOECONOMIC CONTEXT
Robust estimate of fi ve-year change in recorded adult(15+) per capita consumption,2001–2005:
INCREASE
➤ STABLE DECREASE
INCONCLUSIVE
15
5
10
2000 2002 2004
Litre
s of
pur
e al
coho
l
2006
ENLARGEMENT OF RECORDED ADULT (15+) PER CAPITA CONSUMPTION, 2000–2007
Year
2003 2005 20070
2001
No information available
ALCOHOL CONSUMPTION Population data (refer to the population 15 years and older and are in litres of pure alcohol).
1961 1966 1976
Litre
s of
pur
e al
coho
l
1991
RECORDED ADULT (15+) PER CAPITA CONSUMPTION, 1961–2005
Year
1971 1981 200119961986 2006
Change in data source from 2000
Beer Wine Spirits Total
15
5
10
20
0

6
PATTERNS OF DRINKING
ABSTAINERS (15+ years), 2007
Males Females Total
Lifetime abstainers 93.2% 99.4% 96.3%
Former drinkers 3.9% 0.2% 2.0%
Abstainers* 97.1% 99.6% 98.3%
* Persons who did not drink in the past 12 months.
DRINKERS ONLY
Adult (15+ years) per capita consumption*, total 24.02
Adult (15+ years) per capita consumption*, males 25.29
Adult (15+ years) per capita consumption*, females 14.81
Heavy episodic drinkers** (15–85+ years), males —
Heavy episodic drinkers** (15–85+ years), females —
* (Recorded + unrecorded) in litres of pure alcohol, average 2003–2005.** Had at least 60 grams or more of pure alcohol on at least one occasion weekly.
PATTERNS OF DRINKING SCORE
Patterns of drinking score* LEAST RISKY No information available MOST RISKY
* Given the same level of consumption, the higher the patterns of drinking score, the greater the alcohol-attributable burden of disease for the country.
ALCOHOL POLICYExcise tax on beer / wine / spirits Yes / Yes / Yes
National legal minimum age for off-premise sales of alcoholic beverages (selling) (beer / wine / spirits) 18 / 18 / 18
National legal minimum age for on-premise sales of alcoholic beverages (serving) (beer / wine / spirits) 18 / 18 / 18
Restrictions for on-/off-premise sales of alcoholic beverages:Time (hours and days) / location (places and density) No & Yes / YesSpecifi c events / intoxicated persons / petrol stations Yes / NA / Yes
National maximum legal blood alcohol concentration (BAC) when driving a vehicle (general / young / professional), in % 0.08 / 0.08 / 0.08
Legally binding regulations on alcohol advertising / product placement No / No
Legally binding regulations on alcohol sponsorship / sales promotion Yes / Yes
NA = No information.
HEALTH CONSEQUENCES
MORBIDITY
Prevalence estimates (12-month prevalence for 2004): Males Females
Alcohol use disorders (15+ years) 0.19% 0.00%
ALL CAUSE MORTALITY
Age-standardized deaths rates, 15+ years (per 100,000 population)
2000 2001 2002 2003 2004 2005
M F M F M F M F M F M F
Liver cirrhosisNo information availableRoad traffi c
accidents (1)
Data source: WHO Mortality Database, data as reported by countries (1) refer to transport accidents.
67%BEER
<1%WINE
RECORDED ADULT (15+) ALCOHOL CONSUMPTION BY TYPE OF ALCOHOLIC BEVERAGE (IN % OF PURE ALCOHOL), 2005
Beer includes malt beers. Wine includes wine made from grapes. Spirits include all distilled beverages. Other includes one or several other alcoholic beverages, such as fermented beverages made from sorghum, maize, millet, rice, or cider, fruit wine, fortifi ed wine, etc.
Adult (15+) per capita consumption, average 2003–2005 (in litres of pure alcohol):
Recorded 0.20
Unrecorded 0.20
Total 0.40
WHO Eastern Mediterranean Region 0.67
I raq
Total population: 28 506 000 ➤ Population 15+ years: 59% ➤ Population in urban areas: 67% ➤ Income group (World Bank): Lower-middle income
Data source: United Nations, data range 1990–2006.
SOCIOECONOMIC CONTEXT
Robust estimate of fi ve-year change in recorded adult(15+) per capita consumption,2001–2005:
➤ INCREASE STABLE
DECREASE
INCONCLUSIVE
33%SPIRITS
0.3
2000 2002 2004
Litre
s of
pur
e al
coho
lENLARGEMENT OF RECORDED ADULT (15+) PER CAPITA CONSUMPTION, 2000–2005
Year
2003 20052001
ALCOHOL CONSUMPTION Population data (refer to the population 15 years and older and are in litres of pure alcohol).
1961 1966 1976Li
tres
of p
ure
alco
hol
1991
RECORDED ADULT (15+) PER CAPITA CONSUMPTION, 1961–2005
Year
1971 1981 200119961986 2006
Change in data source from 2000
Beer Wine Spirits Total
0.2
0.1
15
5
10
20
0
0

7
PATTERNS OF DRINKING
ABSTAINERS (15+ years), 2005
Males Females Total
Lifetime abstainers
No information availableFormer drinkers
Abstainers*
* Persons who did not drink in the past 12 months.
DRINKERS ONLY
Adult (15+ years) per capita consumption*, total —
Adult (15+ years) per capita consumption*, males —
Adult (15+ years) per capita consumption*, females —
Heavy episodic drinkers** (15–85+ years), males —
Heavy episodic drinkers** (15–85+ years), females —
* (Recorded + unrecorded – tourist) in litres of pure alcohol, average 2003–2005.** Had at least 60 grams or more of pure alcohol on at least one occasion weekly.
PATTERNS OF DRINKING SCORE
Patterns of drinking score* LEAST RISKY 1 2 3 4 5 MOST RISKY
* Given the same level of consumption, the higher the patterns of drinking score, the greater the alcohol-attributable burden of disease for the country.
ALCOHOL POLICYExcise tax on beer / wine / spirits Yes / Yes / Yes
National legal minimum age for off-premise sales of alcoholic beverages (selling) (beer / wine / spirits) 18 / 18 / 18
National legal minimum age for on-premise sales of alcoholic beverages (serving) (beer / wine / spirits) 18 / 18 / 18
Restrictions for on-/off-premise sales of alcoholic beverages:Time (hours and days) / location (places and density) Yes / YesSpecifi c events / intoxicated persons / petrol stations Yes / Yes / Yes
National maximum legal blood alcohol concentration (BAC) when driving a vehicle (general / young / professional), in % 0.08 / 0.08 / 0.08
Legally binding regulations on alcohol advertising / product placement Yes / Yes
Legally binding regulations on alcohol sponsorship / sales promotion Yes / Yes
HEALTH CONSEQUENCES
MORBIDITY
Prevalence estimates (12-month prevalence for 2004): Males Females
Alcohol use disorders (15+ years) 0.32% 0.00%
ALL CAUSE MORTALITY
Age-standardized deaths rates, 15+ years (per 100,000 population)
2000 2001 2002 2003 2004 2005
M F M F M F M F M F M F
Liver cirrhosisNo information availableRoad traffi c
accidents (1)
Data source: WHO Mortality Database, data as reported by countries (1) refer to transport accidents.
10%BEER
85%SPIRITS
2%OTHER
RECORDED ADULT (15+) ALCOHOL CONSUMPTION BY TYPE OF ALCOHOLIC BEVERAGE (IN % OF PURE ALCOHOL), 2005
Beer includes malt beers. Wine includes wine made from grapes. Spirits include all distilled beverages. Other includes one or several other alcoholic beverages, such as fermented beverages made from sorghum, maize, millet, rice, or cider, fruit wine, fortifi ed wine, etc.
Adult (15+) per capita consumption, average 2003–2005 (in litres of pure alcohol):
Recorded 0.41
Unrecorded 0.30
Total 0.71
WHO Eastern Mediterranean Region 0.67
Jordan
Total population: 5 729 000 ➤ Population 15+ years: 63% ➤ Population in urban areas: 83% ➤ Income group (World Bank): Lower-middle income
Data source: United Nations, data range 1990–2006.
SOCIOECONOMIC CONTEXT
Robust estimate of fi ve-year change in recorded adult(15+) per capita consumption,2001–2005:
INCREASE
➤ STABLE DECREASE
INCONCLUSIVE
3%WINE
0.6
2000 2002 2004
Litre
s of
pur
e al
coho
l
ENLARGEMENT OF RECORDED ADULT (15+) PER CAPITA CONSUMPTION, 2000–2005
Year
2003 20052001
ALCOHOL CONSUMPTION Population data (refer to the population 15 years and older and are in litres of pure alcohol).
1961 1966 1976
Litre
s of
pur
e al
coho
l
1991
RECORDED ADULT (15+) PER CAPITA CONSUMPTION, 1961–2005
Year
1971 1981 200119961986 2006
Change in data source from 2000
Beer Wine Spirits Other Total
0.2
0.4
15
5
10
20
0
0

8
PATTERNS OF DRINKING
ABSTAINERS (15+ years), 2006
Males Females Total
Lifetime abstainers 77.0% 90.6% 82.0%
Former drinkers 17.9% 9.3% 14.7%
Abstainers* 94.9% 99.9% 96.7%
* Persons who did not drink in the past 12 months.
DRINKERS ONLY
Adult (15+ years) per capita consumption*, total 3.12
Adult (15+ years) per capita consumption*, males 3.15
Adult (15+ years) per capita consumption*, females 1.89
Heavy episodic drinkers** (15–85+ years), males, 2006 12.8%
Heavy episodic drinkers** (15–85+ years), females, 2006 0.0%
* (Recorded + unrecorded) in litres of pure alcohol, average 2003–2005.** Had at least 60 grams or more of pure alcohol on at least one occasion weekly.
PATTERNS OF DRINKING SCORE
Patterns of drinking score* LEAST RISKY 1 2 3 4 5 MOST RISKY
* Given the same level of consumption, the higher the patterns of drinking score, the greater the alcohol-attributable burden of disease for the country.
ALCOHOL POLICYExcise tax on beer / wine / spirits NA
National legal minimum age for off-premise sales of alcoholic beverages (selling) (beer / wine / spirits) NA
National legal minimum age for on-premise sales of alcoholic beverages (serving) (beer / wine / spirits) NA
Restrictions for on-/off-premise sales of alcoholic beverages:Time (hours and days) / location (places and density) NASpecifi c events / intoxicated persons / petrol stations NA
National maximum legal blood alcohol concentration (BAC) when driving a vehicle (general / young / professional), in % ZT / ZT / ZT
Legally binding regulations on alcohol advertising / product placement NA
Legally binding regulations on alcohol sponsorship / sales promotion NA
NA = No information.ZT = Zero tolerance.
HEALTH CONSEQUENCES
MORBIDITY
Prevalence estimates (12-month prevalence for 2004): Males Females
Alcohol use disorders (15+ years) 0.07% 0.00%
ALL CAUSE MORTALITY
Age-standardized deaths rates, 15+ years (per 100,000 population)
2000 2001 2002 2003 2004 2005
M F M F M F M F M F M F
Liver cirrhosis 7.8 3.3 7.4 4.5 4.0 5.2 — — — — — —
Road traffi c accidents (1)
41.4 13.1 34.0 6.9 31.9 9.8 — — — — — —
Data source: WHO Mortality Database, data as reported by countries (1) refer to transport accidents.
RECORDED ADULT (15+) ALCOHOL CONSUMPTION BY TYPE OF ALCOHOLIC BEVERAGE (IN % OF PURE ALCOHOL), 2005
Beer includes malt beers. Wine includes wine made from grapes. Spirits include all distilled beverages. Other includes one or several other alcoholic beverages, such as fermented beverages made from sorghum, maize, millet, rice, or cider, fruit wine, fortifi ed wine, etc.
Adult (15+) per capita consumption, average 2003–2005 (in litres of pure alcohol):
Recorded 0.00
Unrecorded 0.10
Total 0.10
WHO Eastern Mediterranean Region 0.67
Kuwait
Total population: 2 779 000 ➤ Population 15+ years: 76% ➤ Population in urban areas: 96% ➤ Income group (World Bank): High income
Data source: United Nations, data range 1990–2006.
SOCIOECONOMIC CONTEXT
Robust estimate of fi ve-year change in recorded adult(15+) per capita consumption,2001–2005:
INCREASE
➤ STABLE DECREASE
INCONCLUSIVE
Li
tres
of p
ure
alco
hol
ENLARGEMENT OF RECORDED ADULT (15+) PER CAPITA CONSUMPTION, 2000–2005
0.01
0.02
2000 2002 2004
Year
2003 20052001
ALCOHOL CONSUMPTION Population data (refer to the population 15 years and older and are in litres of pure alcohol).
1961 1966 1976Li
tres
of p
ure
alco
hol
1991
RECORDED ADULT (15+) PER CAPITA CONSUMPTION, 1961–2005
Year
1971 1981 200119961986 2006
Change in data source from 2000
Beer Wine Spirits Total
15
5
10
20
0
0
ALMOST ZERO CONSUMPTION. APPEARS TO BE ALL BEER.
9
PATTERNS OF DRINKING
ABSTAINERS (15+ years), 2003
Males Females Total
Lifetime abstainers 31.6% 54.2% 43.3%
Former drinkers 6.5% 1.3% 3.8%
Abstainers* 38.1% 55.5% 47.1%
* Persons who did not drink in the past 12 months.
DRINKERS ONLY
Adult (15+ years) per capita consumption*, total 4.22
Adult (15+ years) per capita consumption*, males 6.19
Adult (15+ years) per capita consumption*, females 1.59
Heavy episodic drinkers** (15–85+ years), males —
Heavy episodic drinkers** (15–85+ years), females —
* (Recorded + unrecorded) in litres of pure alcohol, average 2003–2005.** Had at least 60 grams or more of pure alcohol on at least one occasion weekly.
PATTERNS OF DRINKING SCORE
Patterns of drinking score* LEAST RISKY 1 2 3 4 5 MOST RISKY
* Given the same level of consumption, the higher the patterns of drinking score, the greater the alcohol-attributable burden of disease for the country.
ALCOHOL POLICYExcise tax on beer / wine / spirits NA
National legal minimum age for off-premise sales of alcoholic beverages (selling) (beer / wine / spirits) NA
National legal minimum age for on-premise sales of alcoholic beverages (serving) (beer / wine / spirits) NA
Restrictions for on-/off-premise sales of alcoholic beverages:Time (hours and days) / location (places and density) NASpecifi c events / intoxicated persons / petrol stations NA
National maximum legal blood alcohol concentration (BAC) when driving a vehicle (general / young / professional), in % 0.05 / 0.05 / 0.05
Legally binding regulations on alcohol advertising / product placement NA
Legally binding regulations on alcohol sponsorship / sales promotion NA
NA = No information.
HEALTH CONSEQUENCES
MORBIDITY
Prevalence estimates (12-month prevalence for 2004): Males Females
Alcohol use disorders (15+ years) 0.69% 0.00%
ALL CAUSE MORTALITY
Age-standardized deaths rates, 15+ years (per 100,000 population)
2000 2001 2002 2003 2004 2005
M F M F M F M F M F M F
Liver cirrhosisNo information availableRoad traffi c
accidents (1)
Data source: WHO Mortality Database, data as reported by countries (1) refer to transport accidents.
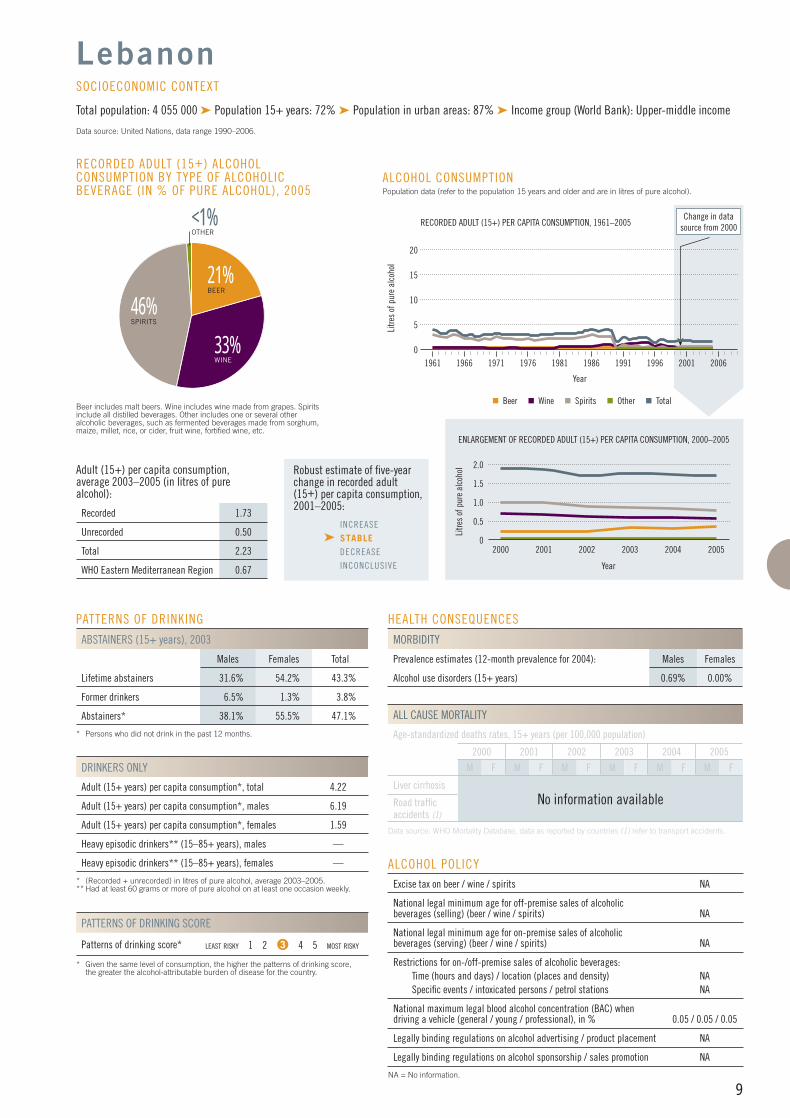
21%BEER
46%SPIRITS
33%WINE
RECORDED ADULT (15+) ALCOHOL CONSUMPTION BY TYPE OF ALCOHOLIC BEVERAGE (IN % OF PURE ALCOHOL), 2005
Beer includes malt beers. Wine includes wine made from grapes. Spirits include all distilled beverages. Other includes one or several other alcoholic beverages, such as fermented beverages made from sorghum, maize, millet, rice, or cider, fruit wine, fortifi ed wine, etc.
Adult (15+) per capita consumption, average 2003–2005 (in litres of pure alcohol):
Recorded 1.73
Unrecorded 0.50
Total 2.23
WHO Eastern Mediterranean Region 0.67
Lebanon
Total population: 4 055 000 ➤ Population 15+ years: 72% ➤ Population in urban areas: 87% ➤ Income group (World Bank): Upper-middle income
Data source: United Nations, data range 1990–2006.
SOCIOECONOMIC CONTEXT
Robust estimate of fi ve-year change in recorded adult(15+) per capita consumption,2001–2005:
INCREASE
➤ STABLE DECREASE
INCONCLUSIVE
<1%OTHER
2.0
2000 2002 2004
Litre
s of
pur
e al
coho
l
ENLARGEMENT OF RECORDED ADULT (15+) PER CAPITA CONSUMPTION, 2000–2005
Year
2003 20052001
ALCOHOL CONSUMPTION Population data (refer to the population 15 years and older and are in litres of pure alcohol).
1961 1966 1976
Litre
s of
pur
e al
coho
l
1991
RECORDED ADULT (15+) PER CAPITA CONSUMPTION, 1961–2005
Year
1971 1981 200119961986 2006
Change in data source from 2000
Beer Wine Spirits Other Total
1.0
1.5
0.5
15
5
10
20
0
0

10
PATTERNS OF DRINKING
ABSTAINERS (15+ years), 2005
Males Females Total
Lifetime abstainers
No information availableFormer drinkers
Abstainers*
* Persons who did not drink in the past 12 months.
DRINKERS ONLY
Adult (15+ years) per capita consumption*, total —
Adult (15+ years) per capita consumption*, males —
Adult (15+ years) per capita consumption*, females —
Heavy episodic drinkers** (15–85+ years), males —
Heavy episodic drinkers** (15–85+ years), females —
* (Recorded + unrecorded – tourist) in litres of pure alcohol, average 2003–2005.** Had at least 60 grams or more of pure alcohol on at least one occasion weekly.
PATTERNS OF DRINKING SCORE
Patterns of drinking score* LEAST RISKY No information available MOST RISKY
* Given the same level of consumption, the higher the patterns of drinking score, the greater the alcohol-attributable burden of disease for the country.
HEALTH CONSEQUENCES
MORBIDITY
Prevalence estimates (12-month prevalence for 2004): Males Females
Alcohol use disorders (15+ years) 0.05% 0.00%
ALL CAUSE MORTALITY
Age-standardized deaths rates, 15+ years (per 100,000 population)
2000 2001 2002 2003 2004 2005
M F M F M F M F M F M F
Liver cirrhosisNo information availableRoad traffi c
accidents (1)
Data source: WHO Mortality Database, data as reported by countries (1) refer to transport accidents.
RECORDED ADULT (15+) ALCOHOL CONSUMPTION BY TYPE OF ALCOHOLIC BEVERAGE (IN % OF PURE ALCOHOL), 2005
Beer includes malt beers. Wine includes wine made from grapes. Spirits include all distilled beverages. Other includes one or several other alcoholic beverages, such as fermented beverages made from sorghum, maize, millet, rice, or cider, fruit wine, fortifi ed wine, etc.
Adult (15+) per capita consumption, average 2003–2005 (in litres of pure alcohol):
Recorded 0.01
Unrecorded 0.10
Total 0.11
WHO Eastern Mediterranean Region 0.67
Libyan Arab Jamahir iya (the)
Total population: 6 039 000 ➤ Population 15+ years: 70% ➤ Population in urban areas: 85% ➤ Income group (World Bank): Upper-middle income
Data source: United Nations, data range 1990–2006.
SOCIOECONOMIC CONTEXT
Robust estimate of fi ve-year change in recorded adult(15+) per capita consumption,2001–2005:
INCREASE
➤ STABLE DECREASE
INCONCLUSIVE
2000 2002 2004
Litre
s of
pur
e al
coho
lENLARGEMENT OF RECORDED ADULT (15+) PER CAPITA CONSUMPTION, 2000–2005
Year
2003 20052001
ALCOHOL CONSUMPTION Population data (refer to the population 15 years and older and are in litres of pure alcohol).
1961 1966 1976Li
tres
of p
ure
alco
hol
1991
RECORDED ADULT (15+) PER CAPITA CONSUMPTION, 1961–2005
Year
1971 1981 200119961986 2006
Change in data source from 2000
Beer Wine Spirits Other Total
15
5
10
20
0.02
0.01
0
0
ALMOST ZERO CONSUMPTION. APPEARS TO BE ALL SPIRITS.
ALCOHOL POLICYExcise tax on beer / wine / spirits Yes / No / Yes
National legal minimum age for off-premise sales of alcoholic beverages (selling) (beer / wine / spirits) 16 / 16 / 18
National legal minimum age for on-premise sales of alcoholic beverages (serving) (beer / wine / spirits) 16 / 16 / 18
Restrictions for on-/off-premise sales of alcoholic beverages:Time (hours and days) / location (places and density) Yes / NoSpecifi c events / intoxicated persons / petrol stations Yes / No / No
National maximum legal blood alcohol concentration (BAC) when driving a vehicle (general / young / professional), in % 0.05 / 0.05 / 0.05
Legally binding regulations on alcohol advertising / product placement Yes / Yes
Legally binding regulations on alcohol sponsorship / sales promotion Yes / Yes
No information available

11
PATTERNS OF DRINKING
ABSTAINERS (15+ years), 2003
Males Females Total
Lifetime abstainers 76.6% 99.7% 88.5%
Former drinkers 11.1% 0.0% 5.4%
Abstainers* 87.7% 99.7% 93.9%
* Persons who did not drink in the past 12 months.
DRINKERS ONLY
Adult (15+ years) per capita consumption*, total 23.93
Adult (15+ years) per capita consumption*, males 20.18
Adult (15+ years) per capita consumption*, females 14.23
Heavy episodic drinkers** (15–85+ years), males, 2003 12.7%
Heavy episodic drinkers** (15–85+ years), females, 2003 3.3%
* (Recorded + unrecorded) in litres of pure alcohol, average 2003–2005.** Had at least 60 grams or more of pure alcohol on at least one occasion weekly.
PATTERNS OF DRINKING SCORE
Patterns of drinking score* LEAST RISKY 1 2 3 4 5 MOST RISKY
* Given the same level of consumption, the higher the patterns of drinking score, the greater the alcohol-attributable burden of disease for the country.
ALCOHOL POLICYExcise tax on beer / wine / spirits NA
National legal minimum age for off-premise sales of alcoholic beverages (selling) (beer / wine / spirits) 20 / 20 / 20
National legal minimum age for on-premise sales of alcoholic beverages (serving) (beer / wine / spirits) 20 / 20 / 20
Restrictions for on-/off-premise sales of alcoholic beverages:Time (hours and days) / location (places and density) Yes / YesSpecifi c events / intoxicated persons / petrol stations Yes / No / Yes
National maximum legal blood alcohol concentration (BAC) when driving a vehicle (general / young / professional), in % NA
Legally binding regulations on alcohol advertising / product placement Yes / Yes
Legally binding regulations on alcohol sponsorship / sales promotion NA / No
NA = No information.
HEALTH CONSEQUENCES
MORBIDITY
Prevalence estimates (12-month prevalence for 2004): Males Females
Alcohol use disorders (15+ years) 0.79% 0.00%
ALL CAUSE MORTALITY
Age-standardized deaths rates, 15+ years (per 100,000 population)
2000 2001 2002 2003 2004 2005
M F M F M F M F M F M F
Liver cirrhosisNo information availableRoad traffi c
accidents (1)
Data source: WHO Mortality Database, data as reported by countries (1) refer to transport accidents.
50%BEER
13%SPIRITS
RECORDED ADULT (15+) ALCOHOL CONSUMPTION BY TYPE OF ALCOHOLIC BEVERAGE (IN % OF PURE ALCOHOL), 2005
Beer includes malt beers. Wine includes wine made from grapes. Spirits include all distilled beverages. Other includes one or several other alcoholic beverages, such as fermented beverages made from sorghum, maize, millet, rice, or cider, fruit wine, fortifi ed wine, etc.
Adult (15+) per capita consumption, average 2003–2005 (in litres of pure alcohol):
Recorded 0.46
Unrecorded 1.00
Total 1.46
WHO Eastern Mediterranean Region 0.67
Morocco
Total population: 30 853 000 ➤ Population 15+ years: 70% ➤ Population in urban areas: 59% ➤ Income group (World Bank): Lower-middle income
Data source: United Nations, data range 1990–2006.
SOCIOECONOMIC CONTEXT
Robust estimate of fi ve-year change in recorded adult(15+) per capita consumption,2001–2005:
INCREASE
➤ STABLE DECREASE
INCONCLUSIVE
37%WINE
0.6
2000 2002 2004
Litre
s of
pur
e al
coho
l
ENLARGEMENT OF RECORDED ADULT (15+) PER CAPITA CONSUMPTION, 2000–2005
Year
2003 20052001
ALCOHOL CONSUMPTION Population data (refer to the population 15 years and older and are in litres of pure alcohol).
1961 1966 1976
Litre
s of
pur
e al
coho
l
1991
RECORDED ADULT (15+) PER CAPITA CONSUMPTION, 1961–2005
Year
1971 1981 200119961986 2006
Change in data source from 2000
Beer Wine Spirits Total
0.4
0.2
15
5
10
20
0
0

12
PATTERNS OF DRINKING
ABSTAINERS (15+ years), 2005
Males Females Total
Lifetime abstainers
No information availableFormer drinkers
Abstainers*
* Persons who did not drink in the past 12 months.
DRINKERS ONLY
Adult (15+ years) per capita consumption*, total —
Adult (15+ years) per capita consumption*, males —
Adult (15+ years) per capita consumption*, females —
Heavy episodic drinkers** (15–85+ years), males —
Heavy episodic drinkers** (15–85+ years), females —
* (Recorded + unrecorded – tourist) in litres of pure alcohol, average 2003–2005.** Had at least 60 grams or more of pure alcohol on at least one occasion weekly.
PATTERNS OF DRINKING SCORE
Patterns of drinking score* LEAST RISKY No information available MOST RISKY
* Given the same level of consumption, the higher the patterns of drinking score, the greater the alcohol-attributable burden of disease for the country.
ALCOHOL POLICYExcise tax on beer / wine / spirits NA
National legal minimum age for off-premise sales of alcoholic beverages (selling) (beer / wine / spirits) 21/ 21 / 21
National legal minimum age for on-premise sales of alcoholic beverages (serving) (beer / wine / spirits) 21 / 21 / 21
Restrictions for on-/off-premise sales of alcoholic beverages:Time (hours and days) / location (places and density) Yes / YesSpecifi c events / intoxicated persons / petrol stations Yes / Yes / Yes
National maximum legal blood alcohol concentration (BAC) when driving a vehicle (general / young / professional), in % 0.08 / 0.08 / 0.08
Legally binding regulations on alcohol advertising / product placement Yes / Yes
Legally binding regulations on alcohol sponsorship / sales promotion Yes / Yes
NA = No information.
HEALTH CONSEQUENCES
MORBIDITY
Prevalence estimates (12-month prevalence for 2004): Males Females
Alcohol use disorders (15+ years) 0.37% 0.00%
ALL CAUSE MORTALITY
Age-standardized deaths rates, 15+ years (per 100,000 population)
2000 2001 2002 2003 2004 2005
M F M F M F M F M F M F
Liver cirrhosisNo information availableRoad traffi c
accidents (1)
Data source: WHO Mortality Database, data as reported by countries (1) refer to transport accidents.
40%BEER
2%WINE
RECORDED ADULT (15+) ALCOHOL CONSUMPTION BY TYPE OF ALCOHOLIC BEVERAGE (IN % OF PURE ALCOHOL), 2005
Beer includes malt beers. Wine includes wine made from grapes. Spirits include all distilled beverages. Other includes one or several other alcoholic beverages, such as fermented beverages made from sorghum, maize, millet, rice, or cider, fruit wine, fortifi ed wine, etc.
Adult (15+) per capita consumption, average 2003–2005 (in litres of pure alcohol):
Recorded 0.64
Unrecorded 0.30
Total 0.94
WHO Eastern Mediterranean Region 0.67
Oman
Total population: 2 546 000 ➤ Population 15+ years: 67% ➤ Population in urban areas: 71% ➤ Income group (World Bank): High income
Data source: United Nations, data range 1990–2006.
SOCIOECONOMIC CONTEXT
Robust estimate of fi ve-year change in recorded adult(15+) per capita consumption,2001–2005:
➤ INCREASE STABLE
DECREASE
INCONCLUSIVE
58%SPIRITS
2000 2002 2004
Litre
s of
pur
e al
coho
l
2006
ENLARGEMENT OF RECORDED ADULT (15+) PER CAPITA CONSUMPTION, 2000–2007
Year
2003 2005 20072001
ALCOHOL CONSUMPTION Population data (refer to the population 15 years and older and are in litres of pure alcohol).
Litre
s of
pur
e al
coho
l
RECORDED ADULT (15+) PER CAPITA CONSUMPTION, 1961–2007Change in data
source from 2000
Beer Wine Spirits Total
15
5
10
20
0.8
0.6
0.4
0.2
ALCOHOL CONSUMPTION Population data (refer to the population 15 years and older and are in litres of pure alcohol).
Litre
s of
pur
e al
coho
l1961 1966 1976 1991
Year
1971 1981 200119961986 2006
0
0

13
PATTERNS OF DRINKING
ABSTAINERS (15+ years), 2003
Males Females Total
Lifetime abstainers 99.7% 100.0% 99.8%
Former drinkers 0.0% 0.0% 0.0%
Abstainers* 99.7% 100.0% 99.8%
* Persons who did not drink in the past 12 months.
DRINKERS ONLY
Adult (15+ years) per capita consumption*, total 30.00
Adult (15+ years) per capita consumption*, males 30.38
Adult (15+ years) per capita consumption*, females 16.07
Heavy episodic drinkers** (15–85+ years), males, 2003 34.8%
Heavy episodic drinkers** (15–85+ years), females, 2003 0.0%
* (Recorded + unrecorded) in litres of pure alcohol, average 2003–2005.** Had at least 60 grams or more of pure alcohol on at least one occasion weekly.
PATTERNS OF DRINKING SCORE
Patterns of drinking score* LEAST RISKY 1 2 3 4 5 MOST RISKY
* Given the same level of consumption, the higher the patterns of drinking score, the greater the alcohol-attributable burden of disease for the country.
ALCOHOL POLICYExcise tax on beer / wine / spirits Total ban
National legal minimum age for off-premise sales of alcoholic beverages (selling) (beer / wine / spirits) Total ban
National legal minimum age for on-premise sales of alcoholic beverages (serving) (beer / wine / spirits) Total ban
Restrictions for on-/off-premise sales of alcoholic beverages:Time (hours and days) / location (places and density) Total banSpecifi c events / intoxicated persons / petrol stations Total ban
National maximum legal blood alcohol concentration (BAC) when driving a vehicle (general / young / professional), in % ZT / ZT / ZT
Legally binding regulations on alcohol advertising / product placement Total ban
Legally binding regulations on alcohol sponsorship / sales promotion Total ban
ZT = Zero tolerance.
HEALTH CONSEQUENCES
MORBIDITY
Prevalence estimates (12-month prevalence for 2004): Males Females
Alcohol use disorders (15+ years) 0.91% 0.12%
ALL CAUSE MORTALITY
Age-standardized deaths rates, 15+ years (per 100,000 population)
2000 2001 2002 2003 2004 2005
M F M F M F M F M F M F
Liver cirrhosisNo information availableRoad traffi c
accidents (1)
Data source: WHO Mortality Database, data as reported by countries (1) refer to transport accidents.
RECORDED ADULT (15+) ALCOHOL CONSUMPTION BY TYPE OF ALCOHOLIC BEVERAGE (IN % OF PURE ALCOHOL), 2005
Beer includes malt beers. Wine includes wine made from grapes. Spirits include all distilled beverages. Other includes one or several other alcoholic beverages, such as fermented beverages made from sorghum, maize, millet, rice, or cider, fruit wine, fortifi ed wine, etc.
Adult (15+) per capita consumption, average 2003–2005 (in litres of pure alcohol):
Recorded 0.01
Unrecorded 0.05
Total 0.06
WHO Eastern Mediterranean Region 0.67
Pakistan
Total population: 160 943 000 ➤ Population 15+ years: 64% ➤ Population in urban areas: 35% ➤ Income group (World Bank): Low income
Data source: United Nations, data range 1990–2006.
SOCIOECONOMIC CONTEXT
Robust estimate of fi ve-year change in recorded adult(15+) per capita consumption,2001–2005:
INCREASE
➤ STABLE DECREASE
INCONCLUSIVE
0.02
2000 2002 2004
Litre
s of
pur
e al
coho
l
ENLARGEMENT OF RECORDED ADULT (15+) PER CAPITA CONSUMPTION, 2000–2005
Year
2003 20052001
ALCOHOL CONSUMPTION Population data (refer to the population 15 years and older and are in litres of pure alcohol).
1961 1966 1976
Litre
s of
pur
e al
coho
l
1991
RECORDED ADULT (15+) PER CAPITA CONSUMPTION, 1961–2005
Year
1971 1981 200119961986 2006
Change in data source from 2000
Beer Wine Spirits Other Total
0.01
15
5
10
20
0
0
ALMOST ZERO CONSUMPTION. APPEARS TO BE OTHER
BEVERAGES.

14
PATTERNS OF DRINKING
ABSTAINERS (15+ years), 2005
Males Females Total
Lifetime abstainers
No information availableFormer drinkers
Abstainers*
* Persons who did not drink in the past 12 months.
DRINKERS ONLY
Adult (15+ years) per capita consumption*, total —
Adult (15+ years) per capita consumption*, males —
Adult (15+ years) per capita consumption*, females —
Heavy episodic drinkers** (15–85+ years), males —
Heavy episodic drinkers** (15–85+ years), females —
* (Recorded + unrecorded – tourist) in litres of pure alcohol, average 2003–2005.** Had at least 60 grams or more of pure alcohol on at least one occasion weekly.
PATTERNS OF DRINKING SCORE
Patterns of drinking score* LEAST RISKY No information available MOST RISKY
* Given the same level of consumption, the higher the patterns of drinking score, the greater the alcohol-attributable burden of disease for the country.
ALCOHOL POLICYExcise tax on beer / wine / spirits No / No / No
National legal minimum age for off-premise sales of alcoholic beverages (selling) (beer / wine / spirits) Subnational
National legal minimum age for on-premise sales of alcoholic beverages (serving) (beer / wine / spirits) Subnational
Restrictions for on-/off-premise sales of alcoholic beverages:Time (hours and days) / location (places and density) NASpecifi c events / intoxicated persons / petrol stations NA
National maximum legal blood alcohol concentration (BAC) when driving a vehicle (general / young / professional), in % ZT / ZT / ZT
Legally binding regulations on alcohol advertising / product placement Yes / Yes
Legally binding regulations on alcohol sponsorship / sales promotion NA / NA
NA = No information.ZT = Zero tolerance.
HEALTH CONSEQUENCES
MORBIDITY
Prevalence estimates (12-month prevalence for 2004): Males Females
Alcohol use disorders (15+ years) 1.64% 0.00%
ALL CAUSE MORTALITY
Age-standardized deaths rates, 15+ years (per 100,000 population)
2000 2001 2002 2003 2004 2005
M F M F M F M F M F M F
Liver cirrhosisNo information availableRoad traffi c
accidents (1)
Data source: WHO Mortality Database, data as reported by countries (1) refer to transport accidents.
12%WINE
5%BEER
RECORDED ADULT (15+) ALCOHOL CONSUMPTION BY TYPE OF ALCOHOLIC BEVERAGE (IN % OF PURE ALCOHOL), 2005
Beer includes malt beers. Wine includes wine made from grapes. Spirits include all distilled beverages. Other includes one or several other alcoholic beverages, such as fermented beverages made from sorghum, maize, millet, rice, or cider, fruit wine, fortifi ed wine, etc.
Adult (15+) per capita consumption, average 2003–2005 (in litres of pure alcohol):
Recorded 0.85
Unrecorded 0.40
Total 1.25
WHO Eastern Mediterranean Region 0.67
Qatar
Total population: 821 000 ➤ Population 15+ years: 79% ➤ Population in urban areas: 96% ➤ Income group (World Bank): High income
Data source: United Nations, data range 1990–2006.
SOCIOECONOMIC CONTEXT
Robust estimate of fi ve-year change in recorded adult(15+) per capita consumption,2001–2005:
INCREASE
➤ STABLE DECREASE
INCONCLUSIVE
1%OTHER
82%SPIRITS
2000 2002 2004
Litre
s of
pur
e al
coho
lENLARGEMENT OF RECORDED ADULT (15+) PER CAPITA CONSUMPTION, 2000–2005
Year
2003 20052001
ALCOHOL CONSUMPTION Population data (refer to the population 15 years and older and are in litres of pure alcohol).
1961 1966 1976Li
tres
of p
ure
alco
hol
1991
RECORDED ADULT (15+) PER CAPITA CONSUMPTION, 1961–2005
Year
1971 1981 200119961986 2006
Change in data source from 2000
Beer Wine Spirits Other Total
15
5
10
20
1.5
1.0
0.5
0
0

15
PATTERNS OF DRINKING
ABSTAINERS (15+ years), 2005
Males Females Total
Lifetime abstainers
No information availableFormer drinkers
Abstainers*
* Persons who did not drink in the past 12 months.
DRINKERS ONLY
Adult (15+ years) per capita consumption*, total —
Adult (15+ years) per capita consumption*, males —
Adult (15+ years) per capita consumption*, females —
Heavy episodic drinkers** (15–85+ years), males —
Heavy episodic drinkers** (15–85+ years), females —
* (Recorded + unrecorded) in litres of pure alcohol, average 2003–2005.** Had at least 60 grams or more of pure alcohol on at least one occasion weekly.
PATTERNS OF DRINKING SCORE
Patterns of drinking score* LEAST RISKY 1 2 3 4 5 MOST RISKY
* Given the same level of consumption, the higher the patterns of drinking score, the greater the alcohol-attributable burden of disease for the country.
ALCOHOL POLICYExcise tax on beer / wine / spirits Total ban
National legal minimum age for off-premise sales of alcoholic beverages (selling) (beer / wine / spirits) Total ban
National legal minimum age for on-premise sales of alcoholic beverages (serving) (beer / wine / spirits) Total ban
Restrictions for on-/off-premise sales of alcoholic beverages:Time (hours and days) / location (places and density) Total banSpecifi c events / intoxicated persons / petrol stations Total ban
National maximum legal blood alcohol concentration (BAC) when driving a vehicle (general / young / professional), in % ZT / ZT / ZT
Legally binding regulations on alcohol advertising / product placement Total ban
Legally binding regulations on alcohol sponsorship / sales promotion Total ban
ZT = Zero tolerance.
HEALTH CONSEQUENCES
MORBIDITY
Prevalence estimates (12-month prevalence for 2004): Males Females
Alcohol use disorders (15+ years) 0.38% 0.00%
ALL CAUSE MORTALITY
Age-standardized deaths rates, 15+ years (per 100,000 population)
2000 2001 2002 2003 2004 2005
M F M F M F M F M F M F
Liver cirrhosisNo information availableRoad traffi c
accidents (1)
Data source: WHO Mortality Database, data as reported by countries (1) refer to transport accidents.
100%SPIRITS
<1%BEER
RECORDED ADULT (15+) ALCOHOL CONSUMPTION BY TYPE OF ALCOHOLIC BEVERAGE (IN % OF PURE ALCOHOL), 2005
Beer includes malt beers. Wine includes wine made from grapes. Spirits include all distilled beverages. Other includes one or several other alcoholic beverages, such as fermented beverages made from sorghum, maize, millet, rice, or cider, fruit wine, fortifi ed wine, etc.
Adult (15+) per capita consumption, average 2003–2005 (in litres of pure alcohol):
Recorded 0.05
Unrecorded 0.20
Total 0.25
WHO Eastern Mediterranean Region 0.67
Saudi Arabia
Total population: 24 175 000 ➤ Population 15+ years: 66% ➤ Population in urban areas: 81% ➤ Income group (World Bank): High income
Data source: United Nations, data range 1990–2006.
SOCIOECONOMIC CONTEXT
Robust estimate of fi ve-year change in recorded adult(15+) per capita consumption,2001–2005:
INCREASE
➤ STABLE DECREASE
INCONCLUSIVE
<1%WINE
0.10
2000 2002 2004
Litre
s of
pur
e al
coho
l
ENLARGEMENT OF RECORDED ADULT (15+) PER CAPITA CONSUMPTION, 2000–2005
Year
2003 20052001
ALCOHOL CONSUMPTION Population data (refer to the population 15 years and older and are in litres of pure alcohol).
1961 1966 1976
Litre
s of
pur
e al
coho
l
1991
RECORDED ADULT (15+) PER CAPITA CONSUMPTION, 1961–2005
Year
1971 1981 200119961986 2006
Change in data source from 2000
Beer Wine Spirits Total
0.05
15
5
10
20
0
0

16
PATTERNS OF DRINKING
ABSTAINERS (15+ years), 2005
Males Females Total
Lifetime abstainers
No information availableFormer drinkers
Abstainers*
* Persons who did not drink in the past 12 months.
DRINKERS ONLY
Adult (15+ years) per capita consumption*, total —
Adult (15+ years) per capita consumption*, males —
Adult (15+ years) per capita consumption*, females —
Heavy episodic drinkers** (15–85+ years), males —
Heavy episodic drinkers** (15–85+ years), females —
* (Recorded + unrecorded – tourist) in litres of pure alcohol, average 2003–2005.** Had at least 60 grams or more of pure alcohol on at least one occasion weekly.
PATTERNS OF DRINKING SCORE
Patterns of drinking score* LEAST RISKY No information available MOST RISKY
* Given the same level of consumption, the higher the patterns of drinking score, the greater the alcohol-attributable burden of disease for the country.
ALCOHOL POLICYExcise tax on beer / wine / spirits Total ban
National legal minimum age for off-premise sales of alcoholic beverages (selling) (beer / wine / spirits) Total ban
National legal minimum age for on-premise sales of alcoholic beverages (serving) (beer / wine / spirits) Total ban
Restrictions for on-/off-premise sales of alcoholic beverages:Time (hours and days) / location (places and density) Total banSpecifi c events / intoxicated persons / petrol stations Total ban
National maximum legal blood alcohol concentration (BAC) when driving a vehicle (general / young / professional), in % ZT / ZT / ZT
Legally binding regulations on alcohol advertising / product placement Total ban
Legally binding regulations on alcohol sponsorship / sales promotion Total ban
ZT = Zero tolerance.
HEALTH CONSEQUENCES
MORBIDITY
Prevalence estimates (12-month prevalence for 2004): Males Females
Alcohol use disorders (15+ years) 0.28% 0.03%
ALL CAUSE MORTALITY
Age-standardized deaths rates, 15+ years (per 100,000 population)
2000 2001 2002 2003 2004 2005
M F M F M F M F M F M F
Liver cirrhosisNo information availableRoad traffi c
accidents (1)
Data source: WHO Mortality Database, data as reported by countries (1) refer to transport accidents.
RECORDED ADULT (15+) ALCOHOL CONSUMPTION BY TYPE OF ALCOHOLIC BEVERAGE (IN % OF PURE ALCOHOL), 2005
Beer includes malt beers. Wine includes wine made from grapes. Spirits include all distilled beverages. Other includes one or several other alcoholic beverages, such as fermented beverages made from sorghum, maize, millet, rice, or cider, fruit wine, fortifi ed wine, etc.
Adult (15+) per capita consumption, average 2003–2005 (in litres of pure alcohol):
Recorded 0.00
Unrecorded 0.50
Total 0.50
WHO Eastern Mediterranean Region 0.67
Somalia
Total population: 8 445 000 ➤ Population 15+ years: 56% ➤ Population in urban areas: 36% ➤ Income group (World Bank): Low income
Data source: United Nations, data range 1990–2006.
SOCIOECONOMIC CONTEXT
Robust estimate of fi ve-year change in recorded adult(15+) per capita consumption,2001–2005:
INCREASE
➤ STABLE DECREASE
INCONCLUSIVE
Zero Consumption
2000 2002 2004
Litre
s of
pur
e al
coho
lENLARGEMENT OF RECORDED ADULT (15+) PER CAPITA CONSUMPTION, 2000–2005
Year
2003 20052001
ALCOHOL CONSUMPTION Population data (refer to the population 15 years and older and are in litres of pure alcohol).
1961 1966 1976Li
tres
of p
ure
alco
hol
1991
RECORDED ADULT (15+) PER CAPITA CONSUMPTION, 1961–2005
Year
1971 1981 200119961986 2006
Beer Wine Spirits Total
15
5
10
20
1.0
0.5
0
0

17
PATTERNS OF DRINKING
ABSTAINERS (15+ years), 2005
Males Females Total
Lifetime abstainers
No information availableFormer drinkers
Abstainers*
* Persons who did not drink in the past 12 months.
DRINKERS ONLY
Adult (15+ years) per capita consumption*, total —
Adult (15+ years) per capita consumption*, males —
Adult (15+ years) per capita consumption*, females —
Heavy episodic drinkers** (15–85+ years), males —
Heavy episodic drinkers** (15–85+ years), females —
* (Recorded + unrecorded) in litres of pure alcohol, average 2003–2005.** Had at least 60 grams or more of pure alcohol on at least one occasion weekly.
PATTERNS OF DRINKING SCORE
Patterns of drinking score* LEAST RISKY 1 2 3 4 5 MOST RISKY
* Given the same level of consumption, the higher the patterns of drinking score, the greater the alcohol-attributable burden of disease for the country.
ALCOHOL POLICYExcise tax on beer / wine / spirits Total ban
National legal minimum age for off-premise sales of alcoholic beverages (selling) (beer / wine / spirits) Total ban
National legal minimum age for on-premise sales of alcoholic beverages (serving) (beer / wine / spirits) Total ban
Restrictions for on-/off-premise sales of alcoholic beverages:Time (hours and days) / location (places and density) Total banSpecifi c events / intoxicated persons / petrol stations Total ban
National maximum legal blood alcohol concentration (BAC) when driving a vehicle (general / young / professional), in % ZT / ZT / ZT
Legally binding regulations on alcohol advertising / product placement Total ban
Legally binding regulations on alcohol sponsorship / sales promotion Total ban
ZT = Zero tolerance.
HEALTH CONSEQUENCES
MORBIDITY
Prevalence estimates (12-month prevalence for 2004): Males Females
Alcohol use disorders (15+ years) 0.54% 0.06%
ALL CAUSE MORTALITY
Age-standardized deaths rates, 15+ years (per 100,000 population)
2000 2001 2002 2003 2004 2005
M F M F M F M F M F M F
Liver cirrhosisNo information availableRoad traffi c
accidents (1)
Data source: WHO Mortality Database, data as reported by countries (1) refer to transport accidents.
20%SPIRITS
80%OTHER
RECORDED ADULT (15+) ALCOHOL CONSUMPTION BY TYPE OF ALCOHOLIC BEVERAGE (IN % OF PURE ALCOHOL), 2005
Beer includes malt beers. Wine includes wine made from grapes. Spirits include all distilled beverages. Other includes one or several other alcoholic beverages, such as fermented beverages made from sorghum, maize, millet, rice, or cider, fruit wine, fortifi ed wine, etc.
Adult (15+) per capita consumption, average 2003–2005 (in litres of pure alcohol):
Recorded 1.56
Unrecorded 1.00
Total 2.56
WHO Eastern Mediterranean Region 0.67
Sudan (the)
Total population: 37 707 000 ➤ Population 15+ years: 60% ➤ Population in urban areas: 42% ➤ Income group (World Bank): Lower-middle income
Data source: United Nations, data range 1990–2006.
SOCIOECONOMIC CONTEXT
Robust estimate of fi ve-year change in recorded adult(15+) per capita consumption,2001–2005:
INCREASE
STABLE
➤ DECREASE INCONCLUSIVE
2.0
2000 2002 2004
Litre
s of
pur
e al
coho
l
ENLARGEMENT OF RECORDED ADULT (15+) PER CAPITA CONSUMPTION, 2000–2005
Year
2003 20052001
ALCOHOL CONSUMPTION Population data (refer to the population 15 years and older and are in litres of pure alcohol).
1961 1966 1976
Litre
s of
pur
e al
coho
l
1991
RECORDED ADULT (15+) PER CAPITA CONSUMPTION, 1961–2005
Year
1971 1981 200119961986 2006
Beer Wine Spirits Other Total
1.0
15
5
10
20
1.5
0.5
0
0
<1%BEER <1%
WINE

18
PATTERNS OF DRINKING
ABSTAINERS (15+ years), 2004
Males Females Total
Lifetime abstainers 74.9% 89.6% 82.3%
Former drinkers 17.5% 9.2% 13.3%
Abstainers* 92.4% 98.8% 95.6%
* Persons who did not drink in the past 12 months.
DRINKERS ONLY
Adult (15+ years) per capita consumption*, total 32.50
Adult (15+ years) per capita consumption*, males 34.38
Adult (15+ years) per capita consumption*, females 11.52
Heavy episodic drinkers** (15–85+ years), males —
Heavy episodic drinkers** (15–85+ years), females —
* (Recorded + unrecorded) in litres of pure alcohol, average 2003–2005.** Had at least 60 grams or more of pure alcohol on at least one occasion weekly.
PATTERNS OF DRINKING SCORE
Patterns of drinking score* LEAST RISKY 1 2 3 4 5 MOST RISKY
* Given the same level of consumption, the higher the patterns of drinking score, the greater the alcohol-attributable burden of disease for the country.
ALCOHOL POLICYExcise tax on beer / wine / spirits NA
National legal minimum age for off-premise sales of alcoholic beverages (selling) (beer / wine / spirits) NA
National legal minimum age for on-premise sales of alcoholic beverages (serving) (beer / wine / spirits) NA
Restrictions for on-/off-premise sales of alcoholic beverages:Time (hours and days) / location (places and density) NASpecifi c events / intoxicated persons / petrol stations NA
National maximum legal blood alcohol concentration (BAC) when driving a vehicle (general / young / professional), in % 0.05 / 0.05 / 0.05
Legally binding regulations on alcohol advertising / product placement Total ban
Legally binding regulations on alcohol sponsorship / sales promotion NA
NA = No information.
HEALTH CONSEQUENCES
MORBIDITY
Prevalence estimates (12-month prevalence for 2004): Males Females
Alcohol use disorders (15+ years) 0.59% 0.00%
ALL CAUSE MORTALITY
Age-standardized deaths rates, 15+ years (per 100,000 population)
2000 2001 2002 2003 2004 2005
M F M F M F M F M F M F
Liver cirrhosisNo information availableRoad traffi c
accidents (1)
Data source: WHO Mortality Database, data as reported by countries (1) refer to transport accidents.
4%BEER
30%WINE
RECORDED ADULT (15+) ALCOHOL CONSUMPTION BY TYPE OF ALCOHOLIC BEVERAGE (IN % OF PURE ALCOHOL), 2005
Beer includes malt beers. Wine includes wine made from grapes. Spirits include all distilled beverages. Other includes one or several other alcoholic beverages, such as fermented beverages made from sorghum, maize, millet, rice, or cider, fruit wine, fortifi ed wine, etc.
Adult (15+) per capita consumption, average 2003–2005 (in litres of pure alcohol):
Recorded 1.13
Unrecorded 0.30
Total 1.43
WHO Eastern Mediterranean Region 0.67
Syrian Arab Republic (the)
Total population: 19 408 000 ➤ Population 15+ years: 64% ➤ Population in urban areas: 51% ➤ Income group (World Bank): Lower-middle income
Data source: United Nations, data range 1990–2006.
SOCIOECONOMIC CONTEXT
Robust estimate of fi ve-year change in recorded adult(15+) per capita consumption,2001–2005:
INCREASE
STABLE
➤ DECREASE INCONCLUSIVE
66%SPIRITS
2000 2002 2004
Litre
s of
pur
e al
coho
lENLARGEMENT OF RECORDED ADULT (15+) PER CAPITA CONSUMPTION, 2000–2005
Year
2003 20052001
ALCOHOL CONSUMPTION Population data (refer to the population 15 years and older and are in litres of pure alcohol).
1961 1966 1976Li
tres
of p
ure
alco
hol
1991
RECORDED ADULT (15+) PER CAPITA CONSUMPTION, 1961–2005
Year
1971 1981 200119961986 2006
Change in data source from 2000
Beer Wine Spirits Total
15
5
10
20
1.5
1.0
0.5
0
0

19
PATTERNS OF DRINKING
ABSTAINERS (15+ years), 2003
Males Females Total
Lifetime abstainers 73.4% 99.8% 86.6%
Former drinkers 14.5% 0.0% 7.3%
Abstainers* 87.9% 99.8% 93.9%
* Persons who did not drink in the past 12 months.
DRINKERS ONLY
Adult (15+ years) per capita consumption*, total 20.70
Adult (15+ years) per capita consumption*, males 20.75
Adult (15+ years) per capita consumption*, females 17.18
Heavy episodic drinkers** (15–85+ years), males, 2003 57.0%
Heavy episodic drinkers** (15–85+ years), females, 2003 14.9%
* (Recorded + unrecorded) in litres of pure alcohol, average 2003–2005.** Had at least 60 grams or more of pure alcohol on at least one occasion weekly.
PATTERNS OF DRINKING SCORE
Patterns of drinking score* LEAST RISKY 1 2 3 4 5 MOST RISKY
* Given the same level of consumption, the higher the patterns of drinking score, the greater the alcohol-attributable burden of disease for the country.
ALCOHOL POLICYExcise tax on beer / wine / spirits Yes / Yes / Yes
National legal minimum age for off-premise sales of alcoholic beverages (selling) (beer / wine / spirits) 20 / 20 / 20
National legal minimum age for on-premise sales of alcoholic beverages (serving) (beer / wine / spirits) 20 / 20 / 20
Restrictions for on-/off-premise sales of alcoholic beverages:Time (hours and days) / location (places and density) Yes / YesSpecifi c events / intoxicated persons / petrol stations Yes / Yes / Yes
National maximum legal blood alcohol concentration (BAC) when driving a vehicle (general / young / professional), in % 0.05 / 0.05 / 0.05
Legally binding regulations on alcohol advertising / product placement No / No
Legally binding regulations on alcohol sponsorship / sales promotion No / No
HEALTH CONSEQUENCES
MORBIDITY
Prevalence estimates (12-month prevalence for 2004): Males Females
Alcohol use disorders (15+ years) 0.73% 0.00%
ALL CAUSE MORTALITY
Age-standardized deaths rates, 15+ years (per 100,000 population)
2000 2001 2002 2003 2004 2005
M F M F M F M F M F M F
Liver cirrhosisNo information availableRoad traffi c
accidents (1)
Data source: WHO Mortality Database, data as reported by countries (1) refer to transport accidents.
63%BEER
RECORDED ADULT (15+) ALCOHOL CONSUMPTION BY TYPE OF ALCOHOLIC BEVERAGE (IN % OF PURE ALCOHOL), 2005
Beer includes malt beers. Wine includes wine made from grapes. Spirits include all distilled beverages. Other includes one or several other alcoholic beverages, such as fermented beverages made from sorghum, maize, millet, rice, or cider, fruit wine, fortifi ed wine, etc.
Adult (15+) per capita consumption, average 2003–2005 (in litres of pure alcohol):
Recorded 1.09
Unrecorded 0.20
Total 1.29
WHO Eastern Mediterranean Region 0.67
Tunisia
Total population: 10 215 000 ➤ Population 15+ years: 75% ➤ Population in urban areas: 66% ➤ Income group (World Bank): Lower-middle income
Data source: United Nations, data range 1990–2006.
SOCIOECONOMIC CONTEXT
Robust estimate of fi ve-year change in recorded adult(15+) per capita consumption,2001–2005:
INCREASE
STABLE
➤ DECREASE INCONCLUSIVE
32%WINE
5%SPIRITS
1.5
2000 2002
Litre
s of
pur
e al
coho
l
ENLARGEMENT OF RECORDED ADULT (15+) PER CAPITA CONSUMPTION, 2000–2005
Year
2003 20052001
ALCOHOL CONSUMPTION Population data (refer to the population 15 years and older and are in litres of pure alcohol).
1961 1966 1976
Litre
s of
pur
e al
coho
l
1991
RECORDED ADULT (15+) PER CAPITA CONSUMPTION, 1961–2005
Year
1971 1981 200119961986 2006
Change in data source from 2000
Beer Wine Spirits Total
1.0
15
5
10
20
0.5
2004
0
0

20
PATTERNS OF DRINKING
ABSTAINERS (15+ years), 2003
Males Females Total
Lifetime abstainers 85.8% 94.4% 88.2%
Former drinkers 5.2% 2.6% 4.4%
Abstainers* 91.0% 97.0% 92.6%
* Persons who did not drink in the past 12 months.
DRINKERS ONLY
Adult (15+ years) per capita consumption*, total 7.20
Adult (15+ years) per capita consumption*, males 7.74
Adult (15+ years) per capita consumption*, females 3.13
Heavy episodic drinkers** (15–85+ years), males, 2003 24.4%
Heavy episodic drinkers** (15–85+ years), females, 2003 36.7%
* (Recorded + unrecorded) in litres of pure alcohol, average 2003–2005.** Had at least 60 grams or more of pure alcohol on at least one occasion weekly.
PATTERNS OF DRINKING SCORE
Patterns of drinking score* LEAST RISKY 1 2 3 4 5 MOST RISKY
* Given the same level of consumption, the higher the patterns of drinking score, the greater the alcohol-attributable burden of disease for the country.
HEALTH CONSEQUENCES
MORBIDITY
Prevalence estimates (12-month prevalence for 2004): Males Females
Alcohol use disorders (15+ years) 0.59% 0.00%
ALL CAUSE MORTALITY
Age-standardized deaths rates, 15+ years (per 100,000 population)
2000 2001 2002 2003 2004 2005
M F M F M F M F M F M F
Liver cirrhosisNo information availableRoad traffi c
accidents (1)
Data source: WHO Mortality Database, data as reported by countries (1) refer to transport accidents.
92%BEER
5%OTHER
RECORDED ADULT (15+) ALCOHOL CONSUMPTION BY TYPE OF ALCOHOLIC BEVERAGE (IN % OF PURE ALCOHOL), 2005
Beer includes malt beers. Wine includes wine made from grapes. Spirits include all distilled beverages. Other includes one or several other alcoholic beverages, such as fermented beverages made from sorghum, maize, millet, rice, or cider, fruit wine, fortifi ed wine, etc.
Adult (15+) per capita consumption, average 2003–2005 (in litres of pure alcohol):
Recorded 0.34
Unrecorded 0.20
Total 0.54
WHO Eastern Mediterranean Region 0.67
United Arab Emirates (the)
Total population: 4 248 000 ➤ Population 15+ years: 80% ➤ Population in urban areas: 77% ➤ Income group (World Bank): High income
Data source: United Nations, data range 1990–2006.
SOCIOECONOMIC CONTEXT
Robust estimate of fi ve-year change in recorded adult(15+) per capita consumption,2001–2005:
INCREASE
STABLE
➤ DECREASE INCONCLUSIVE
3%WINE
<1%SPIRITS
ALCOHOL POLICYExcise tax on beer / wine / spirits Yes / No / Yes
National legal minimum age for off-premise sales of alcoholic beverages (selling) (beer / wine / spirits) 16 / 16 / 18
National legal minimum age for on-premise sales of alcoholic beverages (serving) (beer / wine / spirits) 16 / 16 / 18
Restrictions for on-/off-premise sales of alcoholic beverages:Time (hours and days) / location (places and density) Yes / NoSpecifi c events / intoxicated persons / petrol stations Yes / No / No
National maximum legal blood alcohol concentration (BAC) when driving a vehicle (general / young / professional), in % 0.05 / 0.05 / 0.05
Legally binding regulations on alcohol advertising / product placement Yes / Yes
Legally binding regulations on alcohol sponsorship / sales promotion Yes / Yes
No information available
2000 2002 2004
Litre
s of
pur
e al
coho
l
2006
ENLARGEMENT OF RECORDED ADULT (15+) PER CAPITA CONSUMPTION, 2000–2007
Year
2003 2005 20072001
ALCOHOL CONSUMPTION Population data (refer to the population 15 years and older and are in litres of pure alcohol).
1961 1966 1976Li
tres
of p
ure
alco
hol
1991
RECORDED ADULT (15+) PER CAPITA CONSUMPTION, 1961–2007
Year
1971 1981 200119961986 2006
Change in data source from 2000
Beer Wine Spirits Other Total
15
5
10
20
0.8
0.6
0.4
0.2
0
0

21
PATTERNS OF DRINKING
ABSTAINERS (15+ years), 2005
Males Females Total
Lifetime abstainers
No information availableFormer drinkers
Abstainers*
* Persons who did not drink in the past 12 months.
DRINKERS ONLY
Adult (15+ years) per capita consumption*, total —
Adult (15+ years) per capita consumption*, males —
Adult (15+ years) per capita consumption*, females —
Heavy episodic drinkers** (15–85+ years), males —
Heavy episodic drinkers** (15–85+ years), females —
* (Recorded + unrecorded) in litres of pure alcohol, average 2003–2005.** Had at least 60 grams or more of pure alcohol on at least one occasion weekly.
PATTERNS OF DRINKING SCORE
Patterns of drinking score* LEAST RISKY No information available MOST RISKY
* Given the same level of consumption, the higher the patterns of drinking score, the greater the alcohol-attributable burden of disease for the country.
HEALTH CONSEQUENCES
MORBIDITY
Prevalence estimates (12-month prevalence for 2004): Males Females
Alcohol use disorders (15+ years) 0.24% 0.00%
ALL CAUSE MORTALITY
Age-standardized deaths rates, 15+ years (per 100,000 population)
2000 2001 2002 2003 2004 2005
M F M F M F M F M F M F
Liver cirrhosisNo information availableRoad traffi c
accidents (1)
Data source: WHO Mortality Database, data as reported by countries (1) refer to transport accidents.
RECORDED ADULT (15+) ALCOHOL CONSUMPTION BY TYPE OF ALCOHOLIC BEVERAGE (IN % OF PURE ALCOHOL), 2005
Beer includes malt beers. Wine includes wine made from grapes. Spirits include all distilled beverages. Other includes one or several other alcoholic beverages, such as fermented beverages made from sorghum, maize, millet, rice, or cider, fruit wine, fortifi ed wine, etc.
Adult (15+) per capita consumption, average 2003–2005 (in litres of pure alcohol):
Recorded 0.00
Unrecorded 0.20
Total 0.20
WHO Eastern Mediterranean Region 0.67
Total population: 21 732 000 ➤ Population 15+ years: 55% ➤ Population in urban areas: 28% ➤ Income group (World Bank): Low income
Data source: United Nations, data range 1990–2006.
SOCIOECONOMIC CONTEXT
Robust estimate of fi ve-year change in recorded adult(15+) per capita consumption,2001–2005:
INCREASE
➤ STABLE DECREASE
INCONCLUSIVE
Yemen
Zero Consumption
ALCOHOL POLICYExcise tax on beer / wine / spirits Yes / No / Yes
National legal minimum age for off-premise sales of alcoholic beverages (selling) (beer / wine / spirits) 16 / 16 / 18
National legal minimum age for on-premise sales of alcoholic beverages (serving) (beer / wine / spirits) 16 / 16 / 18
Restrictions for on-/off-premise sales of alcoholic beverages:Time (hours and days) / location (places and density) Yes / NoSpecifi c events / intoxicated persons / petrol stations Yes / No / No
National maximum legal blood alcohol concentration (BAC) when driving a vehicle (general / young / professional), in % 0.05 / 0.05 / 0.05
Legally binding regulations on alcohol advertising / product placement Yes / Yes
Legally binding regulations on alcohol sponsorship / sales promotion Yes / Yes
No information available
0.02
2000 2002
Litre
s of
pur
e al
coho
l
ENLARGEMENT OF RECORDED ADULT (15+) PER CAPITA CONSUMPTION, 2000–2005
Year
2003 20052001
ALCOHOL CONSUMPTION Population data (refer to the population 15 years and older and are in litres of pure alcohol).
1961 1966 1976
Litre
s of
pur
e al
coho
l
1991
RECORDED ADULT (15+) PER CAPITA CONSUMPTION, 1961–2005
Year
1971 1981 200119961986 2006
Change in data source from 2000
Beer Wine Spirits Total
15
5
10
20
0.01
2004
0
0