employment situation of veterans - 2012 - bureau of labor statistics
TRANSCRIPT
For release 10:00 a.m. (EDT) Thursday, March 22, 2018 USDL-18-0453 Technical information: (202) 691-6378 • [email protected] • www.bls.gov/cps Media contact: (202) 691-5902 • [email protected]
EMPLOYMENT SITUATION OF VETERANS — 2017 The unemployment rate for veterans who served on active duty in the U.S. Armed Forces at any time since September 2001—a group referred to as Gulf War-era II veterans—edged down to 4.5 percent in 2017, the U.S. Bureau of Labor Statistics reported today. The jobless rate for all veterans declined from 4.3 percent to 3.7 percent in 2017. About 41 percent of Gulf War-era II veterans had a service-connected disability in August 2017, compared with 24 percent of all veterans. This information was obtained from the Current Population Survey (CPS), a monthly sample survey of about 60,000 households that provides data on employment and unemployment in the United States. Data about veterans are collected monthly in the CPS; these monthly data are the source of the 2017 annual averages presented in this news release. In August 2017, a supplement to the CPS collected additional information about veterans on topics such as service-connected disability and veterans' current or past Reserve or National Guard membership. Information from the supplement is also presented in this release. The supplement was co-sponsored by the U.S. Department of Veterans Affairs and by the U.S. Department of Labor's Veterans' Employment and Training Service. For more information, see the Technical Note, which provides definitions of terms used in this release. Highlights from the 2017 data:
• The unemployment rate for male veterans (3.6 percent) declined over the year, and the rate for female veterans (4.1 percent) changed little in 2017. The unemployment rate for male veterans was not statistically different from the rate for female veterans. (See table A.)
• Among the 370,000 unemployed veterans in 2017, 59 percent were age 25 to 54, 37 percent were
age 55 and over, and 4 percent were age 18 to 24. (See table 2A.)
• Veterans with a service-connected disability had an unemployment rate of 4.3 percent in August 2017, little different from veterans with no disability (4.5 percent). (See table 7.)
• About 1 in 3 employed veterans with a service-connected disability worked in the public sector
in August 2017, compared with about 1 in 5 veterans with no disability. (See table 8.)
• In 2017, the unemployment rate of veterans varied across the country, ranging from 1.7 percent in Maine and Vermont to 7.3 percent in Rhode Island. (See table 6A.)

- 2 -
The Veteran Population In 2017, 20.4 million men and women were veterans, accounting for about 8 percent of the civilian noninstitutional population age 18 and over. About 10 percent of all veterans were women. In the survey, veterans are defined as men and women who have previously served on active duty in the U.S. Armed Forces and who were civilians at the time these data were collected. Veterans are more likely to be men than were nonveterans, and they also tend to be older. In part, this reflects the characteristics of veterans who served during World War II, the Korean War, and the Vietnam era, all of whom are now over 60 years old. Veterans who served during these wartime periods accounted for 39 percent (8.1 million) of the total veteran population in 2017. Thirty-six percent of veterans (7.4 million) served during Gulf War era I (August 1990 to August 2001) or Gulf War era II (September 2001 forward). About a quarter (4.9 million) served outside the designated wartime periods. (See tables 1 and 2A.) Gulf War-era II Veterans In 2017, there were 4.1 million veterans who had served during Gulf War era II (September 2001 forward). Seventeen percent of these veterans were women, compared with about 4 percent of veterans from World War II, the Korean War, and the Vietnam era. Seventy percent of all Gulf War-era II veterans were between the ages of 25 and 44. (See tables 1 and 2A.) Among Gulf War-era II veterans, the unemployment rate for men was not statistically different from the rate for women in 2017. The unemployment rate for men edged down to 4.3 percent in 2017. The rate for women, at 5.5 percent, was essentially unchanged from the prior year. (See table A.) In 2017, the unemployment rate for male Gulf War-era II veterans, at 4.3 percent, was the same as the rate for male nonveterans. Among men age 25 to 34, Gulf War-era II veterans had a higher unemployment rate (6.0 percent) than did nonveterans (4.5 percent). Among men age 45 to 54, however, Gulf War-era II veterans had a lower unemployment rate (1.5 percent) than did nonveterans (3.1 percent). (See table 2B.) Among women, the unemployment rate for Gulf War-era II veterans (5.5 percent) was higher than the rate for nonveterans (4.1 percent) in 2017. By age, unemployment rates for female veterans and nonveterans were similar, with one exception: 25- to 34-year-old female veterans had a rate of 8.0 percent, higher than the rate of 4.5 percent for their nonveteran counterparts. (See table 2C.) Employed Gulf War-era II veterans were about twice as likely to work in the public sector in 2017 as employed nonveterans—27 percent and 13 percent, respectively. Among the employed, 15 percent of Gulf War-era II veterans worked for the federal government, compared with 2 percent of nonveterans. (See table 5.) In August 2017, 47 percent of Gulf War-era II veterans reported serving in Iraq, Afghanistan, or both locations. These veterans had an unemployment rate of 4.4 percent, little different from Gulf War-era II veterans who served elsewhere (4.5 percent). (See table 10.) Gulf War-era I Veterans Of the 3.3 million veterans who served during Gulf War era I (August 1990 to August 2001), the proportion who were women (15 percent in 2017) was similar to that of Gulf War-era II veterans (17

- 3 -
percent). Nearly all (99 percent) Gulf War-era I veterans were age 35 and over in 2017, compared with 54 percent of Gulf War-era II veterans. (See tables 1 and 2A.) In 2017, the unemployment rates for male and female Gulf War-era I veterans were 3.0 percent and 3.4 percent, respectively, lower than the rates for their Gulf War-era II veteran counterparts (4.3 percent and 5.5 percent). The difference in unemployment rates reflects, at least in part, the older age profile of veterans who served during Gulf War era I. Younger people—whether veterans or nonveterans—tend to have higher unemployment rates than older people. (See tables 2B and 2C.) Veterans of Other Service Periods In 2017, 4.9 million veterans had served on active duty during "other service periods," mainly between the Korean War and the Vietnam era and between the Vietnam era and Gulf War era I. All veterans from this period of service were 45 years or older at the time of the survey. Twenty-two percent of these veterans were age 45 to 54 in 2017, another 39 percent were age 55 to 64, and another 39 percent were age 65 and over. (See table 2A.) In 2017, 1 in 10 veterans of other service periods were women. Among veterans of other service periods, the unemployment rate for men (3.2 percent) was little different than the rate for women (2.7 percent). (See table 1.) Veterans with a Service-connected Disability In August 2017, about 4.9 million veterans, or 24 percent of the total, had a service-connected disability. Veterans with a service-connected disability are assigned a disability rating by the U.S. Department of Veterans Affairs or the U.S. Department of Defense. Ratings range from 0 to 100 percent, in increments of 10 percentage points, depending on the severity of the condition. (See table 7.) The unemployment rate for veterans with a service-connected disability was 4.3 percent in August 2017, little different than the rate for veterans with no disability (4.5 percent). The labor force participation rate for veterans with a service-connected disability (48.4 percent) was not statistically different than the rate for veterans with no disability (49.2 percent). Among veterans with a service-connected disability, 28 percent reported a disability rating of less than 30 percent, while another 41 percent had a rating of 60 percent or higher. In August 2017, veterans with a service-connected disability rating of less than 30 percent were much more likely to be in the labor force than those with a rating of 60 percent or higher (53.5 percent and 37.7 percent, respectively). The unemployment rate for veterans with a disability rating of less than 30 percent was 3.3 percent, not statistically different than for those with a disability rating of 60 percent or higher (4.8 percent). Among veterans who served during Gulf War era II, 41 percent (1.7 million) reported a service-connected disability and nearly half of these veterans had a service-connected disability rating of 60 percent or higher. In August 2017, 75.8 percent of all Gulf War era II veterans with a service-connected disability were in the labor force, lower than the 85.5 percent for veterans from this period with no service-connected disability. Among Gulf War-era II veterans, the unemployment rate for those with a service-connected disability was 3.9 percent, not statistically different from those with no disability (4.8 percent).

- 4 -
In August 2017, 28 percent (946,000) of veterans who served during Gulf War era I reported a service-connected disability. Their labor force participation rate was lower (65.6 percent) than the rate for veterans from the era who did not have a disability (85.9 percent). The unemployment rate for Gulf War-era I veterans with a service-connected disability (4.3 percent) was not statistically different than that for Gulf War-era I veterans without a service-connected disability (2.8 percent). Among the 1.7 million veterans with a service-connected disability from World War II, the Korean War, and the Vietnam era, 15.4 percent were in the labor force in August 2017, lower than the 23.1 percent of veterans from these periods who did not have a service-connected disability. The unemployment rate of veterans from these wartime periods with a service-connected disability was 3.9 percent, lower than their counterparts with no disability (7.9 percent). Thirteen percent (633,000) of veterans who served during other service periods reported a service-connected disability in August 2017. The labor force participation rate of these veterans (38.6 percent) was lower than their counterparts without a service-connected disability (48.3 percent), while the unemployment rate was not statistically different for veterans with a service-connected disability (6.7 percent) and those with no disability (3.6 percent). Regardless of period of service, many veterans with a service-connected disability worked in the public sector. In August 2017, 33 percent of employed veterans with a disability worked in federal, state, or local government, compared with 19 percent of veterans with no disability and 13 percent of nonveterans. Nineteen percent of employed veterans with a disability worked for the federal government, compared with 7 percent of veterans with no disability and 2 percent of nonveterans. (See table 8.) Reserve and National Guard Membership In August 2017, about one-third of Gulf War-era veterans (August 1990 to present) were current or past members of the Reserve or National Guard. Labor force participation rates were higher for veterans who were current or past members of the Reserve or National Guard (82.4 percent), compared with veterans who were never members (79.4 percent). Among Gulf War-era veterans, those who were current or past members of the Reserve or National Guard had a lower unemployment rate than those who had never been members (2.5 percent and 4.5 percent, respectively). (See table 9.)
Adjustments to Veteran Population Estimates
Effective with data for November 2017, estimates for veterans incorporate population controls derived from an updated Department of Veterans Affairs population model. In accordance with usual practice, BLS did not revise estimates for previous years. Information about the updated veteran population model is available from the Department of Veterans Affairs at www.va.gov/vetdata/docs/Demographics/New_Vetpop_Model/Vetpop16_Overview.pdf.

Table A. Employment status of the civilian noninstitutional population 18 years and over by veteran status,period of service, and sex, 2016-2017 annual averages[Numbers in thousands]
Veteran status and period of service2016 2017
Total Men Women Total Men Women
TOTAL VETERANS
Civilian noninstitutional population.. . . . . . . . . . . . . . . . . . . . . . . . . . . . . . . . . . 20,895 18,881 2,014 20,387 18,387 2,000
Civilian labor force. . . . . . . . . . . . . . . . . . . . . . . . . . . . . . . . . . . . . . . . . . . . . . . . . . 10,581 9,334 1,247 10,125 8,934 1,191
Participation rate. . . . . . . . . . . . . . . . . . . . . . . . . . . . . . . . . . . . . . . . . . . . . . . . . . 50.6 49.4 61.9 49.7 48.6 59.6
Employed.. . . . . . . . . . . . . . . . . . . . . . . . . . . . . . . . . . . . . . . . . . . . . . . . . . . . . . . . . 10,129 8,944 1,184 9,755 8,613 1,142
Employment-population ratio. . . . . . . . . . . . . . . . . . . . . . . . . . . . . . . . . 48.5 47.4 58.8 47.8 46.8 57.1
Unemployed.. . . . . . . . . . . . . . . . . . . . . . . . . . . . . . . . . . . . . . . . . . . . . . . . . . . . . . 453 390 63 370 321 49
Unemployment rate. . . . . . . . . . . . . . . . . . . . . . . . . . . . . . . . . . . . . . . . . . . . 4.3 4.2 5.0 3.7 3.6 4.1
Not in labor force.. . . . . . . . . . . . . . . . . . . . . . . . . . . . . . . . . . . . . . . . . . . . . . . . . . . 10,314 9,547 767 10,262 9,454 808
Gulf War-era II veterans
Civilian noninstitutional population.. . . . . . . . . . . . . . . . . . . . . . . . . . . . . . . . . . 3,896 3,207 689 4,116 3,400 716
Civilian labor force. . . . . . . . . . . . . . . . . . . . . . . . . . . . . . . . . . . . . . . . . . . . . . . . . . 3,174 2,666 508 3,318 2,819 498
Participation rate. . . . . . . . . . . . . . . . . . . . . . . . . . . . . . . . . . . . . . . . . . . . . . . . . . 81.5 83.1 73.7 80.6 82.9 69.6
Employed.. . . . . . . . . . . . . . . . . . . . . . . . . . . . . . . . . . . . . . . . . . . . . . . . . . . . . . . . . 3,013 2,533 480 3,169 2,698 471
Employment-population ratio. . . . . . . . . . . . . . . . . . . . . . . . . . . . . . . . . 77.3 79.0 69.6 77.0 79.4 65.7
Unemployed.. . . . . . . . . . . . . . . . . . . . . . . . . . . . . . . . . . . . . . . . . . . . . . . . . . . . . . 161 133 28 149 121 28
Unemployment rate. . . . . . . . . . . . . . . . . . . . . . . . . . . . . . . . . . . . . . . . . . . . 5.1 5.0 5.6 4.5 4.3 5.5
Not in labor force.. . . . . . . . . . . . . . . . . . . . . . . . . . . . . . . . . . . . . . . . . . . . . . . . . . . 722 541 181 798 580 218
NONVETERANS
Civilian noninstitutional population.. . . . . . . . . . . . . . . . . . . . . . . . . . . . . . . . . . 223,649 99,107 124,541 225,619 100,301 125,318
Civilian labor force. . . . . . . . . . . . . . . . . . . . . . . . . . . . . . . . . . . . . . . . . . . . . . . . . . 146,479 74,393 72,086 147,957 75,154 72,803
Participation rate. . . . . . . . . . . . . . . . . . . . . . . . . . . . . . . . . . . . . . . . . . . . . . . . . . 65.5 75.1 57.9 65.6 74.9 58.1
Employed.. . . . . . . . . . . . . . . . . . . . . . . . . . . . . . . . . . . . . . . . . . . . . . . . . . . . . . . . . 139,560 70,799 68,761 141,692 71,907 69,785
Employment-population ratio. . . . . . . . . . . . . . . . . . . . . . . . . . . . . . . . . 62.4 71.4 55.2 62.8 71.7 55.7
Unemployed.. . . . . . . . . . . . . . . . . . . . . . . . . . . . . . . . . . . . . . . . . . . . . . . . . . . . . . 6,919 3,594 3,325 6,265 3,248 3,018
Unemployment rate. . . . . . . . . . . . . . . . . . . . . . . . . . . . . . . . . . . . . . . . . . . . 4.7 4.8 4.6 4.2 4.3 4.1
Not in labor force.. . . . . . . . . . . . . . . . . . . . . . . . . . . . . . . . . . . . . . . . . . . . . . . . . . . 77,170 24,714 52,455 77,662 25,147 52,515
NOTE: Veterans are men and women who served on active duty in the U.S. Armed Forces and were not on active duty at the time of the survey. GulfWar-era II veterans served on active duty anywhere in the world sometime since September 2001. Nonveterans never served on active duty in theU.S. Armed Forces.
Technical Note The data in this release were collected through the
Current Population Survey (CPS). The CPS—a monthly survey of about 60,000 eligible households conducted by the U.S. Census Bureau for the Bureau of Labor Statistics—obtains information on employment and unemployment among the nation's civilian noninstitutional population age 16 and over.
Most of the data in this release are annual averages for 2017, compiled from the results of the monthly survey. In August 2017, a supplement to the CPS collected additional information about veterans on topics such as service-connected disability, veterans' Reserve or National Guard status, and veterans who served in Iraq and/or Afghanistan. The supplement was co-sponsored by the U.S. Department of Veterans Affairs and by the U.S. Department of Labor's Veterans' Employment and Training Service. Questions were asked of persons 17 years of age and older regarding their prior service in the U.S. Armed Forces. Data are tabulated for persons 18 years of age and older.
Information in this release will be made available to sensory impaired individuals upon request. Voice phone: (202) 691-5200; Federal Relay Service: (800) 877-8339. Definitions
The definitions underlying the data in this release are as follows:
Veterans are men and women who previously served
on active duty in the U.S. Armed Forces and who were civilians at the time they were surveyed. Members of the Reserve and National Guard are counted as veterans if they had ever been called to active duty. Persons who are on active duty at the time of the survey are outside the scope of the survey and thus not in the estimates shown here, as are persons who reside in institutions, such as nursing homes and prisons.
Nonveterans are men and women who never served on
active duty in the U.S. Armed Forces. World War II, Korean War, Vietnam-era, and Gulf
War-era veterans are men and women who served in the U.S. Armed Forces during these periods of service, regardless of where in the world they served. Veterans who served in more than one wartime period are classified in the most recent one.
Veterans of other service periods are men and women
who served in the U.S. Armed Forces at any time other than World War II, the Korean War, the Vietnam era, or the Gulf War era. Although U.S. Armed Forces were engaged in several armed conflicts during other service periods, these conflicts were more limited in scope and included a smaller proportion of the Armed Forces than the selected wartime periods. Veterans who served during one of the selected wartime periods and during another period are classified in the wartime period.
Veteran status is obtained from responses to the
question, "Did you ever serve on active duty in the U.S. Armed Forces?"
Period of service identifies when a veteran served in the Armed Forces, but not the location of their service. It is obtained from answers to the question asked of veterans, "When did you serve on active duty in the U.S. Armed Forces?" The following service periods are identified:
Gulf War era II — September 2001-present Gulf War era I — August 1990-August 2001 Vietnam era — August 1964-April 1975 Korean War — July 1950-January 1955 World War II — December 1941-December 1946 Other service periods — All other time periods
Veterans could have served anywhere in the world
during these periods of service. Veterans are counted only in one period of service, their most recent wartime period. Veterans who served in more than one wartime period are classified in the most recent one. Veterans who served in both a wartime period and any other service period are classified in the wartime period. The period-of-service definitions are modified occasionally to reflect changes in law, regulations, and program needs of the survey sponsors.
Veterans who served in Iraq, Afghanistan, or both are individuals who served in Iraq at any time since March 2003, in Afghanistan at any time since October 2001, or in both locations. Service in Iraq or Afghanistan is determined by answers to two questions: "Did you serve in Iraq, off the coast of Iraq, or did you fly missions over Iraq at any time since March 2003?" and "Did you serve in Afghanistan, or did you fly missions over Afghanistan, at any time since October 2001?"
Presence of service-connected disability is determined by answers to the question, "Has the Department of Veterans Affairs (VA) or Department of Defense (DoD) determined that you have a service-connected disability, that is, a health condition or impairment caused or made worse by any of your military service?"
Service-connected disability rating is based on answers to the question, "What is your current service-connected disability rating?" Answers can range from 0 to 100 percent, in increments of 10 percentage points. Ratings are determined by the VA or DoD from a rating schedule published in the Code of Federal Regulations, Title 38, "Pensions, Bonuses, and Veterans' Relief," Part 4—"Schedule for Rating Disabilities." The rating schedule is "primarily a guide in the evaluation of disability resulting from all types of diseases and injuries encountered as a result of or incident to military service. The percentage ratings represent as far as can practicably be determined the average impairment in earning capacity resulting from such diseases

and injuries and their residual conditions in civil occupations." Part 4 contains a listing of hundreds of possible disorders and assigns ratings of 0 through 100 percent, with instructions for rating multiple disorders.
Reserve and National Guard membership refers only to
Gulf War-era veterans who are current or past members of the Reserve or National Guard. Members of the Reserve and National Guard are counted as veterans if they had ever been called to active duty. These data do not refer to all persons who may have ever served in the Reserve or National Guard. Reserve or National Guard status is obtained from answers to two questions. Gulf War-era veterans were asked: "Was any of your active service the result of a call-up from the Reserve or National Guard?" If the answer was no, they were asked, "Have you ever been a member of the Reserve or National Guard?" A 'yes' response to either question classified persons as "Current or past member of the Reserve or National Guard." A 'no' response to the latter question classified persons as "Never a member of the Reserve or National Guard." Reliability of the estimates
Statistics based on the CPS are subject to both sampling and nonsampling error. When a sample, rather than the entire population, is surveyed, there is a chance that the sample estimates will differ from the true population values they represent. The component of this difference that occurs because samples differ by chance is known as sampling error, and its variability is measured by the standard error of the estimate. There is about a 90-percent chance, or level of confidence, that an estimate based on a sample will differ by
no more than 1.6 standard errors from the true population value because of sampling error. BLS analyses are generally conducted at the 90-percent level of confidence.
The CPS data also are affected by nonsampling error. Nonsampling error can occur for many reasons, including the failure to sample a segment of the population, the inability to obtain information for all respondents in the sample, the inability or unwillingness of respondents to provide correct information, and errors made in the collection or processing of the data.
Information about the reliability of national data from the CPS and estimating standard errors is available at www.bls.gov/cps/documentation.htm#reliability.
For a discussion of the reliability of state estimates from the CPS, such as those in tables 6A and 6B of this release, see www.bls.gov/opub/gp/gpapndb.htm. Comparability of the estimates
Beginning with data for August 2015, estimates from the veterans supplement shown in tables 7 through 10 of this release reflect a change in the weighting methodology. As a result of this change, for August 2015 and later years, the estimates of the number of veterans with a service-connected disability, veteran Reserve or National Guard members, and veterans who served in Iraq or Afghanistan were higher than in previous years. The supplement data presented in this release are not strictly comparable with data for years before 2015 due to the change. See the note in the Employment Situation of Veterans 2015 news release for more information about the change in weighting methodology (www.bls.gov/news.release/archives/vet_03222016.pdf).

Table 1. Employment status of persons 18 years and over by veteran status, period of service, sex, race, andHispanic or Latino ethnicity, 2017 annual averages[Numbers in thousands]
Veteran status, period of service,
sex, race, and Hispanic or Latino ethnicity
Civiliannoninsti-tutional
population
Civilian labor force
Not inlaborforceTotal
Percentof
population
Employed Unemployed
TotalPercent
ofpopulation
Total
Percentof
laborforce
TOTAL
Total, 18 years and over. . . . . . . . . . . . . . . . . . . . . . . . . . . . . . . . . 246,006 158,082 64.3 151,447 61.6 6,635 4.2 87,924
Veterans.. . . . . . . . . . . . . . . . . . . . . . . . . . . . . . . . . . . . . . . . . . . . . . . . 20,387 10,125 49.7 9,755 47.8 370 3.7 10,262
Gulf War era, total. . . . . . . . . . . . . . . . . . . . . . . . . . . . . . . . . . 7,394 5,903 79.8 5,675 76.8 228 3.9 1,491
Gulf War era II. . . . . . . . . . . . . . . . . . . . . . . . . . . . . . . . . . . . 4,116 3,318 80.6 3,169 77.0 149 4.5 798
Gulf War era I. . . . . . . . . . . . . . . . . . . . . . . . . . . . . . . . . . . . . 3,279 2,585 78.9 2,507 76.4 79 3.1 693
WW II, Korean War, and Vietnam era. . . . . . . . . . . . 8,052 1,818 22.6 1,751 21.7 67 3.7 6,234
Other service periods. . . . . . . . . . . . . . . . . . . . . . . . . . . . . . . 4,941 2,404 48.7 2,329 47.1 75 3.1 2,537
Nonveterans. . . . . . . . . . . . . . . . . . . . . . . . . . . . . . . . . . . . . . . . . . . . 225,619 147,957 65.6 141,692 62.8 6,265 4.2 77,662
Men
Total, 18 years and over. . . . . . . . . . . . . . . . . . . . . . . . . . . . . . . . . 118,688 84,088 70.8 80,520 67.8 3,568 4.2 34,600
Veterans.. . . . . . . . . . . . . . . . . . . . . . . . . . . . . . . . . . . . . . . . . . . . . . . . 18,387 8,934 48.6 8,613 46.8 321 3.6 9,454
Gulf War era, total. . . . . . . . . . . . . . . . . . . . . . . . . . . . . . . . . . 6,175 5,035 81.5 4,848 78.5 188 3.7 1,139
Gulf War era II. . . . . . . . . . . . . . . . . . . . . . . . . . . . . . . . . . . . 3,400 2,819 82.9 2,698 79.4 121 4.3 580
Gulf War era I. . . . . . . . . . . . . . . . . . . . . . . . . . . . . . . . . . . . . 2,775 2,216 79.9 2,150 77.5 66 3.0 559
WW II, Korean War, and Vietnam era. . . . . . . . . . . . 7,764 1,758 22.6 1,693 21.8 66 3.7 6,006
Other service periods. . . . . . . . . . . . . . . . . . . . . . . . . . . . . . . 4,449 2,140 48.1 2,073 46.6 68 3.2 2,309
Nonveterans. . . . . . . . . . . . . . . . . . . . . . . . . . . . . . . . . . . . . . . . . . . . 100,301 75,154 74.9 71,907 71.7 3,248 4.3 25,147
Women
Total, 18 years and over. . . . . . . . . . . . . . . . . . . . . . . . . . . . . . . . . 127,318 73,994 58.1 70,927 55.7 3,067 4.1 53,323
Veterans.. . . . . . . . . . . . . . . . . . . . . . . . . . . . . . . . . . . . . . . . . . . . . . . . 2,000 1,191 59.6 1,142 57.1 49 4.1 808
Gulf War era, total. . . . . . . . . . . . . . . . . . . . . . . . . . . . . . . . . . 1,220 868 71.2 828 67.9 40 4.6 352
Gulf War era II. . . . . . . . . . . . . . . . . . . . . . . . . . . . . . . . . . . . 716 498 69.6 471 65.7 28 5.5 218
Gulf War era I. . . . . . . . . . . . . . . . . . . . . . . . . . . . . . . . . . . . . 504 370 73.4 357 70.9 13 3.4 134
WW II, Korean War, and Vietnam era. . . . . . . . . . . . 288 60 20.8 58 20.2 2 2.8 228
Other service periods. . . . . . . . . . . . . . . . . . . . . . . . . . . . . . . 492 264 53.6 256 52.1 7 2.7 228
Nonveterans. . . . . . . . . . . . . . . . . . . . . . . . . . . . . . . . . . . . . . . . . . . . 125,318 72,803 58.1 69,785 55.7 3,018 4.1 52,515
White
Total, 18 years and over. . . . . . . . . . . . . . . . . . . . . . . . . . . . . . . . . 192,255 123,175 64.1 118,657 61.7 4,518 3.7 69,080
Veterans.. . . . . . . . . . . . . . . . . . . . . . . . . . . . . . . . . . . . . . . . . . . . . . . . 16,867 8,122 48.2 7,846 46.5 276 3.4 8,745
Gulf War era, total. . . . . . . . . . . . . . . . . . . . . . . . . . . . . . . . . . 5,618 4,532 80.7 4,372 77.8 159 3.5 1,087
Gulf War era II. . . . . . . . . . . . . . . . . . . . . . . . . . . . . . . . . . . . 3,133 2,541 81.1 2,438 77.8 103 4.1 592
Gulf War era I. . . . . . . . . . . . . . . . . . . . . . . . . . . . . . . . . . . . . 2,485 1,990 80.1 1,934 77.8 56 2.8 494
WW II, Korean War, and Vietnam era. . . . . . . . . . . . 7,100 1,606 22.6 1,546 21.8 60 3.8 5,494
Other service periods. . . . . . . . . . . . . . . . . . . . . . . . . . . . . . . 4,148 1,984 47.8 1,928 46.5 56 2.8 2,164
Nonveterans. . . . . . . . . . . . . . . . . . . . . . . . . . . . . . . . . . . . . . . . . . . . 175,388 115,053 65.6 110,810 63.2 4,243 3.7 60,336
Black or African American
Total, 18 years and over. . . . . . . . . . . . . . . . . . . . . . . . . . . . . . . . . 30,970 19,900 64.3 18,459 59.6 1,442 7.2 11,070
Veterans.. . . . . . . . . . . . . . . . . . . . . . . . . . . . . . . . . . . . . . . . . . . . . . . . 2,587 1,465 56.6 1,390 53.7 75 5.1 1,122
Gulf War era, total. . . . . . . . . . . . . . . . . . . . . . . . . . . . . . . . . . 1,286 991 77.1 937 72.9 54 5.5 295
Gulf War era II. . . . . . . . . . . . . . . . . . . . . . . . . . . . . . . . . . . . 709 559 78.9 523 73.7 37 6.5 150
Gulf War era I. . . . . . . . . . . . . . . . . . . . . . . . . . . . . . . . . . . . . 577 432 74.9 414 71.8 18 4.1 145
WW II, Korean War, and Vietnam era. . . . . . . . . . . . 684 146 21.3 141 20.6 4 3.0 538
Other service periods. . . . . . . . . . . . . . . . . . . . . . . . . . . . . . . 617 328 53.2 312 50.5 16 5.0 289
Nonveterans. . . . . . . . . . . . . . . . . . . . . . . . . . . . . . . . . . . . . . . . . . . . 28,383 18,435 65.0 17,068 60.1 1,367 7.4 9,948
Asian
Total, 18 years and over. . . . . . . . . . . . . . . . . . . . . . . . . . . . . . . . . 14,804 9,641 65.1 9,316 62.9 325 3.4 5,163
Veterans.. . . . . . . . . . . . . . . . . . . . . . . . . . . . . . . . . . . . . . . . . . . . . . . . 336 202 60.1 199 59.1 3 1.6 134
Gulf War era, total. . . . . . . . . . . . . . . . . . . . . . . . . . . . . . . . . . 185 149 80.4 147 79.3 2 1.3 36
Gulf War era II. . . . . . . . . . . . . . . . . . . . . . . . . . . . . . . . . . . . 108 88 81.3 86 80.0 1 1.6 20
Gulf War era I. . . . . . . . . . . . . . . . . . . . . . . . . . . . . . . . . . . . . 78 61 79.1 61 78.4 1 0.9 16

Table 1. Employment status of persons 18 years and over by veteran status, period of service, sex, race, andHispanic or Latino ethnicity, 2017 annual averages — Continued[Numbers in thousands]
Veteran status, period of service,
sex, race, and Hispanic or Latino ethnicity
Civiliannoninsti-tutional
population
Civilian labor force
Not inlaborforceTotal
Percentof
population
Employed Unemployed
TotalPercent
ofpopulation
Total
Percentof
laborforce
WW II, Korean War, and Vietnam era. . . . . . . . . . . . 91 20 22.0 20 21.7 0 – 71
Other service periods. . . . . . . . . . . . . . . . . . . . . . . . . . . . . . . 60 33 55.3 32 53.8 1 – 27
Nonveterans. . . . . . . . . . . . . . . . . . . . . . . . . . . . . . . . . . . . . . . . . . . . 14,468 9,439 65.2 9,117 63.0 321 3.4 5,029
Hispanic or Latino ethnicity
Total, 18 years and over. . . . . . . . . . . . . . . . . . . . . . . . . . . . . . . . . 39,190 26,836 68.5 25,514 65.1 1,321 4.9 12,355
Veterans.. . . . . . . . . . . . . . . . . . . . . . . . . . . . . . . . . . . . . . . . . . . . . . . . 1,459 916 62.8 881 60.4 35 3.8 543
Gulf War era, total. . . . . . . . . . . . . . . . . . . . . . . . . . . . . . . . . . 798 642 80.4 619 77.5 23 3.6 156
Gulf War era II. . . . . . . . . . . . . . . . . . . . . . . . . . . . . . . . . . . . 527 420 79.7 403 76.5 17 4.0 107
Gulf War era I. . . . . . . . . . . . . . . . . . . . . . . . . . . . . . . . . . . . . 270 222 81.9 215 79.5 6 2.9 49
WW II, Korean War, and Vietnam era. . . . . . . . . . . . 374 103 27.5 99 26.4 4 4.0 271
Other service periods. . . . . . . . . . . . . . . . . . . . . . . . . . . . . . . 287 171 59.7 164 57.1 8 4.4 116
Nonveterans. . . . . . . . . . . . . . . . . . . . . . . . . . . . . . . . . . . . . . . . . . . . 37,732 25,919 68.7 24,633 65.3 1,287 5.0 11,812
NOTE: Veterans are men and women who served on active duty in the U.S. Armed Forces and were not on active duty at the time of the survey.Nonveterans never served on active duty in the U.S. Armed Forces. Veterans could have served anywhere in the world during these periods ofservice: Gulf War era II (September 2001-present), Gulf War era I (August 1990-August 2001), Vietnam era (August 1964-April 1975), Korean War(July 1950-January 1955), World War II (December 1941-December 1946), and other service periods (all other time periods). Veterans are counted inonly one period of service, their most recent wartime period. Veterans who served in more than one wartime period are classified in the most recentone. Veterans who served in both a wartime period and any other service period are classified in the wartime period. Estimates for the above racegroups (White, Black or African American, and Asian) do not sum to totals because data are not presented for all races. Persons whose ethnicity isidentified as Hispanic or Latino may be of any race. Dash indicates no data or data that do not meet publication criteria (values not shown wherebase is less than 35,000).
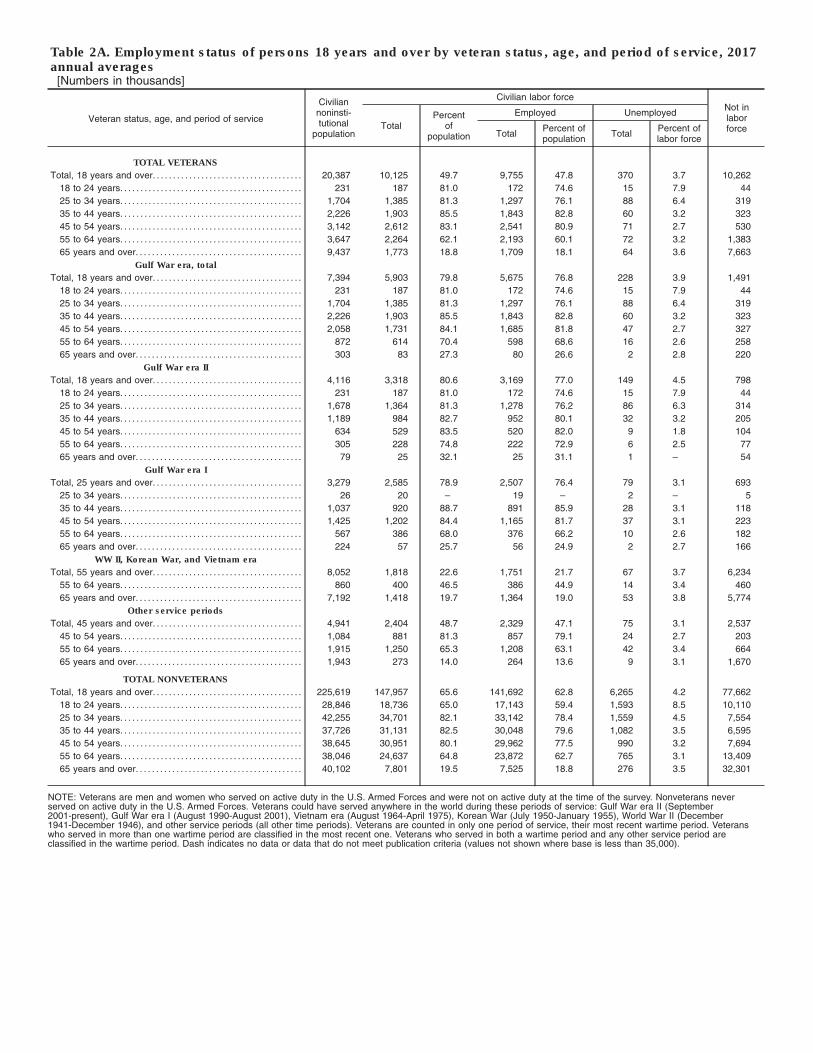
Table 2A. Employment status of persons 18 years and over by veteran status, age, and period of service, 2017annual averages[Numbers in thousands]
Veteran status, age, and period of service
Civiliannoninsti-tutional
population
Civilian labor forceNot inlaborforceTotal
Percentof
population
Employed Unemployed
TotalPercent ofpopulation
TotalPercent oflabor force
TOTAL VETERANS
Total, 18 years and over. . . . . . . . . . . . . . . . . . . . . . . . . . . . . . . . . . . . . 20,387 10,125 49.7 9,755 47.8 370 3.7 10,262
18 to 24 years. . . . . . . . . . . . . . . . . . . . . . . . . . . . . . . . . . . . . . . . . . . . . 231 187 81.0 172 74.6 15 7.9 44
25 to 34 years. . . . . . . . . . . . . . . . . . . . . . . . . . . . . . . . . . . . . . . . . . . . . 1,704 1,385 81.3 1,297 76.1 88 6.4 319
35 to 44 years. . . . . . . . . . . . . . . . . . . . . . . . . . . . . . . . . . . . . . . . . . . . . 2,226 1,903 85.5 1,843 82.8 60 3.2 323
45 to 54 years. . . . . . . . . . . . . . . . . . . . . . . . . . . . . . . . . . . . . . . . . . . . . 3,142 2,612 83.1 2,541 80.9 71 2.7 530
55 to 64 years. . . . . . . . . . . . . . . . . . . . . . . . . . . . . . . . . . . . . . . . . . . . . 3,647 2,264 62.1 2,193 60.1 72 3.2 1,383
65 years and over. . . . . . . . . . . . . . . . . . . . . . . . . . . . . . . . . . . . . . . . . 9,437 1,773 18.8 1,709 18.1 64 3.6 7,663
Gulf War era, total
Total, 18 years and over. . . . . . . . . . . . . . . . . . . . . . . . . . . . . . . . . . . . . 7,394 5,903 79.8 5,675 76.8 228 3.9 1,491
18 to 24 years. . . . . . . . . . . . . . . . . . . . . . . . . . . . . . . . . . . . . . . . . . . . . 231 187 81.0 172 74.6 15 7.9 44
25 to 34 years. . . . . . . . . . . . . . . . . . . . . . . . . . . . . . . . . . . . . . . . . . . . . 1,704 1,385 81.3 1,297 76.1 88 6.4 319
35 to 44 years. . . . . . . . . . . . . . . . . . . . . . . . . . . . . . . . . . . . . . . . . . . . . 2,226 1,903 85.5 1,843 82.8 60 3.2 323
45 to 54 years. . . . . . . . . . . . . . . . . . . . . . . . . . . . . . . . . . . . . . . . . . . . . 2,058 1,731 84.1 1,685 81.8 47 2.7 327
55 to 64 years. . . . . . . . . . . . . . . . . . . . . . . . . . . . . . . . . . . . . . . . . . . . . 872 614 70.4 598 68.6 16 2.6 258
65 years and over. . . . . . . . . . . . . . . . . . . . . . . . . . . . . . . . . . . . . . . . . 303 83 27.3 80 26.6 2 2.8 220
Gulf War era II
Total, 18 years and over. . . . . . . . . . . . . . . . . . . . . . . . . . . . . . . . . . . . . 4,116 3,318 80.6 3,169 77.0 149 4.5 798
18 to 24 years. . . . . . . . . . . . . . . . . . . . . . . . . . . . . . . . . . . . . . . . . . . . . 231 187 81.0 172 74.6 15 7.9 44
25 to 34 years. . . . . . . . . . . . . . . . . . . . . . . . . . . . . . . . . . . . . . . . . . . . . 1,678 1,364 81.3 1,278 76.2 86 6.3 314
35 to 44 years. . . . . . . . . . . . . . . . . . . . . . . . . . . . . . . . . . . . . . . . . . . . . 1,189 984 82.7 952 80.1 32 3.2 205
45 to 54 years. . . . . . . . . . . . . . . . . . . . . . . . . . . . . . . . . . . . . . . . . . . . . 634 529 83.5 520 82.0 9 1.8 104
55 to 64 years. . . . . . . . . . . . . . . . . . . . . . . . . . . . . . . . . . . . . . . . . . . . . 305 228 74.8 222 72.9 6 2.5 77
65 years and over. . . . . . . . . . . . . . . . . . . . . . . . . . . . . . . . . . . . . . . . . 79 25 32.1 25 31.1 1 – 54
Gulf War era I
Total, 25 years and over. . . . . . . . . . . . . . . . . . . . . . . . . . . . . . . . . . . . . 3,279 2,585 78.9 2,507 76.4 79 3.1 693
25 to 34 years. . . . . . . . . . . . . . . . . . . . . . . . . . . . . . . . . . . . . . . . . . . . . 26 20 – 19 – 2 – 5
35 to 44 years. . . . . . . . . . . . . . . . . . . . . . . . . . . . . . . . . . . . . . . . . . . . . 1,037 920 88.7 891 85.9 28 3.1 118
45 to 54 years. . . . . . . . . . . . . . . . . . . . . . . . . . . . . . . . . . . . . . . . . . . . . 1,425 1,202 84.4 1,165 81.7 37 3.1 223
55 to 64 years. . . . . . . . . . . . . . . . . . . . . . . . . . . . . . . . . . . . . . . . . . . . . 567 386 68.0 376 66.2 10 2.6 182
65 years and over. . . . . . . . . . . . . . . . . . . . . . . . . . . . . . . . . . . . . . . . . 224 57 25.7 56 24.9 2 2.7 166
WW II, Korean War, and Vietnam era
Total, 55 years and over. . . . . . . . . . . . . . . . . . . . . . . . . . . . . . . . . . . . . 8,052 1,818 22.6 1,751 21.7 67 3.7 6,234
55 to 64 years. . . . . . . . . . . . . . . . . . . . . . . . . . . . . . . . . . . . . . . . . . . . . 860 400 46.5 386 44.9 14 3.4 460
65 years and over. . . . . . . . . . . . . . . . . . . . . . . . . . . . . . . . . . . . . . . . . 7,192 1,418 19.7 1,364 19.0 53 3.8 5,774
Other service periods
Total, 45 years and over. . . . . . . . . . . . . . . . . . . . . . . . . . . . . . . . . . . . . 4,941 2,404 48.7 2,329 47.1 75 3.1 2,537
45 to 54 years. . . . . . . . . . . . . . . . . . . . . . . . . . . . . . . . . . . . . . . . . . . . . 1,084 881 81.3 857 79.1 24 2.7 203
55 to 64 years. . . . . . . . . . . . . . . . . . . . . . . . . . . . . . . . . . . . . . . . . . . . . 1,915 1,250 65.3 1,208 63.1 42 3.4 664
65 years and over. . . . . . . . . . . . . . . . . . . . . . . . . . . . . . . . . . . . . . . . . 1,943 273 14.0 264 13.6 9 3.1 1,670
TOTAL NONVETERANS
Total, 18 years and over. . . . . . . . . . . . . . . . . . . . . . . . . . . . . . . . . . . . . 225,619 147,957 65.6 141,692 62.8 6,265 4.2 77,662
18 to 24 years. . . . . . . . . . . . . . . . . . . . . . . . . . . . . . . . . . . . . . . . . . . . . 28,846 18,736 65.0 17,143 59.4 1,593 8.5 10,110
25 to 34 years. . . . . . . . . . . . . . . . . . . . . . . . . . . . . . . . . . . . . . . . . . . . . 42,255 34,701 82.1 33,142 78.4 1,559 4.5 7,554
35 to 44 years. . . . . . . . . . . . . . . . . . . . . . . . . . . . . . . . . . . . . . . . . . . . . 37,726 31,131 82.5 30,048 79.6 1,082 3.5 6,595
45 to 54 years. . . . . . . . . . . . . . . . . . . . . . . . . . . . . . . . . . . . . . . . . . . . . 38,645 30,951 80.1 29,962 77.5 990 3.2 7,694
55 to 64 years. . . . . . . . . . . . . . . . . . . . . . . . . . . . . . . . . . . . . . . . . . . . . 38,046 24,637 64.8 23,872 62.7 765 3.1 13,409
65 years and over. . . . . . . . . . . . . . . . . . . . . . . . . . . . . . . . . . . . . . . . . 40,102 7,801 19.5 7,525 18.8 276 3.5 32,301
NOTE: Veterans are men and women who served on active duty in the U.S. Armed Forces and were not on active duty at the time of the survey. Nonveterans neverserved on active duty in the U.S. Armed Forces. Veterans could have served anywhere in the world during these periods of service: Gulf War era II (September2001-present), Gulf War era I (August 1990-August 2001), Vietnam era (August 1964-April 1975), Korean War (July 1950-January 1955), World War II (December1941-December 1946), and other service periods (all other time periods). Veterans are counted in only one period of service, their most recent wartime period. Veteranswho served in more than one wartime period are classified in the most recent one. Veterans who served in both a wartime period and any other service period areclassified in the wartime period. Dash indicates no data or data that do not meet publication criteria (values not shown where base is less than 35,000).

Table 2B. Employment status of men 18 years and over by veteran status, age, and period of service, 2017annual averages[Numbers in thousands]
Veteran status, age, and period of service
Civiliannoninsti-tutional
population
Civilian labor forceNot inlaborforceTotal
Percentof
population
Employed Unemployed
TotalPercent ofpopulation
TotalPercent oflabor force
VETERANS, MEN
Total, 18 years and over. . . . . . . . . . . . . . . . . . . . . . . . . . . . . . . . . . . . . 18,387 8,934 48.6 8,613 46.8 321 3.6 9,454
18 to 24 years. . . . . . . . . . . . . . . . . . . . . . . . . . . . . . . . . . . . . . . . . . . . . 183 157 85.6 144 78.4 13 8.4 26
25 to 34 years. . . . . . . . . . . . . . . . . . . . . . . . . . . . . . . . . . . . . . . . . . . . . 1,396 1,167 83.6 1,096 78.5 71 6.1 229
35 to 44 years. . . . . . . . . . . . . . . . . . . . . . . . . . . . . . . . . . . . . . . . . . . . . 1,825 1,606 88.0 1,556 85.2 50 3.1 219
45 to 54 years. . . . . . . . . . . . . . . . . . . . . . . . . . . . . . . . . . . . . . . . . . . . . 2,675 2,259 84.5 2,199 82.2 60 2.7 416
55 to 64 years. . . . . . . . . . . . . . . . . . . . . . . . . . . . . . . . . . . . . . . . . . . . . 3,236 2,028 62.7 1,964 60.7 64 3.2 1,208
65 years and over. . . . . . . . . . . . . . . . . . . . . . . . . . . . . . . . . . . . . . . . . 9,072 1,716 18.9 1,653 18.2 62 3.6 7,356
Gulf War era, total
Total, 18 years and over. . . . . . . . . . . . . . . . . . . . . . . . . . . . . . . . . . . . . 6,175 5,035 81.5 4,848 78.5 188 3.7 1,139
18 to 24 years. . . . . . . . . . . . . . . . . . . . . . . . . . . . . . . . . . . . . . . . . . . . . 183 157 85.6 144 78.4 13 8.4 26
25 to 34 years. . . . . . . . . . . . . . . . . . . . . . . . . . . . . . . . . . . . . . . . . . . . . 1,396 1,167 83.6 1,096 78.5 71 6.1 229
35 to 44 years. . . . . . . . . . . . . . . . . . . . . . . . . . . . . . . . . . . . . . . . . . . . . 1,825 1,606 88.0 1,556 85.2 50 3.1 219
45 to 54 years. . . . . . . . . . . . . . . . . . . . . . . . . . . . . . . . . . . . . . . . . . . . . 1,743 1,494 85.7 1,456 83.5 38 2.5 249
55 to 64 years. . . . . . . . . . . . . . . . . . . . . . . . . . . . . . . . . . . . . . . . . . . . . 755 538 71.3 525 69.5 13 2.5 217
65 years and over. . . . . . . . . . . . . . . . . . . . . . . . . . . . . . . . . . . . . . . . . 272 73 26.9 71 26.1 2 3.0 199
Gulf War era II
Total, 18 years and over. . . . . . . . . . . . . . . . . . . . . . . . . . . . . . . . . . . . . 3,400 2,819 82.9 2,698 79.4 121 4.3 580
18 to 24 years. . . . . . . . . . . . . . . . . . . . . . . . . . . . . . . . . . . . . . . . . . . . . 183 157 85.6 144 78.4 13 8.4 26
25 to 34 years. . . . . . . . . . . . . . . . . . . . . . . . . . . . . . . . . . . . . . . . . . . . . 1,377 1,151 83.6 1,082 78.6 69 6.0 225
35 to 44 years. . . . . . . . . . . . . . . . . . . . . . . . . . . . . . . . . . . . . . . . . . . . . 965 831 86.1 804 83.3 27 3.3 134
45 to 54 years. . . . . . . . . . . . . . . . . . . . . . . . . . . . . . . . . . . . . . . . . . . . . 542 461 85.0 454 83.7 7 1.5 81
55 to 64 years. . . . . . . . . . . . . . . . . . . . . . . . . . . . . . . . . . . . . . . . . . . . . 262 197 75.2 193 73.6 4 2.1 65
65 years and over. . . . . . . . . . . . . . . . . . . . . . . . . . . . . . . . . . . . . . . . . 70 22 31.6 22 30.7 1 – 48
Gulf War era I
Total, 25 years and over. . . . . . . . . . . . . . . . . . . . . . . . . . . . . . . . . . . . . 2,775 2,216 79.9 2,150 77.5 66 3.0 559
25 to 34 years. . . . . . . . . . . . . . . . . . . . . . . . . . . . . . . . . . . . . . . . . . . . . 19 16 – 14 – 2 – 3
35 to 44 years. . . . . . . . . . . . . . . . . . . . . . . . . . . . . . . . . . . . . . . . . . . . . 860 775 90.1 752 87.4 23 3.0 85
45 to 54 years. . . . . . . . . . . . . . . . . . . . . . . . . . . . . . . . . . . . . . . . . . . . . 1,201 1,033 86.0 1,002 83.4 31 3.0 168
55 to 64 years. . . . . . . . . . . . . . . . . . . . . . . . . . . . . . . . . . . . . . . . . . . . . 493 341 69.2 332 67.3 9 2.7 152
65 years and over. . . . . . . . . . . . . . . . . . . . . . . . . . . . . . . . . . . . . . . . . 202 51 25.2 49 24.5 2 3.1 151
WW II, Korean War, and Vietnam era
Total, 55 years and over. . . . . . . . . . . . . . . . . . . . . . . . . . . . . . . . . . . . . 7,764 1,758 22.6 1,693 21.8 66 3.7 6,006
55 to 64 years. . . . . . . . . . . . . . . . . . . . . . . . . . . . . . . . . . . . . . . . . . . . . 805 378 47.0 365 45.3 13 3.5 427
65 years and over. . . . . . . . . . . . . . . . . . . . . . . . . . . . . . . . . . . . . . . . . 6,959 1,380 19.8 1,327 19.1 52 3.8 5,579
Other service periods
Total, 45 years and over. . . . . . . . . . . . . . . . . . . . . . . . . . . . . . . . . . . . . 4,449 2,140 48.1 2,073 46.6 68 3.2 2,309
45 to 54 years. . . . . . . . . . . . . . . . . . . . . . . . . . . . . . . . . . . . . . . . . . . . . 932 766 82.2 743 79.8 22 2.9 166
55 to 64 years. . . . . . . . . . . . . . . . . . . . . . . . . . . . . . . . . . . . . . . . . . . . . 1,676 1,112 66.3 1,074 64.1 37 3.4 564
65 years and over. . . . . . . . . . . . . . . . . . . . . . . . . . . . . . . . . . . . . . . . . 1,841 263 14.3 255 13.8 8 3.0 1,578
NONVETERANS, MEN
Total, 18 years and over. . . . . . . . . . . . . . . . . . . . . . . . . . . . . . . . . . . . . 100,301 75,154 74.9 71,907 71.7 3,248 4.3 25,147
18 to 24 years. . . . . . . . . . . . . . . . . . . . . . . . . . . . . . . . . . . . . . . . . . . . . 14,449 9,674 66.9 8,738 60.5 936 9.7 4,775
25 to 34 years. . . . . . . . . . . . . . . . . . . . . . . . . . . . . . . . . . . . . . . . . . . . . 20,424 18,206 89.1 17,394 85.2 813 4.5 2,217
35 to 44 years. . . . . . . . . . . . . . . . . . . . . . . . . . . . . . . . . . . . . . . . . . . . . 17,772 16,170 91.0 15,646 88.0 524 3.2 1,602
45 to 54 years. . . . . . . . . . . . . . . . . . . . . . . . . . . . . . . . . . . . . . . . . . . . . 17,759 15,403 86.7 14,926 84.0 476 3.1 2,357
55 to 64 years. . . . . . . . . . . . . . . . . . . . . . . . . . . . . . . . . . . . . . . . . . . . . 16,820 12,130 72.1 11,746 69.8 384 3.2 4,690
65 years and over. . . . . . . . . . . . . . . . . . . . . . . . . . . . . . . . . . . . . . . . . 13,077 3,571 27.3 3,457 26.4 114 3.2 9,506
NOTE: Veterans are men and women who served on active duty in the U.S. Armed Forces and were not on active duty at the time of the survey. Nonveterans neverserved on active duty in the U.S. Armed Forces. Veterans could have served anywhere in the world during these periods of service: Gulf War era II (September2001-present), Gulf War era I (August 1990-August 2001), Vietnam era (August 1964-April 1975), Korean War (July 1950-January 1955), World War II (December1941-December 1946), and other service periods (all other time periods). Veterans are counted in only one period of service, their most recent wartime period. Veteranswho served in more than one wartime period are classified in the most recent one. Veterans who served in both a wartime period and any other service period areclassified in the wartime period. Dash indicates no data or data that do not meet publication criteria (values not shown where base is less than 35,000).
Table 2C. Employment status of women 18 years and over by veteran status, age, and period of service, 2017annual averages[Numbers in thousands]
Veteran status, age, and period of service
Civiliannoninsti-tutional
population
Civilian labor forceNot inlaborforceTotal
Percentof
population
Employed Unemployed
TotalPercent ofpopulation
TotalPercent oflabor force
VETERANS, WOMEN
Total, 18 years and over. . . . . . . . . . . . . . . . . . . . . . . . . . . . . . . . . . . . . 2,000 1,191 59.6 1,142 57.1 49 4.1 808
18 to 24 years. . . . . . . . . . . . . . . . . . . . . . . . . . . . . . . . . . . . . . . . . . . . . 48 30 63.5 29 60.0 2 – 17
25 to 34 years. . . . . . . . . . . . . . . . . . . . . . . . . . . . . . . . . . . . . . . . . . . . . 308 218 70.7 200 65.1 17 7.9 90
35 to 44 years. . . . . . . . . . . . . . . . . . . . . . . . . . . . . . . . . . . . . . . . . . . . . 401 297 74.0 287 71.6 10 3.2 104
45 to 54 years. . . . . . . . . . . . . . . . . . . . . . . . . . . . . . . . . . . . . . . . . . . . . 467 353 75.5 342 73.2 11 3.0 114
55 to 64 years. . . . . . . . . . . . . . . . . . . . . . . . . . . . . . . . . . . . . . . . . . . . . 411 236 57.4 228 55.5 8 3.3 175
65 years and over. . . . . . . . . . . . . . . . . . . . . . . . . . . . . . . . . . . . . . . . . 365 58 15.8 56 15.3 2 3.6 307
Gulf War era, total
Total, 18 years and over. . . . . . . . . . . . . . . . . . . . . . . . . . . . . . . . . . . . . 1,220 868 71.2 828 67.9 40 4.6 352
18 to 24 years. . . . . . . . . . . . . . . . . . . . . . . . . . . . . . . . . . . . . . . . . . . . . 48 30 63.5 29 60.0 2 – 17
25 to 34 years. . . . . . . . . . . . . . . . . . . . . . . . . . . . . . . . . . . . . . . . . . . . . 308 218 70.7 200 65.1 17 7.9 90
35 to 44 years. . . . . . . . . . . . . . . . . . . . . . . . . . . . . . . . . . . . . . . . . . . . . 401 297 74.0 287 71.6 10 3.2 104
45 to 54 years. . . . . . . . . . . . . . . . . . . . . . . . . . . . . . . . . . . . . . . . . . . . . 316 238 75.3 229 72.5 9 3.8 78
55 to 64 years. . . . . . . . . . . . . . . . . . . . . . . . . . . . . . . . . . . . . . . . . . . . . 117 76 64.8 73 62.5 3 3.5 41
65 years and over. . . . . . . . . . . . . . . . . . . . . . . . . . . . . . . . . . . . . . . . . 30 10 – 9 – 0 – 21
Gulf War era II
Total, 18 years and over. . . . . . . . . . . . . . . . . . . . . . . . . . . . . . . . . . . . . 716 498 69.6 471 65.7 28 5.5 218
18 to 24 years. . . . . . . . . . . . . . . . . . . . . . . . . . . . . . . . . . . . . . . . . . . . . 48 30 63.5 29 60.0 2 – 17
25 to 34 years. . . . . . . . . . . . . . . . . . . . . . . . . . . . . . . . . . . . . . . . . . . . . 301 213 70.7 196 65.0 17 8.0 88
35 to 44 years. . . . . . . . . . . . . . . . . . . . . . . . . . . . . . . . . . . . . . . . . . . . . 224 152 68.1 148 66.0 5 3.1 71
45 to 54 years. . . . . . . . . . . . . . . . . . . . . . . . . . . . . . . . . . . . . . . . . . . . . 91 68 74.8 66 72.2 2 3.6 23
55 to 64 years. . . . . . . . . . . . . . . . . . . . . . . . . . . . . . . . . . . . . . . . . . . . . 43 31 72.8 30 69.0 2 – 12
65 years and over. . . . . . . . . . . . . . . . . . . . . . . . . . . . . . . . . . . . . . . . . 9 3 – 3 – 0 – 6
Gulf War era I
Total, 25 years and over. . . . . . . . . . . . . . . . . . . . . . . . . . . . . . . . . . . . . 504 370 73.4 357 70.9 13 3.4 134
25 to 34 years. . . . . . . . . . . . . . . . . . . . . . . . . . . . . . . . . . . . . . . . . . . . . 7 5 – 5 – 0 – 2
35 to 44 years. . . . . . . . . . . . . . . . . . . . . . . . . . . . . . . . . . . . . . . . . . . . . 177 144 81.6 139 78.8 5 3.4 33
45 to 54 years. . . . . . . . . . . . . . . . . . . . . . . . . . . . . . . . . . . . . . . . . . . . . 224 169 75.5 163 72.6 6 3.8 55
55 to 64 years. . . . . . . . . . . . . . . . . . . . . . . . . . . . . . . . . . . . . . . . . . . . . 74 45 60.2 44 58.8 1 2.4 30
65 years and over. . . . . . . . . . . . . . . . . . . . . . . . . . . . . . . . . . . . . . . . . 22 6 – 6 – 0 – 15
WW II, Korean War, and Vietnam era
Total, 55 years and over. . . . . . . . . . . . . . . . . . . . . . . . . . . . . . . . . . . . . 288 60 20.8 58 20.2 2 2.8 228
55 to 64 years. . . . . . . . . . . . . . . . . . . . . . . . . . . . . . . . . . . . . . . . . . . . . 55 22 39.0 21 38.3 0 – 34
65 years and over. . . . . . . . . . . . . . . . . . . . . . . . . . . . . . . . . . . . . . . . . 233 38 16.4 37 15.9 1 3.4 195
Other service periods
Total, 45 years and over. . . . . . . . . . . . . . . . . . . . . . . . . . . . . . . . . . . . . 492 264 53.6 256 52.1 7 2.7 228
45 to 54 years. . . . . . . . . . . . . . . . . . . . . . . . . . . . . . . . . . . . . . . . . . . . . 151 115 75.9 113 74.8 2 1.5 36
55 to 64 years. . . . . . . . . . . . . . . . . . . . . . . . . . . . . . . . . . . . . . . . . . . . . 239 139 58.0 134 56.0 5 3.5 100
65 years and over. . . . . . . . . . . . . . . . . . . . . . . . . . . . . . . . . . . . . . . . . 102 10 9.8 9 9.2 1 – 92
NONVETERANS, WOMEN
Total, 18 years and over. . . . . . . . . . . . . . . . . . . . . . . . . . . . . . . . . . . . . 125,318 72,803 58.1 69,785 55.7 3,018 4.1 52,515
18 to 24 years. . . . . . . . . . . . . . . . . . . . . . . . . . . . . . . . . . . . . . . . . . . . . 14,397 9,062 62.9 8,405 58.4 657 7.2 5,335
25 to 34 years. . . . . . . . . . . . . . . . . . . . . . . . . . . . . . . . . . . . . . . . . . . . . 21,831 16,494 75.6 15,748 72.1 746 4.5 5,337
35 to 44 years. . . . . . . . . . . . . . . . . . . . . . . . . . . . . . . . . . . . . . . . . . . . . 19,954 14,960 75.0 14,402 72.2 558 3.7 4,993
45 to 54 years. . . . . . . . . . . . . . . . . . . . . . . . . . . . . . . . . . . . . . . . . . . . . 20,885 15,549 74.4 15,035 72.0 513 3.3 5,337
55 to 64 years. . . . . . . . . . . . . . . . . . . . . . . . . . . . . . . . . . . . . . . . . . . . . 21,226 12,507 58.9 12,126 57.1 381 3.0 8,719
65 years and over. . . . . . . . . . . . . . . . . . . . . . . . . . . . . . . . . . . . . . . . . 27,025 4,230 15.7 4,068 15.1 162 3.8 22,795
NOTE: Veterans are men and women who served on active duty in the U.S. Armed Forces and were not on active duty at the time of the survey. Nonveterans neverserved on active duty in the U.S. Armed Forces. Veterans could have served anywhere in the world during these periods of service: Gulf War era II (September2001-present), Gulf War era I (August 1990-August 2001), Vietnam era (August 1964-April 1975), Korean War (July 1950-January 1955), World War II (December1941-December 1946), and other service periods (all other time periods). Veterans are counted in only one period of service, their most recent wartime period. Veteranswho served in more than one wartime period are classified in the most recent one. Veterans who served in both a wartime period and any other service period areclassified in the wartime period. Dash indicates no data or data that do not meet publication criteria (values not shown where base is less than 35,000).

Table 3. Employment status of persons 25 years and over by veteran status, period of service, and educationalattainment, 2017 annual averages[Numbers in thousands]
Veteran status,
period of service, and educational attainment
Civiliannoninsti-tutional
population
Civilian labor force
Not inlaborforceTotal
Percentof
population
Employed Unemployed
TotalPercent
ofpopulation
Total
Percentof
laborforce
VETERANS
Total, 25 years and over. . . . . . . . . . . . . . . . . . . . . . . . . . . . . . . . . 20,156 9,938 49.3 9,583 47.5 355 3.6 10,218
Less than a high school diploma. . . . . . . . . . . . . . . . . . . . 876 187 21.3 173 19.8 13 7.0 689
High school graduates, no college. . . . . . . . . . . . . . . . . . 5,890 2,566 43.6 2,467 41.9 99 3.9 3,323
Some college or associate degree. . . . . . . . . . . . . . . . . . 7,026 3,665 52.2 3,514 50.0 151 4.1 3,361
Bachelor’s degree and higher. . . . . . . . . . . . . . . . . . . . . . . . 6,365 3,520 55.3 3,428 53.9 92 2.6 2,845
Gulf War era, total
Total, 25 years and over. . . . . . . . . . . . . . . . . . . . . . . . . . . . . . . . . 7,163 5,716 79.8 5,503 76.8 213 3.7 1,447
Less than a high school diploma. . . . . . . . . . . . . . . . . . . . 88 54 61.5 50 57.2 4 7.0 34
High school graduates, no college. . . . . . . . . . . . . . . . . . 1,578 1,257 79.7 1,200 76.0 57 4.6 321
Some college or associate degree. . . . . . . . . . . . . . . . . . 2,884 2,221 77.0 2,123 73.6 98 4.4 664
Bachelor’s degree and higher. . . . . . . . . . . . . . . . . . . . . . . . 2,613 2,184 83.6 2,130 81.5 54 2.5 429
Gulf War era II
Total, 25 years and over. . . . . . . . . . . . . . . . . . . . . . . . . . . . . . . . . 3,885 3,131 80.6 2,997 77.1 134 4.3 754
Less than a high school diploma. . . . . . . . . . . . . . . . . . . . 48 27 56.5 25 51.2 3 – 21
High school graduates, no college. . . . . . . . . . . . . . . . . . 799 654 81.9 616 77.1 38 5.9 144
Some college or associate degree. . . . . . . . . . . . . . . . . . 1,614 1,220 75.6 1,158 71.7 62 5.1 394
Bachelor’s degree and higher. . . . . . . . . . . . . . . . . . . . . . . . 1,423 1,229 86.3 1,198 84.2 31 2.5 195
Gulf War era I
Total, 25 years and over. . . . . . . . . . . . . . . . . . . . . . . . . . . . . . . . . 3,279 2,585 78.9 2,507 76.4 79 3.1 693
Less than a high school diploma. . . . . . . . . . . . . . . . . . . . 40 27 67.6 26 64.5 1 – 13
High school graduates, no college. . . . . . . . . . . . . . . . . . 779 603 77.4 584 74.9 19 3.2 176
Some college or associate degree. . . . . . . . . . . . . . . . . . 1,270 1,000 78.8 965 76.0 35 3.5 269
Bachelor’s degree and higher. . . . . . . . . . . . . . . . . . . . . . . . 1,190 955 80.3 932 78.3 23 2.4 234
WWII, Korean War, and Vietnam era
Total, 25 years and over. . . . . . . . . . . . . . . . . . . . . . . . . . . . . . . . . 8,052 1,818 22.6 1,751 21.7 67 3.7 6,234
Less than a high school diploma. . . . . . . . . . . . . . . . . . . . 509 62 12.3 58 11.4 4 7.0 447
High school graduates, no college. . . . . . . . . . . . . . . . . . 2,547 499 19.6 480 18.9 19 3.8 2,047
Some college or associate degree. . . . . . . . . . . . . . . . . . 2,528 584 23.1 558 22.1 26 4.4 1,944
Bachelor’s degree and higher. . . . . . . . . . . . . . . . . . . . . . . . 2,469 673 27.2 654 26.5 18 2.7 1,796
Other service periods
Total, 25 years and over. . . . . . . . . . . . . . . . . . . . . . . . . . . . . . . . . 4,941 2,404 48.7 2,329 47.1 75 3.1 2,537
Less than a high school diploma. . . . . . . . . . . . . . . . . . . . 279 70 25.1 65 23.4 5 7.0 209
High school graduates, no college. . . . . . . . . . . . . . . . . . 1,765 810 45.9 787 44.6 23 2.8 955
Some college or associate degree. . . . . . . . . . . . . . . . . . 1,614 861 53.3 833 51.6 27 3.2 754
Bachelor’s degree and higher. . . . . . . . . . . . . . . . . . . . . . . . 1,283 664 51.7 644 50.2 20 3.0 619
NONVETERANS
Total, 25 years and over. . . . . . . . . . . . . . . . . . . . . . . . . . . . . . . . . 196,773 129,221 65.7 124,549 63.3 4,673 3.6 67,552
Less than a high school diploma. . . . . . . . . . . . . . . . . . . . 21,596 10,040 46.5 9,386 43.5 654 6.5 11,556
High school graduates, no college. . . . . . . . . . . . . . . . . . 56,169 33,229 59.2 31,669 56.4 1,560 4.7 22,940
Some college or associate degree. . . . . . . . . . . . . . . . . . 50,520 34,232 67.8 32,958 65.2 1,274 3.7 16,288
Bachelor’s degree and higher. . . . . . . . . . . . . . . . . . . . . . . . 68,489 51,721 75.5 50,536 73.8 1,185 2.3 16,768
NOTE: Veterans are men and women who served on active duty in the U.S. Armed Forces and were not on active duty at the time of the survey.Nonveterans never served on active duty in the U.S. Armed Forces. Veterans could have served anywhere in the world during these periods ofservice: Gulf War era II (September 2001-present), Gulf War era I (August 1990-August 2001), Vietnam era (August 1964-April 1975), Korean War(July 1950-January 1955), World War II (December 1941-December 1946), and other service periods (all other time periods). Veterans are counted inonly one period of service, their most recent wartime period. Veterans who served in more than one wartime period are classified in the most recentone. Veterans who served in both a wartime period and any other service period are classified in the wartime period. Dash indicates no data or datathat do not meet publication criteria (values not shown where base is less than 35,000).

Table 4. Employed persons 18 years and over by occupation, sex, veteran status, and period of service, 2017annual averages[Percent distribution]
Occupation and sex
Veterans
Non-veteransTotal
Gulf War eraWW II,Korean
War,and
Vietnamera
OtherserviceperiodsTotal
Gulf Warera II
Gulf Warera I
TOTAL
Total employed (in thousands). . . . . . . . . . . . . . . . . . . . . . . . . . . . . . . . . . . . . . . . . . . . . . . . . . . 9,755 5,675 3,169 2,507 1,751 2,329 141,692
Occupation as a percent of total employed
Total employed.. . . . . . . . . . . . . . . . . . . . . . . . . . . . . . . . . . . . . . . . . . . . . . . . . . . . . . . . . . . . . . . . . . . . 100.0 100.0 100.0 100.0 100.0 100.0 100.0
Management, professional, and related occupations.. . . . . . . . . . . . . . . . . . . . . . 39.4 39.9 38.8 41.2 41.4 36.7 40.2
Management, business, and financial operations occupations. . . . . . . . . 19.3 18.2 17.6 18.9 23.8 18.5 16.6
Professional and related occupations.. . . . . . . . . . . . . . . . . . . . . . . . . . . . . . . . . . . . . 20.1 21.7 21.2 22.3 17.6 18.2 23.6
Service occupations. . . . . . . . . . . . . . . . . . . . . . . . . . . . . . . . . . . . . . . . . . . . . . . . . . . . . . . . . . . . 13.9 15.1 16.1 13.8 10.7 13.4 17.3
Sales and office occupations. . . . . . . . . . . . . . . . . . . . . . . . . . . . . . . . . . . . . . . . . . . . . . . . . . 16.8 17.0 16.8 17.3 18.2 15.1 22.1
Sales and related occupations.. . . . . . . . . . . . . . . . . . . . . . . . . . . . . . . . . . . . . . . . . . . . . 8.6 7.8 7.5 8.1 11.8 8.1 10.2
Office and administrative support occupations. . . . . . . . . . . . . . . . . . . . . . . . . . . 8.2 9.2 9.3 9.2 6.4 7.0 11.8
Natural resources, construction, and maintenance occupations. . . . . . . . . . 13.6 13.6 14.8 12.1 12.4 14.3 9.0
Farming, fishing, and forestry occupations.. . . . . . . . . . . . . . . . . . . . . . . . . . . . . . . 0.5 0.4 0.4 0.4 0.9 0.6 0.8
Construction and extraction occupations. . . . . . . . . . . . . . . . . . . . . . . . . . . . . . . . . . 5.8 5.3 5.7 4.8 6.0 6.7 5.2
Installation, maintenance, and repair occupations. . . . . . . . . . . . . . . . . . . . . . . 7.3 7.9 8.8 6.9 5.5 7.1 3.0
Production, transportation, and material moving occupations. . . . . . . . . . . . . 16.4 14.4 13.5 15.6 17.3 20.5 11.4
Production occupations.. . . . . . . . . . . . . . . . . . . . . . . . . . . . . . . . . . . . . . . . . . . . . . . . . . . . . 6.2 6.0 5.5 6.6 5.3 7.6 5.5
Transportation and material moving occupations. . . . . . . . . . . . . . . . . . . . . . . . 10.2 8.4 8.0 9.0 12.1 12.9 5.9
MEN
Total employed (in thousands). . . . . . . . . . . . . . . . . . . . . . . . . . . . . . . . . . . . . . . . . . . . . . . . . . . 8,613 4,848 2,698 2,150 1,693 2,073 71,907
Occupation as a percent of total employed
Total employed.. . . . . . . . . . . . . . . . . . . . . . . . . . . . . . . . . . . . . . . . . . . . . . . . . . . . . . . . . . . . . . . . . . . . 100.0 100.0 100.0 100.0 100.0 100.0 100.0
Management, professional, and related occupations.. . . . . . . . . . . . . . . . . . . . . . 38.1 38.3 37.2 39.6 41.0 35.4 36.4
Management, business, and financial operations occupations. . . . . . . . . 19.3 18.1 17.3 19.0 23.8 18.6 17.4
Professional and related occupations.. . . . . . . . . . . . . . . . . . . . . . . . . . . . . . . . . . . . . 18.8 20.2 20.0 20.6 17.2 16.8 18.9
Service occupations. . . . . . . . . . . . . . . . . . . . . . . . . . . . . . . . . . . . . . . . . . . . . . . . . . . . . . . . . . . . 13.7 14.9 15.7 13.9 10.8 13.2 14.0
Sales and office occupations. . . . . . . . . . . . . . . . . . . . . . . . . . . . . . . . . . . . . . . . . . . . . . . . . . 15.2 15.0 14.8 15.1 17.6 13.6 15.9
Sales and related occupations.. . . . . . . . . . . . . . . . . . . . . . . . . . . . . . . . . . . . . . . . . . . . . 8.5 7.7 7.4 8.0 11.8 7.9 9.9
Office and administrative support occupations. . . . . . . . . . . . . . . . . . . . . . . . . . . 6.6 7.3 7.4 7.1 5.9 5.8 6.0
Natural resources, construction, and maintenance occupations. . . . . . . . . . 15.2 15.8 17.3 13.9 12.9 15.8 16.8
Farming, fishing, and forestry occupations.. . . . . . . . . . . . . . . . . . . . . . . . . . . . . . . 0.6 0.4 0.4 0.4 0.9 0.6 1.1
Construction and extraction occupations. . . . . . . . . . . . . . . . . . . . . . . . . . . . . . . . . . 6.5 6.2 6.6 5.6 6.2 7.4 9.9
Installation, maintenance, and repair occupations. . . . . . . . . . . . . . . . . . . . . . . 8.2 9.2 10.2 7.8 5.7 7.8 5.7
Production, transportation, and material moving occupations. . . . . . . . . . . . . 17.8 16.1 14.9 17.5 17.7 22.0 17.0
Production occupations.. . . . . . . . . . . . . . . . . . . . . . . . . . . . . . . . . . . . . . . . . . . . . . . . . . . . . 6.8 6.7 6.1 7.5 5.3 8.2 7.5
Transportation and material moving occupations. . . . . . . . . . . . . . . . . . . . . . . . 11.0 9.3 8.8 9.9 12.4 13.7 9.4
WOMEN
Total employed (in thousands). . . . . . . . . . . . . . . . . . . . . . . . . . . . . . . . . . . . . . . . . . . . . . . . . . . 1,142 828 471 357 58 256 69,785
Occupation as a percent of total employed
Total employed.. . . . . . . . . . . . . . . . . . . . . . . . . . . . . . . . . . . . . . . . . . . . . . . . . . . . . . . . . . . . . . . . . . . . 100.0 100.0 100.0 100.0 100.0 100.0 100.0
Management, professional, and related occupations.. . . . . . . . . . . . . . . . . . . . . . 48.9 49.3 47.8 51.2 52.0 47.0 44.1
Management, business, and financial operations occupations. . . . . . . . . 18.9 18.9 19.3 18.3 25.4 17.4 15.7
Professional and related occupations.. . . . . . . . . . . . . . . . . . . . . . . . . . . . . . . . . . . . . 30.0 30.4 28.5 32.9 26.7 29.6 28.4
Service occupations. . . . . . . . . . . . . . . . . . . . . . . . . . . . . . . . . . . . . . . . . . . . . . . . . . . . . . . . . . . . 15.3 16.0 18.4 13.0 7.9 14.7 20.7
Sales and office occupations. . . . . . . . . . . . . . . . . . . . . . . . . . . . . . . . . . . . . . . . . . . . . . . . . . 28.9 29.1 28.1 30.4 34.4 26.9 28.5
Sales and related occupations.. . . . . . . . . . . . . . . . . . . . . . . . . . . . . . . . . . . . . . . . . . . . . 9.0 8.4 8.1 8.8 12.7 10.3 10.6
Office and administrative support occupations. . . . . . . . . . . . . . . . . . . . . . . . . . . 19.9 20.7 20.1 21.6 21.7 16.7 17.9
Natural resources, construction, and maintenance occupations. . . . . . . . . . 1.0 0.7 0.3 1.1 0.1 2.3 1.0
Farming, fishing, and forestry occupations.. . . . . . . . . . . . . . . . . . . . . . . . . . . . . . . 0.0 0.0 0.0 0.1 0.0 0.0 0.4
Construction and extraction occupations. . . . . . . . . . . . . . . . . . . . . . . . . . . . . . . . . . 0.4 0.1 0.1 0.1 0.1 1.4 0.3
Installation, maintenance, and repair occupations. . . . . . . . . . . . . . . . . . . . . . . 0.6 0.5 0.2 1.0 0.0 0.9 0.3
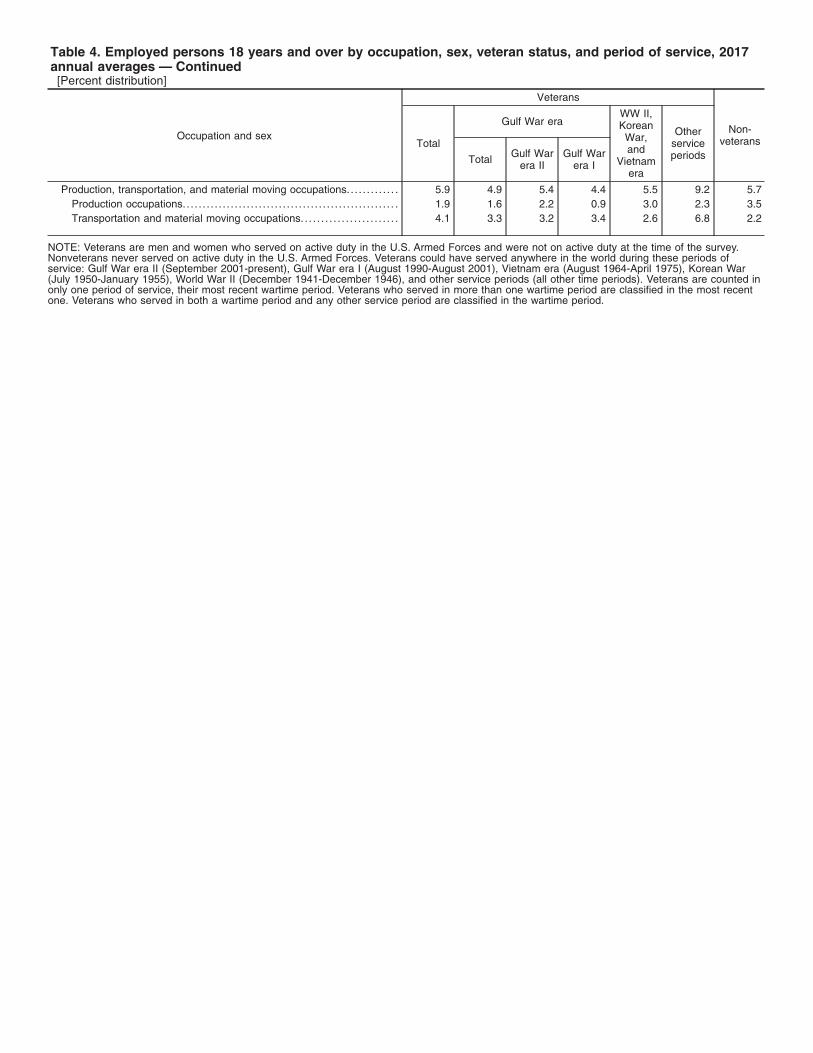
Table 4. Employed persons 18 years and over by occupation, sex, veteran status, and period of service, 2017annual averages — Continued[Percent distribution]
Occupation and sex
Veterans
Non-veteransTotal
Gulf War eraWW II,Korean
War,and
Vietnamera
OtherserviceperiodsTotal
Gulf Warera II
Gulf Warera I
Production, transportation, and material moving occupations. . . . . . . . . . . . . 5.9 4.9 5.4 4.4 5.5 9.2 5.7
Production occupations.. . . . . . . . . . . . . . . . . . . . . . . . . . . . . . . . . . . . . . . . . . . . . . . . . . . . . 1.9 1.6 2.2 0.9 3.0 2.3 3.5
Transportation and material moving occupations. . . . . . . . . . . . . . . . . . . . . . . . 4.1 3.3 3.2 3.4 2.6 6.8 2.2
NOTE: Veterans are men and women who served on active duty in the U.S. Armed Forces and were not on active duty at the time of the survey.Nonveterans never served on active duty in the U.S. Armed Forces. Veterans could have served anywhere in the world during these periods ofservice: Gulf War era II (September 2001-present), Gulf War era I (August 1990-August 2001), Vietnam era (August 1964-April 1975), Korean War(July 1950-January 1955), World War II (December 1941-December 1946), and other service periods (all other time periods). Veterans are counted inonly one period of service, their most recent wartime period. Veterans who served in more than one wartime period are classified in the most recentone. Veterans who served in both a wartime period and any other service period are classified in the wartime period.
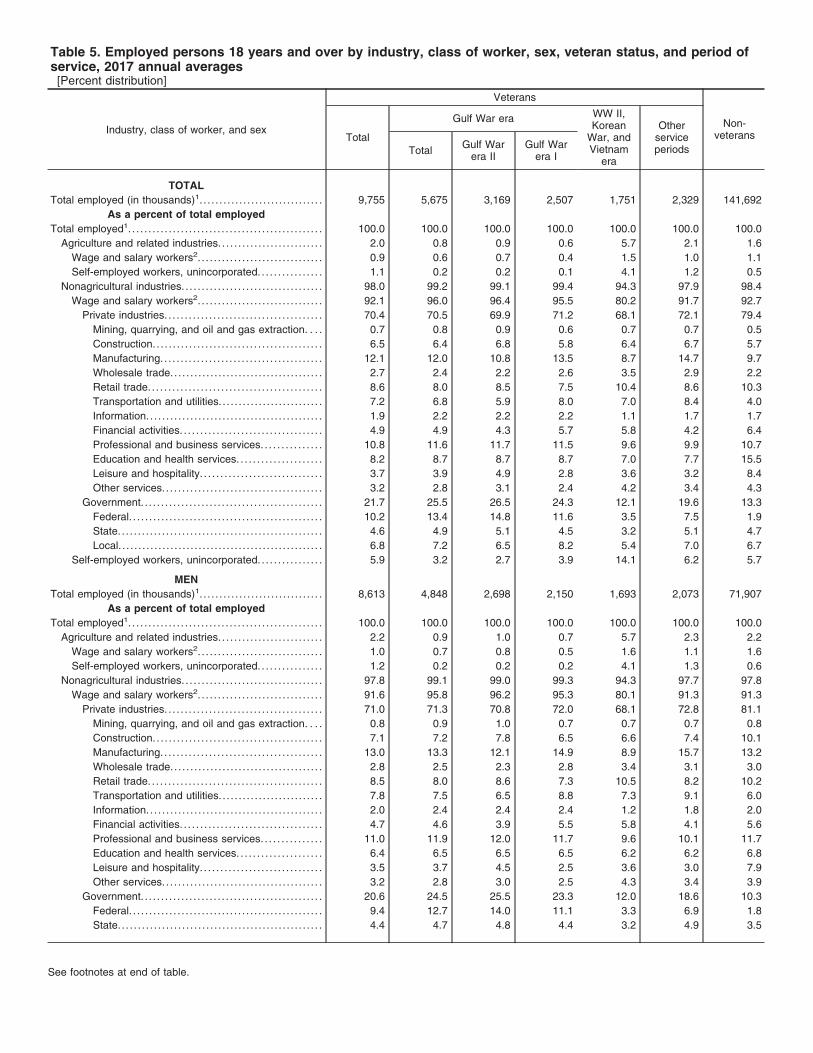
Table 5. Employed persons 18 years and over by industry, class of worker, sex, veteran status, and period ofservice, 2017 annual averages[Percent distribution]
Industry, class of worker, and sex
Veterans
Non-veteransTotal
Gulf War era WW II,Korean
War, andVietnam
era
OtherserviceperiodsTotal
Gulf Warera II
Gulf Warera I
TOTAL
Total employed (in thousands)1. . . . . . . . . . . . . . . . . . . . . . . . . . . . . . . 9,755 5,675 3,169 2,507 1,751 2,329 141,692
As a percent of total employed
Total employed1. . . . . . . . . . . . . . . . . . . . . . . . . . . . . . . . . . . . . . . . . . . . . . . . 100.0 100.0 100.0 100.0 100.0 100.0 100.0
Agriculture and related industries. . . . . . . . . . . . . . . . . . . . . . . . . . 2.0 0.8 0.9 0.6 5.7 2.1 1.6
Wage and salary workers2. . . . . . . . . . . . . . . . . . . . . . . . . . . . . . . 0.9 0.6 0.7 0.4 1.5 1.0 1.1
Self-employed workers, unincorporated. . . . . . . . . . . . . . . . 1.1 0.2 0.2 0.1 4.1 1.2 0.5
Nonagricultural industries. . . . . . . . . . . . . . . . . . . . . . . . . . . . . . . . . . . 98.0 99.2 99.1 99.4 94.3 97.9 98.4
Wage and salary workers2. . . . . . . . . . . . . . . . . . . . . . . . . . . . . . . 92.1 96.0 96.4 95.5 80.2 91.7 92.7
Private industries. . . . . . . . . . . . . . . . . . . . . . . . . . . . . . . . . . . . . . . 70.4 70.5 69.9 71.2 68.1 72.1 79.4
Mining, quarrying, and oil and gas extraction. . . . 0.7 0.8 0.9 0.6 0.7 0.7 0.5
Construction. . . . . . . . . . . . . . . . . . . . . . . . . . . . . . . . . . . . . . . . . . 6.5 6.4 6.8 5.8 6.4 6.7 5.7
Manufacturing. . . . . . . . . . . . . . . . . . . . . . . . . . . . . . . . . . . . . . . . 12.1 12.0 10.8 13.5 8.7 14.7 9.7
Wholesale trade.. . . . . . . . . . . . . . . . . . . . . . . . . . . . . . . . . . . . . 2.7 2.4 2.2 2.6 3.5 2.9 2.2
Retail trade. . . . . . . . . . . . . . . . . . . . . . . . . . . . . . . . . . . . . . . . . . . 8.6 8.0 8.5 7.5 10.4 8.6 10.3
Transportation and utilities. . . . . . . . . . . . . . . . . . . . . . . . . . 7.2 6.8 5.9 8.0 7.0 8.4 4.0
Information. . . . . . . . . . . . . . . . . . . . . . . . . . . . . . . . . . . . . . . . . . . . 1.9 2.2 2.2 2.2 1.1 1.7 1.7
Financial activities. . . . . . . . . . . . . . . . . . . . . . . . . . . . . . . . . . . 4.9 4.9 4.3 5.7 5.8 4.2 6.4
Professional and business services. . . . . . . . . . . . . . . 10.8 11.6 11.7 11.5 9.6 9.9 10.7
Education and health services. . . . . . . . . . . . . . . . . . . . . 8.2 8.7 8.7 8.7 7.0 7.7 15.5
Leisure and hospitality. . . . . . . . . . . . . . . . . . . . . . . . . . . . . . 3.7 3.9 4.9 2.8 3.6 3.2 8.4
Other services. . . . . . . . . . . . . . . . . . . . . . . . . . . . . . . . . . . . . . . . 3.2 2.8 3.1 2.4 4.2 3.4 4.3
Government. . . . . . . . . . . . . . . . . . . . . . . . . . . . . . . . . . . . . . . . . . . . . 21.7 25.5 26.5 24.3 12.1 19.6 13.3
Federal. . . . . . . . . . . . . . . . . . . . . . . . . . . . . . . . . . . . . . . . . . . . . . . . 10.2 13.4 14.8 11.6 3.5 7.5 1.9
State. . . . . . . . . . . . . . . . . . . . . . . . . . . . . . . . . . . . . . . . . . . . . . . . . . . 4.6 4.9 5.1 4.5 3.2 5.1 4.7
Local. . . . . . . . . . . . . . . . . . . . . . . . . . . . . . . . . . . . . . . . . . . . . . . . . . . 6.8 7.2 6.5 8.2 5.4 7.0 6.7
Self-employed workers, unincorporated. . . . . . . . . . . . . . . . 5.9 3.2 2.7 3.9 14.1 6.2 5.7
MEN
Total employed (in thousands)1. . . . . . . . . . . . . . . . . . . . . . . . . . . . . . . 8,613 4,848 2,698 2,150 1,693 2,073 71,907
As a percent of total employed
Total employed1. . . . . . . . . . . . . . . . . . . . . . . . . . . . . . . . . . . . . . . . . . . . . . . . 100.0 100.0 100.0 100.0 100.0 100.0 100.0
Agriculture and related industries. . . . . . . . . . . . . . . . . . . . . . . . . . 2.2 0.9 1.0 0.7 5.7 2.3 2.2
Wage and salary workers2. . . . . . . . . . . . . . . . . . . . . . . . . . . . . . . 1.0 0.7 0.8 0.5 1.6 1.1 1.6
Self-employed workers, unincorporated. . . . . . . . . . . . . . . . 1.2 0.2 0.2 0.2 4.1 1.3 0.6
Nonagricultural industries. . . . . . . . . . . . . . . . . . . . . . . . . . . . . . . . . . . 97.8 99.1 99.0 99.3 94.3 97.7 97.8
Wage and salary workers2. . . . . . . . . . . . . . . . . . . . . . . . . . . . . . . 91.6 95.8 96.2 95.3 80.1 91.3 91.3
Private industries. . . . . . . . . . . . . . . . . . . . . . . . . . . . . . . . . . . . . . . 71.0 71.3 70.8 72.0 68.1 72.8 81.1
Mining, quarrying, and oil and gas extraction. . . . 0.8 0.9 1.0 0.7 0.7 0.7 0.8
Construction. . . . . . . . . . . . . . . . . . . . . . . . . . . . . . . . . . . . . . . . . . 7.1 7.2 7.8 6.5 6.6 7.4 10.1
Manufacturing. . . . . . . . . . . . . . . . . . . . . . . . . . . . . . . . . . . . . . . . 13.0 13.3 12.1 14.9 8.9 15.7 13.2
Wholesale trade.. . . . . . . . . . . . . . . . . . . . . . . . . . . . . . . . . . . . . 2.8 2.5 2.3 2.8 3.4 3.1 3.0
Retail trade. . . . . . . . . . . . . . . . . . . . . . . . . . . . . . . . . . . . . . . . . . . 8.5 8.0 8.6 7.3 10.5 8.2 10.2
Transportation and utilities. . . . . . . . . . . . . . . . . . . . . . . . . . 7.8 7.5 6.5 8.8 7.3 9.1 6.0
Information. . . . . . . . . . . . . . . . . . . . . . . . . . . . . . . . . . . . . . . . . . . . 2.0 2.4 2.4 2.4 1.2 1.8 2.0
Financial activities. . . . . . . . . . . . . . . . . . . . . . . . . . . . . . . . . . . 4.7 4.6 3.9 5.5 5.8 4.1 5.6
Professional and business services. . . . . . . . . . . . . . . 11.0 11.9 12.0 11.7 9.6 10.1 11.7
Education and health services. . . . . . . . . . . . . . . . . . . . . 6.4 6.5 6.5 6.5 6.2 6.2 6.8
Leisure and hospitality. . . . . . . . . . . . . . . . . . . . . . . . . . . . . . 3.5 3.7 4.5 2.5 3.6 3.0 7.9
Other services. . . . . . . . . . . . . . . . . . . . . . . . . . . . . . . . . . . . . . . . 3.2 2.8 3.0 2.5 4.3 3.4 3.9
Government. . . . . . . . . . . . . . . . . . . . . . . . . . . . . . . . . . . . . . . . . . . . . 20.6 24.5 25.5 23.3 12.0 18.6 10.3
Federal. . . . . . . . . . . . . . . . . . . . . . . . . . . . . . . . . . . . . . . . . . . . . . . . 9.4 12.7 14.0 11.1 3.3 6.9 1.8
State. . . . . . . . . . . . . . . . . . . . . . . . . . . . . . . . . . . . . . . . . . . . . . . . . . . 4.4 4.7 4.8 4.4 3.2 4.9 3.5
See footnotes at end of table.

Table 5. Employed persons 18 years and over by industry, class of worker, sex, veteran status, and period ofservice, 2017 annual averages — Continued[Percent distribution]
Industry, class of worker, and sex
Veterans
Non-veteransTotal
Gulf War era WW II,Korean
War, andVietnam
era
OtherserviceperiodsTotal
Gulf Warera II
Gulf Warera I
Local. . . . . . . . . . . . . . . . . . . . . . . . . . . . . . . . . . . . . . . . . . . . . . . . . . . 6.7 7.2 6.7 7.8 5.4 6.7 5.0
Self-employed workers, unincorporated. . . . . . . . . . . . . . . . 6.2 3.3 2.8 4.0 14.2 6.3 6.4
WOMEN
Total employed (in thousands)1. . . . . . . . . . . . . . . . . . . . . . . . . . . . . . . 1,142 828 471 357 58 256 69,785
As a percent of total employed
Total employed1. . . . . . . . . . . . . . . . . . . . . . . . . . . . . . . . . . . . . . . . . . . . . . . . 100.0 100.0 100.0 100.0 100.0 100.0 100.0
Agriculture and related industries. . . . . . . . . . . . . . . . . . . . . . . . . . 0.5 0.3 0.4 0.1 4.0 0.5 0.8
Wage and salary workers2. . . . . . . . . . . . . . . . . . . . . . . . . . . . . . . 0.1 0.2 0.2 0.1 0.2 0.1 0.5
Self-employed workers, unincorporated. . . . . . . . . . . . . . . . 0.4 0.1 0.2 0.0 3.8 0.4 0.3
Nonagricultural industries. . . . . . . . . . . . . . . . . . . . . . . . . . . . . . . . . . . 99.5 99.7 99.6 99.9 96.0 99.5 99.2
Wage and salary workers2. . . . . . . . . . . . . . . . . . . . . . . . . . . . . . . 95.8 97.0 97.3 96.6 84.3 94.7 94.1
Private industries. . . . . . . . . . . . . . . . . . . . . . . . . . . . . . . . . . . . . . . 66.0 65.6 64.9 66.6 67.6 66.6 77.7
Mining, quarrying, and oil and gas extraction. . . . 0.1 0.1 0.1 0.1 0.0 0.4 0.1
Construction. . . . . . . . . . . . . . . . . . . . . . . . . . . . . . . . . . . . . . . . . . 1.3 1.3 1.4 1.2 2.1 1.1 1.2
Manufacturing. . . . . . . . . . . . . . . . . . . . . . . . . . . . . . . . . . . . . . . . 4.7 4.3 3.3 5.6 3.8 6.4 6.2
Wholesale trade.. . . . . . . . . . . . . . . . . . . . . . . . . . . . . . . . . . . . . 1.7 1.4 1.4 1.4 7.3 1.2 1.5
Retail trade. . . . . . . . . . . . . . . . . . . . . . . . . . . . . . . . . . . . . . . . . . . 9.0 8.3 8.0 8.6 7.1 11.6 10.5
Transportation and utilities. . . . . . . . . . . . . . . . . . . . . . . . . . 2.4 2.5 2.1 3.2 0.0 2.6 2.0
Information. . . . . . . . . . . . . . . . . . . . . . . . . . . . . . . . . . . . . . . . . . . . 0.9 0.9 0.7 1.2 0.0 1.0 1.3
Financial activities. . . . . . . . . . . . . . . . . . . . . . . . . . . . . . . . . . . 6.5 6.9 6.6 7.4 6.0 5.1 7.2
Professional and business services. . . . . . . . . . . . . . . 9.5 9.9 9.7 10.2 7.4 8.4 9.6
Education and health services. . . . . . . . . . . . . . . . . . . . . 21.5 21.4 21.4 21.4 30.2 19.8 24.5
Leisure and hospitality. . . . . . . . . . . . . . . . . . . . . . . . . . . . . . 5.5 5.7 6.8 4.2 3.7 5.1 8.9
Other services. . . . . . . . . . . . . . . . . . . . . . . . . . . . . . . . . . . . . . . . 3.0 2.9 3.5 2.2 0.0 4.0 4.6
Government. . . . . . . . . . . . . . . . . . . . . . . . . . . . . . . . . . . . . . . . . . . . . 29.9 31.4 32.4 30.0 16.7 28.0 16.4
Federal. . . . . . . . . . . . . . . . . . . . . . . . . . . . . . . . . . . . . . . . . . . . . . . . 15.9 17.6 19.9 14.6 9.8 11.9 2.0
State. . . . . . . . . . . . . . . . . . . . . . . . . . . . . . . . . . . . . . . . . . . . . . . . . . . 6.2 6.1 6.8 5.1 3.0 7.0 5.9
Local. . . . . . . . . . . . . . . . . . . . . . . . . . . . . . . . . . . . . . . . . . . . . . . . . . . 7.8 7.6 5.6 10.3 3.9 9.1 8.5
Self-employed workers, unincorporated. . . . . . . . . . . . . . . . 3.6 2.7 2.2 3.3 11.7 4.8 5.0
1 Total includes a small number of unpaid family workers, not shown separately.2 Includes self-employed workers whose business are incorporated.
NOTE: Veterans are men and women who served on active duty in the U.S. Armed Forces and were not on active duty at the time of the survey.Nonveterans never served on active duty in the U.S. Armed Forces. Veterans could have served anywhere in the world during these periods ofservice: Gulf War era II (September 2001-present), Gulf War era I (August 1990-August 2001), Vietnam era (August 1964-April 1975), Korean War(July 1950-January 1955), World War II (December 1941-December 1946), and other service periods (all other time periods). Veterans are counted inonly one period of service, their most recent wartime period. Veterans who served in more than one wartime period are classified in the most recentone. Veterans who served in both a wartime period and any other service period are classified in the wartime period.

Table 6A. Employment status of veterans 18 years and over by state, 2017 annual averages[Numbers in thousands]
State
Civiliannoninsti-tutional
population
Civilian labor force
Not inlaborforceTotal
Percentof
population
Employed Unemployed
TotalPercent
ofpopulation
TotalPercent
oflabor force
TOTAL VETERANS
Total, 18 years and over. . . . . . . . . . . . . . . . . . . . . . . . . . . . . . . . . . . . . 20,387 10,125 49.7 9,755 47.8 370 3.7 10,262
Alabama. . . . . . . . . . . . . . . . . . . . . . . . . . . . . . . . . . . . . . . . . . . . . . . . . . . 375 182 48.5 178 47.4 4 2.2 193
Alaska. . . . . . . . . . . . . . . . . . . . . . . . . . . . . . . . . . . . . . . . . . . . . . . . . . . . . . 73 44 60.5 42 57.3 2 5.3 29
Arizona. . . . . . . . . . . . . . . . . . . . . . . . . . . . . . . . . . . . . . . . . . . . . . . . . . . . . 501 229 45.7 217 43.3 12 5.2 272
Arkansas. . . . . . . . . . . . . . . . . . . . . . . . . . . . . . . . . . . . . . . . . . . . . . . . . . . 244 108 44.3 103 42.4 5 4.4 136
California. . . . . . . . . . . . . . . . . . . . . . . . . . . . . . . . . . . . . . . . . . . . . . . . . . . 1,823 887 48.7 850 46.6 37 4.2 936
Colorado. . . . . . . . . . . . . . . . . . . . . . . . . . . . . . . . . . . . . . . . . . . . . . . . . . . 396 215 54.3 207 52.3 8 3.7 181
Connecticut. . . . . . . . . . . . . . . . . . . . . . . . . . . . . . . . . . . . . . . . . . . . . . . . 191 93 48.9 90 47.3 3 3.4 97
Delaware. . . . . . . . . . . . . . . . . . . . . . . . . . . . . . . . . . . . . . . . . . . . . . . . . . . 78 36 46.0 34 44.2 1 4.0 42
District of Columbia. . . . . . . . . . . . . . . . . . . . . . . . . . . . . . . . . . . . . . . . 27 14 49.6 13 46.5 1 6.3 14
Florida. . . . . . . . . . . . . . . . . . . . . . . . . . . . . . . . . . . . . . . . . . . . . . . . . . . . . 1,603 734 45.8 713 44.5 21 2.9 869
Georgia. . . . . . . . . . . . . . . . . . . . . . . . . . . . . . . . . . . . . . . . . . . . . . . . . . . . 697 410 58.8 396 56.8 14 3.4 287
Hawaii. . . . . . . . . . . . . . . . . . . . . . . . . . . . . . . . . . . . . . . . . . . . . . . . . . . . . . 105 55 52.5 53 50.7 2 3.5 50
Idaho. . . . . . . . . . . . . . . . . . . . . . . . . . . . . . . . . . . . . . . . . . . . . . . . . . . . . . . 121 54 44.4 52 42.8 2 3.4 67
Illinois. . . . . . . . . . . . . . . . . . . . . . . . . . . . . . . . . . . . . . . . . . . . . . . . . . . . . . 624 295 47.3 283 45.4 12 4.1 329
Indiana. . . . . . . . . . . . . . . . . . . . . . . . . . . . . . . . . . . . . . . . . . . . . . . . . . . . . 446 239 53.4 233 52.1 6 2.4 208
Iowa. . . . . . . . . . . . . . . . . . . . . . . . . . . . . . . . . . . . . . . . . . . . . . . . . . . . . . . . 217 113 52.2 108 49.6 6 5.0 104
Kansas. . . . . . . . . . . . . . . . . . . . . . . . . . . . . . . . . . . . . . . . . . . . . . . . . . . . . 173 88 50.7 86 49.5 2 2.5 85
Kentucky. . . . . . . . . . . . . . . . . . . . . . . . . . . . . . . . . . . . . . . . . . . . . . . . . . . 294 148 50.3 145 49.3 3 2.0 146
Louisiana. . . . . . . . . . . . . . . . . . . . . . . . . . . . . . . . . . . . . . . . . . . . . . . . . . . 306 149 48.7 145 47.3 4 3.0 157
Maine. . . . . . . . . . . . . . . . . . . . . . . . . . . . . . . . . . . . . . . . . . . . . . . . . . . . . . 112 55 48.6 54 47.8 1 1.7 58
Maryland. . . . . . . . . . . . . . . . . . . . . . . . . . . . . . . . . . . . . . . . . . . . . . . . . . . 436 268 61.6 260 59.6 9 3.3 167
Massachusetts. . . . . . . . . . . . . . . . . . . . . . . . . . . . . . . . . . . . . . . . . . . . . 361 172 47.5 168 46.4 4 2.4 189
Michigan. . . . . . . . . . . . . . . . . . . . . . . . . . . . . . . . . . . . . . . . . . . . . . . . . . . 567 260 45.9 251 44.3 9 3.6 307
Minnesota. . . . . . . . . . . . . . . . . . . . . . . . . . . . . . . . . . . . . . . . . . . . . . . . . . 337 178 52.8 169 50.2 9 5.1 159
Mississippi. . . . . . . . . . . . . . . . . . . . . . . . . . . . . . . . . . . . . . . . . . . . . . . . . 197 98 49.7 95 48.0 3 3.5 99
Missouri. . . . . . . . . . . . . . . . . . . . . . . . . . . . . . . . . . . . . . . . . . . . . . . . . . . . 446 208 46.6 202 45.2 6 3.1 238
Montana. . . . . . . . . . . . . . . . . . . . . . . . . . . . . . . . . . . . . . . . . . . . . . . . . . . 103 51 49.3 49 47.2 2 4.4 52
Nebraska. . . . . . . . . . . . . . . . . . . . . . . . . . . . . . . . . . . . . . . . . . . . . . . . . . . 124 63 50.8 60 48.5 3 4.5 61
Nevada. . . . . . . . . . . . . . . . . . . . . . . . . . . . . . . . . . . . . . . . . . . . . . . . . . . . 270 135 50.1 129 47.6 7 4.9 135
New Hampshire. . . . . . . . . . . . . . . . . . . . . . . . . . . . . . . . . . . . . . . . . . . . 103 49 47.6 48 46.0 2 3.3 54
New Jersey. . . . . . . . . . . . . . . . . . . . . . . . . . . . . . . . . . . . . . . . . . . . . . . . 339 150 44.1 144 42.4 6 4.0 190
New Mexico. . . . . . . . . . . . . . . . . . . . . . . . . . . . . . . . . . . . . . . . . . . . . . . . 152 70 45.9 67 44.4 2 3.3 82
New York. . . . . . . . . . . . . . . . . . . . . . . . . . . . . . . . . . . . . . . . . . . . . . . . . . 760 323 42.5 310 40.8 13 3.9 437
North Carolina. . . . . . . . . . . . . . . . . . . . . . . . . . . . . . . . . . . . . . . . . . . . . 720 365 50.7 348 48.3 17 4.7 355
North Dakota. . . . . . . . . . . . . . . . . . . . . . . . . . . . . . . . . . . . . . . . . . . . . . . 48 27 56.6 27 55.4 1 2.1 21
Ohio. . . . . . . . . . . . . . . . . . . . . . . . . . . . . . . . . . . . . . . . . . . . . . . . . . . . . . . . 796 369 46.4 357 44.8 13 3.5 427
Oklahoma. . . . . . . . . . . . . . . . . . . . . . . . . . . . . . . . . . . . . . . . . . . . . . . . . . 298 151 50.9 146 49.1 5 3.5 146
Oregon. . . . . . . . . . . . . . . . . . . . . . . . . . . . . . . . . . . . . . . . . . . . . . . . . . . . . 305 152 49.8 145 47.6 6 4.3 153
Pennsylvania. . . . . . . . . . . . . . . . . . . . . . . . . . . . . . . . . . . . . . . . . . . . . . . 837 382 45.7 363 43.4 19 5.0 454
Rhode Island. . . . . . . . . . . . . . . . . . . . . . . . . . . . . . . . . . . . . . . . . . . . . . . 71 32 44.5 29 41.3 2 7.3 39
South Carolina. . . . . . . . . . . . . . . . . . . . . . . . . . . . . . . . . . . . . . . . . . . . . 417 189 45.4 182 43.6 7 3.9 228
South Dakota. . . . . . . . . . . . . . . . . . . . . . . . . . . . . . . . . . . . . . . . . . . . . . 77 46 59.5 45 58.0 1 2.5 31
Tennessee. . . . . . . . . . . . . . . . . . . . . . . . . . . . . . . . . . . . . . . . . . . . . . . . . 515 262 50.8 253 49.1 9 3.5 253
Texas. . . . . . . . . . . . . . . . . . . . . . . . . . . . . . . . . . . . . . . . . . . . . . . . . . . . . . 1,678 905 53.9 870 51.9 35 3.8 773
Utah. . . . . . . . . . . . . . . . . . . . . . . . . . . . . . . . . . . . . . . . . . . . . . . . . . . . . . . . 151 79 52.1 76 50.6 2 2.9 72
Vermont. . . . . . . . . . . . . . . . . . . . . . . . . . . . . . . . . . . . . . . . . . . . . . . . . . . . 42 19 44.8 19 44.1 0 1.7 23
Virginia. . . . . . . . . . . . . . . . . . . . . . . . . . . . . . . . . . . . . . . . . . . . . . . . . . . . . 772 463 60.0 452 58.5 11 2.5 309
Washington. . . . . . . . . . . . . . . . . . . . . . . . . . . . . . . . . . . . . . . . . . . . . . . . 508 245 48.2 237 46.6 8 3.2 263
West Virginia. . . . . . . . . . . . . . . . . . . . . . . . . . . . . . . . . . . . . . . . . . . . . . . 145 64 44.2 61 41.9 3 5.1 81
Wisconsin. . . . . . . . . . . . . . . . . . . . . . . . . . . . . . . . . . . . . . . . . . . . . . . . . . 353 175 49.4 169 47.8 6 3.3 179
Wyoming. . . . . . . . . . . . . . . . . . . . . . . . . . . . . . . . . . . . . . . . . . . . . . . . . . . 51 28 53.9 26 51.4 1 4.6 24
NOTE: Veterans are men and women who served on active duty in the U.S. Armed Forces and were not on active duty at the time of the survey.

Table 6B. Employment status of nonveterans 18 years and over by state, 2017 annual averages[Numbers in thousands]
State
Civiliannoninsti-tutional
population
Civilian labor force
Not inlaborforceTotal
Percentof
population
Employed Unemployed
TotalPercent
ofpopulation
TotalPercent
oflabor force
TOTAL NONVETERANS
Total, 18 years and over. . . . . . . . . . . . . . . . . . . . . . . . . . . . . . . . . . . . . 225,619 147,957 65.6 141,692 62.8 6,265 4.2 77,662
Alabama. . . . . . . . . . . . . . . . . . . . . . . . . . . . . . . . . . . . . . . . . . . . . . . . . . . 3,339 1,967 58.9 1,881 56.3 86 4.4 1,372
Alaska. . . . . . . . . . . . . . . . . . . . . . . . . . . . . . . . . . . . . . . . . . . . . . . . . . . . . . 457 321 70.2 296 64.8 25 7.8 136
Arizona. . . . . . . . . . . . . . . . . . . . . . . . . . . . . . . . . . . . . . . . . . . . . . . . . . . . . 4,768 3,033 63.6 2,897 60.8 135 4.5 1,736
Arkansas. . . . . . . . . . . . . . . . . . . . . . . . . . . . . . . . . . . . . . . . . . . . . . . . . . . 2,004 1,241 61.9 1,198 59.8 43 3.5 763
California. . . . . . . . . . . . . . . . . . . . . . . . . . . . . . . . . . . . . . . . . . . . . . . . . . . 28,000 18,116 64.7 17,275 61.7 842 4.6 9,884
Colorado. . . . . . . . . . . . . . . . . . . . . . . . . . . . . . . . . . . . . . . . . . . . . . . . . . . 3,871 2,768 71.5 2,692 69.6 75 2.7 1,103
Connecticut. . . . . . . . . . . . . . . . . . . . . . . . . . . . . . . . . . . . . . . . . . . . . . . . 2,577 1,790 69.5 1,705 66.2 85 4.8 786
Delaware. . . . . . . . . . . . . . . . . . . . . . . . . . . . . . . . . . . . . . . . . . . . . . . . . . . 658 433 65.8 412 62.7 20 4.7 225
District of Columbia. . . . . . . . . . . . . . . . . . . . . . . . . . . . . . . . . . . . . . . . 528 384 72.7 361 68.3 24 6.1 144
Florida. . . . . . . . . . . . . . . . . . . . . . . . . . . . . . . . . . . . . . . . . . . . . . . . . . . . . 14,799 9,284 62.7 8,915 60.2 369 4.0 5,515
Georgia. . . . . . . . . . . . . . . . . . . . . . . . . . . . . . . . . . . . . . . . . . . . . . . . . . . . 7,000 4,607 65.8 4,397 62.8 211 4.6 2,393
Hawaii. . . . . . . . . . . . . . . . . . . . . . . . . . . . . . . . . . . . . . . . . . . . . . . . . . . . . . 960 626 65.2 612 63.7 14 2.3 334
Idaho. . . . . . . . . . . . . . . . . . . . . . . . . . . . . . . . . . . . . . . . . . . . . . . . . . . . . . . 1,125 762 67.7 739 65.7 23 3.0 363
Illinois. . . . . . . . . . . . . . . . . . . . . . . . . . . . . . . . . . . . . . . . . . . . . . . . . . . . . . 9,030 6,046 66.9 5,763 63.8 283 4.7 2,985
Indiana. . . . . . . . . . . . . . . . . . . . . . . . . . . . . . . . . . . . . . . . . . . . . . . . . . . . . 4,506 3,011 66.8 2,910 64.6 101 3.4 1,494
Iowa. . . . . . . . . . . . . . . . . . . . . . . . . . . . . . . . . . . . . . . . . . . . . . . . . . . . . . . . 2,155 1,527 70.8 1,482 68.7 45 3.0 629
Kansas. . . . . . . . . . . . . . . . . . . . . . . . . . . . . . . . . . . . . . . . . . . . . . . . . . . . . 1,966 1,366 69.5 1,319 67.1 47 3.5 600
Kentucky. . . . . . . . . . . . . . . . . . . . . . . . . . . . . . . . . . . . . . . . . . . . . . . . . . . 3,043 1,885 61.9 1,787 58.7 98 5.2 1,158
Louisiana. . . . . . . . . . . . . . . . . . . . . . . . . . . . . . . . . . . . . . . . . . . . . . . . . . . 3,172 1,946 61.4 1,845 58.2 101 5.2 1,225
Maine. . . . . . . . . . . . . . . . . . . . . . . . . . . . . . . . . . . . . . . . . . . . . . . . . . . . . . 953 635 66.7 616 64.6 20 3.1 317
Maryland. . . . . . . . . . . . . . . . . . . . . . . . . . . . . . . . . . . . . . . . . . . . . . . . . . . 4,171 2,919 70.0 2,799 67.1 120 4.1 1,252
Massachusetts. . . . . . . . . . . . . . . . . . . . . . . . . . . . . . . . . . . . . . . . . . . . . 5,012 3,437 68.6 3,305 65.9 132 3.8 1,575
Michigan. . . . . . . . . . . . . . . . . . . . . . . . . . . . . . . . . . . . . . . . . . . . . . . . . . . 7,082 4,522 63.8 4,316 60.9 206 4.6 2,560
Minnesota. . . . . . . . . . . . . . . . . . . . . . . . . . . . . . . . . . . . . . . . . . . . . . . . . . 3,846 2,846 74.0 2,755 71.6 91 3.2 999
Mississippi. . . . . . . . . . . . . . . . . . . . . . . . . . . . . . . . . . . . . . . . . . . . . . . . . 2,005 1,169 58.3 1,112 55.5 57 4.9 835
Missouri. . . . . . . . . . . . . . . . . . . . . . . . . . . . . . . . . . . . . . . . . . . . . . . . . . . . 4,150 2,751 66.3 2,648 63.8 103 3.7 1,400
Montana. . . . . . . . . . . . . . . . . . . . . . . . . . . . . . . . . . . . . . . . . . . . . . . . . . . 707 465 65.8 447 63.3 18 3.8 242
Nebraska. . . . . . . . . . . . . . . . . . . . . . . . . . . . . . . . . . . . . . . . . . . . . . . . . . . 1,284 920 71.6 896 69.8 24 2.6 364
Nevada. . . . . . . . . . . . . . . . . . . . . . . . . . . . . . . . . . . . . . . . . . . . . . . . . . . . 2,001 1,308 65.4 1,245 62.2 63 4.8 693
New Hampshire. . . . . . . . . . . . . . . . . . . . . . . . . . . . . . . . . . . . . . . . . . . . 952 677 71.1 659 69.3 17 2.5 276
New Jersey. . . . . . . . . . . . . . . . . . . . . . . . . . . . . . . . . . . . . . . . . . . . . . . . 6,517 4,279 65.6 4,083 62.7 195 4.6 2,239
New Mexico. . . . . . . . . . . . . . . . . . . . . . . . . . . . . . . . . . . . . . . . . . . . . . . . 1,402 852 60.8 801 57.1 51 6.0 550
New York. . . . . . . . . . . . . . . . . . . . . . . . . . . . . . . . . . . . . . . . . . . . . . . . . . 14,547 9,240 63.5 8,821 60.6 419 4.5 5,306
North Carolina. . . . . . . . . . . . . . . . . . . . . . . . . . . . . . . . . . . . . . . . . . . . . 7,010 4,481 63.9 4,291 61.2 190 4.2 2,529
North Dakota. . . . . . . . . . . . . . . . . . . . . . . . . . . . . . . . . . . . . . . . . . . . . . . 516 383 74.3 374 72.4 10 2.5 133
Ohio. . . . . . . . . . . . . . . . . . . . . . . . . . . . . . . . . . . . . . . . . . . . . . . . . . . . . . . . 8,033 5,292 65.9 5,034 62.7 258 4.9 2,742
Oklahoma. . . . . . . . . . . . . . . . . . . . . . . . . . . . . . . . . . . . . . . . . . . . . . . . . . 2,603 1,668 64.1 1,598 61.4 70 4.2 935
Oregon. . . . . . . . . . . . . . . . . . . . . . . . . . . . . . . . . . . . . . . . . . . . . . . . . . . . . 2,925 1,941 66.4 1,864 63.7 77 4.0 984
Pennsylvania. . . . . . . . . . . . . . . . . . . . . . . . . . . . . . . . . . . . . . . . . . . . . . . 9,037 5,882 65.1 5,615 62.1 268 4.5 3,155
Rhode Island. . . . . . . . . . . . . . . . . . . . . . . . . . . . . . . . . . . . . . . . . . . . . . . 765 516 67.4 494 64.6 21 4.1 249
South Carolina. . . . . . . . . . . . . . . . . . . . . . . . . . . . . . . . . . . . . . . . . . . . . 3,365 2,060 61.2 1,972 58.6 88 4.2 1,305
South Dakota. . . . . . . . . . . . . . . . . . . . . . . . . . . . . . . . . . . . . . . . . . . . . . 564 407 72.2 392 69.6 15 3.6 157
Tennessee. . . . . . . . . . . . . . . . . . . . . . . . . . . . . . . . . . . . . . . . . . . . . . . . . 4,611 2,912 63.2 2,803 60.8 109 3.7 1,699
Texas. . . . . . . . . . . . . . . . . . . . . . . . . . . . . . . . . . . . . . . . . . . . . . . . . . . . . . 18,678 12,409 66.4 11,882 63.6 527 4.2 6,269
Utah. . . . . . . . . . . . . . . . . . . . . . . . . . . . . . . . . . . . . . . . . . . . . . . . . . . . . . . . 1,997 1,445 72.4 1,399 70.1 46 3.2 551
Vermont. . . . . . . . . . . . . . . . . . . . . . . . . . . . . . . . . . . . . . . . . . . . . . . . . . . . 456 319 69.9 309 67.9 9 3.0 137
Virginia. . . . . . . . . . . . . . . . . . . . . . . . . . . . . . . . . . . . . . . . . . . . . . . . . . . . . 5,621 3,806 67.7 3,665 65.2 141 3.7 1,816
Washington. . . . . . . . . . . . . . . . . . . . . . . . . . . . . . . . . . . . . . . . . . . . . . . . 5,143 3,425 66.6 3,269 63.6 155 4.5 1,718
West Virginia. . . . . . . . . . . . . . . . . . . . . . . . . . . . . . . . . . . . . . . . . . . . . . . 1,271 711 56.0 675 53.1 37 5.1 560
Wisconsin. . . . . . . . . . . . . . . . . . . . . . . . . . . . . . . . . . . . . . . . . . . . . . . . . . 4,055 2,905 71.6 2,815 69.4 90 3.1 1,150
Wyoming. . . . . . . . . . . . . . . . . . . . . . . . . . . . . . . . . . . . . . . . . . . . . . . . . . . 383 263 68.6 252 65.8 11 4.1 120
NOTE: Nonveterans never served on active duty in the U.S. Armed Forces.

Table 7. Employment status of veterans 18 years and over by presence of service-connected disability, reported disabilityrating, period of service, and sex, August 2017, not seasonally adjusted
[Numbers in thousands]
Presence of disability, reported disabilityrating, period of service, and sex
Civiliannoninsti-tutional
population
Civilian labor force
TotalPercent
ofpopulation
Employed
TotalPercent
ofpopulation
Unemployed
TotalPercent
oflabor force
Not inlaborforce
TOTAL
VETERANSTotal 20,562 10,065 49.0 9,618 46.8 448 4.4 10,497
With service-connected disability 4,939 2,390 48.4 2,287 46.3 103 4.3 2,549Less than 30 percent disability rating 1,401 749 53.5 725 51.7 24 3.3 65230 to 50 percent disability rating 1,066 664 62.3 642 60.3 22 3.3 40260 percent or higher disability rating 2,034 767 37.7 730 35.9 37 4.8 1,267Disability rating not reported 438 210 47.9 190 43.4 20 9.5 228
Without service-connected disability 14,905 7,338 49.2 7,005 47.0 333 4.5 7,567Presence of disability not reported 718 337 47.0 325 45.3 12 3.6 381
Gulf War era, totalTotal 7,490 6,001 80.1 5,769 77.0 232 3.9 1,489
With service-connected disability 2,613 1,885 72.1 1,809 69.2 76 4.0 728Less than 30 percent disability rating 580 515 88.8 494 85.2 21 4.1 6530 to 50 percent disability rating 658 534 81.2 527 80.1 7 1.3 12460 percent or higher disability rating 1,171 685 58.5 648 55.3 37 5.3 487Disability rating not reported 204 151 73.9 139 68.3 11 7.6 53
Without service-connected disability 4,526 3,878 85.7 3,732 82.4 146 3.8 648Presence of disability not reported 350 238 67.8 228 65.0 10 4.1 113
Gulf War era IITotal 4,085 3,297 80.7 3,150 77.1 147 4.5 788
With service-connected disability 1,667 1,264 75.8 1,215 72.9 50 3.9 403Less than 30 percent disability rating 328 300 91.6 294 89.7 6 2.1 2730 to 50 percent disability rating 430 373 86.9 368 85.6 6 1.5 5660 percent or higher disability rating 808 499 61.7 467 57.9 31 6.3 309Disability rating not reported 102 92 90.6 86 84.2 7 7.1 10
Without service-connected disability 2,200 1,881 85.5 1,791 81.4 90 4.8 319Presence of disability not reported 218 152 69.8 144 66.1 8 5.4 66
Gulf War era ITotal 3,405 2,704 79.4 2,619 76.9 85 3.1 701
With service-connected disability 946 621 65.6 594 62.8 26 4.3 326Less than 30 percent disability rating 252 215 85.2 200 79.3 15 6.9 3730 to 50 percent disability rating 228 161 70.5 160 69.9 1 0.8 6760 percent or higher disability rating 363 186 51.2 181 49.8 5 2.9 177Disability rating not reported 102 59 57.4 54 52.6 5 - 44
Without service-connected disability 2,326 1,998 85.9 1,941 83.4 57 2.8 329Presence of disability not reported 132 85 64.5 84 63.3 2 1.8 47
WW II, Korean War, and Vietnam eraTotal 8,050 1,707 21.2 1,582 19.7 124 7.3 6,343
With service-connected disability 1,692 260 15.4 250 14.8 10 3.9 1,432Less than 30 percent disability rating 602 120 19.9 118 19.6 2 1.8 48230 to 50 percent disability rating 281 62 22.1 59 20.8 4 - 21960 percent or higher disability rating 654 52 8.0 52 8.0 - - 602Disability rating not reported 155 26 16.6 21 13.8 4 - 129
Without service-connected disability 6,157 1,421 23.1 1,309 21.3 112 7.9 4,736Presence of disability not reported 201 26 12.7 23 11.5 2 - 175
Other service periodsTotal 5,022 2,358 46.9 2,267 45.1 91 3.9 2,664
With service-connected disability 633 244 38.6 228 36.0 16 6.7 389Less than 30 percent disability rating 219 114 52.0 113 51.5 1 1.1 10530 to 50 percent disability rating 127 68 53.2 57 44.6 11 - 5960 percent or higher disability rating 209 30 14.3 30 14.3 - - 179Disability rating not reported 79 33 42.2 29 36.9 4 - 45
Without service-connected disability 4,222 2,039 48.3 1,965 46.5 74 3.6 2,183Presence of disability not reported 167 74 44.4 74 44.4 0 - 93
See footnotes at end of table.
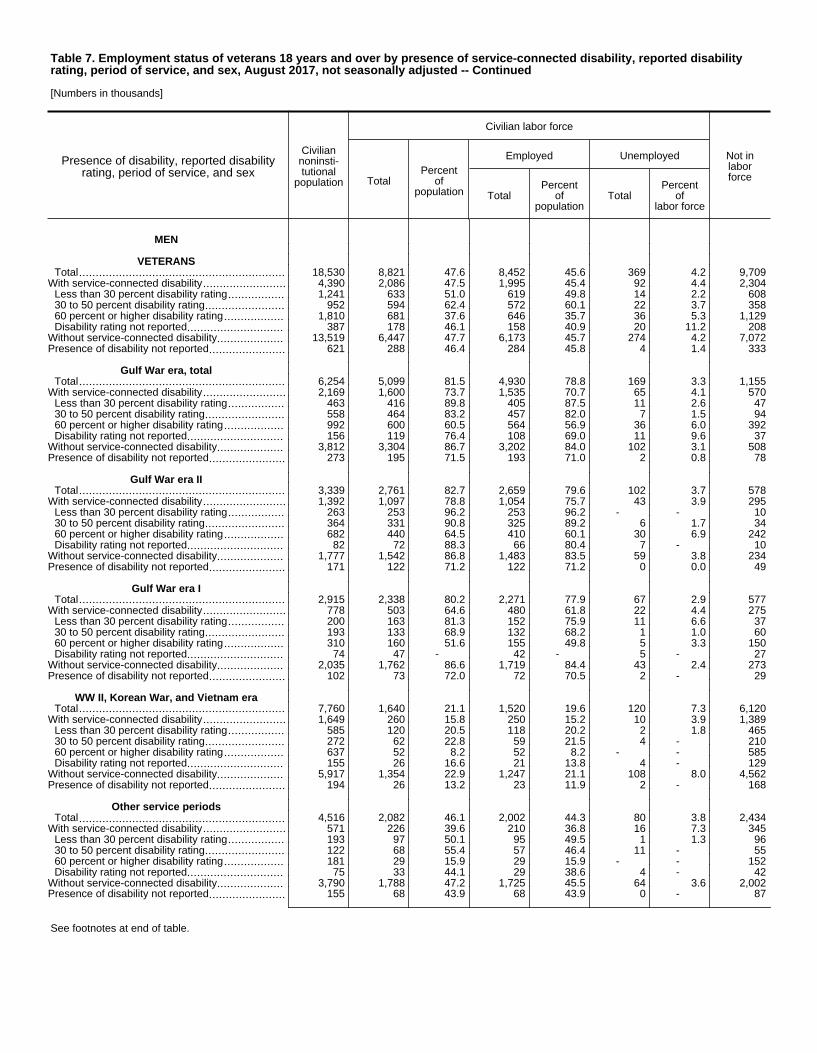
Table 7. Employment status of veterans 18 years and over by presence of service-connected disability, reported disabilityrating, period of service, and sex, August 2017, not seasonally adjusted -- Continued
[Numbers in thousands]
Presence of disability, reported disabilityrating, period of service, and sex
Civiliannoninsti-tutional
population
Civilian labor force
TotalPercent
ofpopulation
Employed
TotalPercent
ofpopulation
Unemployed
TotalPercent
oflabor force
Not inlaborforce
MEN
VETERANSTotal 18,530 8,821 47.6 8,452 45.6 369 4.2 9,709
With service-connected disability 4,390 2,086 47.5 1,995 45.4 92 4.4 2,304Less than 30 percent disability rating 1,241 633 51.0 619 49.8 14 2.2 60830 to 50 percent disability rating 952 594 62.4 572 60.1 22 3.7 35860 percent or higher disability rating 1,810 681 37.6 646 35.7 36 5.3 1,129Disability rating not reported 387 178 46.1 158 40.9 20 11.2 208
Without service-connected disability 13,519 6,447 47.7 6,173 45.7 274 4.2 7,072Presence of disability not reported 621 288 46.4 284 45.8 4 1.4 333
Gulf War era, totalTotal 6,254 5,099 81.5 4,930 78.8 169 3.3 1,155
With service-connected disability 2,169 1,600 73.7 1,535 70.7 65 4.1 570Less than 30 percent disability rating 463 416 89.8 405 87.5 11 2.6 4730 to 50 percent disability rating 558 464 83.2 457 82.0 7 1.5 9460 percent or higher disability rating 992 600 60.5 564 56.9 36 6.0 392Disability rating not reported 156 119 76.4 108 69.0 11 9.6 37
Without service-connected disability 3,812 3,304 86.7 3,202 84.0 102 3.1 508Presence of disability not reported 273 195 71.5 193 71.0 2 0.8 78
Gulf War era IITotal 3,339 2,761 82.7 2,659 79.6 102 3.7 578
With service-connected disability 1,392 1,097 78.8 1,054 75.7 43 3.9 295Less than 30 percent disability rating 263 253 96.2 253 96.2 - - 1030 to 50 percent disability rating 364 331 90.8 325 89.2 6 1.7 3460 percent or higher disability rating 682 440 64.5 410 60.1 30 6.9 242Disability rating not reported 82 72 88.3 66 80.4 7 - 10
Without service-connected disability 1,777 1,542 86.8 1,483 83.5 59 3.8 234Presence of disability not reported 171 122 71.2 122 71.2 0 0.0 49
Gulf War era ITotal 2,915 2,338 80.2 2,271 77.9 67 2.9 577
With service-connected disability 778 503 64.6 480 61.8 22 4.4 275Less than 30 percent disability rating 200 163 81.3 152 75.9 11 6.6 3730 to 50 percent disability rating 193 133 68.9 132 68.2 1 1.0 6060 percent or higher disability rating 310 160 51.6 155 49.8 5 3.3 150Disability rating not reported 74 47 - 42 - 5 - 27
Without service-connected disability 2,035 1,762 86.6 1,719 84.4 43 2.4 273Presence of disability not reported 102 73 72.0 72 70.5 2 - 29
WW II, Korean War, and Vietnam eraTotal 7,760 1,640 21.1 1,520 19.6 120 7.3 6,120
With service-connected disability 1,649 260 15.8 250 15.2 10 3.9 1,389Less than 30 percent disability rating 585 120 20.5 118 20.2 2 1.8 46530 to 50 percent disability rating 272 62 22.8 59 21.5 4 - 21060 percent or higher disability rating 637 52 8.2 52 8.2 - - 585Disability rating not reported 155 26 16.6 21 13.8 4 - 129
Without service-connected disability 5,917 1,354 22.9 1,247 21.1 108 8.0 4,562Presence of disability not reported 194 26 13.2 23 11.9 2 - 168
Other service periodsTotal 4,516 2,082 46.1 2,002 44.3 80 3.8 2,434
With service-connected disability 571 226 39.6 210 36.8 16 7.3 345Less than 30 percent disability rating 193 97 50.1 95 49.5 1 1.3 9630 to 50 percent disability rating 122 68 55.4 57 46.4 11 - 5560 percent or higher disability rating 181 29 15.9 29 15.9 - - 152Disability rating not reported 75 33 44.1 29 38.6 4 - 42
Without service-connected disability 3,790 1,788 47.2 1,725 45.5 64 3.6 2,002Presence of disability not reported 155 68 43.9 68 43.9 0 - 87
See footnotes at end of table.
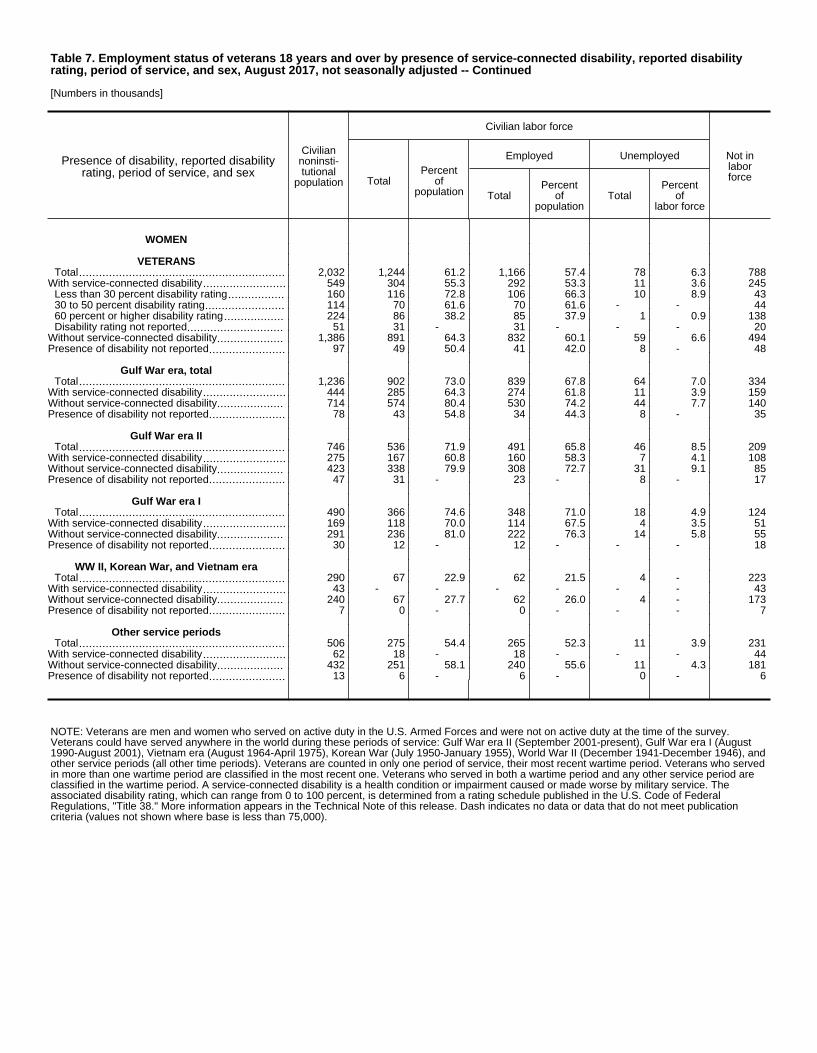
Table 7. Employment status of veterans 18 years and over by presence of service-connected disability, reported disabilityrating, period of service, and sex, August 2017, not seasonally adjusted -- Continued
[Numbers in thousands]
Presence of disability, reported disabilityrating, period of service, and sex
Civiliannoninsti-tutional
population
Civilian labor force
TotalPercent
ofpopulation
Employed
TotalPercent
ofpopulation
Unemployed
TotalPercent
oflabor force
Not inlaborforce
WOMEN
VETERANSTotal 2,032 1,244 61.2 1,166 57.4 78 6.3 788
With service-connected disability 549 304 55.3 292 53.3 11 3.6 245Less than 30 percent disability rating 160 116 72.8 106 66.3 10 8.9 4330 to 50 percent disability rating 114 70 61.6 70 61.6 - - 4460 percent or higher disability rating 224 86 38.2 85 37.9 1 0.9 138Disability rating not reported 51 31 - 31 - - - 20
Without service-connected disability 1,386 891 64.3 832 60.1 59 6.6 494Presence of disability not reported 97 49 50.4 41 42.0 8 - 48
Gulf War era, totalTotal 1,236 902 73.0 839 67.8 64 7.0 334
With service-connected disability 444 285 64.3 274 61.8 11 3.9 159Without service-connected disability 714 574 80.4 530 74.2 44 7.7 140Presence of disability not reported 78 43 54.8 34 44.3 8 - 35
Gulf War era IITotal 746 536 71.9 491 65.8 46 8.5 209
With service-connected disability 275 167 60.8 160 58.3 7 4.1 108Without service-connected disability 423 338 79.9 308 72.7 31 9.1 85Presence of disability not reported 47 31 - 23 - 8 - 17
Gulf War era ITotal 490 366 74.6 348 71.0 18 4.9 124
With service-connected disability 169 118 70.0 114 67.5 4 3.5 51Without service-connected disability 291 236 81.0 222 76.3 14 5.8 55Presence of disability not reported 30 12 - 12 - - - 18
WW II, Korean War, and Vietnam eraTotal 290 67 22.9 62 21.5 4 - 223
With service-connected disability 43 - - - - - - 43Without service-connected disability 240 67 27.7 62 26.0 4 - 173Presence of disability not reported 7 0 - 0 - - - 7
Other service periodsTotal 506 275 54.4 265 52.3 11 3.9 231
With service-connected disability 62 18 - 18 - - - 44Without service-connected disability 432 251 58.1 240 55.6 11 4.3 181Presence of disability not reported 13 6 - 6 - 0 - 6
NOTE: Veterans are men and women who served on active duty in the U.S. Armed Forces and were not on active duty at the time of the survey.Veterans could have served anywhere in the world during these periods of service: Gulf War era II (September 2001-present), Gulf War era I (August1990-August 2001), Vietnam era (August 1964-April 1975), Korean War (July 1950-January 1955), World War II (December 1941-December 1946), andother service periods (all other time periods). Veterans are counted in only one period of service, their most recent wartime period. Veterans who servedin more than one wartime period are classified in the most recent one. Veterans who served in both a wartime period and any other service period areclassified in the wartime period. A service-connected disability is a health condition or impairment caused or made worse by military service. Theassociated disability rating, which can range from 0 to 100 percent, is determined from a rating schedule published in the U.S. Code of FederalRegulations, "Title 38." More information appears in the Technical Note of this release. Dash indicates no data or data that do not meet publicationcriteria (values not shown where base is less than 75,000).

Table 8. Employed persons 18 years and over by veteran status, presence of service-connected disability, period of service,and class of worker, August 2017, not seasonally adjusted
Veteran status, presence ofdisability, and period of service
Totalemployed
(thousands)
Percent distribution by class of worker
Total
Agricultureand
relatedindustries
Nonagricultural industries
Total
Wage and salary workers ¹
Privatesector
Government
Total Federal State andlocal
Self-employed,unincorpo-rated, and
unpaidfamily
workers
Veterans, total ² 9,618 100.0 2.3 97.7 69.8 21.9 10.3 11.6 6.0With service-connected disability 2,287 100.0 1.6 98.4 59.2 32.5 19.3 13.2 6.7Without service-connected disability 7,005 100.0 2.4 97.6 73.1 18.6 7.2 11.4 5.9
Gulf War era, total ² 5,769 100.0 0.8 99.2 70.8 25.6 12.6 13.0 2.7With service-connected disability 1,809 100.0 0.4 99.6 60.7 35.1 21.4 13.7 3.9Without service-connected disability 3,732 100.0 0.9 99.1 75.5 21.4 8.1 13.3 2.2
Gulf War era II ² 3,150 100.0 0.9 99.1 70.9 25.3 12.1 13.2 2.9With service-connected disability 1,215 100.0 0.6 99.4 63.0 32.5 17.3 15.2 3.9Without service-connected disability 1,791 100.0 0.8 99.2 76.3 20.7 7.9 12.8 2.1
Gulf War era I ² 2,619 100.0 0.8 99.2 70.7 26.0 13.3 12.7 2.5With service-connected disability 594 100.0 - 100.0 55.8 40.3 29.6 10.7 3.8Without service-connected disability 1,941 100.0 0.9 99.1 74.8 22.1 8.3 13.8 2.2
WW II, Korean War, and Vietnam era ² 1,582 100.0 6.8 93.2 65.4 11.4 4.1 7.3 16.5With service-connected disability 250 100.0 7.0 93.0 52.6 14.8 6.3 8.4 25.7Without service-connected disability 1,309 100.0 6.8 93.2 67.3 10.9 3.8 7.2 15.0
Other service periods ² 2,267 100.0 3.0 97.0 70.1 19.8 8.8 10.9 7.2With service-connected disability 228 100.0 5.7 94.3 54.7 31.5 17.6 14.0 8.1Without service-connected disability 1,965 100.0 2.5 97.5 72.2 18.4 7.7 10.7 6.8
Nonveterans 141,637 100.0 1.6 98.4 79.7 13.0 1.9 11.1 5.7
¹ Includes self-employed workers whose businesses are incorporated. ² Includes veterans who did not report presence of disability.NOTE: Veterans are men and women who served on active duty in the U.S. Armed Forces and were not on active duty at the time of the survey.Nonveterans never served on active duty in the U.S. Armed Forces. Veterans could have served anywhere in the world during these periods of service:Gulf War era II (September 2001-present), Gulf War era I (August 1990-August 2001), Vietnam era (August 1964-April 1975), Korean War (July 1950-January 1955), World War II (December 1941-December 1946), and other service periods (all other time periods). Veterans are counted in only oneperiod of service, their most recent wartime period. Veterans who served in more than one wartime period are classified in the most recent one.Veterans who served in both a wartime period and any other service period are classified in the wartime period. A service-connected disability is ahealth condition or impairment caused or made worse by military service. The associated disability rating, which can range from 0 to 100 percent, isdetermined from a rating schedule published in the U.S. Code of Federal Regulations, "Title 38." More information appears in the Technical Note of thisrelease.
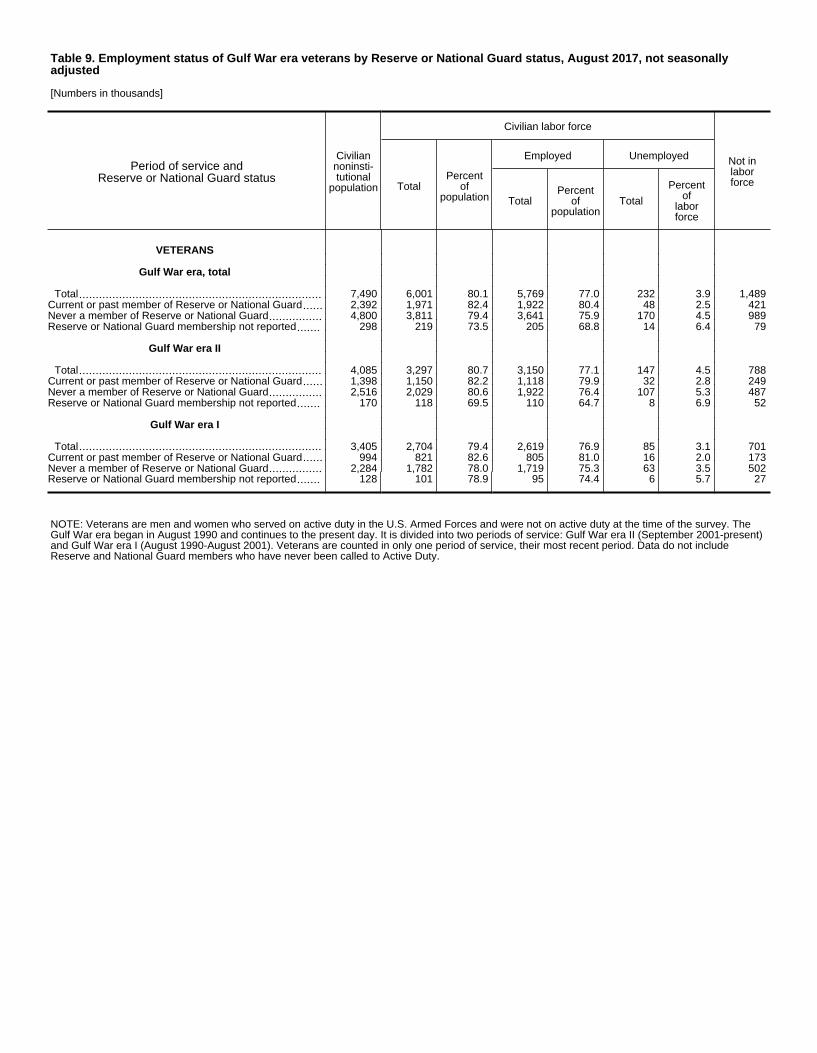
Table 9. Employment status of Gulf War era veterans by Reserve or National Guard status, August 2017, not seasonallyadjusted
[Numbers in thousands]
Period of service andReserve or National Guard status
Civiliannoninsti-tutional
population
Civilian labor force
TotalPercent
ofpopulation
Employed
TotalPercent
ofpopulation
Unemployed
Total
Percentof
laborforce
Not inlaborforce
VETERANS
Gulf War era, total
Total 7,490 6,001 80.1 5,769 77.0 232 3.9 1,489Current or past member of Reserve or National Guard 2,392 1,971 82.4 1,922 80.4 48 2.5 421Never a member of Reserve or National Guard 4,800 3,811 79.4 3,641 75.9 170 4.5 989Reserve or National Guard membership not reported 298 219 73.5 205 68.8 14 6.4 79
Gulf War era II
Total 4,085 3,297 80.7 3,150 77.1 147 4.5 788Current or past member of Reserve or National Guard 1,398 1,150 82.2 1,118 79.9 32 2.8 249Never a member of Reserve or National Guard 2,516 2,029 80.6 1,922 76.4 107 5.3 487Reserve or National Guard membership not reported 170 118 69.5 110 64.7 8 6.9 52
Gulf War era I
Total 3,405 2,704 79.4 2,619 76.9 85 3.1 701Current or past member of Reserve or National Guard 994 821 82.6 805 81.0 16 2.0 173Never a member of Reserve or National Guard 2,284 1,782 78.0 1,719 75.3 63 3.5 502Reserve or National Guard membership not reported 128 101 78.9 95 74.4 6 5.7 27
NOTE: Veterans are men and women who served on active duty in the U.S. Armed Forces and were not on active duty at the time of the survey. TheGulf War era began in August 1990 and continues to the present day. It is divided into two periods of service: Gulf War era II (September 2001-present)and Gulf War era I (August 1990-August 2001). Veterans are counted in only one period of service, their most recent period. Data do not includeReserve and National Guard members who have never been called to Active Duty.

Table 10. Employment status of Gulf War-era II veterans 18 years and over by location of service, August 2017, not seasonallyadjusted
[Numbers in thousands]
Period of service and locationCivilian
noninsti-tutional
population
Civilian labor force
TotalPercent
ofpopulation
Employed
TotalPercent
ofpopulation
Unemployed
Number Rate
Not inlaborforce
Total, Gulf War-era II veterans 4,085 3,297 80.7 3,150 77.1 147 4.5 788Served in Iraq, Afghanistan, or both ¹ 1,940 1,519 78.3 1,452 74.8 67 4.4 421
Served in Iraq ² 1,509 1,149 76.2 1,105 73.2 44 3.9 359Served in Afghanistan ³ 977 785 80.3 746 76.4 38 4.9 192Served in both locations 4 545 415 76.1 399 73.3 15 3.7 130
Served elsewhere 2,145 1,778 82.9 1,698 79.2 80 4.5 367
¹ Refers to veterans who served in Iraq at anytime since March 2003 and veterans who served in Afghanistan at anytime since October 2001. Alsoincludes veterans who served in both countries. ² Includes all veterans who served in Iraq at any time since March 2003, whether or not they also served in Afghanistan. ³ Includes all veterans who served in Afghanistan at any time since October 2001, whether or not they also served in Iraq. 4 Veterans who served in both Iraq and Afghanistan during the designated dates are also included in the totals of each location above.NOTE: Veterans are men and women who served on active duty in the U.S. Armed Forces and were not on active duty at the time of the survey. GulfWar-era II veterans served anywhere in the world at any time since September 2001.