employment, collective bargaining and the quality of ... cfp 101114.pdf · employment, collective...
TRANSCRIPT
Employment, collective bargaining and the quality of industrial relations in the field of fisheries and aquaculture
R E S E A R C H R E P O R T

Employment, collective bargaining and the quality of industrial relations in the field of fisheries and aquaculture
R E S E A R C H R E P O R T
With the financial support from the European Union
The sole responsibility for this publication lies with the author. The Commission is not responsible for any use that may be made of the information contained.
Grant agreement no. VS/2013/0201“The impact of the Common Fisheries Policy (CFP) reform and the contribution of collective bargaining tocreate more and better jobs toward the exit from crisis: information and training measures in Europeanfisheries and aquaculture sector for workers organizations”
Budget heading 04.03.03.02 - Information and training measures for workers' organisations
European Commission - Employment, Social Affairs and Inclusion DG
The project is supported by
EUROPEAN TRANSPORT WORKERS’ FEDERATION - ETF
FAGLIGT FAELLES FORBUND - 3F (DANIMARCA)
FÉDÉRATION GÉNÉRALE DES TRANSPORTS ET DE L’EQUIPMENT - CFDT (FRANCIA)
SYNDICAT DES MARINS PECHEURS - CFTC (FRANCIA)
FEDERACION DE SERVICIOS A LA CIUDADANIA MAR - CC.OO. (SPAGNA)
ACV TRANSCOM MARITIME (BELGIO)

INTRODUCTION 4
METHODOLOGICAL NOTE 5
PART I FISHING IN EUROPE 7
THE ECONOMIC FRAMEWORK 9The European fishing fleet 9Aquaculture 12The processing industry 15Employment 18The market 20
BARGAINING AND SECTORAL POLICIES: THE ROLE OF THE TRADE UNIONS AND MANAGEMENT REPRESENTATIVES AT EUROPEAN LEVEL 22
Collective relations at European level 22The role of the trade unions and management representatives 22Collective bargaining in Europe 24
EUROPEAN POLICIES IN THE FIELD OF FISHERIES AND AQUACULTURE 25The Common Fisheries Policy 25The impact of the CFP 26The reformed CFP 27The European Fund for Maritime Affairs and Fisheries 30
PART II COUNTRY INFO 33
BELGIUM 35Introduction 35Economic and structural characteristics 35Evaluation of the impact of the CFP 36Collective bargaining in the fishing industry 37
DENMARK 39Introduction 39Economic and structural characteristics 39Evaluation of the impact of the CFP 40Collective bargaining in the fishing industry 41
FRANCE 43Introduction 43Economic and structural characteristics 43Evaluation of the impact of the CFP 44Collective bargaining in the fishing industry 45
ITALY 47Introduction 47Economic and structural characteristics 48Evaluation of the impact of the CFP 49Collective bargaining in the fishing industry 50
THE NETHERLANDS 52Economic and structural characteristics 52Collective bargaining in the fishing industry 53
SPAIN 55Introduction 55Economic and structural characteristics 56Evaluation of the impact of the CFP 57Collective bargaining in the fishing industry 58
CONCLUSIONS 61
BIBLIOGRAPHY 63
C O N T E N T S
3

4
I N T R O D U C T I O N
In the last few years, the Italian fishing industry has undergone a period of powerful economic contraction. Those who know this industry in various roles are aware of the causes that have led to this state of affairs.From the increase in the cost of fuel, which has had a considerable impact on business costs, triggering aspiral that has negatively affected the turnover of companies and, therefore, the salaries of employees andincome of the business; to the scarcity of the catch and the inability of the same to produce an income thatwill cover costs; to issues related to the market which often has to compete with much cheaper productsimported from non-EU countries. This is a very complicated situation, and the European Commission, with the enactment of various regula-tions, has attempted to safeguard and revive the sector but without establishing a proper dialogue withthe fishermen.In addition, in some areas, the relationship with the institutions has been contentious which has resultedin difficulties in finding a common course of action to deal with the problems.It is in this scenario that trade union activity draws the strength to take action and seek solutions to revivethe sector, involving all the interested parties.On various occasions, we have had the opportunity to speak with trade unions elsewhere in Europe andnote that our problems were also theirs.Hence the idea of this project, motivated by the desire to form a relationship with others who are living inthe same conditions as we are, comparing the contractual systems, labour regulations, and the systems ofemployment and social protection, to promote an undertaking aimed at reducing the inequalities betweenmember states, improving the role of bargaining and workers’ conditions, and increasing employment.We wanted to touch the reality in which workers are employed in different countries throughout Europe,by going and hearing directly from the protagonists about the problems they face daily, to promote adebate on the prospects and challenges of the future in the fishing industry.An important exchange of information which highlighted similarities and differences which the reader willfind in this volume which provides a snapshot of the sector in Italy and in Europe.
Sara PalazzoliSegretario Nazionale FLAI CGIL
5
The aim of this work is to provide a picture of the employment situation, the status of collective bargain-ing, and the quality of industrial relations in European fisheries and aquaculture as a tool for interpretingthe sector and as a starting point for the development of initiatives and policy proposals.This is the context in which was established the project “The impact of the reform of the Common FisheriesPolicy and the contribution of collective bargaining to the creation of more and better jobs to lead to a wayout of the crisis” which this publication is part of. The first part of the book illustrates the situation of the fisheries sector in Europe (fishing, aquaculture andprocessing) and provides a picture of the role of trade unions and the functioning of collective bargainingat European level through the collection and systematisation of the most up-to-date data available in theliterature. Particularly relevant for the reconstruction are the studies by section of the Scientific, Technicaland Economic Committee for Fisheries of the European Commission, the working documents of theEuropean Commission on the impact of the CFP with a view to its reform, as well as the Eurostat, FAO andUN databases.1
The second part of this publication focuses on the six countries that were the object of the case studies:Belgium, Denmark, France, Italy, the Netherlands and Spain. The analyses were carried out with the coop-eration of the national unions as part of the project “The impact of the reform of the Common FisheriesPolicy and the contribution of collective bargaining to the creation of more and better jobs o lead to a wayout of the crisis” . The trade unions were involved in the analysis between November 2013 and June 2014 through their par-ticipation in a focus group, the compilation of questionnaires and fact sheets on collective bargaining inthe sector, as well as during the fruitful comparisons on the subject which took place in the context of train-ing meetings which took place in the major ports of the participating countries. The meetings, which were held in Thyboron, Vigo, Boulogne-sur-Mer and Ostend in May and June 2014 inthe presence of workers, employees, owners, representatives of the institutions and the trade unions werean important opportunity for comparing the different European scenarios and a step towards understand-ing the impact of the Common Fisheries Policy on local economies.
1 For references to the documents in question, see the bibliography.
M E T H O D O L O G I C A L N O T E
F I S H I N G I N E U R O P E
1
6

PART
18
The economic framework
With a value of €55 billion and 12 million tons, the European Union is the world’s largest market for fish-ery and aquaculture products. Albeit with substantial differences between countries, Europeans consumeon average 22kg of fish per year, 15% of their protein intake and these totals are expected to increase.
T H E E U R O P E A N F I S H I N G F L E E T
In 2011, small-sized boats made up almost 56% of the total fleet in terms of number of vessels, 6% in termsof gross tonnage and 25% in terms of engine power. The ocean fleet, although representing only 1% of thetotal in terms of the number of vessels, constituted 19% of gross tonnage and 7% of engine power. The indus-trial fleet, finally, accounted for 43% in terms of vessels, 75% of gross tonnage and 68% of engine power.In 2011, the European fleet landed 4,699 tons of fish, equivalent to 6.4 billion euros in volume. TheDanish fleet produced, in terms of weight, 20% of the total fish catch, followed by the UK with 17%.With regard to the value of fish landed, Italy produced 22% of the European total, followed by France(21%) and the UK (19%).As in 2010, herring was the most fished species in terms of volume, with a total of 483,000 tons caught,while mackerel reached the highest value of 390 million euros, an increase of 36% over the previous year.The first sales prices increased on average over the previous year: the first price of mackerel, in particular,increased by 20%, despite a simultaneous increase in the volume of catch of 13%, which indicates a sig-nificant increase in demand. The total income generated by the European fleet in 2011 amounted to €7.13 billion divided between €7billion from the sale of fish and €131 million in other revenue, an increase of 7.6% over the previous year.Total costs (excluding fishing rights) amounted to €6.7 billion in 2011, an increase of 7% on the previousyear, caused mainly by the costs of labour and fuel; other costs associated with production amounted to€1.02 billion, and fixed costs were approximately €1.2 billion (of which €571 million was for maintenance).In 2011, the EU fleet paid about €776 million in terms of depreciation and approximately €101 million inopportunity costs of capital.
PART
1
9

instead was the one with the highest ratio between gross value added and profit (64%), followed byDenmark (63%) and Romania (61%).As regards gross profit, the Italian fleet produced 24% of the European total, the best result in absolute terms,followed by the fleets of the United Kingdom (16%) and France (14%). In relative terms instead, the Danishfleet recorded the best performance with 34% of the ratio between GVA and gross profit, followed The UKachieved the highest net profit (38% of the EU total), followed by France (26%) and Italy (19%). The Latvianfleet got the best ratio for net income/profit (28%), followed by the Romanian (17%) and British fleets (16%).
PART
1
11
The 2011 results showed an increase in the profitability of the European fishing fleet compared to 2010.The amount of gross value added (GVA), gross profit and net profit generated by the European fishing fleetin 2011 were, respectively, €3.4 billion (+ 3.6% compared to 2010), €1.29 billion and €410 million.While 13 out of 19 states reported net profit in 2011, 6 countries – Bulgaria, Ireland, Finland, Germany,Malta and Slovenia – recorded a loss in the sector. The Spanish fleet is the one that recorded the highest gross value added in absolute terms (25% of theEuropean total), followed by the French and Italian fleets, each with 17% of the total. The Portuguese fleet
PART
110
FIGURE 2Catch per Member State (2011) (volume in tonnes live weight and percentage of total)
ES 860 030 17.59 %DK 738 846 15.11 %UK 599 523 12.26%FR 443 549 9.07 %NL 364 964 7.46%DE 224 592 4.59%PT 214 779 4.39%IT 212 730 4.35%IE 206 177 4.22%SE 179 836 3.68%PL 169 593 3.47 %LV 156 130 3.19 %LT 137 063 2.80 %FI 119 686 2.45 %EE 77 942 1.59 %HR 70 534 1.44 %EL 62 847 1.29 %BE 22 191 0.45 %BG 8 956 0.18 %HU * 6 216 0.13 %CZ * 3 990 0.08 %RO 3 254 0.07 %MT 1 920 0.04 %SK * 1 608 0.03 %CY 1 163 0.02 %SI 719 0.01 %AT* 350 0.01 %Total EU-28 4 889 188 100.00%* 2010 data. Source: European Commission, Facts and figures on the CFP (2014)
Main indicators related to fishing fleets of the member states (2011)
BEL 89 15,8 51,2 377 342 40,3 17,2 20,1 79,4 82,35 35,9 9,5 0,5 45,1
BGR 1010 5,0 33,7 3276 1668 1,1 16,1 7,6 2,7 2,70 -1,5 -3,1 -3,3 0,1
CYP n.a. n.a. n.a. n.a. n.a. n.a. n.a. 1,2 8,0 7,99 n.a. n.a. n.a. n.a.
DEU 1664 64,6 151,4 1639 1258 41,6 109,3 78,1 125,5 129,63 57,8 14,8 -6,4 97,9
DNK 2663 67,5 238,8 1460 1661 88,0 116,0 711,0 412,8 394,50 249,1 134,5 45,8 406,4
ESP 10892 414,7 936,0 36294 32194 n.a. n.a. n.a. n.a. 1982,06 839,0 180,5 18,6 516,5
EST 934 14,7 39,6 n.a. n.a. n.a. n.a. 63,3 13,8 13,78 n.a. n.a. n.a. n.a.
FIN 3365 16,7 172,8 1722 316 14,2 148,2 119,7 32,5 35,53 12,3 3,9 -0,7 69,2
FRA 6004 161,0 879,9 10713 7447 341,6 492,8 463,7 1050,7 1156,37 590,8 181,2 107,2 1300,7
GBR 6467 207,2 825,9 12405 7192 268,1 414,5 597,4 948,7 971,78 429,5 202,2 157,7 525,4
GRC n.a. n.a. n.a. n.a. n.a. n.a. n.a. n.a. n.a. n.a. n.a. n.a. n.a. n.a.
IRL 2162 72,2 202,4 4714 3166 63,8 49,5 199,5 200,3 246,32 111,6 45,2 -14,3 367,4
ITA 14715 185,0 1236,5 28726 20599 408,2 1748,5 212,4 1101,0 1101,03 582,9 303,2 79,6 917,9
LTU 171 46,0 54,4 768 575 26,4 10,3 114,7 65,6 46,96 12,9 7,5 4,7 53,2
LVA 319 8,5 22,3 712 378 6,5 19,6 63,1 21,8 22,62 10,7 7,4 6,2 9,7
MLT 1087 12,1 83,4 225 155 2,6 41,3 1,9 11,4 11,37 6,1 -1,5 -22,2 81,6
NLD 738 130,5 290,1 2763 1768 193,8 46,1 339,4 326,6 327,61 109,1 30,8 3,0 343,8
POL 805 38,0 88,1 2411 1576 12,7 58,2 179,9 46,0 46,41 21,5 8,8 4,8 91,0
PRT 8557 102,5 377,4 17234 17188 107,3 375,1 178,8 344,2 442,38 283,6 129,2 29,0 358,0
ROU 488 1,0 7,0 454 28 0,2 2,9 0,5 1,4 1,42 0,9 0,4 0,2 3,9
SVN 186 1,0 10,9 114,0 77,0 0,5 7,6 0,7 2,0 2,68 1,6 0,0 -0,4 4,5
SWE 1359 32,9 178,1 1679,0 974,0 40,9 83,7 173,4 116,5 130,50 59,8 32,5 0,2 164,3
Source: Scientific and Technical Committee for Fisheries (STECF), 2013
Coun
try
Num
ber
of v
esse
ls
Gro
ss T
onna
ge(1
000
GT)
Kilo
wat
ts
(100
0 kW
)
Tota
l job
s
FTEs
Ener
gy c
onsu
mpt
ion
(mill
ion
litre
s)
Day
s at
Sea
(tho
usan
d)
Wei
ght
of la
ndin
gs(t
hous
and
tonn
es)
Land
ed v
alue
(€ m
illio
n)
Inco
me
(€ m
illio
n)
GVA
(€ m
illio
n)
Gro
ss P
rofit
(€ m
illio
n)
Net
pro
fit(€
mill
ion)
Fixe
d A
sset
val
ue(€
mill
ion)
FIGURE 1
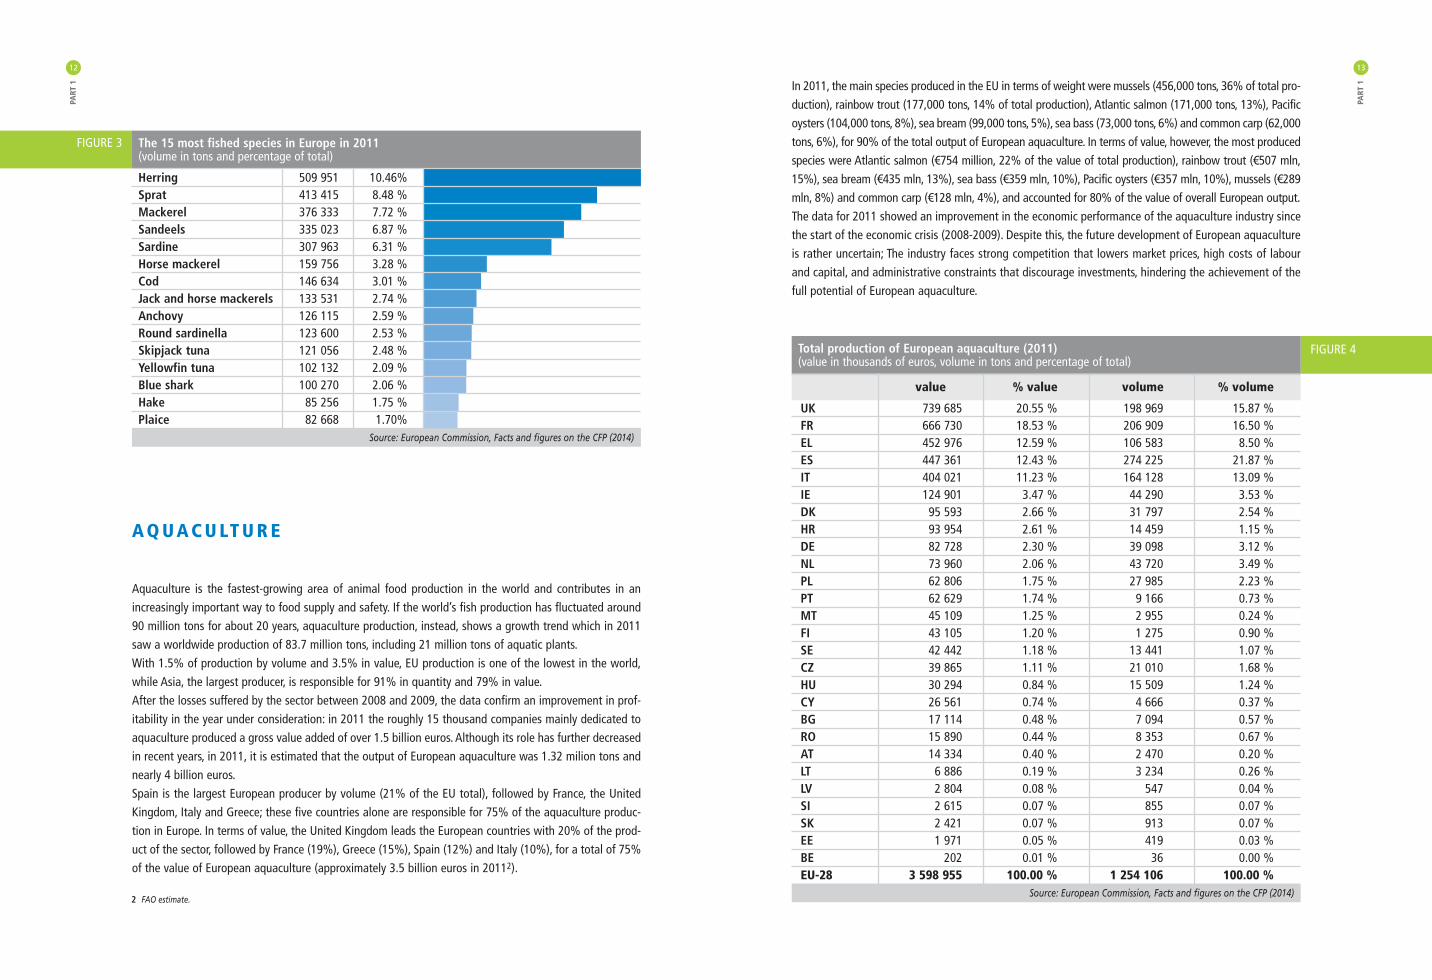
In 2011, the main species produced in the EU in terms of weight were mussels (456,000 tons, 36% of total pro-duction), rainbow trout (177,000 tons, 14% of total production), Atlantic salmon (171,000 tons, 13%), Pacificoysters (104,000 tons, 8%), sea bream (99,000 tons, 5%), sea bass (73,000 tons, 6%) and common carp (62,000tons, 6%), for 90% of the total output of European aquaculture. In terms of value, however, the most producedspecies were Atlantic salmon (€754 million, 22% of the value of total production), rainbow trout (€507 mln,15%), sea bream (€435 mln, 13%), sea bass (€359 mln, 10%), Pacific oysters (€357 mln, 10%), mussels (€289mln, 8%) and common carp (€128 mln, 4%), and accounted for 80% of the value of overall European output.The data for 2011 showed an improvement in the economic performance of the aquaculture industry sincethe start of the economic crisis (2008-2009). Despite this, the future development of European aquacultureis rather uncertain; The industry faces strong competition that lowers market prices, high costs of labourand capital, and administrative constraints that discourage investments, hindering the achievement of thefull potential of European aquaculture.
PART
1
13
A Q U A C U LT U R E
Aquaculture is the fastest-growing area of animal food production in the world and contributes in anincreasingly important way to food supply and safety. If the world’s fish production has fluctuated around90 million tons for about 20 years, aquaculture production, instead, shows a growth trend which in 2011saw a worldwide production of 83.7 million tons, including 21 million tons of aquatic plants. With 1.5% of production by volume and 3.5% in value, EU production is one of the lowest in the world,while Asia, the largest producer, is responsible for 91% in quantity and 79% in value.After the losses suffered by the sector between 2008 and 2009, the data confirm an improvement in prof-itability in the year under consideration: in 2011 the roughly 15 thousand companies mainly dedicated toaquaculture produced a gross value added of over 1.5 billion euros. Although its role has further decreasedin recent years, in 2011, it is estimated that the output of European aquaculture was 1.32 milion tons andnearly 4 billion euros.Spain is the largest European producer by volume (21% of the EU total), followed by France, the UnitedKingdom, Italy and Greece; these five countries alone are responsible for 75% of the aquaculture produc-tion in Europe. In terms of value, the United Kingdom leads the European countries with 20% of the prod-uct of the sector, followed by France (19%), Greece (15%), Spain (12%) and Italy (10%), for a total of 75%of the value of European aquaculture (approximately 3.5 billion euros in 20112).
PART
112
FIGURE 3 The 15 most fished species in Europe in 2011 (volume in tons and percentage of total)
Herring 509 951 10.46%Sprat 413 415 8.48 %Mackerel 376 333 7.72 %Sandeels 335 023 6.87 %Sardine 307 963 6.31 %Horse mackerel 159 756 3.28 %Cod 146 634 3.01 %Jack and horse mackerels 133 531 2.74 %Anchovy 126 115 2.59 %Round sardinella 123 600 2.53 %Skipjack tuna 121 056 2.48 %Yellowfin tuna 102 132 2.09 %Blue shark 100 270 2.06 %Hake 85 256 1.75 %Plaice 82 668 1.70%
Source: European Commission, Facts and figures on the CFP (2014)
2 FAO estimate.
Total production of European aquaculture (2011) (value in thousands of euros, volume in tons and percentage of total)
value % value volume % volume
UK 739 685 20.55 % 198 969 15.87 %FR 666 730 18.53 % 206 909 16.50 %EL 452 976 12.59 % 106 583 8.50 %ES 447 361 12.43 % 274 225 21.87 %IT 404 021 11.23 % 164 128 13.09 %IE 124 901 3.47 % 44 290 3.53 %DK 95 593 2.66 % 31 797 2.54 %HR 93 954 2.61 % 14 459 1.15 %DE 82 728 2.30 % 39 098 3.12 %NL 73 960 2.06 % 43 720 3.49 %PL 62 806 1.75 % 27 985 2.23 %PT 62 629 1.74 % 9 166 0.73 %MT 45 109 1.25 % 2 955 0.24 %FI 43 105 1.20 % 1 275 0.90 %SE 42 442 1.18 % 13 441 1.07 %CZ 39 865 1.11 % 21 010 1.68 %HU 30 294 0.84 % 15 509 1.24 %CY 26 561 0.74 % 4 666 0.37 %BG 17 114 0.48 % 7 094 0.57 %RO 15 890 0.44 % 8 353 0.67 %AT 14 334 0.40 % 2 470 0.20 %LT 6 886 0.19 % 3 234 0.26 % LV 2 804 0.08 % 547 0.04 %SI 2 615 0.07 % 855 0.07 %SK 2 421 0.07 % 913 0.07 %EE 1 971 0.05 % 419 0.03 %BE 202 0.01 % 36 0.00 %EU-28 3 598 955 100.00 % 1 254 106 100.00 %
Source: European Commission, Facts and figures on the CFP (2014)
FIGURE 4
T H E P R O C E S S I N G I N D U S T R Y
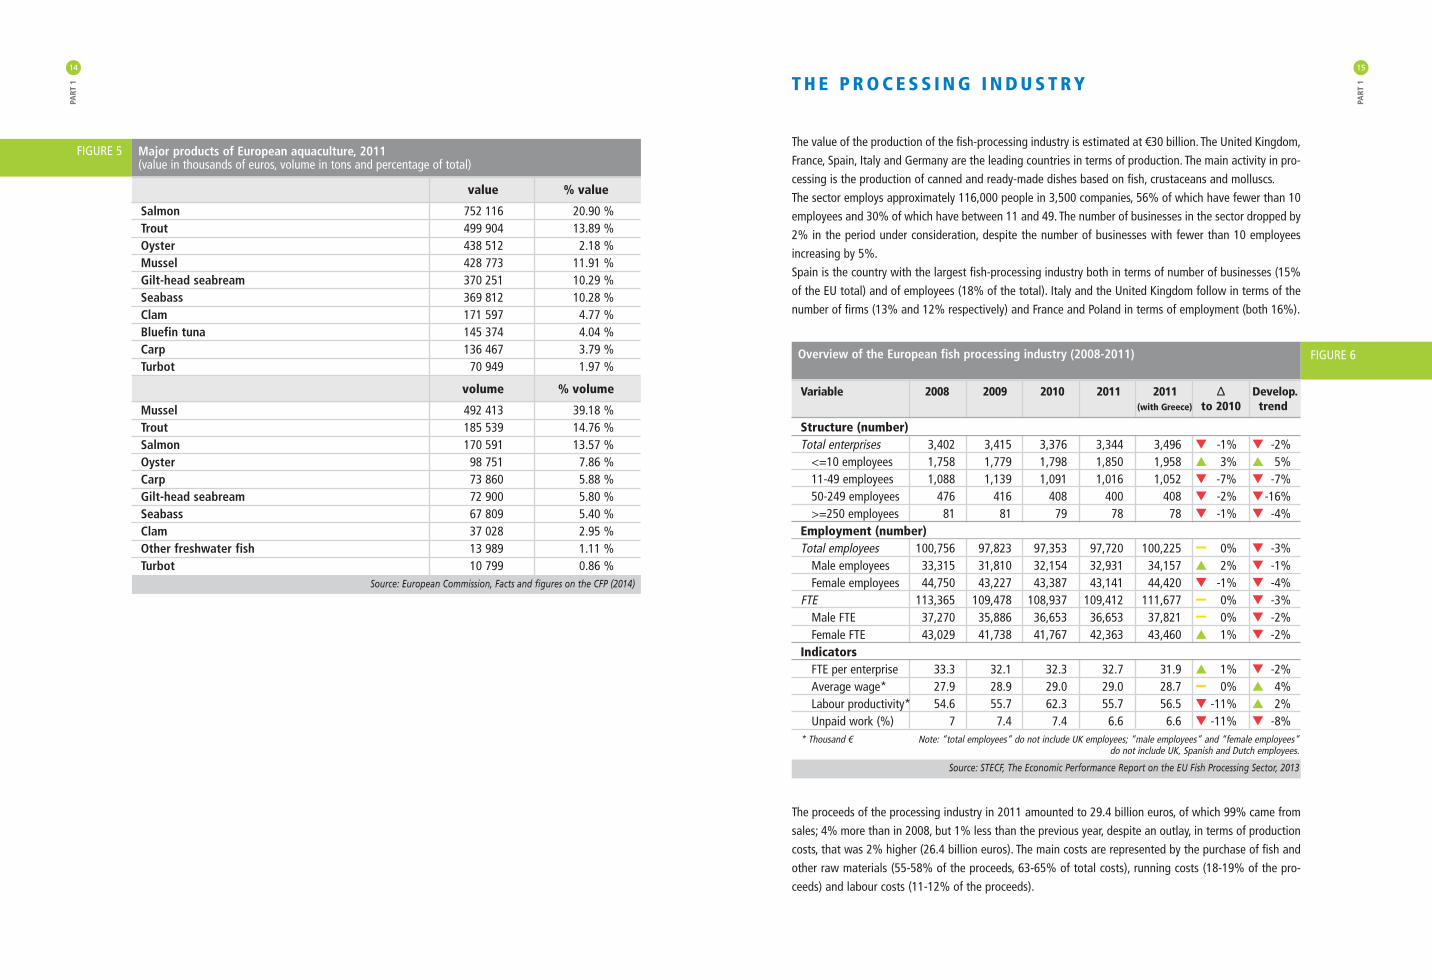
The value of the production of the fish-processing industry is estimated at €30 billion. The United Kingdom,France, Spain, Italy and Germany are the leading countries in terms of production. The main activity in pro-cessing is the production of canned and ready-made dishes based on fish, crustaceans and molluscs. The sector employs approximately 116,000 people in 3,500 companies, 56% of which have fewer than 10employees and 30% of which have between 11 and 49. The number of businesses in the sector dropped by2% in the period under consideration, despite the number of businesses with fewer than 10 employeesincreasing by 5%. Spain is the country with the largest fish-processing industry both in terms of number of businesses (15%of the EU total) and of employees (18% of the total). Italy and the United Kingdom follow in terms of thenumber of firms (13% and 12% respectively) and France and Poland in terms of employment (both 16%).
The proceeds of the processing industry in 2011 amounted to 29.4 billion euros, of which 99% came fromsales; 4% more than in 2008, but 1% less than the previous year, despite an outlay, in terms of productioncosts, that was 2% higher (26.4 billion euros). The main costs are represented by the purchase of fish andother raw materials (55-58% of the proceeds, 63-65% of total costs), running costs (18-19% of the pro-ceeds) and labour costs (11-12% of the proceeds).
PART
1
15PA
RT 1
14
Major products of European aquaculture, 2011 (value in thousands of euros, volume in tons and percentage of total)
value % value
Salmon 752 116 20.90 %Trout 499 904 13.89 %Oyster 438 512 2.18 %Mussel 428 773 11.91 %Gilt-head seabream 370 251 10.29 %Seabass 369 812 10.28 %Clam 171 597 4.77 %Bluefin tuna 145 374 4.04 %Carp 136 467 3.79 %Turbot 70 949 1.97 %
volume % volume
Mussel 492 413 39.18 %Trout 185 539 14.76 %Salmon 170 591 13.57 %Oyster 98 751 7.86 %Carp 73 860 5.88 %Gilt-head seabream 72 900 5.80 %Seabass 67 809 5.40 %Clam 37 028 2.95 %Other freshwater fish 13 989 1.11 %Turbot 10 799 0.86 %
Source: European Commission, Facts and figures on the CFP (2014)
Overview of the European fish processing industry (2008-2011)
Variable 2008 2009 2010 2011 2011 Δ Develop.(with Greece) to 2010 trend
Structure (number)Total enterprises 3,402 3,415 3,376 3,344 3,496 q -1% q -2%
<=10 employees 1,758 1,779 1,798 1,850 1,958 p 3% p 5%11-49 employees 1,088 1,139 1,091 1,016 1,052 q -7% q -7%50-249 employees 476 416 408 400 408 q -2% q-16%>=250 employees 81 81 79 78 78 q -1% q -4%
Employment (number)Total employees 100,756 97,823 97,353 97,720 100,225 0% q -3%
Male employees 33,315 31,810 32,154 32,931 34,157 p 2% q -1%Female employees 44,750 43,227 43,387 43,141 44,420 q -1% q -4%
FTE 113,365 109,478 108,937 109,412 111,677 0% q -3%Male FTE 37,270 35,886 36,653 36,653 37,821 0% q -2%Female FTE 43,029 41,738 41,767 42,363 43,460 p 1% q -2%
IndicatorsFTE per enterprise 33.3 32.1 32.3 32.7 31.9 p 1% q -2%Average wage* 27.9 28.9 29.0 29.0 28.7 0% p 4%Labour productivity* 54.6 55.7 62.3 55.7 56.5 q -11% p 2%Unpaid work (%) 7 7.4 7.4 6.6 6.6 q -11% q -8%
* Thousand € Note: “total employees” do not include UK employees; “male employees” and “female employees”do not include UK, Spanish and Dutch employees.
Source: STECF, The Economic Performance Report on the EU Fish Processing Sector, 2013
FIGURE 6
FIGURE 5
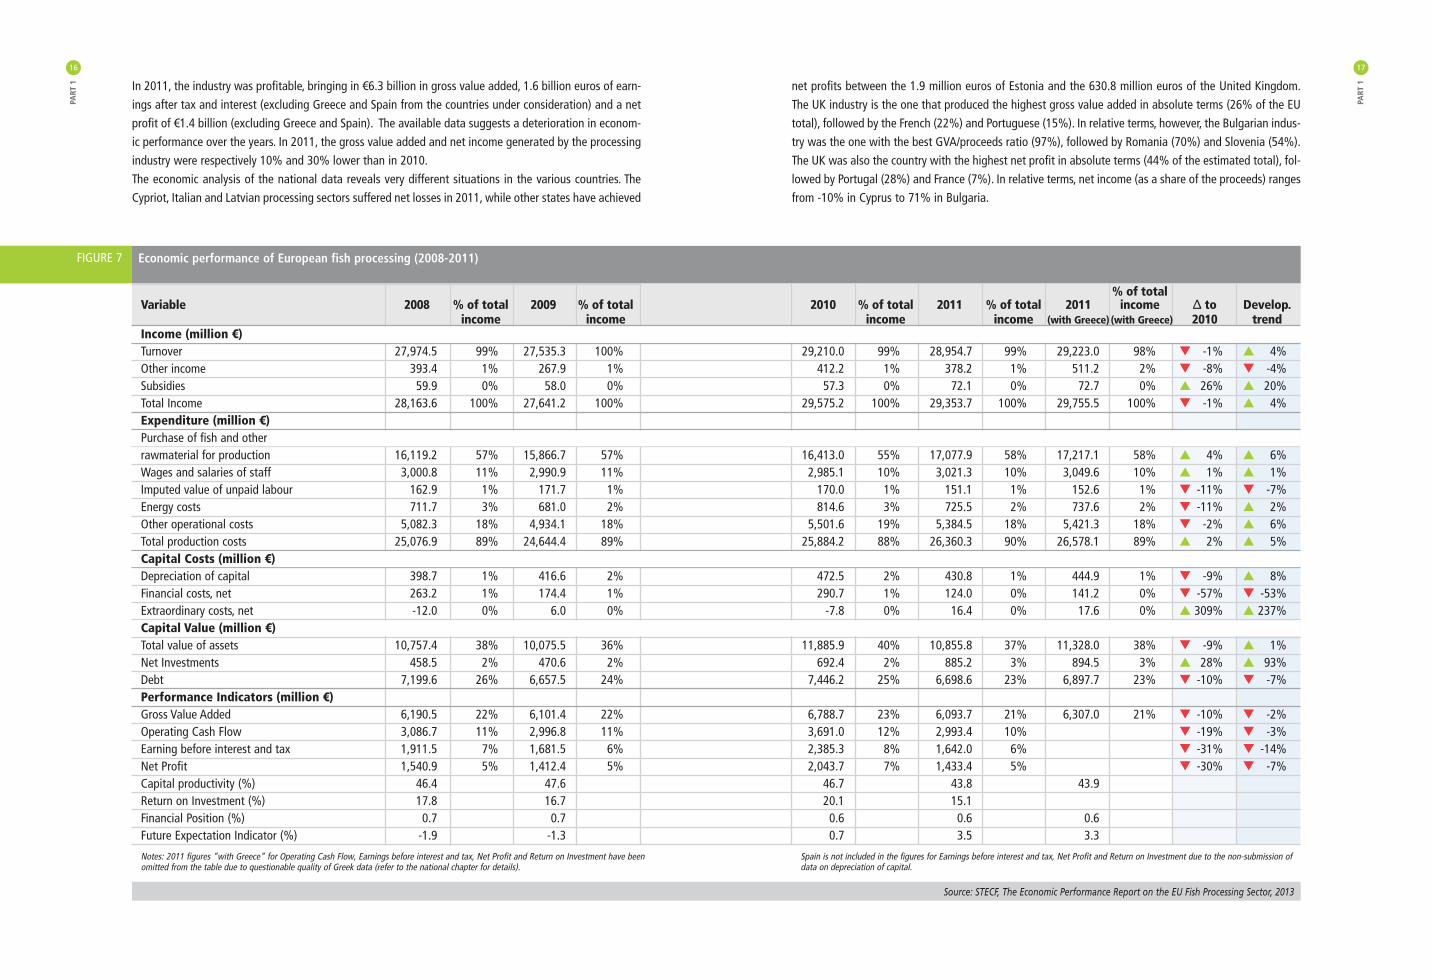
net profits between the 1.9 million euros of Estonia and the 630.8 million euros of the United Kingdom.The UK industry is the one that produced the highest gross value added in absolute terms (26% of the EUtotal), followed by the French (22%) and Portuguese (15%). In relative terms, however, the Bulgarian indus-try was the one with the best GVA/proceeds ratio (97%), followed by Romania (70%) and Slovenia (54%).The UK was also the country with the highest net profit in absolute terms (44% of the estimated total), fol-lowed by Portugal (28%) and France (7%). In relative terms, net income (as a share of the proceeds) rangesfrom -10% in Cyprus to 71% in Bulgaria.
PART
1
17
In 2011, the industry was profitable, bringing in €6.3 billion in gross value added, 1.6 billion euros of earn-ings after tax and interest (excluding Greece and Spain from the countries under consideration) and a netprofit of €1.4 billion (excluding Greece and Spain). The available data suggests a deterioration in econom-ic performance over the years. In 2011, the gross value added and net income generated by the processingindustry were respectively 10% and 30% lower than in 2010.The economic analysis of the national data reveals very different situations in the various countries. TheCypriot, Italian and Latvian processing sectors suffered net losses in 2011, while other states have achieved
PART
116
Economic performance of European fish processing (2008-2011)
% of total Variable 2008 % of total 2009 % of total 2010 % of total 2011 % of total 2011 income Δ to Develop.
income income income income (with Greece) (with Greece) 2010 trendIncome (million €)Turnover 27,974.5 99% 27,535.3 100% 29,210.0 99% 28,954.7 99% 29,223.0 98% q -1% p 4%Other income 393.4 1% 267.9 1% 412.2 1% 378.2 1% 511.2 2% q -8% q -4%Subsidies 59.9 0% 58.0 0% 57.3 0% 72.1 0% 72.7 0% p 26% p 20%Total Income 28,163.6 100% 27,641.2 100% 29,575.2 100% 29,353.7 100% 29,755.5 100% q -1% p 4%Expenditure (million €)Purchase of fish and other rawmaterial for production 16,119.2 57% 15,866.7 57% 16,413.0 55% 17,077.9 58% 17,217.1 58% p 4% p 6%Wages and salaries of staff 3,000.8 11% 2,990.9 11% 2,985.1 10% 3,021.3 10% 3,049.6 10% p 1% p 1%Imputed value of unpaid labour 162.9 1% 171.7 1% 170.0 1% 151.1 1% 152.6 1% q -11% q -7%Energy costs 711.7 3% 681.0 2% 814.6 3% 725.5 2% 737.6 2% q -11% p 2%Other operational costs 5,082.3 18% 4,934.1 18% 5,501.6 19% 5,384.5 18% 5,421.3 18% q -2% p 6%Total production costs 25,076.9 89% 24,644.4 89% 25,884.2 88% 26,360.3 90% 26,578.1 89% p 2% p 5%Capital Costs (million €)Depreciation of capital 398.7 1% 416.6 2% 472.5 2% 430.8 1% 444.9 1% q -9% p 8%Financial costs, net 263.2 1% 174.4 1% 290.7 1% 124.0 0% 141.2 0% q -57% q -53%Extraordinary costs, net -12.0 0% 6.0 0% -7.8 0% 16.4 0% 17.6 0% p 309% p 237%Capital Value (million €)Total value of assets 10,757.4 38% 10,075.5 36% 11,885.9 40% 10,855.8 37% 11,328.0 38% q -9% p 1%Net Investments 458.5 2% 470.6 2% 692.4 2% 885.2 3% 894.5 3% p 28% p 93%Debt 7,199.6 26% 6,657.5 24% 7,446.2 25% 6,698.6 23% 6,897.7 23% q -10% q -7%Performance Indicators (million €)Gross Value Added 6,190.5 22% 6,101.4 22% 6,788.7 23% 6,093.7 21% 6,307.0 21% q -10% q -2%Operating Cash Flow 3,086.7 11% 2,996.8 11% 3,691.0 12% 2,993.4 10% q -19% q -3%Earning before interest and tax 1,911.5 7% 1,681.5 6% 2,385.3 8% 1,642.0 6% q -31% q -14%Net Profit 1,540.9 5% 1,412.4 5% 2,043.7 7% 1,433.4 5% q -30% q -7%Capital productivity (%) 46.4 47.6 46.7 43.8 43.9Return on Investment (%) 17.8 16.7 20.1 15.1Financial Position (%) 0.7 0.7 0.6 0.6 0.6Future Expectation Indicator (%) -1.9 -1.3 0.7 3.5 3.3
Notes: 2011 figures “with Greece” for Operating Cash Flow, Earnings before interest and tax, Net Profit and Return on Investment have been omitted from the table due to questionable quality of Greek data (refer to the national chapter for details).
Source: STECF, The Economic Performance Report on the EU Fish Processing Sector, 2013
FIGURE 7
Spain is not included in the figures for Earnings before interest and tax, Net Profit and Return on Investment due to the non-submission ofdata on depreciation of capital.

The aquaculture sector too has a significant socio-economic impact, with a turnover of approximately €3.5billion and 85,000 employees (part-time and full-time), of whom 27% are women.The high prevalence of part-time workers in this sector should be highlighted because from the compari-son of total employment and FTE, it appears that the employees made equivalent with full-time, come to45% of the total. In the processing industry, in 2011, total employment was 100,225, with an average salary of €28,674.Leaving aside the case of Greece, between 2008 and 2011, there was a fall in employment of 3%, in par-allel with an increase of the average wage by 4%.
PART
1
19
E M P L OY M E N T
The fisheries sector plays a fundamental role in many European regions in terms of its contribution toemployment and local economic activities; in some coastal communities, more than half of jobs are relat-ed to the fisheries sector. Employment in this sector tends to be concentrated in a few countries. Spain alone is home to a quarter ofthose employed in fishing in Europe and the four countries with the highest levels of employment (Spain,Italy, Portugal and Greece) have 70% of the total. In 2011, the number of fishermen employed in the European fleet was 127,686, a decrease compared to2010 of almost 6%3. Spain confirmed its leading position in terms of employment levels (more than 32,000FTE4), followed by Italy (20,600 FTE) and Portugal (17,100 FTE). 41% of the total workforce is employed inthe small vessels fleet, 51% in the industrial fleet and 7% in the ocean fleet.In 2011, wage levels rose to an average total of €21,600: €10,700 in the small vessels, €29,000 in theindustrial and €27,000 in the ocean fleet.
PART
118
3 This does not include Cyprus, Estonia and Greece.4 Full Time Equivalents: unit of measure which, consisting of one day of full-time work, equalises total hours and allows a comparison between
employees’ activities over differing period of employment.
Dependence on Employment in the European regions of the fisheries sector (2011)
Source: European Commission, Facts and figures on the CFP (2014)
FIGURE 8
FIGURE 9Employment in the fisheries and aquaculture sector (2011) (measured in full-time equivalents)
Fisheries1
ES 32 194IT 20 599PT 16 773EL 12 169 2
UK 11 277FR 7 447IE 3 428NL 1 768BG 1 668DK 1 661PL 1 576DE 1 258SE 974CY 911 3
LT 575EE 521 3
LV 378BE 341FI 316MT 155SI 77RO 28
Source: European Commission, Facts and figures on the CFP (2014)
Aquaculture4
FR 10 658ES 6 639EL 5 559 5
UK 2 671IT 2 116PT 1 749RO 1 047IE 958FI 349DK 299CY 276BG 270SE 263MT 165
4 Data not available for AT, BE, CZ, EE, HR, HU, LT, LU, LV, NL and SK. For the following Member States data only cover marine aquaculture: DE 18, PL 49 and SI 32.
5 Total employment (full-time and part-time).
1 Data not available for AT, CZ, HR, HU, LU and SK.2 2010 data taken from the Hellenic Statistical Authority.3 2010 data.
PART
1
21
T H E M A R K E T 5
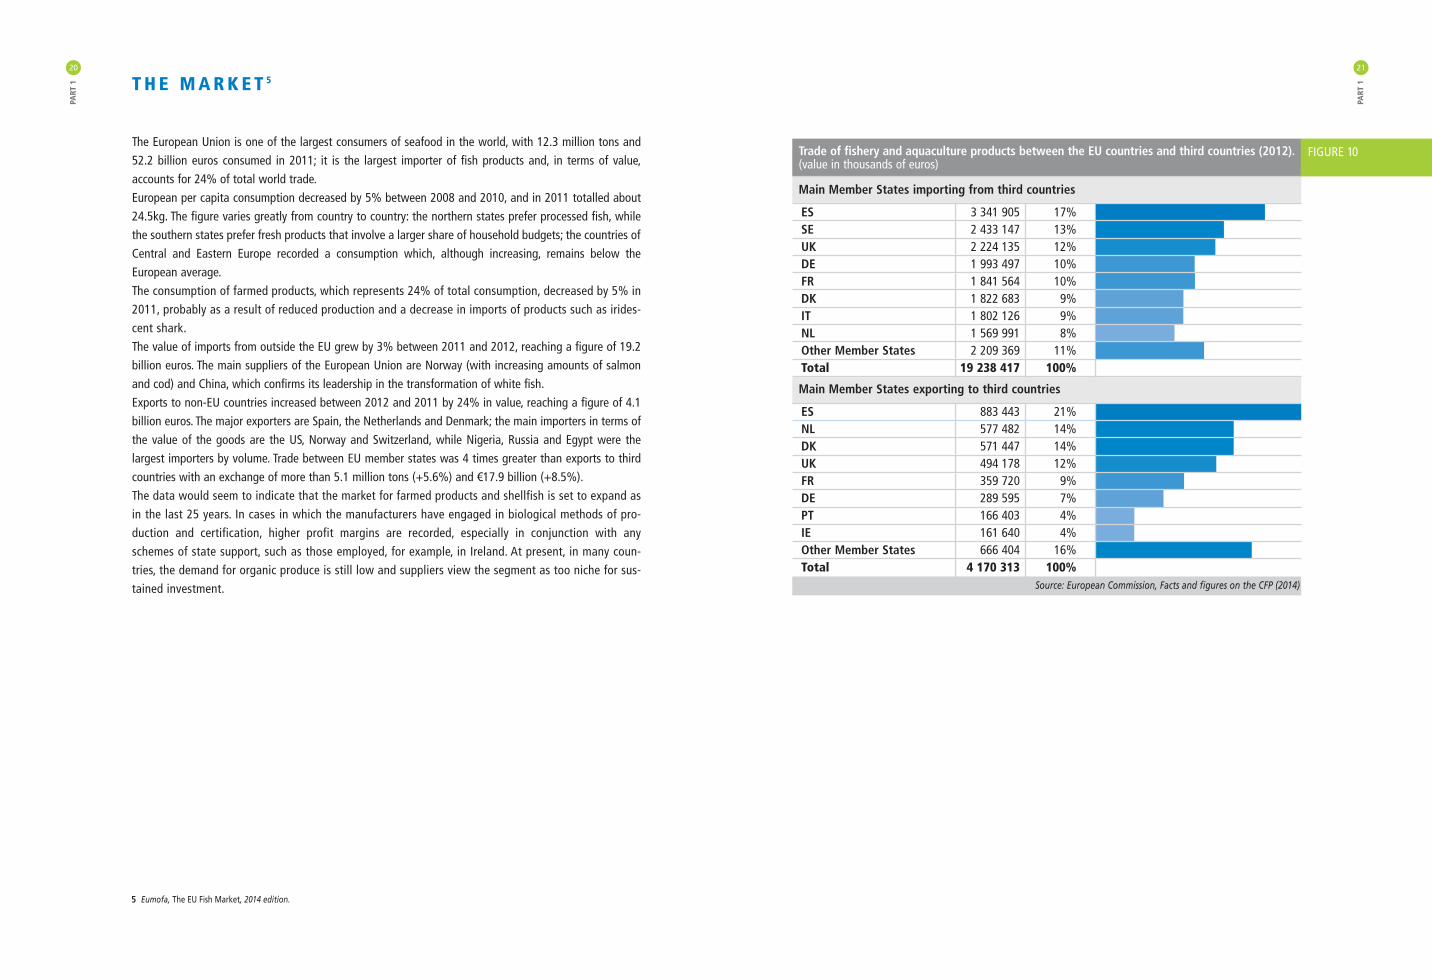
The European Union is one of the largest consumers of seafood in the world, with 12.3 million tons and52.2 billion euros consumed in 2011; it is the largest importer of fish products and, in terms of value,accounts for 24% of total world trade. European per capita consumption decreased by 5% between 2008 and 2010, and in 2011 totalled about24.5kg. The figure varies greatly from country to country: the northern states prefer processed fish, whilethe southern states prefer fresh products that involve a larger share of household budgets; the countries ofCentral and Eastern Europe recorded a consumption which, although increasing, remains below theEuropean average.The consumption of farmed products, which represents 24% of total consumption, decreased by 5% in2011, probably as a result of reduced production and a decrease in imports of products such as irides-cent shark.The value of imports from outside the EU grew by 3% between 2011 and 2012, reaching a figure of 19.2billion euros. The main suppliers of the European Union are Norway (with increasing amounts of salmonand cod) and China, which confirms its leadership in the transformation of white fish.Exports to non-EU countries increased between 2012 and 2011 by 24% in value, reaching a figure of 4.1billion euros. The major exporters are Spain, the Netherlands and Denmark; the main importers in terms ofthe value of the goods are the US, Norway and Switzerland, while Nigeria, Russia and Egypt were thelargest importers by volume. Trade between EU member states was 4 times greater than exports to thirdcountries with an exchange of more than 5.1 million tons (+5.6%) and €17.9 billion (+8.5%). The data would seem to indicate that the market for farmed products and shellfish is set to expand asin the last 25 years. In cases in which the manufacturers have engaged in biological methods of pro-duction and certification, higher profit margins are recorded, especially in conjunction with anyschemes of state support, such as those employed, for example, in Ireland. At present, in many coun-tries, the demand for organic produce is still low and suppliers view the segment as too niche for sus-tained investment.
PART
120
5 Eumofa, The EU Fish Market, 2014 edition.
Trade of fishery and aquaculture products between the EU countries and third countries (2012).(value in thousands of euros)
Main Member States importing from third countries
ES 3 341 905 17%SE 2 433 147 13%UK 2 224 135 12%DE 1 993 497 10%FR 1 841 564 10%DK 1 822 683 9%IT 1 802 126 9%NL 1 569 991 8%Other Member States 2 209 369 11%Total 19 238 417 100%
Main Member States exporting to third countries
ES 883 443 21%NL 577 482 14%DK 571 447 14%UK 494 178 12%FR 359 720 9%DE 289 595 7%PT 166 403 4%IE 161 640 4%Other Member States 666 404 16%Total 4 170 313 100%
Source: European Commission, Facts and figures on the CFP (2014)
FIGURE 10

alent to law: binding for all the employers and workers concerned and retroactive with regard to theeffects that ensure its persistence, even if the parties withdraw from the agreement (“generalised” and“binding” application of the agreement);
2. it formalises the advisory role of the trade unions and management representatives from the stage ofdrawing up Community rules by the Commission (Article 154 TFEU). Before submitting proposals in thearea of social policies, the Commission has to consult management and labour on their possible orien-tation; where action is taken by the EU, the trade unions and management representatives should exam-ine the content and submit to the Commission an opinion or a recommendation if both sides have man-aged to reach a common position;
3. it provides for the normative power of the collective agreement (in conjunction with Articles 154 and 155TFEU), which consists of the possibility for the trade unions and management representatives, in the set-ting of the second consultation on the merits of the proposal of the Commission, to claim for themselvesthe drafting of the regulations on the matter. The agreement will have to be transmuted into a norma-tive provision endorsed by the Commission (the Commission will carry out a control that takes intoaccount the representativeness of the contracting parties, their mandate and the legality of each clauseof the collective agreement in terms of European Union law, as well as the relevance of European actionon the subject and the consistency of the measures to be taken with regard to small and medium-sizedenterprises), and submitted to the European Council (becoming a directive). It is widely held that theterms of the agreement cannot be changed by the Council, but only accepted or rejected “in toto”.
The possibility of concluding collective agreements at European level raises several issues relating to theeffects, both in terms of the member states (insofar as they are required to implement them) and individ-ual employees.In any case, it is to be excluded that a European collective agreement might operate with universal regu-latory effects in different countries. The direct effect would depend, that is, on national legislations. In theItalian case, in particular, it would find a limit to its generalised efficacy simply with the collective agree-ment thanks to case law as a result of the non-application of Article 39 of the Constitution. The most critical elements of the system concern the effective representativeness and negotiating capaci-ty, in particular, the absence of an effective mandate from their members and, therefore, of the power tobind themselves contractually with the counterparties. The problem of representativeness occurs in particular whenever the parties themselves are signatories toan agreement in the sense of Article 155 TFEU. In this case, the Commission must determine whether, inlight of the content of the agreement, the trade unions and management representatives have a sufficient-ly representative status overall and, where this is lacking, will refuse to implement it.The representativeness criteria are to some extent similar to those valid for the national trade unions andmanagement representatives: the trade unions and management representatives need to be organised atEuropean level, they need to consist of organisations recognised as an integral part of the structures of thetrade unions and management of the member states, they need to have the ability to negotiate agree-ments, and they need to have adequate facilities to enable them to participate effectively in the consulta-tion process.Based on these criteria, the Commission has drawn up a list, updated regularly, of the representative organ-isations including the European Trade Union Confederation (ETUC), UNICE-BUSINESS EUROPE and CEEP. As for the fishing sector, the organisations admitted to consultation by the European Commission are theETF, Europeche and COGECA.
PART
1
23
Bargaining and sectoral policies: the role of the trade unions and management representatives at European level
C O L L E C T I V E R E L AT I O N S AT E U R O P E A N L E V E L
Collective labour relations matters are particularly resistant to the influence of European Community law,even in its mildest forms.One fundamental reason lies in the marked heterogeneity of the various European collective legal systemsregarding labour, both as regards the forms of the legal regulation of such relationships, and as regards thefactual elements of the employment relationship. It needs to be added, on the one hand, the central posi-tion they occupy in the social structure and the widespread belief that state power should refrain as muchas possible from intervening, limiting itself to establishing a framework in support of collective bargaining.It is therefore understandable that there should be a widespread distrust of any directives that seek tointervene directly on the institutions of collective relations. It is doubted that collective bargaining as such falls within the competence of the European Union, buttending in the opposite direction we have:• Article 153.3 TFEU, which refers to the “representation and collective defence of the interests of workers
and employers”• Article 28 of the Nice Charter that enshrines the right to collective bargaining.
T H E R O L E O F T H E T R A D E U N I O N S A N D M A N A G E M E N T R E P R E S E N TAT I V E S
The agreement on social policy has led to the development of the consultative function carried out by thetrade unions and management representatives and the express recognition of transnational collective bar-gaining as a source of social regulation.In particular: 1. it provides for a state to entrust to the trade unions and management representatives, at their joint
request, the task of implementing the directives in specific areas of competence, but, in this case, thestate must take the necessary measures that will enable it to guarantee at all times the results requiredby said directives (Article 153, para. 4 TFEU). A widespread practice in Belgium, but which has to meetthe requirements identified by the Court of Justice to ensure that the contract can be considered equiv-
PART
122
tive usefulness of European negotiation all prevented the development of a real practice of collectivebargaining at European level, which is mostly concentrated in a few large multinational groups. Theseagreements usually contained procedural rather than regulatory content, in that they provide proceduresfor information and consultation between the company and workers’ representatives on matters for themost part different to those relating to national bargaining such as restructuring, corporate socialresponsibility and health and safety. The Commission has proposed calling these agreements “transna-tional texts” rather than true collective agreements. They have a binding value for the business (which isthe most identifiable partner in the relationship), while not exerting any direct effect on workers as partsof the individual relationship. The recognition of EWCs has provided a useful institutional basis for thedevelopment of collective relations in a company, even if the existing powers of EWCs are limited andnot directly related to the purpose of collective bargaining. These texts, despite the weakness of collec-tive social rights, are evidence of the spirit of initiative of the parties who voluntarily and in a totallyinformal way launch forms of social dialogue outside the institutional context.
European policies in the field of fisheries and aquaculture6
T H E C O M M O N F I S H E R I E S P O L I C Y
Fisheries is characterised by what is defined as the “tragedy of common assets”, a phenomenon in whichmultiple individuals acting in their own interest and competing with others to get “their” part, tend to over-exploit a common resource. That which a fisherman catches today cannot be caught by another tomorrow.In deciding their fishing strategies, fishermen do not take into account the impact that this will have onother operators (fewer resources, damage to habitats, etc). Without proper regulation of access rights,stocks will be exploited to levels that will lead to their decline and prevent their commercial exploitation.For these reasons, regulatory intervention is required and the “no EU action” option has to be abandoned.Since 1970, there has been a shared organisation of the markets in fishery and aquaculture products,which constitutes one of the pillars of the Common Fisheries Policy. Its current legal basis is Regulation(EU) No. 1379/2013.The objectives of the CFP are set out in Article 3, letter d), Article 4 letter d), and Articles 38 and 39 of theTFEU. Article 11 of the TFEU is also applied to the Common Fisheries Policy, according to which the require-ments linked to the protection of the environment must be integrated into the definition and implementationof Union policies and activities, in particular from the point of view of promoting sustainable development.Article 39 of the TFEU defines for agricultural policy, and therefore also for the CFP, the following objectives:
PART
1
25
C O L L E C T I V E B A R G A I N I N G I N E U R O P E
Collective bargaining is the most widespread and significant form of collective activity in most EU coun-tries that deals with the regulation of working conditions. The common regulation and progressive convergence of national systems might find in European collectivebargaining a significant tool for implementation precisely because this instrument is recognised in practi-cally all the legal systems. This is even more valid if we consider that almost all the states adopt a proce-dure for allocating general effectiveness (erga omnes) to the collective agreement. However, the promotion of the bargaining method has received unequal attention and priority in EU action.Despite the legal recognition of bargaining in the Maastricht Protocol, the inclusion of the trade unions andmanagement representatives in decision-making as legislators by the Treaty of Lisbon and the recognitionas fundamental rights of collective bargaining and the use of collective action (strikes) by the Treaty of Nice,the affirmation of those rights was not followed in practice by secondary legislation (implementation).The European experience of collective bargaining may be historically outlined in three types of activity:bilateral (or trilateral) activities, social dialogue, true collective bargaining (although the formula of socialdialogue is often used in the inclusive sense).• Bilateral or trilateral activities: these are bilateral or trilateral activities, with an EU presence, between the
parties, supported by a shared interest, aimed at finding converging guidelines on defined themes. Theyare particularly widespread at the sectoral level. These activities are carried out mainly within the jointsectoral committees, later replaced by the Sectoral Social Dialogue Committees since 1998 (members areappointed by the Commission on the proposal of sectoral organisations and have advisory functions withrespect to the Council and the Commission), often accompanied by the joint committees (activated exclu-sively or primarily at the initiative of the professional organisations). Their work leads to shared opinions,guidelines, codes of conduct, proper agreements pursuant to Article 155 TFEU (which become bindingonly if implemented by a directive on the part of the Council).
• European social dialogue: (tripartite meetings launched in 1985 at Val Duchesse) forms of discussion andexchange of views between trade unions and management representatives, promoted by the EU, directedat the search for converging positions on matters of common interest. There is a large set of bilateral andtrilateral interactions between trade unions and management representatives and between them and theCommission. For many, social dialogue and collective bargaining are seen as a possible continuum, but itis important not to confuse the nature of the dialogue which tends towards the collaborative, and which,despite the importance of the dialogue, is not binding. The role of these agreements is largely to exercisea form of orientation and pressure on the European Community authorities. The meetings took place from1985 to 1990 (on the topics of education, the impact of new technologies, mobility of labour, and themeans to improve the functioning of the European labour market) and did not achieve convergences thatwere strong enough to translate into meaningful guidance, especially for the national players. In 1992, theCommittee for Interprofessional Social Dialogue was established, on the initiative of the trade unions andmanagement representatives, where relations are informal and voluntary, and it is in this area that thegreatest results were achieved in the form of framework agreements adopted by the Council .
• Collective bargaining: the lack of social players with decision-making powers at the European level; theabsence of conflict at the supranational level; business resistance to accepting an additional level of reg-ulation; the hesitation of the national unions in transferring decision-making powers to the Europeanlevel with direct results on the working conditions of their members; as well as doubts about the effec-
PART
124
6 Services of the European Commission, SEC (2011) 884 definitive, cited.

• A fourth problem is the fact that the CFP had an extremely complex legal framework, which promotesmicromanagement and prevents the achievement of environmental sustainability.
• The external dimension of the CFP too has had worse results than expected, especially in the area of envi-ronmental sustainability, but also in terms of international governance.
The reformed CFP should allow the environmental, economic and social sustainability of the activities ofexploitation of fish resources. In legal terms these goals have the same importance and none of them canbe achieved in isolation.Guaranteeing the environmental sustainability of fisheries means ensuring that fishing is carried out in sucha way as not to prejudice the future exploitation of stocks. Fishing pressure, therefore, must be such as toproduce the maximum sustainable yield (MSY), an objective that is to be achieved with the greatesturgency for the stocks being depleted and, where possible, by 2015. Achieving environmental sustainabili-ty will also comply with the obligation, laid down in the framework directive on the strategy for the marineenvironment, to achieve a good environmental status in the marine environment by 2020.In order to achieve environmental sustainability it is necessary to:• eliminate the overexploitation of resources in the short term;• reduce as much as possible overcapacity and discarding catch;• establish a decision-making system in line with long-term sustainability that is flexible and able to adapt
to local conditions;• encourage the industry to take greater responsibility for the results and to comply with the law; • improve the availability of scientific and economic data.Ensuring economic sustainability means having fleets that are profitable and cost-effective in the long run.The same applies to processing, aquaculture and related activities, called on to work within the constraintsimposed by environmental sustainability and in the context of a competitive global market and consump-tion patterns that are constantly evolving.Ensuring social sustainability means transforming fisheries and related activities into a source of interest-ing jobs that ensure a fair standard of living for those who depend on them and allow the preservation offishing communities. As well as fishing activities themselves, social sustainability in these regions shouldbe based on economic diversification in related maritime sectors.
T H E R E F O R M E D C F P
The European Council and the Parliament adopted a new Common Fisheries Policy (CFP), which has been inforce since 1 January 2014. The new CFP aims to restore stocks to sustainable levels, put an end to fishingpractices that lead to a waste of resources, and create new opportunities for jobs and growth in coastal areas.To achieve this objective, the new policy provides for the prohibition of discarding fish, the strengthening ofrights in the fisheries sector, the decentralisation of decision-making, the strengthening of the aquaculture sec-tor, support for small-scale fisheries, the improvement of scientific knowledge about the state of stocks andthe assumption of responsibility in the waters of third countries through international agreements of the EU.
PART
1
27
• to increase agricultural productivity by promoting technical progress and ensuring the rational develop-ment of agricultural production and the optimum utilisation of production factors, in particular of labour;
• to ensure a fair standard of living for the agricultural community, in particular by increasing the individ-ual earnings of persons engaged in agriculture;
• to stabilise markets;• to ensure security of supply;• to ensure that supplies reach consumers at reasonable prices.
T H E I M PA C T O F T H E C F P 7
The reform of the Common Fisheries Policy represented an excellent opportunity to analyse and possiblyrevise the objectives and market policy instruments for fishery and aquaculture products.Starting in 2008, the Commission has carried out in-depth evaluations and consultations, with the dual aimof examining the effectiveness of the current legal framework and the trends that have appeared in the lastdecade in the markets of the EU, and then obtaining the views of interested parties.The previous common fisheries policy did not allow the guaranteeing of the sustainable exploitation of liv-ing aquatic resources despite the introduction of new instruments such as long-term management plansaimed at exploiting fish stocks at sustainable levels and rebuilding overexploited stocks, and the regionaladvisory councils intended to strengthen the dialogue between the interested parties and the Commission. The problems at the root of this failure are interdependent. Excess capacity is the main factor responsiblefor the overexploitation of resources. All the same, the reduction of quotas, designed to reduce overfish-ing, has only succeeded in further increasing excess capacity. Similarly, this is at the origin of the poor eco-nomic performance of the catch sector, which, in turn, pushes operators to practise overfishing in the shortterm to make up for the loss of income. In this situation the sector is forced to solicit continuous publicsupport, so the excess capacity remains and the TACs (total allowable catches) are set at levels higherthan those recommended in the scientific advice. Given these correlations, the problems can be sum-marised as follows.• The main problem of the CFP is the lack of environmental sustainability due to overfishing, which all the
other problems stem from. Fleet overcapacity, TACs that do not comply with scientific advice and the lackof prioritisation of the objectives are the main factors responsible for the overfishing problem. To theseare added the principle of relative stability, the high level of discarded fish, poor compliance with the rulesand lack of sufficient scientific advice.
• The second problem is the lack of economic sustainability that characterises the catch sector in particu-lar. Many fleets are unprofitable and vulnerable to external pressures (e.g. high fuel prices).
• The third problem is the lack of social sustainability, primarily involving the catch sector and regionsdependent on fishing. Low wages and serious safety risks mean that this sector is not an occupation thatis in a position to attract new generations of fishermen. Employment, especially in the catch sector, hastherefore seen over the last 15 years a steady decline in many sectors that are dependent on fisheries.
PART
126
7 Services of the European Commission, Summary of the Impact Assessment accompanying the document “Proposal for a Regulation of theEuropean Parliament and of the Council on the Common Fisheries Policy”, SEC (2011) 892 definitive, Brussels, 2011.

• Decentralisation of governanceThe new CFP moves the decisions closer to the subjects for which they are intended and clarifies the rolesand obligations of each party. It will put an end to micromanagement from Brussels: European legislatorswill limit themselves to outlining the general framework, principles and basic standards, the overall objec-tives, performance indicators and timetables. Member states will cooperate on a regional level and devel-op the actual implementation measures. Once agreement has been reached by all of the member states,these recommendations will become the rules for all the fishermen involved.
• Support for small-scale fisheriesIn the European Union the small-scale fleet makes up 77% of the entire fleet by number of vessels, butonly 8% in terms of tonnage (vessel size) and 32% in terms of engine power. Its impact on resources istherefore less relevant. Small-scale coastal fishing often plays an important role in the social fabric andcultural identity of Europe’s coastal regions and therefore requires specific support. The reformed CFPextends until 2022 the right of member states to restrict fishing activities within a zone of 12 nauticalmiles from the coastline.
• Developing sustainable aquacultureCreating a better environment for aquaculture will increase the production and range of marine productsin the EU, reducing the dependence on imports of fish and encouraging growth in coastal and rural areas.By 2014, member states will have prepared national strategic plans to improve the conditions for aquacul-ture, remove administrative barriers and promote compliance with the environmental, social and econom-ic norms for the fish-farming industry. It will set up a new advisory council for aquaculture to advise onissues related to the sector. The growth of aquaculture has a clear European Union dimension: the strate-gic choices made at national level might affect the development of the sector in neighbouring countries.
• Advancing scientific knowledgeHaving reliable information and knowledge on the state of fishing and marine resources is essential tomake justifiable management decisions and to carry out an effective implementation of the reformed CFP.Member states will have to deal with the collection, processing and sharing of data on fish stocks and theimpact of fishing fleets at the level of sea basins. The policies will be adopted taking into account the bestavailable scientific advice. To coordinate this activity, national research programmes will be set up.
• New market policy - Making the industry responsible and providing better information for consumers
The new market policy is aimed at strengthening the competitiveness of the fisheries and aquaculturesectors in the EU to improve market transparency and to ensure a level playing field for all products mar-keted in the EU.The current intervention system will be modernised and simplified: producer organisations will be able tobuy fish products when prices fall below a certain level and store them to then reintroduce them on to themarket at a later stage. This system will promote market stability.Producer organisations will contribute most to the collective activities of management, monitoring andcontrol. New standards for labelling, traceability and quality will provide clearer information to consumersand help to promote sustainable fisheries. Some of the information on the label will be mandatory, somemay be provided on a voluntary basis.
PART
1
29
These are the main elements of the new policy9:
• SustainabilitySustainable fishing is fishing at a level that does not threaten the reproduction of stocks while allowingfishermen to obtain the largest catch. This level, known as “maximum sustainable yield” (MSY), is the limitwhich the catch must respect on stocks under the new CFP. This goal was set in the United NationsConvention on the Law of the Sea and was confirmed as part of the World Summit on SustainableDevelopment in 2002 as a global objective to be achieved as far as possible by 2015. In terms of the newCFP, exploitation rates will have to correspond as much as possible to MSY levels by 2015. This objectivehas be achieved for all stocks by 2020.It is estimated that if stocks were exploited on the basis of these modules their size would significantlyincrease, with obvious positive effects on catches and incomes.Sustainable fishing will help to stabilise prices in a transparent way, with clear benefits for consumers.
• Multi-year management based on the ecosystemsMulti-year management plans continue to be central to the management of our fisheries. Current plansrelating to individual stocks will be replaced by plans based on types of fishing: this will allow the inclu-sion of more fish stocks in fewer plans and to pursue the objective of sustainability more effectively. As partof these plans, the Council will establish the annual fishing opportunities. The plans might also includeother technical and conservation measures that are part of the proposed set of instruments. To rebuild a profitable fishing economy in Europe it is necessary to respect more effectively the boundariesof the marine environment. Fisheries activities in the European Union will be managed with an ecosystemapproach in accordance with the precautionary principle, in order to limit impact on the ecosystem and thusprotect marine resources.
• Prohibition of discardsIt is estimated that discards, the practice of throwing overboard fish that has been accidentally caught, con-stitutes about 23% of the total catch (and in some cases a lot more). This unacceptable practice will bephased out between 2015 and 2019, according to a precise timetable for implementation, and along withsome accompanying measures. Fishermen will be obliged to land all commercial species they catch. Theremaining catches of undersized fish cannot normally be sold for human consumption. The prohibition will allow for more reliable data on fish stocks, to provide a more effective support to man-agement and to improve the efficiency of resources. It is also an incentive for fishermen to avoid acciden-tal catches by making use of technical solutions such as the use of more selective fishing gear.Member states will have to ensure that their vessels are fitted with equipment which will document all fish-ing and processing activities, in order to monitor compliance with the obligation to land all catches.
• Management of the fishing capacity of the fleetMember states will have to ensure that the capacity of the fleet (number and size of vessels) is commen-surate with the fishing opportunities by adopting appropriate action plans for the segments where there isexcess capacity. The failure to obtain, by a member state, of the necessary reduction in capacity can resultin the suspension of EU financial support.
PART
128
9 European Commission, Questions and Answers on the reformed Common Fisheries Policy, MEMO/13/1125 10/12/2013.

PART
1
31
• International responsibilityAccording to FAO, numerous global fish stocks are fully exploited or overexploited. As the world’s largestimporter of fisheries products in value terms, the EU has to act on the international level according to thesame principles applied within the Union. Foreign fisheries policy must be an integral part of the CFP. Withinthe framework of international and regional organisations, the EU will therefore invoke the principles ofsustainability and conservation of fish stocks and marine biodiversity. It will establish alliances and initiateactions with strategic partners to combat illegal fishing and reduce overcapacity.As part of the bilateral fisheries agreement with third countries, the EU will promote sustainability, goodgovernance and the principles of democracy, human rights and the rule of law. Current arrangements willbe replaced by partnership agreements for sustainable fisheries, which will ensure that the exploitation offisheries resources occurs on the basis of sound scientific advice and involves only the surplus resourcesthat the partner country cannot or does not intend to fish. As part of the sustainable fishing agreements,the partner countries will receive compensation in exchange for access to their fishery resources, as well asfinancial support for the implementation of a sustainable fisheries policy.
T H E E U R O P E A N F U N D F O R M A R I T I M E A F FA I R S A N D F I S H E R I E S
Structural policies in the fisheries sector contribute to the achievement of the objectives of the CommonFisheries Policy (CFP), strengthening economic and social cohesion. The European Fisheries Fund (EFF), inplace since 1 January 2007, was the financial instrument of this policy. With a budget of about €4.3 billionfor the period 2007-2013, of which 75% was destined for countries with slower development, it has helpedto fund projects submitted by businesses, government agencies or representative bodiesIn 2014, the EFF was replaced by the EMFF (European Maritime and Fisheries Fund) with Regulation (EU)no. 508/2014, with a budget of about €5.8 billion for 2014-2020. Among the changes introduced, the EMFF will support the recovery of fish stocks and the phasing out ofdiscards. Priorities of the fund will also be to improve the collection of data on the sector to ensure thatdecisions are taken on the basis of statistical evidence, as well as to reduce the impact of fishing on themarine environment. The Fund will also focus on monitoring programmes to ensure compliance with the rules on responsibleand sustainable fishing, as well as the Integrated Maritime Policy by investing in the identification of thebarriers to the growth of coastal communities and emerging maritime sectors.
PART
130
Distribution of EFF funds to countries and axes (value in thousands of euros)
Axis 1 Axis 2 Axis 3 Axis 4 Axis 5 Total %per country per country
BE 14 259 800 8 502 1 900 800 26 262 0.61%BG 8 001 36 004 20 002 12 001 4 000 80 010 1.86%CZ 0 14 427 11 324 0 1 355 27 107 0.63%DK 32 980 23 289 57 991 15 960 3 456 133 675 3.11%DE 3 347 43 171 72 946 23 539 3 579 146 582 3.41%EE 15 265 24 584 21 210 19 282 4 228 84 568 1.97%IE 29 937 6 246 5 047 788 250 42 267 0.98%EL 77 272 59 690 32 320 33 300 5 250 207 832 4.83%ES 473 719 327 624 258 259 52 790 19 499 1 131 891 26.30%FR 70 728 43 109 94 574 5 454 1 784 215 650 5.01%HR 4 507 3 757 0 0 435 8 699 0.20%IT 163 905 110 778 97 181 31 275 21 204 424 343 9.86%CY 6 150 2 600 9 474 1 000 500 19 724 0.46%LV 26 197 52 320 30 300 11 238 4 961 125 016 2.91%LT 4 869 30 795 9 684 6 694 2 672 54 713 1.27%HU 0 30 209 2 519 0 2 041 34 770 0.81%MT 2 935 910 3 982 0 545 8 372 0.19%NL 16 913 7 379 16 903 4 987 2 395 48 578 1.13%AT 0 5 202 12 0 45 5 259 0.12%PL 124 184 173 757 164 537 234 910 36 705 734 093 17.06%PT 62 865 74 187 83 408 17 403 8 622 246 485 5.73%RO 6 222 123 719 29 991 53 978 16 736 230 646 5.36%SI 2 164 7 141 7 574 2 164 2 597 21 640 0.50%SK 0 11 432 896 0 684 13 012 0.30%FI 2 495 18 430 14 220 3 606 698 39 449 0.92%SE 13 111 10 933 20 133 7 755 2 733 54 665 1.27%UK 17 269 40 365 62 119 14 187 3 890 137 828 3.20%Total per axis 1 179 295 1 282 857 1 135 107 554 210 151 665 4 303 134Total in % 27.41% 29.81% 26.38% 12.88% 3.52% 100.00% 100.00%
Source: European Commission, Facts and figures on the CFP (2014)
Adaptation of the Community fishing fleet to the available resources (aid for permanent or temporary cessation, for small-scale coastal fishing, for investments on board fishing boats, etc.)
Aquaculture, inland fishing, processing and marketing of fishery and aquaculture products (measures for productiveinvestments in aquaculture, aqua-environmental measures, public health measures, etc.)
Measures of common interest (protection and development of aquatic fauna and flora,promotional campaigns, transformation of fishingvessels for a different use, etc.)
Sustainable development of fishing areas (local projects for sustainable development, diversificationof economic activities, etc.)
Technical assistance intended to facilitate the implementation of aid from the EFF (financing thework of public services that manage the funds, etc.)A
XIS
5 A
XIS
4 A
XIS
3 A
XIS
2 A
XIS
1
FIGURE 11

C O U N T R Y I N F O
2
PART
132

PART
234
PART
2
35
10 Shipowner Marc Vieren, intervening during the meeting in Ostend, told us that there were 73 boats in 2014, 30 of which form part of the indu-strial fleet.
Belgium
I N T R O D U C T I O N (by ACV Transcom Sector Water - Algemeen Sectorverantwoordelijke)
Belgian fisheries represent only some percentages in the EU TAC. In spite of this, Belgian fishers are the
only in EU that are for 100% covered by collective bargaining agreements. There are no exceptions for any
kind of fisheries. Belgian fishermen are paid also a share, but they have a guaranteed salary based on the
number of days at sea.
The labour relations are regulated by law dating from 2003. Before this they were regulated by a law of
1926 that had the objective to regulate labour relations at the Belgian merchant fleet. 10 years ago that
situation was out of time. The most important objective of this new law has always been to develop a fair
balance between fishermen on the one hand and workers ashore on the other hand.
Because Belgian fishermen are always considered as workers, contrary to most other EU countries where
the authorities allow employers to engage fishers as self-employed or something that looks alike. This ends
in deteriorating the work and living conditions for fishers all over Europe. Fishers are subject to enormous
fluctuations in their income due to fluctuations on the oil markets, which drives fishers out of their jobs
when they have the opportunity.
The Belgian model should be considered as a model for future labour relations in the fishing sector. It has
proved to be sustainable and can guarantee not only jobs but also better working and living conditions for
fishermen.
E C O N O M I C A N D S T R U C T U R A L C H A R A C T E R I S T I C S
• Fishing In 2012, the Belgian fleet consisted of 86 vessels registered10 with a total tonnage of 15 thousand tons, a
driving force of 49 thousand kW and an average age of 25 years. There were 80 registered companies, 99%
of them with a single boat.
The size of the fleet between 2011 and 2012 decreased by 3% in terms of number of vessels and tonnage
and 4% of driving force. Compared to 2008 the number of vessels was reduced by 13%. Similarly, days at
sea decreased, 17 thousand in 2012 (-14% compared to 2008) as did fuel consumption (-13% between
2010 and 2011).
In 2011, employment in the sector was 377, corresponding to full-time units of 342 FTEs, a decrease of 18%
compared to 2008 (-10% considering only the FTEs). The average wage, in the same period, underwent an
increase of 4% which projections indicated as likely to be stable in 2012 as well.
In 2012, the Belgian fleet landed 22 thousand tons of fish (+ 9% compared to 2011) to a value of €76 mil-
lion (-4% compared to 2011). Sole was the species caught with the highest value in 2012: 29.7 million
euros, equal to 47% of the total fish catch and a sale price of 10€/kg.
C O L L E C T I V E B A R G A I N I N G I N T H E F I S H I N G I N D U S T R Y PA
RT 2
37
Prices remained stable between 2010 and 2011 for the five major species caught, but fell between 2011
and 2012 for most of the market, with the exception of shrimp that saw a 67% increase.
In 2011, the income of the Belgian fleet was 82 million euros (+4% compared to 2010), split between 72
million euros of the value of fish and 3 million euros of income not directly resulting from fishing activities.
Operating expenses in 2011 totalled 73 million euros, equal to 92% of income. The costs of labour and fuel,
the two main cost items, amounted to €26 million and €25 million respectively.
The general trend for the Belgian fleet is a deterioration in economic performance, mainly due to competi-
tion with the more efficient Dutch fleet. Despite a continued commitment to energy savings, if fish prices
do not rise, it is difficult to imagine an improvement in the profitability of the sector.
• AquacultureBelgian aquaculture, which focuses exclusively on freshwater farms, produced 49 tons in 2011, with a value
of approximately 230 thousand euros. Rainbow trout was the species bred most and constituted 73% of
the weight and 68% of the value of the total production.
• ProcessingThe processing industry is divided in two main branches. On the one hand the fish auctions and the depend-
ing activities as there are soring, packing and delivery to the wholesalers off the fresh fish markets.
On the other hand the food processing industry. This industry is changing rapidly a basic industry into a pro-
duction line of the retail markets, either fresh, frozen and instant meals.
This sector employs the majority in the fishing sector and easily rises above 5000 FTE due to large impor-
tation of fish products.
E VA L U AT I O N O F T H E I M PA C T O F T H E C F P
Currently, the main problem for Belgian fishermen, according to Michel Claes (Secretary of ACV Transcom)11,
is the ban on the discarding of fish waste in the sea. European standards today require that waste is brought
back to land to be destroyed, but this leads to an increase of work onboard, a problem of space on the ship
and additional costs for the disposal. At this stage, it is not yet clear how these problems can be solved and
how exactly the waste should be managed.
European regulations on fishing, more generally, appear to be too restrictive and unnecessarily complicat-
ed, to the extent, in many cases, of forcing owners to make use of expensive consultants to guide them in
the interpretation of the rules before being able to make decisions regarding the company. The distance
between the measures adopted and the real needs of the sector is probably related to the fact that those
who are called on to draw up the rules at European level do not have a very thorough knowledge of the
peculiarities of the industry.
PART
236
11 Intervention during the training session held in Ostend 19-20 June 2014.
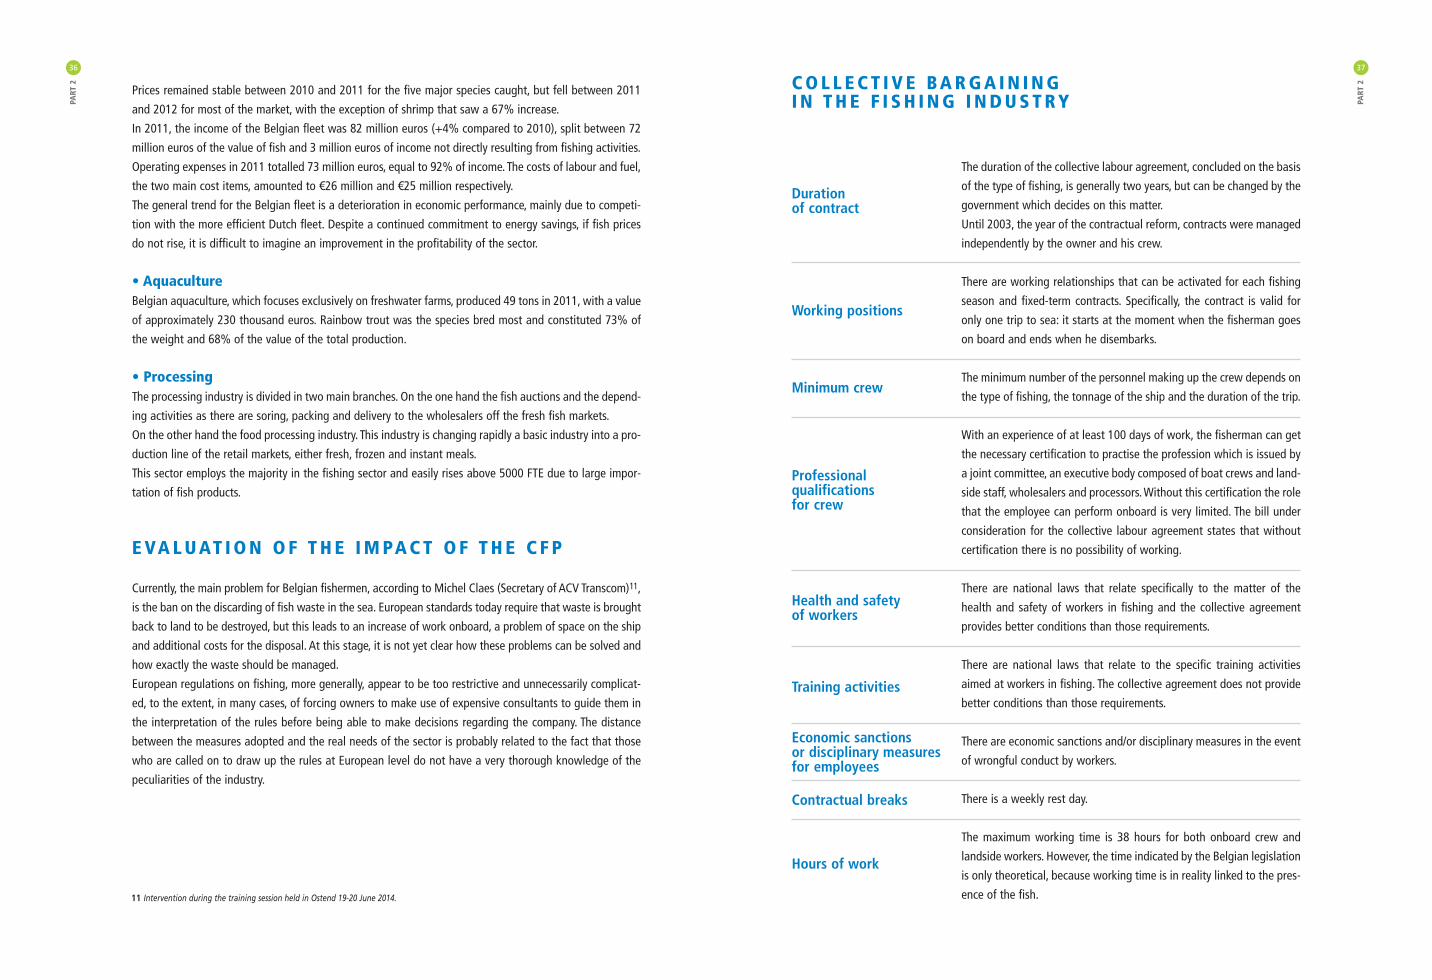
The duration of the collective labour agreement, concluded on the basis
of the type of fishing, is generally two years, but can be changed by the
government which decides on this matter.
Until 2003, the year of the contractual reform, contracts were managed
independently by the owner and his crew.
There are working relationships that can be activated for each fishing
season and fixed-term contracts. Specifically, the contract is valid for
only one trip to sea: it starts at the moment when the fisherman goes
on board and ends when he disembarks.
The minimum number of the personnel making up the crew depends on
the type of fishing, the tonnage of the ship and the duration of the trip.
With an experience of at least 100 days of work, the fisherman can get
the necessary certification to practise the profession which is issued by
a joint committee, an executive body composed of boat crews and land-
side staff, wholesalers and processors. Without this certification the role
that the employee can perform onboard is very limited. The bill under
consideration for the collective labour agreement states that without
certification there is no possibility of working.
There are national laws that relate specifically to the matter of the
health and safety of workers in fishing and the collective agreement
provides better conditions than those requirements.
There are national laws that relate to the specific training activities
aimed at workers in fishing. The collective agreement does not provide
better conditions than those requirements.
There are economic sanctions and/or disciplinary measures in the event
of wrongful conduct by workers.
There is a weekly rest day.
The maximum working time is 38 hours for both onboard crew and
landside workers. However, the time indicated by the Belgian legislation
is only theoretical, because working time is in reality linked to the pres-
ence of the fish.
Duration of contract
Working positions
Minimum crew
Professional qualifications for crew
Health and safety of workers
Training activities
Economic sanctions or disciplinary measures for employees
Contractual breaks
Hours of work

Denmark
I N T R O D U C T I O N (by 3F)
Both historically and at present Denmark has been one of the largest fishing nations in Europe. With a long
coast line and abundant natural fishing resources in the adjacent waters fishing has been a natural part of
daily life for many Danes. Fishing has been an important supply of food throughout centuries and turned
into a major industry in the last part of the twentieth century with both catching and processing activities.
Compared with many other European countries the Danish fisheries has not only been concentrating on
fishing for human consumption but also for industrial purposes by fishing after species such as sand eel
and sprat with the purpose of producing fishmeal and oil.
Danish fisheries have gone through a period of transition, when a shift in the composition of the fleet took
place. Although a sizeable portion of the fleet is still relatively old, new and large fishing vessels have been
introduced over the last 10 years. A contributing factor to this has been the introduction of ITQ`s, first in
the pelagic fisheries with the result of a concentration in ownership and access to resources.
As a consequence approximately 10 vessels fish around 90 per cent of the Danish quota for herring and
mackerel in 2014. This has led to a situation where a number of jobs in the fishing industry not only in the
seagoing sector but also in the processing industry have been vastly reduced especially to the detriment of
the fishing dependent areas.
Aquaculture was until recently dominated by traditionally small land based entities primarily producing
rainbow trout. Over the last 10 to 15 years Denmark has however seen a significant rise in the number of
sea based aquaculture plants originally also producing trout but experiments with other species such as
turbots and eel are now taking place.
Aquaculture is in other words increasing in importance both from a financial and employment perspective.
Once the fish stock has recovered, the future for Danish fisheries is bright with a high level of efficiency
and productivity provided a sustainable level of exploitation can be achieved and maintained.
E C O N O M I C A N D S T R U C T U R A L C H A R A C T E R I S T I C S
• Fishing The Danish fleet was composed, in 2011, of 2,787 registered vessels with a gross tonnage of 64,5 thou-
sand tons, a driving force of 239 thousand kW and an average age of 30 years. The downsizing of the fleet
(-1% for vessels and tonnage, -3% kW) follows the general trend of replacing older vessels with larger and
more efficient new vessels. The quota system also ensures that the more efficient businesses, perhaps
because they are equipped with new technology, acquire the quotas of the vessels which are less so.
In Denmark there is no division between artisanal and industrial fisheries but the fleet can be divided by
size as follows (for 2012):
• Under 12 meters: 2,290 vessels
• 12-16 meters: 216 vessels
• Above 16 meters: 248 vessels
PART
2
39PA
RT 2
38
Overtime work is governed by national law.
Emoluments for fishermen provide a minimum guaranteed amount of
money, which is also due in the event that nothing is caught: a sailor is
entitled to €35,000 a year, a fisherman aboard a ship of 40 meters (fish-
ing in the North Sea) is entitled to 75,000/100,000 euros, an engineer
is entitled to 80% of the latter amount.
Fishermen who cannot go to sea are entitled to compensation. During
the break between one trip and another, the worker is entitled to unem-
ployment benefit.
There is no productivity bonus.
There are no other levels of bargaining other than the national ones.
The cost of the food consumed by workers during fishing activity is the
responsibility of either the worker or the owner/entrepreneur.
The contract recognises paid holidays, assistance to family members,
parental leave and time off for studying.
For the fisheries sector, it is not expected to have private insurance for
accidents at work, but a National fund has been set up, co-funded by
the shipowners and the State. It is part of the national social security
system. PREVIS is installed to organise prevention in the fishing sector
and is jointly managed by the employers and the workers through
withholding a fraction of their wages. A second fund has been estab-
lished for the fish processing industry with a more limited economic
endowment.
There is insurance coverage for sickness, disability, unemployment and
accidents at work.
There is no severance pay.
The provision for the pension fund is funded by the Social Fund called
“Zeevissersfonds”.
There are places and/or instruments of reconciliation between workers
and employers.
Overtime
Remuneration
Productivity bonus
Levels of bargaining
Food
Absences provided for in the contract
Insurance coverage
Termination of employment
Supplementary pension
Reconciliation

C O L L E C T I V E B A R G A I N I N G I N T H E F I S H I N G I N D U S T R Y PA
RT 2
41
• Total number of vessels: 2,744 in 2012 (2,662 in 2013) (tonnage 65,9 and 65,4 thousand tons)
• Vessels below 15 meters with gear typically used close to the shore (artesanal): 1,719 vessels.
In 2011 the number of businesses was 1,533, 97% of which had a single vessel; the remaining 3% were
made up of 2-5 vessels the number of employees in the sector was 1,460. In 2012 the Danish union reports
a number of 3,469 fishermen.
In this period, the total value of the catch amounted to DKK 3,14 billions (about 410millions euros), of
which 2,48 billion for consumption.
The operating costs of 260 million euros, accounted for 65% of income. The costs of labour and fuel, the
two most important items of expenditure, amounted to 115 million and 53 million euros respectively.
The gross added value, gross and net profit in 2011 were respectively €249 million (-7%), €135 million (-9%),
€46 million (-22%), with investments amounting to €20 million.
• AquacultureDanish aquaculture produced, in 2011, 40,454 tons of fish, 4% less than in 2010. At the same time, the
value of the production saw an increase of 7%. Compared to 2008, production fell by 9% and value
increased by 13%.
The value of Danish aquaculture in 2012 amounted to 110 million Euros.
Rainbow trout is the species that accounted for 94% of volume and 91% of the value produced by aqua-
culture in Denmark. 90% of this production (88% of the aquaculture total) is exported to Germany.
Employment has remained effectively stable (+0.2%) since 2010 with 437 employees. In 2011, 86% of
businesses had fewer than 5 employees; the number of companies has fallen by 14% since 2008.
• ProcessingThe Danish processing industry can be divided into 6 sectors based on the type of production: cod and flat-
fish; herring and mackerel; molluscs, shrimps and shellfish; mixed production; salmonids; fishmeal. The most
important sector is that of the production of fishmeal and fish oil which accounts for 68% of volume and
31% of the total value. The salmon industry is the second-most important sector and is closely linked to
aquaculture in Norway. Much of the salmon processed is exported to countries outside the EU.
Recently, the sector has been reduced both in terms of companies (-9%) and employees (27%). Some activ-
ities have been transferred to countries with lower labour costs; the processing of salmon, for example, has
been moved in part to Poland.
The profitability of the sector is expected to decline, but it will likely continue to return net profits because
of the high prices of fish products and increasing labour productivity.
E VA L U AT I O N O F T H E I M PA C T O F T H E C F P
Among the various critical issues in the sector (the price of diesel, the market price of fish that is too low and
the absence of generational turnover), the Danish trade union mentions the issue of quotas: with current poli-
cies, the quotas end up in the hands of the richest organisations that often not have nothing to do with the
industry. The risk is that the quotas are resold abroad with serious negative effects on employment in Denmark.
PART
240
The contract usually lasts two years, but can be up to 3 or 4 years ifagreed with the unions. This duration is foreseen in the contract.
In principle, Danish fishermen are casual workers who are hired for indi-vidual trips. In reality, however, the employment relationship may con-tinue tacitly.
The minimum number of the personnel making up the crew depends onthe size of the boat. The law establishes a minimum number of compe-tent workers in the crew for vessels over 15 metres and a maximumnumber for vessels longer than 45 metres.
In Denmark the system of professional qualifications for crews is theSTCW-F12.
There are national laws that relate specifically to the matter of healthand safety of workers in the fishing industry. The collective agreementdoes not provide better conditions than these legislative requirements.
National law provides for specific training activities for workers in thesector. The agreement improves the conditions laid down by nationallegislation, introducing pay for days spent training.In particular, as regards apprenticeships, training is carried out with thecollaboration of the employer. The trainee receives about 12,000 kroneper month which increases slightly during the period of sailing (14,000krone).
The contract foresees economic sanctions and/or disciplinary measuresin the event of wrongful conduct by workers, such as withholding a partof pay. This measure, however, is never applied.
The daily maximum of 14 hours may be inferred from the EC Directiveon working time for mobile workers13.
In Denmark more than working hours they talk about “rest time” (atleast 10 hours per day). This interval is divided into two periods. Weeklyrest time is 77 hours.
Overtime work is not foreseen.
Duration of contract
Working positions
Minimum crew
Professional qualifications for crew
Health and safety of workers
Training activities
Economic sanctions or disciplinary measures for employees
Contractual breaks
Hours of work
Overtime
12 http://www.imo.org/OurWork/HumanElement/Pages/STCW-F-Convention.aspx13 Directive 93/104/CE of the Council, of 23 November 1993, concerning these aspects of the organisation of working hours, modified by Directive
2000/34/CE, of 22 June 2000, of the European Parliament and the Council.

France
I N T R O D U C T I O N (by Fédérale Maritime, Fédération Générale Transports et Environnement / CFDT)
The fishing sector is an important structural element of the coastal economy.
One “seamen” employment determines three to four, and more, employments “on the ground” (the
attractive effects for tourism, for example).
La CFDT Maritime approves the EU goal to relaunch aquaculture, but the remarks about the continuing dif-
ficulties related to the environmental constraints (Marine Protected Areas) and the pressure on the areas
from other activities don’t bode important developments.
The first national agreements of artisanal fishing (2001) and deep sea fishing (2003) represent historical
achievements. These agreements, that implement the principle of calculating the duration of the work in
annual number of days at sea, provide the guarantee of an annual remuneration and set the annual frame-
work for the legal minimum wage, have been « extended ». It means that they are compulsory for every-
body, employers who are not signatories included : all fishermen can benefit.
These agreements take into account the characteristics of the sector in advance of the ILO Convention 188,
which focuses on rest of the fishermen, and go beyond setting a guaranteed minimum salary.
CFDT Maritime objective is to move forward a single large Collective “Marine Fisheries” Convention,
having a common core of all that can be related: trade union rights, training measures, complementary
health, incapacity.
E C O N O M I C A N D S T R U C T U R A L C H A R A C T E R I S T I C S
• FishingIn 2011, the French fleet consisted of 6,004 vessels registered with a gross tonnage of 160,000 tons, a driving
force of 880,000 kilowatts and an average age of 21 years. Between 2008 and 2011, the resizing of the
fleet (less than 9% in number, less than 14% in tonnage and 8% power) was mainly due to the with-
drawal of vessels.
The estimated employment was of 10,720 workers, or 7,450 FTEs, recording, since 2008, a decrease of 8%
of employees and 11% FTE, derived mainly from the dismissal of boats. In 2011, days at sea amounted to
493,000, 45% due to the artisanal fishing fleet, in line with the data of 2010. In contrast, consumption
decreased by 11%, due to the reduction of the number of vessels and the increase of fuel costs. In 2012, the
number of french enterprises was 4.993, 88% of them had only one boat, and 12% had from 2 to 5 boats.
In 2011, the volume of fishing was 464 thousand tons with a revenues estimated at 1.05 billion euros, in
line with the data of the previous four years.
The highest revenue by species derived from the sole, with € 94 million revenue, while the most caught fish,
by weight, were tuna belly scratched and yellowfin tuna with a volume of 87 000 tonnes.
In 2011, prices have experienced some increase due to the strong growth in global consumption, against
a stable volume of fishing. In 2011, total revenues of fishing activities amounted to 1.165 billion euros, of
which 1,137 represented by the volume of fish and 28 million derived from other activities.
PART
2
43PA
RT 2
42
The amount of remuneration, by contract, is determined by the parties(fixed basic + percentage of the proceeds from the sale of the product)and is paid after each trip. Initially, the percentage was 50% to theemployer and 50% to the employee. Now that the ships are larger, thepercentage going to the workers has dropped. During the work on land, however, the fisherman receives a salary onan hourly basis. Inside the wage packet the employee is provided withextensive details that allow them to check the means of calculating thesalary as it is drawn up after going to the sea and contains informationabout the sale of fish, food, diesel fuel consumed, days at sea.
There is no productivity bonus.
In addition to national bargaining there is a second level of local bar-gaining. Local agreements must be approved by the unions andnational employers’ organisations.
The cost of the food consumed by workers during fishing activity is theresponsibility of the worker.
The contract regulates periods of illness that occur at sea. Treatmentcan last up to 7 weeks. There are no paid holidays.
Since 1982 the pension scheme has been established by the contract. Apercentage of the guaranteed salary is paid to the pension fund (paidby employer and employee).The law provides for various types of insurance coverage for both crewand landside workers: disability (payable by the employer), old age(payable by the State), unemployment (divided between the employeeand employer), illness and accidents at work. Unemployment benefit amounts to 2400 euros per month, but to beable to take advantage of it, it is necessary to be enrolled in the pen-sion plan of the union and having worked at least one year (1,904hours including holidays). Even though this is a state fund, the tradeunion manages unemployment funds.Fishermen and landside workers are covered by the insurance schemefor general unemployment. The cost of entering this insurance frame-work is about 50 euros per month. Depending on the overall state ofemployment, any deficit can be covered by the state. There are no bi- ortrilateral entities that participate in the cost of the insurance premium.
By contract, the employment relationship may be terminated unilateral-ly by each of the parties involved. There shall be no notice or redun-dancy pay.
The provision for the pension fund is 50% funded by the employee and50% by the employer. There is no provision for health purposes.
There are places and/or instruments of reconciliation between workersand employers.
Remuneration
Productivity bonus
Levels of bargaining
Food
Absences provided for in the contract
Insurance coverage
Termination of employment
Supplementary pension
Reconciliation
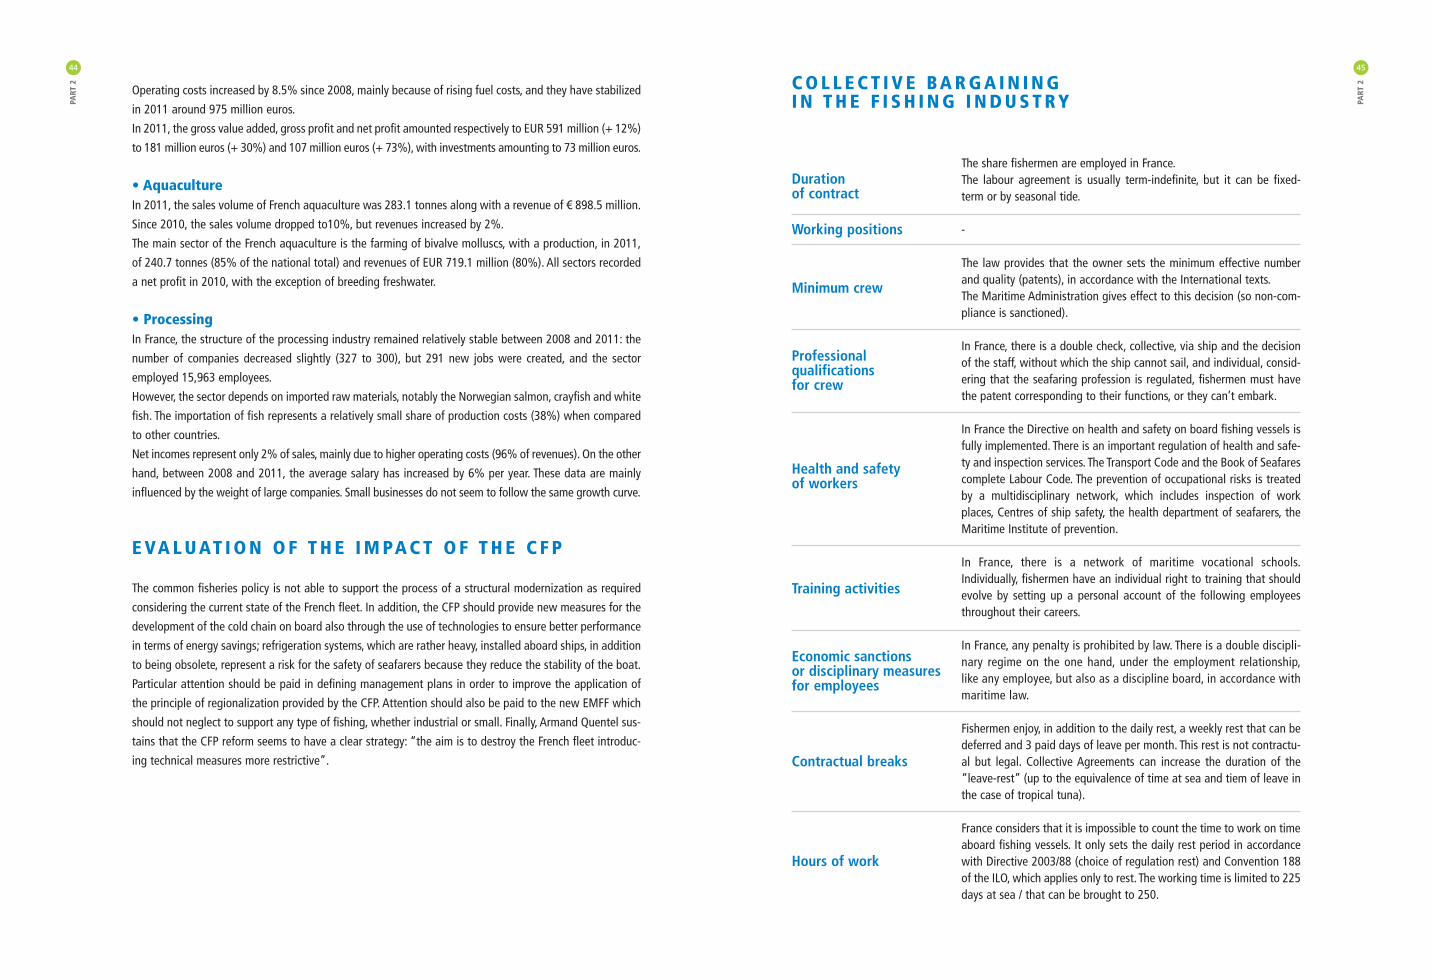
C O L L E C T I V E B A R G A I N I N G I N T H E F I S H I N G I N D U S T R Y PA
RT 2
45
Operating costs increased by 8.5% since 2008, mainly because of rising fuel costs, and they have stabilized
in 2011 around 975 million euros.
In 2011, the gross value added, gross profit and net profit amounted respectively to EUR 591 million (+ 12%)
to 181 million euros (+ 30%) and 107 million euros (+ 73%), with investments amounting to 73 million euros.
• AquacultureIn 2011, the sales volume of French aquaculture was 283.1 tonnes along with a revenue of € 898.5 million.
Since 2010, the sales volume dropped to10%, but revenues increased by 2%.
The main sector of the French aquaculture is the farming of bivalve molluscs, with a production, in 2011,
of 240.7 tonnes (85% of the national total) and revenues of EUR 719.1 million (80%). All sectors recorded
a net profit in 2010, with the exception of breeding freshwater.
• ProcessingIn France, the structure of the processing industry remained relatively stable between 2008 and 2011: the
number of companies decreased slightly (327 to 300), but 291 new jobs were created, and the sector
employed 15,963 employees.
However, the sector depends on imported raw materials, notably the Norwegian salmon, crayfish and white
fish. The importation of fish represents a relatively small share of production costs (38%) when compared
to other countries.
Net incomes represent only 2% of sales, mainly due to higher operating costs (96% of revenues). On the other
hand, between 2008 and 2011, the average salary has increased by 6% per year. These data are mainly
influenced by the weight of large companies. Small businesses do not seem to follow the same growth curve.
E VA L U AT I O N O F T H E I M PA C T O F T H E C F P
The common fisheries policy is not able to support the process of a structural modernization as required
considering the current state of the French fleet. In addition, the CFP should provide new measures for the
development of the cold chain on board also through the use of technologies to ensure better performance
in terms of energy savings; refrigeration systems, which are rather heavy, installed aboard ships, in addition
to being obsolete, represent a risk for the safety of seafarers because they reduce the stability of the boat.
Particular attention should be paid in defining management plans in order to improve the application of
the principle of regionalization provided by the CFP. Attention should also be paid to the new EMFF which
should not neglect to support any type of fishing, whether industrial or small. Finally, Armand Quentel sus-
tains that the CFP reform seems to have a clear strategy: “the aim is to destroy the French fleet introduc-
ing technical measures more restrictive”.
PART
244
The share fishermen are employed in France. The labour agreement is usually term-indefinite, but it can be fixed-term or by seasonal tide.
-
The law provides that the owner sets the minimum effective numberand quality (patents), in accordance with the International texts.The Maritime Administration gives effect to this decision (so non-com-pliance is sanctioned).
In France, there is a double check, collective, via ship and the decisionof the staff, without which the ship cannot sail, and individual, consid-ering that the seafaring profession is regulated, fishermen must havethe patent corresponding to their functions, or they can’t embark.
In France the Directive on health and safety on board fishing vessels isfully implemented. There is an important regulation of health and safe-ty and inspection services. The Transport Code and the Book of Seafarescomplete Labour Code. The prevention of occupational risks is treatedby a multidisciplinary network, which includes inspection of workplaces, Centres of ship safety, the health department of seafarers, theMaritime Institute of prevention.
In France, there is a network of maritime vocational schools.Individually, fishermen have an individual right to training that shouldevolve by setting up a personal account of the following employeesthroughout their careers.
In France, any penalty is prohibited by law. There is a double discipli-nary regime on the one hand, under the employment relationship,like any employee, but also as a discipline board, in accordance withmaritime law.
Fishermen enjoy, in addition to the daily rest, a weekly rest that can bedeferred and 3 paid days of leave per month. This rest is not contractu-al but legal. Collective Agreements can increase the duration of the“leave-rest” (up to the equivalence of time at sea and tiem of leave inthe case of tropical tuna).
France considers that it is impossible to count the time to work on timeaboard fishing vessels. It only sets the daily rest period in accordancewith Directive 2003/88 (choice of regulation rest) and Convention 188of the ILO, which applies only to rest. The working time is limited to 225days at sea / that can be brought to 250.
Duration of contract
Working positions
Minimum crew
Professional qualifications for crew
Health and safety of workers
Training activities
Economic sanctions or disciplinary measures for employees
Contractual breaks
Hours of work

Italy
I N T R O D U C T I O N (by Flai Cgil)
Italy is a country with a great fishing tradition.
The conformity of the coastline and favourable climate have made this business one of its main economic
activities.
The techniques of fishing, which over time have developed differently from region to region, have allowed
a continuity in employment and in the supply of fresh produce to coastal communities.
Our country is rich in docking ports where, thanks to the characteristics of the coasts, tourism and com-
mercial activities take place alongside each other.
In many regions, in addition to major ports offering services to merchant, cruise and industrial fishing ships,
there are as many ports that are home to boats suitable for small-scale fishing.
These realities have been characterised as fishing villages, combining their historical and tourist attractive-
ness with fishing, respecting the environment and the resource, integrating industrial and small-scale fish-
ing, in a marriage that has endured over time.
It is a system that over the years managed to find the right balance but is now suffering from the crisis fac-
ing our country.
In recent years, there has been a gradual reduction in fishing: the abandonment of the activity, by many
boat owners, has had a serious effect on employment.
Our data show this downward curve very clearly.
Vessels registered in at the end of 2012 numbered 14,828; by August 2014, the number had dropped to
12,360, with a consequent drop in employment: the phenomenon seems unlikely to stop.
Low profitability, excessive costs and depressed prices are some of the factors that have given rise to this
state of affairs. This is also why the sector is no longer able to attract young workers.
Increasingly, fishing companies find it difficult to find labour and, when they do, the average age is high-
er than in other productive activities. Increasingly, the industry draws on foreign EU and non-EU labour.
This is the background to the work of FLAI CGIL which, over time, has attempted to reconcile tradition with
the rights of workers, in a continually evolving scenario.
In recent years, the union has still managed to achieve important goals: there are three national collective bar-
gaining agreements applied, covering the entire fishing industry, from industrial to cooperative to a specific
contract for those who work on land; we were able to obtain a social security net, non-existent until a few years
ago; the issues of maritime safety and the health of fishermen has begun to be dealt with more convincingly.
All fundamental points to relaunch fishing and to make this profession less demanding, safer and more
attractive, but this is not enough.
In order to grow, it is necessary to improve a number of aspects.
First of all, the social security net: a tool for income support and more general support that intervenes in a
structured and flexible way to combine fishing work with the periods of inactivity.
A social security net which, used in innovatively, can intervene in those situations where, for example,
workers put their own safety at risk, rather than lose days of wages, even if the weather conditions are not
safe for putting out to sea.
PART
2
47PA
RT 2
46
The concept of overtime for fishermen is nonsense, given the form ofcompensation “on hand” and the fact that hours of work are notcounted: a choice was made only to grant rest periods.
The amount of compensation is fixed by the contract, the crew sharesa number of “parts” according to what is contractually agreed in arma-ments. The notion of "parts" can be implemented as a “index”, as apercentage of gross operating income. There are also conventional andlegal minimum annual compensation. For artisanal fisheries, there is aminimum daily wage for the actual days at sea.
It depends on the agreement.
All levels of bargaining exist in France, but they are mostly concentrat-ed on the national level, on one hand for artisanal fisheries and coop-erative armaments and, on the other hand, for deep sea fishing, orweaponry.
Fishermen are fed for free aboard.
In addition to the paid leave, May the 1st, weekly rest, fishermen arelegally entitled to absences for family events, for training, for materni-ty, parental leave, for the exercise of trade union activity, etc. But this is mainly due to the law and not by means of the contract.
Fishers have their special social security scheme (ENIM). The contribu-tion is shared between the employer and the seafarer. They are coveredby the nine branches of social security, except for unemployment forsmall-scale fisheries. Supplementary health coverage must be negoti-ated and implemented by 2016.
The dismissal law and the related legal procedures are applied to thefishermen contract of employment. The fisherman may challenge hisdismissal in court proceedings, after a conciliation conducted by theMaritime Administration.
Fishermen receive a retirement pension via their special social securityscheme. France applies the Convention No. 71 of the ILO concerningseafarers' pensions to fishermen.
Any individual dispute between the fisherman and the employer maybe subject of a conciliation conducted by a representative of the admin-istration at departmental level, of the Delegation to the Sea andCoastline in each territories and the sea Department. If there is recon-ciliation, a report of the conciliation which has the force of law is pre-pared, otherwise the Court of First Instance is questioned.
Overtime
Remuneration
Productivity bonus
Levels of bargaining
Food
Absences provided for in the contract
Insurance coverage
Termination of employment
Supplementary pension
Reconciliation

has been marine aquaculture with a decrease of 25% in weight, but 49% in value, reflecting a loss of value
of the product. Despite losing 22% compared to 2010, freshwater aquaculture is the one that has held up
better on the market with sales volumes of 206 million euros, 50% of aquaculture production.
The 15% decrease in the number of companies compared to 2010 resulted in a loss of jobs of 13%, which
now amounts to 5,076 units, and a fall in average wages of 20%.
• ProcessingThe turnover of the Italian processing industry in 2011 was 2.2 billion euros, down 17% from the year
before and down 21% compared to 2008.
The largest share of costs for the industry is the purchase of raw materials which, at €1.6 billion, represents
74% of total production costs and 71% of proceeds. To date, Italian processing has been heavily depend-
ent on imports, especially from Ecuador, Colombia and the ACP countries.
The main field of activity is that of conservation, in particular tuna (which is worth 50% of the industry),
anchovies, sardines and shellfish.
In the last decade the increase in production costs, linked to the decline in catches of tuna, has led a num-
ber of Italian companies to change their production methods and marketing strategies. On the one hand,
they have started to import frozen produce at a much lower cost than fresh, and, on the other hand, they
have moved production sites closer to the fishing areas, for the lower labour costs. From the point of view
of the workers, this has represented a significant loss of purchasing power. Other companies have instead
been acquired by foreign companies, especially from Spain, and today are limited only to the marketing of
finished products from abroad.
E VA L U AT I O N O F T H E I M PA C T O F T H E C F P 14
According to Antonio Pucillo (FLAI CGIL Nazionale), in recent years the measures taken under the various
reforms of the Common Fisheries Policy have been responsible for the loss of about 6,000 jobs in Italy.
Particular mention was made of the critical issues related to the introduction of the EU regulations on con-
trols which, by forcing structural changes on fishing operators, led to economic and effectiveness problems
with the catch. The Common Fisheries Policy has not even been able to improve the sustainable manage-
ment of fish resources.
Specific issues regard small and large pelagic species (e.g. bluefin tuna) for which every year there are reduc-
tions in the TACs set by ICAT. Although there are now only 20 boats still active in this segment, the bluefin
tuna fishery still has a great importance from the point of view of the economy and employment in Italy.
Compared to the new CFP there are critical aspects in relation to the impact that the new measures might
have particularly on small-scale fisheries. Specific problems, in fact, will arise from the introduction of the ban
on discards, in spite of the derogation provided for activities in the Mediterranean. In addition, there will be
the issue of the ownership and management of discards landed, raising questions about the responsibility of
the ports or the individual boats. Another problem is the introduction of transferable fishing concessions that
will undoubtedly have a negative impact, resulting in lower profitability and higher costs for the industry.
PART
2
49
Therefore it is an instrument to protect the health and safety of workers. In fact, there is an urgent need
for legislation on safety at work: it is essential to apply to the fisheries sector the Consolidated Law on
Health and Safety, Legislative Decree no. 81/08, since fisheries workers are inexplicably excluded.
In addition, the sector needs to be given the unenviable definition of arduous work. A serious lack for the
workers who every day live in very precarious and exhausting conditions: from exposure to the sun, noise,
water, temperature changes, to working on unstable surfaces and in limited spaces.
These are some of the priorities facing the sector, both for fishing at sea and for fishing in inland waters
and lagoons.
To relaunch the sector there is a need for targeted interventions and, in this, valuable assistance might be
provided by the new CFP (Common Fisheries Policy) and the EMFF (European Maritime and Fisheries Fund).
Within these regulations are to be found the resources and methods to bring new life to the sector.
Here we have to find the elements to turn it into a competitive sector that respects the environment and
the resource.
In all this, in our view, collective bargaining must play a central role: a system of relations between the par-
ties that meets the needs of all the players: the national collective bargaining agreement as an instrument
to lead the sector out from the difficulties it finds itself in.
Only through the shared efforts of all and through the primary role of the national collective bargaining
agreement will we be able to relaunch the fisheries industry in Italy, but, above all, through creating new
and better jobs with close attention to the protection of the resource and the environment, and opposing
illegal work for a labour market that is legal and transparent.
E C O N O M I C A N D S T R U C T U R A L C H A R A C T E R I S T I C S
• FishingThe size of the Italian fishing fleet remained fairly stable between 2011 and 2012 with 14,828 registered
vessels, a tonnage of 183,000 tons, engine power of 1,237kW and an average age of 28 years. About 2/3
of the boats were part of the small-scale fleet, often family-run, but because of their small size they made
up only 9% of the national tonnage.
Employment in 2011 was estimated at 17,541 FTE, 6% less than in 2010, mainly due to the decrease in
productivity of the Italian fleet.
Days at sea numbered 1,748 in 2011, 5% more than the previous year. The increase was mainly attributa-
ble to the favourable weather conditions that allowed sailing in the months of November and December
as well. Consequently, the increase in fishing also saw an increase in fuel consumption by 1% (26% con-
sidering only small-scale fishing). Both fishing effort and production decreased in 2012. The 11% decrease
in activity levels, mainly due to the reaction of fishermen to the increase in fuel costs, resulted in a decrease
in the catch of 9%.
In 2011, 212,000 tons of fish were caught with a value of €1.1 billion, a decrease of 6% compared to 2010.
Hake was the most fished species in terms of value (€86 million), anchovies in terms of weight (46,000 tons).
• AquacultureItalian aquaculture production decreased over the period under consideration by 42% in volume (114,000
tons) and 25% in value (€162 million). The area that more than any other has been affected by the crisis
PART
248
14 Statement by Antonio Pucillo – FLAI CGIL Nazionale Fisheries Department official – made during the focus group held in Brussels on 20 February2014 as part of the project.

PART
2
51
C O L L E C T I V E B A R G A I N I N G I N T H E F I S H I N G I N D U S T R YPA
RT 2
50
3 years as per the national labour contract
Working positions are established by law and by local and national
labour contracts and agreements and can be for an indefinite period,
short-term or for a specific season/type of fish.
All sources establish a minimum number of crew members on the basis
of the type of fishing.
There is a system of professional qualifications for those on board
required by law, the collective labour agreement and local arrangements.
There are national laws that specifically relate to the matter of health
and safety of workers in fishing and the collective agreement provides
better conditions than those requirements.
There are no national laws regarding specific training activities aimed
at fisheries workers. The issue, however, is regulated by the national
labour contract
The law provides for economic sanctions and/or disciplinary measures
in the event of wrongful conduct by workers.
The contract provides for a weekly rest period.
The maximum hours of work at sea, by law, is established at 11 hours.
The national contract fixes at 8 hours the time limit for workers on land
and those engaged in ocean fishing.
Overtime is foreseen by national law only for ocean fishing or for work-
ers on land, in the case of small-scale fisheries.
The amount of remuneration, by contract, can be determined by share
or at a fixed monthly fee.
It is paid monthly (12 months) or weekly.
The contract includes a performance bonus tied to the quantity and
quality of the product.
Duration of contract
Working positions
Minimum crew
Professional qualifications for crew
Health and safety of workers
Training activities
Economic sanctions or disciplinary measures for employees
Contractual breaks
Hours of work
Overtime
Remuneration
Productivity bonus
In addition to the national level, regional and local bargaining is foreseen.
The cost of the food consumed by workers during fishing activity is the
responsibility both of the worker and the owner/entrepreneur.
The contract recognises paid holidays, parental leave, care for family
members. Any additional time off apart from holidays shall not be paid,
nor is there any provision for study days.
The following insurance policies are foreseen: disability, old age and sur-
viving dependents paid by the employee to 9.19% and the employer to
23.81% (range: 19.41%) (small-scale fisheries: 4.40% by the worker, the
employer 10.5%); unemployment paid by the employer to 1.31%
(range: 0.37%) (small-scale fisheries: employer 0.3%); illness borne by
the company to 2.2% (small-scale fisheries: cover not available).
Against injury, both for industrial and small-scale fishing, the premium
is calculated on the total pay and the rate varies according to the
recorded accidents starting from a maximum rate of 0.65%.
As regards industrial fishing, there is a bilateral body, funded by the
workers in the sector, which integrates the provision of accident and ill-
ness with welfare and social security.
The law provides for the unilateral termination of the contract.
The provision of a severance pay is envisaged, but the employee may
choose to receive it through monthly payments rather than in a lump sum.
Forms of provision are provided by both the state and in an integrative
way. The supplementary fund is financed by workers and employers.
Currently, despite being required by the contract, there is no health fund.
There are places and/or instruments of reconciliation between workers
and employers.
Levels of bargaining
Food
Absences provided for in the contract
Insurance coverage
Termination of employment
Supplementary pension
Reconciliation

C O L L E C T I V E B A R G A I N I N G I N T H E F I S H I N G I N D U S T R Y PA
RT 2
53
The Netherlands
E C O N O M I C A N D S T R U C T U R A L C H A R A C T E R I S T I C S
• FishingIn 2013, the Dutch fleet consisted of 742 registered vessels, with a total tonnage of 129 thousand GT, a
driving force of 276 thousand kW and an average age of 35 years. In 2012, there were 471 firms, 70% of
them with just a single ship. Employment in the same year was estimated at 1,773 FTE, a decrease from
2009 of 20%. This decrease is attributable to the decrease in the number of vessels over 24 metres and the
reduction in the size of crews due to the decline in profits.
In 2011, the Dutch fleet spent 46 thousand days at sea, 9% less than the previous year. In 2012, however,
the number of days increased again, thanks in particular to greater fishing in the field of shrimp. Fuel con-
sumption also dropped (-9% in 2010 and -14% in 2009) mainly due to the activation of innovative policies
for energy saving and, thanks to huge investments in this direction, it will continue to drop in coming years.
In 2011, the total catch amounted to 339 thousand tons of fish products, valued at €327 million, down on pre-
vious years. This decline seems to be due mainly to the reduction of catches in the Pacific and African waters.
The prices obtained for the main species started to decline from 2009: the market price of shrimp, for exam-
ple, fell by 50% between 2008 and 2011. During the same period, sole accounted for 30% of the value of
all the Dutch catch.
The economic crisis and the import of cheaper products from Asia have caused a collapse in the prices of
produce from the North Sea.
• AquacultureThe total aquaculture production in 2011 was 43 thousand tons (-36% compared o the previous year) with
a value of 81 million euros (-24%). The most important sector is that of shellfish which produced 36 thou-
sand tons in 2011 compared to a “marine” production of only 220 tons. Since this is a high-density area of
work, wages make up 27% of operating costs, followed by the rents for the areas where the farms are
established.
• ProcessingIn 2011, the turnover of Dutch processing companies amounted to 804 million euros. The average firm had
fewer than 10 employees.
Total revenue increased by 14% since 2010, while costs increased by 17%, mainly due to the increase in
the prices of raw material (up 24%).
PART
252
The contract lasts for 3 years, but we have to specify that the person
who completed the questionnaire is referring to collective labour agree-
ments and not to a national collective bargaining agreement.
The contract allows working relationships that are permanent, tempo-
rary, seasonal or dependent on the type of fishing.
The contract stipulates a minimum number of competent workers in the
crew. The law states that the minimum number of crew is related to the
size of the boat.
The system of professional qualifications for the crew in the
Netherlands is foreseen by law.
There are national laws that relate specifically to the matter of health
and safety of workers in the fishing industry.
The collective agreement does not provide better conditions than those
requirements.
There are national laws relating to specific training activities aimed at
fishing workers. The collective agreement improves the requirements to
the advantage of workers.
The law does not provide for economic sanctions and/or disciplinary
measures in the event of wrongful conduct by workers.
The contract provides for daily and weekly rest periods.
The contract stipulates a maximum of 68 hours or 48 hours a week at
sea and 8 hours per day (up to a weekly maximum of 48 hours) on land.
Overtime at sea is not foreseen: it is permitted to work for a maximum
of 12 hours per day, 6 days a week for no more than 200 days at sea.
The amount of remuneration, by contract, is paid at a fixed rate plus a
proportion of turnover. For this reason, remuneration is paid following
the calculation of the cost of sale of the fish.
The salary is fixed and monthly for non-EU workers.
Duration of contract
Working positions
Minimum crew
Professional qualifications for crew
Health and safety of workers
Training activities
Economic sanctions or disciplinary measures for employees
Contractual breaks
Hours of work
Overtime
Remuneration
Spain
I N T R O D U C T I O N (by FSC-CCOO)
Last May, European Union approved an agreement to reform the Common Fisheries Policy (CFP) which
introduces important changes towards the sustainability of the European fisheries sector.
A sustainable fishery model is the one that can be maintained without compromising the viability of pop-
ulations and without having a negative impact on other species in the ecosystem, including people. For
decades, analysts have pointed out the negative environmental impact of current fishing pattern, but the
analysis regarding the impact on people, on fishing communities, are very rare; economic and environmen-
tal aspects have a greater role in both the academic sphere and in the political agenda.
Fishing communities worldwide are currently threatened by significant risks such as climate change (and
its consequences on oceans and fisheries), high fuel prices, overexploitation of fisheries and aquaculture.
Perhaps for this reason, there’s a growing interest for deepening their social sustainability (defined as the
survival of fishing communities with their own idiosyncrasies and their economic, social and cultural her-
itage) and better understanding their determinants processes. In this context the recent research
“Employment on board” examines the career paths and the lives of more than 2,000 fishermen and their
recent developments and provides empirical evidence on the social sustainability of fisheries. Among its
key findings we highlight the following three:
1. The current fishery model was configured from a strong reduction in the number of traditional fishing
boats that had a high cost in terms of employment. In the last twenty years the Spanish fishing has lost
52,000 jobs (60.4% of total employment). Moreover, since the reduction in capacity does not seem to
have been accompanied by a recovery of the fishery resource, it has also failed to improve the econom-
ic sustainability of the sector.
2. Job losses in artisanal fishing is affecting the survival of fishing rural areas because this type of fishing
helps to maintain the employment of women and young people:
• Nine out of ten women employed in the Spanish extractive fishing sector and living in rural areas, work
in artisanal fisheries;
• Seven out of ten young people (under 25 years) employed in extractive fishing sector and living in rural
areas, work in artisanal fisheries;
• Six out of ten workers over 55 years employed in extractive fishing sector and living in rural areas, work
in artisanal fisheries.
3. The reduction of the fishery resource has also been accompanied by a significant deterioration in the
income of workers and their families (average earnings in artisanal fisheries reached only 37.6% of the
average of the economy and 48.2% of the average of the fisheries sector), reduced levels of employabil-
ity and the lack of opportunities for young men and women (their careers are much more volatile, with
higher job turnover, more episodes of unemployment and inactivity and significant increase in the aver-
age length of such episodes).
In summary, the results empirically state that, in the Spanish fisheries sector, environmental economic and
social sustainability show a strong positive sign of interdependence. Therefore, in the medium and long
term, the dynamics observed and actions that interfere with them (normative, financial, technological,
PART
2
55PA
RT 2
54
The contract provides for an award related to the amount of production.
In addition to national bargaining, there is a second level of company
bargaining.
The cost of the food consumed by workers during fishing activity is the
responsibility of the owner/entrepreneur.
The contract recognises holidays and paid leave and assistance to fam-
ily members.
There is no parental leave or time off for studying.
There are several types of insurance coverage for crew members: inva-
lidity, old age (the responsibility of the workers is 60% and for the
employer 40%, plus an unspecified contribution from the State), illness
(payable by the employer at 70%), accidents at work (paid by the
employer if the employment relationship has lasted for less than two
years, the State if it is more than three years).
Measures to support the unemployed are not covered by insurance, but
are funded through taxation.
There are no bi- or trilateral entities that participate in the cost of the
insurance premium.
According to the contract and the law, the employment relationship
may be terminated unilaterally in the case of wrongful conduct on the
part of the employee, in an agreed manner (and inclusive of any settle-
ment, if due) or, according to the contract, on reaching retirement age.
There is no provision for redundancy payment.
The provision for the pension fund is funded 60% by the employee and
40% by the employer. There is also provision for health purposes fund-
ed by the employer.
There are places and/or instruments of reconciliation between workers
and employers.
Productivity bonus
Levels of bargaining
Food
Absences provided for in the contract
Insurance coverage
Termination of employment
Supplementary pension
Reconciliation
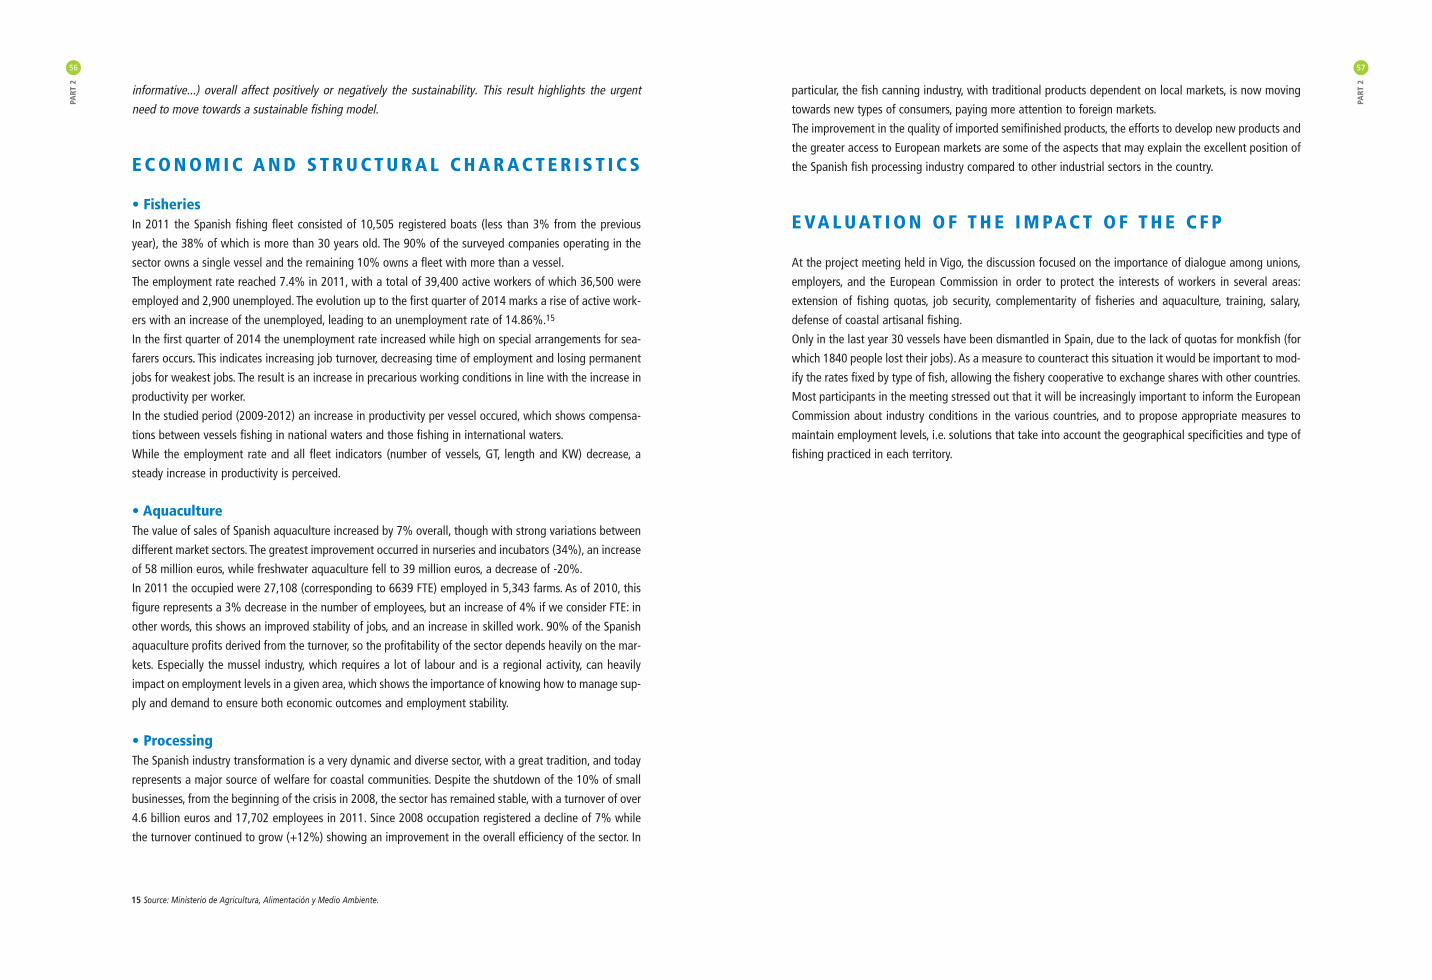
particular, the fish canning industry, with traditional products dependent on local markets, is now moving
towards new types of consumers, paying more attention to foreign markets.
The improvement in the quality of imported semifinished products, the efforts to develop new products and
the greater access to European markets are some of the aspects that may explain the excellent position of
the Spanish fish processing industry compared to other industrial sectors in the country.
E VA L U AT I O N O F T H E I M PA C T O F T H E C F P
At the project meeting held in Vigo, the discussion focused on the importance of dialogue among unions,
employers, and the European Commission in order to protect the interests of workers in several areas:
extension of fishing quotas, job security, complementarity of fisheries and aquaculture, training, salary,
defense of coastal artisanal fishing.
Only in the last year 30 vessels have been dismantled in Spain, due to the lack of quotas for monkfish (for
which 1840 people lost their jobs). As a measure to counteract this situation it would be important to mod-
ify the rates fixed by type of fish, allowing the fishery cooperative to exchange shares with other countries.
Most participants in the meeting stressed out that it will be increasingly important to inform the European
Commission about industry conditions in the various countries, and to propose appropriate measures to
maintain employment levels, i.e. solutions that take into account the geographical specificities and type of
fishing practiced in each territory.
PART
2
57
informative...) overall affect positively or negatively the sustainability. This result highlights the urgent
need to move towards a sustainable fishing model.
E C O N O M I C A N D S T R U C T U R A L C H A R A C T E R I S T I C S
• FisheriesIn 2011 the Spanish fishing fleet consisted of 10,505 registered boats (less than 3% from the previous
year), the 38% of which is more than 30 years old. The 90% of the surveyed companies operating in the
sector owns a single vessel and the remaining 10% owns a fleet with more than a vessel.
The employment rate reached 7.4% in 2011, with a total of 39,400 active workers of which 36,500 were
employed and 2,900 unemployed. The evolution up to the first quarter of 2014 marks a rise of active work-
ers with an increase of the unemployed, leading to an unemployment rate of 14.86%.15
In the first quarter of 2014 the unemployment rate increased while high on special arrangements for sea-
farers occurs. This indicates increasing job turnover, decreasing time of employment and losing permanent
jobs for weakest jobs. The result is an increase in precarious working conditions in line with the increase in
productivity per worker.
In the studied period (2009-2012) an increase in productivity per vessel occured, which shows compensa-
tions between vessels fishing in national waters and those fishing in international waters.
While the employment rate and all fleet indicators (number of vessels, GT, length and KW) decrease, a
steady increase in productivity is perceived.
• AquacultureThe value of sales of Spanish aquaculture increased by 7% overall, though with strong variations between
different market sectors. The greatest improvement occurred in nurseries and incubators (34%), an increase
of 58 million euros, while freshwater aquaculture fell to 39 million euros, a decrease of -20%.
In 2011 the occupied were 27,108 (corresponding to 6639 FTE) employed in 5,343 farms. As of 2010, this
figure represents a 3% decrease in the number of employees, but an increase of 4% if we consider FTE: in
other words, this shows an improved stability of jobs, and an increase in skilled work. 90% of the Spanish
aquaculture profits derived from the turnover, so the profitability of the sector depends heavily on the mar-
kets. Especially the mussel industry, which requires a lot of labour and is a regional activity, can heavily
impact on employment levels in a given area, which shows the importance of knowing how to manage sup-
ply and demand to ensure both economic outcomes and employment stability.
• ProcessingThe Spanish industry transformation is a very dynamic and diverse sector, with a great tradition, and today
represents a major source of welfare for coastal communities. Despite the shutdown of the 10% of small
businesses, from the beginning of the crisis in 2008, the sector has remained stable, with a turnover of over
4.6 billion euros and 17,702 employees in 2011. Since 2008 occupation registered a decline of 7% while
the turnover continued to grow (+12%) showing an improvement in the overall efficiency of the sector. In
PART
256
15 Source: Ministerio de Agricultura, Alimentación y Medio Ambiente.

PART
2
59
C O L L E C T I V E B A R G A I N I N G I N T H E F I S H I N G I N D U S T R YPA
RT 2
58
80% of contracts are not governed by agreements at national, region-
al or local level. The Spanish labour law sets minimums in the “Workers'
Statute” setting the scope and time of application. The national con-
tract is renegotiated each year, unless there are different union agree-
ments, in which case it is renewed every 3 years.
Both the law and the National Collective Agreements admit the exis-
tence of any type of contract. In Spain there are 4 kinds of contracts,
spread over 46 different sub-classes.
The law sets a minimum number of workers to form the crew accord-
ing to vessel size and type of fishing.
The law and the National Collective Agreement establish a system of
professional qualifications of the personnel on board.
National laws regulate the issue of health and safety of workers in fish-
ing, and collective agreement often includes better conditions than the
laws prescriptions. However, there is still no national consensus on the
issue of health and safety of workers.
National laws regulates the training of workers in fishing, but often the
collective agreement includes better conditions.
Both the law and the collective agreement establish economic sanc-
tions and / or disciplinary measures in the case of negligent conduct of
employees.
The contract provides for a break either daily or weekly, according to
the type of fishing and geographic area.
The maximum working hours allowed by the law and the agreement is
of 8 flexible hours, but it can reach 24 hours (according to the condi-
tions of the sea or avalaible fish).
As for ground work this limit is influenced by the type of boat.
Overtime is disciplined both by law and by the national collective
agreement.
Duration of contract
Working positions
Minimum crew
Professional qualifications for crew
Health and safety of workers
Training activities
Economic sanctions or disciplinary measures for employees
Contractual breaks
Hours of work
Overtime
The amount of the compensation provided by the collective agreement
can be paid net of expenses of the task (fuel, food, etc.), or as a fixed
monthly payment. In case of fixed payment, the monthly payments are
12 + 2 bonus, which can be spread over 12 months. In artisanal fish-
eries salary is paid on a weekly basis; in industrial fisheries, regardless
of the fixed remuneration, a wage job is provided.
For industrial fishing a productivity bonus is provided according to the
amount of fish.
Apart from national bargaining a territorial level and a corporate level
of negotiation are provided.
The cost of the food consumed by workers during fishing activity is the
responsibility of the owner/entrepreneur.
The contract recognizes paid leaves and vacation, family care, parental
and study leave. Many owners take advantage of the biological rest
season to grant workers their holidays.
Various forms of insurance for the crew are provided in charge of the
national health insurance: disability (6.7% by the employee and 29.2%
by the employer), age (6.7% by the employee and 29.2% by the
employer), unemployment (divided between worker and employer
1.75%, 5.50%), illness (6.7% by the employee and 29.2% by the
employer), plus a specific allowance for training financed by the work-
er (0.1%) and employer (0.6%).
There are no bilateral or trilateral institutions participating in the cost
of the insurance premium.
The termination of the employment relationship can be either unilater-
al or agreed, both by the law and the collective agreement.
Severance indemnities are provided.
6.7% of the pension reserve fund is funded by the employee and 29.2%
by the employer. In addition, there’s a health reserve fund financed by
the same percentages.
There are places and/or instruments of reconciliation between workers
and employers.
Remuneration
Productivity bonus
Levels of bargaining
Food
Absences provided for in the contract
Insurance coverage
Termination of employment
Supplementary pension
Reconciliation

PART
260
Conclusions
In 2011, the total number of full-time jobs in the fisheries sector in the EU (27) (including catch, aquacul-
ture, processing and ancillary services to other segments) was nearly 313,000. The catch segment had
127,686 jobs (41%), processing 100,000 (32%) and aquaculture 85,000 (27%). Small-scale fishing fleets in
coastal zones (vessels under 12 metres with passive gear) constituted about 41% of employment in the
catch sector and about 55% of EU fishing boats.
To date, employment trends have remained negative, in line with the evolution of most primary sectors in
the EU: in 2007, the level of employment fell by 12% in the catch segment and 27% in processing.
The evaluation of the impact of the reform of the Common Fisheries Policy (CFP) has identified the low
attractiveness of the catch sector as one of the key problems, especially for the new generation of fisher-
men. A recent study of 24 coastal communities showed that they have increasing difficulty in completing
the crews with properly qualified local staff and often need to employ foreign workers or, in small-scale
fishing fleets, continue to work beyond the statutory retirement age. This lack of attractiveness is the result
of relatively low salaries (in comparison to work on the land) combined with difficult working conditions
and safety concerns.
Aquaculture in Europe has also stagnated in recent years, failing to provide much-needed jobs in inland
and coastal areas in Europe, or to make up for the loss of jobs in the catch sector. Aquaculture could cre-
ate jobs that are more attractive, with the average higher wages and better working conditions in relation
to vessels, but the potential of this activity has not yet been fully realised in Europe.
The European Union has for years shown a specific interest in this area. The Common Fisheries Policy has
undergone over the years various reforms (most recently by Commission Regulation (EU) no. 1380/2013),
mainly aimed at promoting a significant reduction of the fishing fleet in the EU whose size was consid-
ered exaggerated compared to the real possibilities of exploiting the resources. The social measures intro-
duced to compensate for the effects caused by the reorganisation of the fleet on the people who depend-
ed on fishing have failed to protect the economic and social conditions of the workers in this sector.
However, the limitation of overexploitation of fisheries resources has been a focal point for new measures
(prohibition of discards, maximum sustainable yield, regionalisation, TFC) introduced by the recently
approved reform of the CFP.
It is crucial to continue to explore initiatives and measures that could contribute to the management and
reduction of the impact of these processes on the sector at European level. Therefore, starting from the
instruments of collective bargaining, it is necessary to identify the policies and initiatives that will address
future social challenges in European fisheries.
PART
2
61

6362
B I B L I O G R A P H Y
• Eumofa, The EU Fish Market, 2014 edition
• European Commission, Facts and figures on the Common Fisheries Policy – Basic statistical data – 2014
Edition, Luxembourg: Publications Office of the European Union 2014
• European Foundation for the Improvement of Living and Working Conditions, Representativeness of the
European social partner organisations: Sea fisheries, 2012
• Eurostat, Agriculture, forestry and fishery statistics 2013 edition, Publications Office of the European
Union, Luxembourg, 2013
• Scientific, Technical and Economic Committee for Fisheries (STECF), The 2013 Annual Economic Report
on the EU Fishing Fleet (STECF-13-15), Luxembourg, Publications Office of the European Union, 2013
(Report EUR 26158 EN, JRC 84745).
• Scientific, Technical and Economic Committee for Fisheries (STECF), The Economic Performance Report on
the EU Fish Processing Sector (STECF-13-31), Luxembourg, Publications Office of the European Union, 2013
• Scientific, Technical and Economic Committee for Fisheries (STECF), The Economic Performance of the EU
Aquaculture Sector (STECF 13-29), Luxembourg, Publications Office of the European Union, 2013
• FAO, The State of World Fisheries and Aquaculture 2014 - Opportunities and challenges, Food and
Agriculture Organization of the United Nations, Rome, 2014
• Servizi della Commissione Europea, Sintesi della valutazione d'impatto che accompagna il documento
“Proposta di regolamento del Parlamento Europeo e del Consiglio sulla politica di mercato per i prodot-
ti della pesca e dell’acquacoltura”, SEC(2011) 884 definitivo, Bruxelles, 2011
• Servizi della Commissione Europea, Sintesi della valutazione d'impatto che accompagna il documento
“Proposta di regolamento del Parlamento Europeo e del Consiglio relativo alla Politica Comune della
Pesca”, SEC(2011) 892 definitivo, Bruxelles, 2011

PUBLISHED IN NOVEMBER 2014 BY ARTI GRAFICHE SRL, POMEZIA.GRAPHIC DESIGN BY STUDIO ROVIGLIONI, ROME.

FLAI CGILVIA LEOPOLDO SERRA, 31 - ROMA 00153 - TEL. +39 06585611 - FAX +39 0658561334
www.flai.it
FONDAZIONE METESVIA LEOPOLDO SERRA, 19 - 00153 ROMA - TEL. +39 06 58561200 - FAX. +39 06 58561220
www.fondazionemetes.it