employment and earnings august 1960 - st. louis fed
TRANSCRIPT

EMPLOYMENTand EARNINGS
Vol. 7 No. 2
including THE MONTHLY REPORT
ON THE LABOR FORCE
August 1960
Data formerly published by theBureau of the Census in TheMonthly Report on the LaborForce (Series P-57) are shownin Section A.
NEW AREA SERIES...
The employment series for Erie and
York, Pennsylvania, formerly limited to
manufacturing, now cover all nonagri-
cultural industry divisions, as shown
in table B-8.
Manufacturing labor turnover rates
for Chattanooga, Tennessee, are now in-
cluded in table D-l*.
For sale by the Superintendent ofDocuments, U.S. Government Print-ing Office, Washington 25, D.C.Subscription price: $3.50 a year;$1.50 additional for foreign mail-ing. Price U5 cents a copy.
DIVISION OF MANPOWER AND EMPLOYMENT STATISTICS
Harold Goldstein, Chief
CONTENTS
Employment and Unemployment Highlights—July I960
Page
iii
STATISTICAL TABLES
Section A—Labor Force, Employment, and Unemployment
Employment Status
A- 1: Employment status of the noninstitutional population, 1929 to date 1A- 2: Qnployment status of the noninstitutional population, by sex, 191*0,
19hh, and 19hl to date 2A- 3: Employment status of the noninstitutional population, by age and sex.... 3A- 1*: Employment status of male veterans of World War II in the civilian
noninstitutional population 3A- £: Employment status of the civilian noninstitutional population, by
marital status and sex •• .... hA- 6: Employment status of the civilian noninstitutional population, by
color and sex ••••••••••••••••• hA- 7: Employment status of the civilian noninstitutional population, total
and urban, by region. • ••••»•• 5
Class of Worker, Occupation
A- 8: Employed persons by type of industry, class of worker, and sex 5A- 9: Employed persons with a job but not at work, by reason for not working
and pay status 5A-10: Occupation group of employed persons, by sex 6A-ll: Major occupation group of employed persons, by color and sex 6
Unemployment
A-12: Unemployed persons, by duration of unemployment.•.••••• •• •« 7A-13: Unemployed persons, by major occupation group and industry group 7A-ll*: Persons unemployed 15 weeks and over, by selected characteristics. 8
Hours of Work
A-15>: Persons at work, by hours worked, type of industry, and class of worker. 9A-16: Persons employed in nonagricultural industries, by full-time or
part-time status and reason for part time 9A-17: Wage and salary workers, by full-time or part-time status and major
Indus try group • 9A-18: Persons at work, by full-time or part-time status and major occupation
group • • • • 10A-19* Persons at work in nonagricultural industries, by full-time or
part-time status and selected characteristics 10
Continued on following page.
Digitized for FRASER http://fraser.stlouisfed.org/ Federal Reserve Bank of St. Louis

EMPLOYMENTand EARNINGSIncluding THE MONTHLY REPORT
ON THE LABOR FORCE
The national industry employment,hours, and earnings data shownin Sections B and C have beenadjusted to first quarter 1957benchmark levels.
CONTENTS-ContinuedPage
Section B—Payroll Employment, by IndustryNational Data
B-l« Employees in nonagricultural establishments, by industry division, 1919to date • 11
B-2: Employees in nonagricultural establishments, by industry 12B~3: Federal military personnel • • 16B-Ut Employees in nonagricultural establishments, by industry division
and selected groups, seasonally adjusted. 17B-5: Employees in private and Government shipyards, by region 17B-6J Women employees in manufacturing, by industry 1/ • • 18
State and Area Data
B-7» Employees in nonagricultural establishments, by industry division andState 20
B-8: Employees in nonagricultural establishments for selected areas, byindustry division 23
Section C—Industry Hours and Earnings
National Data
C-li Gross hours and earnings of production workers in manufacturing,1919 to date 29
C-2: Gross hours and earnings of production workers in manufacturing, bymajor industry group • 30
C-3* Average weekly overtime hours and average hourly earnings excluding over-time of production workers in manufacturing, by major industry group...., 30
C-U: Indexes of aggregate weekly man-hours and payrolls in industrial andconstruction activities.• • 31
C-5: Average weekly hours, seasonally adjusted, of production workers inselected industries 31
C-6: Gross hours and earnings of production workers, by industry 32C-7* Gross and spendable earnings in industrial and construction activities,
in current and 19U7-U9 dollars 38
State and Area Data
C-8: Gross hours and earnings of production workers in manufacturing, by Stateand selected areas • 39
Section D—Labor TurnoverNational Data
D-l: Labor turnover rates in manufacturing, 1951 to date k3D-2: Labor turnover ra tes , by industry khD-3: Labor turnover rates in manufacturing, by sex and major industry group l / . U6
State and Area Data
D-U* Labor turnover rates in manufacturing for selected States and areas I4.7
Explanatory Notes 1Jg
BLS Regional Offices l w s
State Cooperating Agencies I n s i d e back cover
1/ Quarterly data included in the February, May, August, and November issues.
Digitized for FRASER http://fraser.stlouisfed.org/ Federal Reserve Bank of St. Louis
EMPLOYMENT AND UNEMPLOYMENTHIGHLIGHTS July I960
THE MONTHLY REPORT ON THE LABOR FORCE: JULY I960
Changes in employment and unemployment were on the whole seasonalbetween June and July. However, employment in construction picked up morethan seasonally and there were continued job cutbacks in the steel industry.
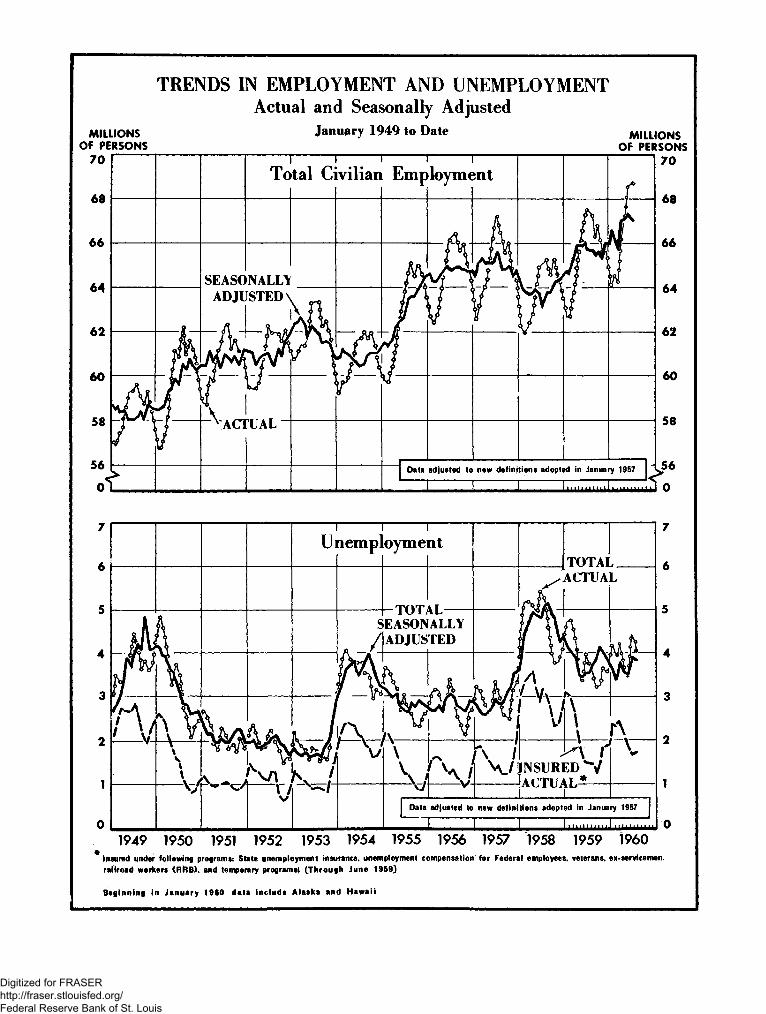
Unemployment dropped by 400, 000 over the month to 4. 0 million in July.The reduction was about usual for this period and the seasonally adjusted rateof unemployment of 5. 4 percent was not significantly different from the 5. 5-percent rate of the month before. Unemployment among teenagers droppedsharply as many of the youngsters who sought work in June found jobs by July.Unemployment among adults, however, rose moderately for the second monthwith job cuts in durable goods industries, mainly autos and steel. State insuredunemployment, which does not include new entrants into the job market, rose bynearly 150, 000 from mid-June to 1. 7 million in mid-July. This increase wassomewhat more than seasonal.
The number of persons unemployed 15 weeks or longer was unchanged overthe month at 800, 000 and was about the same as a year ago.
Total employment, at 68. 7 million, continued at a record high, but wasnot substantially changed from June. Total nonagricultural employment, includ-ing the self-employed, domestics, and unpaid family workers, was 61. 8 millionin July, also approximately the same as a month earlier. At the same time, thenumber of workers on nonfarm payrolls dropped by 365, 000 over the month to 53. 2million largely as a result of vacation-taking by workers who did not receive payfor the period and were therefore not included in the payroll count. (The figureon total nonagricultural employment based on the household survey includesworkers on vacation from a job whether or not they are paid.)
Nonfarm Payroll Employment
The July decline in nonfarm payroll employment was about usual for thistime of year, although there were contrasting developments in several industries.Employment in the construction industry rose by 120, 000 over the month, acomparatively large June to July increase. On the other hand, durable goodsindustries reported a drop of 170, 000 jobs.
There was a cutback of 40, 000 workers in the primary metals industry—the fifth successive monthly decline. The contraction in steel operations alsobrought job reductions in some other industries. Mining employment droppedmore than seasonally as some coal mines which observed their customaryvacation closedown around the end of June did not reopen in mid-July for lackof demand from steel mills. In addition, transportation employment (both inrailroads and in trucking) dropped off by 25, 000*partly as a result of these develop-ments.
Automobile employment also fell in July, in part because manufacturersstarted to trim auto inventories in anticipation of an early model changeover. Inaddition, operations at some plants were hindered by material shortages result-ing from a strike at a supplier plant.
Declines in a number of manufacturing industries reflected vacation^taking without pay by some workers. However, chiefly because of the developmentsin steel and autos, the 160, 000 reduction in all factory jobs between June and Julyto 16. 3 million was greater than usual.
i i i
Digitized for FRASER http://fraser.stlouisfed.org/ Federal Reserve Bank of St. Louis
MILLIONSOF PERSONS
70
TRENDS IN EMPLOYMENT AND UNEMPLOYMENTActual and Seasonally Adjusted
January 1949 to Date
68
66
64
62
60
58
56
n
MILLIONSOF PERSONS
k1 '
SEASO
1 l
Total Civilian
•NALLYADJUSTED \
^ACl
ilk
fUAL
nV
1 7
Employme
fa
1
A
:nt
kr
3
1 Data adjusted to new definitions adopted in January 1957 1
U nemploymentTOTAL_
ACTUAL
_L IData adjusted to new definitions adopted in January 1957
SEASONALLYADJUSTED
I
70
68
66
64
62
60
58
56
0
7
6
1949 1950 1951 1952 1953 1954 1955 1956 1957 1958 1959 1960Insured under following programs: State unemployment insurance, unemployment compensation for Federal employees, veterans, ex-servicemen,railroad workers (RftB). and temporary programs^ (Through June 1959)
Beginning in January 1960 data include Alaska and Hawaii
Digitized for FRASER http://fraser.stlouisfed.org/ Federal Reserve Bank of St. Louis

Other employment changes were mainly connected with the season. Thelargest change, a drop of 270,000 government employees, was due mainly tothe reduction in school system employment during the summer recess.
Over the year, employment was up in State and local governments(300,000), wholesale and retail trade (260,000), service (120,000), and fi-nance (50,000). Manufacturing employment, however, was down by 160,000(mainly in steel and aircraft); mining, and transportation and public utilitieswere down by 50,000 and 20,000 respectively.
Factory Hours and Earnings
The factory workweek dipped by 0, 2 hours to 39. 8 hours in July. Thedecline was about normal for this period, and the seasonally adjusted level con-sequently showed no change. (See table C-5.) The transportation equipment indus-try reported one of the larger declines (0.6 hours), the result of a drop inauto production. An increase of 0. 3 hours in the primary metals industry didnot reflect a longer workweek, since many workers previously on short timewere on vacations and were paid for 40 hours.
As a result of the decline in the factory workweek, earnings of produc-tion workers edged off by 46 cents over the month to $91. 14 per week. Hourlyearnings remained unchanged at $2. 29.
Weekly earnings were $1.49 higher than a year ago, reflecting a 6-centrise in hourly earnings over the year. The workweek, however, was 0. 4 hoursless.
Total Labor Force
The total labor force, including the Armed Forces as well as all civil-ian workers, dipped by 300,000 over the month to 75.2 million in July. All ofthe reduction occurred among adult women, a group which usually declinesslightly at this time of year when teachers leave the labor force for the sum-mer. (Only those with contracts to return to work in the fall are counted asemployed. ) In most years, there are also reductions among women in thefarm work force in July, but farm operations have been delayed this year be-cause of bad weather in early spring.
The number of teenagers in the labor force (8-1/4 million) was virtuallyunchanged over the month, in contrast to a seasonally expected increase ofabout 400,000. This year, partly because of the lateness of the June surveyweek, much of the labor force increase expected among school-age youngstersin July had already been reflected in the June figures.
For the last 4 months, the labor force has shown an average growthof about 1 million from the corresponding 1959 levels. (This comparisonallows for the inclusion of Alaska and Hawaii in this year1 s figures. ) DuringI960, this growth has been rather uneven, and in the 1st quarter the gain from1959 averaged only about 300,000.
Total and part-time employment
Total employment was virtually unchanged over the month at 68. 7million, after reaching an all-time record level in June. Both farm and non-farm employment were about stable at 6.9 million and 61.8 million respec-tively. About 600,000 additional teenagers were employed in nonfarm jobs inJuly. At the same time, there was a reduction of an almost equal number ofadult workers--mostly school employees but also some men from hard goodsmanufacturing industries.
Digitized for FRASER http://fraser.stlouisfed.org/ Federal Reserve Bank of St. Louis

EMPLOYEES IN NONAGRICULTURAL ESTABLISHMENTSSeasonally Adjusted
MILLIONS
13
12
n
10
9
8
7
6
5
4
3
2
Trade
Nondurable Goods ManufacturingState and Local Government
I X
Mining, Transportation,and Public Utilities
Construction
MILLIONS
13
12
11
10
9
8
7
6
5
4
3
2O
1953 1954 1955 1956 1957 1958 1959 I960 1961
UNEMPLOYED MEN AND WOMEN 20 YEARS AND OVERSeasonally Adjusted: April 1948 to Date
THOUSANDS *
4,500
Data Adjusted to New Definitions Adopted in January 1957
1948 1949 1950 1951 1952 1953 1954 1955 1956 1957 1958 1959 1960 1961 1962
Beginning in January 1960. data include Alaska and Hawaii.
Digitized for FRASER http://fraser.stlouisfed.org/ Federal Reserve Bank of St. Louis

Nonfarm employment continued at an all-time record in July, 800, 000above a year earlier. All of the growth over the year was recorded among women,Farm employment was as high as a year ago, but there had been a further drop ofabout 200, 000 in the number of farm self-employed.
As usual, the number of nonfarm employees on vacation reached a peakin July, rising by more than 3 million over the month to about 5-1/2 million.The great majority of these workers—over 80 percent—were paid by theiremployers for all or part of the time off. The proportion on paid vacations wasabout the same as in July 1959. Altogether, there were about 1 million employeeson unpaid vacations in July, up sharply from June, but only slightly higher thanin July 1959.
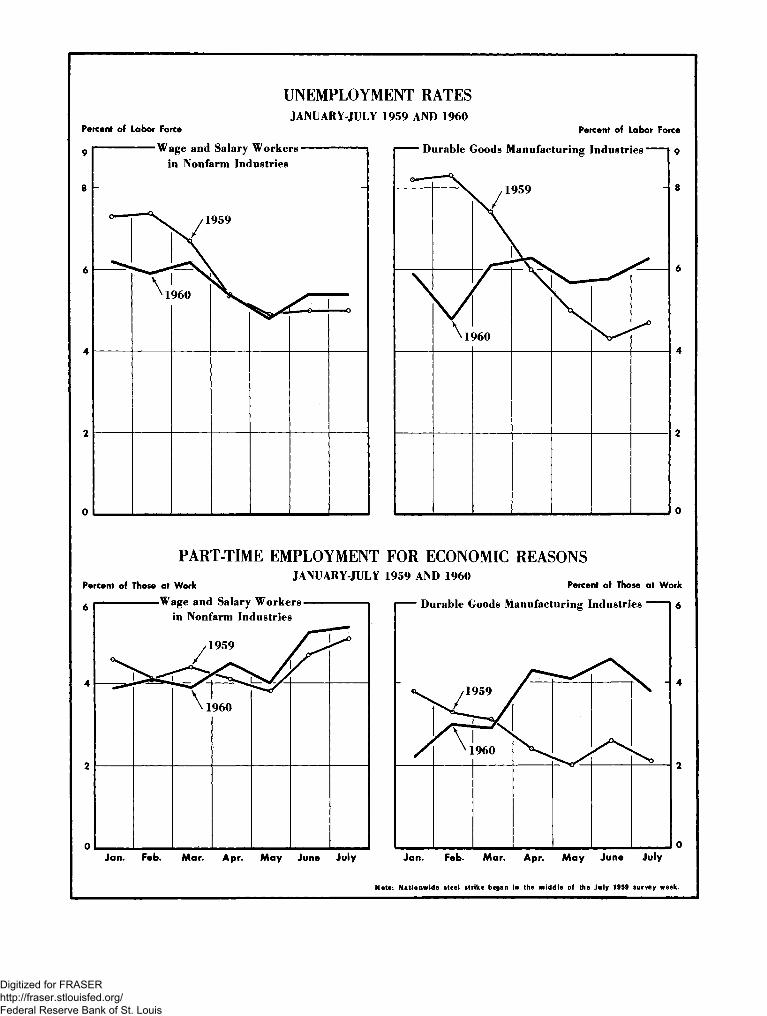
The number of regular full-time workers on part time because of slackwork and other economic factors (including the start of new jobs during thesurvey week) was 1.1 million in July as compared with 1. 4 million in June and900, 000 a year ago. Since April, this total on reduced workweeks because ofeconomic reasons has| averaged higher than in 1959; most of the increase hasbeen among factory workers. In the spring and early summer of 1959, whendurable goods production was being accelerated in anticipation of the steel strike,there was less part time and more overtime.
Characteristics of the Unemployed
Duration of Unemployment. The number unemployed less than 5 weeks(representing new spells of unemployment) fell sharply in July, dropping by800, 000 from its unusually high June level to 1. 9 million. After allowance forseasonal changes, the number of short-term unemployed was about the same inJuly as in May and in most other months this year.
On the other hand, the number unemployed 5 to 10 weeks rose by 350, 000in July. This increase was greater than usual, reflecting the especially largeinflux of new jobseekers in June and ttie inability of some to find jobs withina month. Long-term unemployment (15 weeks\and over) remained unchanged overthe month at 800, 000, and was about the same as a year ago.
Age, Sex, and Marital Status. Unemployment among teenagers fell sharplyby 550, 000 to 1. 0 million, following the abnormally large increase in June. Theseyoung persons accounted for onerthird of the unemployed in June but only one-Eourth in July. Teenagers entering the labor force this summer appear to befinding jobs at about the same rate as a year ago. About 13 percent of those inthe labor market were unemployed in July I960, the same proportion as inJuly 1959.
On a seasonally adjusted basis, the number of unemployed teenagers inJuly was slightly below the number in May before their unusually large influxinto the labor market began. On the other hand, the number of unemployed menand women 20 and over has risen moderately over the last 2 months whereaslittle change is normally expected for this time of year.(See chart on page vi.)As in June, the unemployment rate among married men was slightly higher thana year earlier.
v i i
Digitized for FRASER http://fraser.stlouisfed.org/ Federal Reserve Bank of St. Louis
Percent of Labor Force
9
UNEMPLOYMENT RATESJANUARY-JULY 1959 AND 1960
Percent of Labor Force
Wage and Salary Workers •in Nonfarm Industries
.1959
\ 1960
Durable Goods Manufacturing Industries"
,1959
• ^
1960
PART-TIME EMPLOYMENT FOR ECONOMIC REASONSJANUARY-JULY 1959 AND 1960
Percent of Those at Work
-Wage and Salary Workers -in Nonfarm Industries
,1959
1960
Percent of Those at Work
Durable Goods Manufacturing Industries
Jan. Feb. Mar. Apr. May June July Jan. Feb. Mar. Apr. May June July
Note: Nationwide steel strike began in the middle of the July 1959 survey week.
Digitized for FRASER http://fraser.stlouisfed.org/ Federal Reserve Bank of St. Louis

Unemployment among Married Men
Month
Number(Thousands)
1960 1959
Rate(Percent of married men
in labor force)
I960 1959
JanuaryFebruaryMarchAprilMayJuneJuly
1,5401,4401,6121,2711, 1081, 1041, 182
1,8991,9361,6651,2131,058958
1,055
4.34.04.53.53. 13.13.3
5.35.44.73.43.02.72.9
NOTE: Nationwide steel strike began on July 15, 1959.
Industry Attachment of Last Job. Most of the 400,000 drop in unemploy-ment occurred among young job-seekers with no previous work experience.These new workers number 650, 00O among the unemployed in July, as comparedwith 1 million a month ago. Unemployment also declined among young workerswhose previous job experience was in trade or service. At the same time, thenumber of unemployed factory workers edged up over the month, largely as aresult of cutbacks in steel and autos.
Unemployed new workers totaled about the same as a year earlier. Theunemployment rate was slightly higher than a year earlier among experiencedworkers, but was substantially higher for hard-goods manufacturing workers.Within that sector, the unemployment rate in the primary metals industry wastwice as high as a year ago, after having doubled over the last 2 months.
ix5 6 1 1 6 3 O - 6 0 - 2
Digitized for FRASER http://fraser.stlouisfed.org/ Federal Reserve Bank of St. Louis
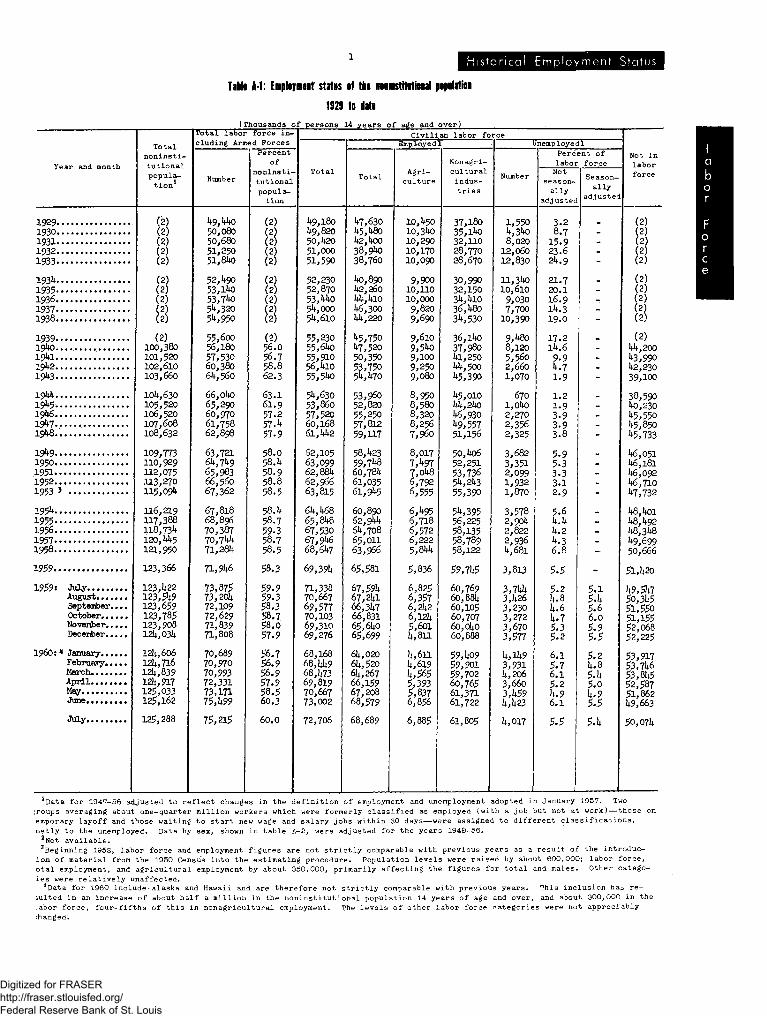
Table A t : Employment status of the ranmstititioial popalation
1929 to date(Thousands of persons 14 years of age and over)
Total labor force i:eluding Armed Forces
Year and month
Totalnoninsti-tutionalpopula-tion1
Percentof
noninstitutionalpopuletion
Civilian labor forceEmployed 1
Agri-culture
Nonagri-culturalindus-tries
UnemployedlPercent oflabor force
Notseason-
allyad juste-
Season-ally
adjustei
Not inlaborforce
1929193019311932193319341935193619371938193919to...19^1194219*6194419^5.194619471948.19491950195119521953 51954195519561957
1958
195? ,
19$9* JulyAugust...,September,October..,November.,December.,
I960:* January..,February.,MarchAprilMayJuneJuly.....,
(2)(2)(2)(2)(2)
(2)(2)(2)(2)(2)
(2)100,380101,520102,610103,660
104,630105,520106,520107,608108,632
109,773110,929112,075113,270115,09^
116,219117,388118,734120,445121,950
123,366
123,1*22123,54?123,659123,785123,°08124,034
12k,606124,716124,839124,917125,033125,162
125,288
49,44050,08050,68051,25051,840
52,49053,14053,7^54,32054,950
55,60056,18057,53060,38064,560
66,oho65,29060,97061,75862,898
63,72164,74965,98366,^6067,362
67,81866,89670,38770,74471,284
73,87573,20472,10972,62971,83971,808
70,68970,97070,99372,33173,17175,1*99
75,215
58.3
$9.959.35Q.358.758.057.9
56.756.9$6.9Si.958.560.3
60.0
49,18049,82050,42051,00051,590
52,23052,87053,44054,00054,610
55,23055,61*055,91056,4io55,540
54,63053,86057,52060,16861,442
62,10563,09962,88462,96663,815
64,46865,84867,53067,9^68,647
69,39k
71,33870,6676?,57770,10369,31069,276
68,16868,44068,47369,81970,66773,002
72,706
47,63045,48042,toO38,94038,760
40,89042,26044,4101*6,30044,220
45,75047,52050,35053,75054,470
53,9^052,82055,25057,81259,117
58,42359,74860,78461,03561,945
60,89062,94464,70865,01163,966
65,581
67,59467,24166,34766,83165,64065,699
64,02064,52064,26766,15967,20868,579
68,689
10,45010,31*010,29010,17010,090
9,90010,11010,0009,8209,690
9,6109,5^9,1009,2509,080
8,9508,5808,3208,2567,960
8,0177,4977,0486,7926,555
6,4956,7186,5726,2225,844
5,836
6,8256,3576,2*26,1245,6014,811
4,6114,6194,565$,393$*$,316,856
6,885
37,18035,14032,11028,77028,670
30,99032,15034,41036,48034,530
36,l4o37,98041,25044,50045,390
45,01044,24046,93049,55751,156
5O,4o652,25153,73654,24355,390
54,39556,22558,13558,78958,122
59,745
60,76960,88460,10560,70760,04060,888
59,40959,90159,70260,76561,37161,722
61,805
1,5504,3408,020
12,06012,830
11,34010,610
9,0307,700
10,390
9,4808,1205,5602,6601,070
6701,0402,2702,3562,325
3,6823,3512,0991,9321,870
3,5782,9042,8222,9364,681
3,813
3,7hk3,4263,2303,2723,6703,577
3,9314,2063,6603,4594,423
4,017
3.28.7
15.923.624.921.720.116.914.319.0
17.214.69-94.71.9
1.21.93.93.93.8
5-95.33.33.12.9
5.64.44.24.36.8
h. 84.64.7$.35.2
6.15.76.15.24.96.1
5.15.45.66.05.9$$
5.24.85.45.0k.9$.$
5.4
(2)
(2)44,20043,99042,23039,ioo
38,59040,23045,55045,85045,733
46,05146,1811*6,09246,71047,732
48,4oi48,49248,34849,69950,666
51,420
49,54750,3455i,55o51,15552,06852,225
53,91753,74653,84552,58751,86249,663
50,074
*Data for 1947-56 adjusted to reflect changes in the definition of employment and unemployment adopted in January 1957. Twojroups averaging about one-quarter million workers which were formerly classified as employed (with a job but not at work)—those onemporary layoff and those waiting to start new wage and salary jobs within 30 days—were assigned to different classifications,ostly to the unemployed. Data by sex, shown in table A-2, were adjusted for the years 1948-56.2Not available.3Beginning 1953, labor force and employment figures are not strictly comparable with previous years as a result of the introduc-ion of material from the 1950 Census into the estimating procedure. Population levels were raised by about 600,000; labor force,otal employment, and agricultural employment by about 350,000, primarily affecting the figures for total and males. Other catego-ies were relatively unaffected.
4Data for 1960 include•Alaska and Hawaii and are therefore not strictly comparable with previous years. This inclusion has re-sulted in an increase of about half a million in the noninstitutional population 14 years of age and over, and about 300,000 in the.abor force, four-fifths of this in nonagricultural employment. The levels of other labor force categories were not appreciablychanged.
Digitized for FRASER http://fraser.stlouisfed.org/ Federal Reserve Bank of St. Louis

Historical Employment Status
Table A-2: Employment status of the noninstitutional population, by sex
(Thousands of persons 14 years of age and over)
Sex, year, and month
Totalnoninsti-tutionalpopula-tion
Total labor force in-cluding Armed Forces
Number
Percentof
noninsti-tutionalpopula-tion
Civilian labor forceEmployed1
Agri-culture
Nonagri-culturalindus-tries
Unemployed1
Percent oflabor forceNot
season-ally
adjusted
Season-ally
adjusted
Not inlaborforce
MALE
9194419^719W19^919501951195219532
195419551956195719581959
1959:August.•• .September.October. . .November. •December..
I960: January..«February.,MarchApri lMayJune
July
FEMALE
19^019441947194819^91950191119521953 2
195419551956195719581959 .
1959: JulyAugust . . . .September,October..,November. tDecember.,
I960:3 January.. ,February. <March. . . . ,A p r i l . . . . ,May ,June ,
July ,
50,08051,98053,08553,51354,02854,5265^,99655,5035^,53^57,01657,48458,04458,81359,^7860,100
60,12860,18660,22260,27860,33360,389
60,661;60,71060,76360,79060,8U260,900
60,956
50,30052,65054,52355,11855,74556,4o457,07857,76658,56159,20359,90^60,69061,63262,47263,265
63,291;63,36363,43763,50663,57U63,614;
63,91*26U,OO564,071*6U,12864,19161;, 262
6U,333
42,02046,67044,84445,30045,67446,069te,6jk47,00147,69247,84748,05448,57948,64948,802U9,O8l
50,68450,2301*9,110U9,Ol;51*8,7291*8,778
U8,U12U8,U871*8,1*1*5l;9,O6O1*9,3375O,9U9
50,998
I4,l6o19,37016,91517,599I8,o4818,68019,30919,55619,66819,97120,84221,80822,09722,48222,865
23,19122,97U22,99923,581;23,11023,030
22,27722,1;8222,5U823,27123,83521;, 550
21;, 217
83-9
81^784.584.584.984.784.483.983.683.782.782.181.7
81*.383.581.581.1;80.880.8
79.879.979.780.781.183.7
83.7
28.236.831.031.932.433.133.833.933.633.734.835.935.936.036.1
36.636.336.337.136.U36.2
31;. 835.135.236.337.138.2
37.6
41,48035,46043,27243,85844,07544,44243,612
44,19444,53745,o4l45,75645,88246,19746,562
48,17947,72546,610"46,55146,23246,278
1*5,923kZ-99945,958l;6,58O1;6,865U8U8U
14,16019,17016,89617,58318,03018,65719,27219,51319,62119,93120,80^21,77422,06422,45122,832
23,15922,9U222,96723,55223,07822,998
22,24522,45022,51623,23923,8032U,518
24,185
35,55035,11041,67742,26841,47342,16242,36242,23742,96642,16543,15243,99943,99043,042U8
45,86345,587Wi, 588iiU,auU3,86343,873
U3,1O3U3,328l»3,0li8Wi,l);9liU,68lU5,788
U6,O17
11,97018,85015,34916,84816,94717,58418,42118,79810,97918,72419,79020,70721,02120,92421,492
21,73121,65U21,75922,28721,77721,826
20,91721,19221,21922,01022,52722,791
22,672
8,4507,0206,9536,6236,6296,2715,7915,6235,4965,4295,4795,2685,0374,802k,lh9
5,3695,050h,82hU,782U,5264,128
3,99514,009U,oioU,575h,7U95,325
$,399
1,0901,9301,3141,3381,3861,2261,2571,1701,0611,0671,2391,3061,1841,0421,087
1,4551,3071,1*181,31*31,071*
683
615610
8191,0881,531
1,U85
27,10028,09034,72535,64534,84435,89136,57136,61437,47036,73637,67338,73138,95238,24o3953UO
hO,k931*0,53739,761;39,76239,33739,71*1*
39,10839,31939,03839,57439,93240,462
U0,6l7
10,88016,92015,03615,51015,56116,35817,16417,62817,91817,65718,55119,4oi19,83719,08220,405
20,27620,3472O,3U20,9h$20,70321,01*1;
20,30120,58220,661;21,19121,1*3921,260
21,187
5,930350
1,5951,5902,6022,2801,2501,2171,2282,3721,8891,7571,8933,1552,473
2,3152,1382,0222,0072,3702,1*05
2,8212,6722,9102,1*312,181;2,696
2,501;
2,190320547735
1,0831,073
851715642
1,2071,0161,0671,0431,5261,3401,1*291,2881,2091,2651,3011,172
1,3281,2581,2961,2291,2761,727
1,513
14.31.03.73.65.95.12.92.82.85.34.23.84.16.85.3
U.84.5k.3k.3'5.15.2
6.15.86.35.2U.75.6
5.2
15.51.73.24.16.05.84.43.73.36.14.94.94.76.85.9
6.25.65.35.U5.65.1
6.05.6
i\5.1*7.0
6.3
U.95.3^.65.86.05.2
5.1U.65.3U.84.85.2
5.3
5.5.75.66.U5.86.1555.35.85.U5.25.9
5.6
8,0605,3io8,2428,2138,3548,4578,3228,5628,8409,1699,4309,^5
10,16410,67711,019
9,W*U9,956
11,113n,23311,601;11,612
12,25112,22312,31911,73011,5069,951
9,958
36,l4o33,28037,60837,52037,69737,72437,77038,20838,89339,23239,06238,80339,53539,99040,401
i;0,10240,3891*0,1*3739,922U0,U6UUO, 631;
la, 665la, 523la, 527UO,857UO,35639,712
U0,ll6
]See footnote 1, table A-l. 2See footnote 3, table A-l. 3See footnote 4, table A-l.
Digitized for FRASER http://fraser.stlouisfed.org/ Federal Reserve Bank of St. Louis

Table A-3: Euplmtit status if the mnstititiual pipilatiu, by aft aid sex
July i960
(Thousands of persons 14 years of age and over)
Age and sex
Total labor forceincluding Armed Forces
Percent ofnoninsti-tutional
population
Civilian labor force
Percent ofnoninsti-tutional
population
Employed
Agri-cul-ture
Nonagri-culturalindus-tries
UnemployedPercent
oflaborforce
Not in labor force
Keepinghouse
Inschool
Unableto
work
Total. 75,215 60.0 72,706 6,88$ 61,805 5.5
Male.
14 to 17 years..- -14 and 15 years.16 and 17 years.
18 to 24 years....18 and 19 years.20 to 24 years..
25 to 34 years...25 to 29 years.30 to 34 years.
35 to 44 years...35 to 39 years.40 to 44 years.
45 to 54 years45 to 49 years.....50 to 54 years... •
55 to 64 years55 to 59 years....60 to 64 years....
65 years and over...65 to 69 years....70 years and over.
Female.
14 to 17 years....14 and 15 years.16 and 17 years.
18 to 24 years....18 and 19 years.20 to 24 years..
25 to 34 years...25 to 29 years.30 to 34 years.
35 to 44 years...35 to 39 years.40 to 44 years.
45 to 54 years45 to 49 years....50 to 54 years... .
55 to 64 years55 to 59 years60 to 64 years....
65 years and over...65 to 69 years....70 years and over.
50,07^ 3^,798 1,773 12,257
50,998
2,9211,01*1,8777,1*992,l8»*5,315
10,9205,2375,683
11,351*5,9005,1*5**
9,6225A31M916,3993,6762,7232,2821,2511,031
2U,217
1,68153**
1,1*71*,1O71,1*622,61*5
1,9792,2265,1962,5192,677
5,2512,8382,1*132,9061,7371,169872520352
83>7 1*8,521 83*0 5,399 1*0,617 2,501* 5.2 9,958 73 61*8 1,091
51.537.365.392.087.3
97.697*398.097.898.O97.6
95.696.19^.986.792.180.1*33.11*6.72k.k
37.6
2,871*1,01*1*1,8306,1931,836l*,357
10,2381*,8215,1*17
10,9785,6635,315
9,5615,085M6
, 3 ^3,6722,7222,2821,2511,031
2t*,l85
51.137.36l*.790.585.293.0
97.597.097.997.797.997.6
95.696.19*.986.792.180.1*
as2»*.l*
37.6
81*23881*51*69I*2731*21
6903593318653901*75
9011*1*91*52819
252336
1,1*85
1,669561*
1,1051*,8621,2853,577
9i7l*,208l*,8639,7565,096l*,66O
8,3361*,1*723,861*5,3113,0982,2131,612935677
21,187
36292270636278358
1*77251*223358177181
321*161*160261*128
6**18
1,513
12.68.8
ll*.810.315.18.2
1*.75.3l*.l3.33.13.1*
3.1*3.23.6l*.l3.55.03.65.11.8
6.3
2,7531,756
319329
26311*811525U122132
1*1*5206239979317662
1*,6151,1*303,185
1*0,116
826
7
3118333
3»*, 725
30711*815921*09511*5
8260221061*
9
1*
598
30.619.81*1.151.059.61*7.2
36.636.137.11*2.539.81*5.5
1*9.550.1*1*8.536.11*0.63L.110.316.96.6
1,681531*
1,11*7l*,0911,1*562,635
1*,1961,9732,2235,1912,5162,675
5,21*92,8372,1*122,9061,7371,169
872520352
30.619.81*1.150.959.51*7.1
36.636.O37.01*2.539.71*5.5
1*9.550.31*8.536.11*0.631.110.316.96.6
21*713810916573
21086
121*293139151*
29I*1611331911058681*
5133
1,21*0
357883
3,1*971,1962,301
3,7011,7351,966l*,61*22,2552,387
l*,7262,5502,1762,6l81,5721,01*6
763l*5l*309
19339
151*1*2918721*2
285152133257122135
2281261029659
2ll*10
11.57.313.510.512.89.2
6,87.76.05.01*.85.1
l*.3
l*.23*?3.1*3.22.82.72.7
3,8082,161*1,61*1*3,91*7992
2,955
7,2783,5003,7787,0213,8163,205
5,3622,7982,561*5,1352,51*2,5917,5652,5635,002
518ll*l*371*
3,321587
7,1093,1*023,7076,8813,7273A51*
5,1992,7202,1*79l*l96i*2,1*722,1*926,7322,1*30l*,302
291*130161*238131107
31*221219ll*
5
116533
199
1021*7
17
5525
1*11*7
11*36380
2761211551*88125363682
1239
1
27ll*13311219
38182075301*5
1*8659
1*27
8,11*7
2,1*251,596
829380216161*
1196356
11*87375
28613»*152693188505
l*,O961,2992,797i*,in
2,981*1,8871,097
376267109
10761k6906327
113
§933951*
31*871*
271*NOTE: Total noninstitutional population may be obtained by summing total labor force and not in labor force; civilian nonlnstitu-
tional population by summing civilian labor force and not in labor force.Data include Alaska and Hawaii beginning 1960. (See footnote 4, table A-l.)
Table A-4: Eipliymt status if mall veterais if World War II ii the civiliai iniistititiiial pipilatin(In thousands)
Employment status Julyi960
Junei960
July1959
Total ,
Civilian labor forceEmployed
AgricultureNonagricultural industrie
Unemployed. ,
Not in labor force..,
ll*,i*59
13,573621
12,9521*85
1*01
1**,1*63
1M7713,63*
58713,037
**53
38»*
ll*,i*62
ll*.,09213,669
59513,071*
1*23
370
NOTE: Data include Alaska and Hawaii beginning 1960. (See footnote 4, table A-l. )
Digitized for FRASER http://fraser.stlouisfed.org/ Federal Reserve Bank of St. Louis
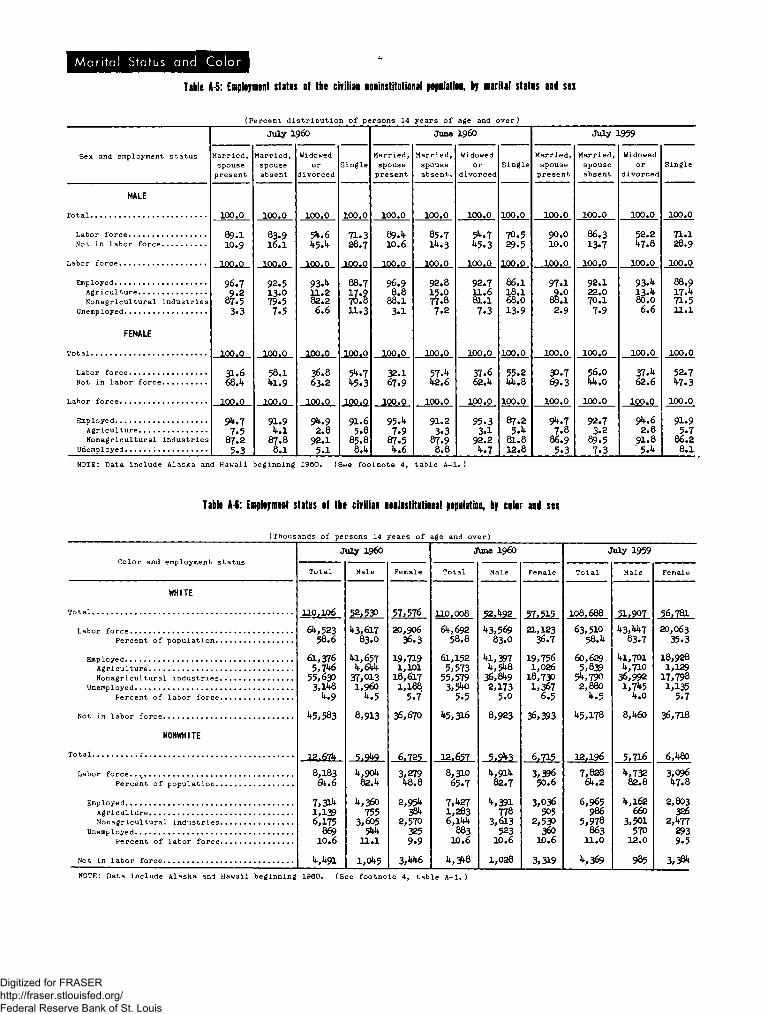
Marital Status and Color
Table A-5: Employment status of the civilian noninstitutional population, by marital status and sex
Sex and employment status
MALE
Total
Nonagricultural industries
FEMALE
Total
Labor force
Labor force
Nonagricultural industries
(Percent distribution of persons 14
July i960
Married,spouse
100.0
89.110.9
100.0
96.79.287.53.3
100.0
31.668.4
100.0
94.77.587.25.3
Married,spouse
100.0
83.916.1
J.Q0.0
92.513.079.57.5
100.0
58.141.9
100.0
91.94.187.88.1
Widowedor
divorced
100.0
54.645.4
p.00.0
93.411.282.26.6
100.0
36.863.2
100.0
94.92.892.15.1
Single
100.0
71.328.7
100.0
88.717.970.811.3
100.0
54.745.3
100.0
91.65.885.88.4
Married,spousepresent
100.0
89.410.6
100.0
96,98.888.13.1
100.0
32.167.9
100.0
95.47.987.54.6
years of
June
Married,spouseabsent.
100.0
85.7
14.3
100.092.815.077.87.2
100.0
2.1100.0
91.23.387.98.8
age and over)
I960
Widowedor
divorced
100.0
5^.745.3
100.0
92.7
7.3
100.037.662.4
100.0
95.33.192.24.7
Single
100.0
70.529.5
100.0
86.118.168.013.9
100.0
55.244.8
100.0
87.25.481.812.8
July 1959
Married,spousepresent
100.0
90.0
10.0
100.097.1
AS2.9
100.0
30.769.3
100.0
94.77.886.95.3
Married,spouseabsent
100.0
86.313.7
100.0
92.122.070.17-9
100.0
56.044.0
100.0
92.73.289.57.3
Widowedor
divorced
100.0
52.247.8
100.0
93.413.480.06.6
100.0
37.462.6
100.0
94.62.891.85.4
Single
100.0
71.128.9
100.0
88.917.471.511.1
100.0
52.747.3
100.0
91.95.786.28.1
NOTE: Data include Alaska and Hawaii beginning 1960. (See footnote 4, table A-l.)
Table A-6: Employment status of the civilian noninstitutional population, by color and sex
(Thousands of persons 14 years of age and over)
Color and employment status
July i960
Male Female
June i960 July 1959
Total Male Female
WHITE
Total
Labor forcePercent of population
Employed «AgricultureNonagricultural industries
Unemployed
Percent of labor force
Not in labor force
NONWHITE
Total .-
Labor force. . .̂Percent of population
EmployedAgricultureNonagricultural industries
UnemployedPercent of labor force
Not in labor force
NOTE: Data include Alaska and Hawaii beglnnini
110,106
64,52358.6
61,3765,746
55,6303,148
4.945,583
12,674
8,18364.6
7 , 3 *1,1396,175
86910.6
4,491
43,61783.O
41,6574,644
37,0131,960
4.58,913
5,949
4,90482.4
^,360755
3,605544
11.1
1,045
57,576
20,90636.3
19,7191,101
18,6171,1881
5.736,670
6,725
3,27948.8
2,954384
2,5703259.9
110,00864,692
58.8
61,1525,573
55,5793,5to
5.51*5,316
12,657
8,31065.7
7,4271,2836,144
88310.6
4,348
43,56983.0
41,3974,548
36,8492,173
5.08,923
5,943
,91^82.7
,39778
3,613523
10.6
1,028
21,12336.7
19,7561,026
18,7301,367
6.5
36,393
6,715
3,39650.6
3,036505
2,530360
10.6
3,319
108,688
63,5io58.4
60,6295,839
5^,7902,880
4.545,178
43,44783.7
41,7014,710
36,9921,745
4.08,460
5,716
4,369
4,73282.8
4,162660
3,501570
12.0
985
56,781
20,06335.3
18,9281,129
17,7981,135
5.7
36,718
6,480
3,09647.8
2,803326
2,4772939.5
3,384
,g I960. (See footnote 4, table A-l. )
Digitized for FRASER http://fraser.stlouisfed.org/ Federal Reserve Bank of St. Louis

.Table A-7: Employment status of the civilian noninstitutional population,
total and urban, by region
(Percent distribution of persons 14 years of age and over)
Region; Class of WorkerReasons Employed Persons
Not at Work
Region
July I960
Percentof pop-ulationin laborforce
Labor force
Employed
Agri-cul-ture
Nonagri-cultural'indus-tries
Unem-ployed
June I960
Percentof pop-ulationin laborforce
Labor force
Employed
Agri-cul-ture
Nonagri-culturalindus-tries
Unem-ployed
July 1959
Percentof pop-ulationin laborforce
Labor force
Employed
Agri-cul-ture
Nonagri-culturalindus-tries
Unem-ployed
Total'. 100.0 9.5 85.0 5.5 100.0 9.k 81;. 5 6.1 100.0 9.6 85.2 5.2
NortheastNorth Central.SouthWest
Urban.
59.li59.558.659.6
59.5
NortheastNorth Central.SouthWest
$9.359.360.059.7
100.0100.0100.0100.0
100.0
100.0100.0100.0100.0
2.711.613.79.3
91.283.780.685.1
92.5
.7
.92.12.7
92.993.391.991.3
6.1U.75.75.6
6.1
6.U5.86.06.0
59.759.859.259.3
59.959.960.059.h
100.0100.0100.0100.0
100.0
100.0100.0100.0100.0
2.3XL.l
8.7
1.3
.5i.o1.92.5
91.083.579.585.1
92.0
6.75.U6.16.2
6.7
59.359.358.1;59.h
59.2
100.0100.0100.0100.0
100.0
2.912.013.19.8
1.1
91.083.781.185.9
93.0
92.692.691.191.2
6.96.1;7.06.3
59.h58.559.858.9
100.0100.0100.0100.0
.51.01.91.8
93.093.891.393.6
6.1k.35.8k.3
6.55.26.8k.6
NOTE: Data include Alaska and Hawaii beginning 1960. (See footnote 4, table A-l.)
Table A-8: Employed persons, by type of industry, class of worker, and sex
(Thousands of persons 14 years of age and over)
Type of industryand class of worker
July i960 June I960
Male Female
July 195?
Total.
AgricultureWage and salary workers.Self-employed workers...Unpaid family workers...
Nonagricultural industriesWage and salary workers
In private households \Government workersOther wage and salary workers
Self-employed workersUnpaid family workers
6,8852,hO32,9621,520
61,801;5U,8U5
2,5897,U66
14i,79O6,261;
695
U6.O17
5,3991,9272,81;3
629
U0,6l835,5k7
397U,56O
30,5901;,938
132
I,t86kit119891
21,18619,298
2,1912,906
lit, 2011,325
563
6,8562,3232,921;1,610
61,7225k,5%92,6307,559
l*U,Uoo6, fc30
703
U5,788
5,3251,8772,801
6kl
35,280388
U,56830,321;5,Ol;9
131;
22,791 67,591; U5,863 21,731
1,531kh6122963
21,26019,3102,2lt22,991
U4,O771,381
569
6,8252,114.23A37
5UU
60.76953,7872,6227,288
U3,8786,336
61.6
5,3691,7682,997
603
kO,k9335,361.
k63U,6oo
30,3025,008
120
373l!;091a
20,276l8,!;22
2,1602,688
13,57U1,328
526NOTE: Data include Alaska and Hawaii beginning 1960. (See footnote 4, table A-l. )
Table A-9: Employed persons with a job but not at work, by reason for not working and pay status
Reason for not working
Total
Industrial disputeVacationIllness
Total
7,291
• 2338
5,692783756
July
(Thousands of persons 14 years of a
I960
Nonagricultural
Total
7,136
2038
5,636729713
Wag<
salary
Number
6,7H
1638
5M5625618
industries
i andworkers
Percentpaid
70.9
(1)
80.533.829.8
ie and over)
June I960
Total
3,772
1958
2,293767631;
Nonagricultural J
Total
3,691
m58
2,275726617
Wagesalary
Number
3,323
758
2,nJa639U78
industries
J andworkers
Percentpaid
60.5
77.331.832.2
Total
7,085
79196
5,na880789
July 1959
Nonagricultural
Total
6,890
ko196
5,1058037U6
Wagsalary
Number
6,h37
26196
U,863719632
industries
; andworkers
Percentpaid
68.8
81.935.529.0
1 Percent not shown where base i s less than 100,000.NOTE: Persons on temporary (less than 30-day) layoff and persons scheduled to start new wage and salary jobs within 30 days have
not been included in the category "With a job but not at work" since January 1957. Most of these persons are now classified as un-employed. These groups numbered 185,000 and 147,000, respectively, in July i960.
Data include Alaska and Hawaii beginning 1960. (See footnote 4, table A-l.)
Digitized for FRASER http://fraser.stlouisfed.org/ Federal Reserve Bank of St. Louis

Table A-10: Occipatiu i m p if tMliyri ptrsiis, by sei
(Thousands of persons 14 years of age and over)
Occupation groupMale 'em ale
Total Male
Percentdistribution
Fe-male
Total Male
Percentdistribution
male
Total. 68,689 i6,017 22,672 100.0 .00.0 100.0 67,5ft U5,863 21,731 100.0 100.0 .00.0
Professional, technical, and" kindred workersMedical and other health workersTeachers, except collegeOther professional, technical, and kindred workers
Farmers and farm managersManagers, officials, and proprietors, except farm...Salaried workersSelf-employed workers in retail tradeSelf-employed workers, except retail trade
Clerical and kindred workersStenographers, typists, and secretariesOther clerical and kindred workers
Sales workers.Retail trade ••Other sales workers
Craftsmen, foremen, and kindred workersCarpenters.Construction craftsmen, except carpentersMechanics and repairmen..,Metal craftsmen, except mechanicsOther craftsmen and kindred workersForemen, not elsewhere classified
Operatives and kindred workersDrivers and deliverymen.Other operatives and kindred workers:Durable goods manufacturing.........Nondurable goods manufacturingOther industries
Private household workersService workers, except private household
Protective service workersWaiters, cooks, and bartenders ,Other service workers
Farm laborers and foremenPaid workersUnpaid family workers
Laborers, except farm and mine.ConstructionManufacturingOther industries^
1,2891,175U,5j82,9506,9U03,1*571,7361,7U7
9,9072,3857,522U,Uo52,5971,808
8,852871
1,9281,9921,1611,7531,H*7
12,2762,U71
3,U583,1**52,872
2,1956,305786
1,7193,800
3,5782,O7U1,50*U,2l*31,0331,1262.O8U
U,56O539301
3,7202,8335,8522,9U21,370l ,5Uo
3,1082,6561,0691,587
8,625870
1,911*1,9831,31*81,6391,071
8,81*12,1*50
2,5391,6972,155
1*53,012
71*8515
1,71*9
2,2661,0*3
623U,l591,0271,087Ad5
2,1*817U987U858117
1,088515366207
6,7362,3231*,1*131,7501,529
221
2271
H*8
11*Hi*
76
3,1*3521
9201,778
716
2,1503,293
381,201*2,051
1,3111*31880
39J*0
10.31.91.76.71*.3
10.15.02.52.5
11.06.1*3.82.6
12.91.32.82.91.72.61.7
17.93.6
5.05.11*.2
3.29.21.12.5$$
5.23.02.26.21.51.6
9.91.2
.78.16.2
12.76.U3.03.3
6.9.1
6.85.82.33.1*
18.71.9U.21*.32.53.62.3
19.25.3
S.S3.71*.7
.16.51.61.13.8
1*.93.61.1*9.02.22.1*
_y*
10.93.33.9
1*.82.31.6
.9
29.710.219.57.76.71.0
1.0(1)
.1(1)
.1
.5
.3
15.2.1
*.l7.83.2
sfcf.2
5.39.05.81.93.9
.1*(1)
.2
.2
6,7711,2261,0761,1*693,1127,0083,1*81*1,7691,755
7,059U,U682,6161,852
8,81*2909
1,891*2,0881,1001,7291,122
12,2122,1*1*3
3,5893,3062,871*
2,2015,981
7551,751*3,1*72
3,1*131,881*1,5291*,2!*6
931*1,2582,051*
1*,1*63523251*
3,6862,9815,8762,9571,3961,523
2,9192,7621,1081,651*
8,638909
1,8812,0691,0921,6511,036
8,996
2,1*31*
2,7231,6212,218
2,8237191*97
1,60?
2,1521 5 5 6
5961 ,131
9311,1872,013
2,309701*822
783131
1,131527373231
6,31*52,205l*,H*01,7061,508
198
20U
11*19
77886
3,2169
8661,685
656
2,1553 , * 8
1,2561,866
1,260327933U5
k70
J
10.01.81.66.6i*.6
10.1*5.22.62.6
13.83.1*
10.1*6.63.92.7
13.11.32.83.11.62.61.7
18.13.6
5.3h.9U.3
3.38.81.12.65.1
5.12.82.36.31.1*1.9
9.71.1
.68.06.5
12.76.1*3.03.3
6.6.2
6.1*6.02.1*3.6
18.92.0l*.lU.52.1*3.62.3
19.55.3
$.93.5U.8
.16.21.61.13.5
1*.73.1*1.39.02.02.6
_y*_
10.63.23.8
i5.22.1*1.71.1
29.210.119.1
7.86U9~
.9
1.0
.1
. 1(1)
.1*
.1*
11*. 8(1)
U.O7.83.0
9.91U.6
.25.88.6
5.81.5U.3
i1Less than 0.05. NOTE: Data include Alaska and Hawaii beginning 1960. (See footnote 4, table A-l. )
Table A-11: Majir iccipatin i m p if eapkytd pirsus, by cttor mi sei
(Percent distribution of persons 14 years of age and over)
Major occupation groupJuly
White
Total
61,376
100*0
11.0l*.l*
11.015.37.0
13.717.71.98.2h.$5.2
Male
1*1,657100.0
10.66.3
13.77.06.2
19.718.8
.15.71*.37.5
Female
19,719100.0
11.8.5
5.232.88.61.1
15.1*5.8
13.51*.8
.3
I960Nonwhite
Total
7,311*100.0
U.23.2
2.57.01.US.9
1 9 . 11U.01 7 . 111 .61U.2
Male
U,36O
100.0
3.U5.o2.95.81.2
9.S23 .1
.31U.311.023.U
Female
2,95U100.0
5.3.5
1.98.81.6.5
1 3 . 13U.121.212.U
.6
Total
60,629100.0
10.7U.7
11.311*. 87.2
13.917.81.97.9k.$5.3
White
Male
1*1,701
100.0
10.U6.6
13.86.76.5
19.719.2
.15.3U.27.U
July
Female
18,928
100.0
11.5.6
5.732.58.81.0
Hw86.0
13.65.1.5
.959Nonwhite
Total
6,965100.0
3.73.7
2.3$.$1.56.1
20.01U.91 7 . 110.015.2
Male
U,162
100.0
2.95.7
2.UU.61.U9.9
23.$
n*.u9.h
25.1
Female
2,803100.0
U.9•8
2.06.81.6
.uXU.936.221.010.8
.6
Tota I thous ands.
Percent,
Professional, technical, and kindred workers
Farmers and farm managersManagers, officials, and proprietors,except farm
Clerical and kindred workersSales workersCraftsmen, foremen, and kindred workersOperatives and kindred workersPrivate household workersService workers, except private household...Farm laborers and foremenLaborers, except farm and mine
NOTE: Data include Alaska and Hawaii beginning 1960. (See footnote 4, table A-l.)
Digitized for FRASER http://fraser.stlouisfed.org/ Federal Reserve Bank of St. Louis

Table A-12: Unemployed persons, by duration of anenployment
lemployment
(Thousands of persons 14 years of age and over)
Duration of unemployment
Total.
Less than 5 weeks...Less than 1 week..1 week2 weeks3 weeks4 weeks
5 to 14 weeks5 to 6 weeks7 to 10 weeks11 to 14 weeks....
15 weeks and over...15 to 26 weeks....27 weeks and over.
Average duration....
JulvNumber
4,017
1,87118385550461436
1,3115325012788344184i611.8
I960Percent
100.0
1*6.6
.49.6
13.712,010.932.713.212.56.920.810.410*. 4-
JuneI960
4,423
2,6548675877763539995428341225981642039610.3
MayI960
3.459
1,63812470k6k3793149002723722569205094n12.8
Apr.I960
3.660
1,58025443456332325876213354309
1,204705499
14.3
i960
4.206
1,51612395429361319
1,474294561619
1,21771550214.2
Feb.I960
3.931
1,476284l4413317304
1,4914io68539696453343113.1
Jan.I960
4.149
1,90916387506516483
1,330341589400910441h6$12.7
Dec.1959
3.577
1,68311400567422284
1,08330552825081138143012.9
Nov.1959
3.670
1,84623393601U63366
I,o4o32044427678435642812.4
Oct.1959
3.272
1,6072838951838828493926938228872633339313.1
Sept.1959
3.230
1,539314o647137026195525740529373634039613.7
Aug.1959
3.426
1,56725451435358298
1,076282504290783290493
13.8
July1959
3.744
1,77316450506420381
1,154440k63251817302515
13.4NOTE: Data include Alaska and Hawaii beginning 1960. (See footnote 4, table A-l. )
Table A-13: Unemployed persons, by major occipation croup and industry group(Persons 14 years of age and over)
Occupation and industryJuly
Percentdistribution
.960Unemployment
rate1
June I960Percent Unemployment
distribution rate1
July 1959Percent Unemployment
distribution rate*
MAJOR OCCUPATION GROUP
Total. 100.0 5.5 100.0 6.1 100.0 5.2
Professional, technical, and kindred workersFarmers and farm managers....-Managers, officials, and proprietors, except farm.Clerical and kindrred workers.;Sales workers 1Craftsmen, foremen, and kindred workersOperatives and kindred workersPrivate household workersService workers, except private householdFarm laborers and foremen *Laborers, except farm and mineNo previous work experience
INDUSTRY GROUP
Total
3.0.1
1.89.94.49.6
25.43.310.03.313.216.1
100.0
1.7.11.03.9
?-94.27.75.66.03.511.1
5.5
4.2.2
2.29.14.38.222.23.09.23.311.223.0
100.0
2.5
l.h3.94.13.97.45.66.33.91C.7
6.1
3.6.2
2.68.94.38.123.I3.8io.44.o12.918.1
100.0
2.0
l'.43.43.53.36.66.16.14.210.2
5.2
Experienced wage and salary workersAgricultureNonagricultural industries * , . .Mining, forestry, and fisheriesConstruct ionManufacturing
Durable goodsPrimary metal industriesFabricated metal productsMachinery (except electrical)Electrical machineryTransportation equipmentMotor vehicles and equipment ,All other transportation equipment
Other durable goods industriesNondurable goods
Food and kindred productsTextile-mill productsApparel and other finished textile productsOther nondurable goods industries
Transportation and public utilitiesRailroads and railway expressOther transportationCommunication and other public utilities....
Wholesale and retail tradeFinance, insurance, and real estateService industries
Professional servicesAll other service industries
Public administration
81.23.7
77.51.69.228.315.73.31.61.92.13.9
1.42.912.62.51.73.54.94.81.22.11.516.01.414.54.110.41.9
5.45.85.48.58.66.26.310.5
5.77.710.55.25.16.25.66.610.64.94.14.55.03.15.72.14.52.66.32.3
74.43.570.91.37.924.013.22.01.32.01.83.11.71.53.010.82.41.22.94.24.41.22.01.216.01.414.34.89-51.6
5.56.35.48.28.45.95.87.25.05.1.5.46.57.75.65.65.96.15.79.64.74.05.05.02.66.42.44.83.26.62.2
79.84.775.11.99.423.712.61.61.41.51.33.11.81.33.711.12.91.73.23.3^ 51.32.3
16.51.615.74.910.81.7
5.17.65.010.18.15.04.74.54.53.53.85.47.23.95.75.56.86.110.03.33.53.95.21.85.72.44.73.16.12.0
Percent of labor force in each group who were unemplprevious work experience, not shown separately. NOTE:
oyed. 2Includes self-employed,Data include Alaska and Hawaii
unpaid family workersbeginning 1960. (See
, and persons with nofootnote 4, table A-l. )
561163 O - 60 - 3
Digitized for FRASER http://fraser.stlouisfed.org/ Federal Reserve Bank of St. Louis

Long-Term Unemployment
Table A-14: Persons unemployed 15 weeks and over, by selected characteristics
(Persons 14 years of age and over)
Characteristics Percentdistribution
July i960
Percent ofunemployedin eachgroup
June i960
Percentdistribution
Percent ofunemployedin eachgroup
July 1959
Percentdistribution
Percent ofunemployedin eachgroup
AGE AND SEX
Total.
14 years and over14 to 17 years18 and 19 years20 to 24 years25 to 34 years...35 to 44 years45 to 64 years65 years and over14 years and over14 to 19 years20 to 24 years25 to 34 years35 to 44 years -45 years and over
MARITAL STATUS AND SEX
Total.
Male: Married, wi-fe present....SingleOther
Female: Married, husband present.SingleOther
COLOR AND SEX
White.. . .Male...Female.
Nonwhite.Male...Female.
MAJOR OCCUPATION GROUPTotal.
Professional, technical, and kindred workersFarmers and farm managers .Managers, officials, and proprietors, except farmClerical and kindred workers ,Sales workersCraftsmen, foremen, and kindred workers •.,Operatives and kindred workersPrivate household workersService workers, except private household ,Farm laborers and foremen ,Laborers, except farm and mine ,
No previous work experience
INDUSTRY GROUP
Total2
Experienced wage and salary workersAgriculture ,Nonagricultural industries ,
Mining, forestry, and fisheriesConstruction ,Manufacturing
Durable goods #.Nondurable goods ,
Transportation and public utilities ,Wholesale and retail trade ,Service and finance, insurance, and real estatePublic administration
100.0
66,2,3.8,
12,11,24,
3'33.
2,5.7.7
10,
100.0
37.421.37.5
18.67.97.3
100.0
73.647.825.826.418.57.9
100.0
2.3.2
2.39.83.78.9
35.52.89.11.6
17.7
6.2
100.0
89.82.4
87.44.79.2
38.721.916.86.3
12.613.22.8
20.8
22.14.7
10.819.821.026.835-4(1)18.66.3
18.621.124.525.5
20.8
26.415.536.223.012.021.1
20.8
19.520.418.125.328.320.3
20.8
16.0(1)(1)20.717.519.129.117.619.09.9
27.9
8.0
20.8
23.013 .k23.4(1)20.928.529.127.727.316.317.3(1)
100.0 18.4
68.74.02.67.28.5
13.727.2
5.531.33.56.64.96.1
10.1
100.0
20.95.76.4
17.416.330.739.8(1)14.84.4
19.715.922.126.318.4
35.823.4
9.514.09.08.2
100.0
26.513.740.419.58.7
23.4
18.4
75.752.623.124.316.0
8.3
100.0
17.519.813.822.525.018.9
18.4
2.4.1
3.510.53.9
11.629.6
1.710.31.8
16.6
7.7
100.0
10.8(1)(1)21.416.826.324,10,20.710,27-
6.2
18.4
88.42.0
86.43.3
n.532.920.212.77.8
15.213.62.1
21.910.222.5(1)27.025.428.321.833.217.515.9(1)
100.0
68.92.43-8
13.324.3
5.431.03.53.54.58.1
11.4
100.0
37.723.08.3
15.08.87.2
100.0
76.351.025.323.817.86.0
100.0
3.7.2
4.311.72.99.7
29.01.3
11.32.2
16.1
7.6
100.0
89.82.7
87.13.1
11.332.018.7
17.813.52.6
21.8
24.45.1
13.518.727.032.835.242.317.87.6
14.616.326.525.1
21.8
29.217.537.218.814.621.1
21.8
21.824.018.322.625.616.7
21.8
21.9
36.528.814.926.527.67.6
24.012.027.3
9.1
21.8
24.412.525.2(1)26.329.132.025.833.323.516.9(1)
Percent not shown where base is less than 100,000. 2Includes self-employed, unpaid family workwork experience, not shown separately. NOTE: Data include Alaska and Hawaii beginning 1960. (Se
ers, and pee footnote
rsons with4, table A-
no previous1. )
Digitized for FRASER http://fraser.stlouisfed.org/ Federal Reserve Bank of St. Louis

Table A15: Persons at work, by hours worked, type of industry, and class of worker
July i960
(Percent distribution of persons 14 years of age and over)
Hours worked TotalWage andsalaryworkers
Agriculture
Self-employedworkers
Unpaidfamilyworkers
Nonagricultural industriesWage and salary workers
Privatehouse-holds
Self-employedworkers
Unpaidfamilyworkers
Total at work...thousandsPercent
61,398100.0
6,7291QQ.Q
2,363100.0
2,846100.0
1,520100.0
54,668100.0
48,1341QQ.Q
2,4661QQ«Q
5,818
1QQ,Q
39,850100.0
5,839100,0
1 to 34 hours1 to 14 hours15 to 21 hours22 to 29 hours30 to 34 hours
35 to 40 hours35 to 39 hours40 hours.4
41 hours and over41 to 47 hours48 hours49 hours and over
49 to 54 hours55 to 59 hours60 to 69 hours70 hours and over
18.05.14.93.84.247.36.341.034.77.56.620.66.02.85.95.9
26.36.010.35.64.414.55.98.659.04.74.949.48.23.615.122.5
Average hours 41.7 49.1
33.910.411.46.35.817.16.410.748.97.17.034.89.03.513.39.041.5
15.45.54.13.42.49.83.76.174.92.83.668.57.42.919.438.8
58.7
35.4
20.38.96.219.29.110.145.54.74.236.68.45.110.113.0
43.1
17.04.9
H3.64.251.36.345.031.77.86.817.15.82.74.83.840.8
16.64.84.03.54.355.66.649.027.97.96.713.35.22.53.32.3
39.9
59.634.011.58.16.021.26.015.219.15.73.99.53.42.11.62.4
26.8
10.31.92.72.23.567.44.662.822.27.14.610.53.42.02.52.6
41.0
14.93.43.83.44.355.96.949.O29.38.27.213.95.62.53.52.3
40.6
17.86.94.33.23.420.54.116.461.77.37.746.710.44.516.415.4
48.6
696100.0
39.8
20.112.07.720.57.513.039.58.44.826.35.12.47.811.0
40.7
NOTE: Data include Alaska and Hawaii beginning 1960. (See footnote 4, table A-l.)
Table A16: Persons employed in nonagricultural industries, by full-time or part-time status and reason for part time
(Thousands of persons 14 years of age and over)
Hours worked, usual status, andreason working part time
Julyi960
61,805
7,13654,66817,30428,0769,288
1,1208615814062
24.9
Junei960
6l,722
3,69158,03218,04129,83810,152
1,3711,024
6523348
25.O
July1959
60,769
6,89053,87917,43827,4259,016
8636425010961
23.6
Hours worked, usual status, andreason working part time
Julyi960
Junei960
July1959
Total.
With a job but not at workAt work.
41 hours and over35 to 40 hours1 to 34 hoursUsually work full time on present job:Part time for economic reasons
Slack workMaterial shortages or repairs...New job startedJob terminated
Average hours
Usually work full time—ContinuedPart time for other reasonsOwn illnessVacationBad weatherHolidayAll other
Usually work part time on present job:For economic reasons1
Average hoursFor other reasons
Average hours for total at work
1,76643045723026623
1,66917.2
4,735
40.8
1,96952032937683661
1,54717.35,266
40.6
1,9804124093601
798
1,72617.44,447
40.8
Primarily includes persons who could find only part-time work. NOTE: Data include Alaska and Hawaii beginning 1960. (See foot-note 4, table A-l. )
Table A17: Wage and salary workers, by full-time or part-time status and major industry group
July i960
(Percent distribution of persons 14 years of age and over)
Major industry groupTotalat
work
100.0
100.0100.0100.0100.0100.0100.0100.0100.0100.0100.0100.0100.0100.0
Total
33.9
16.618.010.08.211.97.319.611.429.925 X15.739.09.1
1 to 34 hours
Usually work fulltime on present job
Part timefor economic
reasons
2.5
2.15.33.13.13.01.51.1.91.31.1.4
1.81,4
Part timefor otherreasons
4.9
3.26.23.43.63.12.62.02.33.18.62.52.54.1
Usually work parttime on present job
Foreconomicreasons
11.8
3.33.61.2.7
1.81.24.8.96.8.3
1.311.2.7
Forother
reasons
14.7
8.02.92.3.8
4.02.011.77.318.715.411.523.52.9
35 to39
hours
6.4
6.65.06.23.110.03.95.620.07.413.26.5,6.74.0
40hours
10.7
49.051.060.566.753.161.135.446.036.642.952.526.061.9
41
Total
48.9
27.925.923.422.125.027.939.422.426.318.425.228.324.9
hours
41 to47
hours
7.1
7.98.57.26.77.88.39.97.97.67.86.78.05.2
and over
48
rs
7.0
6.75.16.15.86.45.910.42.86.22.85.87.16.0
49ours
ver
34.8
13.312.310.19.610.813.719.111.712.57.812.713.213.7
Agriculture.
Nonagricultural industriesConstructionManufacturing
Durable goodsNondurable goods
Transportation and public utilitiesWholesale and retail tradeFinance, insurance, and real estateService industries
Educational servicesOther professional servicesAll other service industries
All other industries
NOTE: Data include Alaska and Hawaii beginning 1960. (See footnote 4, table A-l.]
Digitized for FRASER http://fraser.stlouisfed.org/ Federal Reserve Bank of St. Louis

10
Table M l : Persons at wirk, by foil-tine or part tine statis and Major occupation froipJuly i960
Major occupation group
Total
Professional, technical, and kindred
Managers, officials, and proprietors,
Craftsmen, foremen, and kindred
Service workers, except private
Percent distribution
Totalat
work
100.0
100.0100.0
100.0100.0100.0
100.0100.0100.0
100.0100.0100.0
of persons 14 years of age and
1 to 34 hours
Total
18.0
14.614.9
7.413.624.8
9.913.558.4
23.8
35-927.4
Usually work fulltime on present job
foreconomicreasons
2.0
0.42.1
.7
.6•9
2.74.31.1
1.32.05.2
Part timefor other
reasons
3*92.6
2.62.62.1
3.83.92.5
2.44.14.5
Usually \time on pi
Foreconomic>
3.2
1.3.1
.41.43-9
1.42.0
17.7
4.6
7.49.0
</ork part-esent job
other
9.5
9.010.1
3*79.0
17.9
2.0
3.337.1
15.522.4
8.7
over)
35 to39
6.3
3.8
3.812.2
5.7
4.05.96.8
5.0
7.64.2
40
41.0
47.36.2
26.358.8
31.7
54.450.415.2
37.69.046.3
41
^4.7
31.175.1
62.5.15.4^7.6
31.730.119.6
33.547.522.1
hours
41 to47
hours
7«?
7.62.7
10.1
6.78.9
9.17.46.1
7.06.17.0
and over
hours"
6.6
5.23.6
8.8
3.47.5
8.07.54.2
10.35.74.8
49
andover
20.6
18.368.8
43.6
5.321.2
14.615.2
9.3
16.2
35.710.3
Aver-age
hours
41.7
41.6
58.9
50.338.539.3
41.8
41.527.4
39.841.9
36.5
NOTE: Data include Alaska and Hawaii beginning 1960. (See footnote 4, table A-l.)
Table A-19: Persons at work in nonagricuttiral industries, by foil-tine and part-tine status and selected characteristicsJuly i960
(Percent distribution o f persons 14 years
Characteristics
AGE AND SEX
Total
MARITAL STATUS AND SEX
Married, wife present
Married, husband present
COLOR AND SEX
White
MaleFemale
TotaLat work
(In thou-sands )
54.668
36,5911,641
4,5638,2478,73312,0111,398
18,0771,1943,1353,1243,9006,044680
6,72327,9931,875
4,9019,2983,878
33,285
15,801
5.5823,306
2,276
Percent
100.0
100.0100.0100.0100.0100.0100.0100.0
100.0100.0100.0100.0100.0100.0100.0
100.0100.0100.0
100.0100.0100.0
100.0100.0
100.0
100.0100.0
100.0
of age and over)
1 to 34 hours
Total
17.0
12.159.812.4
7.37.89.232.9
27.157.1I8.324.1
26.925.445.0
25.0
8.714.8
25.4
29.523.6
16.011.3
25.9
25.6
I8.9
35.5
Usually work fulltime on present jobPart time
for economicreasons
2.0
2.21.72.61.92.32.21.4
1.81.11.42.2
2.31.8.8
2.12.13.3
1.12.22.0
1.8l.b1.7
4.35.42.8
Part timefor otherreasons
3.2
3.21.82.82.93.53.62.1
3.31.13.03.24.23.62.2
2.53.33.4
3.13.63.0
3.1
3.13.2
4.44.44.5
Usually work parttime on present job
Foreconomicreasons
3.1
2.520.4
3.41.01.1
1.53.5
4.317.8
4.32.53.23.23.7
8.21.0
3.7
7.12.64.6
2.52.1
3.3
7.95.810.9
Forotherreasons
_8/L_4.235.93.61.5.91.925.9
17.737.19.616.217.216.8
38.3
12.2
2.3
4.4
14.121.114.0
8.64.3
17.7
9.03.3
IT. 3
35 to40
hours
50.024.152.151.850.852.040.8
54.127.867.458.354.4
52.730.9
47.950.451.5
59.0
52.551.8
51.4
49.6
55.3
50.754.0
45.7
41
over
2L.7
38.O16.135.440.8
41.538.926.3
18.8
15.114.417.618.821.824.1
27.140.933.7
15.518.024.6
32.6
39.118.8
23.727.1
18.7
408
43.127.142.144.545.044.136.4
36.326.8
37.136.536.737.6
33.3
37.744.541.5
35.535.938.1
41.2
43.436.6
37.4
34.1
NOTE: Data include Alaska and Hawaii beginning 1960. (See footnote 4, table A-l. )
Digitized for FRASER http://fraser.stlouisfed.org/ Federal Reserve Bank of St. Louis

11Historical Industry Employment
Table B-1: Employees in nonagricultural establishments, by industry division
1919 to date(In thousands)
Year and month
1919.1920.1921.1922.1923.
190*.1925.1926.1927.1928.
1929.1930.1931.1932.1933.
193*.1935.1936.,1937.1938.
1939.19*»0.19*1.19*2.19*3.
19**.19*5.
19*7.19*8.
19*9.1950..1951.1952.1953-
195*.1955.1956.
1959 1
1959 2
1959: JulyAugust.••SeptemberOctober..November•December.
I960: January*.February.March....April....MayJune••••<
July.
26,82927,08824,12525,569-28,128
27,77028,50529,53929,69129,710
31,0*129,1*326,38323,37723,1*66
25,69926,79228,80230,71828,902
30,31132,05836,22039,779*2,106
*1,53**O,037*1,287*3,*6244,448
*3,315**,738*7,3*748,303^9,681
48,43150,05651,76652,16250,5*3
51,97552,205
52,59652,31652,88952,80253,02153,989
52,30252,28452,39853,07653,19553,535
53,171
Mining
1,1241,230953920
1,203
1,0921,0801,1761,1051,0*1
1,0781,000864722735
874888937
1,006882
8459169*7983917
883826
%982
918889916885852
777
809721
676677
712641622622661669
659670667678679681
658
Contractconstruction
1,021848
1,0121,1851,229
1,3211,4461,5551,6081,606
1,4971,3721,214
970809
862912
1,1*51,1121,055
1,1501,29*1,7902,1701,567
1,09*1,1321,6611,9822,169
2,1652,3332,6032,63*2,622
2,5932,759
2^648
2,7672,788
3,0603,1323,0682,9852,8772,719
2,4722,4082,3312,6112,8533,008
3,129
Manufacturing
10,53l!10,5348,1328,98610,155
9,5239,7869,9979,8399,786
10,5349,4018,0216,7977,258
8,3*68,9079,653
10,6069,253
10,07810,78012,97*15,05117,381
17,11115,302l*,*6l15,29015,321
1*,1781*,96716,10416,33417,238
1^,99516,56316,90316,78215,468
16,16816,199
16,45616,21216,40016,22616,30716,510
16,49816,54816,50516,40816,37816,453
16,295
Transportationand publicutilities
3,7113,9983,4593,5053,882
3,8063,8243,9403,8913,822
3,9073,6753,2432,8042,659
2,7362,7712,9563,114
8to
2,9123,0133,2483,4333,619
3,7983,8724,0234,1224,i4l
3,9*93,977*,166*,185*,221
*,009*,062*,l6l*,1513,903
3,9023,921
3,9693,9*23,9*73,9293,9313,958
3,9003,9053,9183,9363,9*33,962
3,953
Wholesale andretail trade
4,6644,6234,7545,0845,494
5,6265,8106,0336,1656,137
6,1*016,0645,531*,907*,999
5,5525,6926,0766,5436,453
6,6126,9407,4167,3337,189
7,2607,5228,6029,1969,519
9,5139,64510,01210,28110,527
10,52010,8^11,22111,302n,i4i
11,38511,439
11,37911,41511,51911,60511,77812,402
11,47811,38211,37911,67511,59911,676
11,643
Finance,insurance,and realestate
1,0501,1101,0971,0791,123
1,1631,1661,2351,2951,360
1,4311,3981,3331,2701,225
1,2471,2621,3131,3551,347
1,3991,4361,480l,*69l,*35
1,4091,4281,6191,6721,7*1
1,7651,8241,8921,9672,038
2,1222,2192,3082,3482,374
2,4252,433
2,4832,4822,4602,4492,4462,446
2,4372,4472,4522,4712,4782,50*
2,536
Service andmiscellaneous
2,05*2,1422,1872,2682,431
2,5162,5912,7552,8712,962
3,1273,0842,9132,6822,6i4
2,7842,8833,0603,2333,196
3,3213,4773,7053,8573,919
3,93*4,0114,4744,7834,925
4,9725,0775,2645,*ll5,538
5,6645,9166,1606,3366,395
6,5256,558
6,6376,6166,6516,6486,6276,581
6,5076,5186,5456,6796,7526,781
6,757
Government
2,6712,6032,5312,5422,6ll
2^8482,9172,996
3,066
\M3,2253,1673,2983,*773,6623,7*9
3,9954,2024,66o5,4836,080
6,0435,9*45,5955,4745,650
5,8566,0266,3896,6096,645
6,7516,91*7,2777,6267,893
8,1278,190
7,9007,8768,2228,3388,39*8,704
8,3518,4068,6018,6188,5138,470
8,200
rData relate to the United States without Alaska and Hawaii.1 Data include Alaska and Hawaii. The monthly data shown below relate to the United States including Alaska and Hawaii.NOTE: Data for the 2 most recent months are preliminary.
Digitized for FRASER http://fraser.stlouisfed.org/ Federal Reserve Bank of St. Louis

Current Industry Employment12
Table B-2: Employees in nonagricultural establishments, by industry
(In thousands)
IndustryAll employees
Julyi960
Junei960
MayI960
July1939
June
1959
Production workers 1
Julyi960'
Junei960 i960
July1959
June1959
TOTAL. 32,910 3,284 >2,957
MINING.
METAL M I N I N GIron miningCopper miningLead and zinc mining.
ANTHRACITE MINING
BITUMINOUS-COAL MINING.
CRUDE-PETROLEUM AND NATURAL-GASPRODUCTIONPetroleum and natural-gas production(except contract services)
N O N M E T A L L I C M I N I N G A N D Q U A R R Y I N G .
CONTRACT CONSTRUCTION
656
95.1,
145.8
116.1
3,102
N0NBU1LDING CONSTRUCTIONHighway and street construction.Other nonbuilding construction..
BUILDING CONSTRUCTION.
GENERAL CONTRACTORS.
SPEC IAL-TRADE CONTRACTORSPlumbing and heatingPainting and decoratingElectrical workOther special-trade contractors.
MANUFACTURING.
DURABLE GOODS....NONDURABLE GOODS.
Durable Goods
ORDNANCE AND ACCESSORIES.
LUMBER AND WOOD PRODUCTSLogging camps and contractorsSawmilJLs and planing millsMillwork, plywood, prefabricatedstructural wood products
Wooden containersMiscellaneous wood products
16,249
9,3326,917
677.8
679
95.533.532.011.7
H.7
164.0
291.4
176.9
116.6
2,983
648316.1331.8
2,335
815.O
1,519.5310.5237.1186.3785.6
16,414
9,5006,914
677
96.135.331.3H.9
12.2
167.2
286.2
174.2
115.7
2,830
594284.2310.1
2,236
774.2
1,461.9304.2222.0176.5759.2
16,348
9,5166,832
710
97.435.231.012.7
17.1
171.3
310.7
184.0
113.8
3,035
687343.0
344.1
2,348
836.71,5H.3
323.5239.9179.1768.8
16,410
9,5236,887
713
97.735.431.112.6
15.3
177.9
308.7
182.8
113.2
2,986
685335.0350.0
2,301
824.0
1,477.2314.0217.7176.5769.O
L6,455
9,5816,874
L2,155
6,8865,269
FURNITURE AND FIXTURESHousehold furnitureOffice, public-building, and profes-sional furniture
Partitions, shelving, lockers, andfixtures
Screens, blinds, and miscellaneousfurniture and fixtures
STONE, CLAY, AND GLASS PRODUCTSPlat glassGlass and glassware, pressed or blown..Glass products made of purchased glass.Cement, hydraulicStructural clay productsPottery and related productsConcrete, gypsum, and plaster products.Cut-stone and stone productsMisc. nonmetallic mineral products
385.6
562.
149.5
689.I127.6326.3
133.644.856.8
390.7279.6
49.6
37.0
24.5
561.429.7
109.416.542.975.748.8
120.518.499.
149.4
66O.7108.5318.1
132.744.856.6
388.3279.5
48.3
35.7
24.8
558.130.8
106.916.842.176.O48.8
118.18.1
100.1
142.4
694.4H5.3330.4
147.044.856.9
382.2276.6
45.8
35.5
24.3
565.732.7
100.917.943.578.449.4
123.518.4
101.0
139.7
691.8112.1330.9
145.945.657.3
384.1277.0
46.2
35.6
25.3
566.133.1
103.I17.843.278.349.4
122.518.;
100.5
6O.7
6O8.7
320.7
455.3
532
78.728.326.19.4
9.9
144.1
203.3
103.5
96.2
2,565
565288.3276.4
2,000
714.7
1,285.6252.4215.3147.867O.I
L2,33O
7,0575,273
72.2
620.1120.3296.8
112.540.849.7
326.3240.3
38.7
28.0
19.3
455.425.592.913.635.265.54l.995.615.969.3
532
80.030.525.6
9.7
10.5
147.7
198.3
101.2
95.9
2,420
513256.6256.8
1,907
675.1
1,232.0246.7201.3139.4644.6
12,292
7,084
5,208
73.0
592.5101.8288.8
111.740.849.4
324.3240.3
37.6
26.8
19.6
451.626.690.513.734.565.941.793.215.669.9
562
80.130.225.310.2
15.5
152.5
218.6
108.4
95.5
2,632
606315.6
290.1
2,026
737.21,288.4
264.6218.3142.8662.7
12,433
7,1615,272
72.2
627.O108.6302.2
125.441.049.8
319.5237.9
35.9
26.8
18.9
463.528.885.714.836.O68.542.499.915.971.5
565
80.930.525.610.2
13.6
158.5
216.8
107.3
95.0
2,583
604307.2297.2
1,979
724.3
1,254.6256.2197.2140.766O.5
12,524
7,248
5,276
72.9
623.8105.2302.4
124.141.850.3
320.7238.O
36.0
26.7
20.0
465.829.288.114.835.868.442.499.215.772.2
See footnotes at end of table. NOTE: Data for the 2 most recent months are preliminary.
Digitized for FRASER http://fraser.stlouisfed.org/ Federal Reserve Bank of St. Louis

13 Current Industry Employment
Table B-2: Employees in nonagricultural establishments, by industry-Continued
(In thousands)
Industry
Durable Goods — Continued
PRIMARY METAL INDUSTRIESBlast furnaces, steel works, androlling millsIron and steel foundriesPrimary smelting and refining ofnonferrous metalsSecondary smelting and refining ofnonferrous metals .
Rolling, drawing, and alloying ofnonferrous metalsNonferrous foundriesMiscellaneous primary metal industries.
FABRICATED METAL PRODUCTS ••Tin cans and other tinwareCutlery, hand tools, and hardware.......Heating apparatus (except electric) andplumbers ' suppliesFabricated structural metal products....Metal stamping, coating, and engraving..Lighting fixturesFabricated wire productsMiscellaneous fabricated metal products.
MACHINERY (EXCEPT ELECTRICAL)Engines and turbines.Agricultural machinery and tractors....Construction and mining machinery .Metalworking machinerySpecial-industry machinery (exceptmetalworking machinery) ,General industrial machinery ,Office and store machines and devices...Service-industry and household machines.Miscel laneous machinery parts ,
ELECTRICAL MACHINERYElectrical generating, transmission,distribution, and industrial apparatus,
Electrical appliances ,Insulated wire and cableElectrical equipment for vehicles ,Electric lampsCommunication equipmentMiscellaneous electrical products
TRANSPORTATION EQUIPMENTMotor vehicles and equipmentAircraft and partsAircraftAircraft engines and partsAircraft propellers and partsOther aircraft parts and equipmentShip and boat building and repairing....Ship building and repairing ,Boat building and repairingRailroad equipmentOther transportation equipment
INSTRUMENTS AND RELATED PRODUCTSLaboratory, scientific, and engineeringinstruments ,
Mechanical measuring and controllinginstruments
Optical instruments and lensesSurgical, medical, and dentalinstruments
Ophthalmic goodsPhotographic apparatusWatches and clocks
JulyI960
1,159.3
1,065.9
1,636.2
1,286.8
1,579.6
349.4
All employeesJuneI960
1,201.9
582.4223.2
59.4
11.9
113.761.7
149.61,087.1
63.9132.2
115.8293.4236.149.456.7
139.61,657.4
101.6149.6127.4265.I
177.5230.9140.4192.4272.5
1,295.7
413.739.128.671.329.1
664.549.4
1,606.4784.1616.7371.2113.4
8.3123.8134.7111.423.36O.710.2
352.8
65.9101.018.645.827.065.928.6
May
1,224.9
606.5222.5
58.6
12.1
112.261.1
151.91,080.8
62.2133.0
116.0287.7236.548.157.4
139.9
1,660.9103.2149.3130.3263.5
176.5230.1138.9196.5272.6
1,289.6
414.838.928.670.929.5
658.O48.9
1,652.8785.0658.3381.4138.714.1
124.1137.4112.325.161.610.5
351.3
66.0100.218.4
45.127.665.528.5
July1959
1,266.1
630.8230.1
56.9
12.5
119.464.1
152.3
1,084.162.8
132.4
116.6303.1228.047.656.O
137.6
1,633.9104.1171.5135.5239.3
165.9226.2129.8186.3275.3
1,241.6
407.036.926.968.627.5
625.848.9
1,692.8744.3735.6433.4
ft}ft}141.1144.6123.321.357.7
10.6
339.2
65.394.315.3
42.025.665.731.0
June1959
1,291.4
651.8231.4
56.3
12.5
119.664.8
155.01,102.0
63.1136.4
118.7301.6233.548.857.7
142.21,644.9
105.1173.0136.2239.4
166.2225.5132.6187.2279.7
1,232.6
405.637.027.969.827.4
615.849.1
1, 703.7754.2735.3434.0
140.3148.0124.223.855.8
10.4
339.2
63.994.615.0
43.525.765.O31.5
Julyi960
926.5
823.5
1,131.3
843.0
1,100.4
224.2
Production workers1
Junei960
968.9
470.8I89.8
46.8
8.6
85.4
50.3117.2
841.1
55.9103.7
88.0208.4
192.538.245.3
109.1
1,155.563.3
102.987.5196.1
124.0146.893.0
143.3198.6
858.4
277.329.321.854.625.4
413.736.3
1,127.2615.5345.6213.856.92.7
72.2112.692.620.045.5
8.0
227.2
35.666.212.830.521.038.622.5
Mayi960
992.6
495.3188.8
46.1
8.9
84.249.6
H9.7
836.554.3
104.488.1
204.4192.9
37.045.9
109.5
1,159.364.5
101.789.9
195.7
123.5146.592.3
146.9198.3
855.1
279.329.122.054.325.8
408.835.8
1,173.6615.8388.0223.582.48.5
73.6114.793.021.746.78.4
227.7
35.866.412.7
30.221.538.722.4
July1959
1,038.4
521.2197.7
44.5
9.4
92.252.5
120.9846.955.0
104.4
89.2221.5186.0
36.944.9
109.0
1,149.466.4
124.694.1
175.5
114.9143.187.7
138.3204.8
835.9
277.827.320.452.923.8
397.935.8
1,207.4586.3448.6264.886.49.2
88.2120.5102.318.243.28.8
220.8
35.5
62.910.3
27.720.139.524.8
1,066.5
543.1199.8
44.1
9.4
92.753.4
124.0865.855.4
108.4
91.5220.7191.5
38.246.5
113.6
1,167.067.5
127.195.5
176.3
115.6143.390.2
141.1210.4
832.5
277.927.521.454.323.7
391.835.9
1,224.0598.1451.3266.086.89.3
89.2124.3103.520.841.78.6
223.5
35.063.910.1
29.420.239.325.6
See footnotes at end of table. NOTE: Data for the 2 most recent months are preliminary
Digitized for FRASER http://fraser.stlouisfed.org/ Federal Reserve Bank of St. Louis

Table B-2: Employees i i loiagriciKiral estailiskaeits, by
(In thousands)
Industry
Durable Goods—Continued
MISCELLANEOUS MANUFACTURING INDUSTRIES...Jewelry, silverware, and plated ware....Musical instruments and partsToys and sporting goodsPens, pencils, other office supplies....Costume jewelry, buttons, notionsFabricated plastics productsOther manufacturing industries
Nondurable Goods
FOOD AND KINDRED PRODUCTSMeat productsDairy productsCanning and preservingGrain-^mill productsBakery productsSugar..Confectionery and related productsBeverages.Miscellaneous food products
TOBACCO MANUFACTURESCigarettesCigarsTobacco and snuffTobacco stemming and redrying
TEXT ILE-MILL PRODUCTSScouring and combing plantsYarn and thread millsBroad-woven fabric millsNarrow fabrics and smallwaresKnitting millsDyeing and finishing textilesCarpets, rugs, other floor coverings....Hats (except cloth and millinery)Miscellaneous textile goods
APPAREL AND OTHER FINISHED TEXTILEPRODUCTSMen's and boys' suits and coatsMen's and boys' furnishings and workclothingWomen ' s outerwearWomen's, children's under garmentsMillineryChildren's outerwearFur goodsMiscellaneous apparel and accessories...Other fabricated textile products
PAPER AND ALLIED PRODUCTS.Pulp, paper, and paperboard millsPaperboard containers and boxesOther paper and allied products
PRINTING, PUBLISHING, AND ALLIEDINDUSTRIESNewspapers...PeriodicalsBooksCommercial printingLithographingGreeting cardsBookbinding and related industriesMiscellaneous publishing and printingservices*
JulyI960
494.2
1,531.6
79-*
942.1
1A89.1
559.3
889.I
All employeesJuneI960
MayI960
508.2*5-918.698.131.959.99**9158.9
l,*67.9303.9102.0205.3110.2290.425.770.1220.9139.*
77.738.425.*6.27.7
960.8
106^4393.729.5224.690.044.110.256.8
,216.8H6.3
358.5330.2118.512.775.07.261.8136.6
566.8278.2152.5136.1
890.8331.362.262.2
229.768.521.448.567.O
498.7*5-718.693.231.658.194.8
156.7
1,414.9297.297.8
184.7IO8.9286.125.169.5
211.113*.578.537.725.56.29.1
956.35.*
105.7392.929.3
221.689.944.910.156.5
1,207.9115.0
353.7328.1118.414.973.26.9
59.6138.I
562.7274.4151.7136.6
32962.762.2
227.368.420.648.0
67.3
July1959
480.744.315.586.131.159.*91.5
152.8
1,516.0306.3104.3253.7114.9286.826.268.3
217.9137.677.335.725.76.89.1
964.75.8
111.2395.729.8
221*388.445.69.8
57.1
1,178.6104.6
339.0330.5112.718.67*.510.057.7
131.0
561.3276.9151.7132.7
864.8323.660.957.1222.965.620.945.8
68.0
June1959
*85.245.215.787.530.859.592.1154.4
1,*79.2305.8104.4214,2115.6284.625.971.0216.4141.3
79.937.527.O6.98.5
975.15.7
112.0399.130.2224.989.6*5-710.257.7
1,200.2
H3.3
3*0.5336.7116.813.776.89.960.7131.8
565.0277.9153.8133.3
862.8322.060.657.1222.666.020.846.0
67.7
JulyI960
391.2
1,071.7
69.6
847.8
1,060.3
443.8
563.7
Production workers1
JuneI960
404.936.515.283.223.848.27*-3
123.7
1,013.2242.270.3
170.676.5
I63.820.455.*
118.495.6
67.933.323.85.25.6
866.05.0
97.5365.325.8
203.6IF36.38.9
*5.9
1,087.0105.0
327.1295.*105.510.967.25.3
55.8114.8
*51.5225.6121.9104.0
26!37.7
184.251.915.*38.2
51.*
MayI960
397.336.315.378.523.646.874.2
122.6
967.*235.766.7
150.875.0
160.919.85*.8
112.291.5
68.332.523.75.26.9
862.9*.9
97.636*.725.6
200.777.737.28.9
*5.6
1,079.1103.5
322.9293.0105.513.065.55.2
53.8H6.7449.2222.8121.5104.9
566.8164.027.037.*
182.551.814.637.7
51.8
July1959
380.23*.512.372.622*9*7.771.6
118.6
1,061.7245.272.0
218.678.9
162.520.554.2
115.89*.O
67.2,3p.524.15.76.9
872.I,5.2
102.7367.726.1
200.776.438.08.7
46.6
1,047.593.1
309.0293.3100.016.466.07.8
51.8110.1
449.0225.9120.8102.3
552.1159.925.334.4
178.8*9.715.336.O52.7
June1959
385.335.512.673.722.7*7.972.3
120.6
1,029.6244.572.3
179.979.7
162.320.157.0
H6.097.8
69.932.425.*
5.86.3
882.85.1
103.1371.326.6
204.877.638.09.0
*7.3
1,067.9101.4
310.5299.*104.411.568.5
110.1
*53.3227.O123.0103.3
55*.9I6O.725.835.2
178.9*9.915.536.3
52.6
See footnotes at end of table. NOTE: Data for the 2 most recent months are preliminary.
Digitized for FRASER http://fraser.stlouisfed.org/ Federal Reserve Bank of St. Louis

15 Current Industry Employment
Table B-2: Employees i i Miafriciltiral establishments, by iidustry-Csitiiaed
(In thousands)
IndustryAll employees
JaneI960
June1959
Production workers!
June
I960
June1959
526.968.12Ol*.t*56.8
30.3U5.U6.121*. 32l*.766.8
160.1*122.3
38.1
196.170.718.2
107.2
333.933.1U.017.9227.013.025.013.9
Nondurable Goods—Continued
CHEMICALS AND ALLIED PRODUCTSIndustrial Inorganic chemicalsIndustrial organic chemicalsDrugs and medicines.Soap, cleaning and polishing prepa-rations
Paints, pigments, and fillers.......Gum and wood chemicals....Fertilizers.Vegetable and animal oils and fats..Miscellaneous chemicals
878.O
PRODUCTS OF PETROLEUM AND COAL..Petroleum refiningCoke, other petroleum and coalproducts
RUBBER PRODUCTS..Tires and inner tubes.Rubber footwearOther rubber products.
LEATHER AND LEATHER PRODUCTSLeather: tanned, curried, and finished.Industrial leather belting and packing.Boot and shoe cut stock and findings..Footwear (except rubber)Luggage .'Handbags and small leather goodsGloves and miscellaneous leather goods.
230.7
256.5
361.1
TRANSPORTATION AND PUBLIC UTILITIES.
TRANSPORTATIONInterstate railroads
Class I railroads.Local railways and bus linesTrucking and warehousingOther transportation and services....Bus lines, except localAir transportation (common carrier).Pipe-line transportation (exceptnatural gas)
3,933
2,565
COMMUNICATION.Telephone...Telegraph...
OTHER PUBLIC UTILITIESGas and electric utilitiesElectric light and power utilities.Gas utilities.Electric light and gas utilitiescombined
Local utilities, not elsewhereclassified
I 750
618
WHOLESALE AND RETAIL TRADE.
WHOLESALE TRADEWholesalers, full-service and limited-functionAutomot ive....fGroceries, food specialties, beer,wines, and liquorsElectr.ical goods, machinery, hardware,and plumbing equipment
Other full-service and limited-function wholesalers
Wholesale distributors, other
11,586
3,3i*O
877.3105.631*3.3106.7
53.2
78.5
8.0
35.7
36.5
109.8232.0183.8
1*8.2
258.3103.7
22.0132.6
365.53k.$k.3
19.1*21*5.216.030.315.8
3,91*2
2,590919.1807.1*
91.1+886.3693.$
U0.9151.2
2U.6
71*5708.136.6
607582.8257.5155.5
169.8
23.9
11,620
3,128
1,866.1*
mi. 3
, 315.U
1*58.1*
951.31,261.9
879.610U.731*0.2105.1*
52.877.87.9
l*l*.l37.5
109.2
231.9183.2
1*8.7
257.1103.lt
21.9331.8
357.631*. 01*.2
18.7238.815.830.215.9
3,921*
2,585
801*991.3
880.3698.61*0.0
153.0
2l*.l
71*1701*. 0
36.6
59857l*.6
153^2
163.3
23.7
n,5l*3
3,in
1,851.1*3i*0.5
313.0
1*55.2
91*2.71,259.3
81*7.8103.6330.2101*. 8
51.075.27.8
31.637.3
105.3
237.5189.3
1*8.2
261*. 0106.7
22.5331*. 8
375.1
36.95.0
19.6252.215.530.215.7
3,91*9
2,589960.1*81*6.292.3
855.7680.11*2.3
11*6.6
25.9
750711.737.2
610585.7259.1*156.3
170.0
23.9
11,321*
3,069
1,820.6337.3
305.5
1*52.0
925.81,21*8.6
81*3.2102.2326.7103.2
50.975.9
37.6105.1
238.3190.2
1*8.1
255.897.022.3
136.5
37I+.1*37.1*
5 .119.9
252.215.328.815.7
2,602967.8850.3
92.5853.9687.61*1.2
3i*5.l*
25.6
71*1*705.737.3
59857l*.7258.2151*.6
161.9
23.6
11,352
3,051+
1,813.2135.7
306.6
1*1*9.2
921.71,21*0.9
51*3.2
151*. 8
191*. 7
319.1*
51*1.169.6
211.657.6
31.31*6.66.5
25.823.968.2
155.5117.8
37.7
198.376.918.2
103.2
323.130.23.2
17.2218.713.726.233.9
537515.7221.2138.8
155.7
21.1
2,688
1,621.2121.6
280.1*
391*. 7
821*. 51,066.8
51*6.769.2
210.056.6
30.81*6.3
6.1*3l*.l21*. 968.1*
151*. 9116.7
38.2
197.677.018.1
102.5
315.229.73.1
16.6212.313.526.011*. 0
529508.0218.2
136.9
152.9
20.9
2,670
1,606.3121.0
277.9
392.1*
815.01,063.7
526.668.9
205.757.2
30.21*5.0
6.1*21.72l*.l*66.5
158.2120.1*
37.8
203.1*79.718.3
105.1*
33l*.632.1*3.9
17.6227.313.226.333.9
51*1*522.6226.211*0.7
155.7
21.3
2,61*6
1,589.1*119.6
273.1
391.1*
805.31,056.1
533512.0221*. 7139.3
l!*8.0
21.0
2,637
l,581*.l*118.1
271*. 1
389.0
803.21,052.1
See footnotes at end of table. NOTE: Da^a for the 2 most recent months are preliminary.
561163 O - 60 - 4
Digitized for FRASER http://fraser.stlouisfed.org/ Federal Reserve Bank of St. Louis

Current Industry Employment 16
Table B-2: Employees in nonagricultural establishments, by industry-Continued
{In thousands]
Industry July1Q6O
June1959
Production workers 1
JuneI960
July1959
June1959
WHOLESALE AND RETAIL TRADE—Continued
RETAIL TRADEGeneral merchandise storesDepartment stores and generalmail-order houses
Other general merchandise storesFood and liquor stores ,Grocery, meat, and vegetable markets.Dairy-product stores and dealers ,Other food and liquor stores
Automotive and accessories dealers. . . . .Apparel and accessories storesOther retai1 trade 2
Furniture and appliance stores ,Drug stores
FINANCE, INSURANCE, AND REAL ESTATEBanks and trust companiesSecurity dealers and exchangesInsurance carriers and agentsOther finance agencies and real estate
SERVICE AND MISCELLANEOUS.Hotels and lodging places...Personal services:Laundri esCleaning and dyeing plants.
Motion pictures
GOVERNMENT.
FEDERAL3 .ExecutiveDepartment of Defense..Post Office Department.Other agenciesLegislativeJudicial
STATE AND LOCAL.StateLocal
Education.Other
8,1*61,425.8
1,664.0
823.O592.8
3,940.2
2,527
6,721
8,136
2,195
5,94l
8,1*921,457.0
928.9528.1
1,657.41,204.5227.3225.6826.3628.4
3,923.0396.4398.0
2,495671.5100.5930.4793.0
6,746525.3
314.2179.9190.0
8,405
2,2042,176.6922.8560.0693.822.8
6,2011,570.94,630.1
8,4321,465.6
932.1533.5
1,648.71,200.7
222.8225.2819.O626.7
3,872.2399.0392.0
2,469662.999.9
922.3783.5
6,717497.1
311.5179.4190.3
8,449
2,2122,184.6
917.1553.3714.222.5h.9
6,2371,578.84,658.0
2,978.53,258.3
8,2551,396.7
898.7498.O
1,600.31,158.4
231.0210.9798.9572.1
3,887.0389.5384.4
2,475649.897.4
914.1813.4
6,603602.6
317.5169.3192.9
7,837
2,1902,162.0
949.6549.4663.O22.74.8
5,6471,480.14,166.7
2,335.53,311.3
8,2981,422.4
913.2509.2
1,616.61,173.4
228.1215.1796.1602.2
3,860.8387.8375.5
2,442638.495.1
902.4806.5
6,623532.7
316.9176.0191.1
8,065
2,1852,156.9
948.1547.3661.522.84.8
5,8801,519.14,360.7
2,617.53,262.3
1,355.3
857.3498.O
1,516.11,129.8
191.9194.4728.3571.7
2,127.2357.1377.7
1,362.4
859.^503.0
1,508.61,126.2
I88.7193.7722.5570.2
2,095.4358.7371.6
1,301.5
830.4471.1
1,468.41,080.8
199.5188.1708.6521.0
2,110.9352.1363.3
1,326.4
844.7481.7
1A89.91,100.7
196.9192.3705.3550.5
2,090.6351.0355.3
*For mining and manufacturing, data refer to production and related workers; for contract construction, to construction workers; andfor all other industries, to nonsupervisory workers.
2Data for nonsupervisory workers exclude eating and drinking places.*Data are prepared by the U.S. Civil Service Commission and relate to civilian employment only.NOTE: Data for the 2 most recent months are preliminary.
Data relate to the United States without Alaska and Hawaii.
Table B-3: Federal military personnel
(In thousands)
Branch 1
TOTAL
Air Force
JuneI960
2,508
873.1
816.5
MayI960
2,496
868.1
814.2
June1959
2,535
862.0
840.4
Branch
Navy
Marine Corps
Coast Guard
Junei960
617.6
170.6
30.5
MayI960
611.5
171.3
30.5
June1959
626.3
175.6
30.4
Data refer to forces both in continental United States and abroad.NOTE: Data for the current month are preliminary.SOURCE: U.S. Department of Defense and U.S. Department of Treasury.
Digitized for FRASER http://fraser.stlouisfed.org/ Federal Reserve Bank of St. Louis

17
Table B-4: Employees ii nonagricultural establishments,by industry division and selected groups, seasonally adjusted
Seasonally Adjusted-Industry Employment
(In thousands,)
Industry division and groupAll employees
JulyI960
Junei960
Production workers
Junei960
Total
Total without Alaska and Hawaii1.
Mining
Contract construction.
ManufacturingDurable goodsNondurable goods.
Durable Goods
Pood and kindred products •Tobacco manufacturesTextile-mill products.Apparel and other finished textile products.Paper and allied productsPrinting, publishing, and allied industries.Chemicals and allied productsProducts of petroleum and coalRubber productsLeather and leather products
Transportation and public utilities.TransportationCommunicationOther public utilities
Wholesale and retail trade.Wholesale tradeRetail trade
Finance, insurance, and real estate.
Service and miscellaneous
GovernmentFederalState and local.
53,39553,133
Ordnance and accessoriesLumber and wood productsFurniture and fixturesStone, clay, and glass productsPrimary metal industriesFabricated metal productsMachinery (except electrical)Electrical machineryTransportation equipmentInstruments and related productsMiscellaneous manufacturing industries
Nondurable Goods
659
2,862
9,444
6,973
13k665399567
1,1681,0911,6531,3181,580
354515
968,242563895889228263364
3,9042,552
743
609
11,7313,1568,575
2,477
6,688
8,3952,2066,189
53,36253,11**
676
2,796
16,4899,4946,995
150667
4oi
5581,2021,0911,61*61,3051,606
354514
1,48288
9611,263
567891887230258368
3,926
2,577745604
11,6953,1608,535
2A70
6,646
8,1*162,2156,201
53,34453,105
681*
2,783
16,5409,5377,003
ll*9658396558
1,2301,0851,6501,2991,653
352507
, 790
9601,266
568889885231258369
3,9272,58571*1601
11,6753,1588,517
2,469
6,618
8,1*092,2346,175
12,3337,0005,333
61597334460936849
1,148874
1,100229412
1,02280874
1,110448570554152201322
12,4057,0525,353
72599336453969845
1,145867
1,127228411
1,02978
8661,132452570549154198325
12,4767,1065,370
73590332452998841
1,148864
1,174229405
1,03579
8671,136
454570550154199326
1Detail adds to the total without Alaska and Hawaii.NOTE: Data for the 2 most recent months are preliminary.
Table B-5: Employees in private and Government shipyards, by region(In thousands)
Region
ALL REGIONS.
North Atlantic2.South Atlantic..GulfPacificGreat LakesInland .....
June I960
203.7
84.438.421,951.04.4
Private
111.4
43.020.121.918.44,4
Navy
92.3
41.418.3
32.6
May I960
84.638.323.749.34.3
Private
112.3
43.520.023.717.14.3
Navy
91.6
41.1
18.3
32.2
June 1959
217.4
100.6" 37.022.149.63.8.
Jus.
124.2
59.918.322.115.83.8
Navy
93.2
40.718.7
33.8
!The North Atlantic region includes all yards bordering on the Atlantic in Conn., Del., Maine, Md., Mass., N.H., N. J., N,R.I., Vt. The South Atlantic region includes all yards bordering on the Atlantic in Ga., N.C., S.C., Va. The Gulf regionall yards in Fla. , and all yards bordering on the.Gui'f of Mexico in Ala., La., Miss., Tex. The Pacific region includes allCalif., Oregon., Wash. The Great Lakes region includes all yards bordering on the Great Lakes in 111., Mich., Minn., N.Y.,Pa., Wis. The Inland region includes all other yards. 2Navy data include Curtis Bay Coast Guard Yard.NOTE: Data for the current month are preliminary.
Y. , Pa.,includesyards inOhio,
Digitized for FRASER http://fraser.stlouisfed.org/ Federal Reserve Bank of St. Louis

18
Table B-6: W u e i employees in •aiifactiriig, by Mistry
Industry
Number(in thousands)
Apr.I960
Percentof totalemploy-ment
1959
Industry
Number(in thousands)
Apr.I960 1959
Percentof totalemploy-ment
MANUFACTURING
DURABLE GOODSNONDURABLE GOODS
Durable Gooda
ORDNANCE AND ACCESSORIES
LUMBER AND WOOD PRODUCTSLogging camps and contractors ,Sawmills and planing millsMillwork, plywood, prefabricatedstructural wood products
Wooden containersMiscellaneous wood products
FURNITURE AND FIXTURESHousehold furnitureOffice, public-building, andprofessional furniture ,Partitions, shelving, lockers, andfixtures • •
Screens, blinds, and miscellaneousfurniture and fixtures
STONE, CLAY, AND GLASS PRODUCTS......Flat glassGlass and glassware, pressed orblown »Glass products made of purchasedglass
Cement, hydraulicStructural clay productsPottery and related productsConcrete, gypsum, and plasterproductsCut-stone and stone productsMiscellaneous nonmetallic mineralproducts
PRIMARY METAL INDUSTRIESBlast furnaces, steel works, androlling millsIron and steel foundries. »Primary smelting and refining ofnonferrous metals.Secondary smelting and refining ofnonferrous metals
Rolling, drawing, and alloying ofnonferrous metalsNonferrous foundriesMiscellaneous primary metalindustries
FABRICATED METAL PRODUCTSTin cans and other tinwareCutlery, hand tools, and hardware...Heating apparatus (except electric)and plumbers' supplies
Fabricated structural metal productsMetal stamping, coating, andengraving....
Lighting fixtures.Fabricated wire productsMiscellaneous fabricated metalproducts. ,
4,248
1,6982,550
28.5
43.41.412.4
9-48.012.2
64.0lf6.0
5.7
3.3
9.0
90.81.3
4.61.16.715.8
7.1.7
19.0
70.7
23.610.5
2.1
1.0
9.87.5
16.2
I85.613.738.2
13.620.9
42.214.011* .2
28.8
4,l43
1,6392,505
26.2
42.91.3
12.5
9.88.2
11.1
65.31*7.8
8.7
88.8
\ 1.6
31.8
4.91.17.0
15-V6.8.7
19.5
68.9
22.810.1
1.9
.9
9.68.0
15.6
188.814.238.9
13.721.0
44.514.313.9
28.3
19
16
19
16
20
21
Durable Goods —Con tinned
MACHINERY (EXCEPT ELECTRICAL)Engines and turbines..Agricultural machinery and tractors...Construction and mining machineryMetalworking machinerySpecial-industry machinery.(exceptmetalworking machinery)General industrial machinery.....Office and store machines and devices.Service-industry and householdmachines
Miscellaneous machinery parts....
ELECTR I CAL MACH INERY •Electrical generating, transmission,distribution*, and industrialapp ar atus <
Electrical appliances.Insulated wire and cableElectrical equipment for vehiclesElectric lampsCommunication equipmentMiscellaneous electrical products
TRANSPORTATION EQUIPMENT.Motor vehicles and equipmentAircraft and partsShip and boat building and repairing.,Railroad equipment
Other transportation equipment ,
INSTRUMENTS AND RELATED PRODUCTSLaboratory, scientific, and engi-neering instrumentsMechanical measuring and controllinginstruments
Optical instruments and lensesSurgical, medical, and dentalinstruments
Ophthalmic goods. ..Photographic apparatusWatches and clocks •
MISCELLANEOUS MANUFACTURING INDUSTRIESJewelry, silverware, and plated ware..Musical instruments and parts ,Toys and sporting goodsPens, pencils, other office supplies.,Costume jewelry, buttons, notions....,Fabricated plastics products '.Other manufacturing industries
nondurable Gooda
FOOD AND KINDRED PRODUCTSMeat productsDairy productsCanning and preservingGrain-mill productsBakery productsSugarConfectionery and related productsBeverages ,Miscellaneous food products ,
228.114.612.910.931.0
18.130.535.4
26.748.0
490.0
131.312.37.127.719.7276.215.7
190.876.7103.04.94.12,1
117.6
14.6
340.671.020.076.316.860.32.734.321.537.7
220.015.213.210.528.4
17.129.033.6
25.347.7
453.7
122.211.66.826.717.3252.616.5
194.171.8111.54.84.02.0
111.7
14.0
31.65.4
21.611.517.315.6
188.617.94.7
38.816.130.429.950.8
29.64.6
19.510.717.316.0
178.417.14.2
35.815.229.528.847.8
335.871.619.874.216.656.62.733.721.339.3
38
33
22
14158812
111326
1418
38
31322438
835
111015
820
34
23
3330
46432753
3838244550513232
24242141152011481129
Digitized for FRASER http://fraser.stlouisfed.org/ Federal Reserve Bank of St. Louis

19 Women
Table B-6: Women employees in manufacturing, by iidnstry-CoitiiieJ
Industry
Number(in thousands)
Apr.I960
TprT1959
Apr. Apr,I960 1959
Percentof totalemploy-ment Industry
Number(in thousands)
prI960
Apr.1959
Percentof totalemploy-ment
Apr. Apr.I960 1959
Nondurable Goods—Continued
TOBACC/) MANUFACTURESCigarettesCigarsTobacco and snuff • .Tobacco stemming and redrying. ......
TEXT ILE-MILL PRODUCTSScouring and combing plantsYarn and thread millsBroad-woven fabric millsNarrow fabrics and smallwares..Knitting millsDyeing and finishing textilesCarpets, rugs, other floor coveringsHats (except cloth andvmillinery)...Miscellaneous textile goods
APPAREL AND OTHER FINISHED TEXTILEPRODUCTSMen's and boys' suits and coatsMen's and boys' furnishings andwork clothingWomen's outerwear.Womeri's, children's under garments..MillineryChildren's outerwearFur goodsMiscellaneous apparel and accessoriesOther fabricated textile products...
PAPER AND ALLIED PRODUCTSPulp, paper, and paperboard mills...Paperboard containers and boxesOther paper and allied products
P R I N T I N G , P U B L I S H I N G , AND AL L I E DI N D U S T R I E SNewspapersPeriodicalsBooksCommercial printing
39.215.1*19.12.52.2
1*11.61.0
k$.k31*7.8
15.8151.6
19.311.1
k.215.1*
971.677.2
296.8283.010U.213.2$9.91.7
1*7.088.6
118.331.036.750.6
21*3.159.030.229.157.6
1*1.115.920.6
2.81.8
1*16.2.9
1*7.1*150.9
16.031*9.9
19.111.7
16*. 2
91*6.072.1
278.6283.7102.612.661.21.9
1*5.787.6
116.1*30.637.1*1*8.1*
233.5
28*526.055.6
66
Nondurable Goods—Continued
PRINTING, PUBLISHING, AND ALLIEDINDUSTRIES—ContinuedLithographingGreeting cardsBookbinding and related industries....Miscellaneous publishing and printingservices.
CHEMICALS AND ALLIED PRODUCTSIndustrial inorganic chemicalsIndustrial organic chemicalsDrugs and medicines.Soap, cleaning and polishingpreparations ,Paints, pigments, and fillersGum and wood chemicalsFertilizersVegetable and animal oils and fats....Miscellaneous chemicals . .
PRODUCTS OF PETROLEUM AND COAL..Petroleum refining.Coke, other petroleum and coalproducts
RUBBER PRODUCTSTires and inner tubes.Rubber footwearOther rubber products.
LEATHER AND LEATHER PRODUCTSLeather: tanned, curried, andfinishedIndustrial leather belting andpackingBoot and shoe cut stock and findings.Footwear (except rubber)LuggageHandbags and -small leather goodsGloves and miscellaneous leathergoods
19.012.719.7
15.8
158.39.0
1*8.038.9
12.810.7
43.332.6
17.133.8
3.3
61*. 031*. 112.337.6
185.8
k.2
1.1*7.9
135.27.120.U
9.6
17.611.619.0
17.5
152.68.31*6.138.1*
11.710.6.5
2.33.1*31.3
17.23l*.l*
2.8
58.033.39.0
35.7
187.8
k.6
1.88.2
138.27.019.2
8.8
V621*126
188
31*37
23
1930
5228
52
12
371*3a67
60NOTE: Data relate to the United States without Alaska and Hawaii.
Digitized for FRASER http://fraser.stlouisfed.org/ Federal Reserve Bank of St. Louis

State Industry Employment20
Table B-7: Employees in nonagricultural establishments, by industry division and State
(In thousands)
Alabama.. . .Arizona. .. .Arkansas. . .California.Colorado...
ConnecticutDelaware.District of Columbia.FloridaGeorgia
IdahoIllinois.Indiana. .IowaKansas. . .
KentuckyLouisiana >.MaineMarylandMassachusetts *
MichiganMinnesotaMississippiMissouriMont ana
NebraskaNevadaNew Hampshire.New Jersey. . . .New Mexico. . . .
New YorkNorth Carolina.North Dakota...OhioOklahoma
OregonPennsylvania. . .Rhode Island...South Carolina.South Dakota...
Tennessee.TexasUtah| 4 . . .Vermont...Virginia..
Washington....West Virginia.WisconsinWyoming
JuneI960
757.5323.2361*. 0
M2U.6501.6
(1)155.2519.1+
1,259.21,020.6
155.U3,1*1*5.11,1+19.7
55i*.5
637.0778.0286.0901.7
1,903.0
2,283.09hO.k396.3
1,315.1;167.1
372.7101.9197.1
1,99U.7239.1+
6,236.31,11*6.1
130.1;3,11+8.9
570.6
5H.33,695.8
281.U558.611*0.5
89U.12,5H*.6
266.6108.9
1,015.3
816.51*56.8
1,190.897.2
758.1325.5361*. 2
1*, 777.01*88.8
899.2152.3518.3
1,280.81,022.1+
153.03,1+29.01,1*12.9
678.5552.0
639.8776.5273.6893.1;
1,881.1
2,281*.l930.3397.6
1,305.8160.8
370.1}98.8
192.21,977.1*
236.2
6,202.1;1,150.9
126. k3,ll*l+.7
567.81*96.1
3,688.1278.6557.9136.8
887.12,506.9
26U.3106.0
l,om. 5805.01*58.0
1,172.793.5
June19S9
7U8.7300.2356.9
U, 662.01*96.1
887.5153.5515.7
1,222.51,007.2
157.63,1+57.1*1,10.8.367U.2560.1;
638.1778.8283.3898.5
1.890.9
2,303.5936.3388.6
1,319.8169.3
370.397.3
193.81,958.6
235.0
9 t U U1,123.0
131.23,138.9
572.0
5OU.33,71*0.7
282.051*l*.l*139.0
888.02,1*88.5
261.2109.6995.8
809.51*62.6
I,l81i.793.2
Mining
JuneI960
MayI960 .
June1959
12.716.16.1*33.315.1;
(2)(3)(3)7.65.7
3.629.710.7U.218.9
29.11*6.7CO2.1*(3)
15.919.76.38.28.9
3.13.2.3
3.720.2
10.63.12.1*20.51*9.5
1.267.6(3)1.62.6
8.0132.1li*.71.2
17.1*
1.763.1l
Contract constructionJuneI960
1*6.030.821.7
308.236.2
(1)12.522.5
ID4.657.0
11.1181.072.11*2.531*. 8
36.755.616.566.785.6
99.363.525.261.712.1
23.57.59.$
106.019.5
295.266.013.2
159.1*33.2
28.3185.312.938.911.6
5o.l*172.1
16.16.9
77.1*
50.120.1*60.610.7
I960
1*1*. 030.720.0
302. k32.9
1*6.912 .121.7
ID.*.!*55.8
10.5178.366.838.032.6
3l*.555.315.263.782.2
98.655.323.958.1*10.1}
22.67.58.9
10U.719.6
286.36U.611.3
152.732.2
25.8175.612.338.310.9
1*6.8167.7
15.16.3
76.1
1*7.919.3^k.911.1
June1959
1*6.126.020.0
293.638.0
1*1*. 113.122.9
130.160.5
11.6178.766.61*3.639.9
1*0.160.316.568.789.1
108.861.826.069.h13.1
2U.27.59.8
96.122.6
289.963.815.1
157.237.1
25.0192.013.132.611.3
1*8.7175.5
16.87.1*
72.81*6.820.359.39.9
See footnotes at end of table.NOTE: Data for the current month are preliminary.
Digitized for FRASER http://fraser.stlouisfed.org/ Federal Reserve Bank of St. Louis

21State Industry Employment
Table 6-7: Employees in nonagricultural establishments, by industry division and State-Continued
(In thousands)
Alabama... .Arizona. ...Arkansas. . .California.Colorado...
Connecticut.........Delaware.District of ColumbiaFloridaGeorgia
Idaho.. . .Illinois.Indiana..IowaKansas. . .
KentuckyLouisianaMaine.MarylandMassachusetts.
MichiganMinnesota...Mississippi.Missouri....Montana
NebraskaNevadaNew Hampshire.New Jersey. . . .New Mexico....
New YorkNorth Carolina.North Dakota. . .OhioOklahoma
OregonPennsylvania.. .Rhode Island...South Carolina.South Dakota. . .
Tennessee.TexasUtah ̂ ...Vermont...Virgina...
Washington....West Virginia.WisconsinWyoming
Manufacturing
JuneI960
238.11*9.3
102.2l,28l.U
8$. 8
(1)60.320.1
202.7335.2
30.11,192.8
59U.1177.2
l
167.1li+3.3109.1259.1*693.0
952.7229.3119.0396.U
21.0
65.85.3
87.9793.718.0
1,900.81*91.9
7.11,268.3
88.3
150.01,1*36.7
119.1239.613.2
311.61*91.6
H6.936.0
272.9
220.7130.01*58.9
7.1*
I69.O11+2.2101.1;257.9687.1
958.1227.5118.2391.8
19.8
6)4.55.2
86.9787.5
17.1*
1,898.91*90.1*
6.9I,27lu9
87.3
11*2.5l,i|39.8
117.U238.713.1
308.91*90.01*5.83$.Q
273.3
217.9128.U1*51*. 9
6.7
June1959
2U0.11*7.1
100.51,281;. 6
82.6
1*01;. 859.720.1
193.9337.8
30.31,233.7
608.9180.8121.0
170.5ll*l*.9108.8267.3699.2
968.5226.5117.2395.2
20.5
6U.85.6
87.lt798.518.0
1,897.11*89.1
7.1*1,291.0
88.9
155.01,1*69.1;
119.U235.013.6
301;. 81*95.31*1*. 136.5
267.9
228.7131.1*1*70.0
7.1
JuneI960
Transportation andpublic utilities
1*9.1*25.228.1;
356.1*l l
(1)10.828.398.172.5
15.3288.1*
93.056.155.2
52.085.1*18.173.2
107.6
136.985.lt25.U
120.619.7
38.39.$9.8
11*9.320.7
1*87.765.613.5
208.81-8.2
1*5.7281.1*15.326.1*10.2
55.8228.323.0
7.88U.0
62.71*5.176.612.3
MayI960
1*9.1*21*. 528.1
353.1*1*3.1*
1*1*. 710.828.398.772.9
15.0286.393.351*. 95U.1*
51.785.317.773.2
106.8
136.881*.l*25.1
119.719.3
37.59.1*9.8
H<A920.7
1*87.565.113.1
208.51*7.1*
Uh.3281.315.126.19.9
55.6226.7
22. h7.7
83.7
60.81*1*. 875.511.8
June1959
U9,2l*.l28.3
352.1
1*1*. 6l l . l28.297.171.7
15.3289.0
96.355.356.3
53.U85.318.1*72.9
108.8
11*0.586.725.1
123.620.1
39.19.U
10.011*2.3
20.9
1*92.163.1*13.5
212.01*8.1*
1*5.7289.1*
15.025.810.1
55.8229.3
23.07.7
85.361.81*6.676.712.5
Wholesale and retail trade
Junei960
151.178.681.6
1,069.1*119.1*
(1)28.98U.1
31*9.2223.8
38.9727.5275.7170.1*128.1*
11*0.0181;. 855.o
191.2393.5
1*29.6229.58)4.5
303.238.7
90.1*21.1*31*. 5
373.650.9
1,279.2215.938.1
602.113U.8
111.5693.351.197.738.1
190.261*5.060.020.9
21J4.0
179.382.8
21*2.920.5
150.278.681.5
1,01*8.612.7.3156.1*
28.1;81*.O
359.U223.1
38.5723.8271*. 9169.6127.5
139.9181*. 5
51*. 0187.8387.1*
1*31.1227.7
81;. 0301.138.5
90.520.633.7
367.71*9.5
1,268,1*215.637.7
$99.h133.5
109.8689.9
51.197.737.5
I89.O61*3.7
59.120.3
213.1
176.182.1;
21*0.519.6
June1959
11*6.1;72.580.3
1,012.9119.5
152.828.082.5
332.2215.039.2
718.6273.2167.0129.8
136.3181.1;
51*. 7187.3385.2
1*1*0.9229.182.6
305.339.9
90.820.233.0
365.11*9.2
l,251*.l*209.1*37.6
595.9132.7
108.2696.3
52.1;98.338.5
190.2628.958.620.6
209.5
1714.383.8
237.019.7
See footnotes at end of table.NOTE: Data for the current month are preliminary.
Digitized for FRASER http://fraser.stlouisfed.org/ Federal Reserve Bank of St. Louis

stry Employment22
Table B-7: Employees in iionasricultnral establishments, by industry division and State-Continued
(In thousands)
AlabamaArizona....Arkansas...California.Colorado...
ConnecticutDelawareDistrict of ColumbiaFloridaGeorgia
Idaho....Illinois.Indiana..IowaKansas...
KentuckyLouisianaMaineMaryland5 ...Massachusetts.
Michigan....Minnesota...Mississippi.MissouriMontana
NebraskaNevadaNew Hampshire.New Jersey....New Mexico....
New YorkNorth Carolina.North Dakota. . .OhioOklahoma
OregonPennsylvania...Rhode Island...South Carolina.South Dakota. ..
Tennessee..TexasUtah *Vermont....Virginia 5
Washington....West Virginia.WisconsinWyoming
Finance, irsurance,and real estate
I960
29.8Hi.612.1
2U0.023.7
(1)5.8
25.1*7U.01*3.1
176.35U.331.022.1
22.732.38.8
1*3.198.2
76.8U6.U12.166.2
6.3
21.33.27.2
89.1*8.6
U82.U39.05.0
115.321*. 5
20.01U7.U12.117.05.7
35.1120.5n . 23.8
1*2.9
37.912.31*3.1
2.7
29.1*lii.512.0
238.723.5
51.05.7
25.273.61*2.8
17U.53.930.121.7
22.332.08.8
1*2.597.5
76.51*5.712.165.16.3
20.83.17.1
89.18.5
1*81.038.5
5.0113.1*
21*. 1*
19.811*5.8
12.016.9
31*. 8118.511.23.8
1*2.2
37.312.11*2.2
2.7
June
30.313.511.9
226.523.8
1*9.65.8
26.272.01*1.8
S.h176.252.629.921.622.131.1*8.7
1*2.296.0
75.51*5.2n.766.66.2
20.72.96.9
88.68.7
1*70.836, U1*.9
111.32k. 3
19.511*5.712.116.6
5.1*31*. 0
117.110.93.8
1*1.937.212.1*1*2.02.6
Service and miscellaneousJune
71*. 51*3.11*2.6
651.870.7
(1)17.980.2
193.597.0
18.81*31*.!*129.587.068.5
78.892.130.5
117.6280.5
235.5122.438.8
161U21.1*
53.033.325.2
21*1.1*36.8
960.1107.1*19.0
373.76U.U60.2
1*58.933.01*1*.519.6
101.3307.1
31*. 216.3
113.2
98.8
2M.312.1;
71*. 11*3.71*2.1
61*3.268.3
103.316.979.7
198.897.1
18.51*29.3129.7
88.668.1*
81.792.2*28.6
116.U275.2
235.0121;. 039.1
165.020.U
52.931.222.9
237.635.9
91*9.2106.1;19.0
373.1*61*. 5
58.91*56.2
32.81*1*.!*19.0
101.530^.7
33.315.0
112.5
97.11*5.1*
11*3.810.5
June
7U.139.61*1.7
617.1*69.8
101.517.776.9
182.1;96.0
19.21*21*. 1126.1
83.167.0
76.890.1;30.U
lll*.l27l*.l*
235.9121.138.3
161;. 221.8
52.530.821-. 2
232.731*. 9
936.1106.718.6
360.165.6
58.61*53.132.6111*. 319.1
101.0299.133.516.2
111.3
91*. 81*5.1*
11*0.611.3
Government
June
156.065.869.0885.7101;. 6
(1)19.0258.8218.6186.2
33.1*1*16.9190.6116.1110.6
109.611*1.91*8.0
31*8.12UU.6
335.611*6.1*
81;. 9195.21*0.3
77.218.322.6
237.663.8
821.0156.5
32.1l;00.6131.5
9U.I*1*31.8
37.992.839.8
11*2.51*25.3
60.816.1
193.8
165.161.1
160.221.1;
MayI960
158.868.772.6
881.1*101;. 1
93.619.0
259.3220.7188.5
32.71*17.1190.2119.011U.8
110.911*3.21*7.9
11*9.521*1*. 9
331.711*6.5
88.8196.9
38.6
78.618.1;22.6
238.363.5
821.1166.531.2
1*01.9133.1;
93.9U36.6
37.9.91*. 238.7
1)43.21*32.2
63.215.9
196.5
166.165.0
157.221.5
June1959
11*9.961.367.8
8U1.6102.5
90.018.1
258.9207.2178.7
33.01*07.1*183.8110.3105.9
109.8138.1*1*5.8
11*3.6238.2
317.511*6.3
81.3187.3
38.8
75.217.722.2
231.660.5
793.1*151.1
31.8391.1125.5
91.11*27.2
37.1*90.238.5
11*5.51*11.259.616.2
189.7
161;. 259.6
155.020.6
2Not available.2 Combined with construction.5 Combined with service.kRevised series; not strictly comparable with previously published data.5 Federal employment in the Maryland and Virginia sectors of the District of Columbia metropolitan area is included in data for
District of Columbia.NOTE: Data for the current month are preliminary.SOURCE: Cooperating State agencies listed on inside back cover.
Digitized for FRASER http://fraser.stlouisfed.org/ Federal Reserve Bank of St. Louis

Area Industry Employment
Table B-8: Employees in uonagricuttHral establishments for selected areas, by industry division
(In thousands)
Industry division
Junei960
JuneLABAMA
June1959
Birmingham Mobile
JuneI960 I960
June1959
ARIZONA
JuneI960
May JuneI960 1959
TOTALMiningContract construction..ManufacturingTrans, and pub. util...TradeFinanceServi ceGovernment
TOTALMiningContract construction..ManufacturingTrans, and pub. util...TradeFinanceServiceGovernment
TOTALMiningContract construction..ManufacturingTrans, and pub. util...TradeFinanceServiceGovernment
TOTALMiningContract construction..Manufacturing » .. . .Trans, and pub. util...Trade,FinanceServiceGovernment
TOTALMining 1Contract construction..ManufacturingTrans, and pub. util...TradeFinanceServiceGovernment
TOTALMiningContract construction..ManufacturingTrans, and pub. util...TradeFinanceServiceGovernment
196.58.211.16O.915.845.711.923.419.5
195.58.311.059.815.745.211.923.120.5
197.08.110.762.815.945.911.723.O18.9
92.1(1)5.317.510.219.73.7
10.025.7
ARKANSAS
93.2(1)5.2I8.710.319.73.7
10.025.6
91.6(1)5.217.910.318.74.210.325.0
172.0.6
17.532.912.646.410.422.029.6
174.8.6
17.632.912.646.710.322.931.2
156.8.4
15.229.912.042.29.6
19.927.6
CALIFORNIA
66.12.76.98.35.7
15.52.6
10.214.2
66.72.76.98.35.5
15.52.5
10.315.0
Little Rock-N. Little Rock
79.4(1)7.0
14.98.0
18.55.1
11.614.3
79.4(1)6.1
15.47.9
18.75.0
11.414.9
77.9(1)6,1
15.18.0
18.35.0
11.214.0
12.6
Los Angeles-Long Beach Sacramento
12.1 12.7
2,318.012.8142.4763.1143.5510.5120.2332.7292.8
San Bernardino-River si de-Ontario
CALIFORNIA—Continued
12.6140.8766.3143.6506.5119.6328.8292.9
2,254.013.1132.1769.3141.1489.8112.83L6.6279.2
170.5.2
14.428.910.733.76.816.059.8
169.7.2
13.929.210.533.76.815.859.6
San DiegoSan Francisco-
Oakland 2
34.2 34.5 36.4
260.9.6
21.566.814.453.311.336.756.3
259.6.6
20.867.O14.253.011.336.356.4
257.9.6
22.572.613.750.910.533.353.8
995.51.9
62.5202.5103.9218.867.5
137.1201.3
988.71.9
61.2200.8IO3.6216.867.3
136.8200.3
973.72.0
61.7200.0106.2211.865.5
132.4194.1
I89.I.1
16.766.99.1
34.27.2
28.726.2
185.3. 1
16.265.19.0
33.57.1
28.326.0
CALIFORNIA—Continued COLORADO CONNECTICUT
Denver Bridgeport
11.6 11.5 12.1
313*84.4
23.462.530.276.917.744.354.4
306.8
21.261.029.775.417.643.354.3
306.64.2
23.858.129.977.218.242.752.5
120.6005.0
65.55.5
20.13 ^
11.49.8
121.4OO5.6
66.15.61
19.93.3
H.59.5
233.60010.889.99.9
44.130.224.224.4
CONNECTICUT—Continued
New Britain
39.4OO1.523.91.85.3.83.12.9
39.600,1.424.31.85.3.83.13.0
39.7
24.41.85.3.83.12.9
DELAWARE
Wilmington
130.8(1)9.3
56.88.6
23.05.3
14.713.1
128.6(1)9.0
56.28.6
22.75.2
13.713.2
130.3(1)9^
57.28.8
22,45.2
14.512.6
(3)3)3)
33)
(3(
122.9
6.743.812.123.56.3
18.412.0
122.5
43.712.323.36.5
18.411.7
DISTRICT OF COLUMBIA
Washington
714.2(1)52.734.546.2
142.237.6
114.2286.8
713.0(1)51.334.546.2
141.837.3
114.6287.3
704.9(1)52.134.045.8
138.936.9
111.4285.8
59.6003.9
23.12.8
11.72.3
10.65.2
58.4OO3.6
22.82.7
11.52.3
10.35.2
57.4003.7
22.52.8
11.32.2
10.04.9
F L O R I D A
Jacksonville
139.6(1)10.919.713.941.418.022.3
139.4(1)10.919.914.141.213.317.922.1
Waterbury
66.4002.1
38.02.99.91.66.3
65.6002.0
37.52.99.81.66.1
62.12.76.09.25.4
14.32.49.2
12.9
138.1(1)11.920.214.439.613.117.321.6
300.7( 1 )24.341.834.385.519.459.336.1
305.9(1)24.242.934.986.719.462.035.8
292.0(1)27.241.634.578.919.456.334.1
160.8.2
12.627.510.930.66.7
14,657.7
I69.I.1
15.657.88.7
31.66.5
25.223.6
232.10012.087.89.7
44.330.124.423.8
67.O002.0
39.32.89.61.66.15-7
See footnotes at end of table. NOTE: Data for the current month are preliminary.
561163 O - 60 - 5
Digitized for FRASER http://fraser.stlouisfed.org/ Federal Reserve Bank of St. Louis

24
Tails M: Eapliyiis ii niairiciltiral istablislmts fir silictii1 arias, by iiiistry Jivisiii- Cutined
(In thousands)
Industry division
TOTALMiningContract construction.ManufacturingTrans, and pub. util.,TradeFinanceServi ceGovernment
TOTALMining ,Contract construction,Manufacturing ,Trans, and pub. util.TradeFinance ,ServiceGovernment ,
TOTAL...MiningContract construction,ManufacturingTrans, and pub. util.,Trade ,FinanceService ,Government
TOTALMiningContract construction,Manufacturing ,Trans, and pub. util.TradeFinanceServiceGovernment
TOTALMiningContract constructionManufacturingTrans, and pub. util.TradeFinanceServiceGovernment
TOTALMiningContract constructionManufacturingTrans, and pub. util.TradeFinanceServiceGovernment
JuneI960
Maty
I960June1959
FLORIDA—ContinuedTampa-
St. Petersburg
?>21.236.114.456.910.626.226.1
21.335.914.257.910.626.226.2
ILLINOIS
185.8(1)22.734.413.854.49.926.224.4
Chicago
333333333
2,378.36.1
113.2852.6200.2506.0139.8326.1234.4
2,398.26.0
113.9877.7203.8501.0141.4325.3229*1
INDIANA—Cont nued
South Bend
82.6(1)3.3
39.34.7
15.13.8
10.65.8
81.9(1)3.1
39.14.8
15.03.8
10.45.7
84.0(1)3.341.34.915.13.710.15.6
KENTUCKY
Louisville
243.0(1)14.983.921.752.611.631.227.1
244.4(1)14.684.521.652.911.632.726.6
246.2(1)15.987.I22.652.211.630.526.4
Lewiston-Auburn
27.3( 1 )1.2
14.31.05.3
.73.31.5
26.8( 1 )1.2
14.01.05.1
.73.31.5
27.1(1)1.114.5.95.2.7
3.31.4
Fall River
42.1
23.91.67.4
3.2
42.2 42.1
24.11.67.4
3.2
24.2
3.2
JuneI960
June1959
6E0R8IA
Atlanta
21.284.535.796.725.547.450.1
361.8(1)21.085.O36.096.625.447.450.4
21.888.135.193.125.146.648.1
Evansville
62.61.72.923.94.514.12.37.35.9
62.31.72.723.84.414.12.3
I'36.0
IOWA
64.51.62.826.04.614.12.37.35.8
Des Moines
103.3(1)6.2
23.39.0
25.311.514.114.0
100.3( 1 )5.0
22.88.8
25.011.114.013.9
101.4(1)6.023.58.725.011.313.713.4
Baton Rouge
70.5• 3
7.018.04.614.53.37.914.9
MA NE
71.7
17.94.614.4
I*38.116.4
71.6.4
7.918.54.615.13.27.814.1
53.1(1)3.112.85.714.83.68.24.9
51.2(1)3.011.85.614.43.68.14.7
52.5(1)3.113.05.614.63.58.24.5
New Bedford '
49.6
1.427.42.28.5
3.7
49.8
1.327.92.18.5
3.8
50.1
1.527.22.28.6
4.0
May196
June1959
&3.515.76.402.92.46.37.5
55*3( l )3.6
15.86.6
12.82.46.37.8
54*9( l )4.2
16.26.3
12.32.36.37.3
25.1(1)2 .12.52.5
l!63.75.4
24.8(1)2.02.52.5
I'.l3.65.3
INDIANA
Fort Wayne
80.3
3.633.76.717.84.37.96.3
8O.5(1)3.434.06.717.74.37.96.5
4.435.76.718.04.27.96.4KANSAS
Topeka
LOUISIANA
New Orleans
280.87.717.245.642.273.416.541.236.9
281.57.517.045.342.273.416.441.738.O
MARYLAND
281.78.019.046.544.172.415.940.735.1
621.2.9
39.^196.055.2
125.732.381.190.6
617.2.9
37.1195.755.3
123.932.18O.991.3
622.0.9
40.5203.255.0123.731.878.288.7
MASSACHUSETTS—Cont i nued
MayI960
June1959
25.2(1)2.22.72.57.31.63.65.3
Indianapolis
291.9(1)15.0
101.220.564.919.231.239.9
292.5( l )14.4
102.021.065.519.030.940.0
291.7
14.1103.421.964.318.430.339.3
48.1. 1
4.16.57.39.42.76.6
11.5
47.4. 1
3.76.57.29-32.66.6
11.5
48.3. 1
3.46.87.29.62.56.5
12.3
117.41.95.8
44.17.3
25.35.4
14.813.1
118.11.95.7
44.77.2
25.45.3
14.713.4
125.21.97.5
48.97.4
26.35.4
14.913.1
Shreveport
72.75.16.89.09.3
19.63.29.5
10.2
72.15.16.58.99.2
19.63.29.4
10.2
72.15.17.29.19.019.43.29.110.0
MASSACHUSETTS
1,070.6(1)53.0
292.468.9
248.873.8
192.5141.2
1,057.4(1)50.9
289.I68.4
244.973.3
189.6141.2
55.2303.970.0243.571.8
Sprlngfield-Holyoke
1 )6.969.58.430.28.121.619.0
163.4(1)6.769.48.330.48.121.519.0
165.4(1)7.271.58.530.27.921.918.2
Worcester
4.051.24.319.35.112.2
109.4(1)3.9
19.45.012*2
109.1(1)4.651.04.519.05.011.913.1
See footnotes at end of table. NOTE: Data for the current month are preliminary.
Digitized for FRASER http://fraser.stlouisfed.org/ Federal Reserve Bank of St. Louis

25 Area Industry Employment
Table B-8: E«pliyees in neiafriciltvral establishieits fir selectei areas, by iriistry divisiei-Ciitiml
(In thousands)
Industry division
Junei960
June1959
Detroit
JuneI960
June1959
JuneI960
June1959
JuneI960
June1959
Grand Rapids Lansing
TOTALMiningContract construction.ManufacturingTrans, and pub. util..TradeFinanceServiceGovernment
TOTALMiningContract construction.ManufacturingTrans, and pub. util..TradeFinanceServi ceGovernment
TOTALMiningContract construction.ManufacturingTrans, and pub. util..TradeFinanceServiceGovernment
TOTALMiningContract construction.ManufacturingTrans, and pub. util..TradeFinanceServiceGovernment
TOTAL....,MiningContract construction.ManufacturingTrans, and pub. util..TradeFinanceServiceGovernment
TOTALMiningContract construction.ManufacturingTrans, and pub. util..TradeFinanceServiceGovernment .
1,159.8.8
HO.9512.369.9
227.01*7.6
130.6
130.7
1,162A.8
41.4514.870.1
228.147.4
130.8129.0
1,169.6.8
49.0
514.3
71.1230.846.7
129.5127.3
117.1(1)3.9
69.14.4
17.22 A9.5
10.5
117.5( l )o
3.869.94.5
17.0
2.4
9.h
10 A
112.9
(1)4.3
65.34.4
n.k2.39.0
10.2
113.7( 1 ) ,5.649.48.0
23.64.1
13.5
9.4
112.9
(1)5 A
48.87.9
23.74.1
13.6
9.3
113.2(1)6.3
49.48.0
23.24.1
12.79.5
88.8(1)4.5
29.53.3
15.72.98.2
24.7
88.1
(1)4.0
29.43.3
15.72.98.1
24.8
89.6
(l)4.8
30.63.4
15.72.97.9
24.4MICHIGAN—Continued MINN SOTA
Muskegon-Muskegon Heights
45-5(1)
l.k
25.72.5
6.8
.93.94.3
45-9(1)l.k
26.32.56.7.83.9k.2
45.4
{1K1.626.02.26.8.8
3.84.3
MISSISSIPPI
Jackson
63.O1.05.9
11.1k.k
lk.1k.k8.7
12.8
62.91.05.6
11.0
k.k
14.5
k.k8.7
13.3NEBRASKA.
61.21.1k.9
11.54.5
14.2
k.38.5
12.2
160.8(4)10.637.320.535.812.623.920.1
159.3(4)10.036.820.135.812.523.9
20.4
158.2(4)10.136.k21.036.012.323.219.2
Newark 7
645.21.0
27.6242.045-3
126.1
1*5.189.868.3
639.3
1.0
26.1238.945.2
125.344.989.268.7
635.21.2
27.1242.8
1+3.2122. k44.887.666.1
NEW MEXICO
Albuquerque
81.7(1)8.67.76.7
18.94.5
18.017.3
81.0(1)8.41*16.6
18.6k.k
17.9H.k
78.7
(1)
Q.k7.76.318.3
4.7
17.2
16.1
Saginaw Minneapolis-St. Paul
53.6
(1)2.924.75.110.21.35.3k.2
53.2
(1)2.624.65.010.21.25.34.2
53.7(1)2.8
25.2
k.910.21.25.2k.2
39.7(1)2.07.96.59.51.87.05.1
39.3(1)1.78.16.2
1.87.05.0
41.6
(1)2.78.76.99*61.77.1k.9
5̂ 3.6(1)32.2
151.2
51.1132.33k.k73.069.3
540.0(1)30.1150.351.1131.633.973.569.5
%?33.6148.952.1131.533.4
71.5
68.5MONTANA
Kansas City
368.6
.9
8.7
106.141.295.024.848.343.6
364.3
• 9
8.0
102.541.394.524.448.144.6
386.7
.9
25.2107.242.795.924.648.441.8
NEVADA
Reno
32.4(6)2.82.1
ftl.k9.95.2
31.5(6)2.92.1
n1.49.35.1
30.3(6)2.92.2n1.29.14.7
NEW JERSEY—Continued
Paterson-Clifton-Passaic
357.7
.420.5159.721.372.812.638.831.6
356.3
.420.3159.221.172.812.438.431.7
358.5
2l!8164.419.871.312.337.431.2
St. Louis Great Falls
734.52.539.3263.768.7154.836.790.378.5
730.12.837.2263.567.8154.136.289.778.8
732.03.038.1267.667.6151.636.390.377.5
NEW HAMPSHIRE
20.4(1)1.83.12.35.8
(1)4 .13-3
19.8( l )1.63.12.25.6
4.03.3
20.8(1)2.33.22.25.7
4.23.2
NEW.JERSEY
Manchester Jersey City
43.2
(1)2.218.32.88.52.55.53.3
42.5
(1)
2.018.12.88.42.45.53.3
42.6
(1)2.218.42.88.22.45.33.3
258.3
8.7118.338.238.O
9.120.525.5
259.1
8.3
119.1
38.5
37.99.120.625.6
260.0
7.6121.637.437.8
8.920.626.1
Perth Amboy Trenton
175.3.79.287.99.127.4
3.3
13.2
24.5
173.8.69.087.29.0
27.3
3.2
13.1
24.4
169.1
8/784.6
8.726.83.212.623.8
104.8
.1
5.139.15.817.63.9
14.8
18.4NEW YORK
104.7.1
4.839.2
5.7
17.6
3.9
14.9
18.5
103.5.1
4.739.75.717.33.814.218.0
Alb any-Schenectady->-Troy
225.6
(1)10.065.317.544.98.6
31.448.0
222.9(1)9.2
65.O
17.3
44.1
8.4
30.7
48.1
224.6
(1)9.0
67.317.544.38.7
30.447.4
Binghamton Buffalo
78.8
(1)3.9
39.73.9
13.02.3
6.8
9.1
78.1
(1)3.6
39A4.0
13.02.26.89.1
79.2(1)3.6
40.54.1
12.72.36.99.2
440.1(1)29.9
178.934.983.61
15.251.446.2
442.5(1)28.3
182.135.686.115.150.844.5
See footnotes at end of table. NOTE: Data for the current month are preliminary.
Digitized for FRASER http://fraser.stlouisfed.org/ Federal Reserve Bank of St. Louis

Area Industry Employment 26
Table B-8: Employees ii loiafriciltiril establ ished fer selected areas, by industry division-Continued
(In thousands)
Industry division
TOTALMiningContract construction,ManufacturingTrans, and pub. util..TradeFinanceServiceGovernment ,
TOTAL
MiningContract construction.ManufacturingTrans, and pub. util..TradeFinanceServiceGovernment ,
TOTALMining ,Contract construction,ManufacturingTrans, and pub. util..TradeFinanceServiceGovernment .'....
TOTALMining ,Contract constructionManufacturingTrans, and pub« util.,Trade ,Finance ,ServiceGovernment
TOTAL
MiningContract constructionManufacturingTrans, and pub. util.Trade ,FinanceServiceGovernment
TOTALMiningContract construction,ManufacturingTrans, and pub. util.TradeFinance ,Service.Government
JuneI960 I960
June1959
Elmira 5
33.2
16.1
6.1
32.9
15.9
6.1
31.6
14.6
6.1
Rochester
(33333
(3(3(3)
217.8
(1)
9.9
105.09.739.37.8
2k.e21.2
217.6(1)11.1
105 A9.939.07.624.130.5
104.7(1)9.5
25.1*
10. 4
29.1
7.2
13.5
9.6
104.8(1)9.025.910.4
28.8
7.1
13.5
10.1
101.0
(1)7.925.710.128.56.713.38.8
Akron
175.7.1
7.783.6
12.5
32.84.719.614.6
175.6.1
7.283.612.532.74.6
19.9
14.8
169.5•1
8.178.212.632.64.619.214.2
257.3
I6!o72.918.353.314.534.846.8
256.4
.715.073.1I8.353.314.23^.747.3
254.1
.816.071.518.552.714.133.546.9
OKLAHOMA
Oklahoma City
168.8
6.912 .420.012.241.49-520.6U5.8
168.2
6.9
11.7
19.612.21*1.29.5
20.6
46.5
163.9
6.9
13.019.212.638.5
9.4
20.6
43.7
JuneI960
June1959
NEW Y0RK— ContinuedNassau and
Suffolk Counties '
423.7(1)35.7
119.923.098.417.361.268.2
416.0
(1)34.8
119.123.095.917.158.267.9
418.2
(1)40.4120.022.993.715.959.665.6
NEW YORK—
Syracuse
181.0
(1)9.169.132.736.3
7.922.223.8
178.8
(1)7.768.612.636.1
7.922.523.5
179.9
69.I12.736.57.922.022.9
NORTH CAROLINAGreensboro-High Point
44.8 44.9 44.9
112.5.5
4.757.26.420.1
3.211.49.0
112.3.6
4.6
57.5
6.4
19.83.111.39.0
113.5
.6
4.5
58.0
6.5
20.1
3.1
11.8
8.9OHIO — I
Dayton
246.2.4
10.5103.49.942.36.227.845.6
245.4.4
9*7103.59.842.26.1
27.845.7
247.8.4
11.1106.39.741.96.227.045.1
131.013.09.8
28.014.931.8
6.5
16.2
10.8
130.412.89.628.214.931.66.416.110.8
129.8
13.79.429.4
13.7
30.86.416.110.3
JuneI960 I960
June1959
New York City
3,577.51.9
134.5961.9322.0766.3384.5598.4408.2
3,573.31.9
130.3965.6322.4763.7383.9598.5407.0
New York-NortheasternNew Jersey
3,529.3
1.9
132.4959.0323.9746.2376.7584.1405.1
Utica-Ttome
102.0
(1)4.4
39.55-7
16.73.8
10.0
21.9
100.8(1)3.8
39.55.6
16.4
3.79.9
21.8
103.1
(1)4.4
40.75.7
17.2
5321.5
Winston-Salem
37.4 38.0 36.7
Cincinnati
397.8
.3
21.5
154.032.578.620.249.241.5
397.9
.321.2154.832.578.319.748.742.5
398.6
.320.7156.432.779.119.548.940.8
159.3
.29.159.413.435.3
6.0
21.3
14.6
"I"158.8
.28.459.613.335.0
5.8
21.5
14.9OREGON
155.6.2
8.158.213.8
34.55.621.114.1
265.2
16.265.927.965.914.335.439.6
259-9(1)15.063.627.365.I14.135.239.6
260.8(1)14.366.828.063.614.034.939.2
Junei960
May195
June1959
5,697.2
5.2
258.11,766.3475.9
1,182.9484.0863.4661.6
5,675.3
5.1249.8
1,766.1476.3
1,175.8482.6859.5660.0
5,628.0
5.3
258.91,768.2
473.31,150.9
473.9845.1652.4
Westchester County
225.5(1)18.265.214.948.811.039.727.7
224.3(1)18.365.415.047.910.939.627.1
224.5(1)18.864.215.247.811.040.726.8
NORTH DAKOTA
Fargo
23.6
(1)2.51.92.87.91.73.53.3
23.2
(1)2.21.82.77.91.73.53.3
23.6
(1)2.62.22.77.61.63.53.3
701.2.5
34.0288.745.0
140.031.585.975.6
698.6.5
32.2289.545.0
139.631.285.874.9
701.5.5
35.0291.646.2138.830.885.O73.7
Youngstown
160.6.4
8.376.9
9.4
tl17.714.2
163.1.4
8.179.59.4
29.64.1
17.714.3
170.2
.48.787.19.529.I4.017.513.8
PENNSYLVANIAAllentown-
Bet hlehem-Easton
179.6.5
7.397.511.028.0
4.617.912.8
180.0.5
7.3
97.6
11.027.94.6
18.1
13.0
177.0
8 ^94.311.128.04.6
17.712.6
See footnotes at end of table. NOTE: Data for the current month are preliminary.
Digitized for FRASER http://fraser.stlouisfed.org/ Federal Reserve Bank of St. Louis

27 Area Industry Empl
Table B-8: Employees in nonafricultural establishments for selected areas, by inlnstry dmsion-Contiiied
(In thousands)
Industry division
JuneI960 I960
June1959
Erie
Junei960
June1959
PEHHSYLVAHIA— Continued
Harrisburg
JuneI960
June1959
Lancaster
JuneI960 I960
June1959
Philadelphia
TOTALMiningContract construction,Manufacturing ,Trans, and pub. util.,Trade ,FinanceService ,Government
TOTALMiningContract construction,ManufacturingTrans, and pub. util..TradeFinanceServiceGovernment
TOTALMiningContract construction.ManufacturingTrans, and pub. util..TradeFinanceServiceGovernment
TOTALMiningContract construction.Manufacturing.Trans, and pub. util..TradeFinanceServiceGovernment
TOTALMiningContract construction.ManufacturingTrans, and pub. util..TradeFinanceServiceGovernment
TOTALMiningContract construction.ManufacturingTrans, and pub. util..TradeFinanceServiceGovernment
76.4(1)2.2
36.45.5
14.02.39.07.0
75.9(1)2.0
36.35.5
13.8|-38.97.1
75.8(1)3.0
35.35.7
13.92.28.86.9
11*3.0(1)9.1
34.812.724.8
5.217.538.9
142.1(1)8.6
35.012.724.65.1
16.939.2
142.1
%35.813.124.35.2
16.339.1
93.2(1)
5.016.42.2
10.07.5
92.3(1)4.9
46.64.8
16.32.29.97.6
92.0(1)5.3
47.34.7
16.02.19.67.0
1,485.52.0
73.6555.8112.6289.276.O
196.0180.3
1,484.22.0
70.2556.9112.2289.975.2
197.1180.7
1,478.31.8
78.2551.7112.2292.475.4
189.4177.2
PENNSYLVANIA—Continued
Pittsburgh
776.813.843.3
294.961.3
156.031.1
104.072.4
780.913.842.1
300.661.9
154.731.0
103.773.1
800.514.244.1
316.663.6
155.631.4
103.072.0
PEHHSYLVAHIA—Continued
York
82.6(1)4.6
42.45.1
13.41.77.67.8
82.0(1)4.6
41.95.0
13.31.77.58.0
82.9(1)5.0
42.44.8
13.81.67.38.0
SOUTH CAROLINA —Continued
Greenville
70.5(1)6.4
32.63.5
13.12.66.45.9
70.9(1)6.3
32.53.5
13.02.66.46.6
61.6(l)5.2
31.63.5
12.52.66.55.7
Reading
100.7(1)4.2
52.45.8
15.33.6
11.18.3
100.7(1)4.0
52.45.8
15.33.6
11.18.5
100,5(1)4.5
51.75.9
15.43.6
11.38.1
RHODE I S L A N D
Providence
279.8(1)11.4
131.113.648.611.730.532.9
277.8(1)10.9
130.113.448.611.630.332.9
280.0(1)11.6
130.713.449.811.730.232.6
SOUTH DAKOTA
Sioux Falls
26.5(1)2.05.62.67.8
3.1
26.2(l)1.75.72.57.71.54.03.2
TENNESSEE—Continued
26.5(1)1.85.92.57.91.53.93.0
Memphis
190.3.2
10.346.116.151.29.2
25.831.4
182.6.3
10.840.716.150.38.9
25.629.9
TEXAS—
92.9 92.8 94.3
138.7
8!l37.911.031.19.621.818.9
ontinued
139.9•37.739.111.031.09.521.919.4
137.2.3
7.339.511.130.29.421.118.3
San Antonio
23.7 23.4 22.9
WiIkes-BarreHazleton
29.3 29.0 30.1 40.5
SOUTH CAROLINA
40.3 40.7
Charleston
55.8(1)3.610.24.612.32.45.317.4
56.4(1)3.610.34.612.22.45.318.0
55.4(1)4.19.94.811.72.3
16.7
TENN SSEE
Chattanooga
91.3.1
4.141.44.816.04.88.911.2
90.6.14.240.84.815.94.99.010.9
90.0.1
4.341.04.815.94.89.110.0
Columbia
70.3(1)4.712.25.315.64.48.219.9
70.0(1)4.712.2
15.64.48.119.7
68.4(1)4.211.95.215.34.38.019.5
Knoxville
TEXAS
(3(3(3(33333)3 )
112.41.77.6
42.66.6
22.03.2
11.217.5
110.21.77.242.36.622.33.211.115.8
Dallas
90.8 91.5
UTAH
91.5
Salt Lake City2
140.07.28.824.313.137.68.719.221.1
138.47.18.424.112.937.18.618.921.3
138.27.39.323.213.436.68.319.021.1
Fort Worth
52.7 52.9
VERMONT
55.1
Burlington 5
20.9
4.91.75.5
20.4
4.91.75.3
20.9
5.01.65.4
See footnotes at end of table. NOTE: Data for the current month are preliminary.
Digitized for FRASER http://fraser.stlouisfed.org/ Federal Reserve Bank of St. Louis

28
Talli B-8: Eipliyns ii uiifriciltiral istallishieits fir selectii areas, by iidistry Jivisioi-Coitiiiid
(In thousands)
Industry division
Junei960
Mayi960
Jane
1959VERMONT—Continued
Springfield 5
Junei960 i960
June
1959
Junei960
Mayi960
VIRGINIA
June
1959
Norfolk-Portsmouth
Richmond
JuneI960
MayI960
June
1959WASHINGTON
Seattle
TOTALMiningContract constructionManufacturingTrans, and pub. util.TradeFinanceServiceGovernment
TOTALMining ,Contract construction,ManufacturingTrans, and pub. util.TradeFinance ,Service ,Government
TOTALMiningContract constructionManufacturing ,Trans, and pub. util.TradeFinanceService ,Government ,
12.0
6.6.8
1.6
11.8
6.6.8
1.6
11.7
6.2.8
1.6
151.1.2
12.216.515.236.8
18.01*6.8
150.9.2
11.916.915.236.75.3
17.6Vf.l
150.3.2
12. If15.615.536.1|5-3
17.h
.212.8ki.k15.638.513.019.623. h
161*. 5.2
12.6la. 715.638.512.919.523.5
WASHINGTON—Continued
162.6.2
12.01*1.715.638.312.919.1*22.5
369.1(1)18.7
113.231.581.921.71*6.156.0
367.0(1)17.9
113.031.281.521.21*5 J*56.8
371.9(1)19.0
120.330.782.021.5
WEST VIRGINIA
Spokane Charleston
(1)h.6
13-78.220.6*uo
12.513.0
75.3
(1)
7.920.1*3.9
12.1*12.8
78.3(1)5.1-ll*.68.5
20.1*
13.1
77.7
17. ̂6.216.23.50.2
WEST VIRGIHIA--Continued
76.8
16.96.1
15.93.59.0
20.6
76.5(l)5.0
16.66,3
15.9
O.I)
20.5
77.53.'+3.8
23.1*9.0
16.93.38.99.1
wise KSIM
77.0
3-H3.623.2
3.916.63.29.0
73.5l*.lh.k22.99.0
16.73.39.38.8
Wheeling Milwaukee
53. h3.32.0
16.6
13.02.16.7
53.93.32.517.1l*.l13.22.07.01*.8
3.12.813.31*.212.72.16.9
^53.6(1)23.3197.928.188.621.351.31*3.0
U19.7
(1)22.0
196.727.888.320.951.81*2.2
51.9(1)23.2
199.728.287.920.650.1*1*1.9
ho.8(1)1.7
18.1*1.97.61.05.9k.k
1*0.6
^l1.618.61.8l.h1.05.7i*.i*
69(l)2.121.91.97.5.95-3
Huntington-Ashland
67.11.22.725.06.9ll*.l2.1*7.37.6
66.31.22.72l*.l6.8ll*.O2.37.*7.9
WYOMING
Casper
19.11*.61.72.01.7^.3.82.02.0
I8.9U.31.72.01.6l*.l.8
2.02.1+
68.01.03.225.27.2
15.02.1*7.07.2
18.03.71.72.01.7
2.1
1 Combined with service.2 Revised series; not strictly comparable ifith previously published data.5 Not available.* Combined with construction.5 Total includes data for industry divisions not shown separately.* Combined vrith manufacturing.7 Subarea of New York-ITortheastern New Jersey.NOTE: Data for the current month are preliminary,SOURCE: Cooperating State agencies listed on inside back cover.
Digitized for FRASER http://fraser.stlouisfed.org/ Federal Reserve Bank of St. Louis

29Historical Hour
Table M: Grtss heirs ail eaniifs if priiictin wirkirs ii raifactiriif
1919 ti Jati
Manufacturing
Year and monthweeklyearnings
weeklyhours
hourlyearnings
Durable goods
weeklyearnings
weeklyhours
hourlyearnings
Nondurable goods
weeklyearnings
weeklyhours
Averagehourly
earnings
19191920 : .192119221923
192U1925192619271928
1 9 2 9 . . . .1930.193119321933
19341935193619371938
1939i94o19*1119421943
19441945.. ' .19W19^719W
19^9195019511952 . . .1953
195**1955.195619571958
1959
1959: JulyAugust, • •,September,October..November.,December.,
I960: January.. ,February.,March. . . . ,A p r i l . . . . ,MayJune
July ,
$22.0826.3022.1821.5123.82
23.9324.3724.6524.7^24.97
25.0323.2520.8717.0516.73
18. 4020.1321.7824.0522.30
23.8625.2029.5836.6543.14
46.0844.3943.8249.9754.14
54.9259.3364.7167.9771.69
71.8676.5279.9982.3983-50
89.1*7
89.6588.7089.1*789.0688.9892.16
92.2991. XU90.9189.6091.3791.60
91.1U
.347.443.144.245.6
43.744.545.045.044.4
44.242.1I1O.538.338.1
34.636.639.238.635.6
37.738.1ko.642.944.9
45.243.44o.440.440.1
39.2to.540.740.740.5
39.740.740.439.839.2
1*0.3
1*0.21*0.51*0.31*0.339.91*0.6
1*0.339.839.739.339.91*0.0
39.8
$0,477.555.515.487.522
.547
.5^7
.548
.550
.562
.566
.552
.515
.446
.442
• 532.550.556.624.627
.633
.661
.729
.853
.961
1.0191.0231.0861.2371.350
l1.4651.591.671.77
1.811.881.982.072.13
2.22
2.232.192.222.212.232.27
2.292.292.292.282.292.29
2.29
$25.78
25.8426.3926.612D.OO27.24
27.2224.7721.2816.2116.43
I8.8721.5224.0426.9124.01
26.5028.4434.0442.7349.30
52.0749.0546.4952.4657.11
58.0363.3269.1*773.4677.23
77.1883". 2186.3188.6690.06
97.10
96.8095.8896.7096.5295.1*1*99.87
100.8698.9898.71*97.3698.5898.98
97.84
32.634.8
33.937.341.040.035.0
38.039.342.145.1k6.6
K.644.140.24o.640.5
39.54l.241.641.541.3
40.241.441.140.339.5
1*0.8
1*0.51*0.8I4O.8h0.91*0.11*1.1
1*1.01*0.1*1*0.339.91*0.1*1*0.1*
1*0.1
$0,497.472
.556
.577
.586
.674
.686
.724
.808
.9^71.059
1.1171.1111.156I.292l.4io
1.4691.537I.671.771.87
1.922.012.102.202.28
2.38
2.392.352.372.362.382.43
2.U62.1*52.1*52.1*1*2.1*1*2.1*5
2.1*1*
$21.94
22.0722.4422.7523.0122.88
22.9321.8420.5017.5716.89
18.0519.H19.&21.5321.05
21.7822.2724.9229.1334.12
37.1238.294l.l446.9650.61
51.4154.7158.4660.9863.60
64.7468.0671.1073.5175.27
79.60
80.0080.2080.7979.7980.3981.19
80.7779.9579.9379.5281.3582.16
81.95
4l.94o.o
35.136.137.737.436.1
37.437.0
38.94o.342.5
1*3.142.340.54o.l39.6
38.839.739.539.639.5
39.039.839.539.138.8
39.6
39.81*0.139.839.539.639.8
39.k39.038.838.6
39.339.5
$0,420.427
.515
.530
.529
• 577.584
.582
.602
.640
.723
.803
.861
.9041.0151.1711.278
1.3251.3781.481.541.61
1.661.711.801.881.94
2.01
2.012.002.032.02
2,032.0U
2.052.052.062.06
2.072.08
39.1* 2.08
NOTE: Data for the 2 most recent months are preliminary.Data on hours of work based on the household survey are shown in tables A-15 through A-19.Data in all tables in Section C relate to the United States without Alaska and Hawaii.
Digitized for FRASER http://fraser.stlouisfed.org/ Federal Reserve Bank of St. Louis
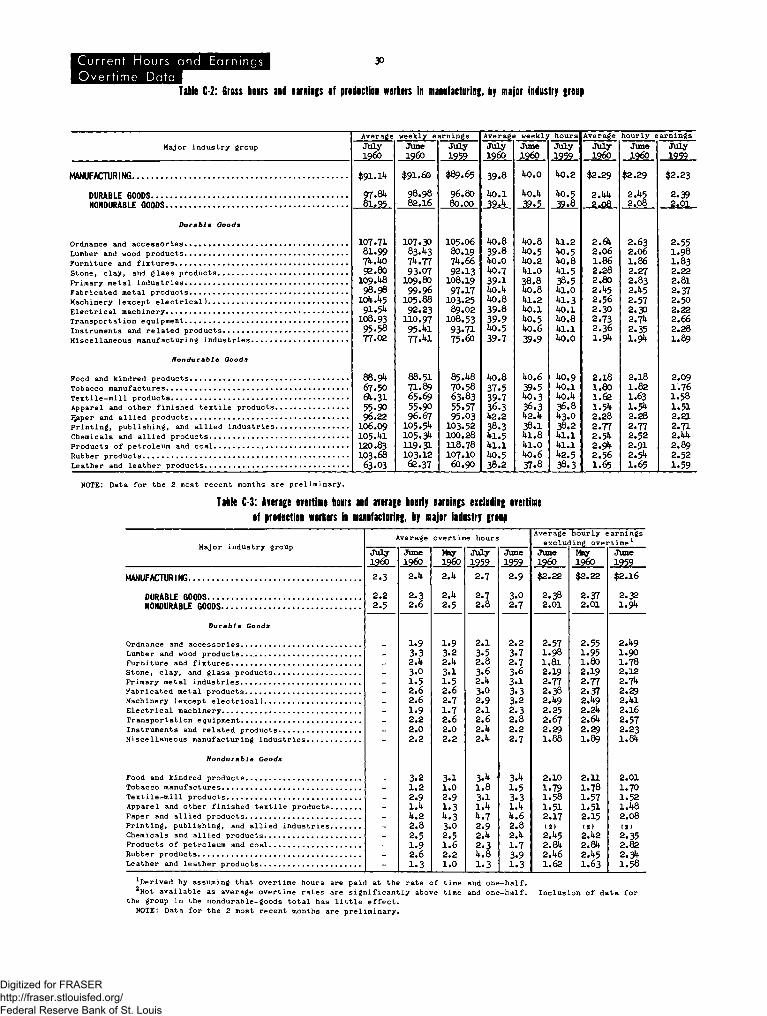
Current Hours and EarningsOvertime Data
Table C-2: Gross hours and earnings of production workers in manufacturing, by major industry group
Major industry group
MANUFACTURING.
DURABLE GOODS....NONDURABLE GOODS.
Durable Goods
Ordnance and accessoriesLumber and wood productsFurniture and fixturesStone, clay, and glass productsPrimary metal industriesFabricated metal productsMachinery (except electrical)Electrical machineryTransportation equipmentInstruments and related productsMiscellaneous manufacturing industries.
Nondurable Goods
Food and kindred productsTobacco manufacturesTextile-mill productsApparel and other finished textile products.P̂ aper and allied productsPrinting, publishing, and allied industries.Chemicals and allied productsProducts of petroleum and coalRubber productsLeather and leather products
Average weekly earnings
Julyi960
$91.14
97.8481.95
107817492
109984
91089577 02
88.9467.5064.3155.9096.22
106.09105.41120.83103.6863.03
Junei960
$91.60
98.9882.16
107.3083.4374.7793.07
109.8099.96
105.8892.23
110.9795.^177.41
88.5171.8965.6955.9096.67
105.54105.34119.31103.1262.37
July1959
$89.65
96.8O80.00
IO5.O680.1974.6692.13
108.1997.17
103.2589.02
108.5393.7175.60
85.4870.5863.8355.5795.03
103.52100.28H8.78107.1060.90
Average weekly hoursJulyI960
39.8
40.139.4
40.839.840.040.739.140.440.839.839.940.539.7
40.837.539.7
42.238.341.541.140.538.2
JuneI960
40.0
40.439.5
40.840.540.241.038.840.841.240.140.540.639.9
40.639.540.336.342.438.141.841.040.637.8
July1959
40.2
40.539.8
41.240.540.841.538.541.041.340.140.841.140.0
40.940.140.436.843.038.241.14 l . l42.538.3
Average hourly earnings
JulyI960
$2.29
2.442.08
JuneI960
$2.29
2.452.08
2.642.061.862.282.802.452.562.302.732.361.94
2.181.801.621.542.282.772.542.942.56I.65
2.632.061.862.272.832.452.572.302.742.351.94
2.181.82I.631.542.282.772.522.912.541.65
$2.23
2.392.01
2.55I.981.832.222.812.372.502.222.662.28I.89
2.091.761.581.512.212.712.442.892.521.59
NOTE: Data for the 2 most recent months are preliminary.
Table C-3: Average overtime hours and average hourly earnings excluding overtimeof production workers in manufacturing, by major industry group
Major industry group
MANUFACTURING.
DURABLE GOODS....NONDURABLE GOODS.
Durable Goods
Ordnance and accessoriesLumber and wood products.Furniture and fixturesStone, clay, and glass productsPrimary metal industriesFabricated metal productsMachinery (except electrical)Electrical machineryTransportation equipmentInstruments and related productsMiscellaneous manufacturing industries.
Nondurable Goods
Food and kindred productsTobacco manufacturesTextile-mill productsApparel and other finished textile productsPaper and allied productsPrinting, publishing, and allied industriesChemicals and allied productsProducts of petroleum and coalRubber productsLeather and leather products
Average
JulyI960
2.3
2.22.5
_________-
_-_-_____
Junei960
2.4
2.32.6
1.93.32.43.01.52.62.61.92.22.02.2
3.21.22.91.44.22.82.51.92.61.3
overtime hours
MayI960
2.4
2.42.5
1.93.22.43.11.52.62.71.72.62.02.2
3.11.02.91.34.33.02.51.62.21.0
July1959
2.7
2.72.8
2.13.52.83.62.43.02.92.12.62.42.4
3.*1.83.11.44.72.92.42.34.81.3
June1959
2.9
3.02.7
2.23.72.73.63.13.33.22.32.82.22.7
3.41.53.31.44.62.82.41.73.91.3
Average hourly earningsexcluding overtime1
JuneI960
$2.22
2.382.01
2.571.981.812.192.772.382.492.252.672.291.88
2.101.791.581.512.17(2)2.452.842.461.62
MayI960
$2.22
2.372.01
2.551.951.802.192.772.372.492.242.642.291.89
2.111.781.571.512.15(2)2.422.842.45I.63
June1959
$2.16
2.321.94
2.491.901.782.122.742.292.412.162.572.231.84
2.011.701.521.482.08(2)2.352.822.341.58
derived by assuming that overtime hours are paid at the rate of time and one-half.2Not available as average overtime rates are significantly above time and one-half,
the group in the nondurable-goods total has little effect.NOTE: Data for the 2 most recent months are preliminary.
Inclusion of data for
Digitized for FRASER http://fraser.stlouisfed.org/ Federal Reserve Bank of St. Louis
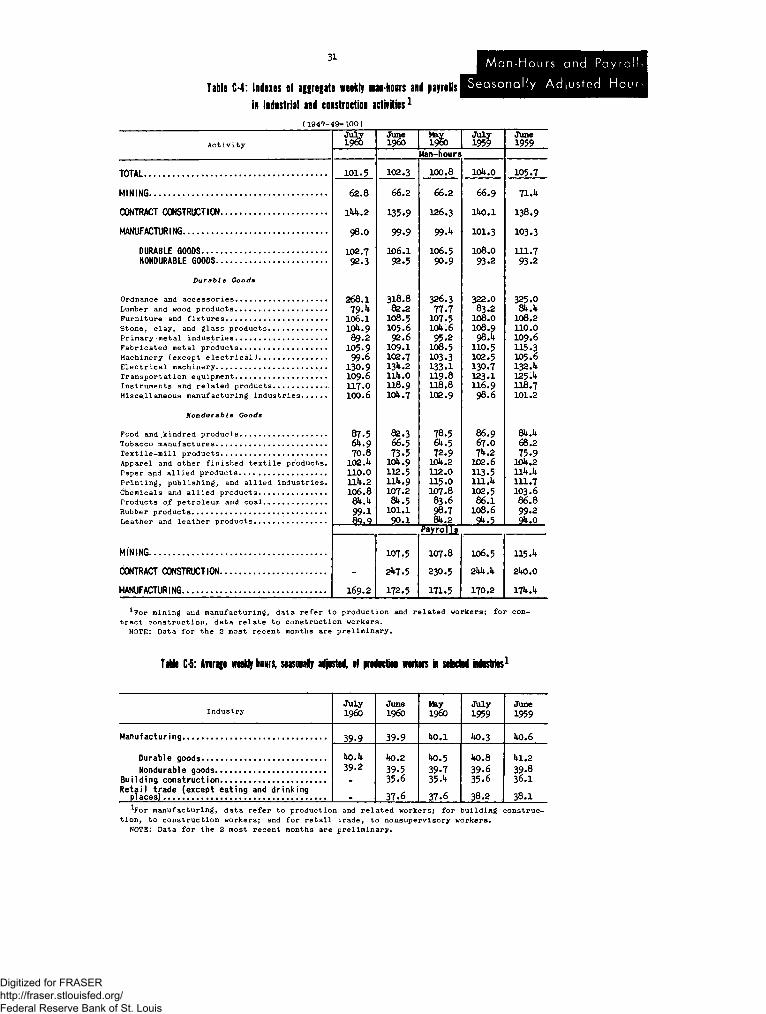
31
Table C-4: Indexes of aggregate weekly man-hours and payrolls
in industrial and construction activities1
, Man-Hours and Payrol
Seasonally Adjusted Hou
(1947-49-100)
Activity
TOTAL
MINING
CONTRACT CONSTRUCTION.
MANUFACTURING
DURABLE GOODS....NONDURABLE GOODS.
Durable Goods
Ordnance and accessoriesLumber and wood productsFurniture and fixturesStone, clay, and glass productsPrimary metal industriesFabricated metal productsMachinery (except electrical).Electrical machinery •Transportation equipmentInstruments and related productsMiscellaneous manufacturing industries
Nondurable Goods
Food and .kindred productsTobacco manufacturesTextile-mill productsApparel and other finished textile products.Paper and allied productsPrinting, publishing, and allied industries.Chemicals and allied productsProducts of petroleum and coal.Rubber productsLeather and leather products
MINING
CONTRACT CONSTRUCTION.
MANUFACTURING
101.5
62.8
144.2
98.0
102.792.3
268.179.**106.1104.989.2105.999.6130.9109.6117.0100.6
87.56U. 970.8
102. 4110.0114.2106.884.499.189.9
169.2
rune May•960 I I960
Man-hours
102.3
66.2
135.9
99.9
106.192.5
318.882.2
IO8.5105.692.6
109.1102.7134.2114.0118.9104.7
82.366.573.5
104.9112.5114.9107.284.5
101.190.1
107.5
247.5
172.5
100.8
66.2
126.3
99.4
106.590.9
326.377.7
107.5104.695.2
IO8.5103.3133.1119.8118.8102.9
78.564.572.9104.2112.0115.0107.883.698.784.2
Payrolls
107.8
230.5
171.5
July1959
104.0
66.9
140.1
101.3
108.093.2
322.083.2
108.0IO8.998.4
110.5102.5130.7123.1116.998.6
86.967.O74.2
102.6113.5111.4102.586.1
108.694.5
106.5
244.4
170.2
June1959
105.7
71.4
138.9
103.3
111.793.2
325.084.4
108.2110.0109.6115.3105.6132.4125.4II8.7101.2
84.468.275.9
104.2114.4111.7103.686.899.294.0
115.4
240.0
174.4
*For mining and manufacturing, data refer to production and related workers; for con-tract construction, data relate to construction workers.NOTE: Data for the 2 most recent months are preliminary.
Table C-5: Average weekly hours, seasonaly adjusted, of production workers in selected industries1
IndustryJulyI960
JuneI960
MayI960
July1959
June1959
Manufacturing. 39-9 39.9 40.1
Durable goodsNondurable goods
Bu i1dIng construct ionRetail trade (except eating and drinking
pi aces)
40.439-2
40.239.535.6
37.6
40.539.735.4
37.6
40.3
40.839.635.6
38.2
40.6
41.239.836.1
38.1
For manufacturing, data refer to production and related workers; for building construc-tion, to construction workers; and for retail trade, to nonsupervisory workers.
NOTE: Data for the 2 most recent months are preliminary.
Digitized for FRASER http://fraser.stlouisfed.org/ Federal Reserve Bank of St. Louis

Industry Hours and Earnings
Table C-6: Crass l i i rs ui eariiifs of prtlictrei workers,1 by iiinstry
Average weekly earningsIndustry June
i960May JuneI960 1959
Average weekly hours
Junei960
June1959
Average hourly earnings
June1959
MINING.
M E T A L M I N I N GIron miningCopper miningLead and zinc mining.
ANTHRACITE MINING
BITUMINOUS-COAL MINING.
CRUDE-PETROLEUM AND NATURAL-GAS PRODUCTION:Petroleum and natural-gas production (except contractservices)
NONMETALLIC MINING AND QUARRYING.
CONTRACT CONSTRUCTION.
NONBUILDING CONSTRUCTIONHighway and street construction.Other nonbuilding construction..
BUILDING CONSTRUCTION.
GENERAL CONTRACTORS.
SPECIAL-TRADE CONTRACTORSPlumbing and heatingPainting and decoratingElectrical workOther special-trade contractors.
MANUFACTURING.
DURABLE GOODS....NONDURABLE GOODS.
Durable Goods
ORDNANCE AND ACCESSORIES.
LUMBER AND WOOD PRODUCTSSawmills and planing millsSawmills and planing mills, generalSouth2
West8
Millwork, plywood, prefabricated structural woodproductsMillworkPlywoodWooden containersWooden boxes, other than cigar....
Miscellaneous wood products
FURNITURE AND FIXTURESHousehold furniture.Wood household furniture, except upholsteredWood household furniture, upholsteredMattresses and bedsprings ,Office, public-building, and professional furnitureWood office furnitureMetal office furniturePartitions, shelving, lockers, and fixturesScreens, blinds, and misc. furniture and fixtures
STONE, CLAY, AND GLASS PRODUCTSPlat glass.... ...Glass and glassware, pressed or blown..Glass containersPressed or blown glassGlass products made of purchased glass.Cement, hydraulic
$110.29
111.99118.90113.80
93-94
93.56
120.41
113.81
100.80
121.13
120.47117.43123.91
120.88
110.77
126.67134.85118.27148.99121.40
91.60
98.9882.16
107.30
83.4379.7781.1954.9599.96
82.7681.1984.7762.1261.3170.14
74,70<64,
73.80,88,74,97-96,77«
93.07124.2692.6394.1990.2373.52106.14
$110.70
114.01120.22115.54
94.58
82.29
119.03
116.03
98.78
119.56
118.03IH.9O123.86
119.91
110.26
124.93132.68116.60148.23119.70
91.37
98.5881.35
107.79
81.4078.9480.3655.1797.61
84.4280.5888.9962.4762.4069.29
74.1969.6565.2570.6981.2487.5471.6696.2994.6076.76
92.84124.9793.1594.8990.7472.95
104.14
$111.49
107.79116.18106.6091.66
82.75
126.49
112.56
98.08
116.66
117.46113.88120.77
116.66
108.19
121.81128.78114.52143.91116.28
91.17
99.3679.60
105.47
82.1980.7081.5453.68
100.61
85.9084.2088.8261.1261.1566.74
74.6670.6464.4374.2982.2185.9069.OI96.1295.9175.81
92.16134.9487.7888.4486.5174.7098.88
41.0
42.141.043.641.2
33.9
36.6
40.5
45.O
37.5
41.442.740.1
36.3
36.2
36.438.235.238.935.6
40.0
40.439.5
40.8
40.540.740.842.639.2
39.639.839.840.640.641.5
40.239.840.838.138.941.443.841.141.440.4
41.039.740.140.639.438.941.3
41.0
42.741.644.141.3
29.6
36.4
41.0
43.9
36.9
40.741.639.7
35.9
35.8
35.937.834.638.535.0
39.9
40.439.3
41.3
40.140.941.043.139.2
40.239.541.241.141.641.0
40.139.841.337.438.541.142.440.840.640.4
40.939.840.540.939.838.641.0
41.6
41.340.242.340.2
30.2
38.8
45.2
38.0
42.143.340.8
36.8
36.8
36.838.135.939.036.O
40.7
41.439.8
41.2
41.341.641.642.640.9
41.7U2.141.741.341.641.2
1*0.840.641.339.140.941.142.640.941.741.2
41.742.339.91*0.239.540.641.2
$2.69
2.662.902.612.28
2.76
3.29
2.81
2.24
3.23
2.912.753.09
3.33
3.06
3.463.533.363.833.41
2.29
2.452.08
2.63
2.061.961.991.292.55
2.092.042.131.531.51I.69
1.861.761.581.922*072.131.692.372.341.91
2.273.132.312.322.291.892.57
$2.70
2.672.892.622.29
2.78
3.27
2.83
2.25
3.24
2.902.693.12
3.34
3.08
3.483.513.373.853.42
2.29
2.442.07
2.61
2.031.931.961.282.49
2.102.042.161.521.50I.69
1.851.751.581.892.112.131.692.362.331.90
2.273.142.302.322.281.892.54
$2,68
2.612.892.522.28
2.74
3.26
2.80
2.17
3.07
2.792.632.96
3.17
2.94
3.313.383.193.693.23
2.24
2.402.00
2.56
1.991.941.961.262.46
2.062.002.131.481.471.62
I.831.74I.561.902.012.091.622.352.301.84
2.213.192.202.202.191.842.40
1See footnotes at end of table. NOTE: Data for the current month are preliminary.
Digitized for FRASER http://fraser.stlouisfed.org/ Federal Reserve Bank of St. Louis
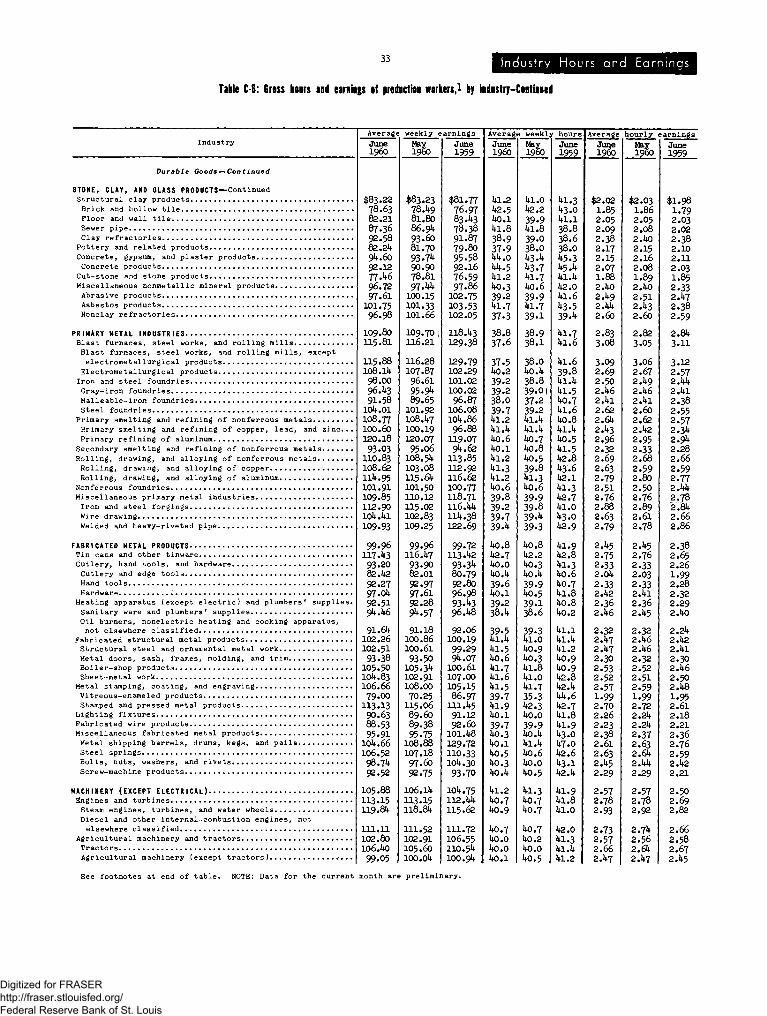
33 Industry Hours and Earnings
Table C-6: Gross hours and earnings of production workers,1 by industry-Continued
Industry JuneI960
Average weekly hours
June MayI960 19
June1959
Average hourly earnings
June1959
JuneI960
Durable Goods-—Continued
STONE, CLAY, AND GLASS PRODUCTS—ContinuedStructural clay productsBrick and hollow tileFloor and wall tileSewer pipeClay refractories
Pottery and related productsConcrete, gypsum, and plaster productsConcrete productsCut-stone and stone productsMiscellaneous nonmetallic mineral products.Abrasive productsAsbestos productsNonclay refractories
PRIMARY METAL INDUSTRIESBlast furnaces, steel works, and rolling mills ,Blast furnaces, steel works, and rolling mills, exceptelectrometallurgical productsElectrometallurgical productsIron and steel foundries ,Gray-iron foundriesMalleable-iron foundriesSteel foundries ,
Primary smelting and refining of nonferrous metalsPrimary smelting and refining of copper, lead, and zinc..,Primary refining of aluminumSecondary smelting and refining of nonferrous metals ,Rolling, drawing, and alloying of nonferrous metalsRolling, drawing, and alloying of copperRolling, drawing, and alloying of aluminumNonferrous foundriesMiscellaneous primary metal industriesIron and steel forgingsWire drawingWelded and heavy-riveted pipe
FABRICATED METAL PRODUCTSTin cans and other tinwareCutlery, hand tools, and hardwareCutlery and edge toolsHand toolsHardware •Heating apparatus (except electric) and plumbers' supplies.Sanitary ware and plumbers' suppliesOil burners, nonelectric heating and cooking apparatus,not elsewhere classified
Fabricated structural metal productsStructural steel and ornamental metal workMetal doors, sash, frames, molding, and trimBoiler-shop productsSheet-metal workMetal stamping, coating, and engravingVitreous-enameled productsStamped and pressed metal productsLighting fixturesFabricated wire productsMiscellaneous fabricated metal productsMetal shipping barrels, drums, kegs, and pailsSteel springsBolts, nuts, washers, and rivetsScrew-machine products
MACHINERY (EXCEPT ELECTRICAL)Engines and turbines •Steam engines, turbines, and water wheelsDiesel and other internal-combustion engines, notelsewhere classified
Agricultural machinery and tractorsTractors ,Agricultural machinery (except tractors)
$83.2278.6382.2187.3692.5882.2494.6092.1277-4696.7297.61
101.7596,98
109.80115.81
115.88108.1498.00
96.4391.58
104.01
108.77100.60120.1893.03
110.83108.62114.95101.91109.85112.90104.41109.93
99.96117.4393.2082.4292.2797.0492.5194.46
91.64102,26102.5193.38
105.50104.83106.6679.00
113.1390.6388.5395.91
104.66106.5298.7492.52
105.88113.15119.84
l l l . l l102.80106.4099.05
$83.2378.4981.8086.9493.6081.7093.7490.9078.8197.44
100.15101.33101.66109.70116.21
116.28107.8796.6195.9489.65
101.92108.47100.19120.0795.06
108.54103.08115.64101.50110.12115.02102.83109.25
99.96116.4793.9082.0192.9797.6192.2894.57
91.18100.86100.6193.50
105.34102.91108.0070.25
115.0689.6089.3895.75
108.88107.1897.60
92.75
106.14113.15118.84
111.52102.91105.60100.04
$81.7776.9783.4378.3891.8779.8095.5892.16
76.5997.86
102.75103.53102.05
118.43129.38
129.79102.29101.02100.02
96.87106.08104.86
96.88
119.0794.62
113.85112.92116.62100.77118.71116.44114.38122.69
99.72113.4293.3480.7992.8096.9893.4396.48
92.06100.1999.2994.07
100.61107.00105.1586.97
111.4591.1292.60
101.48129.72110.33104.3093.70
104.75112.44115.62
111.72106.55110.54100.94
41.242.540.141.838.937.944.044.541.240.339.241.737.3
38.837.6
37.540.239.239.238.O39.741.241.440.640.14l.241.341.240.639.839.239.739.4
40.842.740.040.439.640.139.238.4
39.541.441.540.641.741.641.539.741.940.139.740.340.140.540.340.4
41.240.740.9
40.740.040.040.1
4l.O42.239.941.839.038.O43.443.741.740.639.941.739.1
38.938.1
38.O40.438.839.0 I37.239.241.441.440.740.840.539.841.340.639.939.839.439.340.842.240.340.439.940.539.138.6
39.341.040.940.341.841.041.735.342.340.039.940.441.440.640.040.5
41.340.740.7
40.740.240.040.5
41.343.041.138.838.638.O45.345.441.442.041.643.539.4
41.741.6
41.639.841.441.540.741.640.841.440.541.542.843.642.141.342.741.043.042.9
4l.942.841.340.640.741.840.840.2
41.141.441.240.940.942.842,444.642.741.841.943.047.042.643.142.4
41.941.841.0
42.041.341.441.2
$2.021.852.052.092.382.172.152.071.882.402.492.442.60
2.833.08
3.092.692.502.462.4l2.622.642.432.962.322.692.632.792.512.762.882.632.79
2.452.752.332.042.332.422.362.46
2.322.472.472.302.532.522.571.992.702.262.232.382.612.632.452.29
2.572.782.93
2.732.572.662.47
$2.031.862.052.082.402.152.162.081.892.402.512.432.60
2.823.05
3.062.672.492.462.412.602.622.422.952.332.682.592.802.502.762.892.612.78
2.452.762.332.032.332.412.362.452.322.462.462.322.522.512.591.992.722.242.242.372.632.642.442.29
2.572.78
2.92
2.742.562.642.47
$1.981.792,032.022.382.102.112.031.852.332.472.382.59
2.843.11
3.122.572.442.412.382.552.572.342.942.282.662.592.772.442.782.842.662.86
2.382.652.261.992.282.322.292.40
2.242.422.412.302.462.502.481.952.612.182.212.362.762.592.422.21
2.502.692.82
2.662.582.672.45
See footnotes at end of table. NOTE: Data for the current month are preliminary.
Digitized for FRASER http://fraser.stlouisfed.org/ Federal Reserve Bank of St. Louis

Industry Hoi Earninqs 3k
Table C-6: Gross hoirs a i l eaniigs of production workers,1 by intostry-Contiiied
Industry
Durable Goods—Continued
MACHINERY (EXCEPT ELECTR4CAL)—ContinuedConstruction and mining machineryConstruction and mining machinery, except for oil fields,,.Oil-field machinery and tools... .
Metalworking machinery >Machine tools . . .Metalworking machinery (except machine tools)Machine-tool accessoriesSpecial-industry machinery (except metalworking machinery^.Pood-products machineryTextile machinery. •Paper-industries machineryPrinting-trades machinery and equipmentGeneral industrial machinery • •Pumps, air and gas compressors .Conveyors and conveying equipmentBlowers, exhaust and ventilating fansIndustrial trucks, tractors, etcMechanical power-transmission equipmentMechanical stokers and industrial furnaces and ovens......
Office and store machines and devicesComputing machines and cash registersTypewritersService-industry and household machines.Domestic laundry equipment *,Commercial laundry, dry-cleaning, and pressing machines...Sewing machines .Refrigerators and air-conditioning unitsMiscellaneous machinery parts • . .Fabricated pipe, fittings, and valvesBall and roller bearingsMachine shops (job and repair)
ELECTRICAL MACHINERYElectrical generating, transmission, distribution, andindustrial apparatus. «Wiring devices and suppliesCarbon and graphite products (electrical).Electrical indicating, measuring, and recordinginstruments
Motors, generators, and motor-generator setsPower and distribution transformersSwitchgear, switchboard,, and industrial controlsElectrical welding apparatus
Electrical appliancesInsulated wire and cable.Electrical equipment for vehiclesElectric lamps . . .,Communication equipmentRadios, phonographs, television sets, and equipment...Radio tubesTelephone, telegraph, and related equipment
Miscellaneous electrical productsStorage batteriesPrimary batteries (dry and wet)...X-ray and nonradio electronic tubes ,
TRANSPORTATION EQUIPMENTMotor vehicles and equipmentMotor vehicles, bodies, parts, and accessories.4Truck and bus bodiesTrailers (truck and automobile)Aircraft and partsAircraftAircraft engines and partsAircraft propellers and parts.Other aircraft parts and equipmentShip and boat building and repairing....Ship building and repairing.Boat building and repairingRailroad equipmentLocomotives and partsRailroad and street carsOther transportation equipment
AverageJunei960
$102.77IOU.60
98.50122.52
no. 83nu.09131.71101.9U101.9388.U1
n5.07113.85103.U1101.75105.5695.U1
102.72103.1299.53
1O3.U2n2.88
86.U198.8996.519O.U5
109.3799.70
100.6097.7699.8U
102.18
92.23
96.8882.8696.96
89.8210U.75102.91100.10
no. 8591.6U90.1097.3286.7589.2U86.7683.60
10U.0888.1*3
100.1578.8898.U9
no. 97n2.U611U.U9100.9U
85.80
no.8Uno. 57106!85108.Uo105.3U
no. 8880.39
109.U8109.60109.5286.97
weekly earnings""Hay
i960
&1O2.U710U.30
98.21123.36
n2.#86133.3U102.12103.7587.78
11U.36n3.i6103.16101.2610U.1293.85
105.7310U.30
99.05103.28i n . 52
9O.5U99.1U9U.U991.13
109.62100.UU100.85
97.2799.U5
102.92
91.37
96.2U82.0898.U2
89.87102.9199.90
100.85no . 76
91.8088.6298.5587.3087.3U85.5081.37
100.U589.6598.1579. OU99.$$
ni .66113.85n6.i899.7086.U6
n o . 29109.U8
i n . 92n8.3O109.06105.U6
no. 258U.05
ni.39n5.62109.7086.63
June1959
$105.72103.17n2.9111$. 83105.50108.99123.3699.22
101.7687.13
100. nn o . 17102.U198.59
107.6192.80
107.27106.8297.6U99.38
ni.7682.U798.1699.2987.5199.0798.98
103.8199.87
107.9310U.13
90.58
96.0082.UO95.35
86.27102.92100.60100.1*3n5.32
89.2789.2U96.1*685.8U86.6785.8879.0098.6688.3U
100.U371.U697.75
109.06
i n . 22113.02102.77
89.U6107.98107.20109.30103.58109.30100.7U105.30
79.791X3. U2n2.88113.Uo90.23
AverageJuneI960
U0.3U0.739.UU3.6U2.3U2.1UU.8U2.3U1.1Ul.9U6.UU2.8ia . 2U1.7U0.6uo.6U0.6UO.6Ul.3Uo.UU0.939.1U0.237.7U0.2UU.iU0.2Uo.U39.939.0la . 2
U0.1
U0.238.9UO.U
U0.1UO.6U1.0U0.2U2.839.5U2.539.U38.9U0.239.8Uo.oia. 839.339.9
ia. 3U0.7
U0.5UO.6UO.6i a . 239.0U0.9U0.8Ul.3U2.UUO.639.639.639.639.1Uo.o38.739.0
weekl;MayI960
Uo.5U0.939.6U3.91*3.1Ul.8U5.2U2.2Ui.5Ul.8U6.3U2.7Ul.l
ia. 5U0.239.6Ul.3U0.9
Uo^5U0.7Uo.6Uo.337.2Uo.5UU.2Uo.5
Uo.539.739.0Ul.5
39.9
U0.138.9UO.5
UO.3U0.239.8Uo.5U2.639.UU2.239.939.539.739.U39.5U1.0U0.239.9Ul.6U0.8
U0.9Ul.1Ul.2ia . 239.3U1.0U0.7Ul.3
k$.$U1.0U0.139.8Ul.239.5
U1.038.939.2
r hoursJune1959
U2.8Ul.6k$.9U2.9Ul. 7Ul.6U3.9U2.UU2.UU2.5U2.6U2.7Ul.8Ul.6U2.2U0.7U2.UU2.9Ul.2Uo.U
la. 738.9U0.9U0.2U0.7Ul.8U0.9U2.2Ul.1U3.0U2.5
U0.8
Ul.2Uo.oU l . 1
Uo.5Ui .5U1.UUi.5U5.U39.5U2.7U0.7UO.3Uo.5U0.739.9UO.6U0.9Ui.539.7U0.9
U1.0
Ui.5U1.UU3.0U2.0U0.9UO.3Ui.U
Ul.6U2.239.239.01*0,5U0.8Ui.5Uo.5U1.2
AverageJunei960
2! 572.502.812.622.712.9U2.U12.U82 . n2.U82.662.512.UU2.602.352.532.5U2.U12.562.762.212.U62.562.252.U82.U82.U92.k$2.562.U8
2.30
2.U12.132.U0
2.2U2.582.512.U92.592.322.122.U72.232.222.182.092.U92.252.511.912.U2
2.7U2.772.822.U52.202.712.712.752.522.672.662.802.032.802.7U2.832.23
hourly eMayI960
$'2.532.552.U82.812.612.702.952.U22.502.102.U72.652.512.UU2.592.372.562.552.U12.552.7U2.232.U62.5U2.252.U82.U82.U92.U52.552.U8
2.29
2.U02 . n2.1*3
2.232.562.512.U92.602.332.102.U72.212.202.172.062.U52.232.U61.902.UU
2.732.772.822.U22.202.692.692.71
2*.662.632.772.0U2.822.822.822.21
June1959
$2.U72.U82.U62.702.532.622.812.3U2.U02.052.352.582.U52.372.552.282.532.U92.372.U62.682.122.UP2.U72.152.372.U22.U62.1*32.512.U5
2.22
2.332.062.32
2.X32.U82.1*32.U22.5U2.262.092.372.132.1U
2.n1.982.1*32.162.U21.802.39
2.662.682.732.392.132.6U2.662.6U2.U92.592.572.701.972.782.722.802.19
ee footnotes at end of table. NOTE: D^ta for the current month are preliminary.
Digitized for FRASER http://fraser.stlouisfed.org/ Federal Reserve Bank of St. Louis

35 Hours and Earnings
Tabli C-6: Gross boirs and oaniifs of productioi workers,1 by JBdistry-Contimed
IndustryAverage weekly earnings
I960Junei960
June1959
Average weekly hoursJune May JuneI960 I960 1959
Average hourly earnings
Junei960 i960 June
1959
$2.292.652.282. all2.031.932.551.95
1.901.891.802.H*2.111.7U1.681.851.771.752.012.00
2.092.332.602.372.072.102.191.691.781.752.092.161.902.072.111.902.292.1*52.161.771.722.381.722.972.362.002.1*51.76
1.731.99i.ia1.751.60
1.581.721.1*91.501.1*81.551.531.651.511.691.61
Durable Goods—Continued
INSTRUMENTS AND RELATED PRODUCTS.Laboratory, scientific, and engineering instruments.Mechanical measuring and controlling instruments....Optical instruments and lensesSurgical, medical, and dental instrumentsOphthalmic goods ;Photographic apparatusWatches and clocks •
MISCELLANEOUS MANUFACTURING INDUSTRIESJewelry, silverware, and plated wareJewelry and findingsSilverware and plated ware
Musical instruments and parts.Toys and sporting goods < <Games, toys, dolls, and children's vehiclesSporting and athletic goods .
Pens, pencils, other office supplies , »....Costume jewelry, buttons, notionsFabricated plastics products .:..Other manufacturing industries.
Nondurable Goods
FOOD AND KINDRED PRODUCTS*.Meat products ,Meat packing, wholesale ...,Sausages and casingsDairy products ...Condensed and evaporated milkIce cream and ices ..
Canning and preserving.Sea food, canned and curedCanned fruits, vegetables, and soups......
Grain-mill productsFlour and other grain-mill productsPrepared feeds
Bakery productsBread and other bakery productsBiscuit, crackers, and pretzelsSugar.Cane-sugar refiningBeet sugar .Confectionery and related productsConfectionery
BeveragesBottled soft drinks. r.Malt liquorsDistilled, rectified, and blended liquors.
Miscellaneous food productsCorn sirup, sugar, oil, and starchManufactured ice. ,
TOBACCO MANUFACTURESCigarettesCigarsTobacco and snuff.Tobacco stemming and redrying.
TEXT1LE-MILL PRODUCTSScouring and combing plants....Yarn and thread mills..Yarn millsThread mills ....
Broad-woven fabric millsCotton, silk, synthetic fiber.North4
South2
Woolen and worstedNarrow fabrics and smallwares-.
$95.1*1Hi*. 9593.6798.5385.6978.61
106.8678.01
77.U.80.1676.6789.1090.5869.1*565.1*977.6170.8870.0583.2380.19
88.5198.1*9
112.3210l*.l*8
90.7392.1695.8267.865U.O872.91;9l*.6l97.6885.9388.7590.6181.8199.66
112.3288.2072.6270.05
100.3775.1*0
123.1195.8085.91
109.6279.83
71.8985.2851*. 5270.1*666.02
65.697U.O359.5860.1361.6066.5865.1*1*69.91*6U.627l*.5568.1+7
$9l*.77112.88
93.9098.3683.6280.1*0
106.31*77.1a
77.1*180.7777.1*689.5187.3871.1667.7378.0072.1868.2983.0381.00
88.9199.55
H2.59103.91
89.0190.8393.7570.0557.3i;73.309k. 1896.1k87.2287.0589.3278.0097.61
107.3388.5571.5068.7899.7973.39
121.3096.1*385.90
105.81;83.08
68.5880.2651*.i*368.0861.78
65.3673.1559.8960.5960.9666.016U.8769.7061*.1*673.2566.50
112.1095.3090.0582.-6278.55
105.3277.1*2
76.9577.8771*. 8885.8186.9367.6961*. 8573.2671.6970.8883.8281.00
85.699U.60
107.38100.1*9
87.7786.1095.1*866.1*262.3067.9092.3896.31*86.0781*. 2586.3075.6293.89
1O2*.1381*. 8970.2767.7798.7777.UO
119.6991.3383.80
109.0382.19
67.9980.6051*.3i*67.0360.61;
61*.1*675.8560.3560.9058.3161*. 0262.5867.1*961.7671*. 3666.98
1*0.61*1.81*0.2ia.i*U1.039.7ia.i39.2
39.9ho.91*1.01*0.51*0.838.83Q.339.839.639.81*0.839.7
1*0.61*0.7la. 61*2.31*2.2ia.71*2.1*37.730.938.81*3.1*1*1*. 21*3.1*1*0.91*1.01*0.31*1.71*3.239.239.939.81*0.81*2.61*0.139.1la. 5h3.$kh.6
39.$1*1.037.638.539.3
1*0.31*2.339.239.338.51*1.11*0.91*0.91*0.91*2.61*1.0
1*0.51*1.51*0.31*1.51*0.2l*o.h1*0.938.9
39.91*1.01*1.21*0.539.939.138.71*0.01*0.138.81*0.939.9
1*0.61*0.81*1.7U 9
fekla. 338.729.339.21*3.1*1*3.51*1*. 51*0.31*0.639.01*0.51*1.638.539.539.31*0.1*ia.739.939.21*1.3142.0
38.138.1*37.837.237.9
1*0.1la. 839.1*39.638.1ia.o1*0.8ia.o1*0.81*2.11*0.3
la. 21*2.31*1.81*0.21*0.71*0.71*1.339.7
1*0.5la. 2ia.61*0.11*1.238.938.639.61*0.51*0.51*1.71*0.5
39.31*0.538.1*38.337.9
1*0.8l*l*.l1*0.51*0.639.1*1*1.31*0.91*0.91*0.9l*l*.o1*1.6
$2.352.752.332.382.091.982.601.99
1.91*1.96I.872.202.221.791.711.951.791.762.0U2.02
1*1.01*0.61*1.31*2.1*1*2.1*1*1.01*3.639.335.038.81*1*. 21*1*.6\$.31*0.71*0.939.81*1.01*2.539.339.739.U1*1.51*5.01*0.338.71*1.9^.51*6.7
2.182.1|22.702.1*7
2* 212.261.801.751.882.182.211.982.172.212.032.392.602.251.821.762.i61.773.072.1*52.072.521.79
1.822.081.1*51.831.68
1.631.751.521.53I.601.621.601.711.581.751.67
2.722.332.372.081.992.601.99
1.91*1.971.882.212.191.821.751.951.801.762.032.03
2.192.hk2.70
2.271.811.951.872.172.211.962.162.202.002.1*12.582.301.811.752.1*71.763.01*2.1*62.082.521.81
1.802.09U*l*1.831.63
1.631.751.521.531.601.611.591.701.581.71*1.65
See footnotes at end of table. NOTE: Data for the current month are preliminary.
Digitized for FRASER http://fraser.stlouisfed.org/ Federal Reserve Bank of St. Louis

Industry Hours and Earnings 36
Table C-6: Gross hours aid oaniRfs of production workers,1 by industry-Continued
IndustryAverage weekly earnings
May JuneI960
JuneI960 1959
Average weekly hoursJune May JuneI960 I960 1959
Average hourly earningsJune Hay JuneI960 I960 1959
Nondurable Goods — Continued
TEXTILE-MILL PRODUCTS—ContinuedKnitting mills.Pull-fashioned hosieryNorth4
South2
Seamless hosieryNorth4
South2 ,Knit outerwearKnit underwearDyeing and finishing textilesDyeing and finishing textiles (except wool)
Carpets, rugs, other floor coveringsWool carpets, rugs, and carpet yarn
Hats (except cloth and millinery)Miscellaneous textile goodsFelt goods (except woven felts and hats)Lace goodsPaddings and upholstery fillingProcessed waste and recovered fibersArtificial leather, oilcloth, and other coated fabrics....Cordage and twine
APPAREL AND OTHER FINISHED TEXTILE PRODUCTSMen's and boys' suits and coatsMen's and boys' furnishings and work clothingShirts, collars, and nightwearSeparate trousersWork shirtsWomen's outerwearWomen's dressesHousehold apparel.Women's suits, coats, and skirts
Womenrfs, children's under garmentsUnderwe.ar and nightwear, except corsetsCorsets and allied garments . . . »
MillineryChildren's outerwearMiscellaneous apparel and accessoriesOther fabricated textile productsCurtains, draperies, and other housefurnishingsTextile bagsCanvas products
PAPER AND ALLIED PRODUCTSPulp, paper, and paperboard mills.Paperboard containers and boxes...Paperboard boxesFiber cans, tubes, and drumsOther paper and allied products...
P R I N T I N G , P U B L I S H I N G , A N D A L L I E D I N D U S T R I E SNewsp apersPeriodicalsBooks ,Commercial printingLithographingGreeting cards.Bookbinding and related industriesMiscellaneous publishing and printing services.
CHEMICALS AND ALLIED PRODUCTSIndustrial inorganic chemicalsAlkalies and chlorineIndustrial organic chemicals.Plastics, except synthetic rubberSynthetic rubberSynthetic fibersExplosives
Drugs and medicines.Soap, cleaning and polishing preparationsSoap and glycerin
$58.6757.3859.8256.1753.865U.1053.8662,085*+.7275.007^.5879.7973.3**62.7077.H+82.6170.3179.9861+.62106.1862.63
55.9072.191+8.991+9-5251.301+3.6657.295^.251+8.9169.9150.981+8.6055.8956.7053.0552.1+262.2752.2662.1+963.27
96.67105.1+689.61+89.0292.2985.70
105.51+112.99115.62
93.60IOU.91107.9272.3882.1+3
111+.88
10511511611211612396
101+
| 3121+
$58.2257.7660.2256.5552.8853.5352.8861.6655.6871+.O573.6379.0071+.1061.6675.5878.9970.3077.8166.62
102.2962.08
55.9069.121+8.81+1+9.21+50.671+2.81+59.0060.7250.6063.8851.051+8.2856.5255.91+51.6252.2761.6652.3162.1+063.52
96.05101+.61+
88.3I+87.1297.1+186 .11
106.37113.31111+.379*1.25
105.06110.5573.5381.20
115.97
103.58lll*.53115.75110.77111+.97122.60
92.62102.3693.73
110.95120.60
$58.1+157.1559.1+^56.1+753.2752.3953.1361.1557.2071+.2271+.2279.7675.9862.9375.0381.8170.1071+.5961+.79
103.2663.20
55.0565.651+9.021+9.021+9.661*5.91*57.295l+.771+9.OI68.5U51.151+8.91+56.0956.1+352.0852.9760.1351.8562.0961.71
9I+.60102.75
87.9987.3691.81+83.1+0
102.87
IO8.63IO8.6790.62
101.92106.2670.0280.11115.28
100.1+3111.22110.21+106.91112.75121.8089.13
100.1+590.17
1O1+.55112.33
38.637.538.137.238.238.138.238.838.O1+1.91+1.91+O.338.1+37.11+0.61+0.137.21+0.61+0.91+1+.838.9
36.338.1+37.1+37.838.037.033.732.135.731+.135.936.O35.631.537.136.1+38.236.839.31+0.3
1+2.1+1+3.1+1+1.51+1.61+0.31+1.1+
38.136.11+1.01+0.039.039.138.538.737.3
1+1.81+2.01+2.1+1+2.31+3.61*1.51+1.61+0.91+0.1+1+1.81+2.1
38.338.038.637.737.537.737.538.338.1+1+1.61+1.61+0.139.036.71+0.239.337.039.91+1.91*3.938.8
36.338.1+37.037.338.136.03l*.53>*.536.1+32.135.735.536.O30.1+36.136.338.337.139.039.7
1+2.51+3.61+0.91+0.91+1.11+1.8
38.1+36.21+0.71+0.839.21+0.238.138.337.9
1+1.61+1.81+2.1+1+1.81+2.91+1.71+0.81+0.31+0.1+1+1.1+1*1.3
39.237.638.137.1*38.639.138.539.21+0.01+2.91+2.91+0.91+0.236.81+1.01+0.738.11+0.11+1.81+1+.71+0.0
36.737.338.338.338.239.63l*.l32.636.33**.l36.836.836.931.737.237.338.337.339.31+0.6
1+3.0i+i+.i1+1.91+2.01+1.01+1.7
38.135.51+0.139.1*39.239.538.938.738.3
1*1.51*1.51+1.61+1.61+3.21+2.01+0.71+1.01+0.81+1.01+0.7
$1.521.531.571.511.1+11.1+21.1+11.601 . 1 + 1 +1.791.781.981.911.691.902.06I.891.971.582.371.61
1.5**1.881.311.311.351.181.70I.691.372.051.1+21.351.571.801.1*31.1+1+1.631.1+21.591.57
2.282.1+32.162.11+2.292.07
2.773.132.822.31+2.692.761.882.133.08
2.522.762.71+2.672.682.972.312.552.332.712.96
$1.521.521.561.50l.l+l1.1+21.1+11.611.1*51.781.771.971.901.681.882.011.901.951.592.331.60
1.51*1.801.321.321.331.191.711.761.391.991.1*31.361.571.81+1.1*31.1+1+1 .61l . i+ i1 .601.60
2.262.1+02.162.132.372.06
2.773.132.812.312.682.751.932.123.06
2.1+92.71+2.732.652.682.91+2.272.51*2.322.682.92
$1.1*91.521.561.511.38l.3l*1.381.561.1*31.731.73lm&1.891.711.832.011.81+1.861.552.311.58
1.501.761.281.281.301.161.681.681.352.011.391.331.521.781.1+01.1+21.571.391.581.52
2.202.332.102.082.21+2.00
2.703.062.712.302.602.691.802.073.01
2.1+22.682.652.572.612.902.192.1+52.212.552.76
See footnotes at end of table. NOTE: Data for the current month are preliminary.
Digitized for FRASER http://fraser.stlouisfed.org/ Federal Reserve Bank of St. Louis

37
Tikli C-6: Grass burs HI" tannis if ireiictiu warkirs.1 by
IndustryAverage weekly earningsJuneI960 I960
June1959
Average weekly hoursJuneI960
June1959
Average hourly earningsJune J*qr JuneI960 I960 1959
Nondurable Goods—Continued
CHEMICALS AND ALLIED PRODUCTS—ContinuedPaints, pigments, and fillers.Paints, varnishes, lacquers, and enamels
Gum and wood chemicalsFertilizers ...Vegetable and animal oils and fatsVegetable oilsAnimal oils and fats.....
Miscellaneous chemicals ,Essential oils, perfumes, cosmetics...Compressed and liquefied gases
PRODUCTS OF PETROLEUM AND COALPetroleum refining ..Coke, other petroleum and coal products
RUBBER PRODUCTSTires and inner tubesRubber footwearOther rubber products..., «
LEATHER AND LEATHER PRODUCTSLeather: tanned, curried, and finishedIndustrial leather belting and packingBoot and shoe cut stock and findings...Footwear (except rubber )Luggage.Handbags and small leather goods.Gloves and miscellaneous leather goods
TRANSPORTATION AND PUBLIC UTILITIES:
TRANSPORTATION:Interstate railroads:
Class I railroadsLocal railways and bus lines
COMMUNICATION:TelephoneSwitchboard operating employees' <Line construction employees7 .
Telegraph8
OTHER PUBLIC UTILITIES:Gas and electric utilities ,Electric light and power utilities. ,Gas utilities ,Electric light and gas utilities combined
WHOLESALE AND RETAIL TRADE:
WHOLESALE TRADE
RETAIL TRADE (EXCEPT EATING AND DRINKING PLACES)General merchandise stores.Department stores and general mail-order housei
Food and liquor storesAutomotive and accessories dealersApparel and accessories storesOther retail trade:Furniture and appliance storesLumber and hardware supply stores
FINANCE, INSURANCE, AND REAL ESTATE:Banks and trust companies •.Security dealers and exchanges;Insurance carriers
$103.07100.3291.568O.5692.*2
8*.97
IOI.389*.9*77.77113.28
119.31122.51IO8.78
103.12121.8082.2192.57
62.3786.0577.8159.6659.8*66.7057.385**39
(5)
99.99
88.0969.9*I2O.98104.00
109.20109.20101.8*
115.3*
92.69
68.80*9-7*56.3571.9691.7352.82
76.8982.88
69.5611*.7*88.23
$102.*l99.9087.7*79.7*8 *982.2298.**95.0678.19
115.18
H8.O3123.11102.51
100.0*
117.51ai.*o90.12
59.9083.0777.0358.2556.8065.0757.0752.71
107.59
99.79
87.8170.69119.71
97.75
109.3*109.61101.15116.18
92.*6
67.69*8.8755.0*70.6090.8751.56
75.0782.*9
69.75111.5*88.15
$98.8896.608*.*078.3887.2081.7593.6692.0377.60
105.66
117.79120.39IO8.29
98.7*
108.93
81.58
9*.98
61.5080.9*83.3858.7*59.**65.635*.5*51.66
108.2895.92
85.0268.08
115.*866
105.37106.6098.*9
110.5*
91.13
67.79*'8.725*.7270.299O.*l52.55
75.9580.70
67.69123.7285.91
*1.9*1.8*3.6*2.**3.8*3.8*3.7*0.*38.5*1.8
*1.0*0.7*2.0
*0.6*0.6*0.3*0.6
37.8*0.*39.338.037.*39.737.537.0
1 1 »
*3.1
39.537.6*2.9*2.8
*0.9*0.9*0.9*0.9
*0.3
37.83**335.035.8* * . l3*.3
*0.9*2.5
37. *
*1.8*1.8*2.8*3.1*3.2*3.5*2.8*0.838.9*2.5
*0.7*0.9*0.2
39.739.7*0.139.7
36.339.039.137.135.538.537.336.1
*1.7*3.2
39.237.**2.6*2.5
*0.8*0.9*0.3*1.2
*0.2
37.*33.73*.*35.3*3.933.7
*0.8*2.3
37.3
*1.9*2.0*2.2*2.6*3.6*2.8*4.6*0.9*0.0*1.6
*0.9*0.**2.3
*0.336.8*1.2*2.*
38.239.1*1.938.938.139.337.136.9
*2.8*3.6
39.037.2*2.3*2.2
*1.0*1.0*0.7* ! . *
*0.5
38.33*.835.336.8* * . l3*.8
*1.5*2.7
37.*
$2.*62.*02.101.902.111.9*2.322.352.022.71
$2.*52.392.O5I.852.071.892.302.332.012.71
2.913.012.59
2.5*3.002.0*2.28
I.652.131.981.571.601.681.53l.*7
(51
2.32
•2.231.862.822.*3
2.672.672.*92.82
2.30
1.82l.*51.612.012.081.5*
1.88
1.95
1.86
2.903.012.55
2.522.962.032.27
I.652.131.971.571.60I.691.53l.*6
2.582.31
2.2*1.892.812.30
2.682.682.512.82
2.30
1.81l.*51.602.002.071-53
1.8*
1.95
I.87
$2.362.302.001.8*2.001.912.102.251.9*2.5*"
2.882.982.56
2.*52.961.98
2.2*
1.612.071.991.511.56,I.67l.*7l.*0
2.532.20
2.181.83
2.572.602.*22.67
2.25
1.77l.*01.551.912.051.51
I.831.89
1.81
See footnotes at end of table. NOTE: Data for the current month are preliminary.
Digitized for FRASER http://fraser.stlouisfed.org/ Federal Reserve Bank of St. Louis

38
Table C-6: Gross hours ai l taniifs if pnlictiii wtrktrs,1 by iil istry-Cutiiiel
Industry
SERVICE AND MISCELLANEOUS:Hotels and lodging places:
Hotels, year-round9
Personal services:LaundriesCleaning and dyeing plants
Motion pictures;Motion-picture production and distribution.
$1*7.32
1*6.9251*. 79
103.15
Average weekly hours
June MayI960 I960
39.9
i*o.o39.9
39.9
39.939.1*
June1959
1*0.1
1*0.139.7
Average hourly earnings
JuneI960
$1.21
1.221.1*3
MayI960
$1.21
1.221.1*2
$1.18
1.171.38
1Por mining and manufacturing, laundries, and cleaning and dyeing plants, data refer to production and related workers; for con-tract construction, to construction workers; and for all other industries, to nonsupervisory workers.
2South: Includes the following 17 States—Alabama. Arkansas, Delaware, District of Columbia, Florida, Georgia, Kentucky, Louisiana,"Maryland, Mississippi, North Carolina, Oklahoma, South Carolina, Tennessee, Texas, Virginia, and West Virginia.
*West: Includes California, Oregon, and Washington.*North: Includes all States except the 17 listed as South in footnote 2.6Not available.*Data relate to employees in such occupations in the telephone industry as switchboard operators; service assistants; operating
room instructors; and pay-station attendants. In 1959, such employees made up 36 percent of the total number of nonsupervisory em-ployees in establishments reporting hours and earnings data.
7Data relate to employees in such occupations in the telephone industry as central office craftsmen; installation and exchangerepair craftsmen; line, cable, and conduit craftsmen; and laborers. In 1959, such employees made up 30 percent of the total number
• of nonsupervisory employees in establishments reporting hours and earnings data.8Data relate to domestic employees except messengers.*Money payments only; additional value of board, room, uniforms, and tips, not included.NOTE: Data for the current month are preliminary.
Table C-7: Gross ai l spendable average weekly eariiifs i i Mistrial a i l ciistrictiu activities,
i i cirreit a i l 1947-49 dollarsl
Type of earnings
Gross average weekly earnings:Current dollars1947-49 dollars
Spendable average weekly earnings:Worker with no dependents:
Current dollars1947-49 dollars ,
Worker with 3 dependents:Current dollars1947-49 dollars
JuneI960
$110.2987.19
88.5670.01
96.9076.60
$110.7087.65
88.8870.37
97.2376.98
June1959
$ni.U989.55
89.91*72.21*
98.31*78.99
Contract constructionJuneI960
$121.1395.75
96.8776.58
105.7983.63
MayI960
$119.5691*. 66
95.6675. Ik
lOii.5082.71*
June1959
$116.6693.70
93.9075.1*2
102.5882.39
ManufactureJuneI960
$91.6072. Ul
71*. 0358.52
81.596i*.5O
MayI960
$91.3772.31*
73.8558.1*7
81.U16U.U6
June1959
$91.1773.23
7U.1559.56
81.7165.63
For mining and manufacturing, data refer to production and related workers; for contract construction, to constructionworkers.
NOTE: Data for the current month are preliminary.
Digitized for FRASER http://fraser.stlouisfed.org/ Federal Reserve Bank of St. Louis

39 State and Area Hours and Ea
Table C-8: Cross hoars and earniRfs of prodictioi workers i i nu i f i c t i r i i f , by State aid selected areas
State and areaAverage weekly
June MayI960 I960
e weekly hoursJuneI960 J&L
June1959
Average hourly earningsJuneI960 JSL Jane
Iff?
$1.912.522.15
2.432.44
1.521.SL
2.552.532.222.522.712.582.62
#
ALABAMABirmingham.Mobile
ARIZONA...P h o e n i x . .
ARKANSASL i t t l e Rock-North L i t t l e Rock.
CALIFORNIABakersfieldFresnoLos Angeles-Long BeachSacramentoSan Bernardino-Riverside-Ontario.San DiegoSan Francisco-OaklandSan JoseStockton
COLORADO.Denver..
CONNECTICUT..Bridgeport..Hartford....New Britain.Nev Eaven...Stamford... •Waterbury..•
DELAWARE....Wilmington.
DISTRICT OF COIUMBIA:Washington
FLORIDAJacksonville.
Tampa-St. Petersburg.
GEORGIA..Atlanta.
IDAHO.
ILLINOIS.Chicago.
INDIANA.
IOWADes Moines.
KANSAS...Topeka..Wichita.
$77.20102.66
88.93
98.01
100.77
63.0864.87
104.54107.0687.19103.46110.80107.33107.29no.48in. 51100.00
100.o498.90
&98.1793.50
92.29108.05
98.85
76 A579.2074.2477.88
66.2381.8087.26
102.08
(1)(1)
101.83
9J..8499.36
95.90107-5498.99
$76.03101.8191.71
99.39100.28
63.7063.99
103.62107-7485.07102.29113.29106.93110.84107.64112.8695.89
98.9098.90
92.6997.0397.5189.6O91.2597.6992.17
91.35105.52
98.21
76.5981.8175-1*77.65
66.6382.1987.29
88.66
97.7999-46
101.0*
92.50100.30
95.3*102*0997.16
$76.59102.0685.57
99.87103.21
62.1760.85
103.28.102.2181.92
102.82114.63105.01107.16107.06104.6592.27
99.3095.9*
93.3895.0695.6393.**89.1398.6597.58
91.84104.74
96.15
72.9877.2172.0071.68
65.5381.0084.02
95.60
98.79100.44
103.38
93.7899.76
92.3676.3495.95
40.040.139.7
40.541.3
40.739.fi
39.?4o.437.140.14o.o40.239.339.641.340.0
41.040.7
41.241.4
39.7
i.l39.6
39.939.940.4
44.0
40.3
39.539.0
40.943.04o.l
39.640.440.4
40.941.1
41.140.5
39.740.236.239.840.94o.240.939.041.839.3
40.740.7
40.340.640.839.340.240.239.9
40.64o.9
39.6
41.440.340.442.2
39.9
40.3
40.140.1
40.3
39.939.1
4l.O43.339.9
40.140.539.8
41.142.3
40.940.3
8*42.340.740.939.841.239.6
41.941.0
41.540.841.441.940.741.842.8
41.041.4
4o.4
41.039.840.040.5
4o.740.34l.8
42.3
41.341.4
41.5
41.24o.O
40.834.439.9
$1-932.562.24
2.422.44
1.551.63
2.622.65
2.582.772.672.732,792.702.50
2.442.43
2.29(1)2.432.32
2.242.61
2.49
1.862.001.871.85
1.662.052.16
2.32
(1)
2.53
2.322.55
2.35
$1.922.522.27
2.432.44
1.58
2.612.682.352.572.772.662.712.762,702.44
2.432.43
2.302.392.392.282.272.432.31
2.252.58
2.48
1.852.031.861.84
I.672.062.15
2.20
2.442.48
2.51
2.322.56
2.33
8
2.33
2.372.3*
2.252.332.312.232.192.362.28
2.242.53
2.38
1.77
1.612.012.01
2.26
2.392.43
2.49
2.282.49
2.262.222.41
See footnotes at end of table.NOTE: Data for the current month are preliminary.
Digitized for FRASER http://fraser.stlouisfed.org/ Federal Reserve Bank of St. Louis

State and Area Hours and Earnings ko
Table M : Gross hours and earnings i f prediction workers in manufacturing, by State and selected areas-Continued
State and area
KENTUCKY....Louisville.
LOUISIANA....Baton Rouge.Hew Orleans.Shreveport.•
MAINELewi ston-Auburn.Portland
MARYLAND...Baltimore.
MASSACHUSETTSBostonPall RiverNew Bedford.Springfield-Holyoke.Worcester
MICHIGANDetroitFlintGrand RapidsLansingMuskegon-Muskegon Heights.
MINNESOTA...DuluthMinneapolis-St. Paul.
MISSISSIPPI.Jackson....
MISSOURIKansas City.St. Louis...
MONTANA..
NEBRASKA.Omaha...
NEVADA.
NEW HAMPSHIRE.Manchester...
NEW JERSEYJersey City 2Newark 2
Paterson-Clifton-Passale 2Perth Amboy 2
Trenton
NEW MEXICO...Albuquerque.
Average weekly earnings
June
$85.0197-97
87.76116.72
9O.U579-kO
71.6961.0276.63
90.9096.05
83.6089.5560.0667.1289.3288.1*8
111.86118.68122.27101.01112.23103.26108.8k
9k.k7iok.17
97.15
6i.kl72.kl
87.8k96.7099.15
100.9^
88.0195.52
113.9**
71.156k.68
9 5 . 796.3197.209^.7998.6691.kk
83.8288.22
May1060
$85.2096.06
86.28U 9 . l l88.2680.39
70.8058.1*081.36
9996.87
82.5888.3160.526^.9888.0088.26
111.23118.27121.88103.ki118.29102.56109.65
93.52101.5395.85
60.1069.53
87.1596.2998.90
98.55
88.2693.^9
113.97
70.^563.67
* 393.8996.719k.0k99.3192.53
86.5090.5k
June
$8k.6696.58
8k.25109.3386.0083.OO
68.7862.3376.22
91.6296.76
82.2287.2357-ko66.0289.6091.56
110.18119.02Ilk.8799.51108.0299.58
k
93.00102.3795.9^
60. k969.ll
85.8098.3795.90
8k.ko90.26
107.83
69.606k.o8
93.0692.9795.0k9k. 3096.3k92.60
85.k690.9k
Average weekly hoursJune1060kO.lkO.7
kl.2k l . lkO.2kO.l
kO.537.939.5
ko.kkO.7
ko.o39.836.k38.8k0.6ko.k
ko.9ko.7kl.8ko.639.839.?ko.k
ko.kko.kk O . l
ko.kk2.1
39.5.ko.oko.o
ko.7
k2.kk2.k
k2.2
k0.238.5
ko.kko.kk0.6k0.2k0.639.5
kO.3kO.l
May19ft)ko.o39.9
kO.7kl.539-kk6
ko.o36.5ki.3
ko.5ko.7
39.739.636.938.0ko.okO.3
kO.7k0.6k2.0k l . lkl.839.6k l . l
kO.lk0.539.8
39.8ko.9
39.239.939.9
39-9
k2.7k2.0
kl.9
39.837.9
k0.239.7k0.539.9ko.939.9
ko.8k0.6
June1Q.5Q
V).7kl.O
kO.739.9ko.okl.5
kO.739.7kl.2
ko.9kl.O
kO.5k0.236.139.3k l . lk2.0
kl.5k2.1kl.2k0.8k0.2kO.3kl.O
ko.939.6kO.8
ko.6k2.k
kO.2k l . lko.k
39.1
k2.9kl.9
kl.O
kO.738.6
k0.6kO.3kl.Okl.Oko.6k l . l
k2.1k2.3
Average hourly earnings
June
I960
$2.122.kl
2.132.8k2.251.98
1.771.611.9k
2.252.36
2.092.251.651.732.202.19
2.7k2.922.932.k92.822.592.69
2.3k
1.521.72
2.232.k22.k8
2.k8
2.082.25
2.70
1.771.68
2.362.382.392.362.k32.31
2.082.20
May1060
$2.132.kl
2.122.872.2k1.98
1.771.601.97
2.272.38
2.082.231.6k1.712.202.19
2.732.912.902.522.832.592.67
2.332.512.kl
1.511.70
2.222.k22.k8
2.k7
2.072.23
2.72
1.771.68
2.362.372.392.362.k32.32
2.122.23
June
$2.082.36
2.072.7k2.152.00
1.691.571.85
2.2k2.36
2.032.171.591.682.182.18
2.662.832.792.kk2.692.k72.57
2.272.582.35
I.k9I.63
2.1k2.392.38
2.39
1.972.15
2.63
1.711.66
2.292.312.322.302.372.25
2.032.15
See footnotes at end of table.NOTE: Data for the current month are preliminary.
Digitized for FRASER http://fraser.stlouisfed.org/ Federal Reserve Bank of St. Louis

41 State and Area Hours and Earninqs
Table C-8: Gross hours and earnings of prelection workers in manufacturing, by State and selected areas-Continued
State and area
NEW YORKAlbany-Schenectady-Troy.Binghamton.Buffalo •Elmira....Nassau-Suffolk Counties 2 ......New York City 2
New York-Northeastern New Jersey,Rochester. • • « • . •SyracuseUtica-Rome••••••••••••••••••••••Westchester County 2 ••••••
NORTH CAROLINA.Charlotte ,Greensboro-High Point
NORTH DAKOTA.... ,Fargo
OHIO ,Akron.•••.••••••••••••••••••••••<Canton. •••• ,Cine innati •••••••••• ,Cleveland.Columbus • ..Dayton •Toledo.•••••••••••••••••••••••••,Youngstown • ,
OKLAHOMA.Oklahoma City. ,Tulsa « •
OREGON ,Portland ...
PENNSYLVANIA ,Allentownf-Bethlehem-Easton •,Erie ,Harrisburg. •••••••• ,LancasterPhi lade lphia <Pittsburgh ,Reading ••«••••••••••••.Scranton • • •••••'••••<Wilkes-Barre—Hazleton ,York ,
RHODE ISLANDProvidence .••••••••••••••••,
SOUTH CAROLINA ,Charleston •
SOUTH DAKOTA.... ,Sioux Falls •
TENNESSEE. ,ChattanoogaKnoxville ,MemphisNashville ,
Average weekly earnings
$89.7595*8983.28
(1)
90.39100.5484.4589.86
(1)96.6986.31*92.39
62 .4765.9360.04
83.81*86.77
104.34114.74102.75100.01106.54100.26112.57105.35110.09
86.1082.3991.37
97.6896.38
89.8387.9498.5381.6079.1994.25
108.1479.1768.1161.8576.52
76.1975.33
64.9474.93
89.39100.94
74.3476.8O85.2681.8177.71
$89.3896.6180.34
108.7689.5798.7583.9689.4099.6496.2186.6192.97
62.4768.3961.30
81.7085.06
104.09
111.3796.3999.94
109.2499.37111.51105.39106.88
85.6781.9992.69
98.7998.26
90.7889.0897.9978.9579.2094.16
109.2080.5866.7064.1377.90
75.2075.17
64.9475.35
89.26100.78
73.6075.8385.8881.8178.14
June1959
$88.62
(1)80.41
108.1689.5298.6783.1488.2697.46
(1)85.7690.52
62.0666.4961.60
82.8486.69
105.75106.92110,2697.10
110.7397.27III.63109.91126.64
86.7478.4495.04
96.8195.54
91.8386.7597.9480.7879.3593.09
115.6480.8065.2860.9279.75
75.3674.85
62.2170.18
90.47103.49
70.8275.8184.0571.8176.70
Average weekly hours
39.039.938.8(1)40.440.837.7
40.939.639.8
40.340.238.0
42.139.2
40.340.138.741.34o.o40.641.439.937.8
4l.O41.439.9
38.238.4
39.138.441.44o.O40.239.638.939.038.736.640.7
40.140.5
41.141.4
45.O45.0
40.440.040.640.740.9
38.940.037.540.440.140.337.538.740.740.639.740.0
40.341.238.8
41.338.5
40.139.236.441.340.840.441.240.136.6
40.641.240.3
38.538.9
39.338.941.038.740.039.939.039.537.937.5
41.0
40.040.2
41.141.4
44.846.0
40.039.740.740.540.7
June1959
39.6
(1)
39.3
41.0
40.6
40.9
38.2
39.4
40.6(1)40.539.8
41.141.340.0
42.640.7
41.539.641.241.442.11*0.842.440.842.1
41.541.541.5
38.838.9
40.138.941.539.640.940.341.340.438.436.71*2.2
40.340.9
41.240.8
47.649.8
40.741.240.838.440.8
Average hourly earningsJuneI960
$2.302.402.15(1)2.242.472.242.31(1)
2.32
1.55
1.641.58
1.992.22
2.592.862.662.422.662.472.722.642.91
2.101.992.29
2.562.51
2.302.292.382.041.972.382.782.031.76I.691.88
1.901.86
1.581.81
1.992.24
1.841.922.102.011.90
$2.302.412.142.692.232.452.242.312.452.372.182.33
1.551.661.58
1.982.21
2.602.842.652.422.682.462.712.632.92
2.111.992.30
2.572.53
2.312.292.392.041.982.362.802.04I.761.711.90
1.881.87
1.581.82
1.992.19
1.841.912.112.021.92
2.552.702.682.352.632.382.632.693.01
2.091.892.29
2.502.46
2.292.232.362.041.942.312.802.001.701.66I.89
1.871.83
1.511.72
1.902.08
1.741.842.061.871.88
See footnotes at end of table.
NOTE: Data for the current month are preliminary.
Digitized for FRASER http://fraser.stlouisfed.org/ Federal Reserve Bank of St. Louis

State and Area Hours and Ec 42
Table C-8: Gross hours and earnings i f prediction workers in manufacturing, by State and selected areas-Continued
State and areaAverage weekly earnings
JuneI960
$88.5679.9393.22105.5970.45
103.8996.93
77.2878.8892.00
73.3976.7082.61
102.44100.88105.3498.42
94.23116.2495.06
98.03126.8594.32104.25107.5196.23
9̂ .83113.87
MayI960
$89.6281.7095.82107.2769.94
99.7093.90
77.8978.4795.26
71.9174.4579.19
102.05101.40106.26100.36
93.36115.6689.63
97.73126.3196.72105.77106.7696.23
97.12123.55
June1959
$90.3080.6095.94105.8367.40
98.4992.16
75.7576.6590.88
69.6O75.2678.94
100.0898.67105.9799.33
94.01113.7098.31
9̂ .57104.1693.24100.70104.1099.50
98.30123.19
AveragJuneI960
41.041.239.541.941,2
40.940.9
42.041.342.2
41.040.841.1
39.138.839.638.O
39.140.538.8
41.244.639.740.140.739.5
36.939.4
e weekly
19&)
41.341.940.642.440.9
40.240.3
42.141.343.3
40.439.640.2
39.139.039.538.6
38.940.337.5
40.944.440.740.640.6
37.541.6
hoursJune1959
42.042.241.042.541.1
40.740.6
42.642.243.1
40.740.940.9
39.439.040.638.8
39.540.939.8
41.340.640.040.641.041.0
38.741.9
AverageJunei960
$2.161.942.362.521.71
2.542.37
1.841.912.18
1.791.882.01
2.622.602.662.59
2.412.872.45
2.382.842.372.602.642.44
2.572.89
hourly earningsMay19&>
$2.171.952.362.531.71
2.482.33
I.851.902.20
1.781.881.97
2.612.602.692.60
2.402.872.39
2.392.842.382.602.632.44
2.592.97
June
$2,15-1.912.342.491.64
2.422.27
1.781.822.11
1.711.841.93
2.542.532.612.56
2.382,782.49
2.292.572.332.482.542.43
2.5*2.94
TEXASDallasFort Worth..Houston.•...San Antonio.
UEAHSalt Lake City.
VERMONTBurlington.•Springfield.
VIRGINIANorfolk-Portsmouth•Richmond.••••
WASHINGTON.Seattle...Spokane.••Tacoma....
WEST VIRGINIA.Charleston.••Wheeling
WISCONSIN..Kenosha...La Crosse.Madison...Milwaukee.Racine.•••
WYOMING.Casper.xNot available.2Subarea of New York-Northeastern New Jersey.NOTE: Data for the current month are preliminary.SOURCE: Cooperating State agencies listed on inside back cover*
Digitized for FRASER http://fraser.stlouisfed.org/ Federal Reserve Bank of St. Louis

U3
Tabli 0-1: Lahir tiruvir rates ii •anfactiriii
1951 to late(Per 100 employees)
Apr. May June July Aug. Sept.Annualaverage
Total accessions
1951...1952...1953...1954...1955...1956...1957...1958...19591196©...
1951.1952.1953.1954.1955..1956.1957.1958.
1951-1952..1953..1954..1955..1956..1957..1958..1959 1i960.,
19*1..1952..1953..1954..1955..1956..1957..1958..1959..1960.,
1951..1952..1953..195^..1955..1956..1957..1958..1959..1960.,
5.24.4
'4.42.83.33.33.22.53.33.6
4.53.94.22.53.23.12.82 . 2
3.32.9
4.63.94.42.83.63.12.82.43.62.7
4.53.74.32.43.53.32.82.53.52.8
h.53*94.12.7.3.83.43.03.03.63.2
4.94.95.13.54.34.23.93.84.43.6
4.24.44.12.93.43.33.23.33.3
4.55-94.33.34.53.83.23.93.9
4.35.64.03.44.44.13.34.03.9
4.45.23.33.64.14.22.93.43.1
3-94.02.73.33.33.02.22.83.0
3.03.32.12.52.52.3n3.8
k.h4.43.93.03.73.42.93.03.6
3.93.13.4l.k1.72 . 22 . 01.01.51.9
3.52.93.31.31.82 . 11.7
• 91.71.7
3.72.83.5l.k2.21.91.7
• 91.91.5
3.72.83.51.22.22.11.7
.92.0l.k
3.72.93.3l.k2.52.31.91 .02 . 2
1.7
New 1
k.O3.8k.21.93.13.02.61.63.02.2~
lires
3.23.33.31.62.52 . 22 . 1
1.52 . 2
3.43.93.31.83.22.62.11.62.5
3.2k.k3.01.93.12.72 . 01-92.6
3.kk.l2.k1.82.92.61.71.72.0
2.83.31.71.72.k1.91 . 11.31.5
2 . 02.61 . 11.31.71.5
.71.11.3
3.k3.33.01.62.k2.31.81.32.0
1.0l.k
d1.51.71.53.81.71.3
0.81.3.8
2.21.11.8l.k2.91.31.5
Total separations
k.lk.o3.8k.32.93.63.35.03.12.9
3.83.93.63.52.53.63.03.92.63.0
k.l3.7k.l3.73.03.53.3k.22.83.7
k.6k.lk.33.83.13.43.3k.l3.03.6
4.83.9k.k3.33.23.73.k3.62.93.3
k.33.9k.23.13.23.k3.02.92.83.2
k.k5.0k.33.13.k3.23.13.23.3
5.3k.6k.Q3.5k.O3.9k.O3.53.7
5.1k.95.23.9k.kk.kk.k
U
k.lk.24.53.33.53.5lf.03.2k.l
k.33.5k.Z3.03.13.3k.O2.8k.l
3.53.kk.O3.03.02.83.82.83.1
k.kk.lk.33.53.33.53.63.63.k
2 . 1
1.92 . 11 . 11 .0l.k1.3
.8
.91.0
2 . 11.92 . 21 .01 .01.31 .2
.7
.81 .0
2.52 . 02.51 .01.3l.k1.3
.71.01 .0
2.72 . 22.71 . 11.51.51.3
.71 . 11 . 1
2.82 . 22.71.01.51.6l.k
.81.31 . 1
2.52 . 22.61 . 11.51.61.3
.81.31 . 1
2.k2 . 22.51 . 11.61.5l.k
• 91.3
3.13.02.91.42 . 22 . 2
1.91 .21.8
3.13.53.11.82.82.62 . 21.52 . 2
2.52.82.11.21.81.71.31 . 11.4
1.92.11.51.01.41.3
.9
.81.0
1.41.71 .1
• 91 . 11 .0
.7
.7.9
2.42.32.31 .11.61.61.4
.91.3
Layoffs
0.81.1.8
2.31.31.61.43.21.32.2
1.01.3.9
2.41.21.41.53.01.32.0
1.21.11.01.91.11.61.21.11.6
•I
1.01.1.91.71.21.31.11.81.01.6
1.32.21.11.61.31.21.32.01.4
1.41.01.31.71.31.21.61.91.4
1.3.7
1.51.71.11.41.81.61.5
1.4
x:81.61.21.32.31.72.8
1.7.7
2.31.61.21.52.71.6
2.6
1.51.02.51.71.41.42.71.8
1.7
1.21.11.31.91.21.51.72.31.6
beginning with January 1959, transfers between establishments of the same firm are included in total accessions and total sepa-rations, therefore rates for these items are not strictly comparable with prior data. Transfers comprise part of other accessionsand other separations, the rates for which are not shown separately.NOTE: Data for the current month are preliminary.
Data in all tables "in Section D relate to the United States without Alaska and Hawaii.
Digitized for FRASER http://fraser.stlouisfed.org/ Federal Reserve Bank of St. Louis

nbor Turnover
Table D-2: L i t * tirnvir rates, by iilistry
(Per 100 emplpyees)
Industry
MANUFACTURING.
DURABLE GOODSNONDURABLE GOODS1
Durable Goods
ORDNANCE AND ACCESSORIES.
LUMBER AND WOOD PRODUCTSLogging camps and contractorsSawmills and planing millsMillwork, plywood, prefabricated structural wood products.
FURNITURE AND FIXTURESHousehold furnitureOther furniture and fixtures.
STONE, CLAY, AND GLASS PRODUCTS.Glass and glass productsCement, hydraulicStructural clay productsPottery and related products...
PRIMARY METAL INDUSTRIESBlast furnaces, steel works, and rolling millsIron and steel foundriesGray-iron foundriesMalleable-iron foundriesSteel foundries
Primary smelting and refining of nonferrous metals:Primary smelting and refining of copper, lead, and zinc.
Rolling, drawing, and alloying of nonferrous metals:Rolling, drawing, and alloying of copperNonferrous foundriesOther primary metal industries:Iron and steel forgings
FABRICATED METAL PRODUCTSCutlery, hand tools, and hardware. ,Cutlery and edge tools ,Hand toolsHardwareHeating apparatus (except electric) and plumbers' supplies,Sanitary ware and plumbers' supplies ,Oil burners, nonelectric heating and cooking apparatus,not elsewhere classified. ,
Fabricated structural metal products ,Metal stamping, coating, and engraving ,
MACHINERY (EXCEPT ELECTRICAL)Engines and turbines..... ,Agricultural machinery and tractors ,Construction and mining machinery. ,Metalworking machineryMachine tools ,Met alworking machinery (except machine tools) ,Machine-tool accessories ,Special-industry machinery (except metalworking machinery),General industrial machinery ,Office and store machines and devicesService-industry and household machines ,Miscellaneous machinery parts ,
ELECTRICAL MACHINERYElectrical generating, transmission, distribution, andindustrial apparatus
Communication equipmentRadios, phonographs, television sets, and equipment.....Telephone, telegraph, and related equipment
Electrical appliances, lamps, and miscellaneous products.
See footnotes at end of table. NOTE: Data for the current month are preliminary.
Total
JuneI960
3.6
3.k3.9
3.5
6.3
6.k3.3
3.33.23.6
3.3
illk.22.1
2.21.62.93.13.32.5
2.1
2.5k.O
2.1
3.92.83.12.82.72.61.7
3.25.1
2.92.0k.k2.92.k2.22.82.33.13.2
2̂ 62.6
3.3
2.63.55.21.8k.k
MayI960
3.2
3.23.3
2.1
6.917.8k.l3.5
k.Ok.23.5
2.83.3
3*32.k
1.81.32.62.9l.k2.8
1.8
l.k3.3
2.1
3.93.*2.02.2k.o2.k1.5
2.9k.O5.1
2.31.82.92.12.01.62.12.62.22.k2.k2.k2.2
2.8
2.03.0k.2.9k.3
New 1
Junei960
2.2
1.92.6
1.9
5.2(2)
2*.5
2.32.22.6
1.82.02.12.71.2
.7
.21.21.2.61.3
1.8
.62.0
.7
2.21.52.k2.01.01.71.0
2.23.91.2
1.81.01.01.71.7l.k2.21.82.52.32.51.7l.k
1.8
1.51.92.51.62.7
lires
May.1260.
1.7
1.61.9
l.k
5.515.03.7 -2.k
2.62.72.2
1.51.71.52.11.3
.5
.2
.8
.7
.51.1
1.6
.31.2
.7
1.71.01.61.6.71.5.8
1.92.k1.3
1.2-9
1.11.21.31.0l.k1.51.71.51.21.2.6
1.3
.91.52.0.61.6
Toi
JuneI960
3.2
3.62.5
3.7
k 1(2)3.63.5
3.13.42.3
3.65.81.33.52.2
k.l6!l3.22.92.73.8
1.0
2.05.3
*.3
3.52.72.51.93.12.12.1
2.13.2k.Q
2.92.2•̂73.82.32.31.92.61.82.k1.86.02.0
3.0
2.82.83.81.33.7
salMayI960
3.3
3.52.9
2.2
3.9k.63.73.8
3.53.72.8
2.82.91.23.93.0
k.k5.33.83.7k.l3.3
2.3
2.23.7
5.0
3.k3.33.32.33.53.12.6
3*k3.33.8
3.12.65.33.22.k2.k1.73.02.02.72.k3.3k.O
3.1
3.03.2k.O1.33.7
•par at ion rateQuits
JuneI960
1.1
1.01.3
0.9
2.1(2)2.11.6
l.k1.61.1
.7
.9
.31.0.8
.k
.2
.8
.91.0.6
.5
.31.1
.6
1.01.11.31.11.0.8.9
.71.1.8
.8
.6
.7
.9
.8
.9
.7
.8
.8
.91.0.8•6
1.0
.91.01.1- .6 |1.0
Mayi?6o
1.1
1.01.3
0.8
2.22.32.22.0
1.71.91.2
.8
.9
.51.11.1
.5
.k
.7
.71.0.6
.9
.2
.8
.5
1.0.8
1.2.9.7.9.7
1.01.01.0
.8
.8
.8
.9
.7
7̂.8#9,9.9.7.6
1.0
.81.11.2•7 '
1«2~
sLayoffs
JuneI960
1.6
2.0.8
2.0
1.8(2)•8l.k
1.1l.k.6
2.5k.k.61.91.0
3.8
l!8l.k1.12.6
(3)
1.13.*
3.*
1.91.0.8.kl.k.6.6
.71.5
1.61.03.32.51.01.0.8l.k.5
U'•9
1.2
1.2.9l.k.11.9
MayI960
1.6
1.91.1
1.1
1.11.6.8
1.2
1.11.2.8
1.5l.k.k
2.21.5
3.kk.k2.52.63.32.1
.2
1.62.3
k.2
1.82.01.71.02.31.6l.k
1.71.72.1
1.81.53.71.81.21.3.61.8.71.31.02.13.1
l.k
l.k1.52.0.21.8
Digitized for FRASER http://fraser.stlouisfed.org/ Federal Reserve Bank of St. Louis

U5
Table 0-2: Labor turnover rates, by industry-Continued
(Per 100 employees)
Industry
Durable Goods — Continued
TRANSPORTATION EQUIPMENT.
Ship
vehicles and equipmentaft and partsraftraft engines and partsraft propellers and partsr aircraft parts and equipment..and boat building and repairing.oad equipmentmotives and parts.
Railroad and street carsOther transportation equipment.
INSTRUMENTS AND RELATED PRODUCTSPhotographic apparatusWatches and clocksProfessional and scientific instruments.
MISCELLANEOUS MANUFACTURING INDUSTRIES-Jewelry, silverware, and plated ware..
Nondurable Goods
FOOD AND KINDRED PRODUCTS.Meat productsGrain-mill productsBakery productsBeverages:Malt liquors
TOBACCO MANUFACTURES.CigarettesCigars ,Tobacco and snuff...
TEXT ILE-MILL PRODUCTSYarn and thread millsBroad-woven fabric millsCotton, silk, synthetic fiber.......Woolen and worstedKnitting millsFull-fashioned hosierySeamless hosiery.Knit underwear
Dyeing and finishing textilesCarpets, rugs, other floor coverings.
APPAREL AND OTHER FINISHED TEXTILE PRODUCTSMen's and boys' suits and coatsMen's and boys' furnishings and work clothing.
PAPER AND ALLIED PRODUCTSPulp, paper, and paperboard mills.Paperboard containers and boxes...
CHEMICALS AND ALLIED PRODUCTS...Industrial inorganic chemicals.Industrial organic chemicals. ..Synthetic fibers
Drugs and medicinesPaints, pigments, and fillers. .
PRODUCTS OF PETROLEUM AND COAL-Petroleum refining
RUBBER PRODUCTSTires and inner tubes.Rubber footwearOther rubber products.
LEATHER AND LEATHER PRODUCTSLeather: tanned, curried, and finished.Footwear ( exqept rubber )
Separation ratesTotal
JuneI960
3.5(2)2.32.03.2(2)U.28.28.2(2)8.72.7
2.8(2)2.93.3
U.O2.5
5.03.75.15.3
(2)
1.2
.u2.32.3
3.53.63.22.95.2U.8(2)6.1(2)2.2(2)
3.83.UU.I
3.83.5k.3
3.02.92.U2.53.23.U
1.81.U
3.32.3it. 33.9
5.73.86.0
MayI960
3.33.31.51.U1.52.22.9
10.08.06.78.73.U
2.01.13.22.1
h.91.9
lt.65.h3.63.7
k.9
2.52.13.21.7
3.33.32.72.5U.55.U7.6U.o2.81.62.0
U.O3.9U.2
2.51.73.6
1.71.51.31.31.32.0
1.2.8
2.71.5U.O3.U
5.13.05.h
New
JuneI960
l.Ua1.21.6(2)2.62.81.9(2).71.9
2.2(2)1.02.7
2.52.1
3.0l.U3.13.8
(2)
.8
.21.51.5
2.32.52.01.83.23.k(2)3.6(2)1.U(2)
2.82.63.1
2.82.83.1
2.52.21.81.62.82.6
1.21.0
1.1.81.71.3
3.92.5U.1
hires
MayI960
1'.2.8.8.7.61.81.7U.23.1U.82.21.6
1.3.81.21.5
2.61.5
2.21.11.73.1
2.8
1.31.01.7.7
2.02.31.61.52.73.12.32.72.01.1.7
2.83.03.0
1.81.22.U
1.21.1.8.5.9l.U
.8
.7
.7
.31.U.9
2.61.12.8
Total
JuneI960
U.O(2)2.92.82.5(2)U.69.78.2(2)9.51.6
2.U(2)2.92.7
3.92.0
2.71.93.53.0
(2)
1.3.32.61.U
2.83.12.82.6U.o2.9(2)2.7(2)1.7(2)
2.81.92.9
2.51.33.1
1.U.91.0.81.11.6
1.3.9
3.01.8U.33.8
3.62.53.8
MayI960
3.83.U2.72.62.51.5U.79.67.72.7
10.U2.3
2.31.0U.82.1
3.92.1
3.73.52.83.5
3.0
1.5.92.61.1
2.93.12.82.6U.o3.12.53.22.71.7U.6
U.0U.73.7
2.31.33.1
1.31.8.9.91.51.2
.9
.8
2.71.6h.53.2
U.22.U
u.u
QuitsJunel?6p_
0.9(2)1.11.1.6(2)1.91.8.7(2).31.0
1.0(2)1.11.1
1.31.2
1.0.5.9i.U
(2)
.7
.11.7.2
1.51.61.61.61.72.0(2)1.9(2).5(2)
2.11.32.3
1.1.61.6
.7
.5
.U
.u.6
.6
.3
.3
.8
.31.81.1
2.U.82.6
MayJL960_
0.8.61.01.0.7.81.U1.7.7.9.61.1
.8
.5
.8
.9
1.51.1
1.1.6.71.6
.6
.9
.51.6.51.61.91.61.61.92.01.91.81.7.7.6
2.61.82.8
1.0.51.U
.6
.6
.3
.2
.8
.5
.3
.2
.8
.32.1.9
2.0.62.2
LayoffsJuneI960
2.5(2)1.5I.U1.U(2)2.17.15.9(2)7.6.1
.9(2)1.11.1
1.8.2
1.31.12.3.9
(2)
.2(3).5.3
.81.0.7.61.7.5(2).5(2).8(2)
.5
.3
.3
.8
.U
.8
.u
.1
.3
.3
.2
.5
.5
.2
1.71.21.22.2
.81.2.8
MayI960
2.U2.11.U1.31.5.32.57.16.0.78.8.u1.0.23.1.9
1.7.7
2.12.51.71.2
2.0
.u
.3
.6
.2
.9
.7
.7
.61.5.8.31.1.8.73.7
1.02.U.7
.8
.5
.8
.u
.8
.3
.5
.5
.2
.3
.3
1.51.01.71.9
1.61.51.7
See footnotes at end of table. NOTE: Data for the current month are preliminary.
Digitized for FRASER http://fraser.stlouisfed.org/ Federal Reserve Bank of St. Louis

Takd 0-2: Libtr tiriinr rates, by iiiistrjf-Cutiiiel
(Per 100 employees)
Industry
Accession rates Separation ratesTotal
JuneI960
3.22.9(2)3.6
2.5
1.1
(2)(2)
I960
3.61.82.62.7
1.0
1.0
1.5
New hiresJuneI960
2.21.2(2)3.2
.6
.6
(2)(2)
2.21.11.11.9
.1
.5
•
TotalJuneI960
2.02.3(2)2.5
k.l
k.k
(2)(2)
MayI960
2.71.32.53.9
3.1
k.O
l.k1.9
QuitsJunei960
0.8
1.6
.1
.3
(2)(2)
I960
1.6.3
1-32.2
.7
.3
1.1.9
LayoffsJuneI960
O.k.6
(2).2
2.8
3.8
(2)(2)
3b
0.2.5.1.2
1.6
3.5
.1
.6
N0NMANUFACTURIN6:
METAL MININGIron miningCopper miningLead and zinc mining.
ANTHRACITE MINING
BITUMINOUS-COAL MINING.
COMMUNICATION:
Telephone..Telegraph*
*Data for the printing, publishing, and allied industries group are excluded.Ttot available.*Less than 0.05*itota relate to donestic employees except messengers.HOTEt Data for the current month are preliminary.
Tibli D-3: Lalir timver rates i i •aufactinif, ly su ail Major industry group1
April I960
Major industry group
Men (per 100 men) Women (per 100 women)Total
accessions
2.6
2.72 A
1.95.53 .k2.71.63.21.91-93.21.63.7
U.I1.32.63.21.91.2.7l.k2.9
SeparationsTotal
3.5
3.82.5
2.95.1k .k2.83.6k.23.13.25.01.73.8
3.2l.k3.33.51.91.21.12.7*.9
Quits
1.0
1.01.0
.82 A2.0.6.5.9.8.8.8.8
1-5
.9
.61.72.1.8.k.2.6
1.9
Totalaccessions
3.3
3.13A
2.26.93.82.92.03.32.12.52.02.36.9
5.71.33.13 A3.52.31.12.63.1
SeparationsTotal
k.2
k.kk.O
3.82.53.6k.O3.15.53.5k.k3.73.16.9
5.01.93.8k.l3 A3.11.86.3k.2
Quits
1.6
l.U1.9
1.51.61.51.31.01.21.31.51.01.11.9
l.k1.01.72.51.51.31.11.12.0
MANUFACTURING.
DURABLE GOODS....NONDURABLE GOODS.
Durable Goods
Ordnance and accessoriesLumber and wood productsFurniture and fixturesStone, clay, and glass productsPrimary metal industriesFabricated metal productsMachinery (except electrical)Electrical machineryTransportation equipmentInstruments and related productsMiscellaneous manufacturing industries.
Nondurable Goods
Food and kindred productsTobacco manufacturesTextile-mill productsApparel and other finished textile products..Paper and allied productsChemicals and allied productsProducts of petroleum and coalRubber products «Leather and leather products
^hese figures are based on a slightly smaller sample than those in tables D-l and D-2, inasmuch as somefirms do not report separate data for women. Data for the printing, publishing, and allied industries groupare excluded.
Digitized for FRASER http://fraser.stlouisfed.org/ Federal Reserve Bank of St. Louis

47
TahJt M : Later tirnvir ritis i i •mfactiriif fir selected Statis ail areas
(Per 100 employees)
State and area
ALABAMA. 1
Mobile 1
ARIZONA ••Phoenix
ARKANSASLittle Rock-North Little Rock
CALIFORNIA:Los Angeles-Long Beach 1 ....San Diego 1 •San Francisco-Oakland 1 .....San Jose 1 .•• ,
CONNECTICUT .Bridgeport • ••••<Hartford .••......New Britain •••••••New Haven*••••Waterbury. •••••••••• •.
DELAWARE ,Wilmington
DISTRICT OF COLUMBIA:Washington.••••••••••••••••••.
FLORIDAJacksonville. •Miami.Tampa-St. Petersburg.
GEORGIA
Atlanta 2
IDAHO 3
INDIANA 1
Indianapolis ^ ••*..•........4IOWADes Moines
KANSAS6
Topeka...Wichita 6
KENTUCKY. • •
LOUISIANA
MAINE
Portland ••••••••••
MARYLAND
Baltimore
Accession rates
4.0
9.3
5.15.7
5.34.7
4.02.74.63.4
2.62.02.21.82.72.3
2.52.2
4.0
5.68.25.84.4
3.73.2
10.8
(4)2.5
4.54.2
3.73.22.0
3.2
4.2
6.54.3
3.43.2
3.99.8
5.75.7
6.34.5
4.02.2
3.6
2.21.72.31.51.81.7
2.62.2
4.5
6.k8.0
3.6
3.1
7.6
3.02.0
k.l
k.l
3.02.62.0
3.3
k.2
3.62.6
3.4
3.1
New hires
&
2.3
5.8
k.k5.0
3.73.1
3.01.92.82.8
1.51.21.51.11.8.9
1.51.2
k.O4.55.22.5
2.k
2.3
6.4
001.2
1.93.3
2.12.11.3
1.5
1.9
3.6
2.0
2.01.8
2.0
3.7
k.k5.0
3.93.6
2.91.62.73.1
1.11.51.01.3.8
1.71.3
k.2
k.l3.24.33.3
2.52.1
5.0
1.51.1
2.03 A
1.71.31.1
1.7
2.1
1.8
1.9
1.8
1.7
4.0l.k
5.26.1
4.9
e.k
k.ll.k4.83.0
3.02.82.62.72.72.7
2.31.9
3.7
6.6
U6.0
3.8
3.7
k.l
003.7
3.83.9
3.3
4.9
2.2
3.62.1
3.13.1
3.56.k
k.k
k.9
k.O
k.9
5.5k.kk.62.6
3.12.82.63.72.72.7
3.32.9
k.k
6.17.16.07.2
3.83.9
7.1
3.93.2
k.k5.4
3.72.73.3
3.2
2.7
4.31.8
3.53.4
Separation rates
1.11.6
2.32.7
2.52.k
1.81.11.31.5
1.1.8.9.8
1.21.0
1.1.8
2.3
2.52.32.72.0
1.71.5
2.1
(4)1.0
l.k2.3
1.2l.k1.0
1.0
.8
1.91.3
1.0.9
1.1
2.0
2.12.k
2.22.5
2.0l.k1.51.5
1.2.9
1.1.9
1.1.9
1.0.8
2.9
2.72.32.62.5
1.71.5
2.6
1.11.0
1.42.3
1.21.01.2
1.0
1.0
1.71.1
1.11.0
Layoffs
2.kk.9
2.22.6
1.93.6
2.11.82.6
.9
l.k1.61.31.5
.6
3 .6.13.43*5
1.51.6
1.3
(4)2.2
2.01.2
2.01.81.8
3.4
1.0
1.2.5
1.71.7
I2.03.9
1.71.7
1.31.7
2.62.52.4
.5
1.41.5l . l2.2
.91.4
1.61.6
1.0
3.34.32.73.9
1.51.8
3.9
2.31.8
2.52.6
2.11.41.7
1.8
1.1
2.1.5
1.91.9
See footnotes at end of table.NOTE: Data for the current month are preliminary.
Digitized for FRASER http://fraser.stlouisfed.org/ Federal Reserve Bank of St. Louis

State and Area Labor Turnover.
Table D-4: Labor turnover rates i i •annfactiriig fir selected States and areas-Continued
(Per 100 employees)
MASSACHUSETTS
Fall River •New Bedford
MINNESOTA •
MISSISSIPPI
MISSOURI
MONTANA 5
NEVADA •
NEW HAMPSHIRE
NEW MEXICO t •••••
NEW YORK. ...••••
Buffalo •
New York City.
Utica-Rome•••••••••••••••••••••..
NORTH CAROLINA.
OKLAHOMA 8
Oklahom Citv
OREGON x •Portland * ..••••••»••••• •
RHODE ISLAND
SOUTH CAROLINA 9 •
Tot al
19&
3.53-33*13*5k.l3.0
1+.6k.5
1+.6
3.5
3.9
6.3
1+.2
1+.8
5.03.5
1+.02.92.22.61+.5
2.95*12.12.83.63.2
3.22.72.5
7.1+6.1
k.56.6
3.5
6.11+.1+
5.0k.l
3.97.6
M.3.13.23*3l.k2.82.8
1+.1
k.3
3.83.8
3*7
7*5
5.9
3*5
6.83.9
3.k2.11.62.23.82.5
1.82.13.23.7
2.93.62.3
7.1+
6.7
k.l6.03.6
6.35.0
^.5l+.l
3*59.1
New
5̂o2.22.01.91.92.12.1
2.92.9
3.53.2
2.8
1+.5
3.k
3*7
3*73.1
2.31.21.11.1+1.82.02.91.1+1.72.02.5
2.1+2.32.1
1+.7
3.8
3.3k.32.7
k.53.3
3.02.8
2.8k.6
hires
Apr.I960
2.02.02.12.31.72.1
2.22.3
2.83.0
If.7
5.3
2.5
5.93.7
2.0.6.81.01.71.82.91.11.21.12.2
2.23.02.0
2.32.1
2.71+.0
2.8
1+.83.k
2.82.5
2.5k.k
Total
MayI960
3.73.35.13.83.72.8
k.6k.3
k.l5.1
3.8
k.6
5.3
k.l
k.l2.6
k.32.1+2.63.2k.32.95.72.03.22.93.7
3.13.33.0
3.32.7
1+.1+5.23.9
5.2^.7
5.01+.8
3.7
9.2
Apr.i960
1+.21+.2.̂95.6l+.O2.8
1+.2k.k
k.kk.3
1+.1+
5.6
5.k
k.5
6.93.5
1+.82.52.62.9l+.O
2.23.1l+.l
k.3
3.23 ^3.5
2.32.3
1+.01+.2l+.O
5.7^ 7
6.15.9
3-59.9
Separation rates
Quits
MayI960
1.1+1.51.71.1+1.11.2
1.61.6
1.91.5
1.7
1.7
3.3
2.5
2.21.6
1.1.71.1.61.11.11.2
•91.01.01.3
1.81.61.9
2.1+2.2
2.02.82.0
2.31.6
2.02.0
2.02.1
Apr.I960
1.51.51.61.71.1
1.1+
1.71.8
1.91.7
1.6
1.9
2.8
2.2
3.61.7
1.2.61.2.71.01.1+1.3
1.11.11.5
1.72.02.2
1.1+1.2
1.62.11.5
2.51.6
2.01.9
1.92.0
LayoffsMayI960
1.61.12.91.92.21.1
2.52.2
2.33.2
1.6
1.0
1.3
1.5
1.1.6
2.5.6.5
2.22.31.33.7.81.51.31.9
.81.0.1+
.3
.3
1.81.71.6
2.1
2.22.1
1.05.̂
Apr.I960
2.01.82.83.k2.1+1.0
I.92.0
1.91.7
2.3
1.1+
.9
1.5
2.01.0
3.0.9.5
2.21.2k.51.11.62.52.2
1.0.5.7
.3
.2
1.91.51.7
2.1+
2/5
3.33.1
.9
6.2
See footnotes at end of table.NOTE: Data for the current month are preliminary.
Digitized for FRASER http://fraser.stlouisfed.org/ Federal Reserve Bank of St. Louis

State and Area labor Turnover
Table D-4: Labor turnover rates in manufacturing for selected States and areas-Continued
(Per 100 employees)
State and area
Accession rates
Mayi960
Apr.i960
Separation rates
T6£I960
Apr.i960 i960
Apr.I960 I960 I960
W1960
SOUTH DAKOTA.Sioux Palls.
Chattanooga.Khoxville...MemphisNashville...
TEXAS 1 0
VERMONTBurlington..Springfield.
VIRGINIA...Richmond..
WASHINGTON
WEST VIRGINIA.Charleston...Wheeling
7.65.7
3.43A1.83.04.6
2.6
1.6
3.33.2
4.1
2.81.23.6
7.26.2
3.32.91.93.83-3
2.9
2.72.21.8
3.33-7
4.2
2.01.11.9
4.41.5
2.12.1.9
2.02.3
1.9
2.11.3.8
2.32.4
2.9
1.1.7.5
3.01.1
2.01.9.8
2.82.2
2.1
1.4.7
1.2
2.22.6
2.6
5.65.2
3.22.52.23.43.3
2.4
3.32.61.8
3.53.1
4.3
2.61.05.4
4.74.9
3.4
2.9
f'94.14.3
3.1
3.63.62.6
3.84.4
3.4
2.51.35.9
2.41.5
1.21.1.6
1.11.4
1.2
1.81.71.0
1.41.4
1.7
.6
.2
.7
1.91.7
1.31.2•7
1.5
1.4
1.51.7• 9
1.51.8
1.7
.5
'.6
2.73.5
1.61.0
1.5
.8
1.0.4.5
1.51.1
2.0
1.5.6
4.1
2.53.0
1.61.2.9
1.82.4
1.3
1.5
1.71.8
1.1
4.6
1 Excludes canning and preserving.2 Excludes agricultural chemicals, and miscellaneous manufacturing industries.3 Excludes canning and preserving, and sugar.* Not available.5Excludes canning and preserving, and newspapers.6Excludes instruments and related products.7 Excludes furniture and fixtures.8 Excludes new-hire rate for transportation equipment.9 Excludes tobacco stemming and redrying.
1 0 Excludes canning and preserving, sugar, and tobaccoNOTE: Data for the current month are preliminary.SOURCE: Cooperating State agencies listed on inside back cover.
Digitized for FRASER http://fraser.stlouisfed.org/ Federal Reserve Bank of St. Louis

Explanatory Notes
Additional information concerning the preparation of the
labor force, employment, hours and earnings, and labor
turnover series--concepts and scope, survey methods, and
limitations—is contained in technical notes for each of
these series, available from the Bureau of Labor Statis-
tics free of charge. Use order blank on page 9-E.
INTRODUCTION
The statistics in this periodical are compiled fromtvo major sources: (1) household interviews and (2) payrollreports from employers.
Data based on household Interviews are obtained froma sample survey of the population. The survey is conductedeach month by the Bureau of the Census for the Bureau of LaborStatistics and provides a comprehensive measure of the laborforce, i.e., the total number of persons Ik years of age andover who are employed or unemployed. It also provides data ontheir personal and economic characteristics such as age, sex,color, marital status, occupations, hours of work, and durationof unemployment. The information is collected by trained inter-viewers from a sample of about 35,000 households in 330 areasthroughout the country and is based on the activity or statusreported for the calendar veek ending nearest the 15th of themonth.
Data based on establishment payroll records are com-piled each month from mail questionnaires by the Bureau ofLabor Statistics, in cooperation with State agencies. The pay-roll survey provides detailed industry information on nonagri-cultural wage and salary employment, average veekly hours,average hourly and veekly earnings, and labor turnover for theNation, States, and metropolitan areas.
The figures are based on payroll reports from asample of 180,000 establishments employing about 25 millionnonfarm wage and salary workers. The data relate to allworkers, full- or part-time, who received pay during the pay-roll period ending nearest the 15th of the month.
Relation between the household and payroll series
The household and payroll data supplement one another,each providing significant types of information that the othercannot suitably supply. Population characteristics, forexample, are readily obtained only from the household surveywhereas detailed industrial classifications can be reliably de-rived only from establishment reports.
Data from these two sources differ from each otherbecause of differences in definition and coverage, sources ofinformation, methods of collection, and estimating procedures.Sampling variability and response errors are additional reasonsfor discrepancies. The factors which have a differential effecton levels and trends of the two series are described below:
Employment
Coverage. The household survey definitionof employment comprises wage and salary workers (including do-mestics and other private household workers), self-employedpersons, and unpaid workers who worked 15 hours or more duringthe survey week in family-operated enterprises. Employment inboth farm and nonfarm industries is included. The payroll sur-vey covers only wage and salary employees on the payrolls ofnonfarm establishments.
Multiple jobholding. The household approachprovides information on the work status of the population with-out duplication since each person is classified as employed, un-employed, or not in the labor force. Employed persons holdingmore than one job are counted only once, and are classified ac-cording to the job at which they worked the greatest number of
hours during the survey week. In the figures based on estab-lishment records, persons who worked in more than one estab-lishment during the reporting period are counted each timetheir names appear on payrolls.
Unpaid absences from Jobs* The householdsurvey includes among the employed all persons who had jobs butwere not at work during the I survey week—that is, were notworking or looking for work but had jobs from which they weretemporarily absent because of illness, bad weather, vacation,labor-management dispute, or because they were taking time offfor various other reasons, whether or not they were paid bytheir employers for the time off. In the figures based on pay-roll reports, persons on paid sick leave, paid vacation, orpaid holiday are Included, but not those on leave without payfor the entire payroll period.
Hours of Work
The household survey measures hours actually workedwhereas the payroll survey measures hours paid for by employers.In the household survey data, all persons with a job but not atwork are excluded from the hours distributions and the computa-tions of average hours. In the payroll survey, employees onpaid vacation, paid holiday, or paid sick leave are includedand assigned the number of hours for which they were paidduring the reporting period.
Comparability of the household interview data with other series
Unemployment Insurance data. The unemployed totalfrom the household survey includes all persons who did not workat all during the survey week and twere looking for work or werewaiting to be called back to a job from which they had beenlaid off, regardless of whether or not they were eligible forunemployment insurance. Figures on unemployment insuranceclaims, prepared by the Bureau of Employment Security of theDepartment of Labor, exclude persons who have exhausted theirbenefit rights, new workers who have not earned rights to unem-ployment insurance, and persons losing Jobs not covered by un-employment insurance systems (agriculture, State and localgovernment, domestic service, self-employed, unpaid family work,nonprofit organizations, and firms below a minimum size).
In addition, the qualifications for drawing unemploy-ment compensation differ from the definition of unemploymentused in the household survey. For example, persons with a jobbut not at work and persons working only a few hours during theweek are sometimes eligible for unemployment compensation, butare classified as employed rather than unemployed in the house-hold survey.
Agricultural employment estimates of the Department ofAgriculture. The principal differences in coverage are the in-clusion of persons under Ik in the Agricultural MarketingService (AMS) series and the treatment of dual jobholders whoare counted more than once if they worked on more than one farmduring the reporting period. There are also wide differences insampling techniques and collecting and estimating methods, whichcannot be readily measured in terms of impact on differences inlevel and trend of the two series.
Comparability of the payroll employment data with other series
Statistics on manufactures and business, Bureau ofthe Census. BLS establishment statistics on employment differfrom employment counts derived by the Bureau of the Census from
1-E
Digitized for FRASER http://fraser.stlouisfed.org/ Federal Reserve Bank of St. Louis

its censuses or annual sanple surveys of manufacturing estab-lishments and the censuses of business establishments. The Ma-jor reason for lack of comparability is different treatment ofbusiness units considered parts of an establishment, such ascentral administrative offices and auxiliary units, and in theindustrial classification of establishments due to differentreporting patterns by multi-unit companies. There are also dif-ferences in the scope of the industries covered, e.g., theCensus of Business excludes professional services, transporta-tion companies, and financial establishments, while these areincluded in BLS statistics.
County Business Patterns. Data in County BusinessPatterns, published jointly by the U.S. Departments of Commerceand Health, Education, and Welfare, differ from BLS establish-ment statistics in the units considered integral parts of anestablishment and in industrial classification. In addition,CBP data exclude employment in nonprofit institutions, inter-state railroads, and government.
Employment covered by Unemployment Insurance programs.Not all nonfarm vage and salary workers are covered by the Unem-ployment Insurance programs. All vorkers in certain activities,such as nonprofit organizations and interstate railroads, areexcluded. In addition, small firms in covered industries arealso excluded in 3^ States. In general, these are establish-ments with less than four employees.
LABOR FORCE DATACOLLECTION AND COVERAGE
Statistics on the employment status of the population,the personal, occupational, and other economic characteristicsof employed and unemployed persons, and related labor force dataare compiled for the BLS by the Bureau of the Census in itsCurrent Population Survey (CPS). (A detailed description ofthis survey appears in Concepts and Methods Used in the CurrentEmployment and Unemployment Statistics Prepared by the Bureau ofthe Census, U. S. Bureau of the Census, Current PopulationReports, Series P-23, No. 5. This report is available from BLSon request.)
These monthly surveys of the population are conductedwith a scientifically selected sample designed to represent thecivilian noninstitutional population Ik years and over. Re-spondents are interviewed to obtain information about the em-ployment status of each member of the household Ik years of ageand over. The inquiry relates to activity or status during thecalendar week, Sunday through Saturday, ending nearest the 15thof the month. This is known as the survey week. Actual fieldinterviewing is conducted in the following week.
Inmates of institutions and persons under Ik years ofage are not covered in the regular monthly enumerations and areexcluded from the population and labor force statistics shown inthis report. Data on members of the Armed Forces, who are in-cluded as part of the categories "total noninstitutional popu-lation" and "total labor force," are obtained from the Depart-ment of Defense.
The sample for CPS is spread over 333 areas compris-ing 6kl counties and independent cities, with coverage in 50States and the District of Columbia. At present, completed in-terviews are obtained each month from about 35*000 households.There are about 1,500 additional sample households from whichinformation should be collected but is not because the occu-pants are not found at home after repeated calls, are temporar-ily absent, or are unavailable for other reasons. This repre-sents a noninterview rate for the survey of about k percent.Part of the sample is changed each month. The rotation planprovides for approximately three-fourths of the sample to becommon from one month to the next, and one-half to be commonwith the same month a year ago.
CONCEPTS
Employed Persons comprise (a) all those who duringthe survey week did any work at all either as paid employees, orin their own business or profession, or on their own farm, orwho worked 15 hours or more as unpaid workers on a farm or in abusiness operated by a member of the family, and (b) all thosewho were not working or looking for work but who had Jobs orbusinesses from which they were temporarily absent because ofillness, bad weather, vacation, or labor-management dispute, orbecause they were taking time off for various other reasons,whether or not they were paid by their employers for the time off.
Each employed person is counted only once. Those whoheld more than one job are counted in the job at which theyworked the greatest number of hours during the survey week.
Included in the total are employed citizens of for-eign countries, temporarily in the United States, who are notliving on the premises of an Embassy (e.g., Mexican migratoryfarm workers).
Excluded are persons whose only activity consisted ofwork around the house (such as own home housework, and paintingor repairing own home) or volunteer work for religious, chari-table, and similar organizations.
Unemployed Persons comprise all persons who did notwork at all during the survey week and were looking for work,regardless of whether or not they were eligible for unemploy-ment insurance. Also included as unemployed are those who didnot work at all and (a) were waiting to be called back to a jobfrom which they had been laid off; or (b) were waiting to re-port to a new wage or salary job within 30 days (and were notin school during the survey week); or (c) would have been look-ing for work except that they were temporarily ill or believedno work was available in their line of work or in the community.Persons in this latter category yill usually be residents of acommunity in which there are only a few dominant industrieswhich were shut down during the survey week. Not included inthis category are persons who say they were not looking for workbecause they were too old, too young, or handicapped in any way.
The Unemployment Rate represents the number unemployedas a percent of the civilian labor force, i.e., the sum of theemployed and unemployed. This measure can also be computed forgroups within the labor force classified by sex, age, maritalstatus, color, etc. When applied to industry and occupationgroups, the labor-force base for the unemployment rate also rep-resents the sum of the employed and the unemployed, the latterclassified according to industry and occupation of their latestfull-time civilian Job.
Duration of Unemployment represents the length of time(through the current survey week) during which persons classi-fied as unemployed had been continuously looking for work orwould have been looking for work except for temporary illness,or belief that no work was available in their line of work or inthe community. For persons on layoff, duration of unemploymentrepresents the number of full weeks since the termination oftheir most recent employment. Average duration is an arithmeticmean computed from a distribution by single weeks of unemployment.
The Civilian Labor Force comprises the total of allcivilians classified as employed or unemployed in accordancewith the criteria described above. The "total labor force" alsoincludes members of the Armed Forces stationed either in theUnited States or abroad.
Not in Labor Force includes all civilians Ik years andover who are not classified as employed or unemployed. Thesepersons are further classified as "engaged in own home house-work," "in school," "unable to work" because of long-term physi-cal or mental illness, and "other." The "other" group includesfor the most part retired persons, those reported as too old towork, the voluntarily idle, and seasonal workers for whom thesurvey week fell in an "off" season and who were not reported asunemployed. Persons doing only incidental unpaid family work(less than 15 hours) are also classified as not in the laborforce.
Occupation, Industry, and Class of Worker apply to thejob held in the survey week. Persons with two or more jobs areclassified in the job at which they worked the greatest numberof hours during the survey week. The occupation and Industrygroups used in data derived from the CPS household interviewsare defined as in the 1950 Census of Population. Information onthe detailed categories included in these groups is availableupon request.
The industrial classification system used in the Censusof Population and the Current Population Survey differs somewhatfrom that used by the BLS in its reports on employment, by indus-try. Employment levels by industry from the household survey,although useful for many analytical purposes, are not publishedin order to avoid public misunderstanding since they differ fromthe payroll series because of differences in classification,sampling variability, and other reasons. The industry figuresfrom the household! survey are used as a base for publisheddistributions on hours of work, unemployment rates, and other
2-E
Digitized for FRASER http://fraser.stlouisfed.org/ Federal Reserve Bank of St. Louis

characteristics of industry groups such as age, sex, andoccupation.
The class-of-worker breakdown specifies "wage andsalary workers," subdivided into private and government workers,"self-employed workers," and "unpaid family workers." Wage andsalary workers receive wages, salary, comlssion, tips, or payin kind frost a private employer or from a governmental unit.Self-employed persons are those who work for profit or fees intheir own business, profession, or trade, or operate a farm.Unpaid family workers are persons working without pay for 15hours a week or More on a farm or in a business operated by amember of the household to whom they are related by blood ormarriage.
Hours of Work statistics relate to the actual numberof hours worked during the survey week. For example, a personwho normally works kQ hours a week but who was off on theTeterans Day holiday would be reported as working 32 hours eventhough he was paid for the holiday.
For persons working in more than one job, the figuresrelate to the number of hours worked in all jobs during theweek. However, all the hours are credited to the major Job.
Persons who worked 35 hours or more in the surveyweek are designated as working "full time"; persons who workedbetween 1 and 34 hours are designated as working "part time."Part-time workers are classified by their usual status at theirpresent job (either full time or part time) and by their reasonfor working part time during the survey week (economic or otherreasons). "Economic reasons" include: Slack work, materialshortages, repairs to plant or equipment, start or terminationof job during the week, and inability to find full-time work."Other reasons" include: Labor dispute, bad weather, own ill-ness, vacation, demands of home housework, school, no desire forfull-time work and full-time worker only during peak season.
ESTIMATING METHODS
The estimating procedure is essentially one of usingsample results to obtain percentages of the population in agiven category. The published estimates are then obtained bymultiplying these percentage distributions by Independent esti-mates of the population. The principle steps involved are shownbelow. Under the estimation methods used in the CPS, all of theresults for a given month become available simultaneously andare based on returns from the entire panel of respondents.There are no subsequent adjustments to independent benchmarkdata on labor force, employment, or unemployment. Therefore, re-visions of the historical data are not an Inherent feature ofthis statistical program.
1. Wonlnterview adjustment. The weights for all in-terviewed households are adjusted to the extent needed toaccount for occupied sample households for which no informationwas obtained because of absence, impassable roads, refusals, orunavailability for other reasons. This adjustment is made sepa-rately by groups of sample areas and, within these, for sixgroups—color (white and nonwhite) within the three residencecategories (urban, rural nonfarm, and rural farm). The propor-tion of sample households not interviewed varies from 3 to 5percent depending on weather, vacations, etc.
2. Ratio estimates. The distribution of the popula-tion selected for the sample may differ somewhat, by chance,from that of the Nation as a whole, in such characteristics asage, color, sex, and residence. Since these population charac-teristics are closely correlated with labor force participationand other principal measurements made from the sample, thelatter estimates can be substantially improved when weightedappropriately by the known distribution of these populationcharacteristics. This is accomplished through two stages ofratio estimates as follows:
a. First-stage ratio estimate. This is the pro-cedure in which the sample proportions are weighted by theknown 1950 Census data on the color-residence distribution ofthe population. This step takes into account the differencesexisting at the time of the 1950 Census between the color-residence distribution for the Ration and for the sample areas.
b. Second-stage ratio estimate. In this step,the sample proportions are weighted by independent current esti-mates of the population by age, sex, and color. These estimatesare prepared by carrying forward the most recent census data(1950) to take account of subsequent aging of the population,
mortality, and migration between the United States and othercountries.
3. Composite estimate procedure. In deriving sta-tistics for a given month, a composite estimating procedure isused which takes account of net changes from the previous monthfor continuing parts of the sample (75 percent) as well as thesample results for the current month. This procedure reducesthe sampling variability especially of month-to-month changesbut also of the levels for most items.
Seasonal Adjustment
The seasonal adjustment method used for unemploymentand other labor force series is a new adaptation of the standardratio-to-moving average method, with a provision for "moving"adjustment factors to take account of changing seasonal pat-terns. A detailed description and illustration of the methodwill be published later this year.
Seasonal adjustment factors for major components ofthe labor force to be applied to data for 1958 and laterperiods are shown in table A. Factors for broad age-sex groupsand for duration of unemployment categories will be included inthe publication cited in the preceding paragraph. In computingthese factors, the pre-1957 data were adjusted to reflect thenew definitions of employment and unemployment adopted inJanuary 1957. Seasonally adjusted aggregates for these seriesfor 19^7 to date are available on request.
Table A. Seasonal adjustment factors for the labor force andmajor components, to be used for the period 1958-60
Month
Jan...Feb...Mar...Apr...May...June..July..Aug...Sept..Oct...Nov...Dec...
Civil-ian
laborforce
97-798.O98.499.0
100.1102.4102.7101.8100.4100.6100.0
99.1
Employment
Total
96.997.0
97-798.6100.1101.8102.4
102.3101.2101.8
100.599.4
Agri-cul-ture
8I.381.886.293.6106.0118.2
117.9111.1
109.9112.097-485.O
Nonagri-culturalindus-tries
98.698.799.099.299.5100.0100.7101.3100.2100.7100.9101.0
Unemployment
Total
11411611110399113
.2
.3
.1
.1
.4
.2105.0
9183789093
.2
.9
.8'
.0
.5
Bothsexes
11611811210499110
.769124
102.38983788994
55294
Rate
Males
121125120107971069784
.6• 9.077246
77.874 886.299 6
Fe-males
10810599971021181119894849684
.2
.2
.3• 7.4.6.0.60362
In evaluating deviations from the seasonal pattern--that is, changes in a seasonally adjusted series--it is impor-tant to note that seasonal adjustment is merely an approxima-tion based on past experience. Seasonally adjusted estimateshave a broader margin of possible error than the original dataon which they are based, since they are subject not only tosampling and other errors but, in addition, are affected by theuncertainties of the seasonal adjustment process itself.
Reliability of the Estimates
Since the estimates are based on a sample, they maydiffer from the figures that would have been obtained if itwere possible to take a complete census using the same sched-ules and procedures.
The standard error is a measure of sampling variabil-ity, that is, the variations that might occur by chance becauseonly a sample of the population is surveyed. The chances areabout two out of three that an estimate from the sample woulddiffer from a complete census by less than the standard error.The chances are about 19 out of 20 that the difference would beless than twice the standard error.
Table B shows the average standard error for the majoremployment status categories, by sex, computed from data for 12recent months. Estimates of change derived from the survey arealso subject to sampling variability. The standard error ofchange for consecutive months is also shown in table B. Thestandard errors of level shown in table B are acceptable approx-imations of the standard errors of year-to-year change.
3-E
Digitized for FRASER http://fraser.stlouisfed.org/ Federal Reserve Bank of St. Louis

Table B. Average standard error of major employmentstatus categories
(In thousands)
Employment statusand sex
BOTH SEXES
Labor force and total employment.AgricultureHonagricultural employmentUnemployment
MALE
Labor force and total employment.AgricultureNonagricultural employment
FEMALE
Labor force and total employment.AgricultureIf onagri cultural employmentUnemployment
Average standard error of—
Monthly level
250200300100
12018020075
1807518065
Month-to-month change(consecutivemonths only)
180120180100
909012090
15055
12065
The figures presented in table C are to be used forother characteristics and are approximations of the standarderrors of all such characteristics. They should be interpretedas providing an indication of the order of magnitude of thestandard errors rather than as the precise standard error forany specific item.
Table C. Standard error of level of monthly estimates
(In thousands)
Size of estimate
10,00050,000,100,000250,000500,0001,000,000
2,500,0005,000,00010,000,00020,000,00030,000,0001*0,000,000
Both sexes
Totalor
vhite
511152kIkh&
751001*0180210220
Hon-vhite
510lU2130
ko
5050
Male
Totalor
vhite
7Ik2031*360
901101*0150
Non-vhite
51011*213040
50
Female
Totalor
vhite
510Ik2231k5
70100130170
Non-vhite
510Ik2130VO
50
The standard error of the change in an item from onemonth to the next month is more closely related to the standarderror of the monthly level for that item than to the size of thespecific month-to-month change itself. Thus, in order to usethe approximations to the standard errors of month-to-monthchanges as presented in table D, i t is first necessary to obtainthe standard error of the monthly level of the item in table C,and then find the standard error of the month-to-month change intable D corresponding to this standard error of level. Itshould be noted that table D applies to estimates of change be-tveen 2 consecutive months. For changes between the currentmonth and the same month last year, the standard errors of levelshovn in table C are acceptable approximations.
Illustration: Assume that the tables shoved the totalnumber of persons working a specific number of hours, as15,000,000, an Increase of 500,000 over the previous month.Linear interpolation in the first column of table C shows thatthe standard error of 15,000,000 is about 160,000. Consequently,the chances are about 68 out of 100 that the figure vhich wouldhave been obtained from a complete count of the number of per-sons working the given number of hours vould have differed byless than 160,000 from the sample estimate. Using the 160,000
as the standard error of the monthly- level in table D, i t maybe seen that the standard error of the 500,000 increase Isabout 135,000.
Table D. Standard error of estimates ofmonth-to-month change
(In thousands)
Standard error of monthly level
10,000..25,000..50,000..100,000.150,000.200,000.250,000.300,000.
Standard error of month-to-month change
Estimatesrelating toagriculturalemployment
Ik
3570100110
All estimatesexcept thoserelating toagriculturalemployment
1226kQ90130160190220
The reliability of an estimated percentage, computedby using sample data for both numerator and denominator dependsupon both the size of the percentage and the size of the totalupon vhich the percentage is based. Where the numerator is asubclass of the denominator, estimated percentages are rela-tively more reliable than the corresponding absolute estimatesof the numerator of the percentage, particularly if the per-centage is large (50 percent or greater). Table E shows thestandard errors for percentages derived from the survey.Linear interpolation may be used for percentages and base fig-ures not shovn in table E.
Table E. Standard error of percentages
Estimated
1 or 992 or 985 or 9510 or 90
15 or 8520 or 8025 or 75....35 or 65....50
1 or 992 or 985 or 9510 or 9015 or 8520 or 8025 or 75....35 or 65....50
Base of percentage (thousands)
150
1.0l.k2.23.03.5k.Ok.2k.7k.9
?,000
0.2.2.k• 5.6.7.8.8•9
250
0.81.11.72.32.83.1
3*73-9
10,000
0.1.2•3.k.k.5.5.6.6
500
0.6.8
1.21.72.02.22, k2.62.8
25,000
0.1.1.2.2.3.3.3.k.k
1,000
OU.5.91.2l.k1.61.71.91.9
50,000
0.1.1.1.2.2.2.2.3• 3
2,000
0.3.k.6.8
1.0l.l1.2.1.3l.k
75,000
0.1.1.1.1.2.2.2.2.2
3,000
0,2• 3.5.7.8• 9
1.01.11.1
ESTABLISHMENT DATACOLLECTION
Payroll reports provide current information on vageand salary employment, hours, earnings, and labor turnover innonfarm establishments, by geographic location.
Federal-State Cooperation
Under cooperative arrangements vith State agencies,the respondent fills out only 1 employment or labor turnoverschedule, vhich is then used for national, State, and areaestimates. This eliminates duplicate reporting on the part ofrespondents and, together vith the use of identical techniquesat the national and State levels, ensures maximum geographiccomparability of estimates.
fc-I
Digitized for FRASER http://fraser.stlouisfed.org/ Federal Reserve Bank of St. Louis

State agencies mail the forms to the establishmentsand examine the returns for consistency, accuracy, and com-pleteness. The States use the information to prepare State andarea series and then send the data to the BLS for use in pre-paring the national series. The BLS and the Bureau of Employ-ment Security jointly finance the current employment statisticsprogram in ^3 States, the turnover program in kl States.
Shuttle Schedules
The Form BLS 790 is used to collect employment, pay-roll, and man-hours data, Form 1219 labor turnover data. Bothschedules are of the "shuttle" type, vith space for each monthof the calendar year.
The BLS 790 provides for entry of data on the numberof full- and part-time workers on the payrolls of nonagricul-tural establishments for the pay period ending nearest the 15thof each month. The labor turnover schedule provides;for thecollection of information on the total number of accessions andseparations, by type, during the calendar month.
INDUSTRIAL CLASSIFICATION
Establishments are classified into industries on thebasis of their principal product or activity determined from in-formation on annual sales volume. This information is collectedeach year on a product supplement to the monthly 790 or 1219 re-port. In the case of an establishment making more than oneproduct or engaging in more than one activity, the entire em-ployment of the establishment is included under the industryindicated by the most important product or activity.
Prior to publication of State and area data forJanuary 1959, all national, State, and area employment, hours,earnings, and labor turnover series vere classified In accord-ance vith the following documents: (1) For manufacturing,Standard Industrial Classification Manual, Volume I, Bureau ofthe Budget, 19^5, and (2) for nonmanufacturing, IndustrialClassification Code, Social Security Board, 19^2. Beginningwith January 1959 (with an overlap for 1958), State and areaseries are classified under the revised Standard IndustrialClassification Manual published in 1957- The national industrystatistics will be converted to the 1957 SIC early in 1961.
COVERAGE
Employment, Hours, and Earnings
Monthly reports on employment and, for most indus-tries, payroll and man-hours are obtained from approximately180,000 establishments. The table below shows the approximateproportion of total employment in e*ch Industry divisioncovered by the group of establishments furnishing monthly em-ployment data. The coverage for individual industries withinthe division may vary from the proportions shown.
Approximate size and coverage of BLS employmentand payrolls sample l/
Industry division
MiningContract constructionManufacturingTransportation and publicutilities: Interstaterailroads (ICC)Other transportation andpublic utilities
Wholesale and retail trade..Finance, insurance, andreal estate
Service and miscellaneous...Government:Federal (Civil ServiceCommission) 2/State and local
Number ofestablish-ments insample
3,50022,000^3,900
15,70065,100
12,90011, MX>
5,800
Employees
number insample
393,000860,000
11,779,000
1,152,000
1,693,0002,2^,000
757,0008*8,000
2,196,0003,148,000
Percentof total
*72669
97
5720
3313
100
631/ Since some firms do not report payroll and man-hour infor-
matlon, hours and earnings estimates may be based on a slightlysmaller sample than employment estimates.
2/ State and area estimates of Federal employment are based on2,300 reports covering 1,^30,000 employees, collected throughthe BLS-State cooperative program.
Labor Turnover
Labor turnover reports are received from approximately10,500 establishments in the manufacturing, mining, and commu-nication industries (see table below). The following manufac-turing industries are excluded from the labor turnover sample:Printing, publishing, and allied industries (since April 19^3);canning and preserving fruits, vegetables, and sea foods;women's and misses' outerwear; and fertilizer.
Approximate size and coverage of BLS labor turnoversample used in computing national rates
Industry
ManufacturingDurable goodsnondurable goods
Metal miningCoal mining:
AnthraciteBituminous
Communication:TelephoneTelegraph
number ofestablish-ments insample
10,200
6,koo3,800
120
20200
Employees
Humber insample
5,99^,000
M99,ooo1,795,000
57,000
6,00071,000
661,00028,000
Percentof total
39
3253
1932
8865
1/ Does not apply.
CONCEPTS
Industry Employment
Employment data for all except Federal Governmentrefer to persons on establishment payrolls who received pay forany part of the pay period ending nearest the 15th of the month.For Federal Government establishments, current data generallyrefer to persons who received pay for the last day of the month.
The data exclude proprietors, the self-employed, un-paid family workers, farm workers, and domestic workers inhouseholds. Salaried officers of corporations are included.Government employment covers only civilian employees; Federalmilitary personnel are shown separately, but their number Isexcluded from total nonagricultural employment.
Persons on an establishment payroll who are on paidsick leave (when pay is received directly from the firm), paidholiday, or paid vacation, or who work during a part of the payperiod and are unemployed or on strike during the rest of theperiod, are counted as employed. Persons are not counted asemployed who are laid off, on leave without pay, or on strikefor the entire period, or who are hired but do not report towork during the period.
Benchmark Adjustments
Employment estimates are periodically compared withcomplete counts of employment in the various industries definedas nonagricultural, and appropriate adjustments made as indi-cated by the total counts or benchmarks. The comparison madefor the first 3 months of 1957, the last benchmark adjustment,resulted in changes amounting to 0.5 percent of all nonagricul-tural employment, identical with the extent of the adjustmentto the first quarter 1956 benchmark. The changes were lessthan 0.5 percent for three of the eight major industry divi-sions; under 2 percent for two other divisions; and 3.2, 3.3,and 6.4 percent for the remaining three divisions. The manu-facturing total was changed by only 0.1 percent for the secondsuccessive year. Within manufacturing, the benchmark and esti-mate differed by 1.0 percent or less in 39 of the 132 individ-ual industries, kl industries were adjusted by 1.1 to 2.5 per-cent, and an additional 27 industries differed by 2.6-5-0percent. One significant cause of differences between thebenchmark and estimate is the change in Industrial classifica-tion of individual firms, which is usually not reflected in BLSestimates until they are adjusted to new benchmarks. Othercauses are sampling and response errors.
The basic sources of benchmark information are thequarterly tabulations of employment data, by industry, compiledby State agencies from reports of establishments covered underState unemployment insurance laws. These tabulations are pre-pared under Bureau of Employment Security direction. Supple-mentary tabulations prepared by the U.S. Bureau of Old Age andSurvivors Insurance are used for the group of establishmentsexempt from State unemployment insurance laws because of their
5-E
Digitized for FRASER http://fraser.stlouisfed.org/ Federal Reserve Bank of St. Louis

small size. Benchmarks for industries wholly or partly ex-cluded from the unemployment insurance lavs are derived from avariety of other sources.
The BLS estimates relating to the benchmark quarter(the first quarter of the year) are compared vith the newbenchmark levels, industry by industry. Where revisions arenecessary, the monthly estimates are adjusted between the newbenchmark and the preceding one. The new benchmark for each in-dustry is then projected to the current month by use of thesample trends. Under this procedure, the benchmark is used toestablish the level of employment while the sample is used tomeasure the month-to-month changes in the level.
Seasonal Adjustment
Employment series for many industries reflect a regu-larly recurring seasonal movement which can be measured on thebasis of past experience. By eliminating that part of thechange in employment which can be ascribed to usual seasonalvariation, it is possible to clarify the cyclical and other non-seasonal movements in the series. Seasonally adjusted employ-ment aggregates are published. These estimates are derived bythe use of factors based on free-hand adjustments of 12-monthmoving averages. Seasonal factors are available on request.
I Industry Hours and Earnings
Hours and earnings data are derived from reports ofpayrolls and man-hours for production and related workers ornonsupervisory employees. These terms are defined below. Whenthe pay period reported is longer than 1 week, the figures arereduced to a weekly basis.
Production and Related Workers include working fore-men and all nonsupervisory workers (including leadmen andtrainees) engaged in fabricating, processing, assembling, in-spection, receiving, storage, handling, packing, warehousing,shipping, maintenance, repair, janitorial and watchman services,product development, auxiliary production for plant's own use(e.g., power plant), and recordkeeplng and other servicesclosely associated with the above production operations.
Nonsupervisory Employees include employees (not abovethe working supervisory level) such as office and clericalworkers, repairmen, salespersons, operators, drivers, attend-ants, service employees, linemen, laborers, janitors, watchmen,and similar occupational levels, and other employees whoseservices are closely associated with those of the employeeslisted.
Payroll covers the payroll for full- and part-timeproduction, construction, or nonsupervisory workers who re-ceived pay for any part of the pay period ending nearest the15th of the month. The payroll is reported before deductionsof any kind, e.g., pJLd-age and unemployment insurance, groupinsurance, withholding tax, bonds, and union dues; also in-cluded is pay for overtime, holidays, vacations, and sick leavepaid directly by the firm. Bonuses (unless earned and paidregularly each pay period), other pay not earned in pay periodreported (e.g., retroactive pay), and the value of free rent,fuel, meals, or other payment in kind are excluded.
Man-Hours cover man-hours worked or paid for, duringthe pay period ending nearest the 15th of the month, for pro-duction, construction, and nonsupervisory workers. The man-hours include hours paid for holidays and vacations, and forsick leave when pay is received directly from the firm.
Overtime Hours cover premium overtime hours of pro-duction and related workers during the pay period endingnearest the. 15th of the month. Overtime hours are those forwhich premiums were paid because the hours were in excess ofthe number of hours of either the straight-time workday orworkweek. Weekend and holiday hours are included only if pre-mium wage rates were paid. Hours for which only shift differ-ential, hazard, incentive, or other similar types of premiumswere paid are excluded.
Gross Average Hourly and Weekly Earnings
Average hourly earnings for manufacturing and non-manufacturing industries are on a "gross" basis, reflecting notonly changes in basic hourly and incentive wage rates, but alsosuch variable factors as premium pay for overtime and late-shiftwork, and changes in output of workers paid on an incentiveplan. Employment shifts between relatively high-paid and
low-paid work and changes in workers1 earnings in individualestablishments also affect the general earnings averages.Averages for groups and divisions further reflect changes inaverage hourly earnings for individual industries.
Averages of hourly earnings differ from wage rates.Earnings are the actual return to the worker for a statedperiod or time, while rates are the amounts stipulated for agiven unit of work or time. The earnings series, however, doesnot measure the level of total labor costs on the part of theemployer since the following are excluded: Irregular bonuses,retroactive items, payments of various welfare benefits, pay-roll taxes paid by employers, and earnings for those employeesnot covered under the production-worker or nonsupervisory-employee definitions.
Gross average weekly earnings are derived by multi-plying average weekly hours by average hourly earnings. There-fore, weekly earnings are affected not only by changes in grossaverage hourly earnings, but also by changes in the length ofthe workweek, part-time work, stoppages for varying causes,labor turnover,_and absenteeism.
Average Weekly Hours
The workweek information relates to the average hoursfor which pay was received, and is different from standard orscheduled hours. Such factors as absenteeism, labor turnover,part-time work, and stoppages cause average weekly hours to belower than scheduled hours of work for an establishment. Groupaverages further reflect changes in the workweek of componentindustries.
Average Overtime Hours
The overtime hours represent that portion of thegross average weekly hours which were in excess of regularhours and for which premium payments were made. If an employeeworks on a paid holiday at regular rates, receiving as totalcompensation his holiday pay plus straight-time pay for hoursworked that day, no overtime hours would be reported.
Since overtime hours are premium hours by definition,the gross weekly hours and overtime hours do not necessarilymove in the same direction from month to month; for example,premiums may be paid for hours in excess of the straight-timeworkday although less than a full week is worked. Diversetrends on the industry-group level may also be caused by amarked change in gross hours for a component industry wherelittle or no overtime was worked in both the previous and cur-rent months. In addition, such factors as stoppages, absen-teeism, and labor turnover may not have the same influence onovertime hours as on gross hours.
Spendable Average Weekly Earnings
Spendable average weekly earnings in current dollarsare obtained by deducting estimated Federal social security andincome taxes from gross weekly earnings. The amount of incometax liability depends on the number of dependents supported bythe worker, as well as on the level of his gross income. Toreflect these variables, spendable earnings are computed fortwo types of income receivers—a worker with no dependents, anda worker with three dependents. The computations are based onthe gross average weekly earnings for all production and re-lated workers in manufacturing, mining, or contract construc-tion without regard to marital status, family composition, ortotal family income.
"Real" earnings are computed by dividing the; currentConsumer Price Index into the earnings average for the currentmonth. The resulting level of earnings expressed in 19^7-^9dollars is thus adjusted for changes in purchasing power sincethe base period.
Average Hourly Earnings Excluding Overtime
Average hourly earnings excluding premium overtimepay are computed by dividing the total production-worker pay-roll for the industry group by the sum of total production-worker man-hours and one-half of total overtime man-hours.Prior to January 1956, data were based on the application ofadjustment factors to gross average hourly earnings (asdescribed in the Monthly Labor Review, May 1950, pp. 537-5^0).Both methods eliminate only the earnings due to overtime paidfor at one and one-half times the straight-time rates. No ad-justment is made for other premium payment provisions, such as
6-E
Digitized for FRASER http://fraser.stlouisfed.org/ Federal Reserve Bank of St. Louis

holiday vork, late-shift work, and overtime rates other thantine and one-half.
Indexes of Aggregate Weekly Payrolls and Man-Hours
The indexes of aggregate veekly payrolls and nan-hoursare prepared by dividing the current month's aggregate by themonthly average for the 19^7-^9 period. The nan-hour aggregatesare the product lof average veekly hours and product!on-vorkeremployment, and the payroll aggregates are the product of grossaverage veekly earnings and production-vorker employment.
Railroad Hours and Earnings
The figures for Class I railroads (excluding switchingand terminal companies) are based on monthly data summarized inthe M-300 report of the Interstate Commerce Commission and re-late to all employees who received pay during the month exceptexecutives, officials, and staff assistants (ICC Group I).Gross average hourly earnings are computed by dividing totalcompensation by total hours paid for. Average veekly hours areobtained by dividing the total number of hours paid for, reducedto a veekly basis, by the number of employees, as defined above.Gross average veekly earnings are derived by multiplying averageveekly hours by average hourly earnings.
Labor TurnoverLabor turnover is the gross movement of wage and
salary vorkers into and out of employment status vith respect toindividual establishments. This movement, vhich relates to acalendar month, is divided into tvo broad types: Accessions(nev hires and re hires) and separations (terminations of employ-ment initiated by either employer or employee). Each type ofaction is cumulated for a calendar month and expressed as a rateper 100 employees. The data relate to all employees, whetherfull- or part-time, permanent or temporary, including executive,office, sales, other salaried personnel, and production vorkers.Transfers to another establishment of the company are includedbeginning with January 1959-
Separations are terminations of employment during thecalendar month and are classified according to cause: Quits,layoffs, and other separations, as defined below.
Quits are terminations of employment Initiated byemployees, failure to report after being hired, and unauthorizedabsences, if on the last day of the month the person has beenabsent more than 7 consecutive calendar days.
Layoff8 are suspensions without pay lasting or ex-pected to last more than 7 consecutive calendar days, initiatedby the employer vithout prejudice to the vorker.
Other separations, vhich are not published separatelybut are included in total separations, are terminations of
employment because of discharge, permanent disability, death,retirement, transfers to another establishment of the company,and entrance into the Armed Forces expected to last more than30 consecutive calendar days.
Accessions are the total number of permanent and tem-porary additions to the employment roll including both nev andrehired employees.
Nev hires are temporary or permanent additions to theemployment roll of former employees not recalled by the em-ployer, or persons who have never before been employed in theestablishment, except for those transferred from other estab-lishments of the company.
Other accessions, vhich are not published separatelybut are included in total accessions, are all additions to theemployment roll vhich are not classified as nev hires.
Comparability With Employment Series
Month-to-month changes in total employment in manu-facturing industries reflected by labor turnover rates are notcomparable vith the changes shown in the Bureau's employmentseries for the following reasons: (1) Accessions and separa-tions are computed for the entire calendar month; the employ-ment reports refer to the pay period ending nearest the 15th ofthe month; (2) the turnover sample excludes certain industries(see Coverage, p. 5-E); (3) plants on strike are not Included inthe turnover computations beginning vith the month the strikestarts through the month the vorkers return; the influence ofsuch stoppages is reflected, however, in the employment figures.
STATISTICS FOR STATES A N D AREAS
State and area employment, hours, earnings, and laborturnover data are collected and prepared by State agencies incooperation vith BLS. Additional industry detail may be ob-tained from the State agencies listed on the inside back cover.These statistics are based on the same establishment reportsused by BLS for preparing national estimates. For employment,the sum of the State figures may differ slightly from theequivalent official U.S. totals because of differences in thetiming of benchmark adjustments, slightly varying methods ofcomputation, and, since January 1959, a different classifica-tion system. (See Industrial Classification, p. 5-E-)
For Alaska and Hawaii, satisfactory employmentestimates cannot be derived by subtracting the U.S. totalsvithout Alaska and Hawaii from the totals including the 2 nevStates.
ESTIMATING METHODS
The procedures used for estimating industry employ-ment, hours, earnings, and labor turnover statistics are sum-marized in the folloving table. Details are given in theappropriate technical notes, vhich are available on request.
7-E
Digitized for FRASER http://fraser.stlouisfed.org/ Federal Reserve Bank of St. Louis

Summary of Methods for Computing Industry Statistics
on Employment, Hours, Earnings, and Labor Turnover
I tenIndividual Manufacturing andnonmanufacturing industries
Total nonagricultural divisions,Major groups, and groups
Monthly Data
All employees
Production ornonsupervisory workers;Women employees
Gross arcrage weekly hours
Average weekly overtimehours
Gross average hourlyearnings
Gross average weeklyearnings
Labor turnover rates(total, men, and voaen)
All employees and produc-tion or nonsupervisoryworkers
Gross average weekly hours
Average weekly overtimehours
Gross average hourlyearnings
Gross average weeklyearnings
Labor turnover rates
All-employee estimate for previous monthmultiplied by ratio of all employees incurrent month to all employees in previousmonth, for sample establishments which re-ported for both months.
All-employee estimate for current monthmultiplied by (1) ratio of production ornonsupervisory workers to all employeesin sample establishments for current month,(2) ratio of women to all employees.
Production- or nonsupervisory-worker man-hoursdivided by number of production or nonsuper-visory workers.
Production-worker overtime man-hoursdivided by number of production workers.
Total production- or nonsupervisory-workerpayroll divided by total production- ornonsupervisory-worker man-hours.
Product of gross average weekly hours andaverage hourly earnings.
The number of particular actions (e.g.,quits) in reporting firms divided by totalemployment in those firms. The result ismultiplied by 100. For men (or women), thenumber of men (women) who quit is divided bythe total number of men (women) employed.
Sum of all-employee estimates for componentindustries.
Sum of production- or nonsupervisory-workerestimates, or women estimates, for componentIndustries.
Average, weighted by production- ornonsupervisory-worker employment, of theaverage weekly hours for component industries.
Average, weighted by production-worker employ-ment, of the average weekly overtime hours forcomponent Industries.
Average, weighted by aggregate man-hours, ofthe average hourly earnings for componentindustries.
Product of gross average weekly hours andaverage hourly earnings.
Average, weighted by employment, of the ratesfor component industries.
Annual Average Data
Sum of monthly estimates divided by 12.
Annual total of aggregate man-hours (produc-tion- or nonsupervisory-worker employmentmultiplied by average weekly hours) dividedby annual sum of employment.
Annual total of aggregate overtime man-hours(production-worker employment multiplied byaverage weekly overtime hours) divided byannual sum of employment.
Annual total of aggregate payroll*f(production-or nonsupervisory-worker employment multipliedby weekly earnings) divided by annual aggregateman-hours.
Product of gross average weekly hours andaverage hourly earnings.
Sum of monthly rates divided by 12.
Sum of monthly estimates divided by 12.
Average, weighted by production- ornonsupervisory-worker employment, of theannual averages of weekly hours for componentindustries.
Average, weighted by production-worker employ-ment, of the annual averages of weekly overtimehours for component Industries.
Average, weighted by aggregate man-hours, ofthe annual averages of hourly earnings forcomponent industries.
Product of gross average weekly hours andaverage hourly earnings.
Sum of monthly rates divided by 12.
8-E
Digitized for FRASER http://fraser.stlouisfed.org/ Federal Reserve Bank of St. Louis

UNITED STATES DEPARTMENT OF LABORBureau of Labor Statistics
COOPERATING STATE AGENCIESEmployment and Labor Turnover Statistics Programs
ALABAMAARIZONAARKANSASCALIFORNIA
COLORADO*CONNECTICUTDELAWAREDISTRICT OF COLUMBIAFLORIDAGEORGIAIDAHOILLINOIS*
INDIANAIOWAKANSASKENTUCKYLOUISIANAMAINEMARYLANDMASSACHUSETTS
MICHIGAN*MINNESOTAMISSISSIPPIMISSOURIMONTANANEBRASKANEVADANEW HAMPSHIRENEW JERSEY*NEW MEXICONEW YORK
NORTH CAROLINA
NORTH DAKOTAOHIO*OKLAHOMAOREGONPENNSYLVANIA*RHODE ISLAND
SOUTH CAROLINASOUTH DAKOTATENNESSEETEXASUTAH*VERMONTVIRGINIA
WASHINGTONWEST VIRGINIAWISCONSIN*WYOMING*
-Department of Industrial Relations, Montgomery 4.-Unemployment Compensation Division, Employment Security C
Sacramento 14 (Turnover).-U. S. Bureau of Labor Statistics, Denver 2.-Employment Security Division, Department of Labor, Hartford 15.-Unemployment Compensation Commission, Wilmington 99.-U. S. Employment Service for D. C. , Washington 25.-Industrial Commission, Tallahassee.-Employment Security Agency, Department of Labor, Atlanta 3.-Employment Security Agency, Boise.-Division of Unemployment Compensation and State Employment Service,
Department of Labor, Chicago 6.-Employment Security Division, Indianapolis 25.
Imployment,
-ankfort.•i- ' ivioiun VJJ. iJinuiuyiiiciii jc^uiAiy j ivc pai micil t Oi J_jcLDOr, DB-tOH XvOlZSfC ̂
-Employment Security Commission, Augusta.-Department of Employment Security, Baltimore 1.-Division of Statistics, Department of Labor and Industries, Boston 16 (Employment).
Research and Statistics, Division of Employment Security, Boston 15 (Turnover).-Employment Security Commission, Detroit 2.-Department of Employment Security, St. Paul 1.-Employment Security Commission, Jackson.-Division of Employment Security, Jefferson City.-Unemployment Compensation Commission, Helena.-Division of Employment Security, Department of Labor, Lincoln 1.-Employment Security Department, Carson City.-Department of Employment Security, Concord.-Bureau of Statistics and Records, Department of Labor and Industry, Trenton 25.-Employment Security Commission, Albuquerque.-Bureau of Research and Statistics, Division of Employment, State Department of Labor,
500 FlicrVifVi AvpmiP W^w Ynrlr lft
-Division oi Research and statistics, Bureau oi Unemp-Employment Security Commission, Oklahoma Citv 2.-Department of Employment, Salem.-Bureau of Employment Security, Department of Labor and Industry, Harrisburg.-Division of Statistics and Census, Department of Labor, Providence 3 (Employment).
Department of Employment Security, Providence 3 (Turnover).-Employment Security Commission, Columbia 1.-Employment Security Department, Aberdeen.-Department of Employment Security, Nashville 3.-Employment Commission, Austin 1.-Department of Employment Security, Industrial Commission, Salt Lake City 10.-TTnoYVinimrTvtfint rATYinonootinn r.r\TV»iTn'ccirtn K/nnfnol-ior-Unemployment Compensation Commission, Montpelier.-Division of Research and Statistics, Department of Labor and Industry, Richmon
Unemployment Compensation Commission, Richmond 11 (Turnover).-Employment Security Department, Olympia.-Department of Employment Security, Charleston 5.-Unemployment Compensation Department, Industrial Commission, Madison 3.-Employment Security Commission, Casper.
id 14 (Employment).
^Employment statistics program only.
Digitized for FRASER http://fraser.stlouisfed.org/ Federal Reserve Bank of St. Louis