employer-based work injury recordkeeping: data from … · employer-based work injury...
TRANSCRIPT
Employer-based work injury recordkeeping: Data from four states
Sara Wuellner 2015 ASA/NSF/BLS Research Fellow
Washington State Department of Labor and Industries Safety and Health Assessment and Research for Prevention (SHARP) Program
Polly Phipps
Bureau of Labor Statistics Office of Survey Methods Research
ASA/NSF/BLS Fellowship Final Report March, 2017
This research was conducted with restricted access to BLS data.
The views here do not necessarily reflect the views of the BLS.

i

ii
Acknowledgements Funding for the study was provided in part by the ASA/NSF/BLS Fellowship program.
The authors wish to thank the researchers from Minnesota, New York, Oregon, and Washington who collaborated on survey design and were instrumental in data collection: Brian Zaidman, Bill Boyers, Karen Cummings, Nathan Johnson, and David Bonauto. Additionally, they gratefully acknowledge the statistical guidance provided by BLS staff including Brooks Pierce, Patrick Bobbitt, and Daniell Toth, and the thoughtful comments from Jeffrey Gonzalez on an earlier draft. The authors assume full responsibility for any errors that may be present in the report.
This research was conducted with restricted access to BLS data. The views here do not necessarily reflect the views of the BLS.

iii

iv
Contents Acknowledgements ....................................................................................................................................... ii List of Tables ................................................................................................................................................ v List of Figures (classification trees) ............................................................................................................ vii Executive Summary ................................................................................................................................ ES-1
1 Introduction ........................................................................................................................................... 1
2 Methods................................................................................................................................................. 3 2.1 Survey design ................................................................................................................................ 3 2.2 Sample selection ........................................................................................................................... 3 2.3 Data collection .............................................................................................................................. 3 2.4 Analysis......................................................................................................................................... 4
3 Results ................................................................................................................................................... 7 3.1 Response rates ............................................................................................................................... 7
3.2 Establishment characteristics based on survey responses ............................................................. 9 3.2.1 Workers’ compensation, union workforce, OSHA exemption ............................................. 9 3.2.2 Participant recordkeeping and reporting experience ............................................................. 9 3.2.3 Establishment use of workplace injury and illness data ...................................................... 11
3.3 Compliance with OSHA recordkeeping requirements ................................................................ 13 3.3.1 Estimates of compliance by state ........................................................................................ 13 3.3.2 Characteristics associated with noncompliant recording practices ..................................... 18
3.4 Sources of workplace injury and illness data .............................................................................. 25 3.4.1 Estimates of data source use by state .................................................................................. 25 3.4.2 Characteristics associated with use of workers’ compensation data for OSHA and SOII .. 28
3.5 Knowledge of OSHA recordkeeping requirements .................................................................... 32 3.5.1 Estimates of OSHA recordkeeping knowledge by state ..................................................... 32 3.5.2 Characteristics associated with OSHA recordkeeping knowledge ..................................... 34
3.6 OSHA recordkeeping knowledge by compliance ....................................................................... 37
3.7 Classification trees ...................................................................................................................... 41 3.7.1 Classification trees: Compliance with OSHA recordkeeping regulations .......................... 41 3.7.2 Classification trees: Knowledge of OSHA recordkeeping regulations ............................... 41 3.7.3 Classification trees: Participants trained in OSHA recordkeeping requirements ................ 43
4 Discussion ........................................................................................................................................... 53
5 Conclusion .......................................................................................................................................... 55
References ................................................................................................................................................... 56
Appendix: Worker estimates ....................................................................................................................... 57

v
List of Tables Table 1. Response rate by state…………………………………………………………………….….. 7
Table 2. Response rate by state and select establishment characteristics……………………………... 8
Table 3. Establishment and record-keeper characteristics by state, based on survey responses…………………………………………………………………………….……… 10
Table 4. Establishment use of workplace injury and illness data by state…………………………… 12
Table 5. Workplace injury and illness recordkeeping practices by state…………………………..… 15
Table 6. Reliance on temporary workers obtained through a staffing agency and reporting of injuries among such workers by state……………………………………………………………...…17
Table 7. Unadjusted and adjusted odds ratio for no logs maintained by establishment………………19
Table 8. Adjusted odds ratio for noncompliant OSHA recordkeeping practices……………………. 21
Table 8-A. Adjusted odds ratio for state*trained interaction term for use of noncompliant case definition................................................................................................................................. 22
Table 9. Adjusted odds ratio for omitting temporary worker injuries from host establishment’s injury and illness reports………………………….…………………………………….…….…… 24
Table 10. Source of OSHA log information by state………………………………………………..… 25
Table 11. Source of SOII data by state……………………………………………………………..…. 27
Table 12. Adjusted odds ratios for use of workers’ compensation claims data for OSHA log …….… 29
Table 13. Adjusted odds ratios for use of data other than OSHA for completing SOII………………. 31
Table 14. Responses to hypothetical recordkeeping scenarios by state…………………………….… 33
Table 15. Adjusted odds ratios for incorrect responses to hypothetical OSHA recordkeeping scenarios…………………………………………………………….……………………….35
Table 15-A. Adjusted odds ratios for state*trained interaction terms for incorrect responses to two hypothetical OSHA recordkeeping scenarios…………………………………………….… 36
Table 16. Answers to hypothetical recording scenarios by whether or not OSHA logs were maintained for the establishment….…………………………………………………………………..… 37
Table 17. Answers to hypothetical recording scenarios by compliant and non-compliant case criteria for determining log eligibility…………………………………………….………………… 38
Table 18. Answers to hypothetical recording scenarios by compliant and non-compliant timing of case recording……………………………………………………………………………………. 39

vi
Table 19. Answers to hypothetical recording scenarios by compliant and non-compliant methods of counting days of missed work……………………………………………………………… 40
Tables in the Appendix (Worker Estimates)
Table A-1. Estimated workers at establishments by select establishment and record-keeper characteristics………………………………………………………………….…………….57
Table A-2. Estimated workers at establishments by use of injury and illness data in establishment performance measures……………………………………………………………………….58
Table A-3. Estimated workers at establishments by OSHA recordkeeping compliance……………..… 59
Table A-4. Estimated workers at establishments by source of OSHA injury and illness data, among establishments where OSHA log maintained by the study participant…………………...… 60
Table A-5. Estimated workers at establishments by source of SOII data, among establishments where the study participant completed SOII…………………………………………………….… 60
Table A-6. Estimated workers at establishments by OSHA recordkeeping knowledge, as assessed by correct responses to hypothetical recordkeeping scenarios……………………….………... 61

vii
List of Figures (classification trees) Figure 1. Compliance with requirement to maintain OSHA logs, by establishment
characteristic……………………………………………………………………………...… 44
Figure 2. Compliance with use of OSHA case criteria, by establishment characteristic……………... 45
Figure 3. Compliance with counting calendar days of missed work, by establishment characteristic…………………………………………………………………………………46
Figure 4. Knowledge of requirement to record work injury resulting in stitches, by establishment characteristic………………………………………………………………………….......… 47
Figure 5. Knowledge of requirement to record work injury resulting from horseplay, by establishment characteristic…………………………………………………………….….…………….… 48
Figure 6. Knowledge that cases limited to diagnostic services are not required to be recorded, by establishment characteristic………………………………………………………………… 49
Figure 7. Knowledge that weekend days are counted as missed work, by establishment characteristic………………………………………………………………………...……… 50
Figure 8. Knowledge that OSHA logs are updated to reflect delayed or eventual work absence, by establishment characteristic………………………………………………………………….51
Figure 9. Establishments with trained record-keepers, by establishment characteristic……………… 52

ES-1
Executive Summary
BACKGROUND AND OBJECTIVES
In publishing annual estimates of nonfatal occupational injuries and illnesses for the US and most states, the Bureau of Labor Statistics (BLS) provides a key data source for monitoring the burden of workplace injuries across the country. Estimates are based on employer-reported data, collected through the Survey of Occupational Injuries and Illnesses (SOII). Employers sampled for participation in SOII are instructed to submit data based on their OSHA injury and illness records. Compared to other sources of occupational injury data, employers appear to underreport cases in SOII. Recent research identified several noncompliant employer-based work injury recordkeeping practices that may contribute to underreporting, but did not estimate the extent of the recordkeeping errors. This study aims to estimate the prevalence of compliant and noncompliant recordkeeping practices in several states, and to characterize practices by establishment and record-keeper characteristics.
METHODS
A follow-back telephone survey was conducted in 2013-2014 with 3,342 SOII respondents in four states – Minnesota, New York, Oregon, and Washington – to gather data on employer-based work injury recordkeeping practices. Participant recruitment and survey administration were conducted at the state level; survey responses were aggregated for analysis. We estimated state-wide prevalence of: compliance with OSHA and SOII reporting requirements; sources of employer injury data (e.g., workers’ compensation claims data and OSHA injury and illness records); and knowledge of OSHA injury and illness recordkeeping requirements. Patterns in employer recordkeeping were explored through regression analyses.
RESULTS
Few participants were experienced workplace injury and illness record-keepers.
• 19% participated in SOII in multiple years (four states combined, no difference by state). • 22% received formal OSHA injury and illness recordkeeping training (four states combined, no
difference by state). • Participants with at least one year of OSHA recordkeeping experience ranged from one-third in
New York, one half in Minnesota and Washington, and two-thirds in Oregon.
COMPLIANCE WITH OSHA INJURY AND ILLNESS RECORDING REQUIREMENTS
OSHA 300 logs were maintained in less than half of establishments in any of the four states. Among establishments with logs, compliance was greatest for recording cases within the seven-day requirement, and less so for use of the OSHA case definition to determine eligibility and counting calendar days an injured worker was unable to work. Establishments were least compliant with the requirement to record injuries among temporary help workers hired through staffing agencies. Percentages of compliant establishments differed by state. Although New York had the lowest percent of establishments that

Executive Summary
ES-2
maintained OSHA logs, New York log-maintaining establishments reported the highest percent of compliant recording practices.
• The percent of establishments with OSHA 300 logs ranged from 29% in New York to 48% in Oregon.
• Among establishments maintaining logs: o Recording cases within seven days ranged from 59% of Washington establishments to
85% of New York establishments. o The OSHA recordable case definition was used by as little 30% of establishments in
Washington and as much as 58% of establishments in New York. o Counting calendar days of work disability occurred in 29% of Oregon establishments to
58% of New York establishments. o Establishments where injuries among temporary workers obtained through a staffing
agency would be included on the host’s OSHA log ranged from 17% in Minnesota to 39% in New York.
Controlling for establishment and record-keeper characteristics, the following characteristics were associated with noncompliant OSHA recording practices, based on logistic regression models controlling for establishment and record-keeper characteristics:
Characteristics associated with absent OSHA logs:
• 10 or fewer employees • Leisure and Hospitality industry • Private or state-funded workers’ compensation insurance (vs. self-insured) • Single-site employers • Respondents whose SOII participation was limited to a single survey year (first-time respondent) • 0 recordable cases reported in SOII • Washington and Oregon establishments usually exempt from maintaining OSHA injury records
(compared to non-exempt establishments within each respective state) • New York establishments required to maintain OSHA records annually regardless of SOII
participation (compared to non-exempt establishments in other states)
Factors associated with noncompliance with the recordable case definition differed from the factors associated with noncompliance with the rules for counting days of disability.
Among establishments with OSHA logs, use of the OSHA case definition was less likely among:
• Respondents whose SOII participation was limited to a single survey year (first time respondent) • Minnesota and New York respondents with no recordkeeping training (compared to trained
respondents within each respective state) • Untrained record-keepers in Minnesota, New York, and Washington (compared to untrained
Oregon record-keepers) • Trained record-keepers in Minnesota, Oregon, and Washington (compared to trained New York
record-keepers)

Executive Summary
ES-3
Establishments that disclosed OSHA injury and illness data in competitive bids for contract work were more likely to use the OSHA recordable case definition
Among establishments with OSHA logs, counting calendar days away from work was less likely among:
• Record-keepers with ≤1 year of OSHA recordkeeping experience • Single-site employers • Nonunion workforce • Private or state-funded workers’ compensation insurance (vs. self-insured) • Record-keepers with no formal OSHA recordkeeping training • Establishments with 11-249 employees (compared to larger establishments)
SOURCES OF EMPLOYER INJURY DATA REPORTED IN SOII
Despite instructions to report OSHA injury and illness records for SOII, less than half of establishments in any of the four states reported using OSHA data for SOII. Additionally, the source of SOII data reported by employers varied by state. Among participants who recalled responding to SOII:
• OSHA data was used in as little as 22% of New York establishments to as much as 49% of Oregon establishments
• Use of workers’ compensation data, in the absence of OSHA data, ranged from 10% of Minnesota and Oregon establishments to 19% of New York establishments
• Internal company data that was neither OSHA data nor workers’ compensation data was used in 6% of Oregon establishments, 20%-23% of Minnesota and Washington establishments, and 54% of New York establishments
• It is unclear what data sources were used in the more than one-third of establishments in Minnesota, Oregon, and Washington that claimed to have no injuries, used some other source not classified as OSHA, WC, or internal, or didn’t know what data were used.
Controlling for establishment and record-keeper characteristics, the following characteristics were associated with reporting workers’ compensation claims data instead of OSHA injury data in SOII, based on an adjusted logistic regression model:
• New York establishments • Single-site employers • Record-keepers with no formal OSHA recordkeeping training • Record-keeper with ≤1 year of OSHA recordkeeping experience • Establishments usually exempt from OSHA injury and illness recordkeeping based on industry • Record-keepers whose job performance evaluation is not based on OSHA injury data.

Executive Summary
ES-4
KNOWLEDGE OF OSHA INJURY AND ILLNESS RECORDING REQUIREMENTS
Based on responses to hypothetical recordkeeping scenarios, most participants: considered all incidents recordable even when they did not meet the OSHA case criteria; indicated that they would update the OSHA log as a case develops over time; and would limit the number of days of missed work to scheduled shifts. Correct responses for each of the five scenarios are as follows (estimated prevalence did not differ by state):
• 70% of establishments would record injuries resulting in stitches • 68% of establishments would record injuries resulting from horseplay • 68% of establishments would update the OSHA log with days of missed work that did not occur
until a week after the initial injury • 27% of establishments would count an unscheduled weekend as days of missed work • 22% of establishments would omit from the log a case limited to diagnostic services
The large percentages of incorrect responses to the questions about counting unscheduled weekend days and omitting diagnostic services from the log suggest that many SOII respondents are potentially over-reporting minor cases (those limited to diagnostic services) and underreporting cases involving days of missed work as well as the duration of missed work.
Controlling for establishment and record-keeper characteristics, the following characteristics were associated with incorrect responses to at least three of the five recordkeeping scenarios based on adjusted logistic regression models:
• Establishments in Administrative Support and Waste Management and Remediation Services + Other Services
• Respondents with no formal OSHA recordkeeping training • Washington establishments • Record-keepers with ≤1 year of OSHA recordkeeping experience • 0 recordable cases reported in SOII
Disclosure of OSHA injury and illness data in competitive bids for contract work was associated with correct responses to three scenarios, including the two more challenging questions answered incorrectly by most participants (i.e., counting weekend days as missed work and omitting cases limited to diagnostic services).
CONCLUSIONS
While some workplace injury and illness record-keepers at SOII-participating establishments exhibit comprehensive knowledge of the injury and illness recording requirements, many record-keepers possess a limited understanding of those requirements. Misperceptions of the reporting requirements suggest that many establishments over-report minor cases yet under-report duration of work disability and the number of cases involving disability. Underreporting cases involving missed work is particularly relevant for SOII data as DAFW cases are the basis of injury and illness estimates by worker and injury characteristics (e.g., age of injured worker, nature of injury, body part injured).
Knowledge of and compliance with OSHA injury reporting requirements differed by establishment and record-keeper characteristics. Participants with minimal OSHA recordkeeping knowledge and noncompliant recordkeeping practices share many of the same characteristics of participants who use data

Executive Summary
ES-5
other than OSHA data when completing SOII. State differences in recordkeeping practices and knowledge persisted after controlling for establishment and record-keeper characteristics. While state differences such as OSHA activity or workers’ compensation systems may contribute to recordkeeping patterns at the state level, state-based survey administration procedures for this survey may also explain observed differences.
The accuracy of the BLS estimates of nonfatal occupational injuries and illnesses is dependent on the quality of the data reported by employers. Since record-keeper characteristics were found to be associated with better compliance and knowledge, focusing on SOII respondents may be an effective means of improving data accuracy, including: identification of first time SOII respondents (individuals, not establishments) and increased communication between the SOII data collection staff and all respondents throughout the survey period to facilitate an improved understanding of the reporting requirements; enrollment of establishments in SOII for a multi-year period instead of one year to increase familiarity with recordkeeping; and development and dissemination of effective training materials, in collaboration with OSHA, that address common recordkeeping misperceptions.

ES-6

1
1 Introduction Data that quantify and characterize work-related injuries and illnesses are fundamental to workplace injury prevention efforts by informing the prioritization, implementation, and evaluation of such efforts. The Bureau of Labor Statistics (BLS) provides an important source of occupational health and safety data, publishing annual estimates of nonfatal work-related injuries and illnesses for the US and most states.
BLS estimates are based on employer-reported data, collected from a sample of establishments through the Survey of Occupational Injuries and Illnesses (SOII). Sampled employers are instructed to submit data based on their OSHA injury and illness records, with detailed worker and injury data collected on more serious injuries, defined as those involving one or more days of missed work (Wiatrowski, 2014). Research suggests that, compared to other sources of occupational injury data, employers underreport missed work cases in SOII (Boden and Ozonoff, 2008; Rosenman et al., 2006). Additional studies have identified systematic biases in reporting, with greater underreporting found for difficult to diagnosis non-acute conditions (Nestoriak and Pierce, 2009), Hispanic workers (Dong et al., 2011), and larger establishments in high hazard industries as well as smaller establishments in less hazardous industries (Wuellner et al., 2016). Finally, based on the findings from a study comparing SOII cases to workers’ compensation claims in six states (Boden, 2014), and another study comparing nonfatal SOII data to fatal workplace injury data for all SOII participating states (Mendeloff and Burns, 2013), underreporting of SOII eligible cases may be greater in some states than others.
In an effort to better understand the injury and illness data submitted by employers for SOII, recent studies have focused on the workplace injury recordkeeping practices of SOII respondents to explore whether respondents follow the OSHA injury and illness recording regulations during their participation in SOII as instructed. Interviews with SOII respondents have identified recordkeeping practices noncompliant with the OSHA regulations including: use of eligibility criteria other than the OSHA recordable case criteria; failure to accurately assess and document case severity and update records to reflect changes in the case; and an absence of workplace injury and illness records in any form (Phipps and Moore, 2010; Rappin et al., 2016; Wuellner and Bonauto, 2014). Although these studies identified recordkeeping errors that impact the accuracy of SOII data, they were not designed to estimate the extent of such practices, nor were they designed to identify patterns in recordkeeping errors by establishment characteristics.
Establishment differences in recordkeeping errors may arise from, among other reasons, the frequency of recordkeeping activities and the use and oversight of the establishment injury and illness data. For example, record-keepers in establishments with few injuries and infrequent opportunities to apply their recordkeeping knowledge may possess a poor understanding of the reporting requirements, while record-keepers in establishments with greater recording needs (i.e., more frequent injuries) or where the injury data are used internally to evaluate job performance or award prizes may have a greater familiarity with the requirements. Unions, having the right to review workplace OSHA injury and illness records, may provide oversight of the records and notify the employer of any inaccuracies identified while record-keepers may take steps to improve their recording skills, knowing that the union will be reviewing the injury records.

Introduction
2
This study, building on previous research into the workplace injury recordkeeping practices of SOII respondents, aims to:
• Estimate state-wide occurrence of compliant and noncompliant OSHA injury and illness recordkeeping practices and correct and erroneous OSHA recordkeeping knowledge
o Estimates of compliant practices: section 3.3.1 o Estimates of knowledge: section 3.5.1
• Identify establishment and record-keeper characteristics associated with compliance and knowledge
o Characteristics associated with compliant practices: section 3.3.2 o Characteristics associated with knowledge: section 3.5.2
• Assess patterns in recordkeeping compliance and knowledge by state independent of establishment characteristics
o State comparisons of compliant practices: section 3.3.2 o State comparisons of knowledge: section 3.5.2
• Identify sources of workplace injury and illness data that may be submitted for SOII o Sources of establishment work-related injury data: section 3.4
To address these aims, we analyzed telephone survey data collected from SOII respondents in several states. Survey questions assessed workplace injury recordkeeping knowledge and practices among establishments whose data are used in BLS estimates of occupational injuries and illnesses.

3
2 Methods Details on the survey design, sample selection, and data collection are provided in the final reports prepared by each of the four states, available on the BLS’s Undercount Research webpage.1 They are summarized below.
2.1 Survey design In collaboration with the Bureau of Labor Statistics, occupational safety and health researchers from the Minnesota Department of Labor and Industry, New York State Department of Health, Oregon Department of Consumer and Business Services, and Washington State Department of Labor and Industries developed a telephone questionnaire to assess workplace injury recordkeeping knowledge and practices among SOII respondents. Largely patterned after similar survey tools used in semi-structured interviews (Phipps and Moore, 2010; Wuellner and Bonauto, 2014), the 30-minute telephone questionnaire was adapted for quantitative survey data collection by framing questions as Yes/No or multiple choice responses. The questionnaire included a core set of seven topic areas: 1. Establishment demographics, 2. Employee roles in workplace injury and illness records, 3. Establishment processes for tracking workplace injuries and illnesses, 4. OSHA recordkeeping practices, 5. SOII reporting practices, 6. Establishment use of workplace injury and illness data, and 7. Hypothetical recordkeeping scenarios. Each state’s survey included the core set of questions, plus a limited number of state-specific questions.
2.2 Sample selection The study sample was selected from each state’s population of SOII respondents (i.e., establishments that submitted data for SOII and used in final BLS estimates of occupational injuries and illnesses). BLS provided guidance on selecting establishments that allowed for inference to each state’s SOII-eligible population while accommodating state-specific research aims. Each state stratified the SOII establishment micro data by ownership, NAICS industry sector, and size group.2 Washington oversampled small establishments in high hazard industries; the other three states sampled proportionally from the strata. Minnesota and Oregon selected establishments from the 2010 and 2011 SOII data, while New York and Washington limited selection to the 2011 SOII data. Establishments were randomly selected from each sample cell, and weighted to be proportional to the state distribution. Final survey weights were adjusted for non-response (by industry, size, and ownership), and, in Washington, for oversampling.
2.3 Data collection Like sample selection, participant recruitment and survey administration procedures were developed jointly but executed independently by each state. Using the SOII contact data to reach sampled establishments, states sent an introductory letter via email or postal mail, and followed up with a phone call. The survey was conducted with the individual listed in the SOII contact data as the SOII respondent or, if unavailable, the person currently responsible for the establishment’s occupational injury and illness recordkeeping.
Study participants were informed that participation was voluntary, and consent was obtained verbally in three states; in Minnesota, the IRB determined that the study was exempt and informed consent was thus
1 See http://www.bls.gov/iif/undercount.htm 2 There were slight differences in how each state grouped ownership, industry, and size class, e.g., depending on the state, ownership was defined as two groups (1. Private; 2. State + local government combined), or as three groups (1. Private; 2. State government; 3. Local government). Details can be found in the state reports, available at: http://www.bls.gov/iif/undercount.htm#p2

Methods
4
not required. In addition to approval from the Washington State IRB (which approved both the Washington and Oregon study sites) and the New York State IRB, study approval was also obtained from the Office of Management and Budget.
Telephone interviews were conducted in 2013-2014. Survey responses collected by each state were aggregated at BLS for analysis. Aggregation allowed for increased statistical power to detect differences in recordkeeping practices by respondent or establishment characteristics.
2.4 Analysis Categorical variables for establishment size, industry and ownership were collapsed to the least detailed sample group defined by any one state. Industry was collapsed further to increase cell sizes for the analysis.
For the time period that included the telephone survey data collection, exemption status from annual OSHA injury and illness recordkeeping (requiring certain establishments to maintain records only when asked to do so by OSHA or by BLS for participation in SOII) was based on Standard Industrial Classification (SIC) system codes; however, establishment SIC codes are not captured in SOII data and were not otherwise available for this study. Instead, North American Industry Classification System (NAICS) codes were used as a proxy indicator of partial exemption status at the time of the telephone survey. Establishments were classified as partially exempt based on the NAICS codes used by OSHA to define exemption status effect January 1, 2015.3 The OSHA definition was applied to all establishments and did not account for state-specific exemption regulations in Minnesota, where all establishments are required to maintain injury records regardless of industry,4 and Washington, where health care offices, public schools and libraries join the list of industries required to maintain annual OSHA injury records.5
Based on a review of the completed survey elements, it was determined that individual missing values should have been recorded by the interviewer as “Don’t know”. In general, missing values were grouped with DK responses in the analysis. “Don’t know” responses were grouped with incorrect or non-compliant responses.
The survey included several skip patterns (e.g., some survey participants did not maintain OSHA injury and illness records and were therefore skipped out of the section related to OSHA recording practices). Certain analyses were limited to subgroups of establishments to account for the skip patterns.
Frequency tables were constructed using the SAS surveyfreq procedure to account for the sample design. The domain statement was used to analyze subpopulations (e.g., recordkeeping practices among establishments that use temporary workers obtained through a staffing agency). The Rao-Scott chi-square was used to test the association between variables. Statistical significance was defined as p<0.05. Tabulations presented in the main body of the report are based on estimated numbers of establishments. The appendix provides tabulations for select outcomes based on estimated numbers of workers.
Logistic regression models were used to identify associations between recordkeeping practices and establishment characteristics, and were estimated using the SAS surveylogistic procedure, using the domain statement to conduct analyses of subpopulations. Outcomes included in the regression models were defined as compliant vs. non-compliant practices, and correct answers to the hypothetical recordkeeping scenario vs. incorrect. Binomial outcomes were preferred based on sample size
3 See https://www.osha.gov/recordkeeping/ppt1/RK1exempttable.html accessed on March 30, 2016. 4 See http://www.dli.mn.gov/osha/FedState.asp accessed on June 28, 2016. 5 See http://apps.leg.wa.gov/wac/default.aspx?cite=296-27-00105 accessed on March 20, 2013.

Methods
5
considerations. Unadjusted and adjusted models were estimated for each aspect of recordkeeping compliance and hypothetical recording scenario. In the interest of brevity, unadjusted odds ratios are only presented for one aspect of recordkeeping compliance; adjusted odds ratios are presented for each outcome, and control for establishment and record-keeper characteristics.
Classification trees were developed to create groups of establishments with similar recordkeeping practices. Trees were generated from the Classification and Regression Tree (CART) algorithm using the rpart program in R and unweighted survey data.
Establishment characteristics evaluated for associations with recordkeeping practices included: state, ownership, industry, number of employees, number of worksites, OSHA total recordable injury and illness rate (as reported in SOII), workers’ compensation insurer, unionized workforce, and OSHA recordkeeping exemption status. Record-keeper characteristics included: prior SOII experience, years of OSHA recordkeeping experience, and whether or not they had been trained on OSHA recordkeeping regulations. Establishment uses of OSHA injury and illness data included: a measure of the record-keeper’s job performance, a measure of supervisors’ job performance, a measure of worker performance in workplace safety incentive programs, and a component of competitive bid packages for contract work.
By estimating the magnitude of noncompliant recordkeeping practices among SOII respondents in four states, and by identifying within and between state differences in recordkeeping practices and knowledge, the analyses presented here address the questions posed in my ASA/NFS/BLS fellowship proposal.

6

Results: Response rates
7
3 Results 3.1 Response rates Response rates were calculated as the percent of establishments that participated in the telephone survey out of the total number of sampled establishments still in business at the time of contact.
There were significant differences in participation by state, size class, industry class, and reported cases of occupational injuries. Among the four states, Oregon saw the highest participation (70%), whereas there was little difference among the remaining three states, where approximately half of establishments participated (table 1). Table 2 presents response rates by state and establishment characteristics. Larger establishments were more likely to participate compared with smaller establishments. By industry, participation was lower among Retail Trade and higher among State and Local Government. Establishments that reported any cases in SOII were more likely to participate compared with establishments that reported zero total cases, or zero cases with days away from work (DAFW). Patterns of participation by establishment characteristics were similar across the four states.
Table 1. Response rate by state (unweighted establishment data).
MN NY OR WA Total establishments sampled 1204 1500 2077 1506 Participating establishments 581 690 1368 701 Non-responding establishments 528 743 583 716 Out of business establishments 95 67 126 89 Response rate by state 52% 48% 70% 49%
Note: Response rate = (number of participating establishments/(Total establishments sampled – out of business establishments)*100%

Results: Response rates
8
Table 2. Response rate by state and select establishment characteristics (unweighted establishment data).
MN NY OR WA Size 1-10 employees 32% 37% 60% 46% 11-49 employees 54% 44% 65% 47% 50-249 employees 61% 52% 76% 47% 250+ employees 60% 51% 80% 60% Industry Construction + Agriculture, Forestry, Fishing, Hunting 54% 28% 62% 46% Wholesale Trade + Transp, Warehousing + Utilities 47% 57% 74% 46% Manufacturing 58% 48% 69% 48% Retail Trade 37% 36% 75% 35% Information, Financial, Real Estate, Prof, Mgmt Svc 43% 42% 59% 43% Admin, Support, Waste Mgmt, Remediation + Oth Svc 49% 33% 62% 46% Education + Health Care, Social Assistance 48% 54% 70% 56% Leisure and Hospitality 48% 48% 64% 44% State and Local Government 69% 62% 91% 70% Total OSHA recordable case ratea 0 cases 42% 43% 62% 45% 1+ cases 63% 52% 76% 52% DAFW case ratea 0 cases 46% 45% 65% 46% 1+ cases 64% 51% 79% 53%
aBased on SOII data reported by establishment.

Results: Establishment demographics
9
3.2 Establishment characteristics based on survey responses Table 3 presents establishment and record-keeper characteristics by state. (See Appendix for tabulations based on estimated number of workers.)
3.2.1 Workers’ compensation, union workforce, OSHA exemption There were substantial differences in workers’ compensation insurer by state: in Minnesota, over two-thirds of establishments had coverage through a private insurer, in Oregon and New York approximately one-third of establishments has private insurance, and in Washington an estimated 1% had private insurance (although, given the state’s monopolistic WC system, this was likely a self-insured establishment whose claims were managed by a third party administrator). Conversely, the percent of state funded establishment ranged from less than 10% in Minnesota to almost 90% in Washington. Self-insured establishments were least common in Washington (4%) and most common in New York (18%).
The estimated percent of establishments where some portion of the workforce was unionized was similar across the four states (7%).
Based on OSHA’s NAICS-based list of establishments partially exempt from OSHA recordkeeping, half of the establishments across all four states are required to maintain OSHA injury and illness records only when selected for SOII. (Provisions for establishment size likely increase the number of establishments partially exempt from OSHA recordkeeping.)
3.2.2 Participant recordkeeping and reporting experience For many study participants, the SOII year from which the telephone survey sample was drawn (i.e., 2010 or 2011, depending on the state) was the first time they participated in the SOII. In three of the four states, this represented approximately 40% of establishments, while participants from an estimated 20% of establishments were SOII respondents for multiple years. Participants in the remaining establishments did not complete the SOII (generally, these were new hires and had not been responsible for recordkeeping during SOII data collection) or did not know if they were first-time or repeat SOII respondents.
In any state, few participants had received formal training on the OSHA recordkeeping requirements; trained record-keepers were present in an estimated 22% of all establishments.
The years of OSHA recordkeeping experience differed by state, although percentages suggested limited experience among most establishment record-keepers. New York had the least amount of OSHA recordkeeping experience (67% of establishments were represented by a study participant with less than one year of experience, and 11% by a participant with ten or more years of experience), and Oregon establishments were most experienced (33% of establishments were represented by a study participant with less than one year of experience and 32% by a participant with ten or more years of experience). Most participants with less than one year of experience had, in fact, no OSHA recordkeeping experience and did not maintain any OSHA Injury and illness records.

Results: Establishment demographics
10
Table 3. Establishment and record-keeper characteristics by state, based on survey responses.
MN NY OR WA Total p-value Study establishments 581 690 1368 701 3340 Estimated establishments 179,391 342,596 216,152 131,395 869,533 Establishment demographics Workers' compensation insurer Private 71.7 (5.1) 30.2 (5.5) 32.4 (3.6) 1.1 (0.5) 34.9 (2.7) <0.0001 Self-insured 14.4 (2.7) 18.3 (4.8) 6.9 (1.5) 4.0 (0.9) 12.5 (2.0) State funded 7.7 (3.5) 27.5 (5.5) 46.9 (3.6) 87.9 (2.9) 37.4 (2.8) Other 6.3 (3.6) 23.9 (5.7) 13.8 (2.7) 7.0 (2.7) 15.2 (2.6) Unionized workforce Yes 7.1 (1.4) 8.4 (2.3) 4.8 (0.6) 4.3 (0.7) 6.6 (0.9) 0.0935 No 92.9 (1.4) 91.6 (2.3) 95.2 (0.6) 95.7 (0.7) 93.4 (0.9) Exempt from OSHA recordkeepinga Partially exempt 39.8 (5.3) 56.3 (6.1) 49.0 (3.4) 52.1 (4.9) 50.5 (2.8) 0.1285 Required annually 60.2 (5.3) 43.7 (6.1) 51.0 (3.4) 47.9 (4.9) 49.5 (2.8) Survey participant recordkeeping experience SOII experience First time 41.8 (5.6) 23.8 (4.8) 40.8 (3.6) 44.4 (5.3) 34.8 (2.7) <0.0001 Repeat 18.8 (3.6) 21.1 (4.3) 14.5 (2.5) 22.7 (3.7) 19.2 (2.0) Did Not Complete SOII 16.3 (4.2) 32.3 (6.1) 15.2 (2.3) 4.5 (1.9) 20.5 (2.8) DK + Other 23.1 (5.1) 22.8 (5.8) 29.5 (3.3) 28.4 (4.7) 25.4 (2.7) OSHA recordkeeping training received by the participant or the person responsible for the OSHA records Yes 26.5 (4.6) 18.7 (4.3) 24.8 (3.1) 20.4 (3.6) 22.1 (2.2) 0.1922 No 64.5 (5.3) 66.7 (6.3) 71.0 (3.3) 71.6 (4.3) 68.1 (2.9) DK 9.0 (3.5) 14.6 (5.9) 4.2 (1.6) 8.0 (2.5) 9.8 (2.6) Years of OSHA recordkeeping experience <=1 year 53.0 (5.5) 67.4 (5.4) 33.0 (3.5) 48.0 (5.3) 52.9 (2.9) <0.0001 2 - 9 years 23.3 (4.0) 21.3 (5.0) 28.1 (3.3) 23.5 (3.5) 23.7 (2.3) 10+ years 23.7 (4.2) 10.9 (2.5) 32.0 (3.3) 23.5 (4.1) 20.7 (1.8) DK . (.) 0.5 (0.3) 7.0 (2.0) 5.0 (1.9) 2.7 (0.6)
Note: Data shown are % of estimated establishments by state (SE) unless otherwise noted. aBased on OSHA’s list of partially exempt NAICS codes; does not account for exemption based on number of employees, or state-based exemption rules.

Results: Establishment demographics
11
3.2.3 Establishment use of workplace injury and illness data The telephone survey assessed four establishment uses of workplace injury and illness data6:
As a performance measure of: (1) Record-keeper’s job performance, (2) Supervisors’ job performance, and (3) Worker safety incentive programs
and (4) Inclusion in competitive bid packages for contract work.
Table 4 presents, by state, establishment use of work injury and illness data. (See Appendix for tabulations based on estimated number of workers.) Most establishments did not use workplace injury and illness data for any of the measures assessed.
Injury-based performance measures were most common in Minnesota, where 17% of establishments used injury data to measure the job performance of the record-keeper (5% used OSHA data, 12% used other injury data), 22% of establishments used it in performance evaluations of supervisors (7% used OSHA data, 15% used other injury data), and 15% of establishments used injury data for worker safety incentive programs (4% used OSHA data, 11% used other injury data). In the remaining three states, less than 11% of establishments employed any of the three injury-based performance measures.
Use of OSHA data in performance measures differ by state, but never exceeded 7% of establishments (in Minnesota, where it was used in the job performance evaluation of supervisors). For each of the three injury-based performance measures, use of OSHA data was greatest in Minnesota and lowest in New York.
Inclusion of workplace injury and illness data in bid packages for contract work was the least common use of workplace injury; participation ranged from 2% of New York establishments to 7% of Washington establishments. However, among the establishments that did include workplace injury data in competitive bids, OSHA data was the type injury data used by most establishments.
Of the four measures assessed, use of OSHA data in bid packages was most likely to be an establishment’s only use of OSHA data. Conversely, using OSHA data to evaluate performance in worker safety incentive programs and record-keeper job performance were usually one of multiple applications of OSHA data within an establishment (data not shown).
6 A fifth practice – use of workplace injury data to compare multiple worksites – was also assessed, and was estimated to be among the most common establishment uses of workplace injury data. As many as 40% of multi-site establishments in New York reported using worksite injury data to compare multiple sites (the practice was somewhat less common in the other states). However, because responses were missing for over 15% of Oregon establishments, use of workplace injury data in the comparisons of multiple worksites was not analyzed further.

Results: Establishment demographics
12
Table 4. Establishment use of workplace injury and illness data by state.
MN NY OR WA Total p-value Study establishment 581 690 1368 701 3340 Estimated establishments 179,391 342,596 216,152 131,395 869,533 Used to evaluate the job performance of the record-keeper OSHA data 5.3 (2.5) 0.5 (0.3) 4.8 (1.4) 3.3 (1.6) 3.0 (0.7) <0.0001 Other data 11.8 (3.0) 4.3 (0.9) 4.7 (1.2) 3.6 (1.1) 5.8 (0.8) None 81.4 (4.0) 88.5 (3.7) 88.8 (2.0) 90.3 (2.3) 87.4 (1.8) DK 1.6 (0.9) 6.8 (3.6) 1.7 (0.8) 2.7 (1.3) 3.8 (1.5) Used to evaluate job performance of supervisors OSHA data 7.0 (2.7) 2.1 (1.6) 6.2 (1.2) 4.2 (1.6) 4.5 (0.9) 0.0038 Other data 15.0 (3.5) 8.1 (2.0) 4.7 (1.0) 5.3 (1.6) 8.3 (1.2) None 74.0 (4.5) 75.3 (5.0) 81.3 (2.5) 80.1 (3.4) 77.3 (2.3) DK 4.0 (1.3) 14.5 (4.5) 7.8 (2.0) 10.4 (2.6) 10.0 (1.9) Used to evaluate performance in worker safety incentive program OSHA data 3.8 (2.3) 0.1 (0.0) 2.1 (0.5) 0.7 (0.2) 1.5 (0.5) 0.0099 Other data 11.1 (2.8) 6.9 (2.3) 5.9 (1.2) 7.3 (1.6) 7.6 (1.1) None 83.9 (3.7) 91.4 (2.5) 89.7 (1.6) 88.9 (2.0) 89.0 (1.3) DK 1.2 (0.7) 1.6 (0.8) 2.3 (0.9) 3.1 (1.2) 1.9 (0.4) Included in competitive bids for contract work OSHA data 3.9 (1.3) 1.9 (0.5) 5.9 (1.7) 6.5 (1.6) 4.0 (0.6) 0.0163 Other data 0.3 (0.2) 0.4 (0.3) 0.3 (0.1) 0.3 (0.2) 0.4 (0.1) None 89.4 (2.0) 88.2 (3.2) 89.5 (2.0) 88.6 (2.2) 88.8 (1.4) DK 6.4 (1.5) 9.4 (3.1) 4.3 (1.0) 4.7 (1.5) 6.8 (1.3)
Note: Data shown are % of estimated establishments (SE) unless otherwise noted.

Results: OSHA compliant recordkeeping practices
13
3.3 Compliance with OSHA recordkeeping requirements 3.3.1 Estimates of compliance by state 3.3.1.1 OSHA injury and illness 300 logs maintained for establishment OSHA injury and illness 300 logs were maintained (during the SOII year or in other years) in 41% of all establishments, although participation may have been greater, depending on the practice of the participants who answered ‘don’t know’, which ranged from an estimated 4% of Minnesota establishments to 32% of New York establishments (table 5). Establishments that maintained OSHA logs generally did so every year, regardless of participation in SOII. Of the establishments that maintained logs either during SOII or some other year, 93% indicated that they maintained logs even when not participating in SOII.
Overwhelmingly, logs were maintained, at least in part, by the study participant interviewed; establishments where someone other than the participant maintained the logs represented less than 2% of establishments in Minnesota, New York, and Oregon, and 8% of establishments in Washington. A location manager or the human resources department was usually cited as having responsibility for maintaining OSHA logs when responsibility fell to someone other than the interviewed participant. Analyses of three remaining aspects of compliance with OSHA injury recordkeeping requirements (case criteria, timing of recording, and method for counting days of missed work) were limited to establishments where the study participant was involved, at least in part, in maintaining the establishment’s OSHA logs, electing to have participants speak on their own behalf and no one else’s (and minimize ‘don’t know’ responses). The percent of establishments where the study participant maintained the establishment’s OSHA logs ranged from 29% of establishments in New York to 48% of establishments in Oregon.
3.3.1.2 Case criteria used to determine eligibility for log The criteria used to determine which incidents would be recorded on the logs reflected a wide range of case definitions. Within each state, the OSHA recording criteria was the most frequently reported criteria used, although use of the OSHA case criteria ranged from 30% among log-maintaining Washington establishments to 58% among log-maintaining New York establishments. All cases requiring medical treatment was the second most common criteria used by establishments in Minnesota, Oregon, and Washington. In New York, recording all injuries regardless of severity was the most common criteria reported after the OSHA recording criteria. The practice of recording workers’ compensation claims7 was most common in Washington, where almost 10% of establishments with logs used workers’ compensation claim status as shorthand for OSHA eligibility.
Responses captured in the ‘Other’ category included: someone else decides, common sense, I just know, and we don’t have any injuries. Also captured were instances where the participant indicated multiple selections: all injuries and all claims. “Don’t know” responses captured in the narrative text field were identified via key word search and recoded as a separate category.
7 The questionnaire differentiated filed claims from accepted claims as possible options for cases recorded on OSHA logs or reported in SOII. While use of either case definition was rare, filed claims was the more prevalent of the two. Ultimately, filed and accepted were grouped into a single claims category for analysis.

Results: OSHA compliant recordkeeping practices
14
3.3.1.3 Timing of case recording Among establishments where OSHA logs were maintained by the study participant, compliance with the timing of recording cases was high, with more than three-quarters of Minnesota, New York and Oregon establishments recording cases on the log within the required seven-day period, and almost 60% of Washington establishments doing so. In Oregon and Washington, over 10% of log-maintaining establishments waited until the end of the year to record cases on the log.
Responses captured in the ‘Other’ category included: as soon as possible, depends on my workload, as the case becomes recordable, once information from doctor has been received, and when employee returns to work. Several participants indicated they recorded cases at some time interval other than the existing categories; responses that indicated cases were recorded every few months, quarterly, or a few times a year were identified though a key word search and grouped with the [relatively few responses] indicating monthly recording.
3.3.1.4 Counting days of missed work Less than half of all establishments with OSHA logs maintained by the study participant followed the OSHA recording rule for counting days of missed work, although percentages differed by state. Compliance was lowest in Oregon and Washington, where roughly thirty percent of log-maintaining establishments followed the OSHA requirement to count calendar days, while less than 40% of Minnesota establishments, and less than 60% of New York establishments counted calendar days.
To summarize, across the three aspects of OSHA recordkeeping (case criteria, timing of recording, and method for counting days of missed work), compliance was greatest among New York establishments with logs, and among the lowest in Washington establishments with logs (Oregon establishments were equally noncompliant in counting days of missed work). (See Appendix for tabulations based on estimated number of workers.)

Results: OSHA compliant recordkeeping practices
15
Table 5. Workplace injury and illness recordkeeping practices by state.
MN NY OR WA Total p-value Study establishments 581 690 1368 701 3340 Estimated establishments 179,391 342,596 216,152 131,395 869,533 Logs maintained for the establishment Logs maintained, at least in part, by survey participanta 45.2 (5.1) 29.0 (4.9) 48.5 (3.5) 37.6 (4.5) 38.5 (2.6) <0.0001 Logs maintained by othersa 1.6 (0.8) 1.7 (0.6) 1.5 (0.4) 7.6 (2.5) 2.5 (0.5) No logs maintained for establishment 49.6 (5.2) 37.2 (6.0) 40.8 (3.6) 43.4 (5.5) 41.6 (2.8) Unknown if logs maintained 3.6 (1.4) 32.0 (6.4) 9.3 (2.1) 11.5 (2.9) 17.4 (2.9)
Among establishments with logs maintained, at least in part, by survey participant MN NY OR WA Total p-value Study establishments 473 490 1087 539 2589 Estimated establishments 81,111 99,422 104,766 49,376 334,675 Criteria used to determine eligibility for log OSHA criteriaa 38.1 (6.7) 58.1 (9.1) 50.5 (4.9) 29.8 (5) 46.7 (3.5) <0.0001 Medical treatment 30.9 (6.4) 4.5 (1.7) 20.9 (4.4) 22.3 (4.0) 18.7 (2.5) All injuries (regardless of severity) 15.1 (3.6) 30.3 (9.8) 15.5 (3.4) 17.9 (5.4) 20.2 (3.5) Claims 2.6 (1.1) 1.6 (0.7) 5.7 (2.0) 9.8 (2.3) 4.4 (0.8) DK/Other 13.2 (3.6) 5.5 (2.5) 7.3 (2.3) 20.2 (6.5) 10.1 (1.7) When cases are recorded on log Weeka 79.2 (3.8) 85.0 (3.7) 77.6 (4.4) 59.4 (6.1) 77.5 (2.4) <0.0001 Monthly or Quarterly 7.4 (2.0) 2.3 (0.9) 5.4 (1.3) 6.7 (1.7) 5.2 (0.7) End of year 6.2 (1.9) 3.9 (1.3) 11.5 (4.3) 10.3 (2.4) 7.8 (1.6) Upon receipt of WC claim documentation 0.5 (0.4) 0.4 (0.2) 1.1 (0.4) 0.5 (0.2) 0.7 (0.2) DK/Other 6.7 (2.1) 8.4 (3.0) 4.5 (1.7) 23.1 (6.4) 8.9 (1.6) How days are counted Calendar daysa 39.7 (6.0) 58.0 (7.9) 28.6 (4.1) 31.1 (5.6) 40.4 (3.7) 0.0004 Scheduled work days or shifts 51 (6.6) 37.5 (7.4) 60.4 (4.7) 48.3 (6.1) 49.5 (3.6) DK/Other 9.3 (2.8) 4.4 (2.2) 11.0 (3.0) 20.6 (6.4) 10.1 (1.7)
Note: Data shown are % of estimated establishments (SE) unless otherwise noted. aOSHA-compliant practice.

Results: OSHA compliant recordkeeping practices
16
3.3.1.5 Injuries among temporary workers obtained through a staffing agency An estimated 13% of establishments across all four states supervised temporary workers hired through a staffing agency (table 6). Nearly all establishments that obtained temporary workers through a staffing agency also supervised their day-to-day activities.
Most establishments that supervised temporary help workers would fail to record temporary worker injuries on an OSHA log. Among establishments that supervise temp help workers, the percent that would include temp help injuries on their OSHA log, as required to do so by the recordkeeping regulation, ranged from 17% of Minnesota establishments to 39% of New York establishments (table 6). Temp help injuries would fail to be documented by the host establishment for at least two reasons: the host establishment would omit temp help injuries from the host establishment’s log (9-51% of establishments that supervise temp help workers, by state), or the host establishment did not maintain an OSHA log (15-35% of establishments that supervise temp help workers, by state).
Among establishments that supervised temporary help workers and had a participant who completed SOII, less than half stated that they would include temporary worker injuries in their SOII data (table 6).

Results: OSHA compliant recordkeeping practices
17
Table 6. Reliance on temporary workers obtained through a staffing agency and reporting injuries among such workers by state. All establishments MN NY OR WA Total p-value Study establishments 581 690 1368 701 3340 Estimated establishments 179,391 342,596 216,152 131,395 869,533 Use and supervise temporary workers 12.9 (2.9) 12.0 (3.0) 16.9 (2.8) 10.6 (2.2) 13.2 (1.5) 0.0002 Use but do not supervise temporary workers 3.7 (3.4) ̶ 0.5 (0.3) 0.3 (0.2) 1.0 (0.7) Do not use temporary workers 81.5 (4.3) 83.5 (3.8) 81.8 (2.9) 88.6 (2.2) 83.4 (1.9) DK if temps used or supervised 1.8 (1.2) 4.4 (2.4) 0.8 (0.5) 0.5 (0.2) 2.4 (1.0)
Among establishments that supervise temporary workers MN NY OR WA Total Study establishments 144 191 486 190 1011 Estimated establishments 23,205 41,132 36,566 13,922 114,825 Records temporary worker injuries on OSHA log 16.5 (4.0) 39.3 (13.0) 24.4 (6.3) 21.4 (6.4) 27.8 (5.5) 0.0292 Omits temporary worker injuries from OSHA log 22.9 (5.5) 9.2 (2.9) 31.1 (9.6) 51.1 (9.9) 24.0 (4.7) Maintains logs, DK whether to record temp injuries 33.3 (14.5) 16.8 (5.1) 13.5 (5.2) 12.6 (7.4) 18.6 (4.0) No logs maintained for establishment 27.3 (14.4) 34.8 (14.2) 31.0 (6.3) 14.9 (5.6) 29.6 (6.5)
Among establishments that supervise temporary workers and where the study participant completed SOII MN NY OR WA Total Study establishments 113 149 249 151 662 Estimated establishments 15,537 28,850 16,776 8,932 70,095 Reports temporary worker injuries in SOII 23.5 (8.2) 43.5 (16.1) 26.8 (9.8) 25.0 (6.5) 32.7 (7.6) 0.648 Omits temporary worker injuries from SOII 40.8 (11.4) 31.4 (15.5) 56.8 (13.4) 51.5 (9.8) 42.1 (8.1) DK 35.8 (15.8) 25.0 (14.0) 16.4 (8.0) 23.6 (10.6) 25.2 (7.4)
Note: Data shown are % of estimated establishments (SE) unless otherwise noted. ̶ Data do not meet publication guidelines.

Results: OSHA compliant recordkeeping practices
18
3.3.2 Characteristics associated with noncompliant recording practices 3.3.2.1 Characteristics associated with OSHA injury and illness 300 logs Based on establishment-weighted unadjusted logistic regression models that estimated the relationship between a single establishment characteristic and whether or not OSHA logs were maintained at the establishment (maintained by anyone vs. no logs + don’t know), all characteristics assessed individually were found to be associated with failing to keep OSHA logs (table 7). Establishment size was among the strongest predictors of the absence of logs: establishments with 10 employees or fewer were almost twenty-three times more likely to fail to maintain logs compared to establishments with 250 or more employees, and establishments with 11-49 employees were six times more likely than the largest employers to not keep logs. There was no difference in logs between the two largest establishment size groups.
In an adjusted logistic regression model that controlled for establishment and record-keeper characteristics, the smallest establishments were still less likely to maintain logs, but the effect was muted compared to the unadjusted estimate (OR=3.87, 95% CI: 1.57–9.53). Also significantly associated with failure to maintain OSHA logs based on the adjusted regression model were: establishments in the leisure and hospitality industry, establishments with private or state-funded workers’ compensation insurance, employers operating a single worksite, first time SOII respondents, and establishments that reported zero work-related injuries or illnesses in SOII. An interaction between state and recordkeeping exemption status was observed: among the establishments required to maintain logs each year regardless of participation in SOII, New York establishments were less likely to maintain logs compared with any of the three other states; among the establishments usually exempt from recordkeeping, New York establishments were more likely to lack logs, but only in comparison to Oregon establishments.
Note that OSHA recordkeeping training, years of recordkeeping experience, and use of OSHA injury and illness data as a performance measure were not included in the regression models as these characteristics appeared almost exclusively among establishments with logs and were almost entirely absent from establishments that maintained no logs.

Results: OSHA compliant recordkeeping practices
19
Table 7. Unadjusted and adjusted odds ratio for no logs maintained for establishment (by study participant or others), four states combined (n=3340).
Unadjusted
Odds Ratio (95% CI) Adjusted
Odds Ratio (95% CI) State (vs MN) NY 1.98 (1.07 - 3.66) state*exempt OR 0.88 (0.55 - 1.41) WA 1.07 (0.62 - 1.82) Establishment size (vs. 250+ workers) 1-10 workers 22.93 (14.21 - 37.01) 3.87 (1.57 - 9.53) 11-49 workers 6.96 (4.42 - 10.94) 1.38 (0.64 - 2.96) 50-249 workers 1.42 (0.89 - 2.27) 0.40 (0.19 - 0.83) Industry (vs Manufacturing) Construction + Agriculture, Forestry, Fishing and Hunting 1.60 (0.75 - 3.41) 1.09 (0.43 - 2.77) Wholesale Trade + Transportation, Warehousing + Utilities 1.08 (0.48 - 2.44) 1.18 (0.46 - 3.02) Retail Trade 2.28 (0.98 - 5.28) 1.86 (0.69 - 4.98) State and Local Government 0.35 (0.15 - 0.80) 0.88 (0.28 - 2.82) Admin, Support, Waste Mgmt, Remediation + Other Svc 2.42 (0.92 - 6.40) 1.00 (0.34 - 2.94) Education + Health Care, Social Assistance 1.86 (0.83 - 4.19) 0.63 (0.19 - 2.05) Leisure and Hospitality 3.05 (1.47 - 6.34) 3.06 (1.04 - 8.99) Information, Financial, Real Estate, Professional, Mgmt Svc 5.70 (2.64 - 12.32) 2.14 (0.72 - 6.35) Union presence No vs Yes 4.25 (1.62 - 11.13) 1.46 (0.52 - 4.12) Workers' compensation insurer Private + State Funded vs. Self-insured 4.24 (1.83 - 9.79) 4.94 (2.29 - 10.7) Number of worksites operated by employer Single worksite vs multiple sites 4.30 (2.83 - 6.52) 3.27 (2.03 - 5.28) SOII experience (vs Repeat Respondent) First time SOII respondent 2.90 (1.47 - 5.72) 2.49 (1.32 - 4.70) Did not complete SOII/DK/Oth 6.59 (3.45 - 12.57) 5.47 (2.90 - 10.35) Injury and illness rate (total OSHA recordable cases) 0 vs 1+ 10.29 (6.38 - 16.60) 3.70 (1.71 – 8.00) Usually exempt from OSHA recording requirements N vs Y 0.38 (0.24 - 0.59) state*exempt State*usually exempt interaction MN required vs usually exempt 0.43 (0.14 - 1.31) NY required vs usually exempt 0.45 (0.20 - 1.02) OR required vs usually exempt 0.36 (0.17 - 0.77) WA required vs usually exempt 0.11 (0.03 - 0.38)
Annual records required, NY vs MN 2.70 (1.06 - 6.88) Annual records required, NY vs OR 5.56 (2.67 - 11.58) Annual records required, NY vs WA 6.34 (2.86 - 14.10) Annual records required, OR vs MN 0.49 (0.22 - 1.10) Annual records required, OR vs WA 1.14 (0.57 - 2.27) Annual records required, WA vs MN 0.43 (0.18 - 1.03)
Usually exempt, NY vs MN 2.57 (0.96 - 6.86) Usually exempt, NY vs OR 4.47 (1.83 - 10.92) Usually exempt, NY vs WA 1.49 (0.40 - 5.57) Usually exempt, OR vs MN 0.58 (0.23 - 1.45) Usually exempt, OR vs WA 0.33 (0.09 - 1.24) Usually exempt, WA vs MN 1.72 (0.44 - 6.72)
Note: Adjusted for all variables in table. CI=Confidence interval. Bold font indicates significant at p<0.05.

Results: OSHA compliant recordkeeping practices
20
3.3.2.2 Characteristics associated with OSHA log case criteria Table 8 presents the adjusted odds ratios for three aspects of non-compliant OSHA recordkeeping practices (case criteria, timing of record, methods of counting days of missed work) among establishments where logs were maintained by the study participant.
Among establishments where the study participant was involved in maintaining OSHA logs, the adjusted logistic regression model suggested that the characteristic most strongly associated with noncompliant case eligibility criteria was not including OSHA injury and illness data in competitive bids for contract work (i.e., controlling for establishment and record-keeper characteristics, establishments that disclosed OSHA injury and illness data in bid packages were almost four times more likely to use the OSHA case criteria than non-bidding establishments). SOII experience was also associated: the odds of using a noncompliant case criteria were 2.3 times greater among first time SOII respondents compared with repeat SOII respondents (95% CI: 1.27 – 4.19), controlling for establishment and record-keeper characteristics. By industry, Wholesale Trade + Transportation, Warehousing + Utilities were most likely to use the OSHA case criteria. An interaction between state and OSHA training was observed (Table 8-A): among untrained record-keepers, New York establishments were least likely to use the OSHA criteria, while there was no difference among the untrained record-keepers across Minnesota, Oregon, and Washington. Among trained record-keepers, New York establishments were most likely to use the OSHA case criteria and again, there was little difference between the trained record-keepers in Minnesota, Oregon, and Washington.
3.3.2.3 Characteristics associated with timing of case recording Among establishments with logs maintained by the study participant, after controlling for establishment characteristics, Washington establishments were more likely to be noncompliant with the seven-day recording requirement (compared with Minnesota establishments). Establishments in Construction + Agriculture, Forestry Fishing, and Hunting were also more likely to be noncompliant (compared with Manufacturing establishments), as were establishments with record-keepers with less than 1 year of OSHA recordkeeping experience. Controlling for establishment and record-keepers characteristics, establishments with 1-10 employees were more likely to record in the required time frame compared to establishments with 250 or more employees.
3.3.2.4 Characteristics associated with counting days of missed work Based on the adjusted regression model limited to establishments where the study participant was involved in maintaining OSHA logs, characteristics associated with noncompliant counting practices included: medium-sized establishments (11-249 employees), non-unionized workforce, establishments with private or state-funded workers’ compensation, employers that operate a single worksite, untrained injury record-keepers, and one year or less recordkeeping experience. Controlling for establishment and record-keeper characteristics, no differences by state were observed for compliance with counting days of missed work.

Results: OSHA compliant recordkeeping practices
21
Table 8. Adjusted odds ratio for noncompliant OSHA recordkeeping practices among establishments where OSHA logs maintained by the study participant, four states combined (n=2589).
Noncompliant: Case criteria Timing of recording Counting days
Adjusted OR (95%
CI) Adjusted OR (95%
CI) Adjusted OR (95%
CI) State (vs MN) NY State*trained 0.59 (0.31 - 1.12) 0.66 (0.34 - 1.30) OR See table 8-A 1.16 (0.61 - 2.21) 1.93 (0.99 - 3.76) WA 2.62 (1.38 - 5.00) 1.15 (0.50 - 2.63) Establishment size (vs. 250+ workers) 1-10 workers 1.08 (0.55 - 2.10) 0.42 (0.22 - 0.77) 1.36 (0.66 - 2.81) 11-49 workers 1.64 (0.96 - 2.79) 0.74 (0.44 - 1.24) 1.78 (1.04 - 3.06) 50-249 workers 1.15 (0.74 - 1.79) 0.99 (0.65 - 1.51) 2.72 (1.59 - 4.65) Industry (vs Manufacturing) Construction + Agriculture, Forestry, Fishing and Hunting 0.85 (0.35 - 2.07) 2.94 (1.24 - 6.99) 0.85 (0.32 - 2.27) Wholesale Trade + Transportation, Warehousing + Utilities 0.36 (0.16 - 0.81) 2.09 (0.88 - 4.95) 0.90 (0.35 - 2.30) Retail Trade 1.33 (0.52 - 3.38) 1.02 (0.36 - 2.88) 0.65 (0.24 - 1.73) Information, Financial, Real Estate, Professional, Mgmt Svc 0.46 (0.17 - 1.23) 1.84 (0.68 - 4.94) 2.96 (0.99 - 8.92) Admin, Support, Waste Mgmt, Remediation + Other Svc 2.05 (0.60 - 6.98) 1.66 (0.58 - 4.70) 0.80 (0.27 - 2.34) Education + Health Care, Social Assistance 0.46 (0.19 - 1.09) 1.65 (0.62 - 4.40) 1.10 (0.40 - 3.02) Leisure and Hospitality 1.03 (0.39 - 2.71) 1.87 (0.72 - 4.85) 2.15 (0.71 - 6.55) State and Local Government 0.52 (0.22 - 1.23) 1.87 (0.73 - 4.78) 2.11 (0.78 - 5.73) Union presence No vs Yes 1.21 (0.64 - 2.28) 1.00 (0.52 - 1.93) 2.42 (1.16 - 5.04) Workers' compensation insurer Private + State Funded vs. Self-insured 0.92 (0.52 - 1.62) 1.32 (0.74 - 2.34) 2.06 (1.11 - 3.84) Number of worksites operated by employer Single worksite vs multiple sites 1.24 (0.68 - 2.25) 0.67 (0.41 - 1.11) 5.09 (2.73 - 9.49) SOII experience (vs Repeat Respondent) First time SOII respondent 2.30 (1.27 - 4.19) 0.86 (0.42 - 1.75) 1.30 (0.69 - 2.45) Did not complete SOII/DK/Other 1.79 (1.00 - 3.20) 0.57 (0.28 - 1.14) 0.93 (0.48 - 1.82) Injury and illness rate (total OSHA recordable cases) 0 vs 1+ 1.09 (0.62 - 1.93) 1.11 (0.67 - 1.83) 1.64 (0.94 - 2.87) Usually exempt from OSHA recording requirements N vs Y 0.68 (0.35 - 1.31) 0.87 (0.46 - 1.66) 1.36 (0.64 - 2.91) Trained on OSHA recording No vs Yes See table 8-A 1.38 (0.85 - 2.24) 2.07 (1.24 - 3.43) OSHA experience (vs 2-9 years) ≤1 year 1.00 (0.43 - 2.33) 2.61 (1.11 - 6.15) 11.04 (3.44 - 35.5) 10+ years 1.22 (0.74 - 2.01) 1.08 (0.65 - 1.80) 0.80 (0.49 - 1.32) DK 0.26 (0.06 - 1.13) 0.93 (0.14 - 6.25) 0.35 (0.06 - 1.88) Use of OSHA injury and illness data Competitive bids for contract work N vs Y 3.89 (1.83 - 8.26) 1.4 (0.62 - 3.13) 1.05 (0.48 - 2.32) Job performance eval of supervisors N vs Y 0.77 (0.35 - 1.72) 1.89 (0.79 - 4.51) 1.22 (0.55 - 2.69) Job performance eval of record-keeper N vs Y 0.66 (0.29 - 1.51) 0.76 (0.24 - 2.42) 0.77 (0.30 - 2.02) Worker performance in safety incentive programs N vs Y 0.56 (0.19 - 1.69) 1.48 (0.58 - 3.75) 0.61 (0.21 - 1.74)
Note: Adjusted for all variables in the table. Separate multivariable regression model estimated for each aspect of recordkeeping. CI=Confidence Interval. Noncompliance was defined for case criteria, timing of recording, and counting days as, respectively: use of some criteria other than the OSHA criteria when determining eligibility for OSHA log, waiting >7 days after injury to record cases on log, and limiting counts of missed work to days of scheduled work. “Don’t know” responses were included as non-compliant. Bold font indicates significant at p<0.05.

Results: OSHA compliant recordkeeping practices
22
Table 8-A. Adjusted odds ratio for state*trained interaction term for use of noncompliant case definition among establishments where OSHA logs maintained by the study participant, four states combined (n=2589).
Noncompliant Case criteria
Adjusted OR (95% CI) State*OSHA trained interaction NY Trained N vs Y 18.48 (6.27 - 54.46) OR Trained N vs Y 1.00 (0.40 - 2.48) WA Trained N vs Y 2.32 (1.01 - 5.32) MN Trained N vs Y 3.77 (1.32 - 10.77)
Untrained NY vs OR 2.75 (1.16 - 6.51) Untrained NY vs WA 0.63 (0.26 - 1.56) Untrained NY vs MN 0.73 (0.3 - 1.81) Untrained OR vs WA 0.23 (0.11 - 0.48) Untrained OR vs MN 0.27 (0.13 - 0.56) Untrained WA vs MN 1.16 (0.51 - 2.66)
Trained NY vs OR 0.15 (0.05 - 0.47) Trained NY vs WA 0.08 (0.03 - 0.22) Trained NY vs MN 0.15 (0.05 - 0.48) Trained OR vs WA 0.53 (0.20 - 1.42) Trained OR vs MN 1.01 (0.32 - 3.18) Trained WA vs MN 1.89 (0.61 - 5.79)
Note: Adjusted for all variables in table 8. CI=Confidence Interval. Noncompliance was defined for case criteria as use of some criteria other than the OSHA criteria when determining eligibility for OSHA log. “Don’t know” responses were included as non-compliant. Bold font indicates significant at p<0.05.

Results: OSHA compliant recordkeeping practices
23
3.3.2.5 Characteristics associated with recording injuries among temporary workers obtained through a staffing agency
There were similar establishment characteristics associated with recording temporary help worker injuries on the OSHA log and reporting them in SOII. Compared to Minnesota, New York was less likely to omit temporary worker injuries from the establishment OSHA log and SOII data (i.e., New York was more likely to record temporary worker injuries in both data sources) (table 9). There were no differences in recording temp worker injuries between Minnesota, Oregon, and Washington. Two industry groups, (1) Wholesale Trade + Transportation and Warehousing + Utilities and (2) Information and Professional Services were more likely to record temp worker injuries on the OSHA log and SOII than the reference group Education + Health Care and Social Assistance. Nonunionized establishments and record-keepers with no formal OSHA recordkeeping training were more likely to omit temporary worker injuries from the OSHA log and from reported SOII data.
Additional characteristics associated with failing to include temporary help worker characteristics in SOII data include: single worksite employers; a total recordable injury and illness case rate of zero; and using OSHA data in the job performance evaluation of supervisors.

Results: OSHA compliant recordkeeping practices
24
Table 9. Adjusted odds ratio (95% CI) for omitting temporary worker injuries from host establishment’s injury and illness reports, among establishments where temporary workers were obtained through a staffing agency and supervised by the host establishment.
Omits temp help worker injuries from OSHA
loga Omits temp help worker injuries from SOII data
Study establishments 1011 662 Estimated establishments 114,825 70,095 State (vs MN) NY 0.22 (0.08 - 0.62) 0.25 (0.08 - 0.79) OR 0.86 (0.33 - 2.23) 1.10 (0.34 - 3.55) WA 0.71 (0.26 - 1.97) 0.81 (0.28 - 2.40) Establishment size (vs. 250+ workers) 1-10 workers 0.59 (0.16 - 2.14) 0.26 (0.06 - 1.19) 11-49 workers 1.34 (0.53 - 3.37) 1.03 (0.36 - 2.97) 50-249 workers 0.86 (0.34 - 2.17) 0.49 (0.18 - 1.35) Industry (vs. Manufacturing) Construction + Agriculture, Forestry, Fishing and Hunting 1.21 (0.30 - 4.92) 1.17 (0.21 - 6.36) Wholesale Trade + Transportation, Warehousing + Utilities 0.25 (0.08 - 0.82) 0.29 (0.06 - 1.34) Retail Trade 1.02 (0.22 - 4.62) 1.04 (0.24 - 4.59) Information, Financial, Real Estate, Professional, Mgmt Svc 0.33 (0.07 - 1.46) 0.19 (0.04 – 1.00) Admin, Support, Waste Mgmt, Remediation + Other Svc 0.55 (0.15 - 2.05) 1.61 (0.29 - 9.07) Education + Health Care, Social Assistance 2.26 (0.61 - 8.29) 2.21 (0.47 - 10.38) Leisure and Hospitality 0.10 (0.01 - 1.22) 0.93 (0.06 - 14.78) State and Local Government 2.33 (0.44 - 12.18) 11.95 (0.92 - 154.89) Union presence No vs Yes 4.93 (1.95 - 12.46) 8.52 (3.03 - 23.97) Workers' compensation insurer Private + State Funded vs. Self-insured 1.03 (0.43 - 2.50) 0.83 (0.26 - 2.64) Number of worksites operated by employer Single worksite vs multiple sites 1.22 (0.51 - 2.93) 4.67 (1.54 - 14.12) Trained on OSHA recording No vs Yes 5.62 (2.63 - 12.03) 5.47 (2.06 - 14.53) SOII experience (vs Repeat Respondent) First time SOII respondent 0.93 (0.35 - 2.47) 0.41 (0.15 - 1.11) Did not complete SOII/DK/Other 0.82 (0.30 - 2.23) 6.41 (2.62 - 15.67) Injury and illness rate (total OSHA recordable cases) 0 vs 1+ 2.24 (0.86 - 5.79) 3.73 (1.25 - 11.2) Use of OSHA data In competitive bids for contract work N vs Y 1.34 (0.44 - 4.07) 0.52 (0.15 - 1.83) In job performance eval of supervisors N vs Y 1.98 (0.62 - 6.36) 6.28 (1.66 - 23.78) In job performance eval of record-keeper N vs Y 4.03 (1.23 - 13.18) 0.28 (0.06 - 1.28) In worker safety incentive programs N vs Y 0.71 (0.22 - 2.27) 1.08 (0.28 - 4.12) Usually exempt from OSHA recording requirements N vs Y 0.67 (0.23 - 1.93) 0.52 (0.15 - 1.77) OSHA experience (vs 2-9 years) ≤1 year 4.90 (1.13 - 21.26) 1.41 (0.36 - 5.58) 10+ years 1.43 (0.65 - 3.14) 1.33 (0.58 - 3.04) DK 0.74 (0.09 - 6.26) >9999999999
Note: Adjusted for all variables in the table. CI=Confidence interval. aOmitted because temp worker injuries not recorded or because host establishment does not maintain OSHA logs. Bold font indicates significant at p<0.05.

Results: Sources of workplace injury and illness data
25
3.4 Sources of workplace injury and illness data 3.4.1 Estimates of data source use by state 3.4.1.1 Source of OSHA 300 log information When asked where they got the information needed to complete an OSHA 300 log entry, most study participants involved in maintaining OSHA logs said they used internal company reports completed by the employee and/or supervisor (from 58% of Minnesota establishments to 88% of Oregon establishments). Use of workers’ compensation claim information varied by state, from less than one in five log-maintaining establishments in Oregon to over half the log-maintaining establishments in Minnesota (table 10). Minnesota also saw the largest percent of establishments that relied exclusively on workers’ compensation claims data (16% of establishments used only workers’ compensation data and no other sources of information). Responses captured in the ‘other’ field included: speaking with employees (vs. written reports); payroll data; and other internal company computer-based programs, data systems, and software. (See Appendix for tabulations based on estimated number of workers.)
Table 10. Source of OSHA log information by state among establishments with logs maintained by the study participant.
MN NY OR WA Total p-value Study establishments 473 490 1,087 539 2,589 Estimated establishments 81,111 99,422 104,766 49,376 334,675 Company report completed by employee/supervisor 57.5 (6.7) 58.8 (9.5) 88.0 (2.6) 71.8 (6.0) 69.5 (3.8) 0.0002 Workers’ Compensation (WC) data 54.7 (6.5) 30.3 (10.4) 17.9 (2.9) 32.3 (4.9) 32.6 (3.7) 0.0014
WC only 15.6 (4.6) 8.1 (2.9) 7.2 (2.1) 8.3 (2.3) 9.6 (1.6) WC+non-WC 39.2 (6.4) 22.2 (11.1) 10.8 (2.0) 24.0 (4.2) 23 (3.8)
Doctor's report 16.2 (3.9) 4.4 (1.4) 11.8 (3.2) 18.2 (3.4) 11.6 (1.6) 0.0033 Other 23.3 (6.9) 31.4 (10.2) 5.4 (2.1) 2.9 (0.9) 17.1 (4.0) <0.0001
Note: Data presented are percent of establishments within state (SE), unless otherwise noted. Percentages do not add to 100 as the categories are not mutually exclusive.

Results: Sources of workplace injury and illness data
26
3.4.1.2 Source of SOII data When asked where they got the information needed for the BLS survey, responses also varied by state. Among participants who completed SOII, use of OSHA data for SOII ranged from 22% of New York establishments to 45% of Oregon establishments (table 11). Use of workers’ compensation claims data in the absence of OSHA data ranged from 10% of Minnesota and Oregon establishments to 19% of New York establishments. There were larger differences across states in the percent of establishments using only internal data for SOII (e.g., information collected from the worker, supervisor, HR), from 6% of Oregon establishments to 55% of New York establishments. In 5% of New York establishments to more than 35% of Minnesota, Oregon, and Washington establishments, study participants replied that they did not know what data source they used, they had no injuries and therefore used no data source, or used some source other than internal, OSHA, or workers’ compensation claims data. These other sources included responses such as “from memory”, or indicated that someone else compiled the data – either a coworker or consultant, working onsite or offsite.
Stratified by total recordable cases reported in SOII, use of OSHA data to complete SOII was greater among establishments that reported one or more recordable cases than among establishments reporting zero cases (table 11). Use of workers’ compensation claims data for SOII was similar for establishments that reported cases and those that did not.

Results: Sources of workplace injury and illness data
27
Table 11. Source of SOII data by state among study participants who completed SOII. Among establishments where the participant completed SOII
MN NY OR WA Total p-value Study establishments 422 505 742 527 2196 Estimated establishments 108,696 153,640 119,533 88,209 470,078 OSHA dataa 34.9 (4.8) 21.9 (4.1) 44.8 (5.0) 25.4 (4.1) 31.4 (2.5) <0.0001 WC data instead of OSHA data 9.7 (2.8) 18.8 (6.5) 10.4 (2.6) 15.7 (3.9) 14.0 (2.5)
Internal data only 19.8 (5.2) 54.5 (7.5) 6.1 (2.1) 23.5 (6.2) 28.3 (3.6)
No injuries, DK, Other sources 35.6 (6.9) 4.9 (3.4) 38.7 (5.0) 35.4 (6.8) 26.3 (3)
Among establishments that reported 1 or more cases in SOII
MN NY OR WA Total p-value
Study establishments 276 332 472 356 1436
Estimated establishments 27,483 41,102 24,213 20,941 113,738
OSHA dataa 62.5 (8.6) 29.8 (10.8) 82.6 (4.5) 48.5 (8.8) 52.4 (7.2) <0.0001 WC data instead of OSHA 9.7 (3.4) 19.7 (13.5) 12.1 (4.2) 16.5 (5.1) 15.1 (5.1)
Internal data only 14.8 (4.6) 47.7 (17.7) 4.2 (1.4) 16.0 (8.3) 24.7 (8.8)
No injuries, DK, Other source
12.9 (10.1) 2.9 (1.8) 1.2 (0.7) 19.0 (10.2) 7.9 (3.5)
Among establishments that reported 0 cases in SOII
MN NY OR WA Total p-value
Study establishments 146 173 270 171 760
Estimated establishments 81,213 112,538 95,320 67,269 356,340
OSHA dataa 25.5 (5.1) 19.0 (4.3) 35.2 (5.9) 18.2 (4.4) 24.7 (2.7) <0.0001 WC data instead of OSHA 9.7 (3.6) 18.5 (7.5) 9.9 (3.0) 15.4 (4.9) 13.6 (2.9)
Internal data only 21.5 (6.8) 56.9 (8.3) 6.6 (2.6) 25.8 (7.7) 29.5 (4.0)
No injuries, DK, Other source
43.3 (8.4) 5.6 (4.6) 48.3 (6.0) 40.5 (8.2) 32.2 (3.7)
Note: Data presented are percent of establishments within state (SE), unless otherwise noted. aIncludes establishments that use workers’ compensation claims data to complete the OSHA data.

Results: Sources of workplace injury and illness data
28
3.4.2 Characteristics associated with use of workers’ compensation data for OSHA and SOII 3.4.2.1 Characteristics associated with source of OSHA 300 log information Based on the adjusted regression model limited to establishments where the study participant was involved in maintaining OSHA logs, characteristics associated with use of workers’ compensation claims for completion of OSHA 300 log entries included: state; industry; number of worksites; SOII experience; and total recordable OSHA injury and illness rate (table 12). Minnesota establishments were more likely to report using workers’ compensation for OSHA logs than the other three states. Compared to Manufacturing, odds of using workers’ compensation claims data for OSHA logs was greatest among Retail Trade (OR=6.90). The odds of using workers’ compensation were more than three times the odds among Manufacturing for: Information, Financial, Real Estate, Professional, and Management Services; Construction and Agriculture, Forestry, Fishing and Hunting; and Leisure and Hospitality. Education and Health Care and State and Local Government were also more likely to use workers’ compensation claims data for OSHA logs than Manufacturing. Single site employers were less likely to use workers’ compensation data than multi-site employers, as were establishments with an OSHA recordable injury and illness rate of zero. First time SOII respondents were more than twice as likely to use workers’ compensation data for OSHA logs as repeat SOII respondents.

Results: Sources of workplace injury and illness data
29
Table 12. Adjusted odds ratios for use of workers’ compensation claims data in completing OSHA log entries, among establishments where OSHA logs maintained by the study participant, four states combined (n=2589).
Adjusted OR (95% CI) State (vs MN) NY 0.23 (0.11 - 0.48)* OR 0.16 (0.08 - 0.30)* WA 0.36 (0.18 - 0.69)* Establishment size (vs. 250+ workers) 1-10 workers 1.87 (0.81 - 4.31) 11-49 workers 1.49 (0.85 - 2.61) 50-249 workers 1.28 (0.77 - 2.11) Industry (vs Manufacturing) Construction + Agriculture, Forestry, Fishing and Hunting 3.28 (1.23 - 8.73)* Wholesale Trade + Transportation, Warehousing + Utilities 1.79 (0.68 - 4.71) Retail Trade 6.90 (2.56 - 18.58)* Admin, Support, Waste Mgmt, Remediation + Other Svc 3.02 (0.97 - 9.39) Education + Health Care, Social Assistance 2.54 (1.04 - 6.22)* Leisure and Hospitality 3.03 (1.00 - 9.16)* Information, Financial, Real Estate, Professional, Mgmt Svc 3.85 (1.38 - 10.76)* State and Local Government 2.85 (1.09 - 7.48)* Union presence No vs Yes 0.78 (0.43 - 1.40) Workers' compensation insurer Private + State Funded vs. Self-insured 0.96 (0.47 - 1.97) Number of worksites operated by employer Single worksite vs multiple sites 0.41 (0.22 - 0.75)* Trained on OSHA recording No vs Yes 1.28 (0.73 - 2.26) OSHA experience (vs 2-9 years) ≤1 year 0.51 (0.20 - 1.34) 10+ years 1.04 (0.63 - 1.72) DK 0.07 (0.02 - 0.29)* SOII experience (vs Repeat Respondent) First time SOII respondent 2.13 (1.19 - 3.84)* Did not complete SOII/DK/Other 1.62 (0.90 - 2.91) Injury and illness rate (total OSHA recordable cases) 0 vs 1+ 0.28 (0.15 - 0.55)* Usually exempt from OSHA recording requirements N vs Y 0.99 (0.54 - 1.81) Use of OSHA injury and illness data Competitive bids for contract work N vs Y 0.49 (0.23 - 1.02) Job performance eval of supervisors N vs Y 1.18 (0.56 - 2.49) Job performance eval of record-keeper N vs Y 0.68 (0.28 - 1.64) Worker performance in safety incentive programs N vs Y 0.68 (0.24 - 1.92)
Note: Adjusted for all variables in the table. CI=Confidence interval. *Significant at p<0.05.
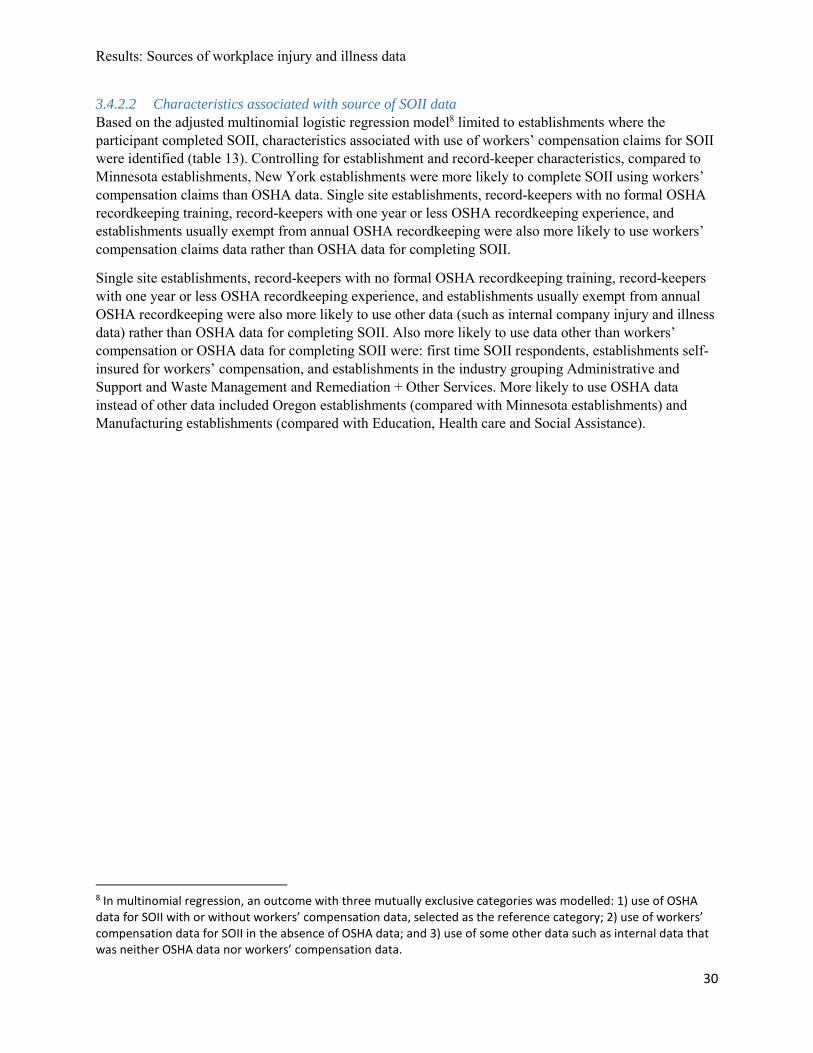
Results: Sources of workplace injury and illness data
30
3.4.2.2 Characteristics associated with source of SOII data Based on the adjusted multinomial logistic regression model8 limited to establishments where the participant completed SOII, characteristics associated with use of workers’ compensation claims for SOII were identified (table 13). Controlling for establishment and record-keeper characteristics, compared to Minnesota establishments, New York establishments were more likely to complete SOII using workers’ compensation claims than OSHA data. Single site establishments, record-keepers with no formal OSHA recordkeeping training, record-keepers with one year or less OSHA recordkeeping experience, and establishments usually exempt from annual OSHA recordkeeping were also more likely to use workers’ compensation claims data rather than OSHA data for completing SOII.
Single site establishments, record-keepers with no formal OSHA recordkeeping training, record-keepers with one year or less OSHA recordkeeping experience, and establishments usually exempt from annual OSHA recordkeeping were also more likely to use other data (such as internal company injury and illness data) rather than OSHA data for completing SOII. Also more likely to use data other than workers’ compensation or OSHA data for completing SOII were: first time SOII respondents, establishments self-insured for workers’ compensation, and establishments in the industry grouping Administrative and Support and Waste Management and Remediation + Other Services. More likely to use OSHA data instead of other data included Oregon establishments (compared with Minnesota establishments) and Manufacturing establishments (compared with Education, Health care and Social Assistance).
8 In multinomial regression, an outcome with three mutually exclusive categories was modelled: 1) use of OSHA data for SOII with or without workers’ compensation data, selected as the reference category; 2) use of workers’ compensation data for SOII in the absence of OSHA data; and 3) use of some other data such as internal data that was neither OSHA data nor workers’ compensation data.

Results: Sources of workplace injury and illness data
31
Table 13. Adjusted odds ratios for use of data other than OSHA for completing SOII, multinomial logistic regression, among establishments where study participant completed SOII (n=2196).
Use of WC without OSHA data for SOII
Adjusted OR (95% CI)
Use of other without OSHA data for SOII
Adjusted OR (95% CI) State (vs MN) NY 2.67 (1.02 - 6.95) 2.32 (0.95 - 5.62) OR 0.48 (0.19 - 1.19) 0.28 (0.13 - 0.61) WA 1.60 (0.60 - 4.27) 1.23 (0.60 - 2.49) Establishment size (vs. 250+ workers) 1-10 workers 1.68 (0.51 - 5.56) 2.49 (0.98 - 6.32) 11-49 workers 0.51 (0.19 - 1.34) 0.54 (0.22 - 1.33) 50-249 workers 1.11 (0.44 - 2.77) 0.58 (0.27 - 1.22) Industry (vs Education + Health Care, Social Assistance) Construction + Agriculture, Forestry, Fishing and Hunting 0.4 (0.08 - 1.92) 0.65 (0.17 - 2.52) Wholesale Trade + Transportation, Warehousing + Utilities 1.04 (0.21 - 5.12) 0.57 (0.18 - 1.86) Manufacturing 0.27 (0.05 - 1.52) 0.08 (0.01 - 0.72) Retail Trade 2.81 (0.7 - 11.23) 0.81 (0.24 - 2.73) State and Local Government 0.14 (0.03 - 0.67) 0.47 (0.12 - 1.80) Admin, Support, Waste Mgmt, Remediation + Other Svc 1.58 (0.34 - 7.44) 3.37 (1.13 – 10.00) Leisure and Hospitality 1.96 (0.53 - 7.32) 1.44 (0.52 – 4.00) Information, Financial, Real Estate, Professional, Mgmt Svc 0.45 (0.09 - 2.21) 0.98 (0.37 - 2.65) Union presence No vs Yes 0.34 (0.10 - 1.16) 1.95 (0.47 - 8.11) Workers' compensation insurer Private + State Funded vs. Self-insured 0.96 (0.43 - 2.17) 0.31 (0.13 - 0.70) Number of worksites operated by employer Single worksite vs multiple sites 2.25 (1.07 - 4.73) 2.18 (1.18 - 4.01) Trained on OSHA recording No vs Yes 2.80 (1.13 - 6.95) 3.18 (1.65 - 6.12) OSHA experience (vs 2-9 years) ≤1 year 12.02 (4.36 - 33.11) 18.71 (7.01 - 49.96) 10+ years 1.25 (0.58 - 2.70) 0.90 (0.48 - 1.71) DK 4.24 (0.88 - 20.44) 11.42 (3.29 - 39.67) SOII experience (vs Repeat Respondent) First time SOII respondent 0.81 (0.38 - 1.74) 2.35 (1.28 - 4.29) Did not complete SOII/DK/Other 0.81 (0.41 - 1.57) 8.87 (4.62 - 17.01) Injury and illness rate (total OSHA recordable cases) 0 vs 1+ 0.96 (0.38 - 2.44) 1.47 (0.74 - 2.90) Usually exempt from OSHA recording requirements N vs Y 0.30 (0.14 - 0.67) 0.51 (0.26 – 1.00) Use of OSHA injury and illness data in: Competitive bids for contract work N vs Y 1.02 (0.31 - 3.33) 1.80 (0.59 - 5.51) Job performance eval of supervisors N vs Y 0.42 (0.10 - 1.78) 0.45 (0.15 - 1.38) Job performance eval of record-keeper N vs Y 32.67 (5.20 - 205.42) 0.87 (0.26 - 2.93) Worker performance in safety incentive programs N vs Y 2.89 (0.52 - 15.99) 1.21 (0.41 - 3.54)
Note: Adjusted for all variables in the table. CI=Confidence interval. Bold font indicates significant at p<0.05.

Results: Knowledge of OSHA recordkeeping requirements
32
3.5 Knowledge of OSHA recordkeeping requirements Study participants were presented with five hypothetical work injury scenarios and asked what recordkeeping decisions they would make for each. All participants were asked to answer the scenarios, regardless of their OSHA recording responsibilities or their SOII experience. Establishments, rather than study participants, were selected as the level of analysis to align with the BLS SOII sampling unit and estimate the prevalence of recordkeeping misperceptions among the SOII establishment population.
3.5.1 Estimates of OSHA recordkeeping knowledge by state 3.5.1.1 Recordkeeping scenarios related to case criteria used to determine OSHA log eligibility Three scenarios regarding case criteria were asked: whether injuries resulting in stitches were recordable (they are); whether injuries resulting from horseplay were recordable (they are); and whether cases limited to X-rays confirming no broken bones are recorded (they should not be). Most participants correctly answered the scenarios regarding stitches and horseplay (70% and 68% of establishments, respectively). Conversely, most participants incorrectly answered the scenario about the omission of diagnostic X-rays (22% of establishments answered correctly). There were no significant differences by state (table 14).
3.5.1.2 Recordkeeping scenarios related to recording days of missed work Study participants were posed two recording scenarios regarding documenting case severity as related to days of missed work. One scenario involved updating the log to record days of missed work that did not occur until a week after the initial injury; the other scenario asked about recording missed work that was limited to a weekend when the employee was not scheduled to work. Most participants correctly answered that they would update the log to capture days of missed work that occurred sometime after the initial injury (68% of all establishments). Participants at 6% of establishments indicated they would add the case to the log as a new case (thus, double counting the injury), while <1% of establishments stated they would not update the log to record the delayed days of missed work leaving the log to indicate a less-severe injury (the remaining participants did not know how they would handle the situation). For the second days-related scenario, most participants indicated a misunderstanding of how to count days of missed work that occurred over the weekend. The percent of establishments that correctly counted weekend days as missed work ranged from 14.3% in Washington to 30.1% in Oregon (table 14). (See Appendix for tabulations based on estimated number of workers.)

Results: Knowledge of OSHA recordkeeping requirements
33
Table 14. Responses to hypothetical recordkeeping scenarios by state.
MN NY OR WA Total p-value Study establishments 581 690 1368 701 3340 Estimated establishments 179,391 342,596 216,152 131,395 869,533 Scenarios related to case criteria Records Stitches Correct 78.3 (4.7) 69.8 (6.3) 68.7 (3.4) 61.6 (5.4) 70.1 (3.0) 0.2665 Incorrect 21.7 (4.7) 30.2 (6.3) 31.3 (3.4) 38.4 (5.4) 29.9 (3.0) Records Horseplay Correct 74.7 (5.2) 63.5 (6.4) 69.2 (3.3) 66.0 (5.4) 67.6 (3.0) 0.4419 Incorrect 25.3 (5.2) 36.5 (6.4) 30.8 (3.3) 34.0 (5.4) 32.4 (3.0) Omits Diagnostic Correct 24.0 (4.4) 24.8 (4.5) 17.1 (2.2) 17.7 (3.2) 21.6 (2.1) 0.281 Incorrect 76.0 (4.4) 75.2 (4.5) 83.0 (2.2) 82.3 (3.2) 78.4 (2.1) Scenarios related to documentation of severity (counting days) Counts Weekend (unscheduled work) Correct 27.5 (4.9) 28.6 (5.1) 30.1 (3.7) 14.3 (2.8) 26.6 (2.5) 0.0993 Incorrect 72.5 (4.9) 71.4 (5.1) 69.9 (3.7) 85.7 (2.8) 73.4 (2.5) Updates Log Correct 76.3 (4.9) 65.3 (6.3) 67.7 (3.5) 64.6 (5.3) 68.1 (3.0) 0.4057 Incorrect 23.7 (4.9) 34.7 (6.3) 32.3 (3.5) 35.4 (5.3) 31.9 (3.0)
Note: Data shown are % of estimated establishments (SE) unless otherwise noted. Incorrect responses include “Don’t Know” responses.

Results: Knowledge of OSHA recordkeeping requirements
34
3.5.2 Characteristics associated with OSHA recordkeeping knowledge Table 15 presents odds ratios for establishment and record-keeper characteristics and incorrect responses to the five hypothetical recordkeeping scenarios, adjusted for establishment and record-keeper characteristics.
Incorrect responses to each of the five different recordkeeping scenarios were associated with different combinations of establishment or record-keeper characteristics, although some characteristics were found to be associated with multiple scenarios. The industry category Administrative Support and Waste Management and Remediation Services + Other Services consistently demonstrated limited recordkeeping knowledge; the only scenario in which they were no different than the comparison group (Manufacturing) was in the recording of missed weekend days (where all industries demonstrated equally poor knowledge). Record-keepers with no OSHA training were also more likely to answer incorrectly in four of the five scenarios; recording injuries resulting from horseplay was the one scenario in which they answered no differently than trained record-keepers. There were state differences in three scenarios (stitches, diagnostic evaluation, and counting weekend days as missed work); inclusion of injury and illness data in competitive bids for contract work was associated with better knowledge in three scenarios (diagnostic evaluation, updating missed days on the log, and counting weekend days as missed work); and limited OSHA recordkeeping experience and reporting zero injuries and illnesses in SOII were associated with three scenarios (incorrect answers for stitches, horseplay, and updating).
The two scenarios that posed the greatest challenge (omitting diagnostic evaluation and counting unscheduled weekend days as missed work) shared three characteristics associated with incorrect answers: untrained record-keepers, Washington and Oregon establishments, and establishments that do not submit bid packages for contract work in which they disclose OSHA injury and illness data.
The relationship between recordkeeping knowledge and establishment size was complex. Compared to establishments with 250 or more employees, establishments with 1-10 employees were either no different (recording horseplay, X-rays, or missed weekend), or demonstrated greater knowledge of the recordkeeping rules (recording stitches and updating logs). Establishments with 11-49 employees were less likely than the largest establishments to know the more difficult scenarios (X-ray and weekend), but more likely to know the easier scenarios (stitches and updating). Establishments with 50-249 employees were less likely to know the more difficult scenarios, but no different than the largest establishments in their knowledge of the easier scenarios.

Results: Knowledge of OSHA recordkeeping requirements
35
Table 15. Adjusted odds ratios (95% CI) for incorrect responses to hypothetical OSHA recordkeeping scenarios, four states combined (n=3340). ------------------------Case-related------------------------ -----------Severity -related-----------
Stitches Horseplay Diagnostic Procedure Weekend Days Update Logs
State (vs MN) NY 1.12 (0.50 - 2.51) 1.44 (0.66 - 3.15) state*trained state*trained 1.28 (0.61 - 2.71) OR 1.91 (0.86 - 4.26) 1.47 (0.69 - 3.14) See table 15-A See Table 15-A 1.72 (0.81 - 3.63) WA 2.60 (1.16 - 5.86) 1.72 (0.79 - 3.75) 2.01 (0.94 - 4.31) Trained on OSHA recording No vs Yes 2.60 (1.28 - 5.26) 1.08 (0.51 - 2.28) state*trained state*trained 2.91 (1.50 - 5.63) Establishment size (vs. 250+ workers) 1-10 workers 0.51 (0.25 - 1.06) 1.06 (0.52 - 2.16) 1.41 (0.73 - 2.73) 1.71 (0.92 - 3.19) 0.43 (0.20 - 0.89) 11-49 workers 0.40 (0.20 - 0.81) 0.74 (0.39 - 1.39) 1.68 (1.00 - 2.81) 1.83 (1.09 - 3.08) 0.40 (0.20 - 0.79) 50-249 workers 0.71 (0.41 - 1.24) 1.41 (0.73 - 2.73) 1.60 (0.99 - 2.59) 3.17 (2.09 - 4.80) 0.69 (0.37 - 1.26) Industry (vs Manufacturing) Construction + Agriculture, Forestry, Fishing and Hunting 1.23 (0.44 - 3.43) 1.53 (0.55 - 4.30) 1.32 (0.39 - 4.42) 0.77 (0.28 - 2.16) 1.15 (0.43 - 3.08) Wholesale Trade + Transportation, Warehousing + Utilities 1.33 (0.45 - 3.89) 0.83 (0.28 - 2.46) 1.02 (0.35 - 3.01) 0.74 (0.28 - 1.93) 1.32 (0.46 - 3.77) Retail Trade 1.75 (0.56 - 5.47) 2.45 (0.84 - 7.18) 2.19 (0.68 - 7.08) 1.05 (0.36 - 3.03) 2.13 (0.72 - 6.36) Information, Financial, Real Estate, Professional, Mgmt 2.08 (0.71 - 6.12) 2.60 (0.86 - 7.83) 3.94 (1.30 - 11.97) 1.81 (0.63 - 5.19) 2.30 (0.80 - 6.58) Admin, Support, Waste Mgmt, Remediation + Other Svc 4.01 (1.50 - 10.70) 2.84 (1.09 - 7.38) 4.25 (1.34 - 13.49) 1.47 (0.57 - 3.76) 4.21 (1.61 - 10.98) Education + Health Care, Social Assistance 2.59 (0.85 - 7.89) 1.51 (0.50 - 4.58) 1.90 (0.62 - 5.84) 1.30 (0.48 - 3.53) 2.05 (0.67 - 6.25) Leisure and Hospitality 2.12 (0.75 - 6.03) 0.96 (0.34 - 2.71) 2.08 (0.69 - 6.27) 0.90 (0.27 - 2.99) 1.50 (0.54 - 4.17) State and Local Government 1.35 (0.46 - 3.99) 1.41 (0.43 - 4.62) 1.74 (0.57 - 5.29) 0.94 (0.37 - 2.38) 1.21 (0.42 - 3.49) Number of worksites operated by employer Single worksite vs multiple sites 1.17 (0.66 - 2.07) 0.71 (0.43 - 1.19) 2.39 (1.47 - 3.88) 1.01 (0.60 - 1.70) 1.10 (0.65 - 1.88) SOII experience (vs Repeat Respondent) First time SOII respondent 1.73 (0.92 - 3.27) 1.48 (0.73 - 3.01) 2.11 (1.08 - 4.13) 1.78 (0.93 - 3.42) 2.01 (1.03 - 3.93) Did not complete SOII/DK/Other 2.14 (1.10 - 4.16) 1.82 (0.83 - 4.01) 2.10 (0.96 - 4.59) 1.57 (0.81 - 3.04) 2.94 (1.48 - 5.84) Injury and illness rate (total OSHA recordable cases) 0 vs 1+ 2.37 (1.32 - 4.28) 1.95 (1.01 - 3.75) 1.25 (0.70 - 2.23) 1.61 (0.94 - 2.76) 2.47 (1.34 - 4.53) Use of workplace injury and illness data In competitive bids for contract work: N vs Y 0.95 (0.20 - 4.51) 1.26 (0.53 - 3.02) 2.25 (1.02 - 4.94) 2.55 (1.15 - 5.64) 2.44 (1.07 - 5.53) In job performance eval of supervisors: N vs Y 3.06 (1.22 - 7.66) 1.93 (0.56 - 6.73) 1.24 (0.50 - 3.05) 1.34 (0.54 - 3.32) 2.31 (1.01 - 5.32) In job performance eval of record-keeper: N vs Y 2.73 (0.62 - 12.02) 4.40 (1.37 - 14.12) 1.67 (0.63 - 4.41) 0.90 (0.37 - 2.19) 2.37 (0.67 - 8.47) In worker safety incentive programs: N vs Y 0.34 (0.12 - 0.99) 1.68 (0.60 - 4.76) 2.72 (1.00 - 7.37) 0.61 (0.27 - 1.37) 0.57 (0.18 - 1.74) OSHA experience (vs 2-9 years) ≤1 year 4.40 (2.29 - 8.43) 2.65 (1.30 - 5.39) 0.76 (0.43 - 1.34) 0.80 (0.43 - 1.50) 3.08 (1.58 - 5.99) 10+ years 2.86 (1.45 - 5.64) 1.32 (0.66 - 2.67) 0.61 (0.36 - 1.04) 1.23 (0.71 - 2.13) 2.54 (1.28 - 5.03) DK 6.51 (2.03 - 20.84) 5.94 (2.00 - 17.59) 0.88 (0.33 - 2.36) 1.59 (0.55 - 4.60) 5.91 (1.80 - 19.40)
Note: Adjusted for all variables in the table and the following (found not significant in any of the five models): Union presence; Workers' compensation insurer; NAICS-based exemption from OSHA recordkeeping requirements. CI=Confidence interval. Separate multivariable regression model estimated for each scenario. Bold font indicates significant at p<0.05

Results: Knowledge of OSHA recordkeeping requirements
36
Table 15-A. Adjusted odds ratios (95% CI) for state*trained interaction terms for incorrect responses to two hypothetical OSHA recordkeeping scenarios, four states combined (n=3340).
Diagnostic Procedure Weekend Days State*OSHA trained interaction MN Trained N vs Y 3.87 (1.58 - 9.50) 1.62 (0.66 - 4.00) NY Trained N vs Y 4.66 (1.81 - 11.97) 5.83 (2.11 - 16.07) OR Trained N vs Y 0.83 (0.39 - 1.77) 1.25 (0.57 - 2.72) WA Trained N vs Y 0.96 (0.41 - 2.28) 2.99 (1.17 - 7.65) Untrained NY vs OR 0.72 (0.37 - 1.44) 1.67 (0.75 - 3.71) Untrained NY vs WA 0.69 (0.30 - 1.59) 0.43 (0.17 - 1.08) Untrained NY vs MN 0.65 (0.25 - 1.68) 1.33 (0.54 - 3.30) Untrained OR vs WA 0.95 (0.46 - 1.97) 0.26 (0.12 - 0.56) Untrained OR vs MN 0.90 (0.38 - 2.13) 0.80 (0.36 - 1.76) Untrained WA vs MN 0.95 (0.37 - 2.47) 3.12 (1.20 - 8.07) Trained NY vs OR 0.13 (0.05 - 0.35) 0.36 (0.13 - 0.98) Trained NY vs WA 0.14 (0.05 - 0.38) 0.22 (0.08 - 0.58) Trained NY vs MN 0.54 (0.21 - 1.41) 0.37 (0.14 - 0.97) Trained OR vs WA 1.11 (0.48 - 2.58) 0.61 (0.26 - 1.42) Trained OR vs MN 4.23 (1.85 - 9.68) 1.04 (0.44 - 2.44) Trained WA vs MN 3.81 (1.63 - 8.92) 1.69 (0.73 - 3.94)
Bold font indicates significant at p<0.05.

Results: Knowledge by OSHA compliant recordkeeping compliance
37
3.6 OSHA recordkeeping knowledge by compliance OSHA recordkeeping knowledge (as measured by correct answers to the hypothetical recordkeeping scenarios) was compared against recordkeeping compliance.
Correct answers to each of the five the hypothetical recordkeeping scenarios were more common among establishments where study participants maintained OSHA logs than among establishments where no logs were maintained (table 16).
Table 16. Answers to hypothetical recording scenarios by whether or not OSHA logs were maintained for the establishment.
Establishments with
OSHA logs Establishments
without OSHA logs Total p-value Study establishments 2733 607 3340 Estimated establishments 356547 512986 869533 Scenarios related to case criteria Records Stitches Correct 89.3 (1.4) 56.7 (3.8) 70.1 (2.6) <0.0001 Incorrect 10.7 (1.4) 43.3 (3.8) 29.9 (2.6) Records Horseplay Correct 87.6 (1.6) 53.7 (3.9) 67.6 (2.8) <0.0001 Incorrect 12.4 (1.6) 46.3 (3.9) 32.4 (2.8) Omits Diagnostic Correct 33.8 (3.0) 13.2 (2.5) 21.6 (1.8) <0.0001 Incorrect 66.2 (3.0) 86.8 (2.5) 78.4 (1.8) Scenarios related to documentation of severity (counting days) Counts weekend (unscheduled work) Correct 34.7 (3.2) 21.0 (3.4) 26.6 (2.4) 0.0059 Incorrect 65.3 (3.2) 79.0 (3.4) 73.4 (2.4) Updates Log Correct 86.4 (1.7) 55.3 (3.8) 68.1 (2.7) <0.0001 Incorrect 13.6 (1.7) 44.7 (3.8) 31.9 (2.7)
Note: Data shown are % of estimated establishments (SE) unless otherwise noted.

Results: Knowledge by OSHA compliant recordkeeping compliance
38
There was little difference in the frequency of correct responses to the hypothetical recordkeeping scenarios related to recording stitches, horseplay, or updating logs among establishments where the case criteria used to determine eligibility for the OSHA log included: OSHA criteria, medical treatment, all injuries, or workers’ compensation claims (all categories other than DK/Other) (table 17). Compared to record-keepers that used criteria other than the OSHA criteria to determine eligibility for the 300 log, record-keepers who used the OSHA criteria were more likely to provide correct answers for omitting cases involving diagnostic services only and for counting unscheduled weekend days as missed work, although even among this group, the percent demonstrating poor knowledge was substantial, with roughly half providing incorrect answers.
Table 17. Answers to hypothetical recording scenarios by compliant and non-compliant case criteria for determining log eligibility among establishments where OSHA log maintained by participant.
Case criteria used for log eligibility Total p-value
OSHA
Criteriaa Medical
treatment All
Injuries Claims DK/Other Study establishments 1478 428 330 175 178 2589 Estimated establishments 156,317 62,447 67,492 14,563 33,856 334,675 Scenarios related to case criteria Records Stitches Correct 88.5 (2.4) 96.6 (1.0) 93.5 (3.1) 94.3 (2.0) 74.8 (6.3) 89.9 (1.5) <0.0001 Incorrect 11.5 (2.4) 3.4 (1.0) 6.5 (3.1) 5.7 (2.0) 25.2 (6.3) 10.1 (1.5) Records Horseplay Correct 88.9 (2.1) 89.4 (3.1) 91.7 (3.4) 88.6 (4.5) 72.3 (7.7) 87.9 (1.6) 0.0135 Incorrect 11.1 (2.1) 10.6 (3.1) 8.3 (3.4) 11.4 (4.5) 27.7 (7.7) 12.1 (1.6) Omits Diagnostic Correct 52.9 (4.9) 25.5 (6.4) 3.9 (1.4) 6.2 (2.0) 26.8 (6.2) 33.2 (3.1) <0.0001 Incorrect 47.1 (4.9) 74.5 (6.4) 96.1 (1.4) 93.8 (2.0) 73.2 (6.2) 66.8 (3.1) Scenarios related to documentation of severity (counting days) Counts weekend (unscheduled work) Correct 46.8 (4.9) 27.8 (7.4) 22.8 (6.2) 10 (3.2) 29.6 (8) 35.1 (3.3) 0.0009 Incorrect 53.2 (4.9) 72.2 (7.4) 77.2 (6.2) 90 (3.2) 70.4 (8) 64.9 (3.3) Updates Log Correct 87.8 (2.4) 90.4 (4.2) 90.1 (3.7) 83.6 (7.1) 75.7 (6.1) 87.3 (1.7) 0.1876 Incorrect 12.2 (2.4) 9.6 (4.2) 9.9 (3.7) 16.4 (7.1) 24.3 (6.1) 12.7 (1.7)
Note: Data shown are % of estimated establishments (SE) unless otherwise noted. aOSHA-compliant practice.

Results: Knowledge by OSHA compliant recordkeeping compliance
39
Like recordkeeping knowledge by case criteria, there was little difference by timing of recording cases for scenarios related to stitches and updating logs. Unlike knowledge by case criteria, there was a difference in recording horseplay injuries by timing of recording: establishments that recorded cases within seven days or on a monthly or quarterly basis were more likely to record injuries resulting from horseplay than establishments that waited for workers’ compensation claims documentation before recording a case on the log. The highest percentages of correct responses to the scenario related to counting missed weekend days was observed among establishments that recorded cases within seven days and establishments that recorded cases at the end of the year, where 38% of both groups provided the correct answer (table 18). Establishments compliant with the seven-day recording requirement did not have the highest percent of correct responses to scenario related to omitting diagnostic services; instead, the greatest percent of correct responses (49%) was observed among establishments that waited for workers’ compensation claims documentation before recording.
Table 18. Answers to hypothetical recording scenarios by compliant and non-compliant timing of case recording among establishments where OSHA logs maintained by study participant.
Timing of case recording Total p-value
Weeka
Monthly or
Quarterly End of year
Upon receipt of WC claim
documentation DK/Other
Study establishments 1894 237 240 47 171 2589 Estimated establishments 259,280 17,313 25,983 2,194 29,905 334,675 Scenarios related to case criteria Records Stitches Correct 91.0 (1.7) 88.2 (3.3) 93.7 (2.1) 90.5 (5.0) 77.7 (6.1) 89.9 (1.5) 0.0008 Incorrect 9.0 (1.7) 11.8 (3.3) 6.3 (2.1) 9.5 (5.0) 22.3 (6.1) 10.1 (1.5) Records Horseplay Correct 91.0 (1.6) 93.5 (1.9) 84.3 (5.9) 76.7 (9.5) 61.7 (9.2) 87.9 (1.6) <0.0001 Incorrect 9.0 (1.6) 6.5 (1.9) 15.7 (5.9) 23.3 (9.5) 38.3 (9.2) 12.1 (1.6) Omits Diagnostic Correct 34.5 (3.9) 41.0 (6.8) 32.1 (8.0) 49.1 (12.6) 17.6 (5.4) 33.2 (3.1) 0.0902 Incorrect 65.5 (3.9) 59.0 (6.8) 67.9 (8.0) 50.9 (12.6) 82.4 (5.4) 66.8 (3.1) Scenarios related to documentation of severity (counting days) Counts weekend (unscheduled work) Correct 37.6 (4.1) 29.7 (6.2) 38.0 (11.8) 20.5 (9.0) 15.2 (4.5) 35.1 (3.3) 0.0438 Incorrect 62.4 (4.1) 70.3 (6.2) 62.0 (11.8) 79.5 (9.0) 84.8 (4.5) 64.9 (3.3) Updates Log Correct 88.8 (2.0) 89.0 (2.7) 87.1 (5.0) 81.2 (9.2) 73.9 (7.3) 87.3 (1.7) 0.0141 Incorrect 11.2 (2.0) 11.0 (2.7) 12.9 (5.0) 18.8 (9.2) 26.1 (7.3) 12.7 (1.7)
Note: Data shown are % of estimated establishments (SE) unless otherwise noted. aOSHA-compliant practice.

Results: Knowledge by OSHA compliant recordkeeping compliance
40
Among establishments that counted either calendar days or scheduled days or shifts of missed work, there was little difference in correct responses to scenarios related to recording injuries resulting in stitches, resulting from horseplay, or updating logs (table 19). Establishments compliant with counting calendar days of missed work were more likely to answer correctly the scenarios related to omitting cases limited to diagnostic services and counting weekend as days of missed work. However, even among establishment reportedly counting missed calendar days, knowledge of the counting rule was limited; over 40% of establishments that claimed to count calendar days of missed work seemed to contradict their reported practice by incorrectly stating they would not count the weekend in the hypothetical scenario.
Table 19. Answers to hypothetical recording scenarios by compliant and non-compliant methods of counting days of missed work among establishments where OSHA logs maintained by the study participant.
Method of counting days of missed work Total p-value
Calendar daysa
Scheduled days or shifts DK/Other
Study establishments 1262 1110 217 2589 Estimated establishments 135187 165782 33707 334675 Scenarios related to case criteria Records Stitches Correct 91.5 (2.0) 92.2 (1.8) 72.5 (7.4) 89.9 (1.5) 0.0003 Incorrect 8.5 (2.0) 7.8 (1.8) 27.5 (7.4) 10.1 (1.5) Records Horseplay Correct 89.1 (2.6) 90.5 (1.9) 70.1 (6.9) 87.9 (1.6) 0.0009 Incorrect 10.9 (2.6) 9.5 (1.9) 29.9 (6.9) 12.1 (1.6) Omits Diagnostic Correct 52.8 (6.6) 19.8 (3.0) 21 (7.2) 33.2 (3.1) <0.0001 Incorrect 47.2 (6.6) 80.2 (3.0) 79 (7.2) 66.8 (3.1) Scenarios related to documentation of severity (counting days) Counts weekend (unscheduled work) Correct 57.5 (6.8) 19.4 (3.9) 22.1 (7.7) 35.1 (3.3) <0.0001 Incorrect 42.5 (6.8) 80.6 (3.9) 77.9 (7.7) 64.9 (3.3) Updates Log Correct 87.7 (3.0) 90.2 (1.8) 71.4 (7.5) 87.3 (1.7) 0.006 Incorrect 12.3 (3.0) 9.8 (1.8) 28.6 (7.5) 12.7 (1.7)
Note: Data shown are % of estimated establishments (SE) unless otherwise noted. aOSHA-compliant practice.

Results: Classification trees
41
3.7 Classification trees To identify discrete groups of establishments with good and bad recordkeeping practices and knowledge without imposing or assuming a distribution of the data, we examined the data using CART (classification and regression trees).
3.7.1 Classification trees: Compliance with OSHA recordkeeping regulations 3.7.1.1 Classification trees: OSHA injury and illness 300 logs maintained for establishment The classification tree constructed for maintaining OSHA logs at an establishment identified many of the same establishment and record-keeper characteristics that were significantly associated with logs based on the adjusted logistic regression model. Based on the classification tree (figure 1), OSHA logs were present in at least 80% of establishments with the following characteristics: establishments that reported in SOII 1 or more cases of OSHA recordable injuries or illnesses; multi-site self-insured establishments; multi-site privately or state-insured establishments with 28 or more employees; and multi-site privately or state-insured establishments with fewer than 28 employees required to maintain OSHA logs annually regardless of participation in SOII in the industry groups of Manufacturing, Wholesale Trade + Transportation and Warehousing + Utilities, Administrative and Support and Waste Management and Remediation + Other Services, and Education + Health Care and Social Assistance. OSHA logs were least common (in 20% of establishments) among single site establishments that reported in SOII zero cases of OSHA recordable injuries or illnesses.
3.7.1.2 Classification trees: Use of OSHA case criteria Based on the classification tree for compliance with the OSHA case criteria (figure 2), the highest rate of compliance was observed for New York establishments with record-keepers formally trained in OSHA recordkeeping, where 88% of establishments reported using the OSHA case criteria to determine eligibility for the log. For trained record-keepers in MN, OR, and WA, compliance was near 70% for certain industries and larger sized establishments; however, even among trained record-keepers in MN, OR, and WA, compliance was less than 40% for establishments in certain industries with fewer than 74 employees. Among establishments with untrained record-keepers, use of OSHA case criteria ranged from 16% for establishments in Manufacturing, Retail Trade, Administrative and Support and Waste Management and Remediation + Other Services, and Leisure and Hospitality, to 61% of New York and Oregon establishments in select industries.
3.7.1.3 Classification trees: Counting calendar days of missed work Compliance with counting calendar days of missed work was greatest among multi-site New York establishments in six industry groups, where 83% of establishments counted calendar days (figure 3). Among the other three states, compliance differed by number of workers, achieving a high of 59% compliance among establishments with more than 6 employees. Compliance with the counting convention was lowest among single site establishments (18% of establishments were compliant), and among multi-site establishments in four industry groups where the study participant had limited SOII experience (19% compliant). Among multi-site establishments in those same industries, repeat SOII respondents were differentiated by whether they had received training on OSHA recordkeeping: 69% of trained record-keepers from these establishments counted calendar days whereas 26% of untrained record-keepers counted calendar days.
3.7.2 Classification trees: Knowledge of OSHA recordkeeping regulations For the three knowledge questions answered correctly by most establishments (recording injuries resulting in stitches, resulting from horseplay, and updating logs to capture eventual missed work), a major characteristic that differentiated correct from incorrect answers was whether OSHA logs were

Results: Classification trees
42
maintained at the establishment. Correct responses were provided in 86 – 89% of establishments that maintained OSHA logs, depending on the question. For the more difficult questions (omitting diagnostic services from the log, and counting an unscheduled weekend as missed days of work), maintaining logs was not identified as a distinguishing characteristic. Instead, recordkeeping experience, measured different ways, appeared to be important: trained, repeat SOII respondents were characteristics identified with correct responses to missed weekend days; repeat SOII respondents with at least 2.5 years of recordkeeping experience were more knowledgeable about diagnostic services, as were first time and never SOII respondents who had been formally trained in OSHA recordkeeping.
3.7.2.1 Classification trees: Recordkeeping scenarios related to case criteria used to determine OSHA log eligibility
Based on the classification tree for recording stitches, in addition to establishments with logs, better knowledge was identified among non-log maintaining New York and Minnesota establishments in most industries (figure 4). The lowest percent of correct responses was observed among Manufacturing, Information + Finance and Insurance + Real Estate and Rental + Professional and Technical Services + Company Management, and Education + Health Care and Social Assistance establishments in Oregon and Washington where no logs were maintained and the record-keeper had less than 1.5 years of recordkeeping experience; 34% of such establishments considered stitches a recordable case. Establishments without logs in Administrative and Support and Waste Management and Remediation + Other Services from all states demonstrated a similar lack of knowledge.
The highest percent of correct responses to recording injuries resulting from horseplay were observed for establishments with OSHA logs (88% correct responses). Among establishments where no logs were maintained, better knowledge of the recordkeeping requirements for horseplay was demonstrated among establishments in five industry groups (Wholesale Trade + Transportation and Warehousing + Utilities; Manufacturing; Education + Health Care and Social Services; Leisure and Hospitality; and State and Local Government) and among establishments with >8 employees in the remaining four industry groups (Construction + Agriculture, Forestry, Fishing and Hunting; Retail Trade; Administrative and Support, Waste Management and Remediation + Other Services; Information, Finance, Insurance, Real Estate and Rental, Professional, Scientific, Technical Services, and Company Management) (figure 5).
Based on the classification tree for correctly omitting cases limited to diagnostic services (figure 6), the most knowledgeable establishments include: New York establishments with a repeat SOII respondent with at least 2.5 years of recordkeeping experience (73% correct); Minnesota, Oregon, and Washington establishments with a repeat SOII respondent with at least 2.5 years of recordkeeping experience and that include OSHA data in competitive bids for contract work (80% correct); and Minnesota and New York establishments with first time or never SOII respondents at multi-site establishments who have been formally trained in OSHA recordkeeping (71% correct). Correct responses were provided in less than 20% of: first time or never SOII respondents at single site establishments; and first time or never SOII respondents at multi-site establishments where the record-keeper had not been trained on OSHA recordkeeping.
3.7.2.2 Classification trees: Recordkeeping scenarios related to recording days of missed work Fewer than one in four record-keepers with no formal training in OSHA recordkeeping would correctly record unscheduled weekend days as missed work (figure 7). This is particularly noteworthy given that untrained record-keepers represent 78% of all establishments across the four states. Trained OSHA record-keepers with limited SOII experience among establishments with private or state funded workers’ compensation claims also demonstrated poor knowledge of counting days. Establishments with high percentages of correct responses included: OSHA trained, repeat SOII respondents in New York (80%

Results: Classification trees
43
correct), and OSHA trained, repeat SOII respondents in Minnesota, Oregon, and Washington in four industry groups: Manufacturing, Administrative and Support and Waste Management and Remediation + Other Services, Leisure and Hospitality, and State and Local Government.
Based on the classification tree for updating logs to document missed work that occurs sometime after the initial injury, correct responses ranged from 34% among establishments in Administrative and Support and Waste Management and Remediation + Other Services where no logs were maintained to 91% among repeat SOII respondents where no logs were maintained among all other industries (figure 8). Among establishments where logs were maintained, 86% responded correctly.
3.7.3 Classification trees: Participants trained in OSHA recordkeeping requirements Because both the regression models and trees identified OSHA recordkeeping training as a significant characteristic in several aspects of recordkeeping practice and knowledge, and because participation in training is not mandated by the OSHA recordkeeping regulations but instead is a voluntary activity, a classification tree was constructed to identify which establishments have trained record-keepers. Based on the classification tree (figure 9), trained record-keepers were most common among: multi-site establishments in Minnesota and Oregon where the record-keeper was a repeat SOII respondent (record-keepers were trained in 70% of these establishments); and multi-site establishments in New York and Washington where the record-keeper was a repeat SOII respondent in an establishment required to maintain OSHA injury records annually regardless of participation in SOII (record-keepers were trained in 70% of these establishments). Training was uncommon among first time and never SOII respondents (16% were trained) and among repeat SOII respondents in small, single site establishments.

Results: Classification trees
44
Figure 1. Compliance with requirement to maintain OSHA logs. Data shown are (% of total establishments that occupy box) % of establishments within box that are in compliance with the OSHA recordkeeping regulation.
All (100%)41% Compliant
Reported ≥1 cases (19%)83%
Reported 0 cases (81%)32%
Multi-site (29%)51%
Self-insured (4%)93%
Private, state funded (25%)
45%
≥28 employees (3%)81%
<28 employees (22%)40%
Non-exempt (10%)56%
Industries A (5%)80%
Industries B (5%)34%
Usually exempt (12%)27%
Single site (52%)20%
Industries A: • Wholesale Trade + Transportation and Warehousing +
Utilities • Manufacturing • Administrative and Support and Waste Management and
Remediation + Other Services • Education + Health Care and Social Assistance
Industries B: • Construction + Agriculture, Forestry, Fishing and Hunting • Retail Trade • Information + Finance and Insurance + Real Estate and
Rental + Professional and Technical Services + Company Management
• Leisure and Hospitality • State and Local Government

Results: Classification trees
45
Figure 2. Compliance with use of OSHA case criteria (among establishments where study participant maintains OSHA logs). Data shown are (% of total establishments that occupy box) % of establishments within box that are in compliance with the OSHA recordkeeping regulation.
All (100%)47% Compliant
OSHA trained (49%)61%
NY (15%)88%
MN, OR, WA (34%)49%
Industries C (10%)68%
Industries D (24%)42%
≥74 employees (3%)69%
<74 employees (22%)38%
Not trained (51%)33%
Industries A (27%)48%
NY, OR (18%)61%
MN, WA (9%)23%
Industries B (24%)16%
Industries A: • Construction + Agriculture,
Forestry, Fishing and Hunting • Wholesale Trade +
Transportation and Warehousing + Utilities
• Information + Finance and Insurance + Real Estate and Rental + Professional and Technical Services + Company Management
• Education + Health Care and Social Assistance
• State and Local Government
Industries B: • Manufacturing • Retail Trade • Administrative and Support
and Waste Management and Remediation + Other Services
• Leisure and Hospitality
Industries C: • Wholesale Trade + Transportation
and Warehousing + Utilities • Information + Finance and
Insurance + Real Estate and Rental + Professional and Technical Services + Company Management
• State and Local Government
Industries D: • Construction + Agriculture, Forestry,
Fishing and Hunting • Manufacturing • Retail Trade • Administrative and Support and Waste
Management and Remediation + Other Services
• Education + Health Care and Social Assistance
• Leisure and Hospitality

Results: Classification trees
46
Figure 3. Compliance with counting calendar days of missed work (among establishments were study participant maintains OSHA logs). Data shown are (% of total establishments that occupy box) % of establishments within box that are in compliance with the OSHA recordkeeping regulation.
All (100%)40% Compliant
Multi-site (60%)55%
Industries A (44%)63%
NY (16%)83%
MN, OR, WA (28%)52%
>6 employees (20%)59%
≤6 employees (8%)30%
Industries B (16%)33%
Repeat SOII (7%)53%
OSHA trained (4%)69%
Not trained (3%)26%
First time SOII/Never/DK (9%)
19%
Single site (40%)18%
Industries A: • Wholesale Trade + Transportation and Warehousing + Utilities • Manufacturing • Retail Trade • Administrative and Support and Waste Management and Remediation
+ Other Services • Education + Health Care and Social Assistance • State and Local Government
Industries B: • Construction + Agriculture, Forestry, Fishing and Hunting • Information + Finance and Insurance + Real Estate and Rental +
Professional and Technical Services + Company Management • Leisure and Hospitality
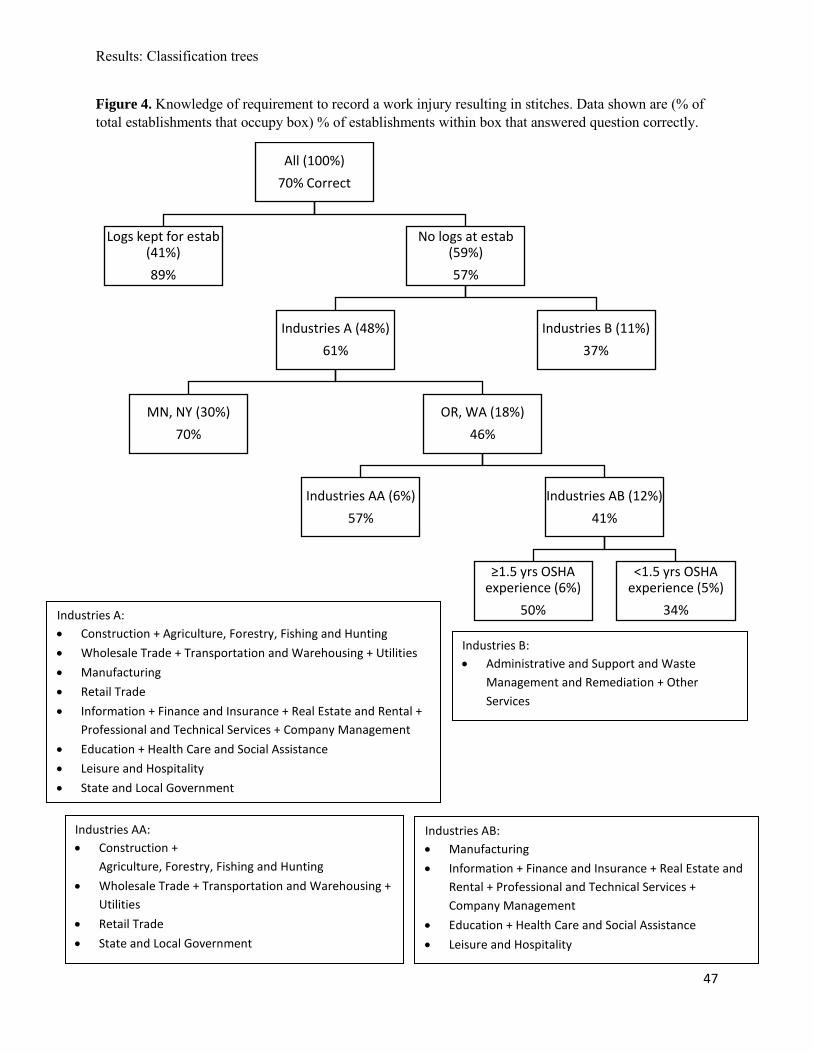
Results: Classification trees
47
Figure 4. Knowledge of requirement to record a work injury resulting in stitches. Data shown are (% of total establishments that occupy box) % of establishments within box that answered question correctly.
All (100%)70% Correct
Logs kept for estab (41%)89%
No logs at estab (59%)57%
Industries A (48%)61%
MN, NY (30%)70%
OR, WA (18%)46%
Industries AA (6%)57%
Industries AB (12%)41%
≥1.5 yrs OSHA experience (6%)
50%
<1.5 yrs OSHA experience (5%)
34%
Industries B (11%)37%
Industries A: • Construction + Agriculture, Forestry, Fishing and Hunting • Wholesale Trade + Transportation and Warehousing + Utilities • Manufacturing • Retail Trade • Information + Finance and Insurance + Real Estate and Rental +
Professional and Technical Services + Company Management • Education + Health Care and Social Assistance • Leisure and Hospitality • State and Local Government
Industries B: • Administrative and Support and Waste
Management and Remediation + Other Services
Industries AA: • Construction +
Agriculture, Forestry, Fishing and Hunting • Wholesale Trade + Transportation and Warehousing +
Utilities • Retail Trade • State and Local Government
Industries AB: • Manufacturing • Information + Finance and Insurance + Real Estate and
Rental + Professional and Technical Services + Company Management
• Education + Health Care and Social Assistance • Leisure and Hospitality

Results: Classification trees
48
Figure 5. Knowledge of requirement to record a work injury resulting from horseplay. Data shown are (% of total establishments that occupy box) % of establishments within box that answered question correctly.
All (100%)68% Correct
Logs kept for estab (41%)88%
No logs at estab (59%)54%
Industries A (17%)70%
Industries B (42%)47%
>8 employees (8%)70%
≤8 employees (34%)42%
Industries A: • Wholesale Trade + Transportation and Warehousing + Utilities • Manufacturing • Education + Health Care and Social Services • Leisure and Hospitality • State and Local Government
Industries B: • Construction + Agriculture, Forestry, Fishing and Hunting • Retail Trade • Administrative and Support, Waste Management and
Remediation + Other Services • Information, Finance, Insurance, Real Estate and Rental,
Professional, Scientific, Technical Services, and Company Management

Results: Classification trees
49
Figure 6. Knowledge that cases limited to diagnostic services are not required to be recorded on log. Data shown are (% of total establishments that occupy box) % of establishments within box that answered question correctly.
All (100%)22% Correct
Repeat SOII (19%) 44%
≥2.5 yrs OSHA exp (13%) 52%
NY (5%)73%
MN, OR, WA (8%) 41%
OSHA data in bids (1%) 80%
No OSHA data in bids (7%) 36%
≥16 employees (3%)52%
<16 employees (4%)25%
<2.5 yrs OSHA exp (6%) 22%
First time SOII/never/DK (81%)
16%
Multi-site (26%)26%
OSHA Trained (6%)50%
MN, NY (3%)71%
OR, WA (3%)26%
No OSHA training (20%) 19%
Single site (55%)12%

Results: Classification trees
50
Figure 7. Knowledge that weekend days are counted as missed work. Data shown are (% of total establishments that occupy box) % of establishments within box that answered question correctly.
All (100%)27% Correct
OSHA trained (22%)42%
Repeat SOII (9%)63%
NY (3%)80%
MN, OR, WA (5%)52%
Industries A (2%)73%
Industries B (3%)37%
First time SOII/Never/DK (13%)
28%
Self-insured for WC (2%)69%
Private ins, state fund, other (11%)
21%
No OSHA training (78%)22%
Industries A: • Manufacturing • Administrative and Support and Waste
Management and Remediation + Other Services • Leisure and Hospitality • State and Local Government
Industries B: • Construction + Agriculture, Forestry, Fishing and Hunting • Wholesale Trade + Transportation and Warehousing + Utilities; • Retail Trade; • Information + Finance and Insurance + Real Estate and Rental +
Professional and Technical Services + Company Mgmt; • Education + Health Care and Social Asst

Results: Classification trees
51
Figure 8. Knowledge that OSHA logs are updated to record missed work that occurred sometime after the initial injury. Data shown are (% of total establishments that occupy box) % of establishments within box that answered question correctly.
All (100%)68% Correct
Logs kept for estab (41%)86%
No logs at estab (59%)55%
Industries A (48%)60%
Repeat SOII (5%)91%
First time SOII/Never/DK (43%)
57%
MN, NY (26%)64%
OR, WA (17%)46%
>3 employees (6%)59%
<3 employees (9%)40%
Industries B (11%)34%
Industries A: • Construction + Agriculture, Forestry, Fishing and Hunting • Wholesale Trade + Transportation and Warehousing +
Utilities • Manufacturing • Retail Trade • Information + Finance and Insurance + Real Estate and
Rental + Professional and Technical Services + Company Management
• Education + Health Care and Social Assistance • Leisure and Hospitality • State and Local Government
Industries B: • Administrative and Support and Waste
Management and Remediation + Other Services

Results: Classification trees
52
Figure 9. Establishments with trained record-keepers, identifiable from SOII data. Data shown are (% of total establishments that occupy box) % of establishments within box with a record-keeper who received formal OSHA recordkeeping training.
All (100%)22% Trained
Repeat SOII (19%)54%
Multi-site (15%)53%
MN, OR (5%)70%
NY, WA (9%)43%
Industries A (8%)49%
Not exempt (3%)70%
Usually exempt (5%)37%
Industries B (1%)6%
Single site (5%)25%
≥38 employees (1%)64%
<38 employees (4%)15%
First time SOII/Never/DK (81%)
16%
Industries A: • Construction + Agriculture, Forestry, Fishing and Hunting • Wholesale Trade + Transportation and Warehousing + Utilities • Manufacturing • Leisure and Hospitality • Retail Trade • Education + Health Care and Social Assistance • Information + Finance and Insurance + Real Estate and Rental +
Professional and Technical Services + Company Management
Industries B: • Administrative and Support and Waste Management and
Remediation + Other Services • State and Local Government

Discussion
53
4 Discussion While some workplace injury and illness record-keepers at SOII-participating establishments exhibit comprehensive knowledge of the injury and illness recording requirements, many record-keepers possess a limited understanding of those requirements. The prevalence of certain practices and knowledge – namely, recording all injuries regardless of severity and a belief that cases limited to diagnostic evaluation should be reported – suggests that many SOII respondents are likely over-reporting cases. Although these cases by definition are minor (involving no days of job restriction or missed work), many establishments may be inflating their rate of total OSHA recordable cases. Reliance on the OSHA case eligibility criteria creates a systematic case definition for SOII; when establishments employ their own case eligibility criteria, the data cannot be used to compare rates of total recordable cases across establishments.
Perhaps more important is the documentation of severity based on methods for counting days of missed work. Given the number of establishments that undercount days of missed work by counting scheduled shifts/days instead of calendar days and the overwhelming belief that unscheduled weekend days need not be counted as missed work, employer records of work-related injuries and illnesses are likely under-reporting total days of missed work. Moreover, if “missed days” are limited to days that the worker is scheduled to appear at work, they are likely under-reporting cases involving days away from work (DAFW) by failing to accurately classify the severity of the case. These cases may instead appear on the log as a less severe case (case involving days of job transfer or restriction or other recordable case), if they appear on the log at all. Underreporting DAFW cases is particularly relevant for SOII data as DAFW cases are the basis of injury and illness estimates by worker and injury characteristics (e.g., age of injured worker, nature of injury, body part injured).
Compounding the issue of under-reporting is the possibility of differential reporting stemming from differences in understanding of the recordkeeping requirements. Record-keepers with limited exposure to OSHA injury and illness records appear more likely to under-report days of missed work than trained, experienced record-keepers at unionized workplaces or establishments that include their OSHA injury data in bid packages for contract work.
The widespread confusion regarding the responsibility for recording injuries and illnesses among temporary workers hired through staffing agencies suggests another area of systematic underreporting to SOII. BLS estimates of occupational injuries and illnesses may be missing a larger portion of cases among this segment of the workforce compared to injuries among workers in a traditional employer-worker relationship. As with other aspects of recordkeeping compliance, temp help worker injuries were more likely to be reported by certain industries and record-keepers.
Record-keepers with minimal OSHA recordkeeping knowledge and noncompliant recordkeeping practices share many of the same characteristics of record-keepers who use data other than OSHA data when completing SOII. Single site establishments, record-keepers with no formal OSHA recordkeeping training, record-keepers with one year or less OSHA recordkeeping experience, and establishments usually exempt from annual OSHA recordkeeping are more likely to rely on their workers’ compensation claims data or some other data source rather than OSHA data for completing SOII. Whereas the OSHA case eligibility criteria offers a systematic case definition across states, the case criteria for workers’ compensation claims differs by state. Additionally, injury and illness reporting in workers’ compensation in incomplete; many workers do not file claims for what might be a covered injury or illness because they are unaware of their benefit eligibility, they consider the condition to be minor, or they perceive the claim filing and administration process to be too burdensome. Instead of entering the workers’ compensation

Discussion
54
system, they seek treatment from their personal health care provider, if at all. Interviews with injured workers in ten states suggest rates of claim filing differs by state (Centers for Disease and Prevention, 2010). Reliance on workers’ compensation claims data for SOII introduces state differences in the SOII data that would not exist if cases were reported in accordance with the OSHA regulation.
State differences in recordkeeping practices and knowledge persisted after controlling for establishment and record-keeper characteristics. It is unknown what is driving these differences. Three of the four states operate state-plan OSHA programs; each may place a different emphasis on recordkeeping, both in terms of enforcement and educational outreach activities. Differences in workers’ compensation insurer may play a role that was obscured in the comparison of self-insured against all other insurance arrangements. There may have been regional differences in a tendency to default to a “don’t know” response (that was grouped with the incorrect responses) instead of providing a more definitive answer. State differences in survey administration procedures for this study may also account for some portion of observed differences. These findings may not reflect the recordkeeping practices in the 46 states that did not participate in the survey; however, the large gaps in recordkeeping knowledge demonstrated across the four states suggest that limited understanding of recordkeeping requirements is pervasive across the country.
Although formal training in OSHA recording was associated with several aspects of recordkeeping compliance and knowledge, this study does not address whether training causes better recordkeeping. Not required under existing OSHA regulations, participation in training is voluntary (unless required by an employer). Better recordkeeping among trained respondents instead may be explained by underlying differences between participants who chose to attend a training course and those who did not, including a greater interest in recordkeeping and motivation to complete the forms correctly. Additionally, some establishments may have better access to high quality training while others have more limited options. The quality and availability of the training provided, not assessed in this study, may further impact observed associations with recordkeeping practices.
Workplace injury and illness recordkeeping is a difficult topic to discuss with employers. For many establishments, injuries are rare and thus, recordkeeping is infrequent. The common response of “don’t know” provided little in terms of informative answers and made assessment of practices and knowledge difficult. In grouping “don’t know” with incorrect responses (for knowledge), or other (for practice responses), the findings can be viewed as ‘worst case’ estimates; some study participants who answered “don’t know” may have or will in the future undertake the appropriate recordkeeping action. Additionally, we were unable to assess the recordkeeping practices of the more than 40% of establishments that did not maintain OSHA logs. Many of these establishments reported zero work injuries and illnesses, suggesting one of two possibilities: either recordkeeping is something establishments undertake only after an injury had occurred, or there are no injuries to report because there is no tracking system in which they are documented. Studies other than telephone interviews with employers may be better suited to exploring this issue.
The observed relationship between establishment characteristics (especially size and industry) and recordkeeping wasn’t always as expected; for example, smaller establishments were not always the worst performers. This may arise from non-response bias for this survey. Smaller establishments were less likely to participate in this study. Perhaps only the most engaged and knowledgeable record-keepers among smaller establishments agreed to participate in the survey, while a greater range of individuals participated from larger establishments. Non-response bias may have also resulted from differences in participation by industry and workplace injury experience.

Discussion
55
5 Conclusion The accuracy of the BLS estimates of nonfatal occupational injuries and illnesses is dependent on the quality of the data reported by employers. BLS data accuracy likely suffers from limited understanding of the reporting requirements among SOII respondents. Since record-keeper characteristics (SOII experience, OSHA recordkeeping experience, and OSHA recordkeeping training) were found to be associated with better practices and knowledge, focusing on the individual reporting the SOII data may be an effective means of improving data accuracy. Approaches to increasing record-keeper engagement include: identification of first time SOII respondents (individuals, not establishments) and increased communication between the SOII data collection staff and all respondents throughout the survey period to facilitate an improved understanding of the reporting requirements as well as the importance of the data; enrollment of establishments in SOII for a multi-year period instead of one year to increase familiarity with recordkeeping; and development and dissemination of effective training materials, in collaboration with OSHA, that address common recordkeeping misperceptions.

56
References Boden, LI. 2014. Capture-recapture estimates of the undercount of workplace injuries and illnesses: sensitivity analysis. Am J Ind Med 57: 1090-1099. Boden, LI, Ozonoff, A. 2008. Capture-recapture estimates of nonfatal workplace injuries and illnesses. Ann Epidemiol 18: 500-506. Centers for Disease, C, Prevention. 2010. Proportion of workers who were work-injured and payment by workers' compensation systems - 10 states, 2007. MMWR. Morbidity and mortality weekly report 59: 897-900. Dong, XS, Fujimoto, A, Ringen, K, Stafford, E, Platner, JW, Gittleman, JL, Wang, X. 2011. Injury underreporting among small establishments in the construction industry. Am J Ind Med 54: 339-349. Mendeloff, J, Burns, R. 2013. States with low non-fatal injury rates have high fatality rates and vice-versa. American Journal of Industrial Medicine 56: 509-519. Nestoriak, N, Pierce, B. 2009. Comparing workers' compensation claims with establishments' responses to the SOII. Monthly Labor Review 132: 8. Phipps, P, Moore, D, 2010. Employer Interviews: Exploring Differences in Reporting Work Injuries and Illnesses in the Survey of Occupational Injuries and Illnesses and State Workers' Compensation Claims, Paper presented at the 2010 Joint Statistical Meetings, Vancouver, BC, Canada. http://www.bls.gov/osmr/pdf/st100210.pdf Rappin, CL, Wuellner, SE, Bonauto, DK. 2016. Employer reasons for failing to report eligible workers' compensation claims in the BLS survey of occupational injuries and illnesses. Am J Ind Med 59: 343-356. Rosenman, KD, Kalush, A, Reilly, MJ, Gardiner, JC, Reeves, M, Luo, Z. 2006. How much work-related injury and illness is missed by the current national surveillance system? J Occup Environ Med 48: 357-365. Wiatrowski, WJ. 2014. The BLS survey of occupational injuries and illnesses: a primer. Am J Ind Med 57: 1085-1089. Wuellner, SE, Adams, DA, Bonauto, DK. 2016. Unreported workers' compensation claims to the BLS Survey of Occupational Injuries and Illnesses: Establishment factors. Am J Ind Med 59: 274-289. Wuellner, SE, Bonauto, DK. 2014. Exploring the relationship between employer recordkeeping and underreporting in the BLS Survey of Occupational Injuries and Illnesses. Am J Ind Med 57: 1133-1143.

57
Appendix: Worker estimates By multiplying the establishment weight by the number of workers reported by the establishment, we estimated the number and percent of workers in each state by select characteristics and recordkeeping outcomes.
Whereas there was little difference in the percent of establishments with an OSHA-trained record-keeper, and trained record-keepers were present in about one in five establishments, the percent of employees that worked at an establishment with a formally trained OSHA record-keeper differed by state, and over half the employees in Minnesota and Oregon worked at an establishment with a formally trained record-keeper. Estimates of recordkeeping experience were substantially different between establishment and employee weights. In three states, half or more establishments had a record-keeper with one year or less experience, but only 21-36% of employees worked at those establishments.
Table A-1. Estimated workers at establishments by select establishment and record-keeper characteristics.
MN NY OR WA Total p-value Study establishments 581 690 1368 701 3340 Estimated workers 4,355,826 7,934,296 3,554,159 2,627,465 18,471,747 Establishment demographics Workers' compensation insurer Private Insurance 64.6 (3.8) 31.1 (3.4) 23.3 (2.1) 1.9 (0.8) 33.4 (2.0) <0.0001 Self-insured 27.8 (3.4) 30.7 (3.5) 21.5 (2.4) 27.8 (3.1) 27.8 (1.8) State funded 2.8 (1.0) 22.0 (2.4) 50.0 (3.1) 64.8 (3.2) 28.9 (1.5) Other 4.8 (1.4) 16.1 (3.8) 5.2 (0.8) 5.5 (1.7) 9.9 (1.8) Unionized workforce Yes 27.7 (4.0) 33.1 (3.5) 26.7 (3.4) 26.9 (2.4) 29.7 (1.9) 0.3885 No 72.3 (4.0) 66.9 (3.5) 73.3 (3.4) 73.1 (2.4) 70.3 (1.9) Exempt from OSHA recordkeeping Partially exempt 48.5 (4.1) 47.3 (3.6) 46.6 (3.0) 44.5 (3.1) 47.0 (1.9) 0.9216 Required annually 51.5 (4.1) 52.7 (3.6) 53.4 (3.0) 55.5 (3.1) 53.0 (1.9) Survey participant recordkeeping experience SOII experience First time 32.9 (3.6) 30.9 (3.7) 23.9 (2.1) 30.9 (3.0) 30.0 (1.9) <0.0001 Repeat 41.7 (4.3) 43.7 (3.7) 32.9 (3.6) 42.7 (3.0) 41.0 (2.0) Did Not Complete SOII 14.6 (4.2) 16.4 (2.1) 23.7 (2.5) 5.2 (1.0) 15.8 (1.4) DK + Other 10.9 (1.7) 9.0 (1.7) 19.5 (2.2) 21.3 (2.6) 13.2 (1.0) OSHA recordkeeping training received by the participant or the person responsible for the OSHA records Yes 55.2 (3.8) 38.0 (3.7) 51.8 (2.9) 42.5 (3.1) 45.3 (2.0) <0.0001 No 42.0 (3.7) 54.4 (3.7) 45.1 (2.9) 52.1 (3.1) 49.4 (2.0) DK 2.8 (0.9) 7.6 (1.9) 3.1 (0.6) 5.5 (1.4) 5.3 (0.9) Years of OSHA recordkeeping experience <=1 year 20.9 (2.9) 35.6 (3.5) 19.0 (1.9) 23.5 (2.7) 27.2 (1.7) <0.0001 2 - 9 years 38.1 (4.7) 36.6 (3.9) 41.8 (3.4) 43.3 (3.1) 38.9 (2.1) 10+ years 41.0 (3.9) 27.3 (3.4) 32.4 (2.4) 29.9 (2.6) 31.9 (1.8) DK . (.) 0.5 (0.3) 6.8 (1.6) 3.3 (1.0) 2.0 (0.4)
Note: Data shown are % of estimated establishments (SE) unless otherwise noted.

Appendix: Worker estimates
58
Use of OSHA data in bids and as a performance measure in worker safety incentive programs was more common on an employee basis than on an establishment basis, although did not impact more than 10% of workers in most states.
Table A-2. Estimated workers at establishments by use of injury and illness data in establishment performance measures.
MN NY OR WA Total p-value Study establishments 581 690 1368 701 3340 Estimated workers 4,355,826 7,934,296 3,554,159 2,627,465 18,471,747 Included in competitive bids for contract work OSHA data 6.6 (1.7) 8.1 (1.4) 8.3 (1.0) 11.3 (2.6) 8.2 (0.9) 0.007 Other data 0.6 (0.3) 0.8 (0.3) 0.6 (0.2) 0.6 (0.3) 0.7 (0.2) None 67.8 (4.7) 69.4 (3.7) 80.0 (2.1) 76.0 (3.0) 72.0 (2.1) DK 25.0 (4.9) 21.7 (3.7) 11.1 (2.0) 12.1 (2.0) 19.1 (2.1) Used to evaluate the job performance of the record-keeper OSHA data 4.1 (1.1) 1.8 (0.6) 7.0 (0.9) 4.7 (1.0) 3.7 (0.4) <0.0001 Other data 15.7 (2.7) 13.3 (1.8) 16.2 (3.8) 7.5 (1.4) 13.6 (1.3) None 76.8 (3.2) 73.4 (3.7) 73.8 (3.7) 84.3 (1.9) 75.8 (1.9) DK 3.4 (1.2) 11.5 (3.6) 3.0 (1.2) 3.4 (0.9) 6.8 (1.7) Used to evaluate job performance of supervisors OSHA data 7.5 (1.6) 1.3 (0.5) 10.1 (1.0) 5.2 (1.0) 5.0 (0.5) 0.0003 Other data 17.2 (2.7) 15.0 (2.0) 12.2 (2.5) 8.3 (1.3) 14.0 (1.2) None 56.8 (4.4) 61.7 (3.8) 64.0 (3.6) 72.9 (2.4) 62.6 (2.1) DK 18.5 (5.2) 22.0 (3.8) 13.7 (4.2) 13.6 (1.9) 18.4 (2.2) Used to evaluate performance in worker safety incentive program OSHA data 10.6 (4.1) 1.1 (0.5) 6.0 (0.7) 3.4 (0.8) 4.6 (1.0) <0.0001 Other data 17.2 (2.9) 12.7 (1.8) 12.7 (1.3) 13.7 (1.7) 13.9 (1.1) None 71.2 (4.2) 79.0 (3.6) 73.2 (3.8) 77.4 (2.2) 75.8 (2.0) DK 1.0 (0.4) 7.3 (3.5) 8.1 (4.2) 5.5 (1.3) 5.7 (1.8)
Note: Data shown are % of estimated establishments (SE) unless otherwise noted.

Appendix: Worker estimates
59
Because larger establishments tended to be more compliant than smaller establishments, compliance was better on an employee-basis. There were similar patterns in state differences for the establishment and employee-based estimates (e.g., logs were least common in New York based on either the establishment weights or the employee weights). There was no difference in compliance with counting days of missed work on an employee-basis.
Table A-3. Estimated workers at establishments by OSHA recordkeeping compliance.
MN NY OR WA Total p-value Study establishments 581 690 1368 701 3340 Estimated workers 4,355,826 7,934,296 3,554,159 2,627,465 18,471,747 Logs maintained for the establishment Logs maintained, at least in part, by study participant 80.1 (2.8) 66.8 (3.2) 77.5 (2.1) 70.5 (2.8) 72.5 (1.6) <0.0001 Logs maintained by others 1.5 (0.8) 5.6 (1.3) 2.9 (0.5) 3.8 (0.8) 3.9 (0.6) No logs maintained for establishment 14.2 (2.4) 13.2 (2.0) 14.1 (1.7) 16.2 (2.5) 14.0 (1.1) Unknown if logs maintained 4.2 (1.4) 14.4 (2.4) 5.5 (1.3) 9.5 (1.9) 9.6 (1.1) Among establishment with logs maintained, at least in part, by study participant
MN NY OR WA Total Study establishments 473 490 1087 539 2589 Estimated workers 3,490,254 5,302,711 2,754,279 1,851,547 13,398,791 Criteria used to determine eligibility for log OSHA Criteriaa 56.0 (4.7) 62.6 (5.0) 64.5 (3.0) 48.7 (3.6) 59.4 (2.4) <0.0001 Medical treatment 17.2 (2.9) 5.0 (1.2) 16.0 (1.9) 20.2 (2.7) 12.5 (1.1) All injuries (regardless of severity) 13.1 (2.7) 16.4 (3.5) 9.8 (1.4) 7.3 (1.3) 12.9 (1.6) Workers’ compensation claims 3.4 (1.4) 2.3 (0.7) 5.5 (1.1) 13.8 (2.0) 4.8 (0.6) DK/Other 10.4 (2.4) 13.7 (5.1) 4.2 (0.9) 10.0 (2.1) 10.4 (2.2) When cases are recorded on log Weeka 75.6 (3.5) 73.6 (5.1) 76.4 (2.5) 64.7 (3.3) 73.5 (2.3) 0.0021 Monthly or Quarterly 10.9 (2.4) 6.0 (1.6) 8.5 (1.6) 11.2 (1.9) 8.5 (1.0) End of year 7.2 (1.9) 5.4 (1.2) 9.0 (1.6) 11.2 (1.9) 7.4 (0.8) Upon receipt of WC claim documentation 0.5 (0.3) 0.9 (0.4) 1.6 (0.4) 1.2 (0.5) 1.0 (0.2) DK/Other 5.8 (1.6) 14.1 (5.3) 4.6 (0.9) 11.6 (2.4) 9.6 (2.2) How days are counted Calendar daysa 51.5 (5.0) 57.9 (4.8) 49.9 (4.3) 48.1 (3.5) 53.2 (2.5) 0.2503 Scheduled work days or shifts 37.2 (4.4) 37.8 (4.9) 40.6 (3.4) 44.4 (3.6) 39.1 (2.4) DK/Other 11.2 (4.8) 4.3 (1.0) 9.5 (3.0) 7.5 (1.5) 7.6 (1.5)
Note: Data shown are % of estimated establishments (SE) unless otherwise noted. aOSHA-compliant practice.

Appendix: Worker estimates
60
Two patterns of OSHA source data were observed. In New York and Oregon, less than 25% of workers were employed at an establishment that used workers’ compensation data to complete the OSHA log, whereas in Minnesota and Washington, over half of workers were at an establishment that used workers’ compensation data for the OSHA log.
Table A-4. Estimated workers at establishments by source of OSHA injury and illness data, among establishments where OSHA log maintained by the study participant.
MN NY OR WA Total Study establishment 473 490 1087 539 2589 Estimated workers 3,490,254 5,302,711 2,754,279 1,851,547 13,398,791 Company report completed by employee/supervisor 74.9 (3.4) 63.3 (5.3) 90.2 (1.3) 78.1 (2.6) 73.9 (2.5) Workers’ Compensation (WC) data 58.2 (4.6) 21.6 (5.1) 22.9 (2.2) 52.1 (3.6) 35.6 (2.6)
WC only 12.4 (2.4) 14.5 (5.1) 6.6 (1.1) 10.8 (1.8) 11.8 (2.2) WC+non-WC 45.7 (5.2) 7.0 (1.7) 16.3 (1.9) 41.3 (3.8) 23.8 (2.1)
Doctor's report 18.6 (3.3) 9.0 (1.7) 10.6 (1.4) 24.3 (2.6) 13.9 (1.2) Other 13.9 (2.6) 21.5 (3.9) 3.4 (0.8) 11.7 (2.7) 14.5 (1.8)
Note: Data shown are % of estimated establishments (SE) unless otherwise noted. Percentages do not add to 100 as the categories are not mutually exclusive.
Use of OSHA data for SOII was greater on an employee-basis than on an establishment-basis. On an employee basis, more than half of all employees worked at an establishment that used OSHA data to complete the SOII, compared with 31% of all establishments. Workers at establishments that relied solely on workers’ compensation claims data for SOII ranged from 11% of workers in Minnesota to 19% of workers in New York.
Table A-5. Estimated workers at establishments by source of SOII data, among establishments where the study participant completed SOII.
MN NY OR WA Total p-value Study establishments 422 505 742 527 2196
Estimated establishments 3,248,155 5,919,192 2,018,158 1,932,866 13,118,371
OSHA dataa 62.4 (5.0) 44.3 (4.8) 66.0 (6.1) 54.5 (3.6) 53.6 (2.7) <0.0001 WC claims data 10.7 (2.5) 19.0 (4.7) 17.6 (6.9) 13.3 (2.0) 15.9 (2.5)
Internal data only 20.8 (5.4) 33.7 (3.9) 6.2 (1.4) 14.4 (2.3) 23.5 (2.1)
DK, No injuries, DK, other sources
6.1 (1.4) 3.0 (1.0) 10.2 (1.9) 17.8 (2.8) 7.0 (0.8)
Note: Data shown are % of estimated establishments (SE) unless otherwise noted. aIncludes establishments that use workers’ compensation claims data to complete OSHA data.

Appendix: Worker estimates
61
Because larger establishments tended to be more knowledgeable than smaller establishments, knowledge was better on an employee-basis. Incorrect responses were still common; more than 60% of employees worked at an establishment that would fail to record days of work missed over a weekend. Larger state differences were observed on an employee-basis, although most estimates were not statistically significant.
Table A-6. Estimated workers at establishments by OSHA recordkeeping knowledge, as assessed by correct responses to hypothetical recordkeeping scenarios.
MN NY OR WA Total p-value Study establishments 581 690 1368 701 3340 Estimated workers 4,355,826 7,934,296 3,554,159 2,627,465 18,471,747 Scenarios related to case criteria Records Stitches Correct 87.2 (2.2) 79.8 (3.3) 75.7 (4.0) 78.3 (2.6) 80.5 (1.8) 0.069 Incorrect 12.8 (2.2) 20.2 (3.3) 24.3 (4.0) 21.7 (2.6) 19.5 (1.8) Records Horseplay Correct 86.4 (2.3) 76.4 (3.9) 75.3 (2.6) 77.7 (2.7) 78.7 (1.9) 0.0314 Incorrect 13.6 (2.3) 23.6 (3.9) 24.7 (2.6) 22.3 (2.7) 21.3 (1.9) Omits Diagnostic Correct 43.7 (4.5) 42.8 (3.6) 34.3 (3.9) 31.3 (2.9) 39.8 (2.1) 0.0773 Incorrect 56.3 (4.5) 57.2 (3.6) 65.7 (3.9) 68.7 (2.9) 60.2 (2.1) Scenarios related to documentation of severity (counting days) Counts Weekend Correct 35.7 (4.1) 41.4 (3.6) 37.3 (3.8) 33.5 (2.8) 38.1 (2.0) 0.4176 Incorrect 64.3 (4.1) 58.6 (3.6) 62.7 (3.8) 66.5 (2.8) 61.9 (2.0) Updates Log Correct 86.9 (2.2) 73.3 (3.7) 81.0 (2.7) 79.2 (2.6) 78.8 (1.9) 0.0015 Incorrect 13.1 (2.2) 26.7 (3.7) 19.0 (2.7) 20.8 (2.6) 21.2 (1.9)
Note: Data shown are % of estimated establishments (SE) unless otherwise noted.