employee share-ownership plans in the mining …
TRANSCRIPT

EMPLOYEE SHARE-OWNERSHIP PLANS IN
THE MINING INDUSTRY– A NEW
APPROACH TO ESOPS
Makatane Kagisho Jacob Diale
A research report submitted to the Faculty of Engineering and the Built
Environment, University of the Witwatersrand, Johannesburg, in partial
fulfilment of the requirements for the degree of Master of Science in
Engineering
Johannesburg 2016

i
DECLARATION
I declare that this research report is my own, unaided work. It is being
submitted for the Degree of Master of Science in Engineering to the
University of the Witwatersrand, Johannesburg. It has not been
submitted before for any degree or examination to any other
University.
Signed:
Makatane Kagisho Jacob Diale
_______ day of ____________2016

ii
ABSTRACT
Empowerment of previously disadvantaged groups has been applied in many
countries, in order to achieve specific political, economic and social outcomes.
Group preferences and preferential policies are common in developed and
developing countries under various names. They have been mostly implemented in
countries where a specific ethnic, religious, or gender group has been discriminated
against historically.
An ESOP is an empowerment tool that can be adapted and designed to achieve the
goals of companies, employees and governments. An ESOP is an instrument used
to enable employee ownership in private and public companies. Internationally the
application of ESOPs have taken various architectures highly dependent on
individual company and country circumstances.
SA has a long and well documented history of racial discrimination and economic
exclusion. Poverty, unemployment and inequality continue to bedevil the South
African economy. Transformation in the mining industry is given effect in the Mining
Charter which is governed under section 100 of the Minerals and Resources
Development Act. The Charter is buttressed by a key set of pillars. These pillars are
supplemented by the codes of good practice as well as the housing and living
conditions standards.
These pillars include reporting; ownership; housing and living conditions;
procurement and enterprise development; employment equity; human resource
development; mine community development; sustainable development and growth
and beneficiation. This report focusses on the ownership pillar of the Charter.
iii
The mining industry has completed a number of empowerment deals post
implementation of the Mining Charter. The impacts of most BEE deals have not been
broad-based; and have mostly benefitted only a few HDSA entrepreneurs. The value
and number of transactions have coincided with the rise and fall of the JSE, making
the deals expensive – due to elevated stock prices in favourable market conditions.
ESOPs enable extensive employee ownership; and have the ability to foster a sense
of individual enterprise that fuels productivity in companies that have imbued a
culture of ownership amongst their employees. ESOPs generally contribute
positively to company performance; and they provide a stable and dynamic working
environment, when administered effectively. ESOPs cannot be implemented in
isolation; but they require a combination of factors to make them successful.
ESOPs generally contribute positively to company performance; and they provide a
stable and dynamic working environment, when administered effectively. Effective
ESOPs require a combination of elements for success: these comprise of financial
incentives, employee-involvement mechanisms and the instilling of an ownership
culture.
Anglo American was used as a proxy for the industry due to its size and diversity.
ESOPs that have been implemented have failed to meet stakeholders’ expectations.
These ESOPs are inconsistent, complicated and mostly opaque to employees;
whilst delivering modest returns to employees.
This report proposes the application of a new ESOP framework that is to be
considered in amending existing ESOPs or in the crafting of new programmes.
Existing ESOPs are assessed against this proposed framework in this report. The
proposed ESOP framework is supported by a set of key principles, essential to the
success of the framework.

iv
The performance of ESOPs in Anglo American varied when assessed against the
framework. With the exception of Envision, Anglo American’s ESOPs have delivered
very modest financial benefits to employees. They have not achieved their intended
purpose, of empowering employees and aligning company performance with
individual employee performance. When assessed against the other pillars of the
framework, KIO and AAP did not perform satisfactorily.

v
DEDICATION
This research report is dedicated to my family, for the ongoing support that has been
afforded to me over the years. It is also dedicated to Anglo American and the School
of Mining Engineering at the University of the Witwatersrand – for offering me the
opportunity to complete this research.

vi
ACKNOWLEDGEMENTS
I wish to acknowledge and extend my gratitude to the following people and
organisations for making the completion of this research report possible.
Professor Hudson Mtegha, my project supervisor, for his continuous support and
guidance.
Tebello Chabana, the Head of Government Relations at Anglo American, for his
assistance with the data and his guidance.
Ian French, Corporate Finance manager at Anglo American, for the data
provision and his support.
Anglo American Corporate Division (CEO’s Office).
Family and Friends.

vii
TABLE OF CONTENTS
DECLARATION i
ABSTRACT ii
DEDICATION v
ACKNOWLEDGEMENTS vi
LIST OF FIGURES xiii
LIST OF TABLES xvi
LIST OF SYMBOLS/ACRONYMS xvii
1 INTRODUCTION 1
1.1 Background and Motivation 2
1.2 Relevance and Importance of the Topic 3
1.3 Problem Statement 4
1.4 Objectives 4
1.5 Methodology 4
1.6 Report structure 5
2 LITERATURE REVIEW 6
2.1 Empowerment of historically disadvantaged groups internationally 6
2.1.1 Empowerment Policies in the Soviet Union 7
2.1.1.1 ESOPs in the Soviet Union 8

viii
2.1.2 Preferential Policies in India 8
2.1.2.1 ESOPs in India 9
2.1.3 Employment Equity in Canada 9
2.1.3.1 ESOPs in Canada 9
2.1.4 Empowerment in Malaysia 10
2.1.4.1 ESOPs in Malaysia 11
2.1.5 Empowerment in the United States of America 11
2.1.5.1 ESOPs in the USA 12
2.1.6 Group Preferences in Sri Lanka 12
2.1.6.1 ESOP in Sri Lanka 13
2.1.7 Summary 14
2.2 SA’s Historical context 14
2.3 Empowerment of HDSA’s 15
2.4 Current economic status of South Africans 17
2.5 Broad-Based Black Economic Empowerment Sector Charters 19
2.6 Empowerment in the Mining Industry 22
2.6.1 Policy Framework 22
2.6.2 Scoring Principles 23
2.7 Empowerment deals in the Mining Industry 25

ix
2.7.1 Chamber of Mines assessment of members’ empowerment transactions in
the industry 25
2.7.2 Transactions involving employee schemes and community trusts 29
2.7.3 Company transactions 30
2.7.4 Summary of benefits to beneficiaries 32
2.7.5 Assessment by The Department of Mineral Resources on the industry’s
performance in relation to the Charter 33
2.7.6 Summary 33
2.8 ESOPS 34
2.8.1 The need for ESOPs 35
2.8.2 How ESOPs are structured 36
2.8.3 Various ESOP models 37
2.8.3.1 Share Appreciation Rights 37
2.8.4 Characteristics of successful ESOPs 42
2.8.5 Benefits of Establishing an ESOP 44
2.8.6 Criticism of ESOPs 45
2.8.7 Financing an ESOP 47
2.8.8 ESOPs in other parts of the world 47
2.8.9 Summary 48
2.9 Overview of ESOPs in South Africa 49

x
2.10 Summary 52
3 ANGLO AMERICAN 53
3.1 Anglo American as a proxy for the mining industry 53
3.2 Anglo American’s BEE Transactions 60
3.3 AAP – Atlatsa / Bokoni 60
3.3.1 Structure Overview 60
3.4 AATC 63
3.4.1 Structure overview 63
3.5 De Beers 64
3.5.1 Structure overview 64
3.6 DTC SA Empowerment 65
3.7 Employee Share-Ownership Plans (ESOPs) 66
3.8 Summary 66
4. Anglo American’s assessments of current ESOPs 67
4.1 Performance assessment 67
4.2 Original objectives of the schemes 68
4.3 Summary 69
5 ESTABLISHING A FRAMEWORK FOR A SUCCESSFUL ESOP 70
5.1 Principles underpinning the proposed framework 70

xi
5.2 Proposed Framework 72
5.2.1 Meaningful economic participation 72
5.2.2 Instilling an ownership culture 73
5.2.3 Driving the business disciplines 73
5.2.4 Share price performance 73
5.2.5 Financial incentives 74
5.2.6 Aligned goals 74
5.2.7 Productivity gains 74
5.2.8 Engaged and responsive workforce 74
5.2.9 Regulatory compliance 75
5.3 Summary 75
6 ANALYSIS OF CURRENT ESOPS USING PROPOSED FRAMEWORK 77
6.1 KIO 77
6.1.1 Share performance and financial incentives 77
6.1.2 Meaningful economic participation 80
6.1.3 Instilling ownership culture and aligning goals 80
6.1.4 Productivity 80
6.1.5 Engaged and responsive workforce 81
6.1.6 Regulatory compliance 82

xii
6.1.7 Summary 82
6.2 Anglo American Platinum 83
6.2.1 Share performance and financial incentives 84
6.2.2 Instilling an ownership culture and aligning goals with an engaged and
responsive workforce 87
6.2.3 Meaningful economic participation 88
6.2.4 Productivity 88
6.2.5 Regulatory compliance 89
6.2.6 Summary of Kotula 90
6.3 Summary 90
7 CONCLUSION AND RECOMMENDATIONS 91
8 REFERENCING 94
9 APPENDICES 101
Appendix 1: Summarised HDSA ownership results 101
Appendix 2: Summary of Anglo American Platinum Atlatsa/Bokoni empowerment
deal 102
Appendix 3: Anglo American Platinum Joint Ventures (JVs) 103
Appendix 4: Funding model for Anglo-Inyosi Coal 105
Appendix 5: Ponahalo-funding Structure 106

xiii
LIST OF FIGURES
Figure 1: Average annual household income by population group (Statistics South
Africa, 2011) ................................................................................................... 18
Figure 2: Kernel Density curve of income distribution by group (Van De Berg,
2010) .............................................................................................................. 19
Figure 3: A structure of the transformation policy framework for the mining industry
(Department of Mineral Resources, 2015) ...................................................... 23
Figure 4: Portion of ownership of mining industry transferred to HDSA (Wu and
Moodley, 2009) ............................................................................................... 27
Figure 5: Value of transactions in the mining sector (Wu and Moodley, 2009) ...... 28
Figure 6: Resources 20 index (Financial Times, 2016) .......................................... 29
Figure 7: BEE transactions involving employees and communities (Wu and
Moodley, 2009) ............................................................................................... 30
Figure 8: Meaningful economic participation of HDSA (Chamber of Mines South
Africa, 2015) ................................................................................................... 32
Figure 9: Anglo American's economic contribution to SA (Genesis Analytics and
PwC, 2013) ..................................................................................................... 54
Figure 10: Anglo American’s capital expenditure (Genesis Analytics and PwC,
2013) .............................................................................................................. 55
Figure 11: Mining-production revenue (Genesis Analytics and PwC, 2013) .......... 56
xiv
Figure 12: Distribution of AA's economic impact (Genesis Analytics and PwC,
2013) .............................................................................................................. 57
Figure 13: Local sales and exports (Genesis Analytics and PwC, 2013) ............... 58
Figure 14: Tax revenues paid by AA (Genesis Analytics and PwC, 2013) ............ 59
Figure 15: AAP BEE deal structure ........................................................................ 61
Figure 16: Atlatsa/Bokoni structure (Anglo American Corporate Finance , 2013) .. 61
Figure 17: De Beers’ structure (Anglo American Corporate Finance , 2013) ......... 64
Figure 18: DTC structure (Anglo American Corporate Finance , 2013) ................. 65
Figure 19: Proposed ESOP framework .................................................................. 76
Figure 20: KIO’s share price (Kumba Iron Ore Limited, 2015) ............................... 78
Figure 21: KIO’s earnings-dividend........................................................................ 78
Figure 22: KIO's dividend flow graph ..................................................................... 79
Figure 23: KIO's productivity .................................................................................. 81
Figure 24: Summary of KIO Iron Ore’s performance evaluated against proposed
framework ....................................................................................................... 83
Figure 25: Anglo American Platinum dividend comparison .................................... 85

xv
Figure 26: Anglo American Platinum share price (Anglo American Platinum
Limited, 2015) ................................................................................................. 86
Figure 27: AAP earnings – dividend chart ............................................................. 87
Figure 28: Precious Metals Sector Productivity (Goldman Sachs, 2012). .............. 88
Figure 29: AAP labour productivity profile (Anglo American Platinum Limited, 2008-
2015). ............................................................................................................. 89
Figure 30: Summary of AAP performance evaluated against proposed framework
....................................................................................................................... 90

xvi
LIST OF TABLES
Table 1: Transformation sector charters (Department of Trade and Industry, 2016)
....................................................................................................................... 21
Table 2: Scoring principles for the elements of the charter (Department of Mineral
Resources, 2015) ........................................................................................... 24
Table 3: Top 10 contributors and vendors to BEE transactions (Wu and Moodley,
2009) .............................................................................................................. 31
Table 4: Advantages and Disadvantages of Share Appreciation Plans (Hunt,
2013). ............................................................................................................. 38
Table 5: Advantages and Disadvantages of Share Performance Plans (Hunt,
2013). ............................................................................................................. 39
Table 6: Advantages and Disadvantages of Forfeitable Share Plans (Hunt, 2013).
....................................................................................................................... 40
Table 7: Advantages and Disadvantages of Forfeitable Share Plans (Hunt, 2013).
....................................................................................................................... 41
Table 8: Summary of ESOPs in SA (Motswenyane, 2009). ................................... 50
Table 9: AA business unit ESOPs (Anglo American Corporate Finance , 2013) ... 66
Table 10: KIO’s annual financial results (Kumba Iron Ore Limited, 2006-2015) .... 77
Table 11: AAP annual financial result (Anglo American Platinum Limited, 2008-
2014) .............................................................................................................. 84

xvii
LIST OF SYMBOLS/ACRONYMS
AAP: Anglo American Platinum
AASAF: Anglo American South Africa Finance
AATC: Anglo American Thermal Coal
AEMFC: African Exploration Mining and Finance Company
AIC: Anglo-Inyosi Coal
AMCU: Association of Mineworkers and Construction Union
ANC: African National Congress
ARM: African Rainbow Minerals
ASAC: Anglo South Africa Capital
ASSA: Anglo American South Africa
BEE: Black Economic Empowerment
BBSEE: Broad-Based Socio-Economic Empowerment
BBBEE: Broad-Based Black Economic Empowerment Amendment Act
DBCM: De Beers Consolidated Mines
DBGS: De Beers Group Services
DBSA: De Beers South Africa
DMR: Department of Mineral Resources
DTI: Department of Trade and Industry
DT: Development Trust
DTC SA: Diamond Trading Company of South Africa
ESO: Employee Stock Options
ESOP: Employee share-ownership plan
FDI: Foreign Direct Investment
GSS: Global Shared Services
HDSA: Historically Disadvantaged South Africans
IDC: Industrial Development Corporation
IT: Information Technology
JSE: Johannesburg Stock Exchange
JV: Joint Ventures
KIO: Kumba Iron Ore
LLRT: Lefa La Rona Trust
LSA: Labour Sending Areas
LSA NPC: Labour Sending Area Non-profit Company
MPRDA: Mineral and Petroleum Resources Development Act
NEC: National Executive Council

xviii
NUM: National Union of Mineworkers
NVF: Notional Vendor Funding
PAYE: Pay as You Earn
PWC: PricewaterhouseCoopers
RB Plat: Royal Bafokeng Platinum Limited
RBH: Royal Bafokeng Holdings
RBS: Royal Bank of Scotland
SA: South Africa
SAB: South African Breweries
SIOC: Sishen Iron Ore Company
SPV: Special Purpose Vehicle
USA: United States of America

1
1 INTRODUCTION
Historically, black South Africans have been excluded from the mainstream
economy; and this has resulted in skewed distribution patterns of wealth and
participation in the South African (SA) economy. Through various legislative
instruments, the SA government has endeavoured to reconstruct the economy to
better reflect South African society, and to eradicate some of SA’s social ills.
Poverty, unemployment and inequality continue to bedevil the country; and as such,
the mining industry continues to be a politically charged industry, which is seen by
many as being capable of addressing SA’s developmental goals. Consequently, the
SA government is implementing policies to transfer mining assets to Historically
Disadvantaged South Africans (HDSAs). The government has sought to achieve
these objectives through the introduction of the Mining Charter.
The Mining Charter stems from the Mineral and Petroleum Resources Development
Act of 2002 (MPRDA), where it states in section 2(c) that the objectives of the Act
are to “promote equitable access to the nation’s mineral and petroleum resources –
to all the people of South Africa”. It further states in 2(d), that some of the objectives
are to “substantially and meaningfully expand opportunities for historically
disadvantaged persons, including women, to enter the mineral and petroleum
industries, and to benefit from the exploitation of the nation’s mineral and petroleum
resources” (Government Gazette vol.448, 2002).
The Act further states in Chapter 3, that: “the Minister must ensure the sustainable
development of South Africa’s mineral and petroleum resources within a framework
of national environment policy, norms and standards, while promoting economic and
social development” (Government Gazette vol.448, 2002).

2
1.1 Background and Motivation
In September 2010, the South African government published a Revised Broad-
Based Socio-economic Empowerment Charter (BBSEE) for the Mining Industry. The
revised Charter sought to give clarity to ambiguities existing in the original Charter,
whilst providing more specific targets than its predecessor. With the 2014 review of
the performance of mining companies with respect to the different elements of the
Mining Charter, there has been a great deal of uncertainty in the mining industry with
regard to how companies have performed (Anglo American Corporate Finance ,
2013).
The revised charter calls for “effective ownership” of mining companies by HDSAs.
This is defined in the revised Charter as “the meaningful participation of HDSAs in
the ownership, voting rights, economic interest and management control of mining
entities” (Department of Mineral Resources, 2010).
The regulator and mining companies disagree on performance. Government and the
industry produce different performance results; with government intimating that
industry is overstating their performance, and the industry pointing to government’s
inability to recognise good performance (Anglo American Corporate Finance , 2013).
The mining industry is of the view that the interpretation afforded by the DMR, that
Black Economic Empowerment (BEE) deals completed after 2004, which resulted in
participants disposing their assets, should result in renewed BEE deals is flawed.
This has resulted in the DMR finding certain companies not having complied with
the ownership aspects, due to the current reduced black ownership (Mthimkhulu,
2015).
The industry is of the view that those deals completed with empowered entities
should be included in the ownership calculation as it represents HDSA ownership. It
further ads that the Charter does not require the industry to maintain 26% ownership

3
once it has been achieved. The chamber believes the exclusion of past deals results
in a material misrepresentation of HDSA participation (Mthimkhulu, 2015).
This report will investigate the different models used by companies for compliance
with the ownership aspect of the Charter. The specific focus of this study will be on
the different Employee Share Ownership Plans (ESOPs) adopted and the
performance of this particular instrument.
These ESOPs will be evaluated against a new proposed framework that
commandeers the virtues of a successful ESOP in the South African context. Anglo
American is used as a case study and proxy for the industry; because it is the largest
and most diversified company, with four (4) business units in SA, namely coal,
platinum, iron ore and diamonds.
1.2 Relevance and Importance of the Topic
Over the past decade the mining industry has faced significant challenges relating
to policy uncertainty, labour unrest and escalating costs. Most recently, the
Association of Mineworkers and Construction Union (AMCU) engaged in a 5-
months’ strike. The strike has demonstrated the publicly perceived charge of an
ongoing trust deficit that exists between business, labour and government.
It is important to investigate the reasons behind these events, especially because
mining companies have instated ESOPs – with the expectation that this would
achieve the aims envisaged in the Mining Charter. It is also important to investigate
this topic because of the evolving minerals policy and regulatory environment.
The effectiveness of mining policy needs to be reviewed to assist in further policy
development and implementation. Hence, there needs to be an understanding of the
reasons behind the successes or failures of the current Mining Charter requirements
and identification of opportunities to improve on development polices.

4
1.3 Problem Statement
The Mining Charter was developed to transform the socio-economic landscape of
the mining industry in SA. In principle, most mining companies have expressed
broad support for the objectives of the Charter and the outcomes it seeks to achieve.
However, there have been disagreements between the regulator and the mining
industry with regard to the performance of companies in aspiring to achieve the
objectives of the Charter (Anglo American Corporate Finance , 2013).
The effectiveness of initiatives by mining companies to both comply with Charter
requirements and improve the socio-economic conditions of HDSA’s have received
mixed reviews. ESOPs instituted by mining companies do not seem to be meeting
the expectations of all the important stakeholders, mainly employees, the companies
themselves and the regulator (Anglo American Corporate Finance , 2013).
1.4 Objectives
The objective of the study is to propose a framework to be used by mining companies
when establishing ESOPs. The framework is underpinned by key fundamental pillars
and will encapsulate the main virtues of successful ESOPs applied in a South African
context. This report will evaluate the efficacy of current ESOPs in Anglo American;
and test them against this proposed framework.
1.5 Methodology
The methodology applied in completing this report, in order to address the objectives
of the study was as follows:
Utilise historical and current government literature;
Utilise data from the mining companies; and
Utilising information collected from desktop studies.

5
This report has utilised Anglo American data. Anglo American can be considered as
a proxy for the industry, due to its dominance in the local industry. The report used
current and historical policy documents. Generic literature on ESOPs was also used.
The report also used publicly available data from company annual reports and
research reports discussing this issue.
1.6 Report structure
Chapter 1 introduces the scope of the study; and it provides the reasons for
conducting this research. Chapter 2 provides a literature review on the
empowerment of previously disadvantaged groups in other countries and application
of ESOPs in those profiled countries. Chapter 2 also provides socio-political and
socio-economic conditions that necessitated the empowerment of HDSAs.
Furthermore, the chapter provides a review of ESOPs and the different associated
models.
Chapter 3 focuses on Anglo American and the company’s contribution to SA and the
mining industry. Furthermore, the structure of Anglo American’s empowerment deals
in SA is analysed in Chapter 3. Chapter 4 provides an analysis of Anglo American’s
ESOPs.
Chapter 5 proposes a new approach to ESOPs in the mining industry. A set of
principles is afforded that underpins the proposed framework. Chapter 6 analyses
Anglo American’s ESOPs against this framework. Chapter 7 contains the conclusion
and recommendations of the report.

6
2 LITERATURE REVIEW
2.1 Empowerment of historically disadvantaged groups
internationally
The empowerment of previously disadvantaged groups is a common practice
internationally; and goes by various names in different countries. The tools and
policy instruments adopted to achieve empowerment goals vary from country to
country. Common names of empowerment philosophies include compensatory
discrimination; preferential policies; positive action; and affirmative discrimination
(Martin, 2001).
In his empirical study, Sowell (2004) studied how preferential policies have been
implemented throughout history in various countries. He found that empowerment
policies in some countries have included preferences for minority groups in society,
whilst others were structured to favour majorities.
In other countries these policies where aimed at various classes in those
communities. These group preferences have been applied in countries, such as
India, Britain, Sri-Lanka, Nigeria, Malaysia, Indonesia, Israel, China, Australia,
Brazil, Fiji, Canada, Pakistan, New Zealand, the United States of America (USA)
and the Soviet Union, as well as its successive States (Sowell, 2004). There are a
number of empowerment instruments that can be adopted depending on the nature
of exclusion and envisaged outcome.
An ESOP is an empowerment tool that can be adapted and designed to achieve the
goals of companies, employees and governments. An ESOP is an instrument used
to enable employee ownership in private and public companies. Internationally the
application of ESOPs have taken various architectures highly dependent on
individual company and country circumstances (Gates and Saghir, 1995).

7
ESOPs are implemented for a variety of reasons, including broadening ownership,
enhancing company performance, and facilitating privatization in previously state
owned entities and carrying other reform measure as well as raising money for
corporate purposes (Gates and Saghir, 1995).
2.1.1 Empowerment Policies in the Soviet Union
The Soviet Union was a large multi-ethnic state with an assembly of territories with
diverse interests. It was the first state in the old European architecture to face strong
nationalism and responded with the systematic promotion of its ethnic minorities.
Martin (2001) provided a comprehensive assessment of the manifestation of group
preferences in the large diverse national republics and territories scattered across
the Soviet empire.
The majority of Soviet nationalities were regarded as culturally backward, compared
to the Russians, Ukrainians, Georgians, Armenians, Jews and Germans; who were
grouped as western nationalities. The Union was essentially divided into two regions,
the East and the West (Martin, 2001).
The East had a problem of low literate, uneducated nationals; and so empowerment
policies were skewed toward education and hiring of citizens from the East. In the
West, literate and educated nationals were abundant, with the policy focusing on
language, and establishing the national language as the official state language.
“Economic equalisation”, which referred to the redistribution of economic power,
through preferential policies in education and hiring of the local population was
preferred (Martin, 2001).

8
2.1.1.1 ESOPs in the Soviet Union
ESOPs have been used in the former Soviet Union for empowering employees
utilising previously state owned entities. ESOPs became a popular empowerment
tool because they ensured workers benefited from the privatization programme that
ensued post the collapse of the Soviet Union (Gates and Saghir, 1995).
2.1.2 Preferential Policies in India
India has a large and diverse population, with over a billion people living within its
borders. The country has 6 main ethnic groups, 52 major tribes, 6 major religions,
and 6400 castes and sub-castes – with 18 major languages and 1 600 minor
languages and dialects (Castellino and Redondo, 2006). India has long history with
preferential policies for targeted groups beginning under British colonial rule. India’s
constitution espouses policies designed to assist disadvantaged segments of its
population (Sowell, 2004).
In 1950, the first amendment to the constitution enshrined preferential policies and
programmes for deprived peoples, untouchables, Scheduled Castes and Tribes
(Castellino and Redondo, 2006). There are different policies that predominated;
those aimed at national minorities viewed as less fortunate and policies in the
various states in India that target local groups. Tribal groupings that fell outside the
social mainstream were also included (Sowell, 2004).
Sowell (2004) describes how these policies were implemented with the objective of
raising the socio-economic conditions of these groups through what was termed
“positive discrimination”. These preferential policies were given effect in preferential
hiring, admissions in institutions of higher learning and parliamentary representation
amongst others. All of these were designed to overcome historical discriminatory
patterns.

9
2.1.2.1 ESOPs in India
The use of ESOPs in India is common with varying design practices. Most of the
ESOPs have been implemented in the Information Technology (IT) sector
accounting for 61% of all ESOPs. This practice is particular tor the IT sector due to
recruitment patterns in this sector and the need to retain highly skilled and globally
mobile employees. ESOPs have been used as a retention tool in these companies
(Pathak and Saraswathy, 2011).
2.1.3 Employment Equity in Canada
Renowned scholar Loney (1998) examined how preferential hiring policies placed
race and gender at the centre of Canadian politics. There were various groupings
that were beneficiaries of preferential policies in Canada. They had a specific
concern for those who were said to have experienced double discrimination, notably
women of colour. Aboriginal (First Nation) Canadians have also been the target of
employment equity legislation aimed at addressing the historical injustices that
Aboriginal’s have suffered (Loney, 1998).
2.1.3.1 ESOPs in Canada
ESOPs have been widely used in Canada with some dating back 40 years. These
ESOPs started out in the public sector as a means of rewarding employees for their
efforts, then later expanded to all employers. Some organisations in Canada have
used ESOPs post the financial crisis in 2008 as a job saving mechanism. Examples
of such organisations include Algoma Steel, Spruce Falls and Canadian Airlines
(ESOP Association Canada, 2015).
The Toronto Stock Exchange conducted a study that compared the performance of
companies with ESOPs and those without ESOPs. The study found that companies
with ESOPs had a 123% profit growth over 5 years, 95% higher net profit margin,
24% higher productivity, 92.3% higher return on equity and a 65.5% higher return
on capital (ESOP Association Canada, 2015).
10
2.1.4 Empowerment in Malaysia
Malaysia has a population of approximately 23 million people; and it is considered
to be one of the most prosperous countries in Southeast Asia. As many as 50% of
the population are Malays; 24% are Chinese; and 7% are Indian. In 1948, the
population of colonial Malaysia was 45% Chinese, 43% Malay, and 10% Indian.
Apart from the 3 groups that exist in Malaysia there are other indigenous peoples,
who together make up the Bumiputeras or the “sons of the soil” (Sowell, 2004).
As early as 2500 BC, technologically advanced groupings migrated to Malaysia from
China. These groups of seafarers and farmers encountered and forced the
indigenous populations into the hills and jungles. In later years, the Chinese
predominated in the urban areas and mining districts; whilst the largest numbers of
Indians were found in rubber areas (known for its production of natural rubber)
mainly located on the West coast. Malays mostly lived in the in the Northern region,
outside towns in rural areas (Castellino and Redondo, 2006).
Under British rule, Malaysia instituted policies in favour of the Malay population,
whilst utilising cheap Indian labour to work in the peninsula. The Chinese were left
to govern themselves; and utilised their entrepreneurial skills to get ahead. Chinese
businesses flourished after the British rule; whilst the economic fortunes of the
Malays languished. (Castellino and Redondo, 2006).
Sowell (2004) found that although Malays were more privileged than the Chinese,
through rising incomes in the Chinese population, they managed to earn more than
double the average income of Malays. This produced resentment, which precipitated
demands from the Malay populous for preferential policies. At this time under British
rule, the Malays already enjoyed preferential treatment; with other groups facing
strong restrictions on land ownership and Malay children provided with free
education. Despite these policies, the Chinese continued to outperform the other
ethnic groups.
11
With the exclusion of Singapore (due to their high Chinese population) and other
territories, Malaya became Malaysia. Policies included the political hegemony of the
Malays. This was achieved by constitutional guarantees and by positively weighting
votes in rural areas, where the Malay population mostly predominated (Sowell,
2004).
The Malays wanted to preserve and maintain this preferential treatment for
themselves, and for other indigenous peoples, whilst the Chinese demanded equal
treatment for all citizens. The inter-ethnic strife was resolved, when Malaysia
expelled Singapore in 1965, because of Singapore’s high Chinese population,
leaving Malaysia with a comfortable Malay majority (Sowell, 2004).
According to Sowell (2004), new economic policies emanated where preferences
that existed under government employment were extended to the private sector. The
policy also prescribed that 30% of all corporate shares should be transferred to the
Malay population, during which time they owned no more than 2% of the country’s
corporate equity.
2.1.4.1 ESOPs in Malaysia
The use of ESOPs in Malaysia are not as popular as Employee Stock Options
(ESOs). Many publicly traded companies use this tool for employee compensation
and incentives packages (Bacha et al., 2009).
2.1.5 Empowerment in the United States of America
Anderson (2004), has studied the history of affirmative action in the USA. He
describes how many States in the 1880s promulgated various discriminatory laws
based on race. These States established segregated schools, hospitals, jails and
homes for the impoverished, elderly, deaf – and even for the blind.

12
Preferential policies and practices in the USA have been described as correction,
the forestalling of discrimination, or as promoting diversity. Group preferences
evolved out of laws initially seeking to ban discrimination against individuals (Sowell,
2004). Anderson (2004) found that group preferences had been part of American
national policy for more than 40 years.
Companies in the USA are required to have affirmative action plans that ensure
equal employment opportunities. If companies do not abide by their policy, the
government may bar them from making contracts. Public institutions and universities
must have preferential policies, including those private institutions that accept grants
(Sowell, 2004).
2.1.5.1 ESOPs in the USA
The USA has implement the most number of ESOPs within companies operating in
that country since the first ESOP was created in 1956 (Gates and Saghir, 1995). In
2011 The National Center for Employee Ownership found that 11,300 ESOPs
existed in the USA which covered 13.3 million employees who collectively held
approximately $900 billion in assets (Rodgers, 2011).
The study also found that companies employing ESOPs in the USA experienced
faster growth rates in sales, employment and productivity. These companies also
have higher compensation for employees, higher employee retirement assets and
lower staff turnover (Rodgers, 2011).
2.1.6 Group Preferences in Sri Lanka
In Sri Lanka, simmering discontent and ethnic tensions had resulted in a full scale
civil war, which subsequently divided the island-state. Sri Lanka has seen the two
largest ethnic groups, the Sinhala (74%), who dominate State institutions and the
army, and the Tamil minority (13%), who have resorted to guerrilla warfare, engaging
in a vicious civil war. The minority Muslim population is mostly ignored in the face of
this ongoing feud (Castellino and Redondo, 2006).

13
Historically, the Tamils were located in the northern part of the state, characterised
by a dry climate and devoid of natural endowments. The Sinhalese were located in
the more prosperous region with high rainfall and fertile ground. The Tamils readily
took advantage of the education opportunities provided for by the missionary schools
established (Sowell, 2004).
The Tamil minority was more favourably represented in universities, in the
professions and in businesses than the Sinhalese majority. In 1956, the government
instituted “Sinhala only” as the official language. Declining prospects, both in
education and employment, led to the Tamils protesting, resulting in lethal riots in
subsequent years. Ultimately, a civil war broke out between the two ethnic groups
(Sowell, 2004).
Sri Lanka has enshrined minority rights in the country’s Constitution and legal
system, from the autonomy of regimes and negotiations with the Tamils, to the
reservation of seats in political and governance structures and public institutions
(Castellino and Redondo, 2006).
2.1.6.1 ESOP in Sri Lanka
ESOPs have been used in Sri Lanka in both the private and public sector. In the
public sector these have been used in programmes that have been termed the
“peoplisation programmes” aimed at transferring ownership of state enterprises into
the hands of employees. In the private sector ESOPs have been used to expand
employee ownership with the intended purpose of increasing profitability through
greater employee satisfaction (Pushpakumara et al., 2009).
Pushpakumara et al. (2009) studied the profitability of listed companies in Sri Lanka
that have applied ESOPs. They found that ESOPs where not a significant
determinant of profitability in those listed companies. One reason cited for this
conclusion was the lack of significant share allocations afforded to employees with

14
most shares not afforded voting rights and used as a compensation tool for
employees.
2.1.7 Summary
Empowerment of previously disadvantaged groups has been applied in many
countries, in order to achieve specific political, economic and social outcomes.
Group preferences and preferential policies are common in developed and
developing countries under various names. They have been mostly implemented in
countries where a specific ethnic, religious, or gender group has been discriminated
against historically.
These preferential policies have manifested in employment equity, ownership of
land, protected representation in education and parliament in these countries. In
most of the profiled countries ESOPs have been used as an empowerment tool for
the collective benefit of employees, employers and governments.
South Africa has its own history of discrimination and economic exclusion based on
race. Section 2.2 - 2.7 will focus on empowerment in the South African context, from
a broader economic perspective to a more specific focus of empowerment in the
mining industry. Section 2.8 will discuss ESOPs in terms of their formulation,
structure and application with the advantages and disadvantages of each model.
The various plans adopted by companies in the South African economy will be
profiled.
2.2 SA’s Historical context
SA has a long and well documented history of racial discrimination and economic
exclusion. SA’s modern economy has largely been developed on the back of the
mining industry, with foreign capital turning what was largely an agricultural economy
into a thriving mining center (Nattrass and Seekings, 2010).

15
By 1910, gold mining on the Witwatersrand had transformed SA’s economy into an
industrializing economy, anchored by a strong mineral exporting sector. During that
time, there existed a set of discriminatory policies and institutions, which sought to
protect the incomes of mostly white workers, whilst depressing the wages paid to
unskilled, black employees (Nattrass and Seekings, 2010).
Assessing the history of SA’s modern economy, Natrass and Seekings (2010)
provided an analysis of how the SA economy experienced significant change
throughout the twentieth century. These racially based discriminatory and coercive
strategies they found, excluded unskilled black workers from the institutional
framework that fostered economic prosperity.
These interventions not only ensured high levels of inequality in the short term; but
they also shaped SA’s growth path, such that high levels of inequality persisted over
time. SA’s economic growth model ensured that a minority enjoyed disproportionate
benefits; whilst the rest of the population enjoyed very little and some had no benefits
at all. Despite a growing economy, poverty and chronic unemployment persisted into
the second half of the century (Nattrass and Seekings, 2010).
2.3 Empowerment of HDSA’s
Apartheid denied the majority of South Africans the opportunity to amass capital in
any form, such as land, finance, skills, education and social networks. The need to
promote the drafting of redressing policies was necessitated by the enduring legacy
of this system (Sharma, 2012).
South Africa’s level of income distribution and racial inequality is high and persistent.
South Africa is rated as an upper-middle income country (in terms of GDP per capita
and economic structure), however its social indicators such as life expectancy, infant
mortality and quality of education are closer to those of lower-middle countries. This
is indicative of the levels of inequality within South African society (Van Der Berg,
2010).

16
Empowerment and the pursuit of equality in the South African context gets its
tenants from the South African Constitution. Section 9 (2) of the constitution states,
“equality includes the full and equal enjoyment of all rights and freedoms. To
promote the achievement of equality, legislative and other measures designed to
protect or advance persons, or categories of persons, disadvantaged by unfair
discrimination may be taken” (Constitutional Assembly, 1996).
Post the power sharing arrangement in 1994 the South African government began
to formulate their BEE intentions. These intentions found expression in legislative,
regulatory and policy measures by 2000. At this stage, none of the discussions were
involved with BEE ownership and investments (Cargill, 2010).
Much of the discussions were focussed on employment based affirmative action,
skills training and business development as measures for black empowerment. The
formulation of the BEE strategy began under the auspices of the Department of
Trade and Industry in 2003 (DTI) (Cargill, 2010).
There were a number of BEE deals that were conducted at this time which many
critics believed only benefitted the political and economic elite. BEE investors
garnered a reputation for opportunistic rent seeking and unproductive investment
behaviour without an interest in long term value creation (Cargill, 2010).
Another important criticism levelled against BEE deals at this time was the choice of
empowerment partners. Consortiums involved in these transactions often involved
trade unions, various social groupings and a few politically connected individuals
(Cargill, 2010).
After the strategy was adopted by various stakeholders, parliament soon agreed to
the BEE Act. The various state entities where compelled to formulate and implement
code and sector charters. The codes sought to mitigate some of the unwanted
occurrences from the first round of BEE transactions (Cargill, 2010).
Section 2.4 will delve into the socio-economic conditions of South Africans. It will
depict the wealth profile of the different race groups in SA.

17
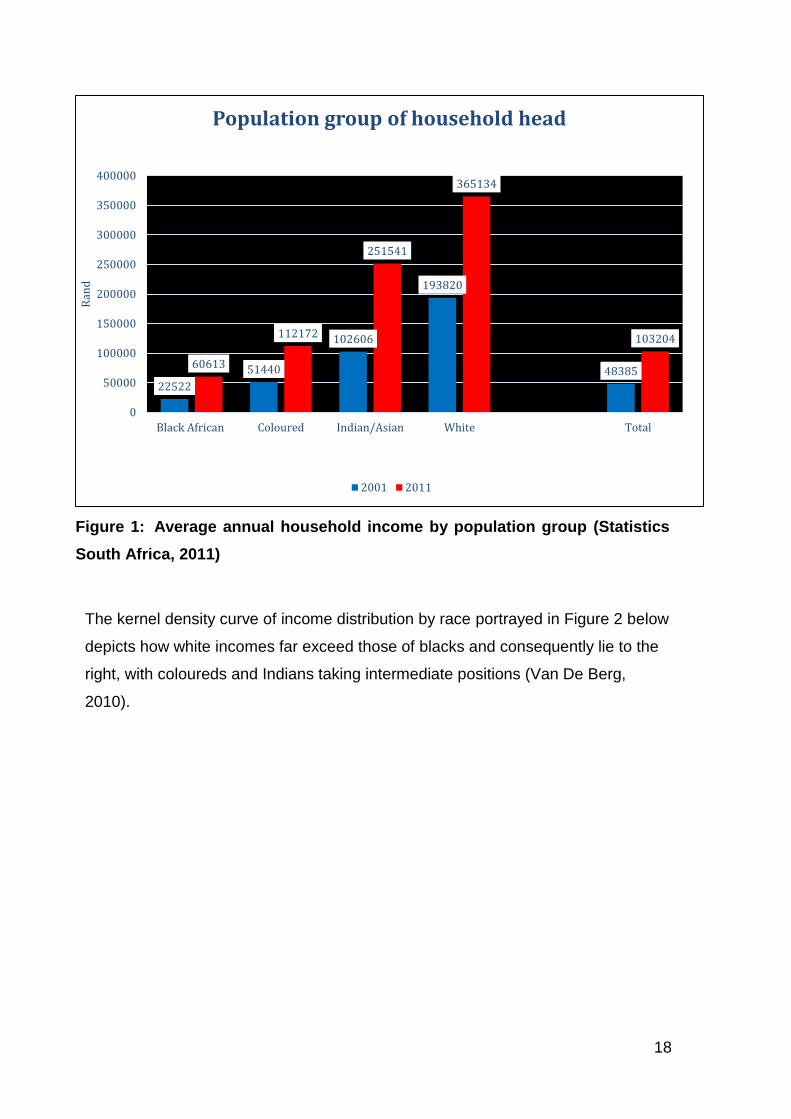
2.4 Current economic status of South Africans
Currently, wealth distribution in SA is skewed toward minority groups; whilst the
majority of the population enjoy modest incomes. Figure 1 below, depicts the
variance in average annual household income in the different ethnic groups. The
average annual income in Black households was R60, 613 in 2011, significantly less
than coloured-headed households at R112, 172. Indian households had the second
highest annual income at R251, 541 in 2011.
White-headed households had the highest average household income at R365, 134
per annum. The average increase in the annual household income for black Africans
was R38, 091 from 2001-2011; for the Coloured community, it was R60, 732; for the
Indian/Asian community, it was R148, 935; and for the White community, it was
R171, 314 (Statistics South Africa, 2011). This indicates growing racial inequality
and further exacerbation the aforementioned economic exclusion. This requires
more effective policy instruments tailored for redress.
18
Figure 1: Average annual household income by population group (Statistics
South Africa, 2011)
The kernel density curve of income distribution by race portrayed in Figure 2 below
depicts how white incomes far exceed those of blacks and consequently lie to the
right, with coloureds and Indians taking intermediate positions (Van De Berg,
2010).
22522
51440
102606
193820
4838560613
112172
251541
365134
103204
0
50000
100000
150000
200000
250000
300000
350000
400000
Black African Coloured Indian/Asian White Total
Ran
d
Population group of household head
2001 2011

19
Figure 2: Kernel Density curve of income distribution by group (Van De Berg,
2010)
South Africa still struggles with income inequality. The average annual income of
white South Africans is significantly higher than that of other groups in the country.
The income disparity is most significant between white South Africans and black
Africans. Section 2.5 outlines some of the policy instruments used to achieve redress
in the broader economy.
2.5 Broad-Based Black Economic Empowerment Sector Charters
The Broad-Based Black Economic Empowerment (BBBEE) Amendment Act, is used
as the policy instrument governing transformation in the broader SA economy. The
Act defines broad-based black economic empowerment as the economic
empowerment of all black people. The definition singles out the empowerment of
women, workers, youth, people with disabilities and people living in rural areas. The
strategies outlined to achieve this include, but are not limited to:

20
Increased management, ownership and enterprise control of productive
assets;
ownership and management of enterprises and productive assets by
communities, workers, co-operatives and other collective enterprises;
human resource and skills development of black people;
equitable representation in different levels in the workforce;
preferential procurement; and
investment in black owned enterprises (Parliament of the Republic of South
Africa, 2013)
The DTI in 2007 introduced the Codes of Good Practice, in terms of which a number
of transformation sector charters were introduced (Department of Trade and
Industry, 2016). The charters are outline in Table 1 below.

21
Table 1: Transformation sector charters (Department of Trade and Industry, 2016)
Sector Charters Effective Date
Highlights
Agri-BEE Charter
28 December
2012
Charter supports land reform by setting equity and land ownership targets. Recognition given for long-term leases under enterprise development and socio-economic development elements. Greenfield ventures, job creation and beneficiation of primary products, and support industrialisation, highly recognised
Financial Sector Charter
26 November
2012
Transformation guidelines for the financial sector. 8 pillars in Financial Sector Charter. Extra element, known as Access to Financial Services, aims to facilitate access to finance for black people and black-owned enterprises.
(ICT) Charter 6 June 2012
30% black ownership to be achieved by entities in the sector. 5% Net Profit After Tax to be spend on enterprise development initiatives. 1.5% of Net Profit After Tax on Socio Economic Development Initiatives
Property Sector Charter
1 June 2012
Charter introduced targets such as measurements for Economic Development used for investment for properties in underdeveloped areas and thus reduce service inequalities and the limited tradability of properties in these areas.
Chartered Accountancy Sector Code
10 May 2011
Chartered Accountancy Profession to increase the number of black people, particularly black women entering the profession.
Integrated Transport Sector Codes
21 August 2009
Comprises eight (8) sub-sectors, which seek to boost one of South Africa's largest infrastructure and Gross Domestic Product (GDP) contributors. Aims to fast-track the implementation of efficient transportation, freight and logistics sectors within the economy. 35% black-ownership target, within a period of five (5) years.
Forest Sector Code
12 June 2009
30% BEE ownership. It further seeks to encourage and support entities to undertake BEE-compliant procurement and job creation initiatives in the sector.
Construction Sector Code
5 June 2009
Advancement of transformation and BEE in the procurement of construction programmes and services. 30% black ownership in the industry over the next 10 years.
Tourism Sector Code
22 May 2009
Seeks to ensure that a significant number of enterprises doing business in the tourism industry are not excluded
Section 2.6 below outlines the empowerment governance framework in the mining
industry.

22
2.6 Empowerment in the Mining Industry
2.6.1 Policy Framework
The mining industries policy framework is governed by the Constitution of South
Africa and the MPRDA. The Mining Charter is provided for in terms of section 100
of the MPRDA as instrument for transformation in the industry (Department of
Mineral Resources, 2015).
Transformation in terms of the Charter is buttressed by a key set of identified pillars.
These pillars are supplemented by the codes of good practice as well as the housing
and living conditions standards as per section 100 of the MPRDA. Figure 3 below
summarises the framework (Department of Mineral Resources, 2015).
The Charter pillars include reporting; ownership; housing and living conditions;
procurement and enterprise development; employment equity; human resource
development; mine community development; sustainable development and growth
and beneficiation (Department of Mineral Resources, 2015). For compliance with the
Charter companies are measured against these pillars.

23
Figure 3: A structure of the transformation policy framework for the mining
industry (Department of Mineral Resources, 2015)
2.6.2 Scoring Principles
Table 2 below sets out the performance measures prescribed by the Charter. These
measures include targets and compliance dates.

24
Table 2: Scoring principles for the elements of the charter (Department of Mineral Resources, 2015)
Element
Scoring Principle
Reporting Percentage of companies that have reported on the Charter requirements
Ownership Category 1: Equal or greater than 26% HDSA but does without all three identifiable beneficiaries i.e. Entrepreneurs, ESOPS &
Communities.
Category 2: Equal or greater than 26% HDSA without trickle cash flow to HDSA.
Category 2+: Equal or greater than 26% HDSA ownership, broad-based, reported trickle cash flow to HDSA.
Category 3: HDSA ownership below 26%.
Housing and Living Conditions 100% conversion of hostels using the following measures: One person per room by 2014. Conversion of hostels into family units by 2014.
Procurement and Enterprise Development
Percentage expenditure from BEE entities by 2014: Capital goods = 40%, Services = 70%, Consumables = 50% and 0.5% of annual spend on procurement from multinational suppliers
Employment Equity HDSA representation: Top Management = 40%, Senior Management = 40%, Middle Management = 40%, Junior Management = 40% and Core Skills = 40% by 2014
Human Resource Development Payroll expenditure on training 2014 target was 5% of total annual payroll (excluding mandatory skills development levies) to be spent on HRD
Mine Community Development Implementation of mine
community project commitments by December 2014
Sustainable Development Percentage implementation of the tripartite plan on mine health and safety, 2014 targets were Environment Management Plans = 100%, Tripartite Action Plan = 100% and Percentage of samples in South African facilities = 100%
Beneficiation Contribution of a mining company towards beneficiation (this measure is effective from 2012)

25
2.7 Empowerment deals in the Mining Industry
2.7.1 Chamber of Mines assessment of members’ empowerment transactions
in the industry
Current empowerment policies are said to encourage redistribution rather than
productive ownership. Where this productive ownership has occurred has not been
by way of policy design, but by chance with inequitable benefit distribution.
Sustainability of shareholding has been extremely difficult, due to high debt levels of
empowerment partners who are also restricted from trading shares (Cargill, 2010).
Meaningful economic participation in relation to HDSA beneficiaries has four key
attributes as described in the Charter which include (Department of Mineral
Resources, 2010):
Identifiable HDSA beneficiaries in the form of BEE entrepreneurs, workers and
communities;
Cash flow to BEE partners throughout the term of the investment and the ability
of BEE entities to leverage equity to facilitate sustainable growth of the BEE
entities;
HDSA participants should have full shareholder rights including participation at
general meetings and exercising voting rights;
And lastly that ownership shall vest within the agreed timeframes.
The Chamber of Mines has recently released a report, which attempted to
demonstrate the economic empowerment of HDSAs in the mining industry, in line
with requirements of the Charter. The report aggregated overall company
performance (members of the Chamber of Mines) based on the DMR’s submissions,
as at 31 December 2014. According to the report:
Chamber of Mines members have reached 38% of meaningful economic
participation by HDSAs, significantly higher than the 26% required by the
Charter;

26
Numerous commodity groups have all achieved, or surpassed, ownership targets
for HDSA as outlined in the Charter: Coal achieved the highest ownership
percentage at 47.2%; whilst Platinum-Group Metals (PGMs); manganese, iron
ore chrome and gold where all above 27.2% with the exception of diamonds at
26%
63% of the HDSA population that has benefited are BEE entrepreneurs, with
communities and employees at 22% and 15% respectively.
Figure 4 depicts the ownership patterns according to the commodity segment, and
the beneficiary category. From Figure 4, it is clear that the majority of beneficiaries
from the deals completed are BEE entrepreneurs. This has attracted criticism with
regard to the structure of the deals, in that they benefit only a few individuals, rather
than a larger pool.

27
Figure 4: Portion of ownership of mining industry transferred to HDSA (Wu and Moodley, 2009)
When assessing the total value of reported empowerment transactions from 2004-
2008, the mining industry had its highest transactions in 2007 not only in value but
also in volume terms. More than R40 billion in transaction value was amassed
underlined by 34 transactions. Figure 5 below depicts the transaction value through
this period (Wu and Moodley, 2009).
0.00%
5.00%
10.00%
15.00%
20.00%
25.00%
30.00%
35.00%
40.00%
45.00%
50.00%
Coal Iron Ore ManganeseOre
Diamonds PGM Gold Chrome Total SAmining
industry
Employees BEE enterprenuersCommunities Industry target

28
Figure 5: Value of transactions in the mining sector (Wu and Moodley, 2009)
Figure 6 below depicts the increase in value of the Johannesburg Stock Exchange
(JSE’s) resources index from 2005 reaching a peak in mid-2008, then declining in
the latter part of 2008. This trend in the Resource 20, which denotes the performance
of mining companies on the JSE is similar to the trend denoted in figure 5 (Wu and
Moodley, 2009).
7954319673
14269006858
18838422267
40021626013
20843304355
0
5E+09
1E+10
1.5E+10
2E+10
2.5E+10
3E+10
3.5E+10
4E+10
4.5E+10
2004 2005 2006 2007 2008
Value of Transactions in the Mining Sector

29
2.7.2 Transactions involving employee schemes and community trusts
From 2004-2008, only 7% of the mining sector transactions during that time involved
ESOPs; and only 10% involved community-ownership schemes, as shown in Figure
7 below. Lack of meaningful participation from employees in the schemes, is
indicative of the popular models for ownership transactions that have been adopted
in the industry. These transactions were not broad based resulting in limited benefits
for employees and other stakeholders (Wu and Moodley, 2009).
Figure 6: Resources 20 index (Financial Times, 2016)

30
Figure 7: BEE transactions involving employees and communities (Wu
and Moodley, 2009)
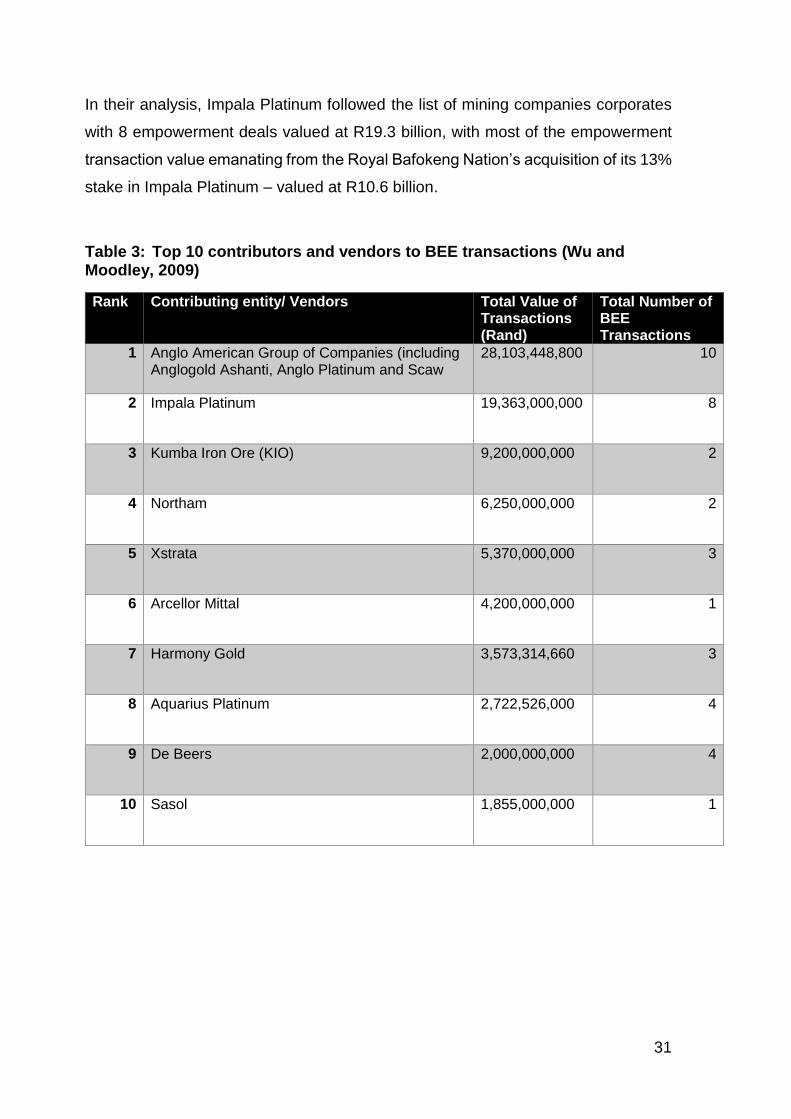
2.7.3 Company transactions
Table 3 below represents some of the notable empowerment transactions
conducted in the mining industry over the past decade. Wu and Moodley (2009)
found that Anglo American and its subsidiaries completed the largest number of
empowerment deals in the industry, with 10 reported transactions with a combined
value of approximately R28 billion as at December 2009.
5%
7%
11%
6%5%
7%
5%
20%
18%
9%
0%
10%
0%
5%
10%
15%
20%
25%
2004 2005 2006 2007 2008 Average
% O
wn
ersh
ip
Transactions involving Employees Transactions involving Broad-based or Community
31
In their analysis, Impala Platinum followed the list of mining companies corporates
with 8 empowerment deals valued at R19.3 billion, with most of the empowerment
transaction value emanating from the Royal Bafokeng Nation’s acquisition of its 13%
stake in Impala Platinum – valued at R10.6 billion.
Table 3: Top 10 contributors and vendors to BEE transactions (Wu and Moodley, 2009)
Rank Contributing entity/ Vendors Total Value of Transactions (Rand)
Total Number of BEE Transactions
1 Anglo American Group of Companies (including Anglogold Ashanti, Anglo Platinum and Scaw
28,103,448,800 10
2 Impala Platinum 19,363,000,000 8
3 Kumba Iron Ore (KIO) 9,200,000,000 2
4 Northam 6,250,000,000 2
5 Xstrata 5,370,000,000 3
6 Arcellor Mittal 4,200,000,000 1
7 Harmony Gold 3,573,314,660 3
8 Aquarius Platinum 2,722,526,000 4
9 De Beers 2,000,000,000 4
10 Sasol 1,855,000,000 1

32
2.7.4 Summary of benefits to beneficiaries
The Chamber of Mines asserts that over the 12-year period that the Mining Charter
has been in effect, a minimum of R47 billion in dividends has accrued to HDSA
participants (BEE entrepreneurs, employees and communities), which in their
analysis was found to represents 19.6% of the dividends paid over the same period
by Chamber of Mines members (Chamber of Mines South Africa, 2015). Figure 8
provides a breakdown of the transactions and the accrued benefits.
Figure 8: Meaningful economic participation of HDSA (Chamber of Mines South Africa, 2015)
At the lowest point of the commodity cycle, the net value of the transactions was
R155 billion according to the Chamber of Mines; whilst at the high point of the cycle,
the value of the transactions totalled R282 billion. These two points were highly
dependent on company share price performance.
The initial transaction value of all empowerment deals, of members in the Chamber
of Mines was R116 billion with an initial debt of R64 billion. The completed
transactions have generated significant returns for participants with a net value of
R159 billion (Chamber of Mines South Africa, 2015). For a complete breakdown of
116
6452 47
155
282
159
0
50
100
150
200
250
300
Initialtransaction
value
Initial debt Initial net value BEE dividendreceived
(a) Net valuebased on LOWpoint of cycle
valuation(25%)
(b) Net valuebased on HIGHpoint of cycle
valuation(46%)
(c) Net valuebased on Co.submissions
(26%)
Ran
d B
illi
on
s

33
the BEE transactions that have taken place in the various commodity groupings, see
Appendix 1.
2.7.5 Assessment by The Department of Mineral Resources on the industry’s
performance in relation to the Charter
The assessment conducted by the department in 2009 outline weaknesses in
company performance as per the Charter requirements in relation to HDSAs. This
included a conspicuous lack of transfer of ownership, access to funding,
indebtedness, limited flow of dividends to HDSAs to service loan agreements,
onerous transaction conditions and financially cumbersome deal structures.
According to the assessment, BEE ownership was concentrated in a few black
beneficiaries. In 2009 aggregated ownership was at 9% against a target of 15%
(Department of Mineral Resources, 2015).
The 2014 assessment of the Charter concluded that although mining companies
have reported to the department to have met or exceeded the 26% HDSA ownership
target, meaningful economic participation by beneficiaries remains elusive. The
assessment further concluded that the number of broad based empowerment
transactions involving both communities and ESOPs were low. Results from the
department’s assessment also found limited impact in terms of beneficiaries
realising economic benefits (Department of Mineral Resources, 2015).
2.7.6 Summary
The impacts of most BEE deals have not been broad-based; with 63% of
transactions from Chamber of Mines members benefitting BEE entrepreneurs with
communities and employees at 22% and 15%. The value and number of
transactions have coincided with the rise and fall of the JSE, making the deals
expensive – due to elevated stock prices in favourable market conditions. Results
from the Department of Mineral Resources assessment found limited impact in terms
of beneficiaries realising economic benefits.

34
One of Anglo American’s well known former CEO’s Clem Sunter has said that one
of the solutions to the current endemic problems in the mining industry is for greater
participation by employees in companies. This can achieved through the use of
ESOPs to ensure income inequality is reduced in South Africa, he added (Visser,
2004).
Sunter, who was one of the original proponents of the idea is of the opinion that
ESOPs have never been adequately explored. He regards the implementation of
ESOPs as a fairer way of implementing BEE as it relates to ownership of capital. As
an experienced previous executive in Anglo American, Sunter believes ESOPs are
a better alternative to the BEE deals that have been completed, often making a few
well connected black individuals wealthy, whilst not being sure of the value ad these
individuals make to the company as passive investors. Often their knowledge of the
industry in which they participate is limited (Sunter, 2012).
With this background in mind, Section 2.8 will focus on ESOPs.
2.8 ESOPS
Traditionally the relationship between company owners, management and labour
has been fractious and at times dysfunctional. This dynamic has made labour
relations challenging, and not geared toward making organizations reach their full
potential. ESOPs establishes unity of interests between management and labour,
owners and employees (Rosen et al., 2005).
Today’s business environment is characterised by fast changing technological
advancements and requires a workforce that is engaged and responsive, qualities
that are too often stifled in traditional organisations. “The organisation that permits
participation ultimately produces individuals who are responsible to participate”
(Beirne, 2006).

35
2.8.1 The need for ESOPs
Postlethwaite et al. (2005) have found that those companies that have embedded
ESOPs in their business model, have performed better than those have not through
productivity gains, higher innovation, superior customer loyalty, and improved talent
management.
As Postlethwaite et al. (2005) established, this is mainly because those ESOPs that
have prospered combine three critical factors that ensured the success of the
scheme. These comprise financial incentives, employee-involvement mechanisms,
and the instilling of a culture of ownership.
Most companies with employee share-ownership schemes already possess these
attributes as single entities. The best results are achieved through the combination
of all 3 virtues. Where the company is completely owned by employees these
attributes exist (Postlethwaite et al., 2005).
When analysing the failures of some ESOPs, Postlethwaite et al. (2005) found how
some employers make the mistake of simply assessing their business and the
sector, reviewing their best practice, and concluding that the secret is simply
employee-share ownership and good communication. They would then emulate that
part which they thought was the most important, or just the part that they admire.
However, as a growing number of businesses have discovered, it is the whole
package that works best.
An employee’s ability and opportunity to contribute to decision making,
supplemented by meaningful financial incentives, is that which creates a conducive
environment for employees to disseminate information about process failures and
improvement opportunities. Companies with successful ESOPs create mechanisms
for employees’ contributions to be heard, and timeously acted upon. This is in
contrast to a working environment that is bureaucratically centralised in its structure
and working culture (Postlethwaite et al., 2005).

36
Postlethwaite et al. (2005) discovered a strong negative relationship between a
company’s ability to innovate and a centralised bureaucratic organisation. This
facilitates adverse behaviours and attitudes amongst employees; stifling new ideas
and innovation as well as resisting suggested improvement methods from
management.
Those companies that offered broad based ESOPs far outperformed these
companies. From their study, Kruse concluded that while broad based ESOPs are
not a guarantee for improved performance and employee attitude, it does help on
average to improve productivity, profitability, organizational commitment and other
employee attitudes (Rosen et al., 2005).
2.8.2 How ESOPs are structured
A company can create a trust fund for employees, which would serve as a holding
structure for an ESOP. The company would then have the option of either
subsidising the trust with funds to purchase shares, or contribute shares directly to
the plan. The company could also provide guarantees allowing the trust to borrow
money to purchase shares. A combination of all three can also be adopted (The
National Center for Employee Ownership, Undated). Employers can also afford
shares directly to employees.
Usually, employees are exempt from paying taxes on their contributions until they
receive the shares or proceeds from the ESOP; but when they sell, they are then
liable for taxation; alternatively, this may be the case when they leave the company
or retire. Once this has occurred, the employee has the option to either sell the
shares on the market, sell them back to the company, or alternatively to keep the
shares (The National Center for Employee Ownership, Undated).

37
2.8.3 Various ESOP models
ESOPs vary in architecture depending on the desired outcome. Success measures
such as productivity improvements, increased dividend flows, an engaged and
responsive labour force, lower operating costs, higher quality returns are but some
of these measures (Hunt, 2013). The different variations are detailed below.
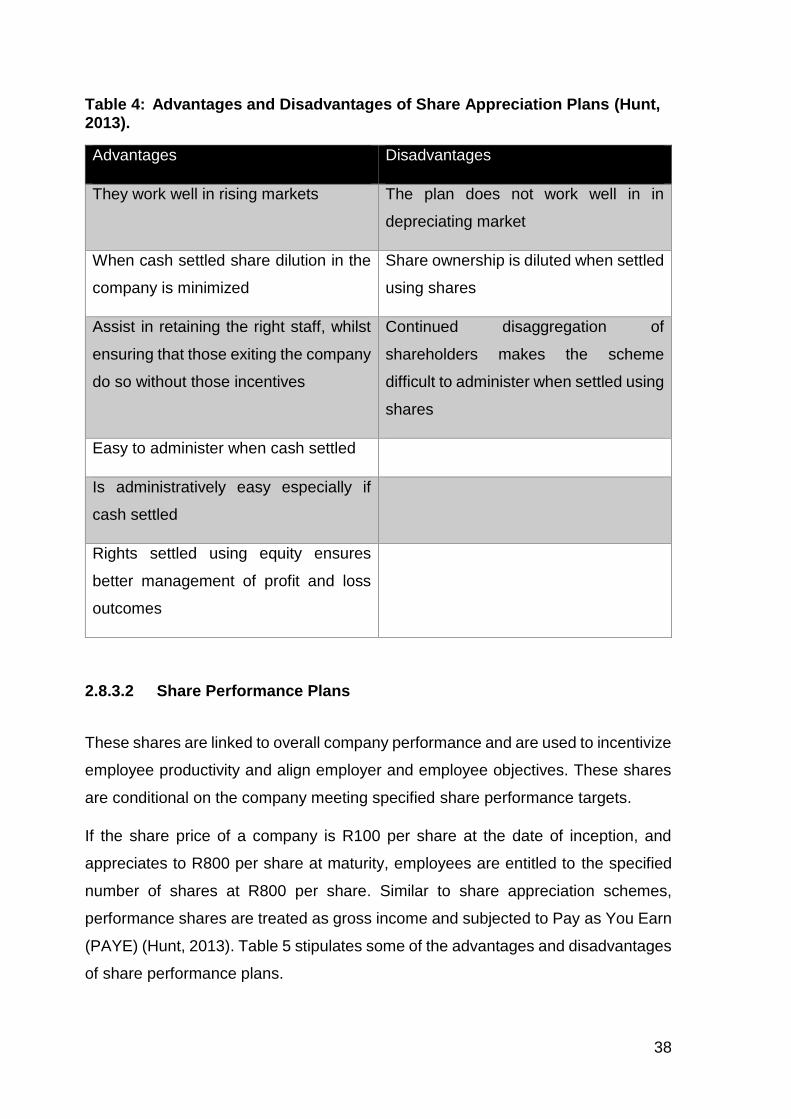
2.8.3.1 Share Appreciation Rights
One of the more common structures used are share appreciation rights. These rights
give employees the option to cash out, or get payment in shares or a combination
or both on any appreciation in share value of the concerned entity.
If a specific entity has a share value of R100 per share at the inception of the
scheme, and a value of R800 during the vesting period, employees are entitled to
R700 in cash or R700 worth of shares. These shares are accounted for in employee
remuneration as gross income in the year where the scheme matures (Hunt, 2013).
Table 4 below contains some of the advantages and disadvantages of this type of
scheme.
38
Table 4: Advantages and Disadvantages of Share Appreciation Plans (Hunt, 2013).
Advantages Disadvantages
They work well in rising markets The plan does not work well in in
depreciating market
When cash settled share dilution in the
company is minimized
Share ownership is diluted when settled
using shares
Assist in retaining the right staff, whilst
ensuring that those exiting the company
do so without those incentives
Continued disaggregation of
shareholders makes the scheme
difficult to administer when settled using
shares
Easy to administer when cash settled
Is administratively easy especially if
cash settled
Rights settled using equity ensures
better management of profit and loss
outcomes
2.8.3.2 Share Performance Plans
These shares are linked to overall company performance and are used to incentivize
employee productivity and align employer and employee objectives. These shares
are conditional on the company meeting specified share performance targets.
If the share price of a company is R100 per share at the date of inception, and
appreciates to R800 per share at maturity, employees are entitled to the specified
number of shares at R800 per share. Similar to share appreciation schemes,
performance shares are treated as gross income and subjected to Pay as You Earn
(PAYE) (Hunt, 2013). Table 5 stipulates some of the advantages and disadvantages
of share performance plans.

39
Table 5: Advantages and Disadvantages of Share Performance Plans (Hunt, 2013).
Advantages Disadvantages
Performance plans work well in
appreciating and depreciating markets
Free share allocation creates dilution
effect
The scheme imposes performance
criteria on beneficiaries
Beneficiaries may become disillusioned
if performance criteria is arduous
The scheme is easy to implement Implementation becomes complex with
increasing shareholder base
Profit and loss metrics’ are easily
managed
2.8.3.3 Forfeitable Share Plans
Forfeitable share incentive plans are plans structured to afford employees free
shares on condition that they comply with specific company provisions. In the event
where these conditions are contravened, the shares revert back to the company or
special purpose vehicle chosen.
Conditions imposed on this scheme may be performance related or employment
period related. Beneficiaries of the scheme receive dividends and profit from share
appreciation. These structures may also be structured such that they are cash
settled at maturity performance, shares are treated as gross income and subjected
to PAYE (Hunt, 2013). Table 6 contains some of the advantages and disadvantages
of this plan.

40
Table 6: Advantages and Disadvantages of Forfeitable Share Plans (Hunt, 2013).
Advantages Disadvantages
Performance plans work well in
appreciating and depreciating markets
Free share allocation creates dilution
effect
The plan is flexible and provides a
capability impose performance criteria
Beneficiaries may become disillusioned
if performance criteria is arduous
Profit and loss metrics’ are easily
managed
Implementation becomes complex with
increasing shareholder base
2.8.3.4 Deferred Annual Bonus Plans
These plans include the deferral of beneficiaries’ annual bonus payments towards
purchasing shares. Most of these plans have been used as successful retention
strategies performance shares are treated as gross income and subjected to PAYE
(Hunt, 2013). Table 7 contains some of the advantages and disadvantages of this
plan.

41
Table 7: Advantages and Disadvantages of Forfeitable Share Plans (Hunt, 2013).
Advantages Disadvantages
The plan has good retention elements Participation rates from employees
tends to be low
Ideal for investors for employee
purchased shares
May become disincentive if
performance conditions too arduous
Performance conditions may be
imposed on the plan
Gross employee earnings may be
significantly increased if bonuses
increased to facilitate deferral
Provides ability to manage short and
long term performance
2.8.3.5 Broad-based share ownership plan
Broad based share incentive plans are commonly implemented to attract and retain
specific qualifying individuals to the company. The plan not only assist in aligning
the financial interests of the company but also can be used to meet specific
regulatory requirements. To qualify as a broad-based share incentive plan in terms
of the income tax Act, the plan must comply with the following requirements:
Participants must directly purchase shares in the company
Employees may only be restricted from selling shares for 5 years
The combine market value of the shares may not exceed R50, 000 (Hunt,
2013).

42
2.8.4 Characteristics of successful ESOPs
Successful ESOPs are buttressed by a shared mind-set, which is anchored by 3
fundamental pillars. The first of these pillars is equity, the second is culture, making
people feel and think like owners, and the third is a common understanding of key
business disciplines and a common commitment to pursuing those (Rosen et al.,
2005).
2.8.4.1 Equity Ownership
Entities that afford organizations capital traditionally own those businesses, whilst
management is accountable to these owners. If the company does not succeed, the
capital providers carry all the risk in the business, whilst claiming all the earnings
and returns if the entity succeeds. These capital providers are concerned with the
success and prosperity of the organization (Rosen et al., 2005).
The challenge these owners face is pursuing profits and growth with a workforce
that is not aligned with the goals and aspirations of the organisation. Companies
have tried addressing this challenge with other tools such as performance reviews,
motivational speeches and team building exercises in hopes that employees will
inspired to perform better. Employees are incentivized with bonuses, salary
increases, promotions with the expectation and employees will align with company
objectives (Rosen et al., 2005).
The confrontational relations between labour and management has created an
environment where strike and lockout are used as tools to advance individual
interests. These interactions are supported by the premise that collective labour is
willing to disadvantage the company in order to further their own individual goals
(Rosen et al., 2005).

43
The principle underlying ESOPs is that employees are incentivised through
ownership to pursue long term success of the business. The ability to garner support
for the ESOP when it comes to equity is dependent on the amount of equity the
organization provides. Insubstantial and intermittent share offerings will unlikely
make recipients recalculate their economic interests (Rosen et al., 2005).
2.8.4.2 Ownership Culture
Organizational culture has transformed over time, previously characterized by a
command and control ethos where employees did as they were told. Employees of
these organizations were part of a rigid hierarchy where individuals could not
contribute to decisions made. The rigid structures was further accentuated by dress
code, hours worked, freedom to come to and go, pay and bonuses, parking spaces
and other indications of power and status (Rosen et al., 2005).
To establish an ownership culture organizations need to eliminate the ‘us’ versus
‘them’ mentality that has plagued many organizations. An approach that could be
used to mitigate this behavioural framework is to constantly communicate with staff.
This entails sharing information about the organization relating to its operations
including much of the financial data to which investors and analysts are traditionally
privy to and that senior managers use to run the business (Rosen et al., 2005).
Employees need to get a sense that are aware of operational financials that
managers use to make decisions. A second approach would be source the opinions
of employees when making important decisions. This does not in any way advocate
for people voting on everything and making every decision. This approach seeks to
engender a sense of collective decision making on those decisions that affect the
whole company (Rosen et al., 2005).

44
2.8.4.3 Business Discipline
In organizations that have successfully implemented ESOPs, employees are
concerned with, and drive the business disciplines that help their company do well.
Employees are taught their companies’ key business disciplines. These successful
organizations are staffed with employees who understand how to contribute to
improving performance and how to measure the results. Employees in these
organizations are engaged and have managed to successfully embed the principle
of driving business discipline by doing the following:
Identifying critical performance metrics;
Outlining performance objectives and targets;
Sharing ideas on how to improved performance;
Continuously monitoring and tracking those critical performance metrics;
Celebrating and rewarding wins (Rosen et al., 2005).
2.8.5 Benefits of Establishing an ESOP
ESOPs can be used as a vehicle to facilitate the sale of the shares over a period of
time, whilst ensuring employees still retain the capability to sell their shares to other
employees when parting ways with the company. Apart from incentivising the
desired behaviours by employees in an organisation, ESOPs can form part of an
employee’s company benefit package (Voison and Volaw, 2007).
Effective ESOPs create a working culture where an employee’s individual enterprise
is stimulated which ultimately leads to improved productivity. Employees in these
organisations, because they are empowered as owners of the business, tend to be
more entrepreneurial when solving problems. They possess more creative ideas for
solving problems in the organization. Consequently, these employees take
ownership of their decisions and exercise more discretion when carrying out tasks
(Postlethwaite et al., 2005).

45
According to Postlethwaite et al. (2005), these factors foster an environment where
employees are motivated and empowered to act in the best interests of the
organization – via a collective voice.
Gamble et al (2001) studied the correlation between job satisfaction and improved
company performance. Employees that were beneficiaries of ESOPs were found to
have a higher job satisfaction which resulted in improved company performance.
The study also investigated the employment setting of these companies. Working
conditions in these organisations where characterised by the following:
Suitable working conditions
Ability of employees to participate in the decision making process
Employees displayed an intimate knowledge and understanding of
company’s key business drivers
Employers and employees were aligned in their goals (Gamble et al., 2001)
There are common traits found in companies that encourage ESOPs. These
companies are more innovative and stable, with a staff turnover that is lower than
companies without ESOPs. Companies with effective ESOPs poses faster
employment growth and higher rates of survival (Rosen et al., 2005).
2.8.6 Criticism of ESOPs
Transforming employees into owners reduces the overall company costs. This in
part is due to the fact that as employees become more aligned to company owners,
the overall company cost is reduced through productivity gains and improved
company performance. However, this may create corporate governance failures as
the line of separation between ownership and control becomes blurred (Mitchell et
al., 2005).

46
Abdullah (2006) studied the implementation of ESOP and its effect on corporate
governance. He found that the application of ESOPs are not associated with a return
on assets, however he did find a negative correlation between the use of ESOPs
and corporate governance.
Some of the strongest weaknesses of ESOPs is the lack of excitement generated
within the company at the different levels. Those charged with the responsibility of
implementing ESOPs in companies, often treat ESOPs as just another benefit or
financial tool. These include company owners, human resource practitioners and
finance professionals (Rosen et al., 2005).
Managers, often responsible for business execution are not encouraged to run the
business differently. Employees are not educated and informed about what is meant
to be an owner, and are neither expected to change their approach to their jobs. Due
to the erroneous application of ESOPs, companies are unable to tap into the
immense energy, intelligence and extra effort throughout the organization required
to meet today’s global business challenges (Rosen et al., 2005).
Criticism levelled at ESOPs include that they are highly dependent on tax breaks
and favourable accounting treatment. Critics have claimed that ESOPs cannot, as
independent structures, lead to improved company performance (Rosen et al.,
2005).
Winther et al. (1997) concluded that ESOP implementation does not necessarily
result in increased profits. They focused on 110 companies with the key areas of
focus being on productivity and profitability. The results of the study was that ESOPs
had little or no impact on profits, however the analysis highlighted increased
productivity.

47
2.8.7 Financing an ESOP
In most cases ESOPs are funded by employers through structured loan facilities to
the designated holding structure of the ESOP. The loans mostly have favourable
repayment conditions in lieu of forgoing dividends used to repay the loan. When a
company has a strong balance sheet, on occasion, ESOPs may be directly funded
by the company and the debt owed by the holding structure settled outright (Voison
and Volaw, 2007).
There are other common financing instruments used to finance ESOPs, such as
bank loans where the employer acts as a guarantor. Other funding mechanisms
include call-option agreements, where the holding structure may only purchase
shares from those financial institutions that originally financed the purchase of the
shares (Voison and Volaw, 2007).
2.8.8 ESOPs in other parts of the world
The USA has for many years led the way with regard to ESOPs with other countries
following suit with application of these principles in their companies. The United
Kingdom, through many of their large corporations have some kind of broad
ownership plan, whilst in Ireland large energy companies offer ESOPs. Other
European countries that offer similar arrangements include Spain and Italy, offering
worker co-operatives in their important sectors (Rosen et al., 2005).
ESOPs have been used by other countries to privatize state owned entities,
countries include Poland, Russia, Slovenia and Hungary. China’s government has
allowed employees to buy shares in enterprises it owns. ESOPs have been used in
other countries such as Australia, Egypt, Jamaica and Kenya (Rosen et al., 2005).
Freeman and Knoll (2008) conducted an empirical study using 10 years of data from
companies in the USA that have implemented ESOPs. Their study showed that the
implementation of ESOPs led to an average increase in productivity and profitability
that benefited both employees and employers. Their study found that ESOPs

48
accounted for $14 billion annually in equity contributions, plus $3 Billion attributable
to increased job stability, as well as non-qualified benefits of greater work
satisfaction and reduced stress (Freeman et al., 2008).
Jones et al. (2006) studied a large data set from publicly listed entities in Finland
and concluded that the implementation of ESOPs in organisations improved
company performance. Most companies in the UK have used ESOPs for the
purpose of tax incentives as the main reason for implementing ESOPs (Robinson et
al., 2005).
ESOPs have been implemented successfully by many international companies in
many different sectors. Construction companies, banks, insurance companies,
textile manufacturers, architectural firms, health care providers, hotels and resorts
and many other industries have successfully employed ESOPs (Rosen et al., 2005).
2.8.9 Summary
In summary, ESOPs enable extensive employee ownership; and they have the
ability to foster a sense of individual enterprise that fuels productivity in companies
that have imbued a culture of ownership amongst their employees. ESOPs generally
contribute positively to company performance; and they provide a stable and
dynamic working environment, when administered effectively. ESOPs cannot be
implemented in isolation; but they require a combination of factors to make them
successful.
There are different ESOP structures and funding models that can be adopted
depending on the desired outcome. Section 2.9 seeks to give a broad summary of
ESOPs conducted in SA, and the different structures adopted.

49
2.9 Overview of ESOPs in South Africa
A number of companies have implemented ESOPs in their organisations. Table 8
below contains a summary of ESOPs across multiple companies operating in
different industries and all adopting a company specific model.
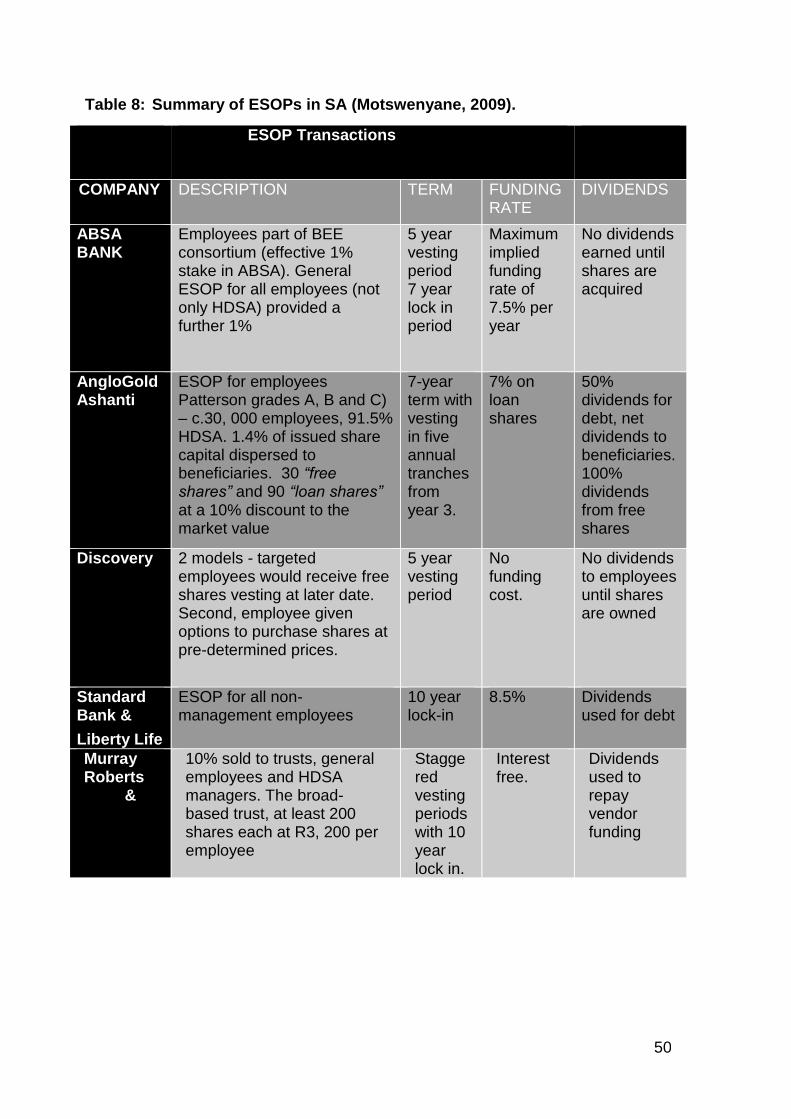
50
Table 8: Summary of ESOPs in SA (Motswenyane, 2009).
ESOP Transactions
COMPANY DESCRIPTION TERM FUNDING RATE
DIVIDENDS
ABSA BANK
Employees part of BEE consortium (effective 1% stake in ABSA). General ESOP for all employees (not only HDSA) provided a further 1%
5 year vesting period 7 year lock in period
Maximum implied funding rate of 7.5% per year
No dividends earned until shares are acquired
AngloGold Ashanti
ESOP for employees Patterson grades A, B and C) – c.30, 000 employees, 91.5% HDSA. 1.4% of issued share capital dispersed to beneficiaries. 30 “free shares” and 90 “loan shares” at a 10% discount to the market value
7-year term with vesting in five annual tranches from year 3.
7% on loan shares
50% dividends for debt, net dividends to beneficiaries.100% dividends from free shares
Discovery 2 models - targeted employees would receive free shares vesting at later date. Second, employee given options to purchase shares at pre-determined prices.
5 year vesting period
No funding cost.
No dividends to employees until shares are owned
Standard Bank &
Liberty Life
ESOP for all non-management employees
10 year lock-in
8.5% Dividends used for debt
Murray Roberts &
10% sold to trusts, general employees and HDSA managers. The broad-based trust, at least 200 shares each at R3, 200 per employee
Staggered vesting periods with 10 year lock in.
Interest free.
Dividends used to repay vendor funding

51
COMPANY DESCRIPTION TERM FUNDING RATE
DIVIDENDS
Impala
Platinum
c.3% to SA employees in Patterson A, B & C grades and any new employees who join within two years.
10 years
interest free capital
Dividend post expenses, taxes and debt repayment.
Medi-Clinic Non-management employees, 4% stake in Medi-Clinic’s 15% BEE transaction.
10 year lock in period
Not disclosed
20% div. For 10 years
Edcon Employees were sole beneficiaries of 10.66%. option structured plan with periodic cash payments
Vesting period of 3 and 6 years
26% for shares vesting in 3 years and 12.3% for shares vesting in 6 years
Dividends used to settle share funding
FirstRand 3.5% through BEE transaction, Free shares to HDSA, at R6, 000 with remainder used to incentivize and retain targeted employees.
4-10 year vesting. 10 year lock-in
80% prime less dividends received
Dividends are used to service debt
Distell Employees owned 45% of the 15% BEE deal. Employees not involved in separate ESOP but form part of consortium
8 – 10 years
Inflation plus 7% less dividends.
Dividends used to fund the vendor loan
Group 5 4.5% to ESOP comprised a management scheme (87%) and a broad-based scheme amounting to R2, 000 per employee.
2 – 4 years None (interest rate was set equal to the dividend yield)
No dividends till debt settled
Mutual &
Federal
2 components to ESOP – free shares and share options
4– 6 years vesting
5– 8 year lock-in
Interest free
Dividends on free shares

52
2.10 Summary
Chapter 2 provided a broad overview of empowerment applications around the world
and the promotion of preferential policies aimed at historically disadvantaged
groups. These groups have been previously discriminated against on the bases of
their ethnicity, race, culture, language and various other descriptions. SA has a
history of discrimination on the bases of race with policies aimed at economic
exclusion of black South Africans.
The South African government has enacted a number of transformation policy
instruments in an attempt to empower HDSAs. For the broader economy these are
governed under the BBBEE Amendment Act, whilst in the mining industry these are
governed under the MPRDA, given effect in the Mining Charter. The Charter has
several pillars against which transformation is measured. This report focusses on
the ownership aspects of Charter.
When applied correctly, ESOPs have proven advantageous to companies. The
application of ESOPs in the mining industry will be investigated. Anglo American will
be used as a proxy for the mining industry, with chapter 3 outlining the company’s
impact and presence in the industry.

53
3 ANGLO AMERICAN
3.1 Anglo American as a proxy for the mining industry
In 2013, Anglo American recognised the need to more accurately measure and
articulate the company’s economic and developmental impact in the South African
economy and society as a whole. Assisted by PricewaterhouseCoopers (PwC) and
Genesis Analytics, Anglo American produced a report quantifying its impact in the
industry and the broader economy.
This was necessitated by the perception that mining companies were not
contributing concomitant benefits to South African society in line with those reaped
by the company itself from SA’s mineral endowment. Figure 9 outlines the direct
economic impact of Anglo American in the South African economy. The study found
that Anglo American employs 82 000 people in South Africa, and that it had directly
contributed R60 billion to the South African economy in 2012.
The company accounted for approximately 2% of Gross Domestic Product (GDP);
comprising wages and profits generated by the company. Apart from the direct
impacts the company imparts in the economy, there were corollary indirect and
induced impacts. The indirect impacts are those produced by the company’s
spending in the economy, thereby stimulating further spending by suppliers,
contractors, etc. According to the study 126, 000 jobs and R41 billion were realised
from these indirect impacts in 2012 (Genesis Analytics and PwC, 2013).

54
The induced impacts are those produced by employees spending their money in the
economy, which in turn produces jobs downstream. A total of 176, 000 jobs and R49
billion were the result of the induced impacts. In total, approximately 384 000 jobs
and R150 billion resulted from Anglo American’s existence in South Africa. This
equated to 3% of employment and 5% of GDP (Genesis Analytics and PwC, 2013).
Figure 9: Anglo American's economic contribution to SA (Genesis Analytics and PwC, 2013)

55
The mining industry, the study found, had a total capital expenditure of
approximately R46.5 billion. Of this, Anglo American accounted for approximately
33% of the capital expenditure, as is depicted in Figure 10 below. Anglo American’s
capital expenditure, both in the form of expansionary and replacement capital, has
increased from 2000-2012, as depicted in Figure 10, by an estimated eight jobs
being created for every R1 million spent on capital expenditure.
In 2012, the mining industry’s production revenue was approximately R372 billion,
of which Anglo American accounted for approximately 32% of revenue, equating to
R119 billion. When assessing the direct economic impact, in 2012, the mining
industry contributed 9%; whilst Anglo American contributed 23% of the direct
economic impact in the mining industry (Genesis Analytics and PwC, 2013).
Figure 10: Anglo American’s capital expenditure (Genesis Analytics and PwC, 2013)

56
The study also compared Anglo American’s contribution to the economy with that of
other sectors. It found that the direct impacts from the company were comparable to
the direct impacts from the entire agricultural sector (R73 billion). It was also
comparable to that of the utilities sector (R79 billion), and a little more than half the
direct impacts of the entire construction sector. When indirect and induced benefits
are included, Anglo American accounts for considerably more than any of the
different sectors, as depicted in Figure 12.
Figure 11: Mining-production revenue (Genesis Analytics and PwC, 2013)

57
Figure 12: Distribution of AA's economic impact (Genesis Analytics and PwC, 2013)
Figure 13 depicts SA’s balance of payments, together with the export revenue
generated by Anglo American. Figures obtained from the South African Reserve
Bank and Anglo American indicate that the company accounted for 12% of total
South African exports, and approximately 41% of the total mining exports. Anglo
American’s coal division supplied 72% of its production for local use; whilst KIO
supplied the local domestic markets full demand at prices well below the export rates
(Genesis Analytics and PwC, 2013).
27
R 60 bn
R 113 bn
R 79 bn R 73 bn
R 41 bn
R 49 bn
R 0
R 20
R 40
R 60
R 80
R 100
R 120
R 140
R 160
Eco
no
mic
im
pact – G
VA
(R
bn
)
Direct output
Indirect output
Induced output
R60bn
Source: Anglo American South Africa, PwC
analysis, Statistics South Africa
The distribution of AA’s economic impact (GVA) by industry, 2012
Through strong linkages to other sectors of the
economy, AA's production is a cornerstone of the
economy.
The sectors on which AA
has the greatest indirect
impact are utilities,
transport &
construction (R10bn)
and manufacturing
(R9bn) as these are
where supplier
expenditure is
concentrated
The sectors on which AA has the
greatest induced impact are
trade & real estate (R10bn) and
finance, business &
communication (R10bn) as
these are where employee
spending is concentrated
Economic linkages:
This graph sh o ws how AA’s
direct economic output
affects other sectors through
indirect and induced impacts
With direct, indirect and induced impacts considered, AA’s total GVA (R150bn) exceeds the
direct GVA of South Africa’s agricultural sector (R73bn), ut ilities sector (R70bn), and
construction sector (R113bn) (note the comparison is to the direct GVA of other sectors only)

58
PwC and Genesis Analytics (2013) maintain that Anglo American accounted for
approximately 3% of tax revenues in 2012, which equated to approximately R13.1
billion. According to their findings, this amounted to 42% of the total tax paid by the
entire mining industry. This was equivalent to 68% of the public health expenditure,
and 57% of the education department expenditure over the same period.
Figure 13: Local sales and exports (Genesis Analytics and PwC, 2013)

59
3.1.2 Summary
Anglo American remains an important player in the mining industry and the SA
economy. Due its size, commodity mix, and significance in the mining industry, Anglo
American can be used as a proxy for the industry. Section 3.3 provides a summary
of the empowerment transactions completed by the company’s various business
units.
Figure 14: Tax revenues paid by AA (Genesis Analytics and PwC, 2013)
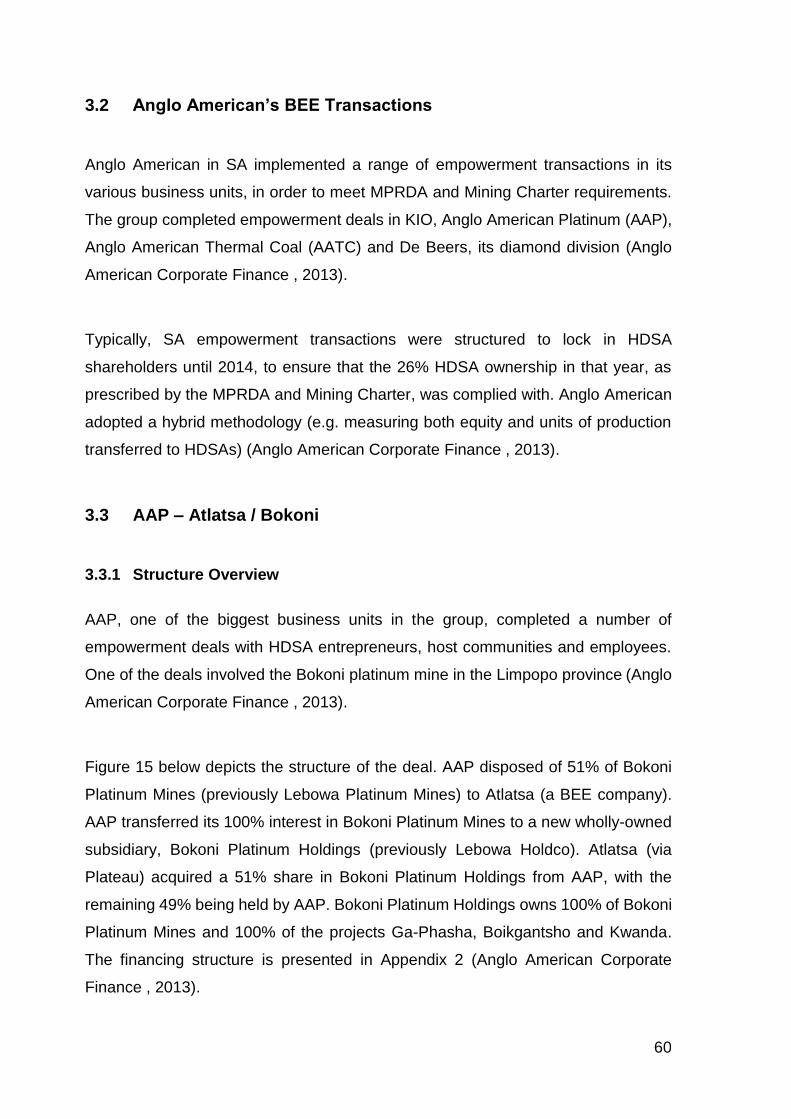
60
3.2 Anglo American’s BEE Transactions
Anglo American in SA implemented a range of empowerment transactions in its
various business units, in order to meet MPRDA and Mining Charter requirements.
The group completed empowerment deals in KIO, Anglo American Platinum (AAP),
Anglo American Thermal Coal (AATC) and De Beers, its diamond division (Anglo
American Corporate Finance , 2013).
Typically, SA empowerment transactions were structured to lock in HDSA
shareholders until 2014, to ensure that the 26% HDSA ownership in that year, as
prescribed by the MPRDA and Mining Charter, was complied with. Anglo American
adopted a hybrid methodology (e.g. measuring both equity and units of production
transferred to HDSAs) (Anglo American Corporate Finance , 2013).
3.3 AAP – Atlatsa / Bokoni
3.3.1 Structure Overview
AAP, one of the biggest business units in the group, completed a number of
empowerment deals with HDSA entrepreneurs, host communities and employees.
One of the deals involved the Bokoni platinum mine in the Limpopo province (Anglo
American Corporate Finance , 2013).
Figure 15 below depicts the structure of the deal. AAP disposed of 51% of Bokoni
Platinum Mines (previously Lebowa Platinum Mines) to Atlatsa (a BEE company).
AAP transferred its 100% interest in Bokoni Platinum Mines to a new wholly-owned
subsidiary, Bokoni Platinum Holdings (previously Lebowa Holdco). Atlatsa (via
Plateau) acquired a 51% share in Bokoni Platinum Holdings from AAP, with the
remaining 49% being held by AAP. Bokoni Platinum Holdings owns 100% of Bokoni
Platinum Mines and 100% of the projects Ga-Phasha, Boikgantsho and Kwanda.
The financing structure is presented in Appendix 2 (Anglo American Corporate
Finance , 2013).
61
3.3.2 Anglo American Platinum Community Empowerment
AAP completed an empowerment deal with host communities in Rustenburg,
Amandelbult, Mogalakwena and Twickenham operations, as well as AAP’s labour-
sending areas (LSAs). The structure includes an umbrella trust called the Lefa La
Rona Trust (LLRT), acting as a conduit and bank to the underlying development
trusts (DT) in each of the four operational areas. The trust also acts as a non-profit
company for the labour-sending areas (LSA NPC) (Anglo American Corporate
Finance , 2013).
Figure 16: Atlatsa/Bokoni structure (Anglo American Corporate Finance , 2013)
Figure 15: AAP BEE deal structure
62
The LLRT was set up in November 2011 at the time when the AAP share price was
R556/share. JSE and shareholder approval was obtained; and on 15 December
2011; 6, 290, 365 (2.33% of AAP market capitalisation) of AAP shares were issued
to LLRT. (All the other AAP joint ventures (JV’s) are outlined in Appendix 3) (Anglo
American Corporate Finance , 2013).
The transaction involved AAP issuing new shares worth R3.5 billion to a trust for the
benefit of the communities. AAP provided Notional Vendor Financing (NVF) for the
whole transaction; hence no cash was required from AAP (except for an up-front
donation of R629, 037 to the LLRT to subscribe for the shares). The NVF structure
is in place for 10 years, after which a sufficient quantity of shares will be sold to repay
the NVF; and the LLRT will retain the remainder.
A total of 60% of the ordinary AAP dividends on the shares were held back and used
towards the repayment of the NVF. The remaining dividends (40%) were paid to the
LLRT, which, in turn, distributed the funds to the DTs and LSA NPC according to the
determined allocation splits (Anglo American Corporate Finance , 2013).

63
3.4 AATC
AATC, one of the smaller business units in the division, conducted an empowerment
deal with HDSA partners. AATC is not a listed entity, compared to the other business
units in the group; and it is wholly owned by Anglo American.
3.4.1 Structure overview
Anglo Inyosi Coal (AIC) is a venture entered into between Anglo South Africa Capital
(ASAC) (representing AATC) and Inyosi (Pty) Ltd, as displayed in Figure 16. AIC’s
share capital is 73% owned by ASAC and 27% owned by Inyosi (Pty) Ltd. Inyosi
(Pty) Ltd is 33% owned by Pamodzi Coal (Pty) Ltd; and 33% owned by Ndonsa
Mining (Pty) Ltd (named Lithemba Consortium); 19% owned by WDB Investment
Holdings (Pty) Ltd; and 15% owned by a Community Trust (Anglo American
Corporate Finance , 2013).
Figure 16: Anglo Inyosi Coal structure (Anglo American Corporate Finance , 2013)
AIC purchased assets from Anglo Operations Proprietary Limited (Anglo Coal
division). The capital structure of the deal is described in Appendix 4.
Pamodzi Lithemba WDB Community
Consortium Consortium Trust
33% 33% 19% 15%
ASAC Inyosi
73% 27%
AIC

64
3.5 De Beers
3.5.1 Structure overview
Figure 17 illustrates the De Beers empowerment structure. Several empowerment
partners were co-opted into the consolidated holding company. Ponahalo purchased
a 26% holding in De Beers Consolidated Mines (DBCM). The remaining 74% is
owned by De Beers South Africa (DBSA).
The purchase price of R3.7 billion was funded with preference shares issued to
Standard Bank, with maturity dates between 2009 and 2013. Of this amount, DBSA
guaranteed R800 million. DBCM was funded with senior debt from the Royal Bank
of Scotland (RBS); and it had a facility of R1.8 billion with Standard Bank. The equity
contribution for the BEE shareholders was R10 million (Anglo American Corporate
Finance , 2013). Appendix 5 illustrates the financing structure.
Figure 17: De Beers’ structure (Anglo American Corporate Finance , 2013)

65
3.6 DTC SA Empowerment
As part of the 2008 diamond dealers’ licence application, De Beers committed to
empowering the Diamond Trading Company of South Africa (DTC SA) prior to the
expiry of the licence in August 2013. It was envisaged that DBCM (26% BEE
empowered) would acquire DTC SA from De Beers Group Services (DBGS), which
is 100% held by DBSA. However, owing to the economic downturn in 2008/2009
and the subsequent strain on the DBCM balance sheet, DBCM has not been in a
position to purchase DTC SA at a fair value. The group structure prior to the
proposed transaction is illustrated in Figure 18 (Anglo American Corporate Finance
, 2013)
Figure 18: DTC structure (Anglo American Corporate Finance , 2013)

66
3.7 Employee Share-Ownership Plans (ESOPs)
All Anglo American business units in SA have ESOPs. The ESOPs for the different
business units are outlined in Table 9 below. At inception, KIO’s scheme was R8.7
billion, whilst the net equity value in 2012 was R5.2 billion (Anglo American
Corporate Finance , 2013).
KIO’s ESOP has outperformed all other business units in Anglo American.
Disappointingly, both Anglo American South Africa and Anglo American Platinum’s
schemes have not performed well; and they have delivered less than satisfactory
value for employees (Anglo American Corporate Finance , 2013).
Table 9: AA business unit ESOPs (Anglo American Corporate Finance , 2013)
Entity ESOP Number of employees
Scheme value at inception
Net equity value Dec 2012
Meaningful value
AAP Kotula 46, 000 R1.5 billion R0.5 billion R7.5 billion
KIO Envision 6, 000 R8.7 billion R5.2 billion R1.8 billion
Anglo American SA (AASA)
Siyaphambili 10, 000 R0.2 billion R0.2 billion R5.2 billion
3.8 Summary
Anglo American has concluded a number of empowerment deals through its various
subsidiaries. It has done this by adopting diverse financing models and holding
structures tailored for the unique needs of each company. Most of the significant
empowerment deals have involved HDSA partners. Chapter 4 will provide a general
assessment of these ESOPs and their performance. A framework of what a
successful ESOP looks like will be developed, and these ESOPs assessed against
that framework.

67
4. Anglo American’s assessments of current ESOPs
4.1 Performance assessment
Anglo American conducted a study on the performance of current ESOPs employed
in the different business units. These include:
AAP: Kotula;
KIO: Envision;
AASA (AATC, Corporate Centre, Global Shared Services (GSS), Vergelegen):
Syaphambili; and
DBCM: Ponahalo (Anglo American South Africa, 2013).
According to the company, as they are currently structured, the ESOPs across the
business units are not consistent in terms of both design and generated returns. In
terms of the financial structure, the main categories include:
Free shares (AASA, part of Kotula);
Notionally vendor-funded shares (part of Kotula, Envision, Ponahalo); and
Different vesting periods (3-5 years) (Anglo American South Africa, 2013).
After analysing the performance of the ESOP, the company found that the majority
of ESOPs have not performed satisfactorily, in financial terms, with the exception of
Envision.
Kotula’s benefits have been limited to minimal dividends and a small value that
vested in relation to the free shares;
Envision has delivered beyond expectation;
The AASA scheme’s benefits have been relatively modest; and
The DBCM scheme has not yielded any anticipated benefits for employees
(Anglo American South Africa, 2013).

68
According to Anglo American, the performance of the ESOPs have been driven
mostly by the commodity cycles, where Envision benefited from the iron ore up-
cycle; but Kotula and AASA suffered from general weakness in AAP’s and Anglo
American plc’s share prices, respectively.
Due to the varying architectures and the various financial performances of the
ESOPs in the group, Anglo American cannot show that its employees have
meaningful and consistent long-term share-ownership in the company, because
employees sell their shares, after vesting. This is accredited to the need for short-
term financial needs, as opposed to long-term investment opportunities.
Consequently, the employees do not experience any transparent long-term
participation in the organisation (Anglo American South Africa, 2013).
4.2 Original objectives of the schemes
According to their findings, Anglo American believes some of the original objectives
of the current ESOPs, such as wealth creation for employees, have not been met.
This, in large part, is due to modest pay-outs for employees and the sale of shares
by employees upon vesting, even in the case of high-performing schemes, such as
Envision. The alignment of company performance with the individual performance
of employees has not materialised.
The ESOPs do not, in all cases, meet the employees’ needs. The day-to-day reality
of employees' lives puts a stronger emphasis on the availability of cash than on
active participation as a shareholder. The current notional vendor-funded structures
are highly dependent on share price performance; whereas non-management
employees have a far greater need for low-risk consistent cash income (Anglo
American South Africa, 2013).

69
4.3 Summary
Anglo American has conducted a number of ESOPs in its various business units.
The financial performance of the ESOPs has been inconsistent. Employees have
not fully benefitted from current ESOPs, with structures that are complicated and
opaque to employees. Chapter 5 seeks to propose a framework that encapsulates
varying success factors of an ESOP, which can be used by mining companies when
structuring new ESOPs or amending existing plans.
70
5 ESTABLISHING A FRAMEWORK FOR A SUCCESSFUL ESOP
5.1 Principles underpinning the proposed framework
The new proposed ESOP model has to take into account all that has been discussed
with regard to the failures of current ESOP models in the industry, whilst providing
mechanisms to alleviate these drawbacks. This is to ensure that ESOPs are
instruments used by mining companies to foster all the virtues of an effective ESOP.
It is envisaged any ESOP formulated under the framework should apply to
employees of that organisation so long as they remain employees. Once an
employee leaves the organization, the provisions of the ESOP would be forfeited
and gained by the employee who replaces the departing employee. This is a critical
principle of the proposed ESOP framework as this would ensure that companies
continue to comply with regulation and that their employees continue to benefit from
the ESOP.
Similarly, employees that get promoted and fall within a higher bracket forfeit their
benefits in the scheme. Any new employees that falls within the bracket becomes
an automatic participant in the scheme. Beneficiaries of these ESOPs should be
HDSAs that fall within the lower salary bands in the organisation. If there is a
reduction in employee numbers, the benefits of that ESOP should be redistributed
to the remaining employees. This is to avoid constant dilution of employee
shareholding to external partners when employees leave the company.
The shares issued to employees must be placed in a holding structure, which is
managed by representatives elected by the employees. Each representative union
would have a nomination, based on the percentage share of those employees it
represents in the category of workers that qualify. The trust must have full voting
rights, preferable with a seat on the board of directors of the company through the
trust.
71
The payment of annual dividends must also be balanced with the need to finance
the sale of shares to employees. It is proposed that the vesting period of the shares
be extended to allow for a more consistent and notable dividend flow to the
employees. It is important to note that once the debt has been settled, employees
would be entitled to 100% of the dividend flow.
Once vested, employees are allowed to sell their shares to qualifying employees
within the organization. These are HDSA participants that fall within the specified
salary bracket. There should be an obligation placed on the trust to maintain a
certain amount of capital to ensure rights offers are followed through. This is to
mitigate the risk of diluting shares and also to ensure continued empowerment.
To ensure that during times when companies are performing satisfactorily, due to
rising commodity prices, or improved productivity gains, a sliding scale should be
used, when determining what percentage should flow to the employees. During high
commodity cycles dividends should be skewed towards debt repayment. During low
cycle periods dividends paid should be skewed towards cash payments for
employees.
The report does not propose separate dividend policies for employees and other
ordinary shareholders. It is incumbent on the trust, upon receiving dividends from
the company to institute this sliding scale.
It is not enough for companies to institute an ESOP without engaging employees on
the meaning of the ESOP, and providing employees with financial literacy programs.
These must be geared towards sensitising employees to the financial aspects of the
business as new owners. This, with a view of aligning company interests with
individual employee interests.

72
These aspects are equally important; and they need to be applied in concert,
accompanied by constant engagement with the employees and the provision of an
environment conducive to individual employee enterprise.
5.2 Proposed Framework
A successful ESOP must be buttressed by a set of key fundamental pillars if it is to
meet the collective needs of critical stakeholders. In terms of an ESOP, these critical
stakeholders include employers, employees and the government. This section will
outline a proposed framework for companies to utilise when instituting a new ESOP
or reviewing their old ESOPs. This framework as aforementioned will be
underpinned by the set of principles outlined in section 5.1.
5.2.1 Meaningful economic participation
The first most important pillar is the equity stake in the company. If companies want
to employ ESOPs successfully, they need to ensure that they afford a meaningful
equity value toward the ESOP. The percentage depends on the dynamics of the
business. In terms of the Mining Charter, the requirements are 26% HDSA
participation.
Khan (2014) studied the effect of ESOPs on company profitability in the South
African mining industry. The study was conducted on JSE listed companies. The
study found that ESOP percentages for these companies ranged from 1.4%-3% of
the total shares for of the company. His study also found that only 8 out of the 30
company’s listed had ESOPs in place (Khan, 2014).
Short and Keasey (1999) contended that the effect of ESOP is not only dependent
on the existence thereof, but highly dependent on the level of ownership. Their study
depicted a positive relationship between ownership and performance at various
percentages. In Anglo American the highest equity stake from broad based ESOPs
is 3% from Envision.

73
5.2.2 Instilling an ownership culture
The second critical pillar to the framework is the ability of a company to instil an
ownership culture within the business. Employees must have the ability and
opportunity to contribute to decision making processes, accompanied by
implementation of those business decisions. This must be enabled by mechanisms
that allow for efficient dissemination of information and channels that enable
employee participation in identifying process failures and improvement
opportunities. These contributions should be heard, and timeously acted upon.
5.2.3 Driving the business disciplines
For successful ESOPs companies must ensure that employees are concerned with
driving the business disciplines. These employees must understand how their
individual performance contributes to overall performance improvement. An
enabling environment where these employees identify critical performance metrics,
are clear about the performance objectives and targets whilst continuously
monitoring and tracking those metrics is needs to be created. Ideas about
performance improvement must be shared between lower level employees and
management.
5.2.4 Share price performance
A prerequisite for any successful ESOP is an improving share price. This is critical
to the success of an ESOP in large part due to the fact that the repayment for the
equity afforded by the company depends on dividend flow. Increasing share normally
is indicative of improved company performance, and results in improved dividend
payment which results in shorter vesting periods.

74
5.2.5 Financial incentives
Under the proposed framework, short term and long term financial incentives are
critical to the success of the ESOP. The implementation of the ESOP must ensure
that employees recalculate their economic interests. Meeting the short term needs
of employees and protecting employee incentives from commodity cycles is an
important feature of the ESOP under this new framework.
5.2.6 Aligned goals
Employers and employees must have aligned goals and objectives under the
proposed framework. These objectives and goals centre on business sustainability,
operational and financial performance. Other considerations include meeting
stakeholder requirements and ensuring business risk is mitigated.
5.2.7 Productivity gains
Improved productivity is a measure of business efficiency. Application of an ESOP
should ensure improved productivity from the workforce as this will indicate a
positive collaborative relationship between management and lower level employees
and an indication of employee sentiment.
5.2.8 Engaged and responsive workforce
A successful ESOP must result in an engaged and responsive workforce.
Employees must be responsive to the needs of the organisation in a dynamic
business environment. This has to be supported by effective employee involvement
mechanisms. Strikes and lock-outs are not features of an engaged and responsive
workforce.

75
5.2.9 Regulatory compliance
One of the more important pillars supporting an effective ESOP is the compliance
with regulatory requirements. In terms of SA, mining companies must comply with
requirements of the Charter.
5.3 Summary
Chapter 5 summarises a proposed framework that should utilised by employers
when constituting an ESOP. The ESOP is underpinned by the set of principles
specified. The framework comprises key pillars that should be considered when
implementing an ESOP, with underlying programmes underpinning these key pillars.
The framework is summarised in figure 19 below. ESOPs in Anglo American will be
tested against this framework and their success assessed according to the
framework.

76
Figure 19: Proposed ESOP framework

77
6 ANALYSIS OF CURRENT ESOPS USING PROPOSED
FRAMEWORK
Anglo American has two listed companies in its stable, namely, AAP and KIO. This
report provides an analysis of the performance of the ESOPs, as well as some of
the key drivers behind this performance. The ESOPs will be evaluated using this
new proposed framework laid out in Chapter 5.
6.1 KIO
Kumba Resources (now KIO), was unbundled in 2006, resulting in KIO owning 74%
of the Sishen Iron Ore Company (SIOC). Exxaro Resources took up 20%; SIOC
development SPV (Pty) Limited (3%); and employees through the ESOP, named
Envision, owning the remaining (3%). The combined minority shareholding accounts
for the 26% demanded by the Charter. The shares were meant to vest in years five,
six and seven from the subscription date (Kumba Iron Ore Limited, 2006-2015).
6.1.1 Share performance and financial incentives
Table 10 below contains the parameters used for the analysis, with figures obtained
from KIO’s annual integrated financial report, from 2006-2014.
Table 10: KIO’s annual financial results (Kumba Iron Ore Limited, 2006-2015)
Year Total dividend (R million)
Earnings per share (R/share)
Dividend per share (R/share)
Dividend cashflows (R million)
2006 12 0.84 0.8 7
2007 98 9.85 7.5 11
2008 271 22.8 21 32.00
2009 189 21.88 14.6 59.00
2010 419 44.67 34.5 62.00
2011 587 53.11 44.2 127.00
2012 426 37.97 31.7 120.00
2013 144 48.08 40.04 83.00
2014 478 34.32 23.34 169.00

78
Figure 20 depicts KIO’s share price performance from its initial listing in 2006 to
2014. The graph shows how the company experienced tremendous share price
growth from listing until 2012; but this was followed by a precipitous fall in sub
sequent years.
Figure 20: KIO’s share price (Kumba Iron Ore Limited, 2015)
Figure 21: KIO’s earnings-dividend
0.87.5
2114.6
34.5
44.2
31.7
40.04
23.34
0.84
9.85
22.8 21.88
44.67
53.11
37.97
48.08
34.32
0
10
20
30
40
50
60
0
5
10
15
20
25
30
35
40
45
50
2007 2008 2009 2010 2011 2012 2013 2014
Ear
nin
gs p
er s
har
e (R
/sh
are)
Div
iden
d p
er s
har
e (R
/sh
are)
Earnings-Dividend graph
dividend per share Earnings per share

79
There is a direct relationship between a company’s share price, earnings per share,
and dividends per share. Higher earnings are accompanied by a higher share price
and increased dividends.
Figure 22: KIO's dividend flow graph
Figure 22 illustrates the difference between the total dividends paid out to the
shareholders, and the final dividend paid out to the employees. On average, the total
dividend is more than 3 times the dividend cash flow. The difference between the
two dividend payments is used to finance the cost of the debt; and it is also used for
trust fees and the associated costs.
The performance of Envision was driven mostly by the commodity cycles benefiting
from the iron ore up-cycle. Envision’s financial performance has been good, with
shareholders benefiting from high dividend pay-outs.
7 1132.00
59.00 62.00
127.00 120.00
83.00
169.00
12
98
271
189
419
587
426
144
478
2007 2008 2009 2010 2011 2012 2013 2014
0
100
200
300
400
500
600
700
0
20
40
60
80
100
120
140
160
180
2007 2008 2009 2010 2011 2012 2013 2014
To
tal
Div
iden
d (
Rm
il)
Div
iden
d C
ash
flo
w (
R/s
har
e)
Dividend cashflow
Dividend cashflow Total dividend

80
6.1.2 Meaningful economic participation
Envision owns a total of 3% of the companies share allocation without any voting
rights pre-vesting of the shares.
6.1.3 Instilling ownership culture and aligning goals
In October 2012, KIO employees engaged in unlawful industrial action that resulted
in significant losses, in both physical assets and also lost production output. In their
2012 annual report, KIO stated that, “labour relations issues proved to be the biggest
challenge, despite the unprecedented financial payouts to employees at the end of
2011” (Kumba Iron Ore Limited, 2012).
6.1.4 Productivity
An analysis of KIO’s productivity was conducted post the implementation of
Envision. Figures were obtained by comparing the production output (million tons)
by total permanent employee numbers with data from KIO’s annual reports from
2007 to 2015. Figure 23 below displays the results obtained from.

81
Figure 23: KIO's productivity
KIO has increased its production over the years, however, employee numbers have
significantly increased. The increase in employee numbers outpaced the increase in
production output, as a result overall employee productivity has reduced. In their
2012 annual report, KIO highlighted absenteeism having a significant impact on
productivity.
6.1.5 Engaged and responsive workforce
Labour relations has constantly been a risk highlighted by the company during the
past years. According to the 2015 annual report, labour relations formed part of the
top 10 risks. This the company asserts is as a result of the restructuring proposed
by the company necessitated by declining commodity prices. According to KIO, the
risk is also caused by zero dividend pay-outs expected in 2016 due to lower
commodity prices (Kumba Iron Ore Limited, 2015).
0
1000
2000
3000
4000
5000
6000
7000
8000
9000
2007 2008 2009 2010 2011 2012 2013 2014 2015
Pro
du
ctiv
ity
Rat
io (
t/em
plo
yee
)Kumba Productivity

82
According to Lucas Phiri, National Union of Mine Workers (NUM) Chief Negotiator
at KIO, mining companies do not have the best interest of employees at heart. He
said, “the government must consider taking back mining licences of these mines
who their objective is to exploit workers, maximize profit and when they are done
they move away from their social responsibilities and leave some workers in bad
conditions, injured or sick.” This follows the announcement of the plans by the
company to retrench 2633 employees (NUM, 2016).
6.1.6 Regulatory compliance
In their 2015 annual report, KIO highlighted the Department of Mineral Resources’
interpretation of the Mining Charter as a significant challenge. Post the
implementation of ESOP, the company had complied with all elements of the mining
charter. However there still remains uncertainty around the issue of “once
empowered, always empowered” (Kumba Iron Ore Limited, 2015).
6.1.7 Summary
Figure 24 below contains a dashboard summary of the components discussed
above.

83
Figure 24: Summary of KIO’s performance evaluated against proposed
framework
6.2 Anglo American Platinum
In 2008, AAP reached an agreement with its employees and the labour unions on
the terms and structure of the companies’ ESOP. The AAP Kotula Trust would
facilitate the scheme on behalf of the beneficiaries, to a total of 2.5 million shares.
These were issued to the trust, equating to approximately 1% of the company’s
ordinary share capital. When the shares were issued, 90% of the beneficiaries would
be HDSAs. The ESOP had a value of R1.5 billion at inception, with a total of 46, 000
beneficiaries (Anglo American Platinum Limited, 2009).
To achieve the 26% ownership target, AAP opted to utilise various mechanisms,
such as a community trust, joint ventures, disposal of the assets, and establishing
the company’s ESOP in order to achieve this milestone.

84
6.2.1 Share performance and financial incentives
An analysis was conducted, comparing what the dividend flow to individual
employees would have been, had the company opted to use only the ESOP as the
empowerment vehicle. This was compared to the actual dividend payment that each
employee received after the establishment of the program. Table 11 below contains
the parameters used for the analysis; and these were obtained from AAP’s annual
integrated financial report, from 2008-2014.
Table 11: AAP annual financial result (Anglo American Platinum Limited, 2008-2014)
Year Employee numbers
Dividend/share (c/share)
Shares in issue (million)
Dividend paid (R)
Shares @ 26% (million)
Dividend @ 26% ownership (R)
2008 50152 3500 237.1 704.16 18.53 12205.5
2009 58320 0 236.8 0 18.53 0
2010 54022 683 261.6 135.15 18.53 2342.66
2011 58541 700 261.1 127.82 18.53 2215.63
2012 56379 0 261 0 18.53 0
2013 49816 0 261 0 12.35 0
2014 49763 0 261.2 0 6.18 0
It is important to note that the shares were structured to vest in the fifth, sixth and
seventh year from the subscription date. In 2012, some of the shares had vested;
and as such, some of the employees were entitled to the capital value of each Kotula
share allocated to them. From the dividend paid, provisions had to be made for trust
fees and other associated liabilities (Anglo American Platinum Limited, 2009).

85
Figure 25: Anglo American Platinum dividend comparison
In 2008, AAP paid a dividend of 3, 500 cents per ordinary share (c/share), as
illustrated in Figure 25. The Kotula trust had 1, 069 million shares, which meant that
the total ordinary dividend paid to the trust amounted to R53.3 million. This equates
to R704.16 per employee for each share that they owned.
AAP did not pay a dividend in 2009, with dividends of 683 c/share and 700 c/share
paid in 2010 and 2011, respectively. This resulted in a dividend per employee
amount of R135.15 in 2010 and R127.82 in 2011. From 2012-2014, the company
did not pay any dividend.
Had the ownership percentage increased to 26%, instead of the 1% at inception, the
dividend flow to the employees would have significantly increased. In 2008, this
would have resulted in a total dividend of R648.55m paid to the trust, resulting in
R12, 205.50 per employee for every share they owned; and this is significantly
higher than the R704.16 received in 2008.
2007 2008 2009 2010 2011 2012 2013 2014
0
100
200
300
400
500
600
700
800
0
2000
4000
6000
8000
10000
12000
14000
2007 2008 2009 2010 2011 2012 2013 2014
Div
ide
nd
pai
d t
o e
mp
loye
es
(R/s
har
e)
Div
ide
nd
at
26
% o
wn
ers
hip
(R
/sh
are
)Dividend comparison
Dividend flow at 26% Dividend flow to individual employee

86
Similarly, the subsequent 2010 and 2011 pay-outs would have been R2, 342.66 and
R2, 215.63, respectively. Increasing the equity stake of employees to 26% is not
always pragmatic due the responsibilities mining companies have toward
communities and other stakeholders. However it does demonstrate the impact of
improved equity participation by ESOPs on individual employees.
Figure 26: Anglo American Platinum share price (Anglo American Platinum Limited, 2015)
AAP’s share price chart has a similar trend to the divided flow chart. The chart
reflects the performance of the company. The chart reached a peak above R1, 400
in 2008; and it fell to a price below R200 in 2015. This coincides with the highest
dividend paid by the company in 2008. There is also a direct relationship between
the earnings per share of the company and the dividend flow, as displayed in Figure
27.

87
Figure 27: AAP earnings – dividend chart
AAP’s ESOP has not paid significant dividends to employees. This was in large part
due to the poor financial performance of the company resulting in low dividend
payments.
6.2.2 Instilling an ownership culture and aligning goals with an engaged and
responsive workforce
Following the tragic events at Marikana in 2012, where an industrial dispute turned
violent, resulting in the death of 34 mine workers, followed by a 5 month strike in the
platinum belt, the industrial action resulted in significant losses for the company.
After reaching an agreement, the company continued to report non-procedural
incidents such as underground sit-ins and illegal stoppages in 2013 (Anglo American
Platinum Limited, 2014).
Delivering his Chairman’s report for the 2014 reporting period, the Chairman of AAP,
Valli Moosa, pointed to a need for a renewed emphasis on labour relations. Key
amongst the important requirements is a labour force that has a meaningful stake in
the business, and a subsequent responsibility in the fortunes of the company,
according to the Chairman. This requires more serious engagement with the
2006 2007 2008 2009 2010 2011 2012 2013 2014
-10
0
10
20
30
40
50
60
0
10
20
30
40
50
60
2006 2007 2008 2009 2010 2011 2012 2013 2014
Ear
nin
gs p
er s
har
e (R
/sh
are)
Div
iden
d p
er s
har
e (R
/sh
are)
Earnings-Dividend graph

88
employees and increased ownership in the business. This is interpreted as an
implicit recognition of the ineffectiveness of the current ESOP.
6.2.3 Meaningful economic participation
Kotula owned 1% of the company’s ordinary share capital. When the shares were
issued, 90% of the beneficiaries would be HDSAs. Final vesting for Kotula shares
was in 2014 with the ESOP subsequently wound up. AAP indicated its intention to
consider the implementation of a new ESOP (Anglo American Platinum Limited,
2009).
6.2.4 Productivity
Figure 28: Precious Metals Sector Productivity (Goldman Sachs, 2012).

89
Wage inflation has increased by 11% whilst productivity levels in the gold and
platinum sectors have declined by 4% per annum over a 10-year period as depicted
in figure 28 above.
Figure 29: AAP labour productivity profile (Anglo American Platinum
Limited, 2008-2015).
For AAP Productivity levels vary year on year without a significant positive or
negative trend. Figure 29 above reflects the productivity level at AAP post the
implementation of the ESOP.
6.2.5 Regulatory compliance
Similar to KIO, the implementation Kotula ensured compliance with HDSA
ownership requirements of the Charter with uncertainty around interpretation with
the DMR remaining an issue.

90
6.2.6 Summary of Kotula
Figure 30: Summary of AAP performance evaluated against proposed
framework
6.3 Summary
Anglo American’s two listed entities had ESOPs that had varying financial
performance. High company earnings lead to higher dividend payments, which are
ultimately reflected in a rising share price. High company earnings are achieved
through productivity gains and demand factors. When measured against the other
success criteria, the ESOPs did not compare favorably. Productivity levels, instilling
an ownership culture and aligning goals with employees remain a challenge.

91
7 CONCLUSION AND RECOMMENDATIONS
Empowerment of previously disadvantaged groups has been applied in various
countries throughout history; and it has been applied in many different forms aiming
to achieve specific political, social and economic objectives. In the profiled countries,
these policies have had varying degrees of success.
South Africa continues to struggle with poverty, unemployment and inequality;
realities brought about by past policy instruments and bias. BEE is seen as an
appropriate approach for providing opportunities for HDSAs who suffered from
economic exclusion.
The major mining houses have completed empowerment deals, with the most
significant deals involving individual HDSA entrepreneurs. The deals have been
completed as a response to the requirement of the Mining Charter, governed under
the MPRDA, for more ownership participation by HDSAs.
These empowerment deals have garnered criticism for not being sufficiently broad-
based, and for empowering a few individuals. Mining companies have also
implemented ESOPs in their respective businesses.
In this report, Anglo American was used as a proxy for the industry, due to its size
and diverse nature. Current ESOPs in Anglo American were found to be
inconsistent, sometimes complicated; and they remain largely opaque to the
employees.
When employees are made to be part owners and meaningful participants in the
success of the business, this leads to a more productive workforce that is engaged,
and has an increased sense of responsibility in generating higher returns. Current
ESOPs have failed to imbue an ownership culture within their employees. An

92
employee’s ability and opportunity to participate in the decision-making processes
contributes to the success of an ESOP.
A successful ESOP should not just pay out money to employees, but it should
change behaviors of both beneficiaries, management and owners of the business.
This report has proposed a new framework for ESOPs under which it is envisaged
that future ESOPs be modelled. The framework takes into account the needs of all
important stakeholders, namely employers, employees and government. The
framework is centred on 9 key pillars.
These are share performance, meaningful economic participation, financial
incentives, driving the business disciplines, instilling a culture of ownership, aligned
goals, productivity gains, and engaged and responsive workforce and regulatory
compliance.
The new framework is underpinned by a set of key fundamental principles.
Employees short term needs should be reconciled with the long term aspiration of
the organisation. The technical aspects of the ESOP should be aligned with the
change management requirements for effective implementation. The impact of the
ESOP needs to change employee behaviour and thus benefits should be immediate
and meaningful.
The performance of ESOPs in Anglo American varied when assessed against the
framework. With the exception of Envision, Anglo American’s ESOPs have delivered
very modest financial benefits to employees. They have not achieved their intended
purpose, of empowering employees and aligning company performance with
individual employee performance. Envision has benefited from the iron ore up-cycle;
but Kotula and AASA have suffered from a general weakness in AAP and AA plc’s
share prices, respectively. When assessed against the other pillars of the
framework, KIO and AAP did not perform satisfactorily.

93
This report recommends that mining companies, irrespective of size and commodity
group, implement this proposed approach, in order to fully harness the virtues of
ESOPs. The report further recommends that appropriate programmes specific to
each pillar be instituted.
Further work needs to be conducted on how to create a working environment where
employees can participate in the decision-making processes of the business.
Programmes that that will give effect to the framework can be investigated. Clarity
needs to be sought on the relationship between the BBBEE Amendment Act and the
Mining Charter. Issues around interpretation of the ownership pillar (“once
empowered always empowered”) is also required.

94
8 REFERENCING
Abdullah, S.N. (2006) Directors’ remuneration, firms performance and corporate
governance in Malaysia among distressed companies, Corporate Governance,
p162-174
Anderson, H.T. (2004) The Pursuit of Fairness – A History of Affirmative Action,
Oxford University Press Inc., United Kingdom, pp.2-283
Anglo American Corporate Finance. (2013) BEE funding requirements position
paper, Internal and Unpublished Document, Anglo American South Africa,
Johannesburg, South Africa, pp.1-18
Anglo American CEO's Office. (2013) Restructure and align ESOPS, Internal and
Unpublished Document, Anglo American South Africa, Johannesburg, South Africa,
pp.2-8
Anglo American CEO's Office. (2013) State Intervention in Mining Position Paper,
Internal and Unpublished Document, Anglo American South Africa, Johannesburg,
South Africa, pp.1-2
Anglo American Platinum Limited. (2008-2015) Integrated Report, Public Document,
Anglo American South Africa, Johannesburg, South Africa
Anglo American Platinum Limited (2015) Share Price Chart, Internet Source,
Retrieved July 22, 2015 http://www.angloamericanplatinum.com/investors/share-
price/jse/share-chart.aspx
Bacha, O.I., Zain, S.R.S.M., Rasid, M.E.S.M., Mohamad, A. (2009) GRANTING
EMPLOYEE STOCK OPTIONS (ESOs), MARKET REACTION AND FINANCIAL
PERFORMANCE, Internet Journal, Department of Finance and Accounting,
International Centre for Education in Islamic Finance (INCEIF), Kuala Lumpur,
Malaysia, pp. 2 Retrieved September 22, 2016
http://web.usm.my/journal/aamjaf/Vol%205-1-2009/5-1-6.pdf
95
Beirne, M. (2006) Empowerment and Innovation, Research Report, University of
Glasgow, Scotland, United Kingdom, pp.1-9
Bryson, A., Freeman, R., Lucifora, C., Pellizzari, M., & Perotin, V. (2012) Paying For
Performance: Incentive Pay Schemes and Employees’ Financial Participation:
Centre for Economic Performance, LSE
Cargill, J. (2010) TRICK OR TREAT: Rethinking Black Economic Empowerment,
Book Reference, Jacana Media, Johannesburg, South Africa, pp.21-228
Castellino, J., Redondo, D.E. (2006) Minority Rights in Asia, Comparative Legal
Analysis, Oxford University Press, United Kingdom, pp.47-151
Chamber of Mines South Africa. (2013) Briefing Note: State-Owned Mining
Company (SOMCO), Internal and Unpublished Document, Chamber of Mines South
Africa, Johannesburg, South Africa, pp.14-23
Chamber of Mines South Africa. (2015) CHAMBER OF MINES CALCULATES
BROAD-BASED HDSA OWNERSHIP OF 38% and MEANINGFUL ECONOMIC
VALUE TRANSFER OF >R159 BN, Internet Document, pp.1-3, Retrieved May 26,
2015 from https://commondatastorage.googleapis.com/comsa/summary-of-
chamber-research-report-on-progress-on-ownership-15-05-2015.pdf
Constitutional Assembly. (1996) The Constitution Of the Republic of South Africa,
1996, Department of for Justice and Constitutional Development, Pretoria, South
Africa, pp.5
Department of Mineral Resources. (2015) ASSESSMNET OF THE BROAD-BASED
SOCIO-ECONOMIC EMPOWERMENT CHARTER FOR THE SOUTH AFRICAN
MINING INDUSTRY (MINING CHARTER), Assessment Report, Department of
Mineral Resources, Pretoria, South Africa, pp. 9-38
Department of Mineral Resources. (2010) AMMENDMENT OF THE BROAD-
BASED SOCIO-ECONOMIC EMPOWERMENT CHARTER FOR THE SOUTH
AFRICAN MINING AND MINERALS INDUSTRY, Sector Charter, Department of
Mineral Resources, Pretoria, South Africa, definitions

96
Department of Trade and Industry (2013) Broad-Based Black Economic
Empowerment Amendment Act, Department of Trade and Industry, Pretoria, South
Africa
Department of Trade and Industry (2016) B-BBEE Sector Charters, Department of
Trade and Industry, Pretoria, South Africa, Internet Document, Retrieved June 26,
2016 from
https://www.thedti.gov.za/economic_empowerment/bee_sector_charters.jsp
ESOP Association Canada. (2015) Creative Strategies for Growing Organizations,
Internet Document, Retrieved September 23, 2016 from http://www.esop-
canada.com/ESOPCanada/index.php
Financial Times. (2016) Indices - JSE Resource 20, Financial Times, Internet
Document, Retrieved September 23, 2016 from
http://markets.ft.com/data/indices/tearsheet/charts?s=JRESI:JNB
Freeman, S. F., & Knoll, M. (2008) S Corp ESOP Legislation Benefits and Costs:
Public Policy and Tax Analysis. Organizational Dynamics Working Papers, 4.
Gamble, J.E, Culperpper, R. and Blubaugh, M.G. (2001) ESOP’s and employee
attitude: The importance of empowerment and financial value. Emerald Group
Publishing Limited. Vol 31, Issue 1, pp.9-21
Gates, J.R., Saghir, J. (1995) Employee Stock Ownership Plans (ESOPs):
Objectives, Design Options and International Experience, Discussion Paper, The
World Bank, pp.7-20 Retrieved October 12, 2016
https://ppiaf.org/sites/ppiaf.org/files/documents/toolkits/LaborToolkit/Toolkit/pdf/refe
rence/Gates_Saghir_1995_ESOPs.pdf
Genesis Analytics & PwC. (2013) Anglo American South Africa - Economic
Contribution to South Africa, Internal and Unpublished Document, Anglo American
South Africa, Johannesburg, South Africa, pp.3-33
Government Gazette vol. 448, n. (2002) Mineral and Petroleum Resources
Development Act.28 of 2002, Public Document, Department of Mineral Resources,
Pretoria, South Africa, pp.18

97
Hunt, K. (2013) Is Treasury broadening the divide between shareholders and
employees-an analysis of the role taxation plays in share incentive plans, Research
Report, University of the Witwatersrand, Johannesburg, South Africa, pp.1-30
Jones, D.C, Kalmi, P. and Makinen, M. (2006) The determinants of stock option
compensation: Evidence from Finland, Blackwell publishing limited, pp.437-468
Khan, S. (2014) The effect of employee share ownership on company performance
in South African mining. Research Report, University of the Witwatersrand,
Johannesburg, South Africa, pp.79
Kumba Iron Ore Limited (2006-2015) Integrated Report, Public Document, Anglo
American South Africa, Centurion, South Africa.
Kumba Iron Ore Limited (2015) Share Price Chart, Internet Source, Retrieved July
22, 2015 http://www.angloamericankumba.com/investors/share-price-and-
tools/share-price-chart.aspx
Loney, M. (1998) The Pursuit of Division - Race, Gender, and Preferential Hiring in
Canada, McGill-Queen's University Press, Montreal, Canada, pp. 1-81
Martin, T. (2001) The Affirmative Action Empire - Nations and Nationalism in the
Soviet Union, 1923-1939, Cornell University Press, New York, United States of
America, pp. 1-142
Mitchell, R., O’Donnell, A., & Ramsay, I. (2005) Shareholder value and employee
interests: intersections between corporate governance, corporate law and labor law,
Wis. Int’l LJ, 23, 417.
Motswenyane, P. (2009) The Impact of Employee Shareholding Option Plans on
Company Performance in South Africa, Research Report, University of the
Witwatersrand, Johannesburg, South Africa, pp.87-95
Mthimkhulu, V. (2015) BEE is on trial in ‘once empowered always empowered’,
Internet Document, Retrieved July 22, 2016 http://www.ujuh.co.za/bee-is-on-trial-in-
once-empowered-always-empowered-matter/

98
Nattrass, N., Seekings, J. (2010) The Economy and Poverty in the Twentieth
Century in South Africa. Retrieved June 25, 2015 from
http://www.cssr.uct.ac.za/sites/cssr.uct.ac.za/files/pubs/wp276.pdf
NUM. (2016) NUM statement on Kumba Iron Ore restructuring, Retrieved July 25,
2016 from http://www.cosatu.org.za/show.php?ID=11307
Pathak, K., Saraswathy, M. (2010) Esop idea spreads across corporate India,
Retrieved September 25, 2016 from http://www.business-
standard.com/article/companies/esop-idea-spreads-across-corporate-india-
111121900077_1.html
Postlethwaite, R., Michie, J., Burns, P. & Nuttall, G. (2005) Shared Company - How
employee ownership works, Internet Document, pp.5-21 Retrieved July 2014, 06
from www.employeeownership.com.au:
http://www.employeeownership.com.au/wp-content/uploads/2012/01/Shared-
Company-UK.pdf
Pushpakumara, W.P.N, Rajapakse, R.M. (2009) The Effect of Employee Share
Ownership Plans on the Corporate Profits, Department of Accountancy, University
of Kelaniya, Sri Lanka, Journal, Retrieved October 09, 2016 from
http://www.kln.ac.lk/uokr/ARS2009/C-6.12.pdf
Robinson, A. M., & Zhang, H. (2005) Employee Share Ownership: Safeguarding
Investments in Human Capital, British Journal of Industrial Relations 43(3), United
Kingdom, pp.469-488
Rodgers, L., (2011) ESOP Plans Today; The Participant’s Perspective,
Presentation, National Center for Employee ownership, United States of America,
pp. 2, Retrieved October 09, 2016 from
http://www.nceo.org/assets/public_webinars/free-ESOP-
webinars/ESOP_Overview/handouts/ESOP%20Overview%20-Rodgers.pdf
Rosen, C., Case, J., Staubus, M. (2005) Equity: Why Employee Ownership Is Good
for Business, Massachusetts, Boston, United States of America, pp. 7-178

99
Sharma, S. (2012) Rising inequality in South Africa: Drivers, trends and policy
responses, Internet Article, Retrieved November 09, 2013 from Consultancy Africa:
http://www.consultancyafrica.com/index.php?option=com_content&view=articale&i
d=1142:rising-inequality-in-south-africa-drivers-trends-and-policy-responses-
&catid=87:african-finance-a-economy&Itemid=294item
Short, H., Keasey, K. (1999) Managerial Ownership and the Performance of Firms:
Evidence from the UK, Journal of corporate finance, pp.79-101
Sowell, T. (2004) Affirmative Action Around the World, Empirical Study, Yale
University Press, New Haven & London, United Kingdom & United States of
America, pp.1-121
Statistics South Africa. (2011) 2011 South African Census, Internet Document,
pp.17-43 Retrieved August 2014, 02 from
http://www.statssa.gov.za/publications/P03014/P030142011.pdf
Sunter., C. (2012) ESOPs are top of the pops, Article, News24, Pretoria, South
Africa, Retrieved July 2016, 08 from
http://www.news24.com/Columnists/ClemSunter/ESOPs-are-top-of-the-pops-
20120222
The National Center for Employee Ownership. (n.d.) Employee Stock Option
Factsheet, Internet Article, Retrieved November 22, 2013 from www.nceo.org:
http://www.nceo.org/articles/employee-stock-options-factsheet
Van Der Berg, S. (2010) Current poverty and income distribution in the context of
South African history, Working Paper, University of Stellenbosch, Stellenbosch,
South Africa, pp. 3-6
Visser, W. (2004) Sustainable business futures: setting the global agenda for
corporate responsibility and ‘ubuntu’ capitalism, B. Bowes, S. Pennington and G.
Lundy, South Africa, 2014, pp.349-351
Voison Law Firm, Volaw Group. (2007) Employee Share Ownership Plans, Internet
Document, pp.1-2, Retrieved August 2014, 02 from www.voisinlaw.com:

100
http://www.voisinlaw.com/Briefing%20Notes/Employee%20Share%20Ownership%
20Plans%20(ESOPs)%20Nov%2007.pdf
Winther, G. and Marens, R. (1997) Participatory democracy may go a long Way:
Comparative growth performance of employee ownership firms in New York and
Washington States, Economic and industrial democracy, Vol. 18, No.3, pp. 393-422
Wu, C.-C. & Moodley, C. (2009) A SUMMARY OF THE BEE TRANSACTIONS IN
THE MINING SECTOR 2004-2008, Internet Document, pp. 5-14 Retrieved June 25,
2013 from www.empowerdex.co.za:
http://www.empowerdex.co.za/Portals/5/docs/Research/A%20summary%20of%20
BEE%20Transactions%20in%20Mining%202002%20-%202008.pdf

101
9 APPENDICES
Appendix 1: Summarised HDSA ownership results
SECTOR HDSA OWNERSHIP (%)
PARTICIPANTS (million)
MIN. NET VALUE (R billion)
MAX. NET VALUE (R billion)
Mining Industry 37.7 7.0 155.32 282.018
Black investors 22.8
Community 10.8
ESOPs 4.2
PGM 39.5 2.77 43.442 65.987
Black investors 19.5
Community 18
ESOPs 2
Gold 28.8 0.14 7.182 32.267
Black investors 18.6
Community 0.9
ESOPs 9.2
Coal 43.9 1.75 24 49.512
Black investors 32
Community 5.3
ESOPs 6.3
Diamonds 26 0.11 0.616 5.29
Black investors 4.4
Community 11.6
ESOPs 10
Iron Ore 38.2 1.48 53.22 115.33
Black investors 24
Community 12
ESOPs 2.2
Manganese 50.1 0.41 -0.436 8.389
Black investors 33.3
Community 16.3
ESOPs 0
Chrome 28.1 0.45 1.824 5.242
Black investors 15.9
Community 7
ESOPs 5.2

102
Appendix 2: Summary of Anglo American Platinum Atlatsa/Bokoni
empowerment deal
Sources of funds Rmil Application of funds Rmil
Atlatsa/Pelawan/Plateau
Plateau “A” prefs issued to APL
1, 193 Equity acquired in Holdco 2, 600
Pelawan “B” prefs offered to APL
1, 100 Repayment of bridge finance to APL
93
APL free contribution to communities and ESOP
149
Total 1* 2, 442 Total 2* 2, 693
SBC loan 500 Costs, community, ESOP 249
2, 942 2, 942

103
Appendix 3: Anglo American Platinum Joint Ventures (JVs)
BEE partner Asset Status
ARM Mining
Consortium:
- 83% ARM;
- 17%
Communities
Modikwa AAP contributed mineral rights to the 50:50 JV for
no consideration. The mine is at steady state
production. ARM is a listed company with
substance and significant other interests and should
be able to stand behind its own obligations. AAP
has been vendor-funded, through a loan, ARM’s
and, to an extent, the community’s portion of the
expansion capital. Should Modikwa underperform,
this loan could be at risk of default. At present,
there is a limited risk of refinancing or default.
Approximately R17 million of the R131 million loan
has been re-paid to date.
Northam Pandora AAP gave 5% of its 50% interest to Mvelaphanda
Resources Limited (“Mvela”) – now a subsidiary of
Northam - and sold another 2.5% for R65
million. The R65 million remains receivable.
Bakgatla Union Royalty agreement conversion and purchase
consideration of R420 million in return for 15%
participation interest. All funding to Bakgatla has
been repaid. The Bakgatla has assets and it is
unlikely that Anglo American would need to provide
funding to the Bakgatla. The Bakgatla have
expressed a desire to take up an additional 11% of
Union. The additional take up right would be on a
commercial basis and not vendor funded by Anglo
American.

104
Africa Wide
Minerals
Prospecting a
subsidiary of
Wesizwe
Platinum
Limited
Wesizwe AAP holds 211.9 million shares in Wesizwe (26.6%).
An equalisation payment amounting to circa
US$18m is still due by Wesizwe. Wesizwe
completed a deal with Jinchuan in May 2011, which
would fund the entire project capital of the
company’s project to full production through debt
and equity.
RBN BRPM The BRPM JV was initially established in 2002 as a
50:50 JV between Royal Bafokeng Resources
(Proprietary) Limited and AAP. The JV was
reconfigured in 2009 to enable RB Resources to
acquire a majority 67%interest in the JV with the
remaining 33% held by AAP
RB Plat was formed as a new company with a 67%
ownership in the BRPM JV. From the 4th January
2010, operational control of BRPM vested with RB
Plat. The successful listing of RB Plat on the JSE
took place in November 2010 with AAP, holding an
effective interest in the listed company of
12.6%. AAP received R1.452 billion by selling
shares in the IPO process.

105
Appendix 4: Funding model for Anglo-Inyosi Coal
Source of funds Rmil Application of funds Rmil
Equity Contribution 185 Acquisition capital 6, 971
Equity Inyosi 50 Project expenditure 4, 400
Equity ASAC 135
Preference shares
Preference shares ASAC
6, 786
Debt finance
Loan facility AASAF
4, 400
Total 11, 371 11, 371

106
Appendix 5: Ponahalo-funding Structure
Sources of funds Rmil Application of funds Rmil
Equity Contributions to Ponahalo
10 Acquisition of 26% in DBCM 3 710
Equity 10
Preference shares to Ponahalo
3 700
Preference shares Standard
2 900
Guaranteed preference shares Standard
800
Debt finance
Loan facility AASAF
4 400
Total 3 710 3 710