employee engagement: “are we engaged or just going...
TRANSCRIPT
© 2017. Archbright. All rights reservedSlide 1
Employee Engagement: “Are We Engaged or Just Going Steady?”
Joseph Marth, PhD
Vice President of Business Solutions
© 2017. Archbright. All rights reservedSlide 2
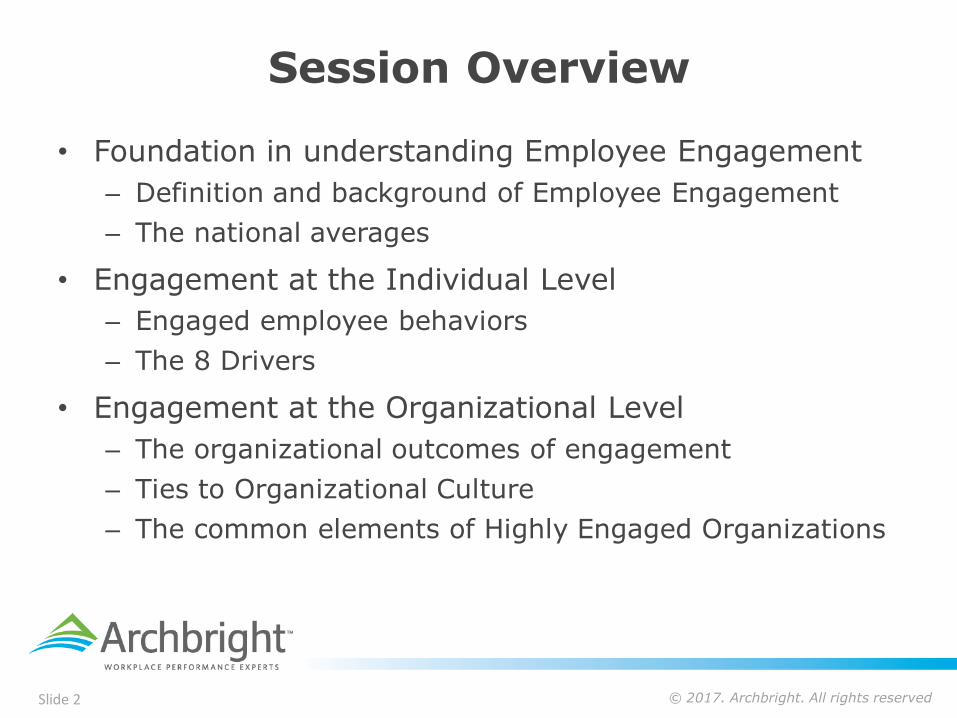
Session Overview
• Foundation in understanding Employee Engagement
– Definition and background of Employee Engagement
– The national averages
• Engagement at the Individual Level
– Engaged employee behaviors
– The 8 Drivers
• Engagement at the Organizational Level
– The organizational outcomes of engagement
– Ties to Organizational Culture
– The common elements of Highly Engaged Organizations
© 2017. Archbright. All rights reservedSlide 3
© 2017. Archbright. All rights reservedSlide 4
Remember when…
• Recall a time in your career when you were highly satisfied and engaged in your job.
• What were the reasons you were so happy?
• In your pair/triad:
• Have each member describe their experience and the supporting reasons
• Identify common themes
© 2017. Archbright. All rights reservedSlide 5
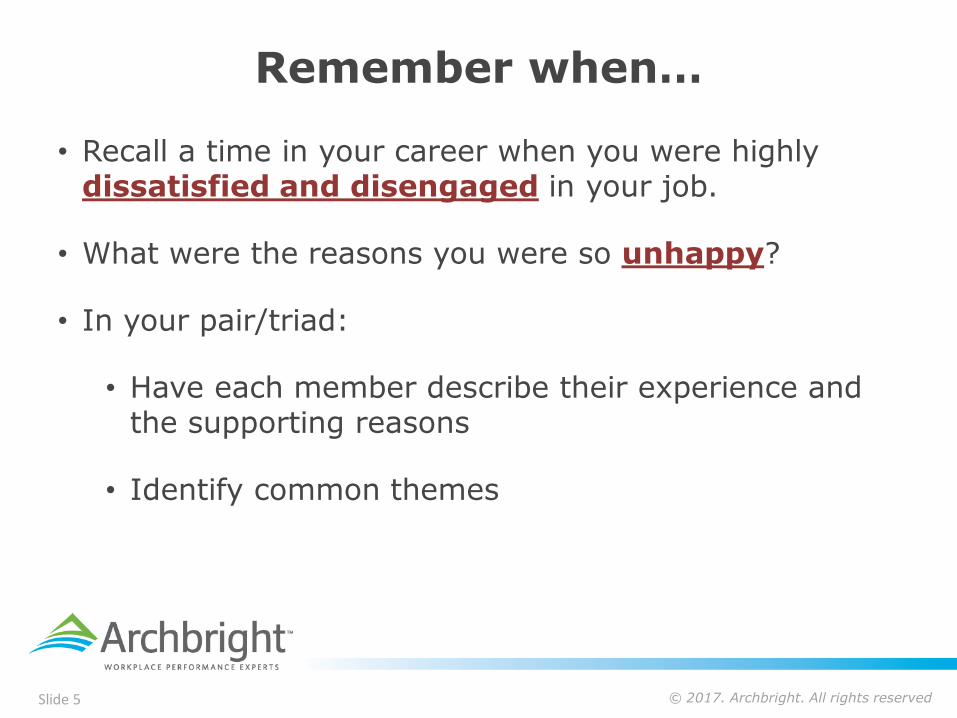
Remember when…
• Recall a time in your career when you were highly dissatisfied and disengaged in your job.
• What were the reasons you were so unhappy?
• In your pair/triad:
• Have each member describe their experience and the supporting reasons
• Identify common themes
© 2017. Archbright. All rights reservedSlide 6
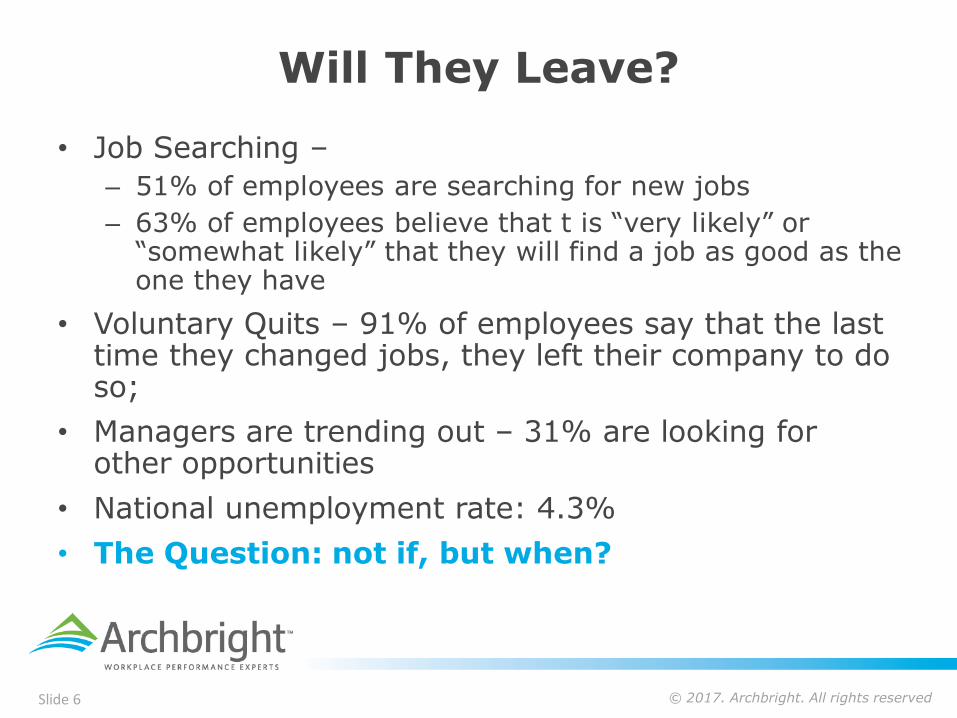
Will They Leave?
• Job Searching –
– 51% of employees are searching for new jobs
– 63% of employees believe that t is “very likely” or “somewhat likely” that they will find a job as good as the one they have
• Voluntary Quits – 91% of employees say that the last time they changed jobs, they left their company to do so;
• Managers are trending out – 31% are looking for other opportunities
• National unemployment rate: 4.3%
• The Question: not if, but when?
© 2017. Archbright. All rights reservedSlide 7
Employee Engagement at the Foundation Level
© 2017. Archbright. All rights reservedSlide 8
Employee Engagement
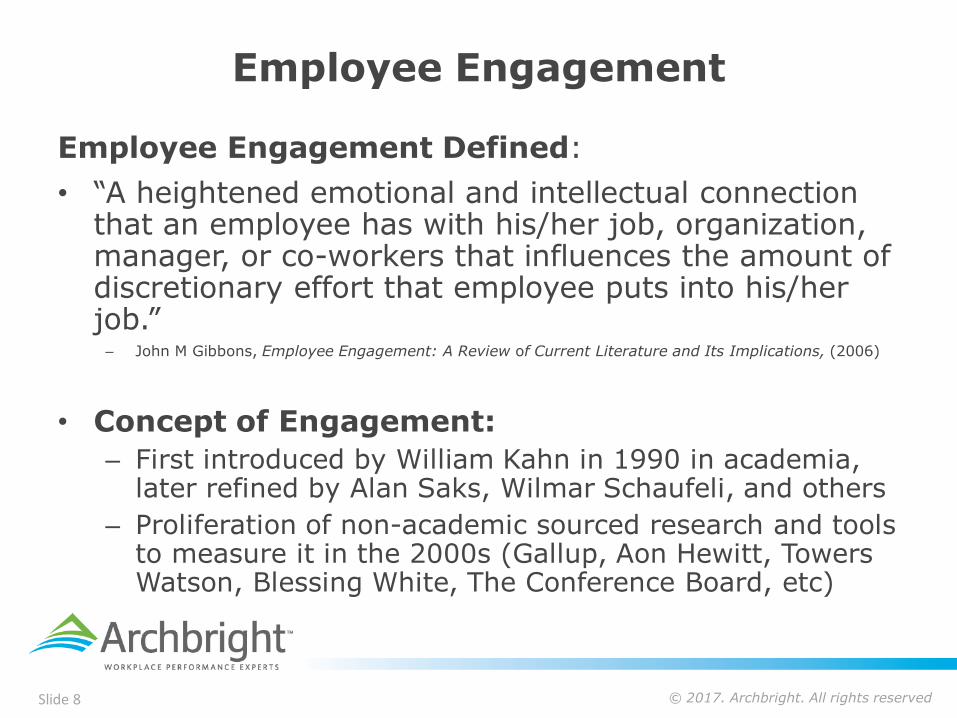
Employee Engagement Defined:
• “A heightened emotional and intellectual connection that an employee has with his/her job, organization, manager, or co-workers that influences the amount of discretionary effort that employee puts into his/her job.” – John M Gibbons, Employee Engagement: A Review of Current Literature and Its Implications, (2006)
• Concept of Engagement:
– First introduced by William Kahn in 1990 in academia, later refined by Alan Saks, Wilmar Schaufeli, and others
– Proliferation of non-academic sourced research and tools to measure it in the 2000s (Gallup, Aon Hewitt, Towers Watson, Blessing White, The Conference Board, etc)
© 2017. Archbright. All rights reservedSlide 9
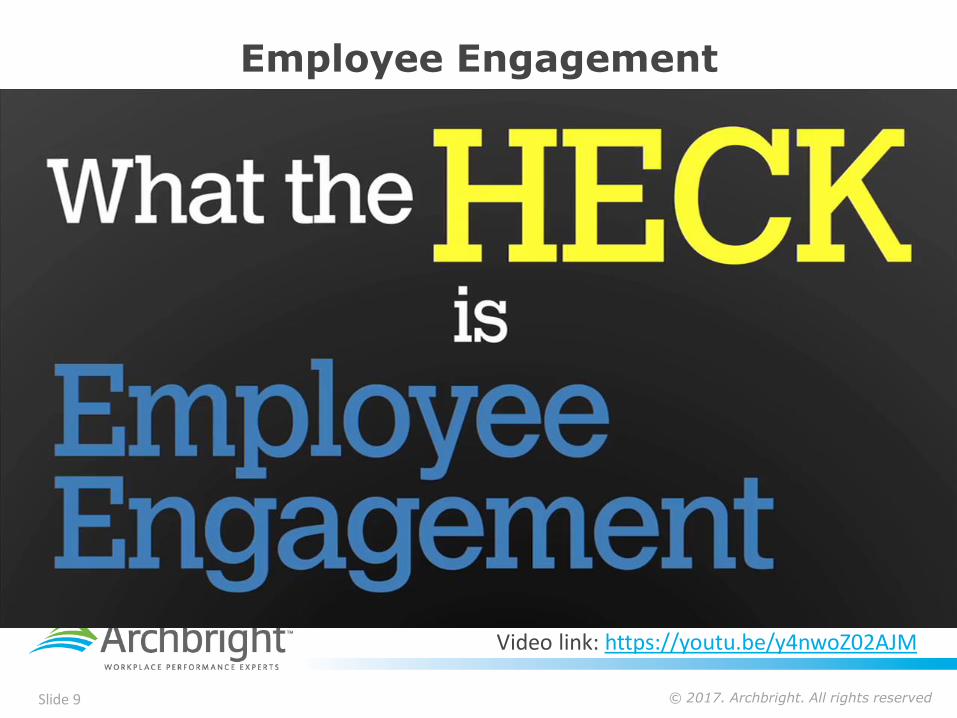
Employee Engagement
Video link: https://youtu.be/y4nwoZ02AJM
© 2017. Archbright. All rights reservedSlide 10
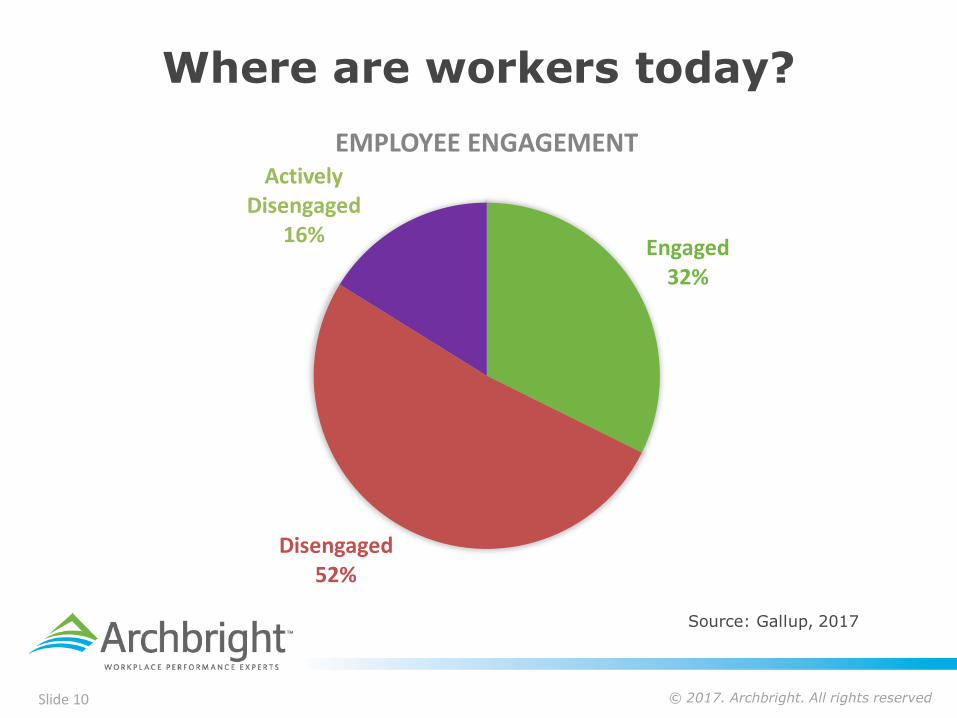
Where are workers today?
Source: Gallup, 2017
Engaged32%
Disengaged52%
Actively Disengaged
16%
EMPLOYEE ENGAGEMENT
© 2017. Archbright. All rights reservedSlide 11
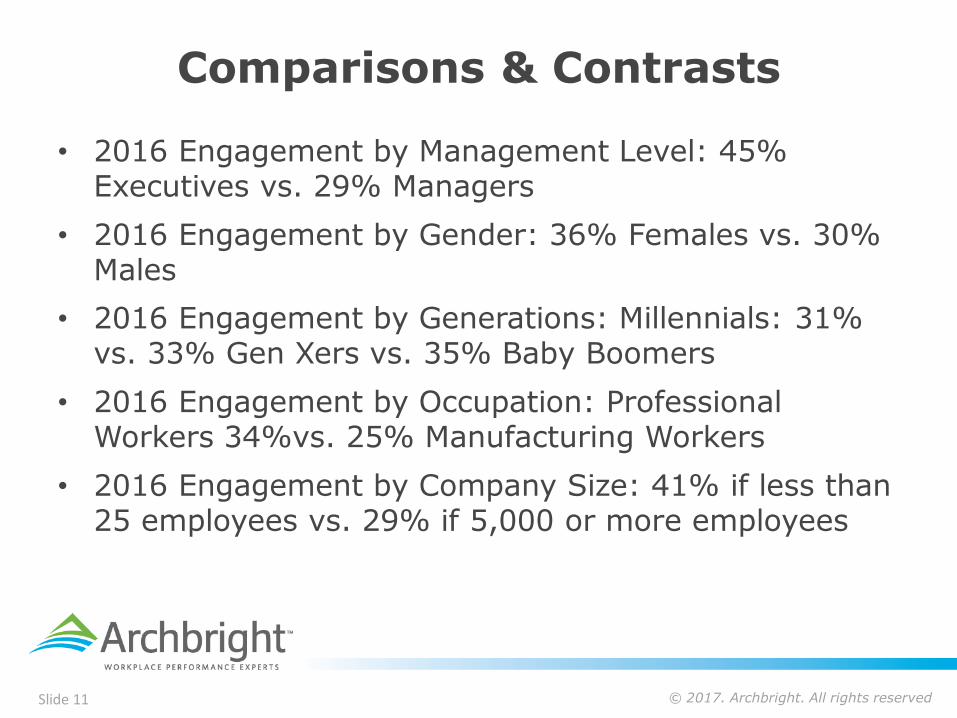
Comparisons & Contrasts
• 2016 Engagement by Management Level: 45% Executives vs. 29% Managers
• 2016 Engagement by Gender: 36% Females vs. 30% Males
• 2016 Engagement by Generations: Millennials: 31% vs. 33% Gen Xers vs. 35% Baby Boomers
• 2016 Engagement by Occupation: Professional Workers 34%vs. 25% Manufacturing Workers
• 2016 Engagement by Company Size: 41% if less than 25 employees vs. 29% if 5,000 or more employees
© 2017. Archbright. All rights reservedSlide 12
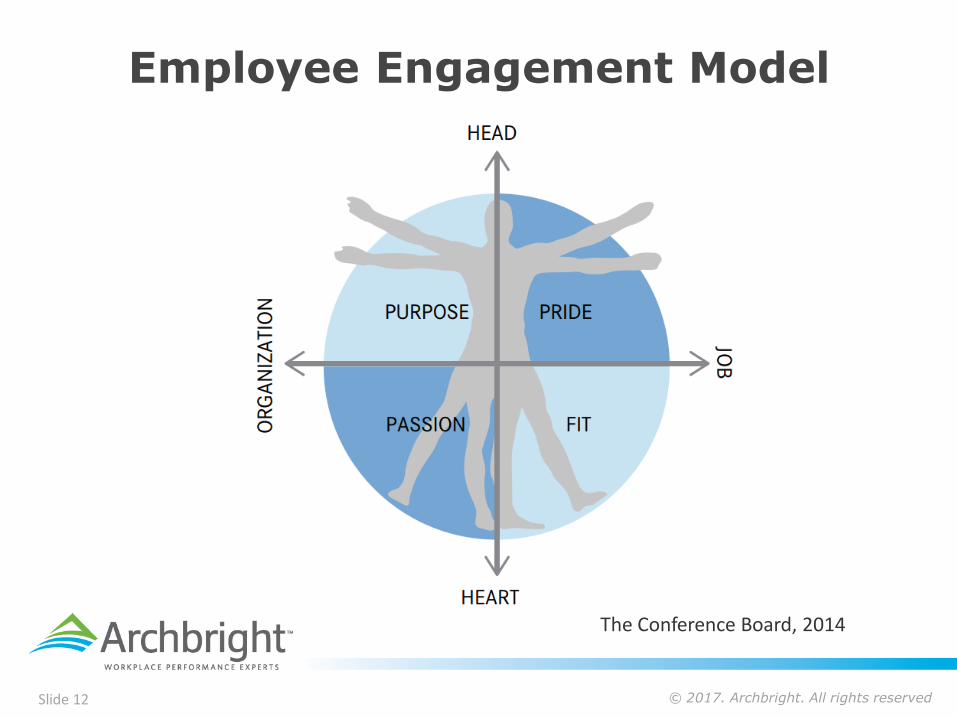
Employee Engagement Model
The Conference Board, 2014
© 2017. Archbright. All rights reservedSlide 13
© 2017. Archbright. All rights reservedSlide 14
Engagement at the Individual Level
© 2017. Archbright. All rights reservedSlide 15
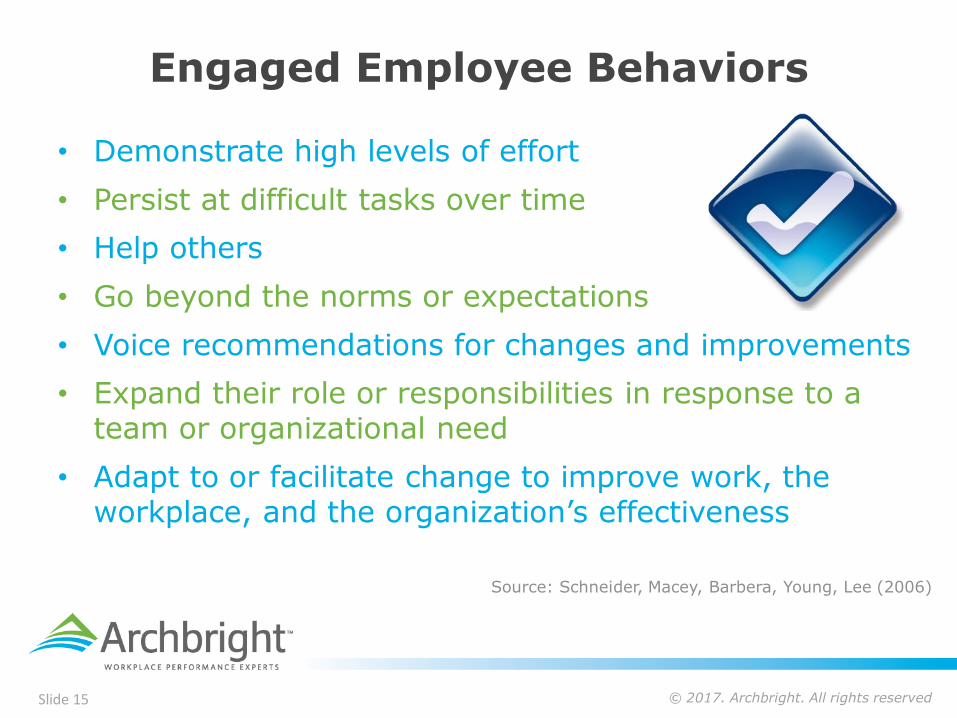
Engaged Employee Behaviors
• Demonstrate high levels of effort
• Persist at difficult tasks over time
• Help others
• Go beyond the norms or expectations
• Voice recommendations for changes and improvements
• Expand their role or responsibilities in response to a team or organizational need
• Adapt to or facilitate change to improve work, the workplace, and the organization’s effectiveness
Source: Schneider, Macey, Barbera, Young, Lee (2006)
© 2017. Archbright. All rights reservedSlide 16
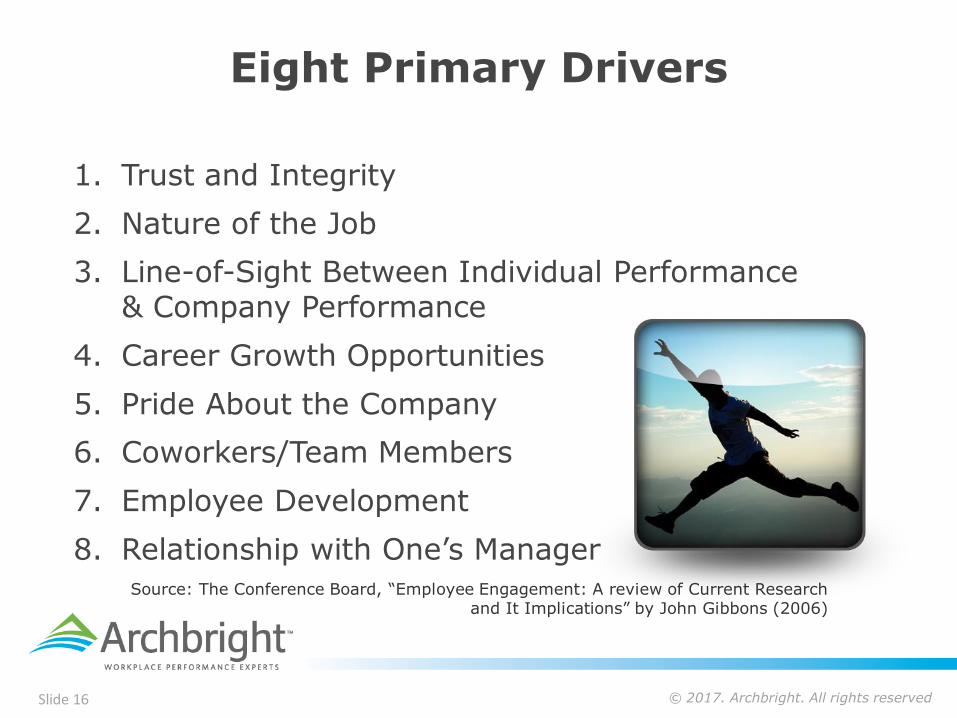
Eight Primary Drivers
1. Trust and Integrity
2. Nature of the Job
3. Line-of-Sight Between Individual Performance & Company Performance
4. Career Growth Opportunities
5. Pride About the Company
6. Coworkers/Team Members
7. Employee Development
8. Relationship with One’s ManagerSource: The Conference Board, “Employee Engagement: A review of Current Research
and It Implications” by John Gibbons (2006)
© 2017. Archbright. All rights reservedSlide 17
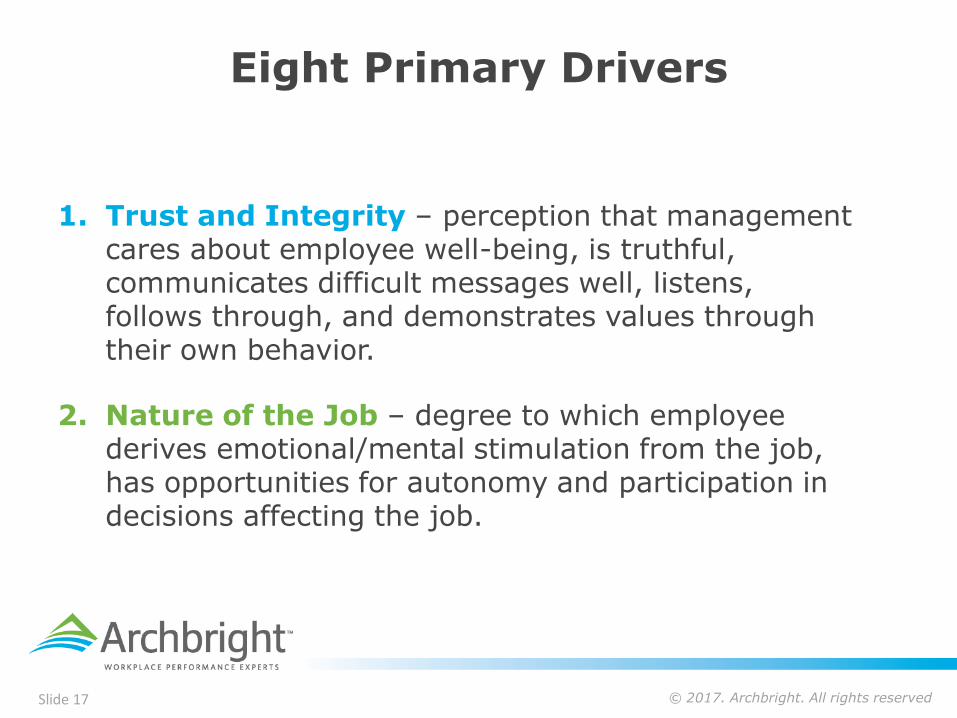
Eight Primary Drivers
1. Trust and Integrity – perception that management cares about employee well-being, is truthful, communicates difficult messages well, listens, follows through, and demonstrates values through their own behavior.
2. Nature of the Job – degree to which employee derives emotional/mental stimulation from the job, has opportunities for autonomy and participation in decisions affecting the job.
© 2017. Archbright. All rights reservedSlide 18
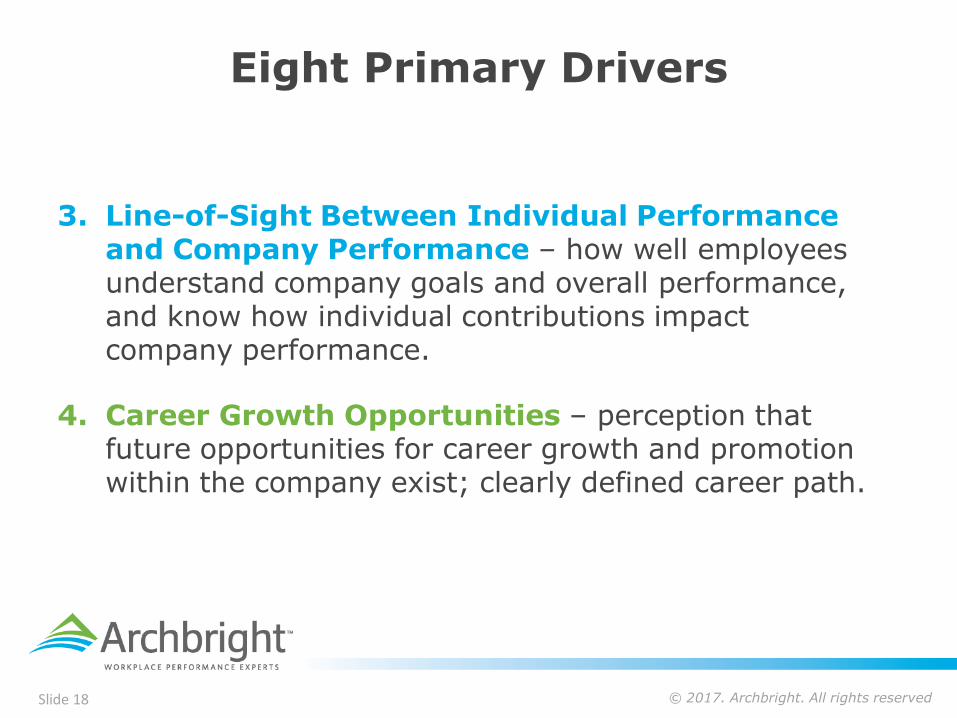
3. Line-of-Sight Between Individual Performance and Company Performance – how well employees understand company goals and overall performance, and know how individual contributions impact company performance.
4. Career Growth Opportunities – perception that future opportunities for career growth and promotion within the company exist; clearly defined career path.
Eight Primary Drivers
© 2017. Archbright. All rights reservedSlide 19
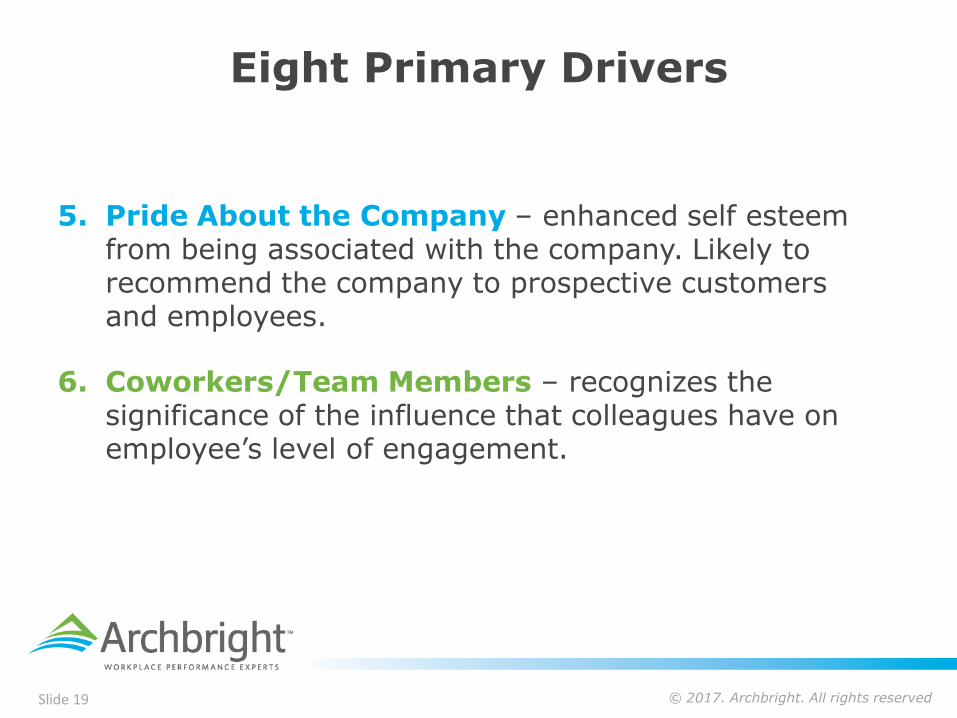
5. Pride About the Company – enhanced self esteem from being associated with the company. Likely to recommend the company to prospective customers and employees.
6. Coworkers/Team Members – recognizes the significance of the influence that colleagues have on employee’s level of engagement.
Eight Primary Drivers
© 2017. Archbright. All rights reservedSlide 20
Eight Primary Drivers
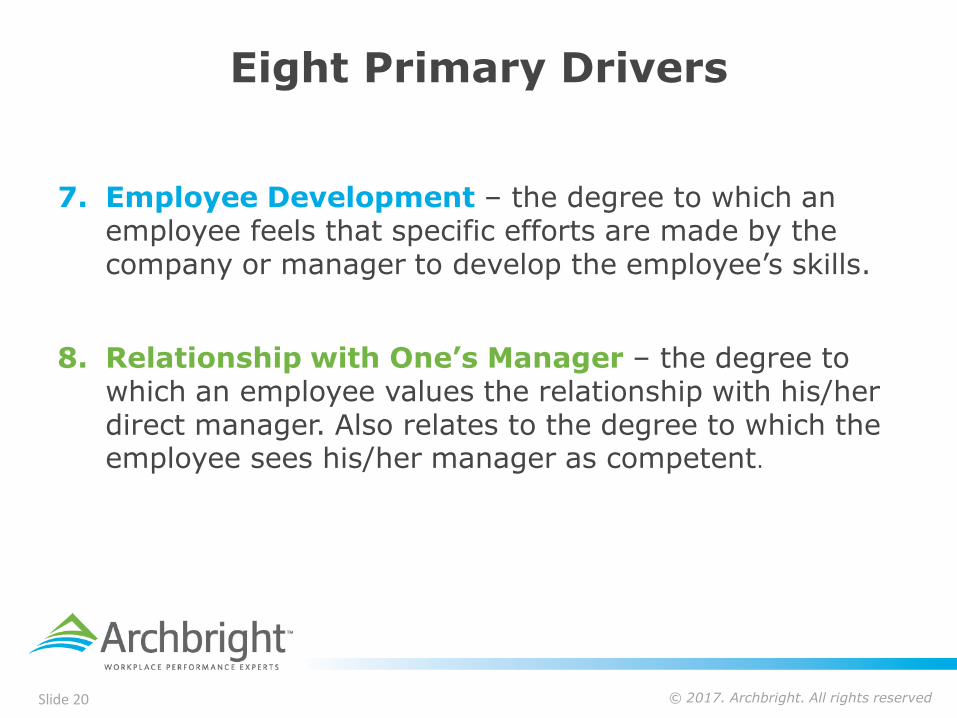
7. Employee Development – the degree to which an employee feels that specific efforts are made by the company or manager to develop the employee’s skills.
8. Relationship with One’s Manager – the degree to which an employee values the relationship with his/her direct manager. Also relates to the degree to which the employee sees his/her manager as competent.
© 2017. Archbright. All rights reservedSlide 21
Engagement at the Organizational Level
© 2017. Archbright. All rights reservedSlide 22
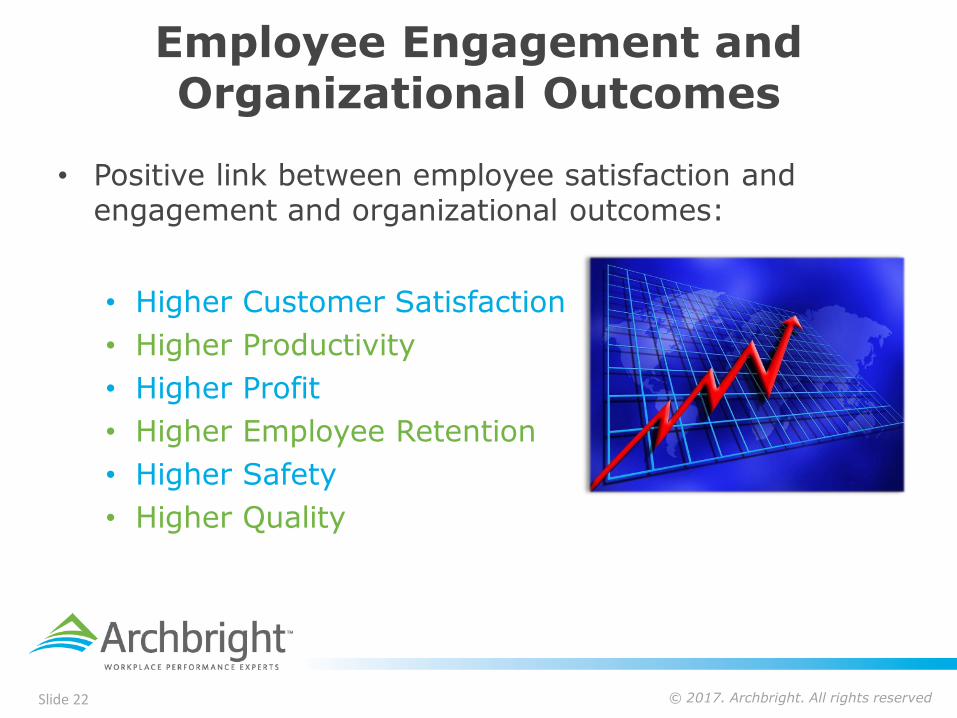
Employee Engagement and Organizational Outcomes
• Positive link between employee satisfaction and engagement and organizational outcomes:
• Higher Customer Satisfaction
• Higher Productivity
• Higher Profit
• Higher Employee Retention
• Higher Safety
• Higher Quality

© 2017. Archbright. All rights reservedSlide 23
Employee Engagement and Organizational Outcomes
• Employees who are more engaged in their work:
– more satisfied with their jobs
– less likely to leave their companies
– more likely to attain their performance objectives
• Transformation of workforce from low to high engagement translates into a $4,200 per employee annual impact in increased performance.– Source: DDI (2005), “Employee Engagement: They Key to Realizing Competitive Advantage”
© 2017. Archbright. All rights reservedSlide 24
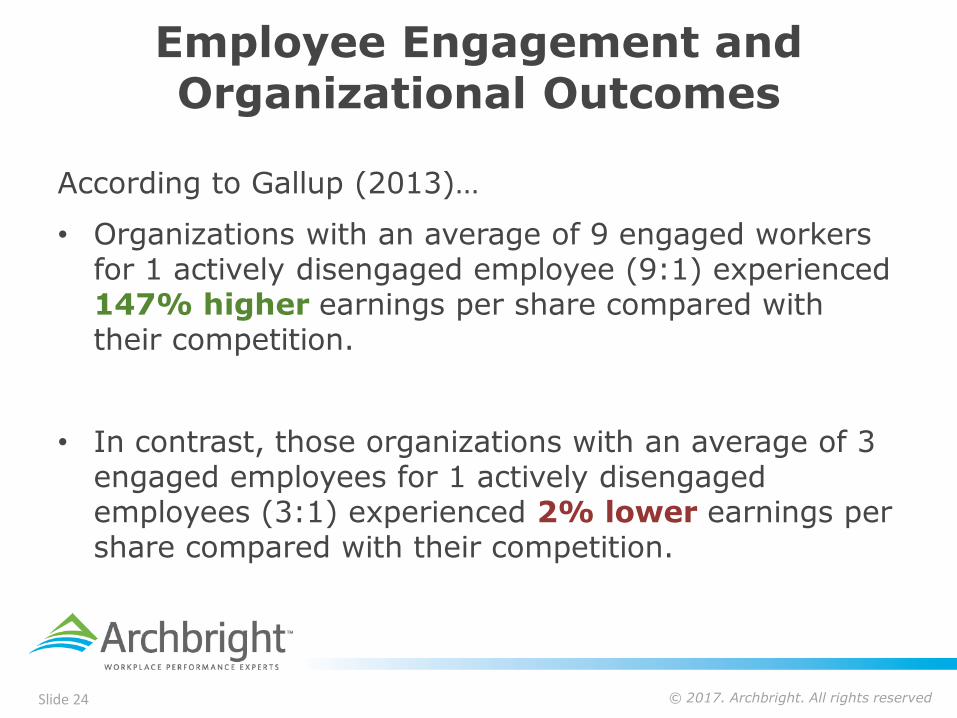
Employee Engagement and Organizational Outcomes
According to Gallup (2013)…
• Organizations with an average of 9 engaged workers for 1 actively disengaged employee (9:1) experienced 147% higher earnings per share compared with their competition.
• In contrast, those organizations with an average of 3 engaged employees for 1 actively disengaged employees (3:1) experienced 2% lower earnings per share compared with their competition.
© 2017. Archbright. All rights reservedSlide 25
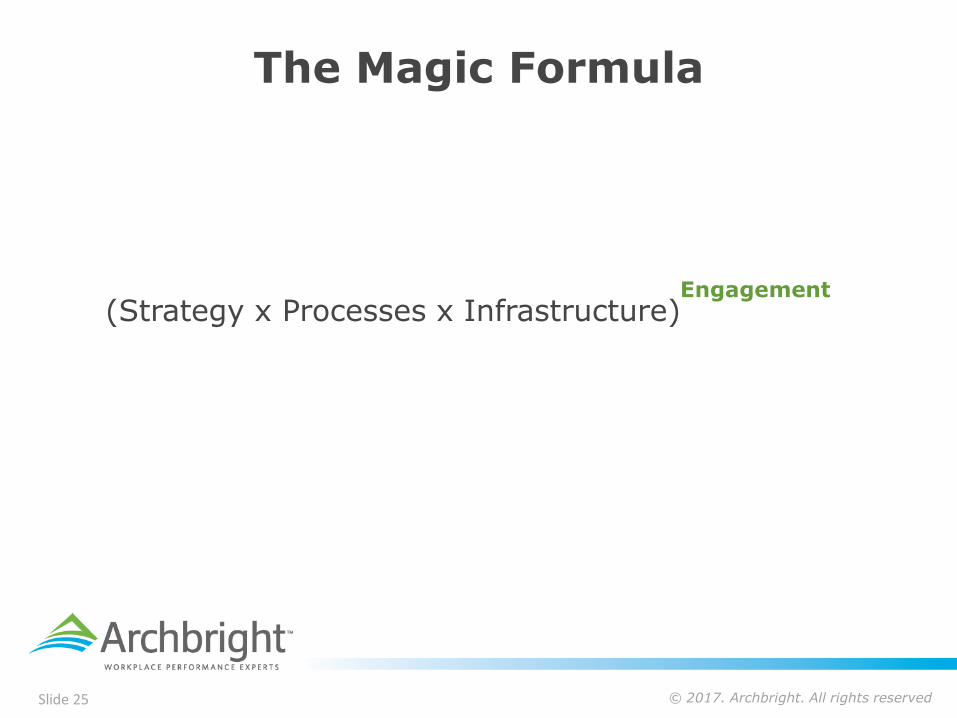
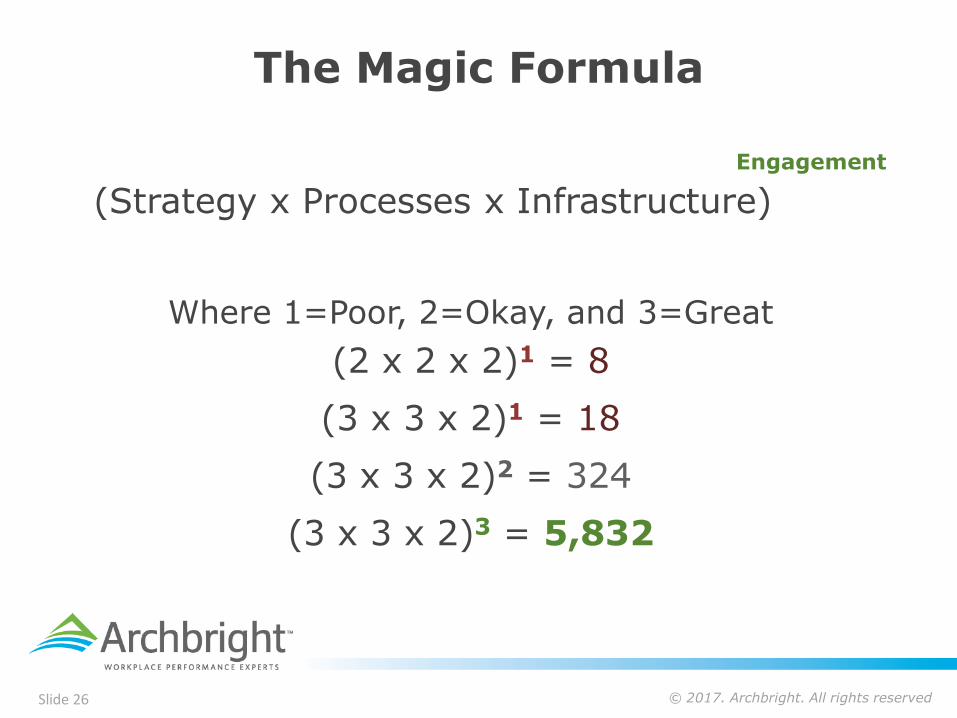
The Magic Formula
(Strategy x Processes x Infrastructure)Engagement
© 2017. Archbright. All rights reservedSlide 26
The Magic Formula
(Strategy x Processes x Infrastructure)
Engagement
Where 1=Poor, 2=Okay, and 3=Great
(2 x 2 x 2)1 = 8
(3 x 3 x 2)1 = 18
(3 x 3 x 2)2 = 324
(3 x 3 x 2)3 = 5,832
© 2017. Archbright. All rights reservedSlide 27
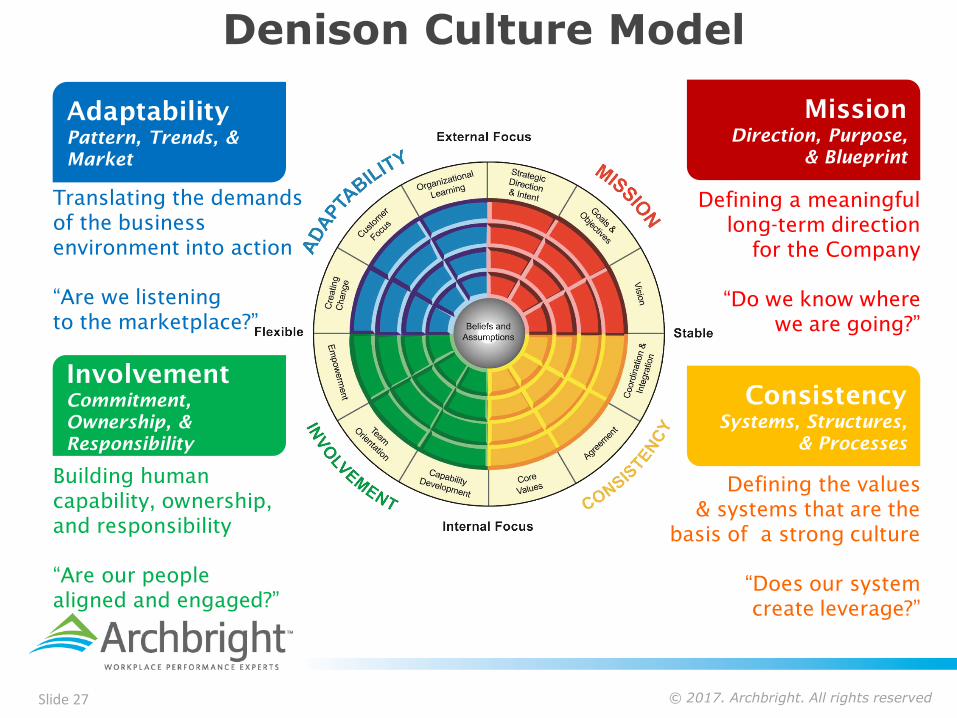
Building human
capability, ownership,
and responsibility
“Are our people
aligned and engaged?”
Adaptability
Pattern, Trends, &
Market
Mission
Direction, Purpose,
& Blueprint
Defining a meaningful
long-term direction
for the Company
“Do we know where
we are going?”
Translating the demands
of the business
environment into action
“Are we listening
to the marketplace?”
Involvement
Commitment,
Ownership, &
Responsibility
Consistency
Systems, Structures,
& Processes
Defining the values
& systems that are the
basis of a strong culture
“Does our system
create leverage?”
Denison Culture Model
© 2017. Archbright. All rights reservedSlide 28
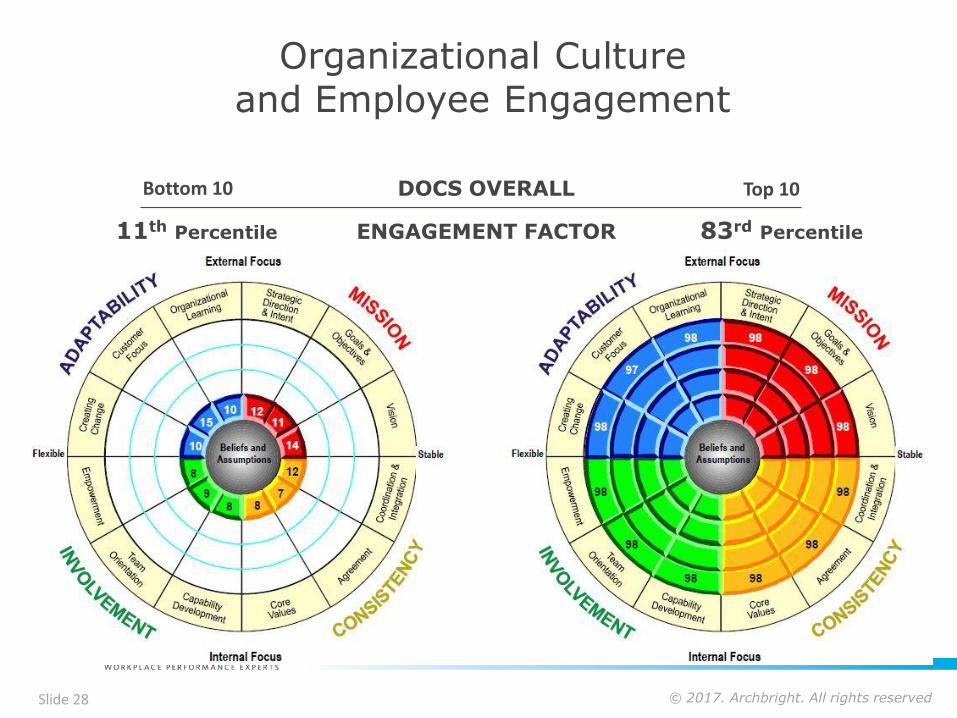
11th Percentile ENGAGEMENT FACTOR 83rd Percentile
Bottom 10 Top 10DOCS OVERALL
Organizational Cultureand Employee Engagement

© 2017. Archbright. All rights reservedSlide 29
Strongest Predictorsof Employee Engagement
© 2017. Archbright. All rights reservedSlide 30
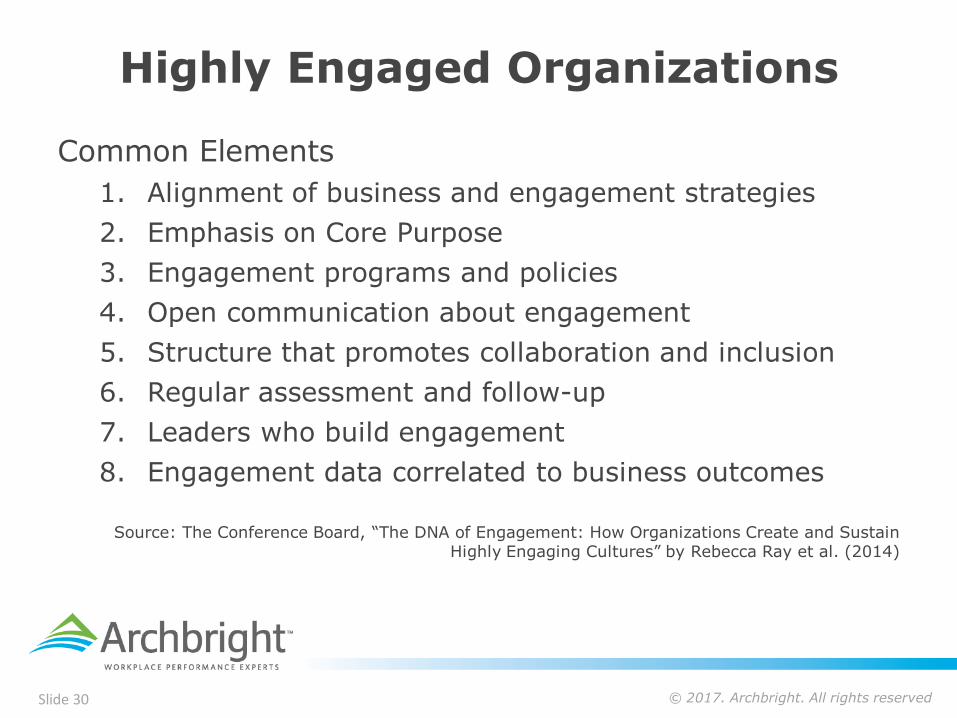
Highly Engaged Organizations
Common Elements
1. Alignment of business and engagement strategies
2. Emphasis on Core Purpose
3. Engagement programs and policies
4. Open communication about engagement
5. Structure that promotes collaboration and inclusion
6. Regular assessment and follow-up
7. Leaders who build engagement
8. Engagement data correlated to business outcomes
Source: The Conference Board, “The DNA of Engagement: How Organizations Create and Sustain Highly Engaging Cultures” by Rebecca Ray et al. (2014)
© 2017. Archbright. All rights reservedSlide 31
Strategy Alignment
73% of the high engagement companies…
• Integrate engagement in business decisions
• Expect organization members to embrace it
• Weave it throughout the business
• Recognize how engagement brings tangible benefits
© 2017. Archbright. All rights reservedSlide 32
What Does It Look Like?
Whole Foods Market…
• Everyone is responsible for engagement
• Team members are expected to work well together and so they decide collectively who gets hired
– After a new hire works for a 30 to 90 day trial period, the team takes a vote on whether or not to continue their employment
© 2017. Archbright. All rights reservedSlide 33
© 2017. Archbright. All rights reservedSlide 34
Core Purpose
More than half of high engagement companies…
• Describe their engagement culture as being heavily defined by their values, mission and vision
© 2017. Archbright. All rights reservedSlide 35
What Does It Look Like?
Quicken Loans…
• New employees attend an 8-hour session on company values and behaviors, led by the Company founder and chairman and the CEO.
Zappos…
• “We have 10 core values, and when we hire people, we make sure they have similar values. For example, one of our values is to be humble. If someone comes in and is really egotistical, even if they are the greatest, most talented person technically and we know they could do a lot for our top or bottom line, we won’t hire them, because they’re not a culture fit.”
– Tony Hsieh CEO, Zappos.com
© 2017. Archbright. All rights reservedSlide 36
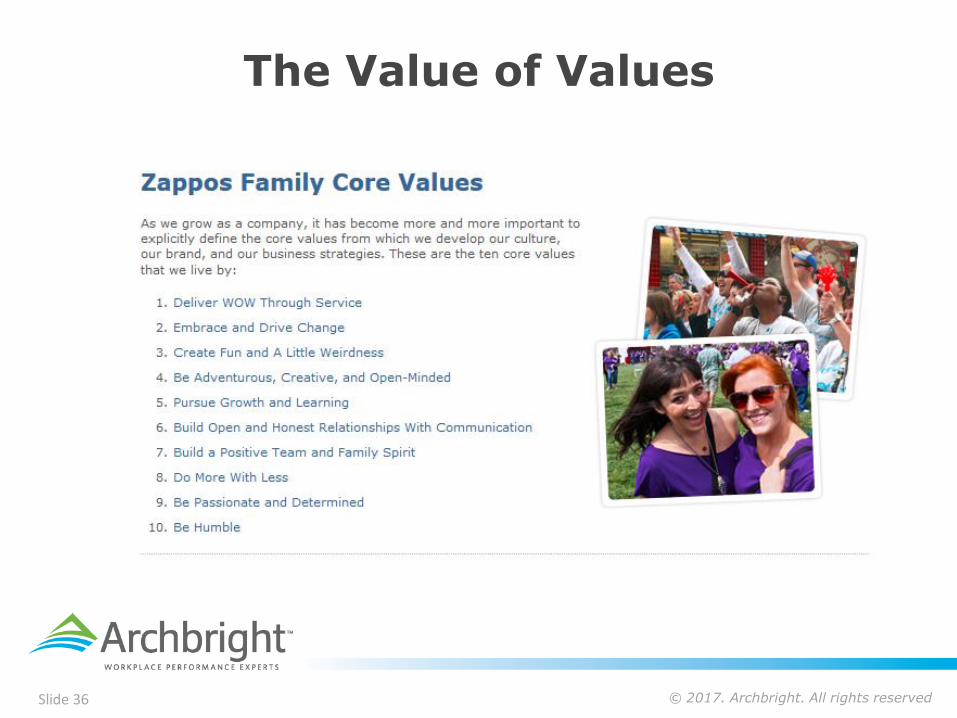
The Value of Values
© 2017. Archbright. All rights reservedSlide 37
The Value of Values
Video link: https://youtu.be/5CcLIPaUz3E
© 2017. Archbright. All rights reservedSlide 38
Policies and Programs
82% of the high engagement companies…
• Promote engagement in programs and policies throughout the employment lifecycle
• Integrate engagement practices with leadership development, and diversity and inclusion programs
• One size does not fit all…
• no common programs or policies across all companies
• programs are tailored to unique cultures and engagement strategies
© 2017. Archbright. All rights reservedSlide 39
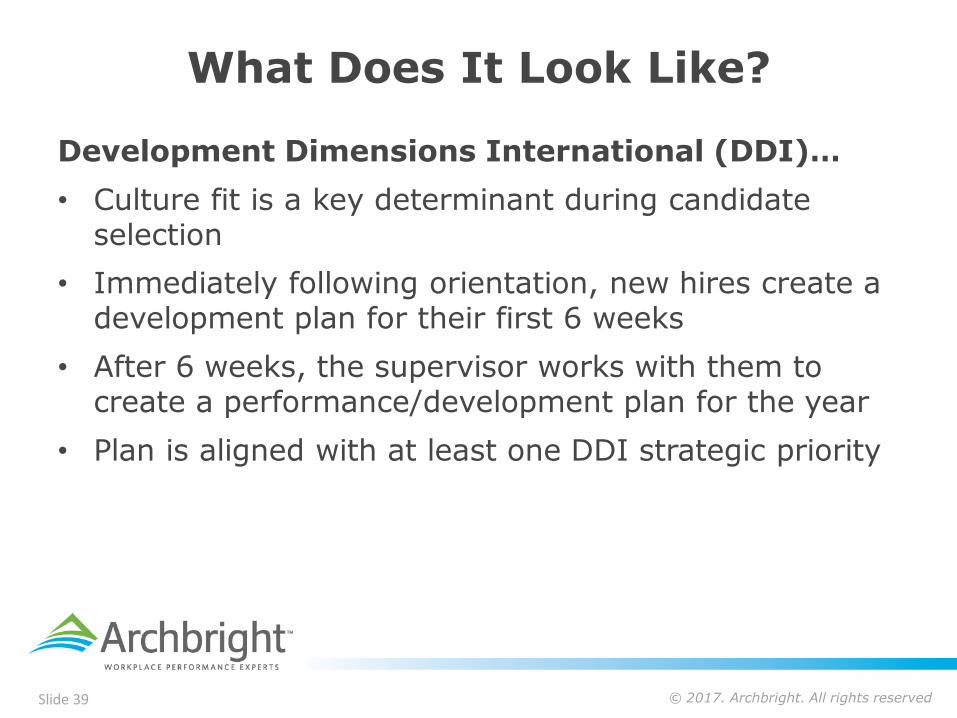
What Does It Look Like?
Development Dimensions International (DDI)…
• Culture fit is a key determinant during candidate selection
• Immediately following orientation, new hires create a development plan for their first 6 weeks
• After 6 weeks, the supervisor works with them to create a performance/development plan for the year
• Plan is aligned with at least one DDI strategic priority
© 2017. Archbright. All rights reservedSlide 40
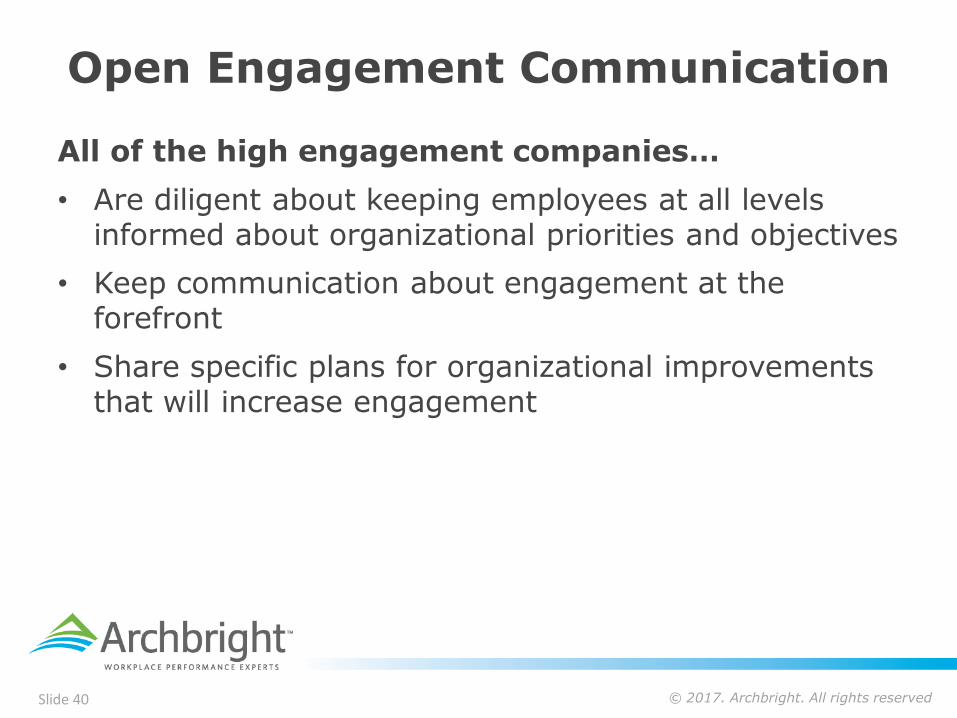
Open Engagement Communication
All of the high engagement companies…
• Are diligent about keeping employees at all levels informed about organizational priorities and objectives
• Keep communication about engagement at the forefront
• Share specific plans for organizational improvements that will increase engagement
© 2017. Archbright. All rights reservedSlide 41
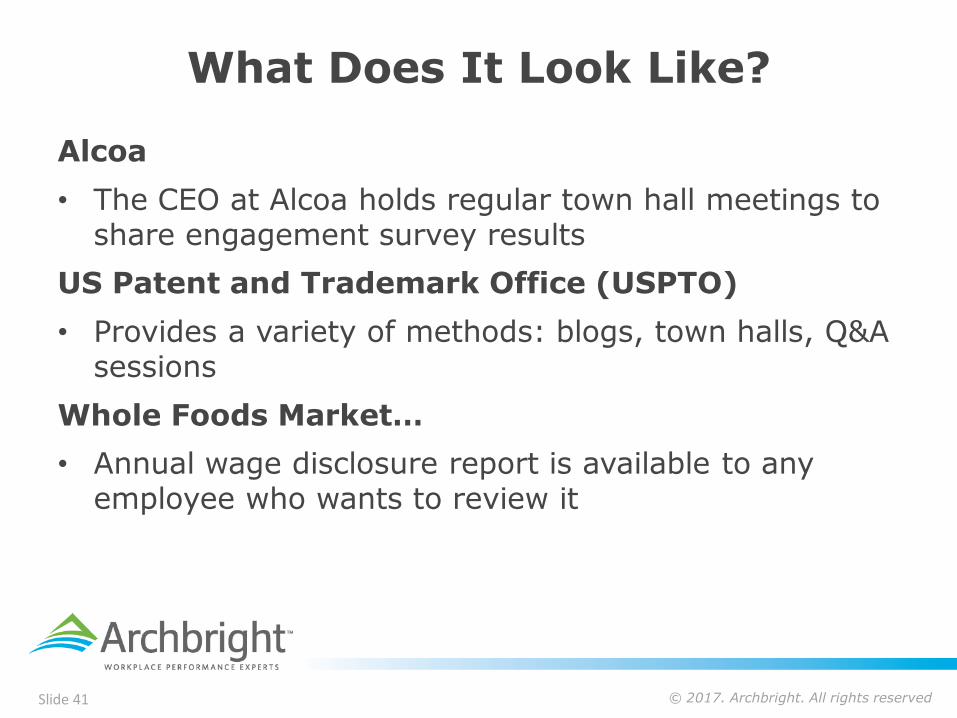
What Does It Look Like?
Alcoa
• The CEO at Alcoa holds regular town hall meetings to share engagement survey results
US Patent and Trademark Office (USPTO)
• Provides a variety of methods: blogs, town halls, Q&A sessions
Whole Foods Market…
• Annual wage disclosure report is available to any employee who wants to review it
© 2017. Archbright. All rights reservedSlide 42
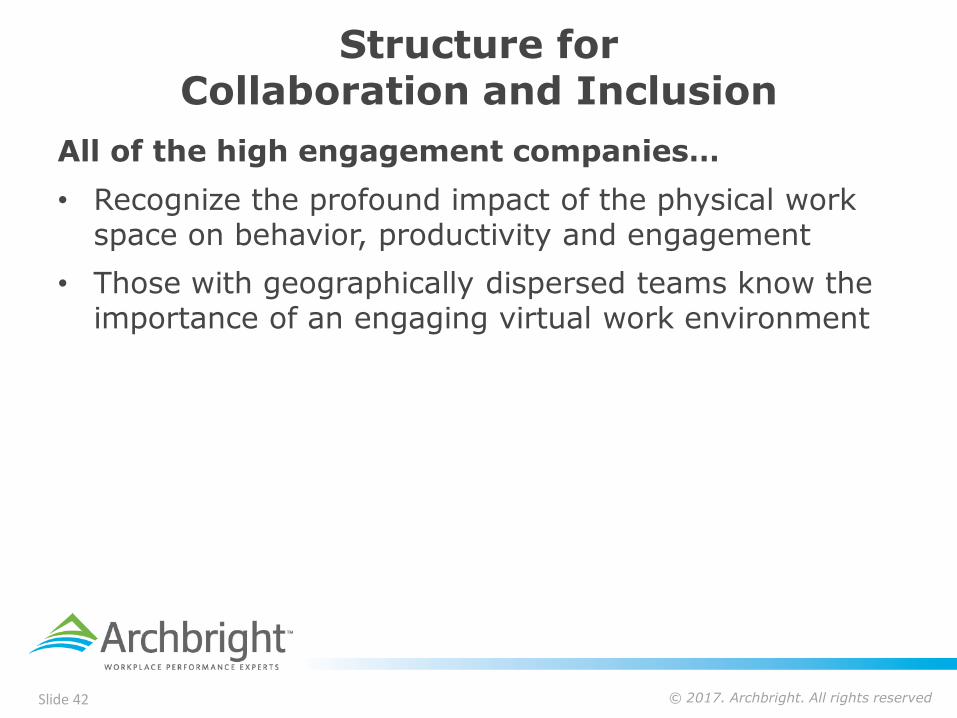
Structure for Collaboration and Inclusion
All of the high engagement companies…
• Recognize the profound impact of the physical work space on behavior, productivity and engagement
• Those with geographically dispersed teams know the importance of an engaging virtual work environment
© 2017. Archbright. All rights reservedSlide 43
What Does It Look Like?
Deloitte
• Their Leadership Center built to provide a space for dispersed workforce to come together for connection and learning
Quicken Loans
• Work space designed for “fun and functionality”
• Colorful décor
• Materials that dampen sound
• Spaces to go relax
© 2017. Archbright. All rights reservedSlide 44
Regular Assessment and Follow-up
Over 80% the high engagement companies…
• Have formal processes for surveying engagement
• Those without formal processes still track engagement
• All have defined practices for making the data actionable
© 2017. Archbright. All rights reservedSlide 45
What Does It Look Like?
Alcoa…
• Annual Global Voices Survey (GVS)
• Voluntary, anonymous participation
• “Survey Champions” communicate survey results to business managers, promote participation, encourage action planning and follow through
• GVS results from 100’s of locations become location-specific action plans for improving engagement
© 2017. Archbright. All rights reservedSlide 46
Leader Expectations
91% of the high engagement companies…
• Hold executives and senior management accountable for acting on survey results
92% of the high engagement companies…
• Require managers and front-line supervisors to hold forums to share results with their employees and collaboratively create action plans
© 2017. Archbright. All rights reservedSlide 47
What Does It Look Like?
DDI…
• Analyzes data for themes and trends
• Generates business unit and team reports
• Distributes detailed plan from the President describing expectations for sharing/acting upon results
• Department managers submit action plans to the President
© 2017. Archbright. All rights reservedSlide 48
Engagement Data Correlates to Business Impact
All of the high engagement companies…
• Use employee feedback and engagement data to drive their business results
• Track engagement scores year over year
• Measure impact on specific performance indicators:
– Turnover and retention
– Diversity and inclusion
– Business unit performance
– Brand and reputation
– Well being
– Customer satisfaction
© 2017. Archbright. All rights reservedSlide 49
What Does It Look Like?
Whole Foods
• Uses data from annual survey to identify specific aspects of morale that correlate to performance outcomes such as higher productivity and sales
US Patent and Trademark Office (USPTO)
• Leader in teleworking programs
– Avoided in excess of $30 million real estate costs
– Inclement weather has no effect on office hours
– Saved 6 million gallons of gas / 27,000 tons of emission into the atmosphere
© 2017. Archbright. All rights reservedSlide 50
Leadership is Key
Leaders are the enablers of highly engaged cultures
• Authorize programs and practices
• Approve award systems
• Articulate the Vision
• Decide on strategy
• Are accountable for business success
© 2017. Archbright. All rights reservedSlide 51
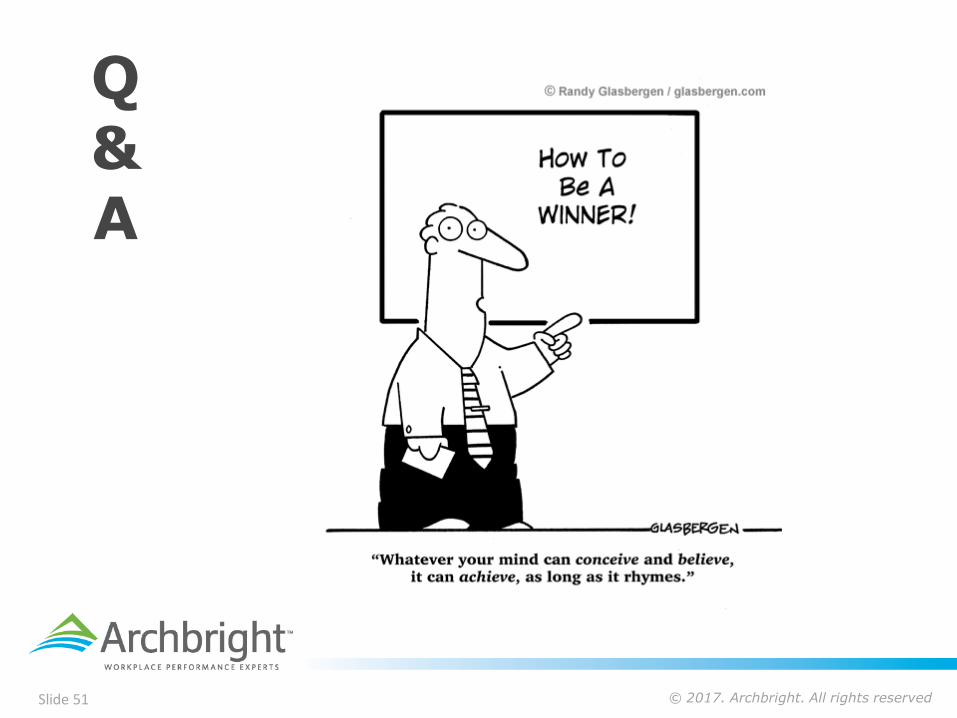
Q &A
© 2017. Archbright. All rights reservedSlide 52
Thank You!
Contact Information:
• Joseph Marth, PhD – Vice President
• 206.664.7165