empirically evaluating and developing alarm rate standards
TRANSCRIPT

Louisiana State UniversityLSU Digital Commons
LSU Master's Theses Graduate School
2010
Empirically evaluating and developing alarm ratestandards for liquid pipeline control roomoperatorsGlen David Uhack IILouisiana State University and Agricultural and Mechanical College
Follow this and additional works at: https://digitalcommons.lsu.edu/gradschool_theses
Part of the Construction Engineering and Management Commons
This Thesis is brought to you for free and open access by the Graduate School at LSU Digital Commons. It has been accepted for inclusion in LSUMaster's Theses by an authorized graduate school editor of LSU Digital Commons. For more information, please contact [email protected].
Recommended CitationUhack II, Glen David, "Empirically evaluating and developing alarm rate standards for liquid pipeline control room operators" (2010).LSU Master's Theses. 4148.https://digitalcommons.lsu.edu/gradschool_theses/4148
EMPIRICALLY EVALUATING AND DEVELOPING ALARM RATE STANDARDS FOR
LIQUID PIPELINE CONTROL ROOM OPERATORS
A Thesis
submitted to the Graduate Faculty of the
Louisiana State University and
Agricultural and Mechanical College
in Partial Fulfillment of the
requirements for the degree of
Master of Science in Industrial Engineering
in
The Department of Construction Management and Industrial Engineering
by
Glen D. Uhack II
B.S., University of New Orleans, 2007
May 2010

ii
ACKNOWLEDGMENTS
I would like to thank my major professor Dr. Craig Harvey for the guidance, direction,
and support throughout this research. I would also like to thank the members on my committee,
Dr. Fereydoun Aghazadeh and Dr. Gerald Knapp, for their guidance, direction, and support
throughout my research.
We would like to thank all of the participants who volunteered and participated in this
study. Their participation and feedback have contributed valuable new data towards
understanding human factors in pipeline control rooms. We appreciate their willingness to
provide time out of their schedules and the observations obtained from this work.
We thank the Center for Operator Performance for their support, funding, and guidance
throughout the progression of this work.

iii
TABLE OF CONTENTS
ACKNOWLEDGMENTS ....................................................................................................... II
ABSTRACT......................................................................................................................... VIII
LIST OF TABLES……………………………………………………………………..……….VI
LIST OF FIGURES………………………………………………………………………...…VII
CHAPTER 1. INTRODUCTION ...........................................................................................1
1.1 Rational and Objectives ......................................................................................................2
CHAPTER 2. LITERATURE REVIEW................................................................................4
2.1 Human Factors Considerations ...........................................................................................4
2.2 Operator Training ...............................................................................................................4
2.3 HMI Interface .....................................................................................................................8
2.3.1 Console Design – Physical Design Considerations .....................................................9
2.3.2 Graphical User Interface – Cognitive Design Considerations ................................... 10
2.4 Operator Fatigue Considerations....................................................................................... 15
2.5 Situational Awareness ...................................................................................................... 16
2.6 Alarm System Lifecycle and Benchmarking Standards ..................................................... 17
2.6.1 Introduction to the Challenge ................................................................................... 17
2.6.2 Alarm Management Lifecycle .................................................................................. 17
2.6.2.1 Alarm Philosophy......................................................................................... 18
2.6.2.2 Identification ................................................................................................ 20
2.6.2.3 Rationalization ............................................................................................. 20
2.6.2.4 Design of Alarms ......................................................................................... 21
2.6.2.5 Implementation ............................................................................................ 22
2.6.2.6 Operation ..................................................................................................... 22
2.6.2.7 Lifecycle Loops (Maintenance, Performance Monitoring, and MOC) ........... 23
2.6.2.8 Assessment .................................................................................................. 23
2.7 Observed Alarm Performance vs. EMMUA No. 191 Standard of Performance ................. 24
2.7.1 Analysis of the Results ............................................................................................. 24
2.7.2 Interpretations .......................................................................................................... 25
2.8 HMI Studies ..................................................................................................................... 26
2.9 Roles and Responsibilities of the Operator........................................................................ 28
2.10 Summary of Literature Review ......................................................................................... 29
CHAPTER 3. EXPERIMENTAL METHOD AND PROCEDURE ................................... 31
3.1 Experimental Design and Layout .................................................................................... 31
3.2 Participants ..................................................................................................................... 32
3.3 Participant Training and Selection ................................................................................... 32
3.4 Equipment and Software ................................................................................................. 33
3.5 Overview of Abnormal Events Simulated........................................................................ 35
3.6 Experimental Variables and Their Measures ................................................................... 36

iv
3.6.1 Dependent Variables ................................................................................................ 36
3.6.2 Independent Variables ............................................................................................. 39
3.7 Experimental Design Procedure ...................................................................................... 40
CHAPTER 4. RESULTS AND DISCUSSION ..................................................................... 43
4.1 Experimental Model and Statistical Reporting Conventions ............................................ 43
4.2 Hypothesis 1 ................................................................................................................... 43
4.2.1 Differences in Accuracy of Response (All Alarms) .................................................. 44
4.2.2 Differences in Accuracy of Response (Low Priority Alarms) ................................... 44
4.3 Hypothesis 2 ................................................................................................................... 45
4.3.1 Differences in Response Time (Low Priority Alarms) .............................................. 45
4.3.2 Differences in Response Time (Caution Priority Alarms) ......................................... 45
4.3.3 Differences in Response Time (High Priority Alarms) ............................................. 46
4.4 Hypothesis 3 ................................................................................................................... 47
4.4.1 Differences in Response Time (All Alarms) ............................................................. 47
4.5 Further Observations ....................................................................................................... 48
4.5.1 Differences in Acknowledgement Time (All Alarms) .............................................. 48
4.5.2 Differences in Acknowledgement Time (Low Priority Alarms) ................................ 49
4.5.3 Differences in Acknowledgement Time (Caution Priority Alarms)........................... 50
4.5.4 Differences in Acknowledgement Time (High Priority Alarms) ............................... 51
4.6 Subjective Usability Questionnaire.................................................................................. 52
4.7 Experiment Summary Statistics ....................................................................................... 52
4.8 Discussion and Future Research Recommendations ........................................................ 53
REFERENCES ........................................................................................................................ 58
APPENDIX 1 – TABLE IDENTIFYING MEANING OF COLORS ................................... 61
APPENDIX 2 – EEMUA NO. 191 BENCHMARK AVERAGE ALARM RATE
STANDARD ............................................................................................................................ 62
APPENDIX 3 – TABLE SHOWING ORDER OF EXPERIMENTS, WHICH DISPLAY
USED FIRST, AND DEMOGRAPHIC INFORMATION .................................................... 63
APPENDIX 4 – PARTICIPANT TRAINING GUIDE .......................................................... 65
APPENDIX 5 – DEMOGRAPHIC SURVEY ........................................................................ 73
APPENDIX 6 – GENERAL KNOWLEDGE QUIZ .............................................................. 74
APPENDIX 7 – SUBJECTIVE USABILITY QUESTIONNAIRE AND
SUMMARY DATA ................................................................................................................. 75
APPENDIX 8 – DIFFERENCES IN ACCURACY OF RESPONSE (ALL ALARMS) ....... 80
v
APPENDIX 9 – DIFFERENCES IN ACCURACY OF RESPONSE (LOW PRIORITY
ALARMS)................................................................................................................................ 81
APPENDIX 10 – DIFFERENCES IN RESPONSE TIME (LOW PRIORITY ALARMS) . 82
APPENDIX 11 – DIFFERENCES IN RESPONSE TIME (CAUTION PRIORITY
ALARMS)................................................................................................................................ 83
APPENDIX 12 – DIFFERENCES IN RESPONSE TIME (HIGH PRIORITY ALARMS) 84
APPENDIX 13 – DIFFERENCES IN RESPONSE TIME (ALL ALARMS) ....................... 85
APPENDIX 14 – DIFFERENCES IN ACKNOWLEDGEMENT TIME (ALL ALARMS) 87
APPENDIX 15 – DIFFERENCES IN ACKNOWLEDGEMENT TIME (LOW PRIORITY
ALARMS)................................................................................................................................ 88
APPENDIX 16 – DIFFERENCES IN ACKNOWLEDGEMENT TIME (CAUTION
PRIORITY ALARMS) ........................................................................................................... 89
APPENDIX 17 – DIFFERENCES IN ACKNOWLEDGEMENT TIME (HIGH PRIORITY
ALARMS)................................................................................................................................ 90
APPENDIX 18 – DESCRIPTIVE STATISTICS ................................................................... 91
VITA…………………………………………………………………………………………….97
vi
TABLES
Table 1 – Considerations When Designing Operator Consoles .................................................. 10
Table 2 – Roles and Responsibilities of the Console Operator ................................................... 29
Table 3 – Example participant Grading for Accuracy of Response and Successful Completion . 39
Table 4 – EEMUA No. 191 Benchmark Average Alarm Rate Standard ..................................... 39
Table 5 – Draft ISA 18.02 Average Alarm Rate Standard .......................................................... 39
Table 6 – Alarm Rates Used For Experiments ........................................................................... 40
Table 7 – Acknowledgement Time Summary Statistics ............................................................. 54
Table 8 – Reaction Time Summary Statistics............................................................................ 55
Table 9 – Summary of Null Hypotheses .................................................................................... 56

vii
FIGURES
Figure 1– Alarm Management Lifecycle ................................................................................... 18
Figure 2 – Example Alarm List Display .................................................................................... 34
Figure 3 – User Interface Used for Qualifying Participants ........................................................ 34
Figure 4 – Partial Snapshot of Overview Display Used During Actual Experiment.................... 34
Figure 5 – Picture of Hardware used by Participants .................................................................. 35
Figure 6 – Overview of Experimental Variables and Measures of Operator Performance .......... 37
Figure 7 – Alarm Frequency Distribution .................................................................................. 40
Figure 8 – Chronological Alarm Display ................................................................................... 41
Figure 9 – Categorized Alarm Display ...................................................................................... 41
Figure 10 – Experimental Procedure Flow Chart. ...................................................................... 42
Figure 11 – Mean Acknowledgement Time ............................................................................... 53
Figure 12 – Mean Reaction Time .............................................................................................. 54

viii
ABSTRACT
The liquid and gas pipeline community has recently been faced with the challenge of new
governmental regulations set forth by congress which are being implemented by PHMSA (an
arm of the DOT). These new governmental regulations need to understand the role of the human
in the loop as part of alarm management systems. To investigate alarm rate standards a repeated
measures design was developed that included a series of ten (10) simulated liquid pipeline
operator scenarios utilizing high fidelity liquid pipeline simulation software (Stoner Pipeline
Simulator). A total of 39 participants volunteered for this study. Participants completed two
subsets of experiments, five were completed using an alarm display presenting alarms by time
(chronological) and the remaining five experiments were completed using a categorical alarm
display.
Statistically significant differences were found to exist in participant response time,
acknowledgement time, and accuracy of response given different alarm display types and alarm
rates. Use of the categorical alarm display resulted in significantly reduced alarm
acknowledgement and response times. Also, a severe operator performance reduction with
regard to alarm handling was observed when the alarm rate was increased from ten alarms per
ten minutes (10-alarms/10-minutes) to twenty alarms per ten minutes (20-alarms/10-minutes).

1
CHAPTER 1. INTRODUCTION
Human factors and alarm management in pipeline control rooms, in recent years, has
become of increasing interest to many government entities. In 2005, the National Transportation
Safety Board (NTSB) reported the results of their safety study titled “Supervisory Control and
Data Acquisition (SCADA) in Liquid Pipelines.” The NTSB study recommended improvements
in graphics design, alarm management, human factors (e.g. fatigue), training, and leak detection.
Further, In September 2006, the 109th Congress passed Senate Bill 3961 (S.3961). This Bill
specifies that no later than 18 months after the enactment of the Bill the Secretary of
Transportation shall issue standards that implement the NTSB recommendations, and “issue
regulations requiring operators of gas and hazardous liquid pipelines to evaluate and take
measures to reduce risks associated with human factors, including fatigue, for pipeline
controllers & other employees.” This includes adoption of American Petroleum Institute’s (API)
1165 standard on SCADA graphics, standards for review & audit of alarms, standards for
pipeline controller training, and regulations which deal with human factors in pipeline control
rooms, particularly fatigue & shift work.
Most recently, in response to congress and the president approving the PIPES Act (H.R.
5782 [109th]) the Pipeline and Hazardous Materials Safety Administration (PHMSA), arm of the
Department of Transportation (DOT) charged with protecting public and environmental interest
by insuring safe and secure movement of hazardous materials, has been working towards
revising Federal Pipeline Safety Regulations.
These legislative efforts are being pursued in an effort to help ensure companies operate
safely, reduce economic loss, and reduce environmental damage. Many groups are available to
provide guidance based on limited case studies and their operating experience. However, as

2
much as these organizations try to standardize operations in the pipeline industry, much diversity
in regards to human factors and alarm management best practices still exist within the pipeline
community.
1.1 Rational and Objectives
The liquid and gas pipeline community has recently been faced with the challenge of new
governmental regulations set forth by congress which are being implemented by PHMSA. As
these new governmental regulations are passed, there is a need to conduct research in the area of
alarm management in control rooms. Past work in alarm management in pipeline control rooms
concentrated on improving training programs, designing more efficient/effective Human
Computer Interfaces (HCI), development of the alarm management lifecycle, development of
industry consensus standards stating best practices, and reducing fatigue situations. The research
and work performed here fill empirical evaluation deficiencies with regards to alarm rate
standards for liquid pipeline control room operators, although there are many areas of interest
regarding this topic that are mentioned above.
To empirically investigate alarm rate standards a repeated measures design was
developed that included a series of ten (10) operator scenarios utilizing high fidelity liquid
pipeline simulation software (Stoner Pipeline Simulator). Participants completed two subsets of
experiments, five were completed using an alarm display presenting alarms by time
(chronological) and the remaining five experiments were completed using a categorical alarm
display with alarm priority categories being high, medium, and low. For both, the chronological
and categorical alarm display, experiments the alarm rates were derived from the Engineering
Equipment Materials and Users Association (EEMUA) No. 191 average alarm rate standard and
were randomly distributed between participants. The main operator performance metrics of

3
interest were participant acknowledgement time, participant response time to take appropriate
action to handle each alarm, and percentage of successful completion. With these metrics, a
statistical model was developed to empirically derive alarm rate standards for liquid pipeline
control room operators.

4
CHAPTER 2. LITERATURE REVIEW
2.1 Human Factors Considerations
According to Ian Nimmo, studies conducted by the Abnormal Situation Management
Consortium (ASM), American Institute of Chemical Engineers, American Petroleum Institute,
American Chemistry Council, and similar organizations have concluded that about 80% of the
root causes contributing to major accidents affecting safety, environment, and/or economics can
be linked to human operator error (Nimmo 2002). Human error can be caused by many variables,
some of which are poor human-machine interface (HMI), poor situational awareness, operator
experience, workload, communication, and shift-fatigue. There is little published research
regarding specific best-practices for pipeline control room operators. However, the Engineering
Equipment Materials and Users Association (EEMUA) No.191 authors imply that research
conducted in the process industry or elsewhere in a control room setting, (e.g. a refinery or
similar control room environments), can be used to improve human factors design and
benchmark performance in the pipeline industry, as well as other industries.
2.2 Operator Training
Rasmussen conducted a study of 190 accidents in chemical processing facilities which
identified the top causes leading to an accident (Rasmussen 1989). Reasons identified include
insufficient knowledge (34%), procedure error (24%), and operator error (16%). A study
conducted in petrochemical and refining operations by Butikofer (1986) observed that the
leading sources attributed to causes of accidents include equipment and design failures (41%),
operator and maintenance errors (41%), inadequate or improper procedures (11%), inadequate or
improper inspection (5%), and miscellaneous (2%).

5
Between September 1993 and February 1994 the Abnormal Situation Management
(ASM) Consortium team visited six chemical plants in the U.S and Europe to study and obtain
an understanding of abnormal situations (Bullemer and Nimmo 1994). The method used for
these site visits consisted of observing and interviewing personnel from operations, engineering,
and management. Plant incident reports were also reviewed to gather further insight into the
scope of abnormal situations. From the information collected at the six chemical plants,
specifically from plant incident reports, the ASM Consortium team was able to identify the
primary initiating causes of incidents. It was also observed that training programs tended to be
narrowly focused due to a lack of formal training practices to effectively build the knowledge,
skills, and abilities of operations personnel. It was noted that due to the low situational awareness
of supervisors and field operators, since they were not console operators, they were not able to
provide significant guidance to console operators who then by default managed the Distributed
Control System (DCS) system. Because of this observation, the authors pointed out console
operators expressed a need for more effective training. Bullemer and Nimmo also reported
feedback from the companies who expressed a reluctance to identify people as the initiating
cause of an incident (Bullemer and Nimmo 1994).
Moreover, observations revealed that operator training activities were not keeping pace
with technological developments (Bullemer and Nimmo 1994). The authors found the causes
initiating abnormal situations to be people and work practices (42%), equipment (36%), and
processes (22%) (Bullemer and Nimmo 1994).
Goldstein states essential components help ensure an effective training program
(Goldstein 1986). These include (1) needs analysis; (2) practices; and (3) evaluation. Another
study of twelve refineries yielded very similar findings to the framework proposed by Goldstein

6
(Bullemer and Nimmo 1998). From the studies conducted by the ASM Consortium team it was
observed that the plants studied lacked formal needs assessment activities and there was a
general lack of understanding as to the initiating causes of abnormal situations. The training
evaluation findings yielded similar observations which included lack of a formal evaluation
effort and a short term focus on training. Training practices observed focus on “on-the-job”
training (OJT), initial training for field operators, moderate training for console operators, and
little training for remaining operations personnel. The authors interestingly noted for many
companies organizational obstacles such as schedules, staffing, availability of trainers, and
availability of training materials was hindering effective “hands-on” training and/or “on-the-job”
training.
An interesting finding in Bullemer’s and Nimmo’s (1994) study was field operators were
provided no formal refresher training. However, the new Instrumentation Society of America
(ISA) Alarm Management standard 18.02, currently in draft form, states refresher training shall
be conducted to ensure operators are able to execute the appropriate corrective action when
required while maintaining consistency when executing procedures (ISA 2008). The ISA 18.02
standard also states the refresher training should cover a broad range of operating scenarios and
be conducted over regular intervals. Moreover, the ISA 18.02 standard defines these respective
training requirements for maintenance personnel. The EEMUA No. 191 standard on Alarm
Management calls for training which encompasses all realistic operational usage of the alarm
system, requiring all operators be trained on the portion of the alarm system with which they
actually work, and this should include initial training, refresher training, and training on new
alarm facilities. The EEMUA No. 191 standard further states operators should be trained in
detecting and diagnosing fault diagnosis of the alarm system.

7
Bullemer and Nimmo discuss characteristics of a good training program which include
ensuring the workforce skill level meets or exceeds the national average. The authors also
suggest training programs must be strong individual motivators, and act as an effective catalyst
for change (Bullemer and Nimmo 1998). These authors reference a study conducted by The
National Institute for Occupational Safety and Health that found traditional methods, (e.g.
seminars, posters, videos), of training typically fail due to the lack of basic human factors. The
authors report on their observation of successful training practices in industry which include “on-
the-job” training coupled with manuals and introductory courses, training manuals for each role,
peer to peer training, computer-based training, and independent study (Bullemer and Nimmo
1998). It is important to note that the authors indicate successful training programs consist of a
combination of methods individually tailored to each plant. A variety of factors influencing a
plant’s training program structure and organization are offered ranging from the number of
operators per training session up to and including accommodating training during a turnaround.
Given the wealth of research findings highlighting gaps and deficiencies in operator
training Bullemer and Nimmo called for a new standard of training to be implemented (Bullemer
and Nimmo 1994). The new standard would include a training program that is incorporated into
the daily activities of an operator’s job and provide a work environment conducive to continuous
learning. The goal here would be to optimize an operator’s knowledge base and skill set which
should significantly improve operations efficiency and effectiveness. The authors cite that a
significant obstacle to knowledge development is the lack of resources for managing abnormal
situations.
In regards to skill development Bullemer and Nimmo state to improve an operator’s skill
set plants must provide operators a resource to practice managing realistic abnormal situations as
8
a team, (e.g. high fidelity simulators), and these practice sessions should provide individualized
feedback and be conducted on a regular basis (Bullemer and Nimmo 1994). However, using high
fidelity simulators alone will not guarantee better results, because these resources must be used
in combination with realistic operating constraints and scenarios (Bullemer and Nimmo 1998).
2.3 HMI Interface
In the mid-1990’s, the Abnormal Situation Management Consortium set out to examine
the value of developing an Abnormal Event Guidance Information System (AEGIS) (Nimmo
1995). This system would offer console operators and other operations team members
unmatched levels of control over processes within a plant, especially during scheduled
shutdowns and startups given that the chance for a process upset is high during this time (Nimmo
1995). The principle functions of this system would be to assist operators in knowledge
acquisition, memory requirements, offer predictive hypothesis testing of the process state,
provide training resources, and it would be able to dynamically assess process variables
depending on the intended state of a process (Nimmo 1995). The author describes these features
will produce a more efficient, effective, and safe operating environment.
One of the most discussed topics regarding human factors is the human-machine interface
(HMI). One factor affecting the HMI is display design for the console. Two important design
features need to be considered here, one is the ergonomics of the physical layout (physical design
considerations) and two is the graphics layout presented to the operator (cognitive design
considerations). There are many methods for presenting alarm and process information to an
operator, but the industry is only concerned with the interface that allows an operator to work
most efficiently and effectively. One study funded by the ASM Consortium showed
implementing human factors engineering into the design of an operator’s graphical user interface

9
(GUI) resulted in a 41% faster resolution of an abnormal situation as compared to utilizing a
traditional interface (Errington, Reising et al. 2005). Some key features implemented in their
study’s interface design are listed below (Errington, Reising et al. 2006).
multi-windowing with controlled window management to minimize display overlays
multi-level, simultaneous views of increasing plant detail
yoked navigation between display levels (i.e., automated display invocation through pre-
configured display associations for assisted, task-relevant navigation)
tabbed navigation within a display level
integrated trending of historical information
integrated alarm management into graphics and navigation tabs
right-mouse click access to online documentation
human factors graphics design (e.g., principled/limited color-coding of critical changing
information; limited 3-D objects; simple/effective symbols)
access to online information (e.g., alarm rationalization documentation, operating
procedures, shift logbook)
2.3.1 Console Design – Physical Design Considerations
To start, one of the first components to be designed for an operator’s process and alarm
system is the physical workstation or console. Console design begins with the development of
the facility layout that must accommodate communication between operators & supervisors,
thru-traffic, and other disruptions to the operator (Smith and Walker 2001). According to Smith
& Walker (2001) the console design methodology must begin with an analysis of the user’s
needs. This analysis consists of the operator workload, task load, corporate culture, situational
awareness, and communication. It should be noted that in a study conducted by Reising, Downs

10
et al. (2004) it was determined that the average time required for an operator to detect, analyze,
and respond to an alarm is 49 seconds. This helps determine how an operator’s workload and
task load can be defined, and console features can be designed accordingly. For example, the
physical workstation can be designed to reduce operator movement when troubleshooting a
problem during an upset. Also, the GUI could be designed to minimize the number of mouse
clicks to access detailed process and alarm information. Moreover, a company’s culture should
also be considered in console design because behavioral characteristics and conflicting
personalities could have a detrimental impact on an operator’s ability to effectively and
efficiently communicate operational needs (Smith and Walker 2001).
Once the task analysis has been completed the design of the console can begin. Factors to
consider when designing the console should include postural considerations, visual comfort, and
environmental factors (Smith and Walker 2001). Table 1 presents these factors.
Table 1 – Considerations When Designing Operator Consoles
Postural Considerations Visual Considerations Environmental
Considerations
1. Height of console (adjustable
height)
2. Reach distances (keyboards or
pointing device)
3. Ergonomics of chairs and
tables (adjustable)
1. Height of viewing
monitor
2. Angle of monitor relative
to vertical
3. Eye-screen distance
4. Lateral location
1. Through traffic
2. Lighting levels
3. Noise levels
2.3.2 Graphical User Interface – Cognitive Design Considerations
Another component to consider when designing an operator user interface is the graphics
display properties, (e.g. color, symbols, alpha-numeric attributes, flashing, audible annunciation,
and a combination of the aforementioned). These tools should be used to design a display which
can effectively draw an operator’s attention to unexpected process deviations & new alarms,
11
provide a means for viewing the state of the process & alarms, and it should allow the operator a
safe amount of time to take action on the required response to alarms before an upset occurs
(EEMUA 1999). An operator must be able to readily and easily detect relevant data flowing
through the system in order to meet the EEMUA standard of drawing one’s attention to new
alarms.
A solution to this is offered by Woods (1984) using the idea of virtual momentum.
Virtual momentum can be defined as a user’s ability to extract relevant information across views
and displays. When consistency across graphical user interfaces is increased virtual momentum
will be high, thus allowing operators easy access to pertinent information (Watts-Perotti and
Woods 1999). While the EEMUA No. 191 Alarm Management standard offers readers the
industry’s best practices regarding alarm management it was not intended to address the
development and maintenance of graphical user interfaces. The API RP1165 (Recommended
Practice for Pipeline SCADA Displays) was created to focus on design and implementation of
displays used for SCADA systems (API 2007). Also, the EEMUA No. 201 standard published in
2002 offers high-level guidance or general principles on the development and maintenance of
graphical user interfaces, or human computer interface (HCI) (EEMUA 2002). The standard is
comprehensive in that it defines what the HCI is, briefly explains the role of the operator, and
largely focuses on HCI design, (e.g. number of screens, display formatting, navigation,
functional & system requirements, and methodologies & lifecycle stages for human computer
interfaces).
The use of alpha-numeric and text has been the traditional method of presentation for the
alarm list/summary to the operator (Errington, Reising et al. 2006). Using text to communicate
important information has distinct advantages and disadvantages. Some advantages are that text
12
provides quick recognition of data and accurately presents quantitative data (Shahriari, Shee et
al. 2006). Disadvantages using text include difficulty locating individual data in list or tables,
rate of data change can cause alarm list to become unmanageable, and text cannot effectively
illustrate parameters being measured by the alarm system, (e.g. trendable information)
(Shahriari, Shee et al. 2006). Also, care should be taken when designing text into displays
because it may not be conducive to allowing an operator the ability to detect trends during
operations. It should be noted that trend analysis was implemented by ASM in their graphical
user interface, where a 40% increase in operator productivity was observed (Errington, Reising
et al. 2005).
Color is yet another human factors consideration which should be well thought-out when
designing the graphics display. It is a good idea to incorporate use of color when distinct
categories of data presented to an operator need to be quickly and easily distinguished, such as a
list of alarm text messages (MPR Associates and Laboratory 2004). The purpose of this is to aid
the operator in navigating through alarms that are prioritized as either low, medium, or high; this
prioritization schedule is chosen arbitrarily. Prioritization of alarms will be discussed in a later
section. As with text, color has limitations on its usefulness if misused. It should be clear that
color is not intended to be used for separating every aspect of the display design (MPR
Associates and Laboratory 2004). If color is used excessively it may hinder an operator’s ability
to recognize and distinguish between alarm priorities.
The EEMUA No. 201 standard on HCI design parallels the practice of using color to
enable an operator to more readily distinguish areas of importance. EMMUA No. 201 states that
color should not overwhelm an operator, rendering the use of color meaningless or creating a
hindrance. Also, over use of color could easily decrease the amount of time available for an

13
operator to take action on an alarm’s required response, leading to poor system performance or
an accident.
According to research conducted by MPR Associates and Laboratory (2004) some ways
to hedge against the shortcomings of implementing color is to use no more than a maximum of
six colors, and apply color coding according to already standardized or typical user meanings.
This can help avoid mentally overloading an operator because an operator will not have to
distinguish between many or ambiguous shades of colors. Also, operators may be more likely to
recognize, distinguish, and discriminate between alarms of different priority if alarms can be
coded to colors in which operators already have associations with specific conditions, (e.g. red –
danger, yellow – abnormal condition, green – alarm cleared) (MPR Associates and Laboratory
2004). More information on common conditions associated with colors please refer to Appendix
1. Another consideration when implementing color into the design of graphical user interfaces is
color blind operators. The EEMUA No. 201 HCI standard offers an alternative that may help
combat the presence of color blind operators. This standard suggest that it is a good practice to
design the graphical user interface to be monochrome (EEMUA 2002). The authors do not
specifically state this design technique can be used design around color blind operators, but this
may offer an attractive and practical design alternative. The writers emphasize that this is a good
technique to practice during interface design in general to help prevent implementation of
excessive color use (EEMUA 2002). Also, high priority alarms should be assigned a readily
distinguishable color which is easily recognizable against the background & low priority alarms
presented in progressively less conspicuous colors, but still identifiable (EEMUA 1999).
The use of icons and symbols can be incorporated into an operator’s graphical user
interface to allow better use of space and promote quick detection of an abnormal situation
14
(MPR Associates and Laboratory 2004). For these types of display characteristics to be
operationally effective, designers must consider human factors during the design stage. Some
important factors to incorporate into the design of symbols and icons are listed below (MPR
Associates and Laboratory 2004).
Must be distinct and readily identifiable
Must be large enough to be distinguished by the operator
Meaning should be easily discernible
Design should incorporate typical conventions known by the operator
Alarm communication or state change should be readily identifiable by the operator
Should accurately reflect the unit, process, or state it represents
Designers may also want to incorporate design features like hidden text or right-click
help dialog boxes to aid operators, particularly new operators, with the identification & meanings
of symbols and icons.
Further, the EEMUA No. 201 HCI design standard begins to define detailed system and
functional requirements (EEMUA 2002). The first of several recommendations in executing HCI
design is to perform task analysis to determine the functional and system needs for an operator.
Second, operators and other end users should be included in the HCI design process. Third, the
number of screens implemented in the HCI should provide an operator complete access to all
required process information and controls during any operational state. Next, the concept of
situational awareness should be addressed by highlighting the fact that an operator’s overall view
of the process can be negatively impacted when using a GUI, if designed poorly, in place of a
hardwired panel annunciator system.
Given the limitation of the GUI to display large amounts of information on a single fixed
15
size screen the EEMUA No. 201 HCI standard recommends that a screen be solely dedicated to
displaying an overview of the plant, thus attempting to provide an equivalent level of situational
awareness or better than that of a hardwired panel display. This standard also recommends an
HCI design where alarm information is continuously accessible. The standard also recommends
that system expendability be considered during the design of a HCI. Finally, the reliability
requirements of the HCI system must be evaluated against any respective or unique operating
conditions or system constraints to ensure compliance with regulatory requirements and/or safe
operation of the process.
2.4 Operator Fatigue Considerations
Operator fatigue is another important challenge designers of alarm system must contend
with to ensure optimum performance. Many factors lead to operator fatigue and companies
should be aware of the debilitating mental and physical affects and the impact on system
performance. One challenge which is conducive to increased fatigue in any control room setting
is due to 24 hours a day 7 days a week operations. Further, twelve hour shifts are common in the
process control and pipeline industry leading to negative effects on an operator’s circadian
rhythm (Walker, Smith et al. 2003). These authors specifically state this is particularly relevant
to operators on the night shift. Furthermore, they proceeded to suggest methods and practices to
help prevent the affects of shift-work fatigue. Some of Walker et al. (2003) suggestions are listed
below.
Reduce glare on monitors
Play music
Reduce ambient noise (printers, copiers, fax)
Vary employees’ posture

16
Keep temperatures cool
Allow naps (no longer than 45 min.)
Add simulated daylight
Use bright lighting (in the workplace)
Get 6-8 hours of sleep each night
Improve sleep environment (dark room, lock doors, reduce noise & distractions)
The above steps provide examples on how to reduce operator fatigue and reduce its
adverse affects on alarm system performance. Increased alarm system performance should result
in safer operations, reduced economic losses, reduced risk to environmental & equipment
damage, and decreased product loss.
In September 2008, PHMSA released a document proposing to revise the current Federal
Pipeline Safety Regulations, noting that the NTSB recognizes fatigue as one of its top ten safety
hazards (Pipeline and Hazardous Materials Safety Administration (PHMSA) 2008). In this
proposed rule the need to educate and train operators and supervisors regarding fatigue
mitigation strategies is addressed. PHMSA specifically noted that operators would be trained on
how non-work related activities contribute to fatigue and ultimately impact performance
negatively.
2.5 Situational Awareness
An operator’s situational awareness has been diminished progressively as automation has
increased (Smith and Walker 2001). This affects an operator’s ability to have a clear
comprehensive visual representation or model of the unit, plant, pipeline, or process being
controlled. Some sites and pipeline companies have tried to overcome the decreased situational
awareness by implementing overview displays, which depict a high level graphical
17
representation of the unit, pipeline, plant, or process onto a large display screen big enough for
every operator in the control room to view from their console. Overview displays can also be
scaled down for incorporation into an operator’s graphical user interface.
Some guidance to help increase an operator’s situational awareness is offered indirectly
in EEMUA’s No. 201 HCI standard. Some key design principles to emphasize when developing
an operator’s workstation HCI are, in order of importance, (1) Abnormal situation handling; (2)
Normal operation; (3) Optimization; and (4) Informational retrieval. The point being made here
is that proper workstation design can significantly aid an operator’s situational awareness.
2.6 Alarm System Lifecycle and Benchmarking Standards
2.6.1 Introduction to the Challenge
According to the ASM Consortium, it is estimated that poor alarm management (e.g.
consequences being safety, environmental, and economic) practices cost the industry
approximately $13 billion dollars each year (Dunn and Sands 2005). An earlier finding found
abnormal situations cost the industry over $20 billion each year (Nimmo 1995). The purpose of
quantifying alarm system performance is simply to make the system operate more efficiently and
effectively so to reduce and eventually eliminate losses due to poor alarm management. Factors
which contribute to the performance of the alarm system include human operator error, operator
training, task load, workload, HMI, SCADA/DCS/alarm system components, the site’s alarm
management philosophy, alarm overloads, stale alarms, nuisance alarms, and bad alarm settings
among others.
2.6.2 Alarm Management Lifecycle
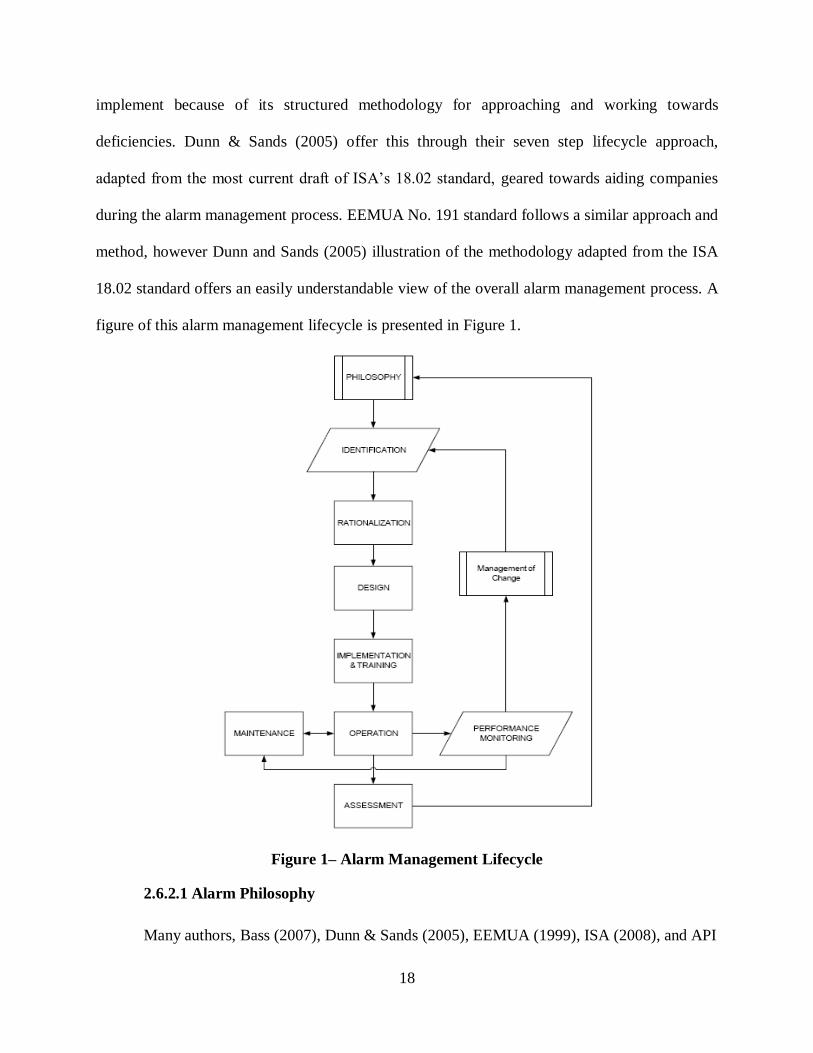
To achieve optimum alarm system performance a lifecycle approach is a logical choice to
18
implement because of its structured methodology for approaching and working towards
deficiencies. Dunn & Sands (2005) offer this through their seven step lifecycle approach,
adapted from the most current draft of ISA’s 18.02 standard, geared towards aiding companies
during the alarm management process. EEMUA No. 191 standard follows a similar approach and
method, however Dunn and Sands (2005) illustration of the methodology adapted from the ISA
18.02 standard offers an easily understandable view of the overall alarm management process. A
figure of this alarm management lifecycle is presented in Figure 1.
Figure 1– Alarm Management Lifecycle
2.6.2.1 Alarm Philosophy
Many authors, Bass (2007), Dunn & Sands (2005), EEMUA (1999), ISA (2008), and API
19
(2009) discuss what components should be included in the alarm philosophy. Key components
of the alarm system philosophy document compiled from the four aforementioned authors are
listed below:
Definition of the alarm and purpose of the system
Specify key design principles/goals of the alarm system (purpose is to guide operator to
required action)
Define a lifecycle approach for alarm management with feedback loops for continuous
improvement. The ISA 18.02 document provides a good base or starting point to
developing a site specific alarm management lifecycle
Provide an operating framework for each alarm management lifecycle component
Clearly identify the roles and responsibilities of the operator for each operating state, and
roles/responsibilities related to & in response to alarms
Rationalization processes for alarms, i.e. creating or removing alarms
Maintenance procedures and monitoring requirements for the alarm system, i.e. testing of
alarms periodically
How alarms will be prioritized and classified (economic, safety, environmental), i.e.
methodology describing how alarms will be prioritized and classified. Also, each class
and priority level should be defined
Management of change procedures
Alarm audit requirements and processes
Performance monitoring techniques and metrics (identify an appropriate benchmark)
How alarms will be presented to the operator, acknowledged, and what is the defined
response

20
Operating characteristics unique to an operating company’s site or facility
Comprehensive overview of the alarm system suppression techniques/processes
Alarm system’s relationship to other relevant site procedures
Operator Training
2.6.2.2 Identification
The identification stage in the lifecycle should facilitate a methodology for recognizing
the need to alarm, which will later be thoroughly evaluated and analyzed in the rationalization
stage (Dunn and Sands 2005). The intention of identification is not to conduct a formal analysis
of each new alarm only to justify approving it, in place of arbitrarily creating alarms. EEMUA
(1999) states that “every alarm should be justified, properly engineered, and be consistent with
the overall alarm philosophy & plant risk assessment.” This stage is particularly important due to
government regulation specifically requiring employers to “make suitable and sufficient
assessment of risk” (EEMUA 1999).
Request for alarms can originate from process hazards analysis, safety requirement
specifications, recommendations from an incident investigation, new industry best practices,
operator feedback, and/or Process and Instrumentation Display (P&ID) development or
operating procedure reviews (ISA 2008). General guidelines to consider when identifying
possible alarms during the risk assessment is to focus on risks or hazards which an alarm would
greatly reduce the potential for environmental, safety, or economic loss (EEMUA 1999).
2.6.2.3 Rationalization
Rationalization is a means of thoroughly analyzing each potential alarm against a set of
standardized criteria in the alarm philosophy (Dunn and Sands 2005). The goal of the

21
rationalization stage is to only create those alarms that will add value to the operator and not
contribute to an alarm overload situation. It should be intuitive that if alarms are not evaluated
according to a set of standardized criteria listed in the alarm philosophy (at the very least a set of
standardized criteria) the creation of many unnecessary and unjustified alarms will possibly be
the result. Some considerations to emphasize when rationalizing an alarm are its purpose, the
severity of risk, frequency of possible risk, prioritization, operator response, alarm settings,
suppression techniques, and management control (EEMUA 1999).
2.6.2.4 Design of Alarms
The design process focuses on the configuration of alarms, design of the human machine
interface, and any advanced/artificial intelligence suppression techniques (advanced alarming
techniques) based on the alarm requirements identified during the rationalization stage (ISA
2008). Obviously, once the alarm is in the design phase the key design principles in the alarm
philosophy should be used to configure the alarm (EEMUA 1999). Consistently applying the key
design principles to each alarm will help ensure optimum alarm operation when an alarm is put
online and this effort should also reduce the potential of the alarm to contribute to alarm floods.
Designers would ideally incorporate human factors engineering into the HMI and GUI to help
aid an operator detect abnormal situations and then aid an operator to respond accordingly. This
information may not always be appropriate to include in the alarm philosophy document because
of the extensive amount of technical information, however it may be a good practice to include
general guidelines (Dunn and Sands 2005). Moreover, if a site or facility has highly customized
HMI or GUI design standards to compliment the current alarm system it may prove
advantageous to incorporate this into the alarm philosophy document. Moreover, the American
Petroleum Institute’s 1165 standard on display design provides design engineers useful insight

22
about current industry best practices when designing an HCI/HMI or GUI.
2.6.2.5 Implementation
Implementation focuses on installing the new alarm in the alarm system and making sure
the system is functioning properly to proceed with testing (Dunn and Sands 2005). The ISA
18.02 standard outlines the requirements to install an alarm/(alarm system) or modify an existing
alarm or alarm system. These requirements include training for operators (initial and refresher),
testing and validation, and documentation requirements. Objectives of this stage are to
troubleshoot and identify design flaws, and then correct them before the new alarm becomes
fully operational. Moreover, this testing and operator training stage could benefit from a
corporate culture that is conducive to constructive feedback because experienced operators often
have valuable information that can add significant justification and value to an alarm (Mattiasson
1999).
2.6.2.6 Operation
Dunn & Sands (2005) define the operation stage as the point at which abnormal situations
are able to be presented to the operator during regular operational monitoring and control. At this
stage a new alarm has become fully operational and able to provide critical feedback to the
operator on the condition of the unit, process, pipeline, or plant (ISA 2008). Three final stages
combine to form a feedback loop for continuous improvement: (1) Maintenance; (2)
Performance monitoring; and (3) Assessment. Performance monitoring will be implemented
after the alarm becomes operational and will continue on a more frequent basis than the
assessment stage (ISA 2008). In this part of the feedback loop key performance indicators should
be selected (Errington, DeMaere et al. 2004). Bass (2007) indicates a low alarm rate is the best
23
performance indicator for an alarm management program. Additional metrics used in the
performance evaluation are standing & stale alarm analysis, average & peak alarm rate analysis,
and time in an abnormal operating state, i.e. greater than ten alarms in a ten minute interval
(Errington, DeMaere et al. 2004).
2.6.2.7 Lifecycle Loops (Maintenance, Performance Monitoring, and MOC)
During the maintenance stage the alarm sensor device is serviced according to its
individualized maintenance schedule (Dunn and Sands 2005). The goal here is to help ensure the
accuracy of the measurement device in the field and make sure it is calibrated properly with the
alarm system. The next lifecycle loop to be implemented is management of change (MOC). This
process is dynamic and is used as needed allowing an alarm to be evaluated after some period of
time after it has been in operation (Dunn and Sands 2005). This stage enables one of the
continuous improvement opportunities that have been built into this alarm management process.
The management of change procedures should be clearly defined in the philosophy document
and a good practice for decision management is structuring changes according to priority of the
alarms (EEMUA 1999). For example, low priority alarms may not require the level of scrutiny
that a critical or safety alarm requires.
2.6.2.8 Assessment
Finally, the assessment stage of the lifecycle deals with analyzing each alarm to ensure it
accurately reflects the standards set forth in the alarm philosophy document (Dunn and Sands
2005). Assessments, often referred to as alarm audits or rationalizations, are most often
conducted when a site’s management recognize the alarm system’s usefulness has deteriorated to
the point where it is no longer efficient or effective at alerting operators of abnormal situations

24
(Mostia Jr 2003). A more proactive solution than postponing the assessment process until
operations are significantly affected is to complete the process on a more consistent basis. This
should improve the quality of the assessment process because the task load would probably be
substantially less, allowing a project team to focus their resources on a fewer number of poorly
configured alarms/implemented alarms.
Also, the assessment process may not always result in a reduced number of alarms.
Remember, the purpose of the assessment process is to make sure the alarm system meets the
requirements in the alarm philosophy document. For instance, if a deficiency is recognized
during the assessment process an alarm should be identified, scrutinized in the rat ionalization
stage, and if that alarm is found to add value to the system it should be designed & implemented.
The point here is that if an alarm will add material value to the system it should be included. A
good example of this situation is demonstrated in a study conducted by the ASM Consortium. A
chemical plant performed an alarm rationalization and focused their efforts on worst actors in
their alarm system. After the process was completed the site realized a 20% increase in the
number of configured alarms (Reising and Montgomery 2005). However, the same plant’s
average alarm rate decreased by about 33%. Over a three and one-half year period this plant was
able to achieve a cumulative reduction in the average alarm rate of 94%.
2.7 Observed Alarm Performance vs. EMMUA No. 191 Standard of Performance
2.7.1 Analysis of the Results
Widely known in industries with operator control rooms is the EEMUA No. 191 alarm
system performance standards (Appendix 2). Some operating companies express that the
EEMUA standard is geared towards process plants and therefore assume the standard does not

25
reflect appropriate benchmarks for the pipeline community. In support of this, there is little
published empirical research regarding specific best practices for pipeline control room operators
relative to other topics studied in the petroleum industry. However, the Engineering Equipment
Materials and Users Association (EEMUA) No.191 authors imply that research conducted in the
process industry or elsewhere in a control room setting, (e.g. a refinery or similar control room
environments), can be used to improve human factors design and benchmark performance in the
pipeline industry, as well as other industries.
Moreover, research conducted by the ASM consortium suggests that the EEMUA
standards are not entirely unachievable (Reising and Montgomery 2005). The ASM group
conducted a study including 37 operator consoles and collected statistics on monthly average
alarm rates & monthly peak average alarm rates following major plant disruptions. The monthly
average alarm rate was calculated to be 2.3 and median value of 1.77 alarms per ten minute
period for normal operations, while the Health & Safety Executive alarm study reported 5 alarms
per ten minute period (Reising and Montgomery 2005). For 95% of the consoles included in the
study the average monthly peak alarm rate reported was 31-50 alarms per ten minute interval.
For a more detailed description and analysis of the ASM study refer to (Reising and
Montgomery 2005).
2.7.2 Interpretations
The results of the ASM study demonstrated that during normal operations the EEMUA
standards, based on a consensus of industry experience, appear to be attainable today in the near
future. Unfortunately, the peak alarm rates during abnormal situations continue to present
challenges to operating companies when compared against the EEMUA No. 191 standard for
alarm system performance. The EEMUA No. 191 standard states there should be no more than
26
one alarm per one minute period during a plant upset, or stated differently no more than ten
alarms in the first ten minutes of a plant upset (EEMUA 1999).
2.8 HMI Studies
There is little published research empirically evaluating different alarm rates and display
methodologies on pipeline operator performance. A study has been conducted which utilizes
Keystroke-Level Modeling and Markov Modeling to assess the observed performance of human
operators against the standards currently adopted by the industry (Reising, Downs et al. 2004).
The methodology used for the Keystroke-level Modeling included using Goals, Methods,
Operators, and Selection Rules (GOMS) analysis to create a framework of elemental human
operator tasks for a “prototypical” response to an alarm. These elemental tasks were then
assigned “psychological-based time constants.” Several validating assumptions regarding the
aforementioned GOMS task framework and alarm system time constants and other parameters,
(e.g. system lag time, event size), were identified. The methodology used for the Markov
Modeling focused on estimating the time required to respond per alarm generated. This method
included recording video of five experienced operators while they completed their annual
simulator training. Each operator completed each alarm scenario on a high fidelity simulator
simulating their respective units. The training session consisted of four to five operating
scenarios ranging from a valve failing in the open position to a turbine trip. Communications
with field operators and console operators were simulated by the unit trainer via a radio. Using
the video recordings and the GOMS elemental task framework the authors constructed a time per
element task document for each scenario and operator.
An interesting finding using Keystroke-Level Modeling is that given a burst of ten alarms
the time required of an operator to complete the high level goals in the GOMS framework is

27
thirty four minutes and four seconds (Reising, Downs et al. 2004). The time required to respond
to just one alarm was found to be three minutes and twenty two seconds. When compared to the
EEMUA No. 191 standard (no more than ten alarms in the first ten minutes following a process
upset) a person realizes that even a relatively small number of alarms such as ten can initiate a
time consuming alarm response process. However, often times an operator must work quickly to
resolve an abnormal situation before the process becomes unstable and causes product loss,
property damage, or injury. So, this study shows that reducing the number of alarms presented
to an operator may have a significant positive effect on reducing the likelihood an incident will
escalate in severity. Further, the leading contributor to higher response times when responding to
alarms was found to be the time required to assess new alarms (Reising, Downs et al. 2004). This
finding also supports the notion that fewer alarms presented to an operator will result in quicker
resolutions of abnormal situations. The second study method, Markov Method, found the
average time required of the five operators studied to completely handle one alarm was found to
be 49.1 seconds (Reising, Downs et al. 2004).
In another study conducted involving 21 console operators performing simulated
operating scenarios on traditional and new human-centered design high fidelity training
simulators results showed significant gains in operating performance can be realized by
implementing a human-centered design interface (Errington, Reising et al. 2005). The
experimental method included identifying two high fidelity training simulators. One of which
was just recently designed implementing human-centered design and another that was
representative of a more traditional control interface. Both interfaces utilized a Honeywell Total
Plant System control system. Eleven operators were selected to perform the experiment on the
new human-centered interface and ten were selected for the traditional interface. All operating

28
scenarios were modeled from past process upsets at each respective plant and each operator
completed the experiment interacting with an interface that accurately represented the interface
currently online in the respective plants. It should be noted that only data from four of the eight
operating scenarios were used in analyzing the experimental data and efforts were taken to
design the experimental operating scenarios to make use of the beneficial features when using
the human-centered design interface.
Results of the study yielded the finding that operators who used the human-centered
design interface responded to an abnormal situation 7.5 minutes (41%) faster on average than
operators using the traditional interface (Errington, Reising et al. 2005). It was also observed that
the response time variance between operators using the two interfaces was reduced when using
the human-centered design. Further, it was observed that early event detection reported by
operators using the human-centered design interface was found to be 47.7% on average and early
event detection reported by operators using the traditional interface was calculated to be 10% on
average (Errington, Reising et al. 2005). Finally, results observed showed that operators using
the human-centered design interface completed operating scenarios 95.5% on average and
operators using the traditional interface yielded a result of 70% completion on average
(Errington, Reising et al. 2005).
2.9 Roles and Responsibilities of the Operator
The proposed rule issued by PHMSA requires each operating company to clearly define
and document the roles and responsibilities of control room operators, explaining that such
documentation should define an operator’s authority and expectation of the operator.
EEMUA No. 191 defines the roles and responsibilities for an operator in three operating
states. They include (1) Normal; (2) Upset; and (3) Shut-down. These roles should be clearly

29
defined in the philosophy document and broken down into subsections stating the role for each
operating state of the system and define the required actions for each state, (e.g. normal, upset,
and shutdown) (EEMUA 1999). Another plant state which could be defined is the planned off-
normal situation (Errington, DeMaere et al. 2004). A table using data compiled from Errington et
al. (2004) and EEMUA (1999) outlining the roles and responsibilities of the operator for each
state is detailed below (Table 2).
Table 2 – Roles and Responsibilities of the Console Operator
2.10 Summary of Literature Review
The topic of alarm management is of great importance to the pipeline industry, as well as
many other industries which operate control rooms. There is also great diversity in regards to the
practice of design principles, management philosophies, and equipment procurement.
Organizations like EEMUA, API, ASM Consortium, H&SE, ISA, and others have dedicated
themselves to the standardization of processes and technologies across industries that routinely
transport/process large amounts of gas or hazardous liquids. Many successes have been realized
when a site’s management show a genuine commitment to an alarm management lifecycle to
improve the performance of the alarm system. For example, NOVA Chemicals realized great
success when an alarm assessment and rationalization was completed at one of their plants, and
Operating State Operator’s Role Alarm Information Needed
Normal Monitoring, optimization, coordination of maintenance
Alert of minor operating adjustments required
Planned Off-Normal
Manage intended operation and
coordinate changes to the planned off-normal situation
Alert operator intended operation is
deviating from planned or required responses
Abnormal Situation Manage the alarm response system manually where appropriate
Prioritize and clearly present alarms needed to return operation to a normal state
Shut-down Ensure shutdown proceeds safely Prioritize critical and safety alarms which require action

30
the company also expressed the most significant contributing factor to their success was
consistently following the alarm management lifecycle (Errington, DeMaere et al. 2004).
Another success story is exemplified by Xcel Energy which reduced the alarm rate per shift from
several hundred to only about 8, and during upsets a trip would typically produce no more than
20 alarms (Bass 2007). It should be noted that Xcel Energy commissioned a team of experts who
worked about 10 hours each week for a two year period to obtain that level of performance.
Good alarm system performance has been demonstrated to be achievable, however a company
must be committed to a continually improving the system through a lifecycle approach.
31
CHAPTER 3. EXPERIMENTAL METHOD AND PROCEDURE
3.1 Experimental Design and Layout
The experimental model used for this study was a repeated measures design where all
participants were subjected to the same conditions. Each participant was trained in an effort to
orient participants to the type of situations they would experience during supervision and
management of the simulated pipeline system. More detail regarding participant training can be
found in the Training and Selection section 3.3 below. For the main experiment participants
completed ten separate experiments lasting ten minutes each. Five experiments were completed
by each participant utilizing an alarm window that displays alarms in order of occurrence
(chronological) and distinguishing the alarms by priority using color, i.e. three priority levels
were used: Red-High, Yellow-Caution, and White-Low. The remaining five experiments
completed by participants were done using a different alarm window which displays alarms by
grouping them categorically for each priority, although chronologically ordered within each
category.
Since this study attempted to empirically determine an alarm rate standard the alarm
rate/interval during each experiment was evenly distributed given any number of alarms. For
example, for an experiment that would present 20 alarms in ten minutes to a participant, one
alarm would display every 30 seconds. The alarm rates chosen for this study were derived from
the Engineering Equipment & Users’ Association standard publication No. 191.
The experimental scenarios completed by participants were randomized. Specifically, the
order in which participants completed the five alarm rate experiments using the chronological
alarm display and the five alarm rate experiments using the categorized display were randomized
between participants. Also, the order in which participants completed the experiment starting

32
with a particular alarm display was randomized between participants. Tables displaying the
sequences in which participants completed experiments can be found in Appendix 3.
3.2 Participants
The participants in this study consisted of undergraduate and graduate students at
Louisiana State University. The number of participants to complete the experiment was
determined by a statistical power test as subjects completed the experiment. Participants
completed the training, qualification testing/assessments, and the two experiments designed to
measure specific human performance variables when supervising and operating a high fidelity
pipeline simulator. After completing the experiment participants were asked to complete a
subjective usability questionnaire; summary data for the questionnaire can be found in the
Results section and Appendix 7.
3.3 Participant Training and Selection
To help reduce differences among participants attributed to other factors other than those
experimentally manipulated all participants completed a training presentation,
demonstration/familiarization session, a multiple choice quiz, and training qualification
assessment. The training presentation can be found in Appendix 4 and the quiz in Appendix 6.
This battery of pre-experiment training and testing was developed to help ensure only those
participants who are able to successfully execute tasks representative to those during the actual
experiment would be allowed to complete the experiment. Each participant was trained and
oriented via a power point presentation presented by the experimenter (Appendix 4). Afterwards,
any questions a participant had were then answered and the participants were shown a
demonstration of the type of system they would supervise and manage to familiarize them with

33
executing tasks representative of those during the actual experiment.
This training presentation provided each participant with a general overview of the actual
pipeline they would operate upon successful completion of training & qualification and for this
particular study it attempted to teach each participant the fundamental principles of abnormal
situation assessment and responses which were required for each type of abnormal event
simulated in this experiment (e.g. leak/pressure relief event). The principles emphasized were
covered in the training presentation and any questions or ambiguities perceived by a participant
were answered or clarified verbally and with illustrations/demonstration where appropriate.
3.4 Equipment and Software
Advantica’s Stoner Pipeline Simulator (SPS) software was used to develop a pipeline
model which calculates the fluid hydraulics and transients occurring in the simulated pipeline;
simply put SPS is the calculation engine for the simulated pipeline in this study. SPS is widely
used in the pipeline community for engineering analysis. Schematic, Advantica’s interface
design module for SPS, in conjunction with Microsoft Visual Studio.NET 2008, was used to
develop the graphical user interface (GUI) for the pipeline model that was developed with SPS.
These screens were analogous to the SCADA screens used for online systems. SCADA systems
are defined by PHMSA (2008) as serving a principal function to alarm or notify a control room
operator of abnormal process deviations, (e.g. pressure, flow, and temperature). A standalone
Visual Basic program was developed to present alarms to participants. Our Visual Basic alarm
presentation program allowed the manipulation of essential independent variables in this
experiment, i.e. alarm category colors and different display methods. Sample pictures of the user
interface are provided in Figures 2, 3, and 4.
The interface design for the study utilized four computer monitors, one 19 inch and three

34
Figure 2 – Example Alarm List Display
Figure 3 – User Interface Used for Qualifying Participants
Figure 4 – Partial Snapshot of Overview Display Used During Actual Experiment
17 inch monitors. The 19 inch monitor was used to display the participant qualifying and
experiment overview displays. Two 17 inch monitors were dedicated to displaying detailed
station displays of the simulated pipeline system. The remaining 17 inch monitor was used to
display the alarm window and maintenance request form for the experiments. The additional
screens were setup as an extension of the computer’s desktop so one keyboard and mouse could
control all system functions. A picture of the hardware setup is provided in Figure 5.
To capture each participant’s observed performance and responses during each

35
Figure 5 – Picture of Hardware used by Participants
experimental scenario, MORAE (video capture software) was installed on the same computer as
that used by participants for their training and experiments. This data was analyzed manually
after each participant finished all phases of the study to collect response times and scenario
performance.
3.5 Overview of Abnormal Events Simulated
For this experiment an essential objective was to measure operator performance given
different alarm rates and alarm display methodologies. Given that this was the goal it was
decided that each alarm would require an operator response which consist of three elemental
subtasks. These subtasks are (1) Identify the abnormal situation; (2) Assess the abnormal
situation; and (3) Respond to the abnormal situation. The decision to exclude erroneous alarms
(e.g. nuisance alarms, false alarms, etc…) during all of these experiments was based on the
assumption that these alarms would not add any significant value when interpreting operator
performance data as measured in this experiment. The reasoning for using this simplifying
assumption, for this experiment, is that there are a very limited number of published empirical
studies evaluating operator performance given different alarm rates and display types. So, it was
decided that an idealized simulation scenario evaluating alarm rates would yield the most useful
results, with the goal of evaluating and developing “condition specific” studies at a later date.

36
Further, since this study was directly attempting to empirically evaluate the impact alarm
rates and alarm display methodologies has on operator performance, the addition of erroneous
alarms (e.g. nuisance alarms, false alarms, etc…) was believed to not contribute relevant data
when analyzing performance measures such as response time and error rate, and would only add
“noise” to the data. Future studies may attempt to further evaluate the topic of alarm floods
which include some number of non-value added (erroneous) alarms since there have only been a
small number of experimental studies focusing on the alarm rate and display methodology topic.
A list of example events that were randomly presented to participants is provided below.
Pressure Relief/Leak Events
Power Failures
Equipment Malfunctions
Equipment Failures
3.6 Experimental Variables and Their Measures
A discussion of the experimental variables in this experiment and their measures are
provided below. Figure 6 graphically presents an overview of the experimental variables and
their measures. The independent variables were the experimental alarm rates (Table 6) and the
two types of alarm window displays chronological (Figure 8) and categorical (Figure 9). The
dependent variables in this experiment was the time taken to acknowledge each alarm, response
time to initiate corrective action, fraction of abnormal situations successfully dealt with, and
accuracy of response.
3.6.1 Dependent Variables
Time Taken to Acknowledge Each Alarm – This is simply the time elapsed after an alarm

37
Figure 6 – Overview of Experimental Variables and Measures of Operator Performance
is displayed until that alarm is acknowledged by the participant.
Response Time to Each Alarm – Response time can be broken down into three general
sub-measures (1) Acknowledgement; (2) Analyze; and (3) Act. This framework is
adapted from a study conducted by Reising et al. (2004). Also, when an operator is
handling alarms, by GOMS analysis, there are four distinct steps an operator must
complete to respond to any given alarm, these are (1) Acknowledge; (2) Analyze; (3)
Act; and (4) Interpret effect of action (Reising, Downs et al. 2004). For this experiment,
the time taken during the acknowledgement stage is measured as the time elapsed after an
alarm is displayed until that alarm is acknowledged by the participant. The time taken to
analyze an alarm and the time taken to determine the effect of action was not considered

38
directly for this experiment. The time taken to act on an alarm is measured as the time
elapsed after an alarm is displayed until action is taken.
Fraction of Abnormal Situations Successfully Dealt With – A point system was defined
to practically measure this variable. The point system is defined by 0 – Unsuccessful and
1 – Successful. “Successful” is defined here in a very literal sense as the participant
executes the correct action for a given alarm. For simplicity, the correct action (defined
by the respective abnormal event simulated) did not have to be executed in the correct
order to be awarded points for this measure.
Accuracy of Response – A point system was defined to practically measure this variable.
The total number of points possible was calculated based on the minimum number of
actions to successfully handle all abnormal situations for each alarm, for each unique
experiment. Participants start the experiment with zero points and were awarded points
when they took the appropriate action for each alarm. For example, one point could be
awarded for submitting a maintenance request for a pump failure, one point could be
awarded for shutting down the correct pump during a leak event, or one point could be
awarded for opening/closing a block valve that malfunctioned. Every elemental defined
action was worth one point. The maximum points a participant could achieve was 38 (20
Alarms – 10 Min.), 20 (10 Alarms – 10 Min.), 10 (5 Alarms – 10 Min.), 4 (2 Alarms – 10
Min.), and 2 (1 Alarms – 10 Min.). Unlike the Fraction of Abnormal Situations
Successfully Dealt With measure, the Accuracy of Response measure evaluates a
participant’s ability to execute corrective action in the correct sequence. This measure
can be thought of as a participant’s error rate. A grading example is provided in Table 3
below.

39
Table 3 – Example participant Grading for Accuracy of Response and Successful Completion
3.6.2 Independent Variables
Alarm Rates – The alarm rates for this experiment were kept constant. Please refer to
Table 4 for the EEMUA No. 191 average alarm rate standard, Table 5 for the Draft ISA
average alarm rate standard, and Table 6 for the alarm rates used for this experiment. The
alarm priority distribution is presented in Figure 7.
Table 4 – EEMUA No. 191 Benchmark Average Alarm Rate Standard
Long Term Average Alarm Rate in Steady
Operation Acceptability
>1 alarm per minute Very likely to be unacceptable
1 alarm per two minute Likely to be excessively demanding
1 alarm per five minutes Manageable
<1 one alarm per ten minutes Very likely to be acceptable
Table 5 – Draft ISA 18.02 Average Alarm Rate Standard
Very Likely to be Acceptable Maximum Manageable
~150 Alarms per day ~300 Alarms per day
~6 Alarms per hour (average) ~12 Alarms per hour (average)
~1 Alarms per 10 minutes (average) ~2 Alarms per 10 minutes (average)
Alarm Windows – There were two types of alarm windows used for this experiment. One
presented alarms chronologically (Figure 8) and the other presented them by category
(Figure 9).
Required Action In
Order of Occurance Alarm 1 Points Notes: Required Action Alarm 1 Points Notes:
1
Execute shutdown
sequence for pump
with leak. 0
Participant shutdown
wrong pump first. 1
Shutdown pump
with leak. 1
Participant shutdown
correct pump after
shutting down the wrong
pump first.
2
Submit maintenance
request. 1
Participant submitted
maintance request. 2
Submit maintenance
request. 1
Participant submitted
maintenance request.
Accuracy of Response Successfully Handled Abnormal Situation

40
Table 6 – Alarm Rates Used For Experiments
20 in First 10 Minutes Chronological and Categorized Alarm display
10 in First 10 Minutes Chronological and Categorized Alarm display
5 in First 10 Minutes Chronological and Categorized Alarm display
2 in First 10 Minutes Chronological and Categorized Alarm display
1 in First 10 Minutes Chronological and Categorized Alarm display
Figure 7 – Alarm Frequency Distribution
3.7 Experimental Design Procedure
The experimental procedure begins with the participant completing a demographic survey
(computer based). This survey included questions regarding generalized demographic
information (e.g. major, student classification, GPA, etc.), a participants computer literacy, and a
question asking if they have ever used Stoner’s software (used to develop and complete
Experiments utilized in this study). The demographic survey can be found in Appendix 5.
Participants with any past experience using Stoner software were eliminated. Participants were
then trained to navigate the user interface and become familiarized with standard operating
7
4
2
1 1
7
4
2
1
0
6
2
1
0 00
1
2
3
4
5
6
7
8
20-10Min. 10-10Min. 5-10Min. 2-10Min. 1-10Min.
Ala
rms
Fre
qu
ency
Alarm Frequency Distribution
High
Caution
Low

41
Figure 8 – Chronological Alarm Display
Figure 9 – Categorized Alarm Display
procedures via a power point presentation and demonstration model. Last, participants were then
administered a general knowledge quiz testing their ability to complete elemental tasks involved
with the experiment. A copy of this quiz can be found in Appendix 6.
Upon passing the general knowledge quiz participants were then administered the
qualification assessment (overview display for the qualification assessment can be found in

42
Figure 3). The qualification assessment tested each participant’s ability to correctly handle
abnormal situations representative of those to be experienced during the experiment. Upon
successful completion of the qualification assessment participants proceeded to complete the first
part of the experiment. Finally, during day two a brief round of refresher training was provided
to each participant to help ensure the skills taught during the first day were retained for the
second portion of the experiment. After completing all experiments each participant was
administered a subjective usability questionnaire evaluating their experiences during both days
of the experiment. A copy of this questionnaire can be found in Appendix 7. A flow chart of the
experimental procedure is presented in Figure 10.
Figure 10 – Experimental Procedure Flow Chart.

43
CHAPTER 4. RESULTS AND DISCUSSION
4.1 Experimental Model and Statistical Reporting Conventions
Within subject design (A x I x P), the model would be:
= m + A + I + P + AI + AP + IP + AIP + e
Where:
A = the effect of your first Independent Variable (Alarm Rate)
I = the effect of your second Independent Variable (Interface Type)
P = the participant effect (The Repetitions)
= dependent measures (Reaction time, Accuracy, Acknowledge time)
m = the population mean
AI = the interaction of "A" and "I"
AP = the interaction of "A" and "P"
IP = the interaction of “I" and "P"
AIP = the interaction of "A," "I" and "P"
e = error
The P-Value will always be reported as P-Value = #.
The F-Ratio will always be reported as .
All analysis of variance (ANOVA) tests were completed using a 0.05 level of
significance.
4.2 Hypothesis 1
Null Hypothesis 1: No differences exist in participant accuracy of response given different
alarm rates.
Alternative Hypothesis 1: Differences exist in participant accuracy of response given

44
different alarm rates.
Dependent Variable : Accuracy of Response
Independent Variable : Alarm Rates
4.2.1 Differences in Accuracy of Response (All Alarms)
The results of an ANOVA testing for differences in accuracy of response (including all
alarms) between the five different alarm rate experiments yielded a significant effect. Thus, there
is sufficient evidence at the 0.05 level of significance to conclude that differences do exist in an
operator’s performance at different alarm rates. ( ).
To determine which alarm rates showed difference, a Tukey’s means test was performed.
The results showed that for the 20 Alarms in 10 Min. experiment there was a significant
difference compared to all other experimental alarm rates used. See Appendix 8 for a summary
of the AVONA, Effects Test, and Tukey’s Means Test.
4.2.2 Differences in Accuracy of Response (Low Priority Alarms)
Response accuracy for low priority alarms at different alarm rates was observed to be
significant. The results of an ANOVA testing for differences in accuracy of response for
different alarm rates given low priority alarms yielded a significant effect. Thus, there is
sufficient evidence at the 0.05 level of significance to conclude that differences do exist in an
operator’s performance for different alarm rates given low priority alarms.
( ).
To determine which alarm rates showed difference, a Tukey’s means test was performed.
The results showed that for the 20 Alarms in 10 Min. experiment there was a significant
difference compared to all other experimental alarm rates used. See Appendix 9 for a summary

45
of the AVONA, Effects Test, and Tukey’s Means Test.
4.3 Hypothesis 2
Null Hypothesis 2: Participant response time to each alarm by category does not differ between
each alarm display used by participants.
Alternative Hypothesis 2: Participant response time to each alarm by category differs
between each alarm display used by participants.
Dependent Variable : Participant Response Time
Independent Variable : Alarm Display Window (Category or Chronological)
4.3.1 Differences in Response Time (Low Priority Alarms)
The results of an ANOVA testing for differences in participant response times (including
only Low priority alarms) yielded a significant effect. Thus, there is sufficient evidence at the
0.05 level of significance to conclude that differences do exist in an operator’s response time to
Low priority alarms. ( ).
To determine which alarm rates showed difference, a Tukey’s means test was performed.
The results showed that for the 20 Alarms in 10 Min. experiment there was a significant
difference in participant reaction time (for Low priority alarms only) between all other
experimental alarm rates used. Specifically, the mean response time (in seconds) observed for
each alarm rate experiment (by alarm rate for Low priority alarms only) are as follows 162 (20
Alarms in 10 Min.), 33 (5 Alarms in 10 Min.), and 19 (10 Alarms in 10 Min.). See Appendix 10
for a summary of the AVONA, Effects Test, and Tukey’s Means Test.
4.3.1 Differences in Response Time (Caution Priority Alarms)
The results of an ANOVA testing for differences in participant response times (including only

46
Caution priority alarms) yielded a significant effect. Thus, there is sufficient evidence at the 0.05
level of significance to conclude that differences do exist in an operator’s response time to
Caution priority alarms. ( ).
To determine which alarm rates showed difference, a Tukey’s means test was performed.
The results showed that for the 20 Alarms in 10 Min. experiment there was a significant
difference in participant reaction time (for Caution priority alarms only) between all other
experimental alarm rates used. Specifically, the mean response time (in seconds) observed for
each alarm rate experiment (by alarm rate for Caution priority alarms only) are as follows 64 (20
Alarms in 10 Min.), 33 (10 Alarms in 10 Min.), 31 (5 Alarms in 10 Min.), and 22 (2 Alarms in
10 Min.). See Appendix 11 for a summary of the AVONA, Effects Test, and Tukey’s Means
Test.
4.3.2 Differences in Response Time (High Priority Alarms)
The results of an ANOVA testing for differences in participant response times (including only
High priority alarms) yielded a significant effect. Thus, there is sufficient evidence at the 0.05
level of significance to conclude that differences do exist in an operator’s response time to High
priority alarms. The Effects Tests showed that the Main Effect (alarm rate) was significant
having a and the Interaction Category & Chronological
Alarm Display was significant having .
To determine which alarm rates showed difference, a Tukey’s means test was performed.
The results showed that for the 20 Alarms in 10 Min. experiment there was a significant
difference in participant reaction time (only for High priority alarms) between all other
experimental alarm rates used. Specifically, the mean response time (in seconds) observed for
each alarm rate experiment (by alarm rate for High priority alarms only) are as follows 64 (20

47
Alarms in 10 Min.), 41 (5 Alarms in 10 Min.), 37 (10 Alarms in 10 Min.), 37 (2 Alarms in 10
Min.), and 27 (1 Alarms in 10 Min.). See Appendix 12 for a summary of the AVONA, Effects
Test, and Tukey’s Means Test.
Another Tukey’s Means Test was performed to determine where differences exist in
participant response times when using the Category & Chronological Alarm Displays (for High
priority alarms only). The results showed that there was a significant difference in participant
reaction time (only for High priority alarms) between the Category & Chronological Alarm
Displays. Specifically, the mean response time (by Alarm Display Type for High priority alarms
only) observed when using the Chronological Alarm Display was 47 seconds and the mean
response time when using the Categorical Alarm Display was 35 seconds. See Appendix 12 for
a summary of the AVONA, Effects Test, and Tukey’s Means Test.
4.4 Hypothesis 3
Null Hypothesis 3: Participant response time to alarms will not increase as the alarm rate is
increased.
Alternative Hypothesis 3: Participant response time to alarms will increase as the alarm
rate is increased.
Dependent Variable : Participant Response Time
Independent Variable : Alarm Rate
4.4.1 Differences in Response Time (All Alarms)
The results of an ANOVA testing for differences in participant response times (including all
alarms) yielded a significant effect. Thus, there is sufficient evidence at the 0.05 level of
significance to conclude that differences do exist in an operator’s response time to alarms. The

48
Effects Tests showed that the Main Effect (alarm rate) was significant, having
and the Interaction of Alarm Rate & Alarm Display Type
(Category/Chronological) was significant, having .
To determine which alarm rates showed difference, a Tukey’s means test was performed.
The results showed that for the 20 Alarms in 10 Min. experiment there was a significant
difference in participant reaction time between all other experimental alarm rates used.
Specifically, the mean response time (in seconds) observed for each alarm rate experiment (by
alarm rate only) are as follows 93 (20 Alarms in 10 Min.), 35 (5 Alarms in 10 Min.), 32 (10
Alarms in 10 Min.), 29 (2 Alarms in 10 Min.), and 27 (1 Alarms in 10 Min.). Performing an
expanded Tukey’s Means test for the interaction between Alarm Rate & Alarm Display Type
results showed that for the 20 Alarms in 10 Min. experiment there was a significant difference in
participant reaction time between the categorical alarm window and chronological alarm
window. Specifically, the mean response times (in seconds) observed for each experiment are as
follows 112 (20 Alarms in 10 Min. – Chronological Alarm Display) and 74 (20 Alarms in 10
Min. – Categorical Alarm Display). See Appendix 13 for a summary of the AVONA, Effects
Test, and Tukey’s Means Test.
4.5 Further Observations
4.5.1 Differences in Acknowledgement Time (All Alarms)
The results of an ANOVA testing for differences in participant acknowledgement times
(including all alarms) yielded a significant effect. Where, the independent variables were Alarm
Rate & Display Type and the dependent variable was participant acknowledgement times. Thus,
there is sufficient evidence at the 0.05 level of significance to conclude that differences do exist
49
in an operator’s acknowledgement time to alarms. The Effects Tests showed that the Main Effect
(alarm rate) was significant, having and the Interaction of
Alarm Rate & Alarm Display Type (Category/Chronological) was significant, having
.
To determine which alarm rates showed difference, a Tukey’s means test was performed.
The results showed that for the 20 Alarms in 10 Min. experiment there was a significant
difference in participant acknowledgement time between all other experimental alarm rates used.
Specifically, the mean acknowledgement time (in seconds) observed for each alarm rate
experiment (by alarm rate only) are as follows 93 (20 Alarms in 10 Min.), 35 (5 Alarms in 10
Min.), 32 (10 Alarms in 10 Min.), 29 (2 Alarms in 10 Min.), and 27 (1 Alarms in 10 Min.).
Running an expanded Tukey’s Means test for the interaction between Alarm Rate & Alarm
Display Type results showed that for the 20 Alarms in 10 Min. experiment there was a
significant difference in participant acknowledgement time between the categorical alarm
window and chronological alarm window. Specifically, the mean acknowledgement times (in
seconds) observed for each experiment are as follows 115 (20 Alarms in 10 Min. –
Chronological Alarm Display) and 63 (20 Alarms in 10 Min. – Categorical Alarm Display). See
Appendix 14 for a summary of the AVONA, Effects Test, and Tukey’s Means Test.
4.5.2 Differences in Acknowledgement Time (Low Priority Alarms)
The results of an ANOVA testing for differences in participant acknowledgement times
(including only Low priority Alarms) yielded a significant effect. Thus, there is sufficient
evidence at the 0.05 level of significance to conclude that differences do exist in an operator’s
acknowledgement time for Low priority alarms. The Effects Tests showed that the Main Effect
(alarm rate) was significant, having and the Interaction of

50
Alarm Rate & Alarm Display Type (Category/Chronological) was significant, having
.
To determine which alarm rates showed difference, a Tukey’s means test was performed.
The interaction between Alarm Rate & Alarm Display Type results showed that for the 20
Alarms in 10 Min. experiment there was a significant difference in participant acknowledgement
time for Low priority alarms between the categorical alarm window and chronological alarm
window. Specifically, the mean acknowledgement times (in seconds) observed for each
experiment, for Low priority alarms only, are as follows 191 (20 Alarms in 10 Min. –
Chronological Alarm Display) and 116 (20 Alarms in 10 Min. – Categorical Alarm Display). See
Appendix 15 for a summary of the AVONA, Effects Test, and Tukey’s Means Test.
4.5.3 Differences in Acknowledgement Time (Caution Priority Alarms)
The results of an ANOVA testing for differences in participant acknowledgement times
(including only Caution priority Alarms) yielded a significant effect. Thus, there is sufficient
evidence at the 0.05 level of significance to conclude that differences do exist in an operator’s
acknowledgement time for Caution priority alarms. The Effects Tests showed that the Main
Effect (alarm rate) was significant, having and the
Interaction of Alarm Rate & Alarm Display Type (Category/Chronological) was significant,
having .
To determine which alarm rates showed difference, a Tukey’s means test was performed.
The results for the interaction between Alarm Rate & Alarm Display Type showed that for the 20
Alarms in 10 Min. experiment there was a significant difference in participant acknowledgement
time for Caution priority alarms only using the chronological alarm window. Specifically, the
mean acknowledgement times (in seconds) observed for each 20 Alarms in 10 Min. experiment
51
for Caution priority alarms only are as follows 107 (20 Alarms in 10 Min. – Chronological
Alarm Display) and 52 (20 Alarms in 10 Min. – Categorical Alarm Display). See Appendix 16
for a summary of the AVONA, Effects Test, and Tukey’s Means Test.
4.5.4 Differences in Acknowledgement Time (High Priority Alarms)
The results of an ANOVA testing for differences in participant acknowledgement times
(including only High priority Alarms) yielded a significant effect. Thus, there is sufficient
evidence at the 0.05 level of significance to conclude that differences do exist in an operator’s
acknowledgement time for High priority alarms. The Effects Tests showed that the Main Effect
(alarm rate) was significant, having , the Effect Categorical
vs. Chronological was significant having , and the
Interaction of Alarm Rate & Alarm Display Type (Category/Chronological) was significant,
having .
To determine which alarm rates showed difference, a Tukey’s means test was performed.
The results for the interaction between Alarm Rate & Alarm Display Type showed that for the 20
Alarms – 10 Min. experiment there was a significant difference in participant acknowledgement
time for High priority alarms only using the chronological alarm window. Specifically, the mean
acknowledgement times (in seconds) observed for each 20 Alarms in 10 Min. experiment for
High priority alarms only are as follows 58 (20 Alarms in 10 Min. – Chronological Alarm
Display) and 29 (20 Alarms in 10 Min. – Categorical Alarm Display). Also, significance was
observed for the 2 Alarms in 10 Min. experiment for chronological & categorical. The results
observed (in seconds) are as follows 38 (2 Alarms in 10 Min. – Chronological Alarm Display)
and 38 (2 Alarms in 10 Min. – Categorical Alarm Display). See Appendix 17 for a summary of
the AVONA, Effects Test, and Tukey’s Means Test.

52
4.6 Subjective Usability Questionnaire
A total of 34 participants completed the subjective usability questionnaire. A complete
table of participant answers and summary data can be found in Appendix 7. Of those surveyed,
79% (27/34) of participants preferred using the Categorical Alarm Display and 21% preferred
using the Chronological Alarm display. The average response (including all questions and
participants surveyed) was 1.6.
4.7 Experiment Summary Statistics
See Table 9 for a summary of the hypotheses, with each answered. See Figures 11 and 12
and Tables 7 and 8 below for important results observed during this experiment. A total of 39
participants volunteered for this study. 31 participants were included in the data analysis in
Chapter 4. Participants whose participant number is highlighted in yellow in Appendix 3 were
included in the data analysis in Chapter 4. The first 4 participants were part of the pilot study
which evaluated the experimental method; participants who were part of the pilot study were not
included in the final data analysis in Chapter 4. Two participants failed the qualification
assessment (passing was ≥ 50% and failing was < 50%), this is where each participant qualified
using a scaled down version of the actual experiment (100% is 4/4). All participants passed the
multiple choice quiz (Appendix 6); passing was ≥ 4/6 and failing was < 4/6. There was
incomplete data on participant 36. Of the participants included in the final data analysis in
Chapter 4, 16 participants started the experiment using the categorical alarm window first and 15
participants started the experiment using the chronological alarm window. See Appendix 3 for a
summary of general participant experiment statistics and demographic data collected. Please see
Appendix 18 for Descriptive Statistics observed during this experiment.

53
4.8 Discussion and Future Research Recommendations
The most noticeable distinction between this study and all but one previously discussed
in the literature review is that this study set out with a goal to empirically evaluate the human
Figure 11 – Mean Acknowledgement Time
limitation with respect to alarm rates for liquid pipeline control room operators. While the
studies evaluating observed alarm rates during actual operation or different display
methodologies are completely valid and practical there still was still a void in the research with
respect to empirically evaluating alarm rate standards.
Future alarm management studies could focus on further developing and evaluating an
empirical alarm rate standard. Topics for this scope of research could target maximum allowable
number of alarms an operator can theoretically handle over some time interval, how long a given
alarm rate can be sustained by an operator before performance begins to decrease significantly,
and this last topic, but certainly not the only, can be described as a “performance measure as a
function of time” curve which could prove useful to companies developing new systems,
0
50
100
150
200
250
Hig
h
Cau
tio
n
Hig
h
Low
Cau
tio
n
Hig
h
Low
Cau
tio
n
Hig
h
Low
Cau
tio
n
Hig
h
1 -10
Min.
2 - 10 Min.
5 - 10 Min. 10 - 10 Min. 20 - 10 Min.
Me
an A
ckn
ow
led
ge T
ime
(Se
c)
Mean(ACK-Sec) Category
Mean(ACK-Sec) Chronological

54
improving existing systems, and/or benchmark current system performance. “Performance
Figure 12 – Mean Reaction Time
Table 7 – Acknowledgement Time Summary Statistics
Mean(ACK-Sec) Std Dev(ACK-Sec) N(ACK-Sec)
Category Chronological Category Chronological Category Chronological
1 -
10
Min
.
High
10 19 12 24 30 31
2 -
10
Min
.
Caution 15 18 13 22 31 31
High 38 38 75 69 31 31
5 -
10 M
in. Low 49 27 118 45 30 31
Caution 27 23 42 22 60 62
High 26 27 37 44 60 62
10 -
10
Min
.
Low 17 18 20 22 62 62
Caution 27 27 49 37 124 124
High 21 27 25 31 124 124
20 -
10
Min
.
Low 116 191 163 217 186 186
Caution 52 107 69 145 217 217
High 29 58 30 86 217 217
0
50
100
150
200
250
Hig
h
Cau
tio
n
Hig
h
Low
Cau
tio
n
Hig
h
Low
Cau
tio
n
Hig
h
Low
Cau
tio
n
Hig
h
1 -10
Min.
2 - 10 Min.
5 - 10 Min. 10 - 10 Min. 20 - 10 Min.
Re
acti
on
Tim
e (
Seco
nd
s)
Mean(RT-Sec) Category
Mean(RT-Sec) Chronological

55
Table 8– - Reaction Time Summary Statistics
Mean(RT-Sec) Std Dev(RT-Sec) N(RT-Sec)
Category Chronological Category Chronological Category Chronological
1 -
10
Min
.
High
24 30 15 14 31 31
2 -
10
Min
.
Caution 18 25 8 17 31 31
High 35 38 20 25 31 31
5 -
10
Min
. Low 29 36 45 88 30 31
Caution 27 34 23 38 60 62
High 38 45 26 34 60 62
10 -
10
Min
.
Low 19 18 25 10 62 62
Caution 28 38 25 60 124 124
High 32 42 20 48 124 121
20 -
10
Min
.
Low 131 192 173 226 178 182
Caution 53 75 63 111 214 214
High 47 80 61 119 214 211
measures” defined here could be response times, accuracy of response, successful completion,
and/or acknowledgement time (these performance measures would be literally studied as a
function of time). Some other areas of study could include operator distractions, time of day
effects, affect of nuisance alarms on operator performance, and operator stress experiments.
There are two note worthy limitations to this study that should not be overlooked
including (1) students were the participants as opposed to actual operators and (2) the full
complexity of the simulation was not comparable to real-world SCADA systems. These
limitations must be understood in interpreting the results of this work and its application to the
industry. Further work is needed before the results can be implemented within industry.
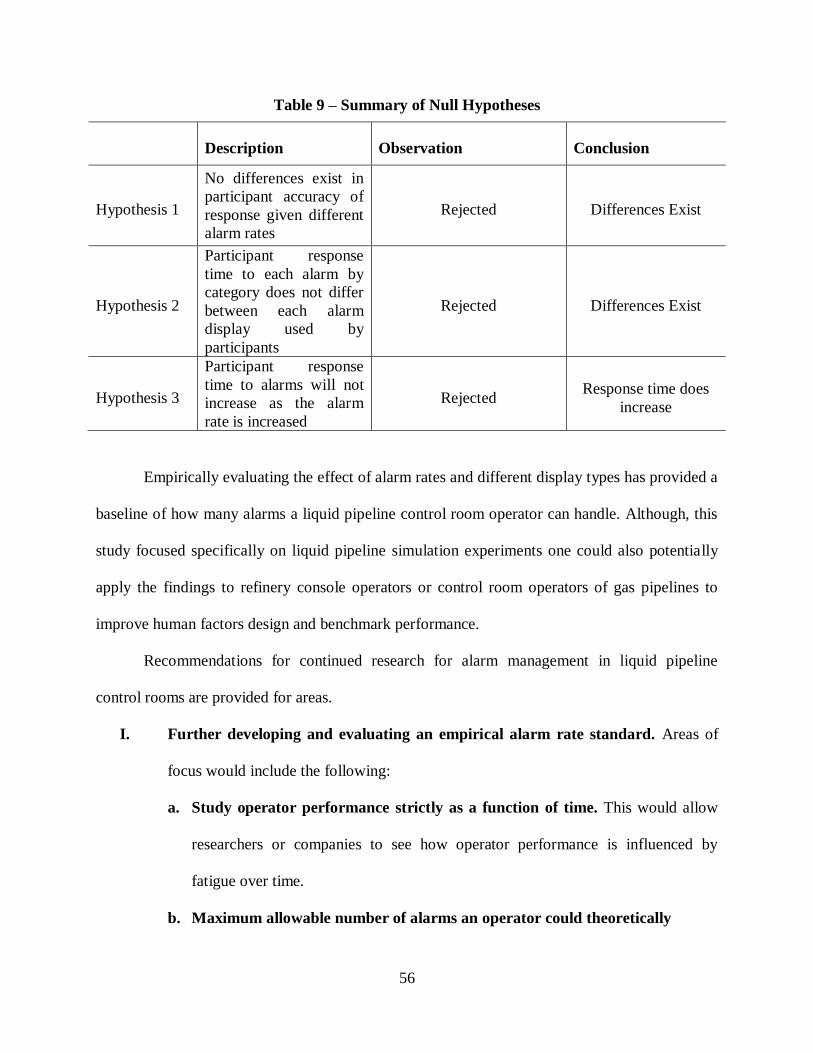
56
Table 9 – Summary of Null Hypotheses
Description Observation Conclusion
Hypothesis 1
No differences exist in
participant accuracy of
response given different
alarm rates
Rejected Differences Exist
Hypothesis 2
Participant response
time to each alarm by
category does not differ
between each alarm
display used by
participants
Rejected Differences Exist
Hypothesis 3
Participant response
time to alarms will not
increase as the alarm
rate is increased
Rejected Response time does
increase
Empirically evaluating the effect of alarm rates and different display types has provided a
baseline of how many alarms a liquid pipeline control room operator can handle. Although, this
study focused specifically on liquid pipeline simulation experiments one could also potentially
apply the findings to refinery console operators or control room operators of gas pipelines to
improve human factors design and benchmark performance.
Recommendations for continued research for alarm management in liquid pipeline
control rooms are provided for areas.
I. Further developing and evaluating an empirical alarm rate standard. Areas of
focus would include the following:
a. Study operator performance strictly as a function of time. This would allow
researchers or companies to see how operator performance is influenced by
fatigue over time.
b. Maximum allowable number of alarms an operator could theoretically

57
handle over some time interval.
c. Time a given alarm rate or dynamic alarm rate can be sustained before
selected performance measures begin to decrease materially.
d. Operator distractions – Communication, Logging, and other distractions.
e. Time of day effects – Operator performance could be studied taking into account
the nature of shift-work.
f. Effect of nuisance alarms – The effect of nuisance alarms could be studied to
evaluate how to these alarms effect operator performance.
g. Operator stress effects – Specific “stressor” experiments could be developed to
evaluate the impact on operator performance.
58
REFERENCES
American Petroleum Institute (API). (2009). API RP 1167: Recommended Practice for Pipeline
Control Room Alarm Management (Vol. FIRST EDITION).
API (2007). API – RP 1165 – 2007, Recommended Practice for Pipeline SCADA Displays, API
- American Petroleum Institute, API Publishing Services 1220 L Street, N.W.,
Washington, D.C. 20005, United States.
Bass, J. (2007). "Xcel Energy Implements an Alarm Management Strategy." Power Engineering
111(11): 196-204.
Bullemer, P. and I. Nimmo (1998). "Tackle abnormal situation management with better
training." Chemical Engineering Progress 94(1): 43.
Bullemer, P. T. and I. Nimmo (1994). Understanding and supporting abnormal situation
management in industrial process control environments: a new approach to training, San
Antonio, TX, USA, IEEE, Piscataway, NJ, USA.
Butikofer, R.E. Safety Digest of Lessons Learned, API Publications 758. American Petroleum
Institute, Washington DC, 1986
Dunn, D. G. and N. P. Sands (2005). ISA-SP18 - Alarm systems management and design guide,
Chicago, IL, United States, ISA - Instrumentation, Systems, and Automation Society,
Research Triangle Park, NC 27709, United States.
EEMUA (1999). Alarm systems : a guide to design, management and procurement. London,
Engineering Equipment and Materials Users Association.
EEMUA (2002). Process Plant Control Desks Utilising Human-Computer Interfaces. London,
Engineering Equipment and Materials Users Association
Errington, J., T. DeMaere, Reising, D. (2004). After the alarm rationalization - Managing the
DCS alarm system, New Orleans, LA, United States, American Institute of Chemical
Engineers, New York, United States.
Errington, J., D. V. Reising, Harris, K. (2006). "ASM outperforms traditional interface."
Chemical Processing 69(3): 55-58.
Errington, J., D. V. C. Reising, Bullemer, P, Demaere, T., Coppard, D., Doe, K., Bloom, C.
(2005). "Establishing Human Performance Improvements and Economic Benefit for a
Human-Centered Operator Interface: An Industrial Evaluation." Human Factors and
Ergonomics Society Annual Meeting Proceedings 49: 2036-2040.
Goldstien, I.L. (1986). Training in Organizations: Needs Assessment, Development, and
Evaluation. Monterery, CA: Brooks/Cole.

59
ISA (2008). ISA – 18.02 – 2008, Management of Alarm Systems for the Process Industries, ISA
- Instrumentation, Systems, and Automation Society, Research Triangle Park, NC 27709,
United States.
Mattiasson, C. T. (1999). "Alarm system from the operator's perspective." IEE Conference
Publication(463): 217-221.
Mostia Jr, W. L. B. (2003). "How to perform alarm rationalization." Control (Chicago, Ill) 16(7):
45-47.
MPR Associates, I. and B. N. Laboratory (2004). Human Factors Guidance for Control Room
and Digital Human-System Interface Design and Modification, Guidelines for Planning,
Specification, Design, Licensing, Implementation, Training, Operation and Maintenance.
United States: 1136p.
Nimmo, I. (1995). Abnormal situation management, New Orleans, LA, USA, Instrument Society
of America, Research Triangle Park, NC, USA.
Nimmo, I. (2002). "It's time to consider human factors in alarm management." Chemical
Engineering Progress 98(11): 30-38.
Pipeline and Hazardous Materials Safety Administration (PHMSA), D. O. T. (2008). Pipeline
Safety: Control Room Management/Human Factors; Proposed Rule. Federal
Register/Vol. 73, No. 178. 49 CFR Parts 192, 193, and 195.
Rasmussen, B. (1989). "CHEMICAL PROCESS HAZARD IDENTIFICATION." Reliability
Engineering & System Safety 24(1): 11-20.
Reising, D. V. C., J. L. Downs, Danni, B. (2004). "Human Performance Models for Response to
Alarm Notifications in the Process Industries: An Industrial Case Study." Human Factors
and Ergonomics Society Annual Meeting Proceedings 48: 1189-1193.
Reising, D. V. C. and T. Montgomery (2005). Achieving effective alarm system performance:
Results of ASM [registered trademark] consortium benchmarking against the EEMUA
guide for alarm systems, Atlanta, GA, United States, American Institute of Chemical
Engineers, New York, NY 10016-5991, United States.
Shahriari, M., A. Shee, Ortengren, R. (2006). "The development of critical criteria to improve
the alarm system in the process industry." Human Factors and Ergonomics in
Manufacturing 16(3): 321-337.
Smith, K. D. and B. A. Walker (2001). "Optimum console design promotes control room
efficiency. (Cover story)." Hydrocarbon Processing 80(9): 163.
Walker, B. A., K. D. Smith, Kekich, M. D. (2003). "Limiting shift-work fatigue in process
control." Chemical Engineering Progress 99(4): 54-57.

60
Watts-Perotti, J. and D. D. Woods (1999). "How Experienced Users Avoid Getting Lost in Large
Display Networks." International Journal of Human-Computer Interaction 11(4): 269-
299.
Woods, D.D. (1984). Visual Momentum - A Concept to Improve the Cognitive Coupling of
Person and Computer. [Article]. International Journal of Man-Machine Studies, 21(3).
229-244.

61
APPENDIX 1 – TABLE IDENTIFYING MEANING OF COLORS
Page 526 of (MPR Associates and Laboratory 2004), table on meaning of colors.

62
APPENDIX 2 – EEMUA NO. 191 BENCHMARK AVERAGE ALARM RATE
STANDARD
Alarm system performance benchmark standards developed by (EEMUA 1999).
Long Term Average Alarm Rate in Steady Operation
Acceptability
>1 alarm per minute Very likely to be unacceptable
1 alarm per two minute Likely to be excessively demanding
1 alarm per five minutes Manageable
<1 one alarm per ten minutes Very likely to be acceptable

63
APPENDIX 3 – TABLE SHOWING ORDER OF EXPERIMENTS, WHICH DISPLAY
USED FIRST, AND DEMOGRAPHIC INFORMATION
1---------- 5 2 1 3 4 ------------- 4 1 5 2 3 2---------- 2 3 1 5 4 ------------- 5 3 2 4 1 3---------- 4 1 2 5 3 ------------- 2 1 3 5 4 4---------- 1 5 3 4 2 ------------- 2 4 1 3 5 5---------- 4 3 2 5 1 ------------- 1 4 5 2 3 6---------- 4 5 3 2 1 ------------- 2 5 1 3 4 7---------- 4 1 5 2 3 ------------- 5 4 2 3 1 8---------- 2 4 1 3 5 ------------- 2 3 4 1 5 9---------- 3 4 1 2 5 ------------- 1 4 2 5 3 10--------- 5 3 4 2 1 ------------- 3 2 5 4 1 11--------- 1 5 4 3 2 ------------- 4 3 2 5 1 12--------- 1 4 3 5 2 ------------- 3 5 1 4 2 13--------- 3 4 1 5 2 ------------- 4 2 5 1 3 14--------- 1 4 3 2 5 ------------- 1 4 3 5 2 15--------- 4 5 1 2 3 ------------- 5 1 3 4 2 16--------- 5 4 2 3 1 ------------- 5 1 2 4 3 17--------- 3 1 2 4 5 ------------- 4 5 2 1 3 18--------- 4 3 5 1 2 ------------- 4 1 2 5 3 19--------- 4 3 1 5 2 ------------- 1 2 5 3 4 20--------- 3 2 1 5 4 ------------- 5 1 3 4 2 21--------- 2 1 4 5 3 ------------- 4 5 3 1 2 22--------- 1 2 3 5 4 ------------- 4 3 5 2 1 23--------- 5 1 2 4 3 ------------- 5 1 3 2 4 24--------- 5 4 2 1 3 ------------- 3 4 2 1 5 25--------- 2 4 3 5 1 ------------- 5 2 4 3 1 26--------- 2 5 1 3 4 ------------- 3 4 5 2 1 27--------- 1 4 2 5 3 ------------- 1 4 3 5 2 28--------- 3 2 5 4 1 ------------- 3 1 2 5 4 29--------- 5 3 4 1 2 ------------- 2 1 4 5 3 30--------- 1 4 3 2 5 ------------- 1 4 5 2 3 31--------- 3 1 2 4 5 ------------- 3 2 4 1 5 32--------- 3 1 2 5 4 ------------- 2 3 4 1 5 33--------- 4 2 5 3 1 ------------- 1 4 3 2 5 34--------- 1 2 3 5 4 ------------- 3 4 1 2 5 35--------- 3 4 1 5 2 ------------- 5 4 1 3 2 36--------- 4 5 3 1 2 ------------- 5 1 3 4 2 37--------- 5 1 2 3 4 ------------- 5 3 2 1 4 38--------- 3 4 5 2 1 ------------- 2 4 5 3 1 39--------- 2 4 3 1 5 ------------- 3 4 2 5 1
Notes: 1---------------- 1-10 Min. 2---------------- 2-10 Min. 3---------------- 5-10 Min. 4---------------- 10-10 Min. 5---------------- 20-10 Min.
Experiment 1
(Time)
Experiment 2
(Category)

64
Participant Number
Alarm Window Used First
(1=Chronological 2=Category)
Reason Rejected
Quiz Score (6 Possible)
Qualification Score (4 Possible) Age Gender Major Video Games
Computer Skills GPA
Student Class
Hydraulic Software
Use 1 Pilot Study Pilot Study Pilot Study Pilot Study 26 M gen studies: minor: cm, psych, socl Sometimes 3 2.7 B.S N 2 Pilot Study Pilot Study Pilot Study Pilot Study 25 M Construction Management (B.S.) Never 3 2.5 B.S N 3 Pilot Study Pilot Study Pilot Study Pilot Study 24 M Construction Management (B.S.) Sometimes 4 2 B.S N 4 Pilot Study Pilot Study Pilot Study Pilot Study 23 F Construction Management (B.S.) Never 3 3 B.S N 5 1 Pass 6 4 31 M Construction Management (B.S.) Sometimes 4 2.5 B.S N 6 2 Pass 6 3 24 M Construction Management (B.S.) Never 3 3.4 B.S N 7 1 Pass 6 4 8 1 Pass 6 2 20 M Construction Management (B.S.) 1Hr./Day 4 3.1 B.S N 9 2 Pass 6 2 22 M Construction Management (B.S.) Never 3 2.7 B.S N
10 2 Pass 4 4 23 M Civil Engineering (B.S.) 1-30Min./Day 3 2.8 B.S N 11 2 Pass 5 3 20 M Construction Management (B.S.) 1-30Min./Day 3 2.9 B.S N 12 1 Pass 6 4 22 F Construction Management (B.S.) Sometimes 2 2.4 B.S N 13 1 Pass 5 4 21 M Construction Management (B.S.) Sometimes 4 3 B.S N 14 1 Pass 5 3 20 M Construction Management (B.S.) Never 3 2.8 B.S N 15 2 Pass 6 4 21 M Construction Management (B.S.) Never 2 3.3 B.S N 16 2 Pass 6 4 23 M Construction Management (B.S.) Never 2 2.8 B.S N 17 1 Pass 6 3 32 M Construction Management (B.S.) 1Hr./Day 3 2.7 B.S N 18 2 Pass 6 4 23 M Construction Management (B.S.) Sometimes 2 3.4 B.S N 19 2 Pass 6 4 28 M Industrial Engineering (M.S. in I.E.) Sometimes 4 3.25 MS N 20 2 Pass 5 2 25 M Industrial Engineering (B.S.) Sometimes 4 2.9 BS N 21 1 Pass 6 4 20 M Industrial Engineering (B.S.) Sometimes 3 2.5 BS N 22 1 Pass 6 4 23 M Engineering Science (M.S. in E.S.) 1-30 min per day 4 3.0 MS N 23 1 Pass 6 3 22 M Industrial Engineering (B.S.) Sometimes 3 2.8 BS N 24 2 Pass 6 4 22 M Industrial Engineering (B.S.) 1-30 min per day 3 2.6 BS N 25 2 Pass 6 3 23 M Industrial Engineering (B.S.) Sometimes 3 3.5 MS N
26 Failed Qual.
Failed Qual. Failed Qual. Failed Qual. 22 M Computer Engineering (B.S.) Sometimes 3 3.6 MS N
27 2 Pass 6 4 20 M Petroleum Engineering (B.S.) 1-30 min per day 3 3.2 BS N 28 2 Pass 6 4 19 M Petroleum Engineering (B.S.) Sometimes 3 4.0 BS N
29 Failed Qual.
Failed Qual. Failed Qual. Failed Qual. 22 M Engineering Science (M.S. in E.S.) Sometimes 5 MS N
30 1 Pass 6 4 21 M Mechanical Engineering (B.S.) 5+ hr per day 4 2.8 BS N 31 1 Pass 6 4 25 M Construction Management (B.S.) Sometimes 3 2.5 BS N 32 1 Pass 6 4 22 M Engineering Science (M.S. in E.S.) Sometimes 4 3.0 MS N 33 1 Pass 6 3 22 M Engineering Science (M.S. in E.S.) 1 hr per day 4 3.0 MS N 34 2 Pass 6 3 20 M Petroleum Engineering (B.S.) 1-30 min per day 1 3.5 BS N 35 1 Pass 6 2 22 M Engineering Science (M.S. in E.S.) 3 hr per day 3 2.7 MS N 36 Eliminated Eliminated Eliminated Eliminated 22 F Environmental Engineering (B.S.) Sometimes 2 3.8 BS Y 37 2 Pass 6 4 20 F Industrial Engineering (B.S.) Never 3 3.5 BS N 38 2 Pass 6 4 23 M Construction Management (B.S.) Sometimes 2 3.4 BS N 39 1 Pass 6 4 21 M Petroleum Engineering (Ph.D.) Sometimes 2 3.3 BS N

65
APPENDIX 4 – PARTICIPANT TRAINING GUIDE
Overview of Experimental Method
Training Presentation.
Demonstration/Familiarization.
Quiz.
Participant Qualification Test.
Demographic Questionnaire
Experiment Total of 10 experiments with a duration of 10 minutes each.
Day 1○ Approximately 1Hr. 30Min.
○ Training
○ Demographic Questionnaire
○ Complete first 5 experiments
Day 2○ Approximately 1Hr.
○ Refresher training.
○ Complete remaining 5 experiments.
○ Subjective Usability Questionnaire

66
Introduction
This guide will train participants to
successfully identify, analyze, and act
during abnormal situations.
Abnormal situations can include any of
the following.
Leak events
Power failures
Equipment malfunctions
Equipment failures
Pipeline Overview
Section of line approximately 70 miles in
length.
9 Main transfer lines.
8 pumping stations.
2 – 4 pumps per station
Stations 2 – 8 have Main Station Discharge
Pipes and Bypass Station Discharge Pipes.
Pipeline will be transporting “Water” (SCL).

67
Alarm Priority Levels
Red – High priority alarms.
Yellow – Caution.
White – Low priority alarms.
Standard Operating Procedure
Every alarm will have a defined response!
Leaks Identify origin of flow leaving the pipeline.
Initiate shutdown sequence for specific pump or reroute flow through Bypass Station Discharge Pipes. Do not shutdown an entire station to stop a leak at one pump! Use the Start/Shutdown sequence button.
Submit maintenance request.
Pump Trip/Power Interruption Attempt to restart pump.
Submit maintenance request.
Equipment Malfunction Attempt to return equipment to normal operating mode
Submit maintenance request.

68
Cont’d
Equipment Failures
Ensure safe operating conditions are
obtained.
Submit maintenance request.
Overview Display

69
Detailed Station DisplayStart/Shutdown
sequence
button
Block
ValvePump
Detailed Station Display
Station
discharge
pipes
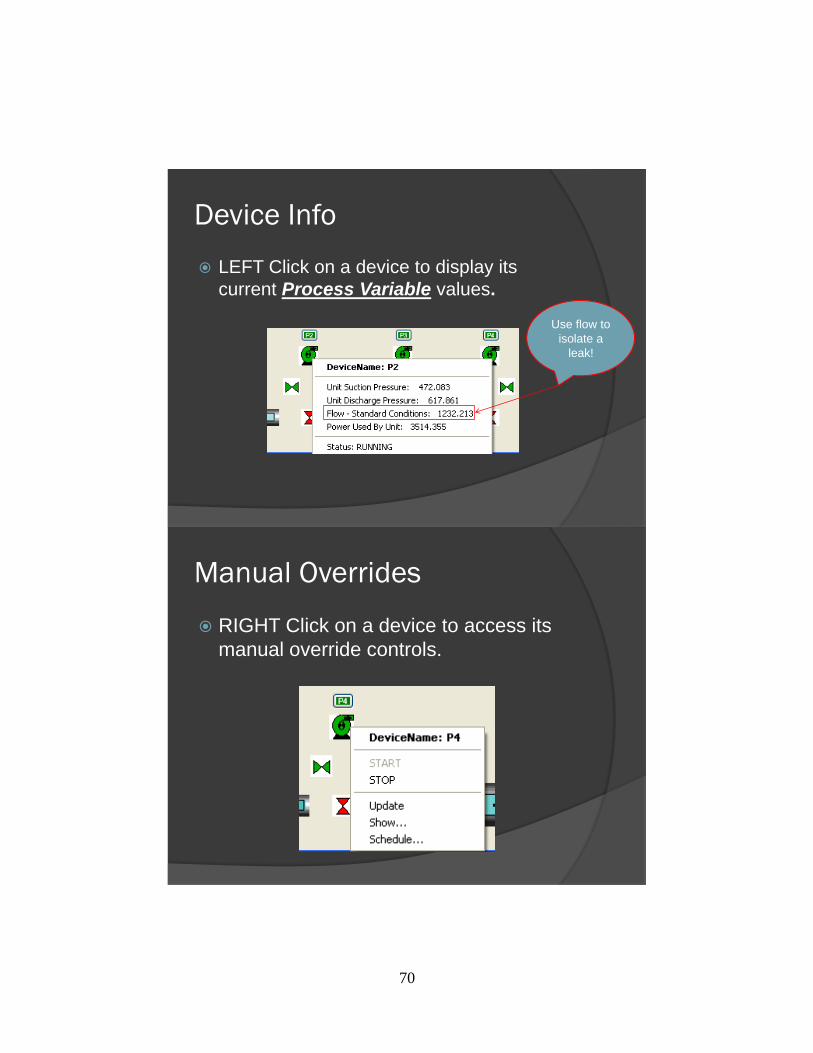
70
Device Info
LEFT Click on a device to display its
current Process Variable values.
Use flow to
isolate a
leak!
Manual Overrides
RIGHT Click on a device to access its
manual override controls.

71
Distance Plot – Steady State
Pump Trip & Leak ExamplePump
TripLeak

72
Time Plots
Pump Trip Leak
Questions???

73
APPENDIX 5 – DEMOGRAPHIC SURVEY
1. Age
2. Gender
3. Major
4. Student Classification
5. GPA
6. Rate you computing literacy: Ex. 5 would be a programmer (1 being not Fluent---5 being
very fluent)
7. How often do you play computer games?
8. Have you ever used Stoner Pipeline Simulator or other hydraulic analysis software?

74
APPENDIX 6 – GENERAL KNOWLEDGE QUIZ
General knowledge Quiz Participant #:_________________________________________
List the name associated with the pipeline device and answer any questions.
1. _____________
a. What is the status of this device? _______________
2. _______________
a. What is the status of this device? _______________
3.
What type of abnormal situation does this chart suggest has occurred? __________________
4. When is it necessary to submit a maintenance request?
a. Leak events
b. Power Trips
c. Equipment failures
d. Equipment malfunction
e. All of the above

75
APPENDIX 7 – SUBJECTIVE USABILITY QUESTIONNAIRE AND SUMMARY DATA
For each of the statements below, circle the rating of your choice.
1. Overall, I am satisfied with the ease of completing tasks using this system.
STRONGLY STRONGLY
AGREE 1 2 3 4 5 DISAGREE
COMMENTS:
2. Overall, I am satisfied with the support information (messages, documentation) when completing tasks
using this system.
STRONGLY STRONGLY
AGREE 1 2 3 4 5 DISAGREE
COMMENTS:
3. Overall, I am satisfied with how easy it is to use this system.
STRONGLY STRONGLY
AGREE 1 2 3 4 5 DISAGREE
COMMENTS:
4. It was simple to use this system.
STRONGLY STRONGLY
AGREE 1 2 3 4 5 DISAGREE
COMMENTS:
5. I could effectively complete the tasks and scenarios using this system.
STRONGLY STRONGLY
AGREE 1 2 3 4 5 DISAGREE
COMMENTS:
6. I was able to efficiently complete the tasks and scenarios using this system.
STRONGLY STRONGLY
AGREE 1 2 3 4 5 DISAGREE
COMMENTS:

76
7. I felt comfortable using this system.
STRONGLY STRONGLY
AGREE 1 2 3 4 5 DISAGREE
COMMENTS:
8. It was easy to learn how to use this system.
STRONGLY STRONGLY
AGREE 1 2 3 4 5 DISAGREE
COMMENTS:
9. I believe I could become productive quickly using this system.
STRONGLY STRONGLY
AGREE 1 2 3 4 5 DISAGREE
COMMENTS:
10. The information (on-screen messages and other documentation) provided with this system was clear.
STRONGLY STRONGLY
AGREE 1 2 3 4 5 DISAGREE
COMMENTS:
11. It was easy to find the information I needed to complete tasks.
STRONGLY STRONGLY
AGREE 1 2 3 4 5 DISAGREE
COMMENTS: 12. The information provided for the system was easy to understand.
STRONGLY STRONGLY
AGREE 1 2 3 4 5 DISAGREE
COMMENTS:
13. The information was effective in helping me complete the tasks and scenarios.
STRONGLY STRONGLY
AGREE 1 2 3 4 5 DISAGREE
COMMENTS:
14. The organization of information on the system screens was clear.
STRONGLY STRONGLY
AGREE 1 2 3 4 5 DISAGREE

77
COMMENTS: 15. I liked using the interface of this system.
STRONGLY STRONGLY
AGREE 1 2 3 4 5 DISAGREE
COMMENTS:
16. This system has all the functions and capabilities I expect it to have.
STRONGLY STRONGLY
AGREE 1 2 3 4 5 DISAGREE
COMMENTS:
17. Overall, I am satisfied with this system.
STRONGLY STRONGLY
AGREE 1 2 3 4 5 DISAGREE
COMMENTS:
18. Which alarm window (categorical vs. chronological) did you prefer using and why?

78
0
5
10
15
20
25
30
35
1 2 3 4 5 6 7 8 9 10 11 12 13 14 15 16 17
Question
Nu
mb
er o
f R
esp
on
ses
Subjective Usability Questionare Summary Data
1
2
3
4
5
7
27
Subjective Comparision Between Different Alarm Windows Studied (Question 18)
Time
Categorical

79
*Denotes data not considered or not collected. Yellow highlight denotes participant was included in data analysis in Chapter 4.
1 2 3 4 5 6 7 8 9 10 11 12 13 14 15 16 17 18
1 1 1 2 2 3 3 3 2 1 3 3 2 2 2 2 3 2 Time
2 * * * * * * * * * * * * * * * * * *
3 2 2 2 2 2 2 2 3 1 1 2 2 2 2 2 3 2 Categorical
4 * * * * * * * * * * * * * * * * * *
5 1 1 1 1 1 1 1 1 1 2 2 1 1 1 1 1 1 Categorical
5.1 1 1 1 1 1 1 1 1 1 1 1 1 1 1 1 1 1 Categorical
6 2 2 1 1 2 2 1 1 1 2 2 2 2 3 2 2 1 Categorical
7 1 1 1 1 1 1 1 1 1 2 1 2 2 1 2 1 1 Categorical
8 1 1 1 1 1 1 1 1 1 1 1 1 1 1 1 3 1 Categorical
9 1 2 1 1 1 2 2 2 1 2 1 3 2 3 3 2 2 Categorical
10 1 1 1 1 1 1 1 1 1 1 1 1 1 1 3 2 1 Categorical
11 1 2 1 1 1 1 1 1 1 2 1 1 1 1 1 1 1 Categorical
12 4 4 4 4 5 5 5 5 5 5 5 5 5 5 5 5 5 Time
13 1 2 1 1 1 1 2 2 1 1 1 1 1 1 2 1 1 Categorical
14 1 2 1 1 1 1 1 1 2 2 1 2 2 2 2 2 2 Categorical
15 1 1 1 1 1 1 1 1 1 1 1 1 1 1 1 1 1 Time
16 2 3 2 1 1 1 1 1 1 2 1 1 1 1 1 1 1 Categorical
17 1 1 1 1 1 1 2 2 1 1 1 2 1 1 1 1 1 Time
18 2 2 3 3 1 2 1 2 1 2 2 1 2 2 2 2 2 Categorical
19 4 4 4 5 5 5 5 5 5 5 5 5 4 5 4 4 4 Time
20 2 3 1 1 1 1 1 1 1 2 2 2 2 1 3 2 2 Categorical
21 1 1 1 1 1 1 1 1 1 1 1 1 1 1 1 1 1 Categorical
22 1 2 1 1 1 1 1 1 1 2 1 1 2 2 2 1 1 Categorical
23 1 2 1 1 1 1 1 1 1 3 2 1 1 2 2 1 1.5 Time
24 3 1 2 2 2 2 2 1 1 2 2 1 2 1 2 3 2 Categorical
25 * * * * * * * * * * * * * * * * * *
26 2 2 1 1 1 1 1 1 1 1 1 2 1 1 1 1 1 Time
27 2 2 2 3 2 2 2 1 1 2 2 2 2 2 1 2 2 Categorical
28 * * * * * * * * * * * * * * * * * *
29 * * * * * * * * * * * * * * * * * *
30 3 2 2 1 1 2 1 1 1 2 2 1 2 1 1 1 1 Categorical
31 1 1 1 1 1 1 1 2 1 2 1 2 1 1 1 1 1 Categorical
32 1 1 1 1 1 1 1 2 1 1 1 1 1 2 2 3 1 Categorical
33 1 1 1 1 1 1 1 1 3 1 1 1 1 1 1 3 1 Categorical
34 1 1 1 1 2 2 1 1 1 1 1 1 1 1 2 2 1 Categorical
35 2 1 1 1 1 1 1 1 2 1 1 1 1 1 1 2 1 Categorical
36 * * * * * * * * * * * * * * * * * *
37 1 2 1 1 1 1 1 1 1 2 1 1 1 1 1 1 1 Categorical
38 * * * * * * * * * * * * * * * * * *
39 3 2 2 2 3 3 2 2 1 1 1 2 2 3 2 1 1 Categorical
40 1 1 1 1 1 1 1 1 1 1 1 1 1 1 1 1 1 Categorical
QuestionP
arti
cip
an
t
1 2 3 4 5 6 7 8 9 10 11 12 13 14 15 16 17
1 21 16 24 26 25 22 24 23 29 15 22 20 19 21 16 17 23
2 8 14 7 4 5 8 7 8 2 15 9 11 13 8 13 9 9
3 3 2 1 2 2 2 1 1 1 2 1 1 0 3 3 6 0
4 2 2 2 1 0 0 0 0 0 0 0 0 1 0 1 1 1
5 0 0 0 1 2 2 2 2 2 2 2 2 1 2 1 1 1
1.8 1.51.8 1.6 1.6 1.6 1.6 1.81.4 1.5 1.6 1.5 1.5 1.4
Res
po
nse
s
Question
AVERAGE 1.6 1.7 1.4

80
APPENDIX 8 – DIFFERENCES IN ACCURACY OF RESPONSE (ALL ALARMS)

81
APPENDIX 9 – DIFFERENCES IN ACCURACY OF RESPONSE (LOW PRIORITY
ALARMS)
***Levels not connected by same letter are significantly different
Level Least Sq Mean
510 A 1.8709677
1010 A 1.8467742
2010 B 1.5806452

82
APPENDIX 10 – DIFFERENCES IN RESPONSE TIME (LOW PRIORITY ALARMS)
***Levels not connected by same letter are significantly different
Level Least Sq Mean
2010 A 161.59242
510 B 32.56559
1010 B 18.76613

83
APPENDIX 11 – DIFFERENCES IN RESPONSE TIME (CAUTION PRIORITY
ALARMS)
***Levels not connected by same letter are significantly different
Level Least Sq Mean
2010 A 63.719626
1010 B 32.891129
510 B 30.590323
210 B 21.661290

84
APPENDIX 12 – DIFFERENCES IN RESPONSE TIME (HIGH PRIORITY ALARMS)
***Levels not connected by same letter are significantly different
Level Least Sq Mean
2010 A 63.819053
510 B 41.107258
1010 B 37.180219
210 B 36.580645
110 B 27.451613
Level Least Sq Mean
1 A 47.163893
2 B 35.291622
Note
1-Chronological2-Categorical

85
APPENDIX 13 – DIFFERENCES IN RESPONSE TIME (ALL ALARMS)
***Levels not connected by same letter are significantly different
Level Least Sq Mean
2010 A 92.846672
510 B 35.192151
1010 B 31.749911
210 B 29.120968
110 B 27.451613

86
***Levels not connected by same letter are significantly different
Level Least Sq Mean
2010,1 A 111.83361
2010,2 B 73.85974
510,1 C 38.67097
1010,1 C 35.64821
210,1 C 31.77419
510,2 C 31.71333
110,1 C 30.41935
1010,2 C 27.85161
210,2 C 26.46774
110,2 C 24.48387
Note
1-Chronological2-Categorical

87
APPENDIX 14 – DIFFERENCES IN ACKNOWLEDGEMENT TIME (ALL ALARMS)
***Levels not connected by same letter are significantly different
Level Least Sq Mean
2010,1 A 115.12258
2010,2 B 63.29194
510,2 C 31.07333
210,1 C 28.24194
210,2 C 26.46774
510,1 C 25.49032
1010,1 C 25.22258
1010,2 C 22.50645
110,1 C 18.83871
110,2 C 9.76667
Note
1-Chronological
2-Categorical

88
APPENDIX 15 – DIFFERENCES IN ACKNOWLEDGEMENT TIME (LOW PRIORITY
ALARMS)
***Levels not connected by same letter are significantly different
Level Least Sq Mean
2010,1 A 191.29032
2010,2 B 116.43548
510,2 C 49.20000
510,1 C 27.32258
1010,1 C 17.51613
1010,2 C 16.87097
Note
1-Chronological
2-Categorical
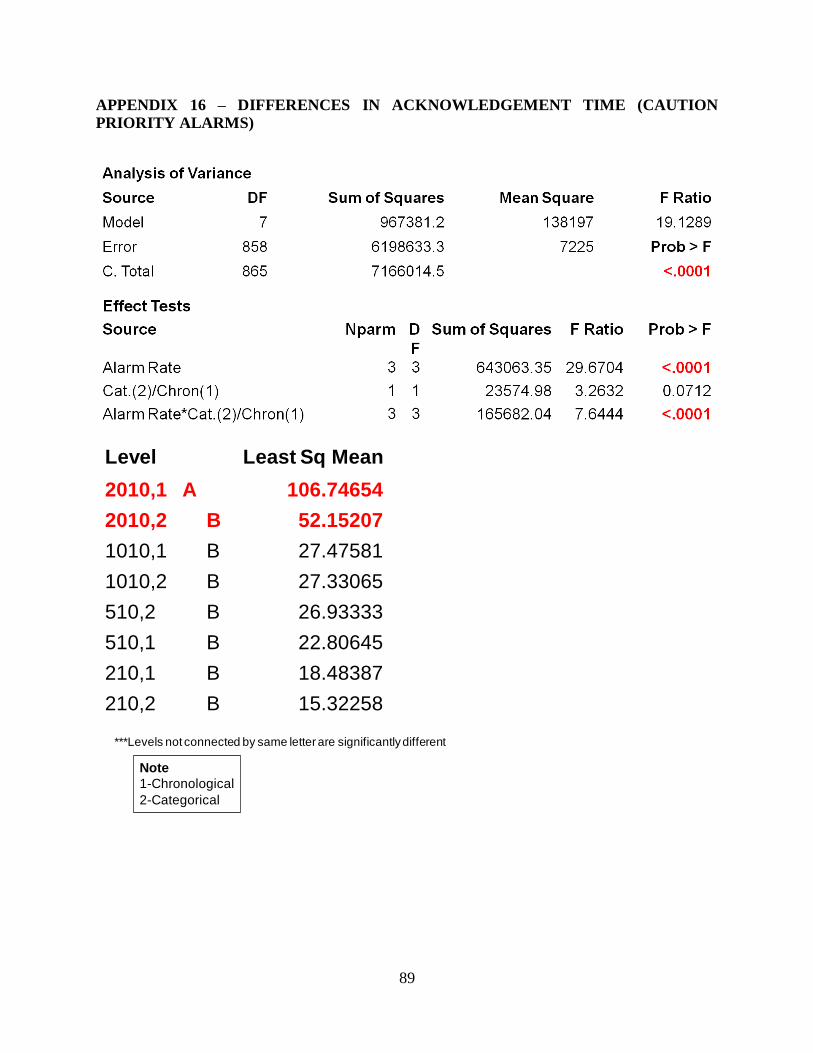
89
APPENDIX 16 – DIFFERENCES IN ACKNOWLEDGEMENT TIME (CAUTION
PRIORITY ALARMS)
***Levels not connected by same letter are significantly different
Level Least Sq Mean
2010,1 A 106.74654
2010,2 B 52.15207
1010,1 B 27.47581
1010,2 B 27.33065
510,2 B 26.93333
510,1 B 22.80645
210,1 B 18.48387
210,2 B 15.32258
Note
1-Chronological
2-Categorical

90
APPENDIX 17 – DIFFERENCES IN ACKNOWLEDGEMENT TIME (HIGH PRIORITY
ALARMS)
***Levels not connected by same letter are significantly different
Level Least Sq Mean
2010,1 A 58.211982
210,1 A B 38.000000
210,2 A B 37.612903
2010,2 B 28.880184
510,1 B 27.258065
1010,1 B 26.822581
510,2 B 26.150000
1010,2 B 20.500000
110,1 B 18.838710
110,2 B 9.766667
Note
1-Chronological
2-Categorical
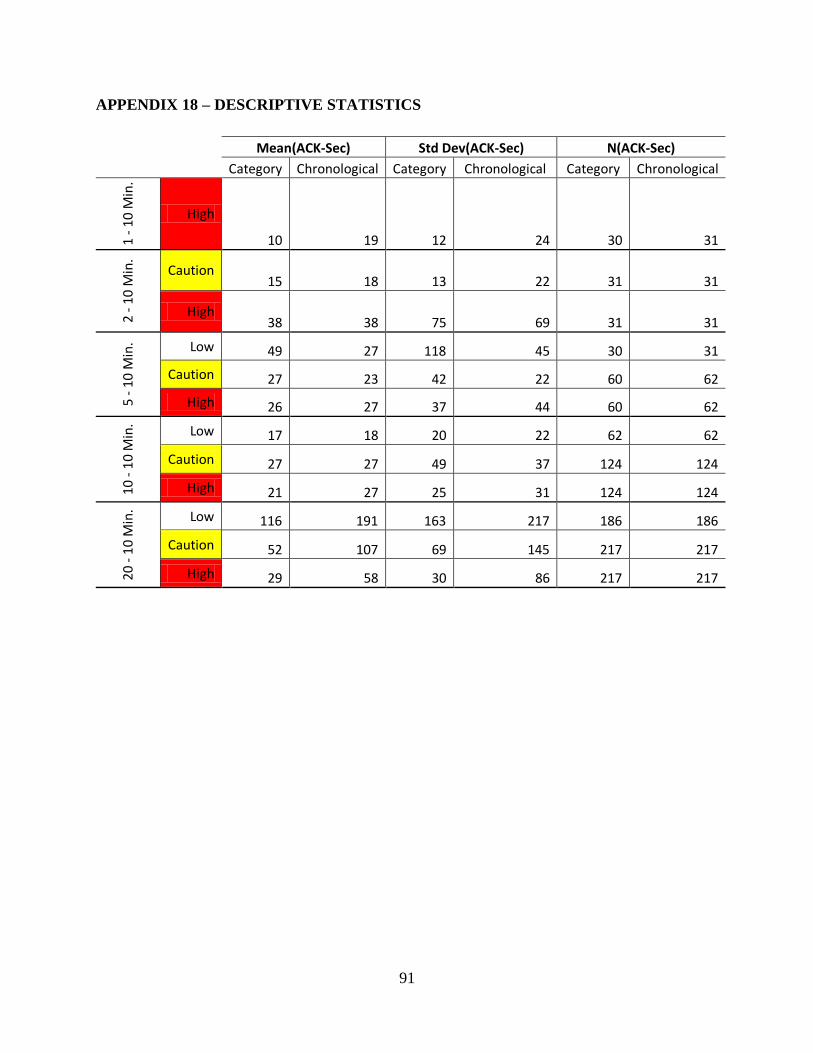
91
APPENDIX 18 – DESCRIPTIVE STATISTICS
Mean(ACK-Sec) Std Dev(ACK-Sec) N(ACK-Sec)
Category Chronological Category Chronological Category Chronological
1 -
10
Min
.
High
10 19 12 24 30 31
2 -
10
Min
.
Caution 15 18 13 22 31 31
High 38 38 75 69 31 31
5 -
10
Min
. Low 49 27 118 45 30 31
Caution 27 23 42 22 60 62
High 26 27 37 44 60 62
10 -
10
Min
.
Low 17 18 20 22 62 62
Caution 27 27 49 37 124 124
High 21 27 25 31 124 124
20 -
10
Min
.
Low 116 191 163 217 186 186
Caution 52 107 69 145 217 217
High 29 58 30 86 217 217

92
0
50
100
150
200
250
Hig
h
Cau
tio
n
Hig
h
Low
Cau
tio
n
Hig
h
Low
Cau
tio
n
Hig
h
Low
Cau
tio
n
Hig
h
1 -10
Min.
2 - 10 Min.
5 - 10 Min. 10 - 10 Min. 20 - 10 Min.
Mea
n A
ckn
ow
led
ge T
ime
(Sec
)
Mean(ACK-Sec) Category
Mean(ACK-Sec) Chronological
0
50
100
150
200
250
Hig
h
Cau
tio
n
Hig
h
Low
Cau
tio
n
Hig
h
Low
Cau
tio
n
Hig
h
Low
Cau
tio
n
Hig
h
1 -10
Min.
2 - 10 Min.
5 - 10 Min. 10 - 10 Min. 20 - 10 Min.
Stan
dar
d D
evia
tio
n (
AC
K-S
ec)
Std Dev(ACK-Sec) Category
Std Dev(ACK-Sec) Chronological

93
0
50
100
150
200
250
Hig
h
Cau
tio
n
Hig
h
Low
Cau
tio
n
Hig
h
Low
Cau
tio
n
Hig
h
Low
Cau
tio
n
Hig
h
1 -10
Min.
2 - 10 Min.
5 - 10 Min. 10 - 10 Min. 20 - 10 Min.
Nu
mb
er o
f D
ata
Po
ints
(N
)
N(ACK-Sec) Category
N(ACK-Sec) Chronological

94
Mean(RT-Sec) Std Dev(RT-Sec) N(RT-Sec)
Category Chronological Category Chronological Category Chronological
1 -
10
Min
.
High
24 30 15 14 31 31
2 -
10
Min
.
Caution 18 25 8 17 31 31
High 35 38 20 25 31 31
5 -
10
Min
. Low 29 36 45 88 30 31
Caution 27 34 23 38 60 62
High 38 45 26 34 60 62
10 -
10
Min
.
Low 19 18 25 10 62 62
Caution 28 38 25 60 124 124
High 32 42 20 48 124 121
20 -
10
Min
.
Low 131 192 173 226 178 182
Caution 53 75 63 111 214 214
High 47 80 61 119 214 211

95
0
50
100
150
200
250
Hig
h
Cau
tio
n
Hig
h
Low
Cau
tio
n
Hig
h
Low
Cau
tio
n
Hig
h
Low
Cau
tio
n
Hig
h
1 -10
Min.
2 - 10 Min.
5 - 10 Min. 10 - 10 Min. 20 - 10 Min.
Re
act
ion
Tim
e (
Seco
nd
s)
Mean(RT-Sec) Category
Mean(RT-Sec) Chronological
0
50
100
150
200
250
Hig
h
Cau
tio
n
Hig
h
Low
Cau
tio
n
Hig
h
Low
Cau
tio
n
Hig
h
Low
Cau
tio
n
Hig
h
1 -10
Min.
2 - 10 Min.
5 - 10 Min. 10 - 10 Min. 20 - 10 Min.
Stan
dar
d D
evia
tio
n (R
T-S
ec)
Std Dev(RT-Sec) Category
Std Dev(RT-Sec) Chronological

96
0
50
100
150
200
250
Hig
h
Cau
tio
n
Hig
h
Low
Cau
tio
n
Hig
h
Low
Cau
tio
n
Hig
h
Low
Cau
tio
n
Hig
h
1 -10
Min.
2 - 10 Min.
5 - 10 Min. 10 - 10 Min. 20 - 10 Min.
Nu
mb
er o
f D
ata
Po
ints
(N
)
N(RT-Sec) Category
N(RT-Sec) Chronological

97
VITA
Glen D. Uhack II was born in New Orleans, Louisiana in 1985. He received a bachelor’s degree in
business administration at the University of New Orleans, New Orleans in May 2007. He started his work
towards the degree of master’s in industrial engineering after graduating with his bachelor’s. He worked
as a research assistant during his time as a master’s student in the Department of Industrial Engineering.
Glen is a first degree black belt American Taekwondo Foundation, student member of
Instrumentation, Systems, and Automation Society (ISA), and automotive technician by trade. The degree
of Master of Science in Industrial Engineering will be conferred at the May 2010 commencement.