empirical software engineering empirical software...
TRANSCRIPT
Empirical Software Engineering with Examples
Dr. Cristina Marinescu
Empirical Software Engineering
a sub-domain of software engineering focusing on experiments on software systems
devise experiments on software, in collecting data from these experiments, and elaborate laws and theories from this data (wikipedia)
2
Dr. Cristina Marinescu
Software Quality
?
Defects (Bugs)
3 Dr. Cristina Marinescu
Classification
4
Observed Defects
TRUE FALSE
Predicted Defects
TRUE TP FP
FALSE FN TN
precision = TP/(TP + FP)
recall = TP/(TP + FN)
Dr. Cristina Marinescu
Some tests...
arithmetic mean
mean(2, 3, 4) = 3
mean(0, 3, 6) = 3
standard deviation
5 Dr. Cristina Marinescu
Rhttp://www.r-project.org/
6
Dr. Cristina Marinescu
T. Zimmermann, R. Premraj, and A. Zeller
Predicting defects for Eclipse
Third International Workshop on Predictor Models in Software Engineering (PROMISE)
IEEE Computer Society, 2007
7 Dr. Cristina Marinescu
Predicting Defects for Eclipse
8
ReleaseNumber of
Files Packages
2 6729 377
2,1 7888 434
3 10593 661
Dr. Cristina Marinescu
Used Metrics...
9
methods
FOUTMLOCNBDPARVG
Number of method calls (FAN OUT)Method Lines of CodeNested block depthNumber of parametersMcCabe Cyclomatic Complexity
classesNOFNOMNSFNSM
Number of fieldsNumber of methodsNumber of static fieldsNumber of static methods
filesACDNOINOTTLOC
Number of anonymous type declarationsNumber of interfacesNumber of classesTotal lines of code
packages NOCU Number of files
Dr. Cristina Marinescu
Spearman correlations
10
FOUTMLOCNBDPARVG
0.4000.4030.3920.3500.389
0.3190.3220.3200.2830.315
0.5370.5450.3920.5540.546
0.5230.5440.3200.5260.538
NOFNOMNSFNSM
0.2600.3190.1860.202
0.2040.2680.1700.179
0.5070.5020.4590.448
0.4800.4910.4140.371
ACDNOINOTTLOC
0.2580.160(-)0.1600.421
0.1800.129(-)0.1290.333
0.4420.1290.5180.581
0.4140.1100.4700.559
NOCU - - 0,514 0,461
Dr. Cristina Marinescu
Classification of files
11
Release Testing Precision Recall
22.02.13.0
0.6920.4780.613
0.2650.1910.171
2,12.02.13.0
0.6640.6680.717
0.2030.1600.139
32.02.13.0
0.5780.5280.675
0.2770.2200.224
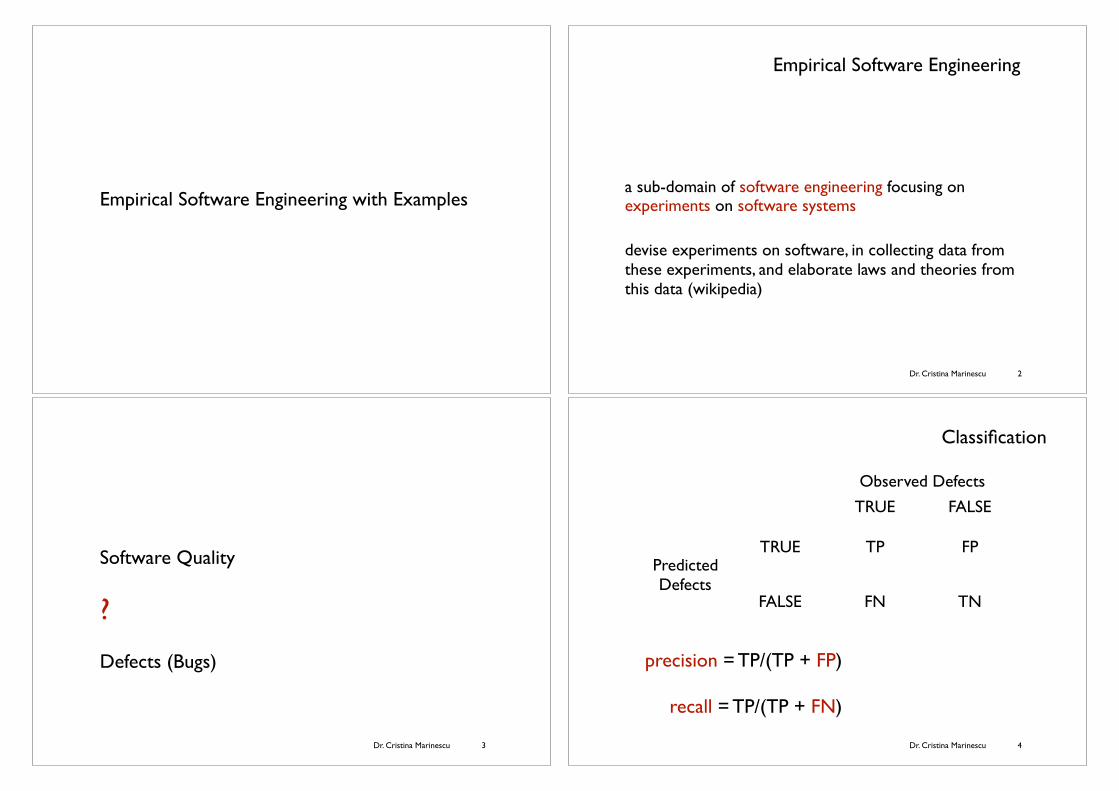
Are the Classes that use Exceptions Defect Prone?
Author: Cristina Marinescu
12th International Workshop on Principles on Software Evolution7th ERCIM Workshop on Software Evolution
2011

Exceptions
highlight exceptional
Should WE CARE MORE about?
Exceptions &
Defects
Does any correlation exist in
Eclipse ?
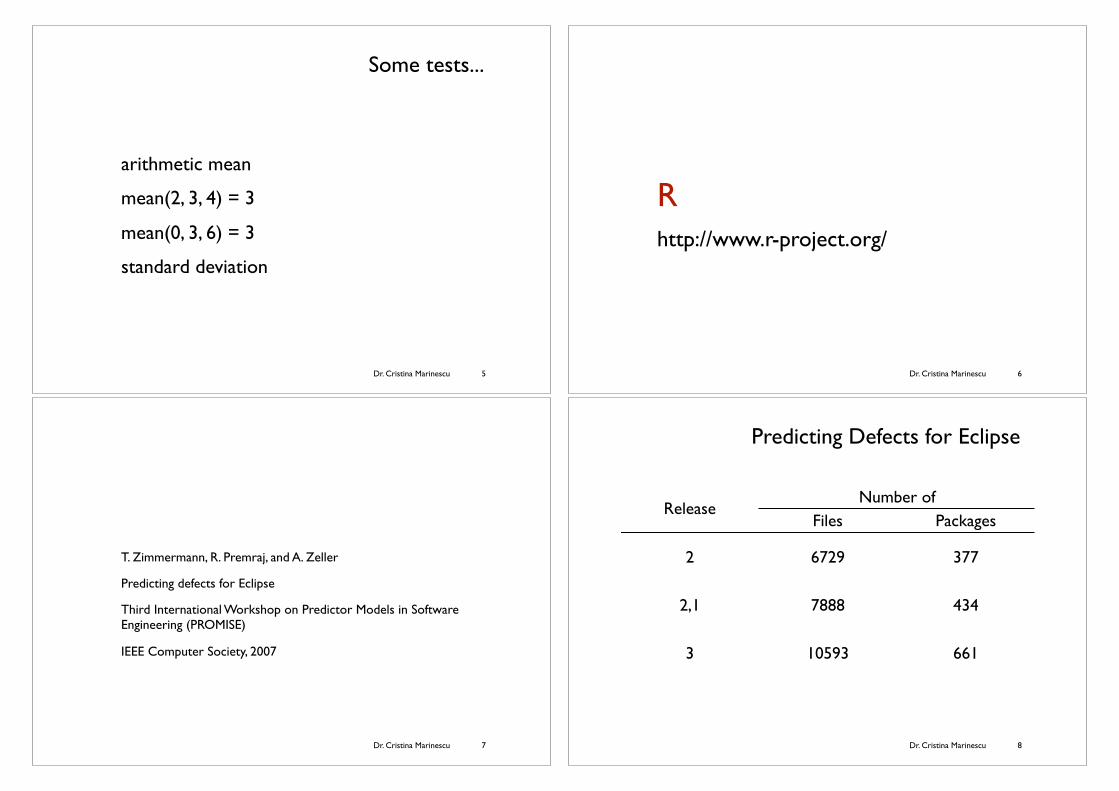
Class
Location, Name, Type
Class
Location, Name, Type
Throws, Catches
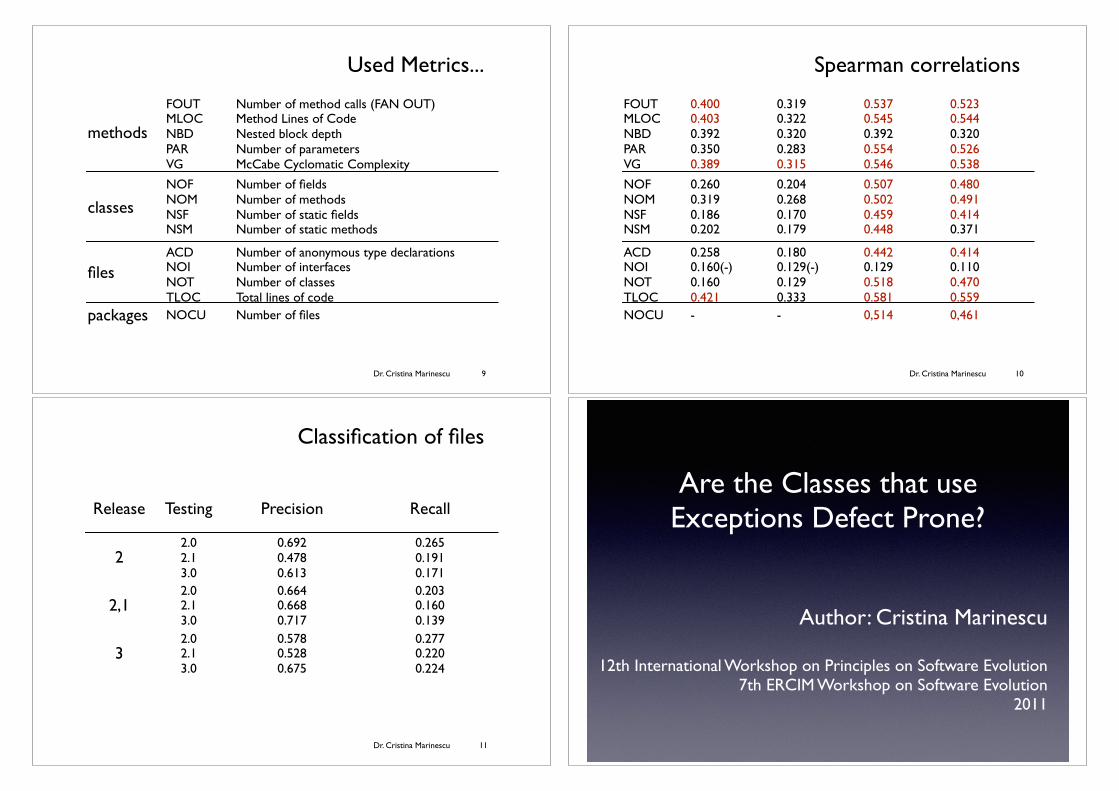
Class
Location, Name, Type
Throws, Catches
Defects (Pre&Post Release)
Class
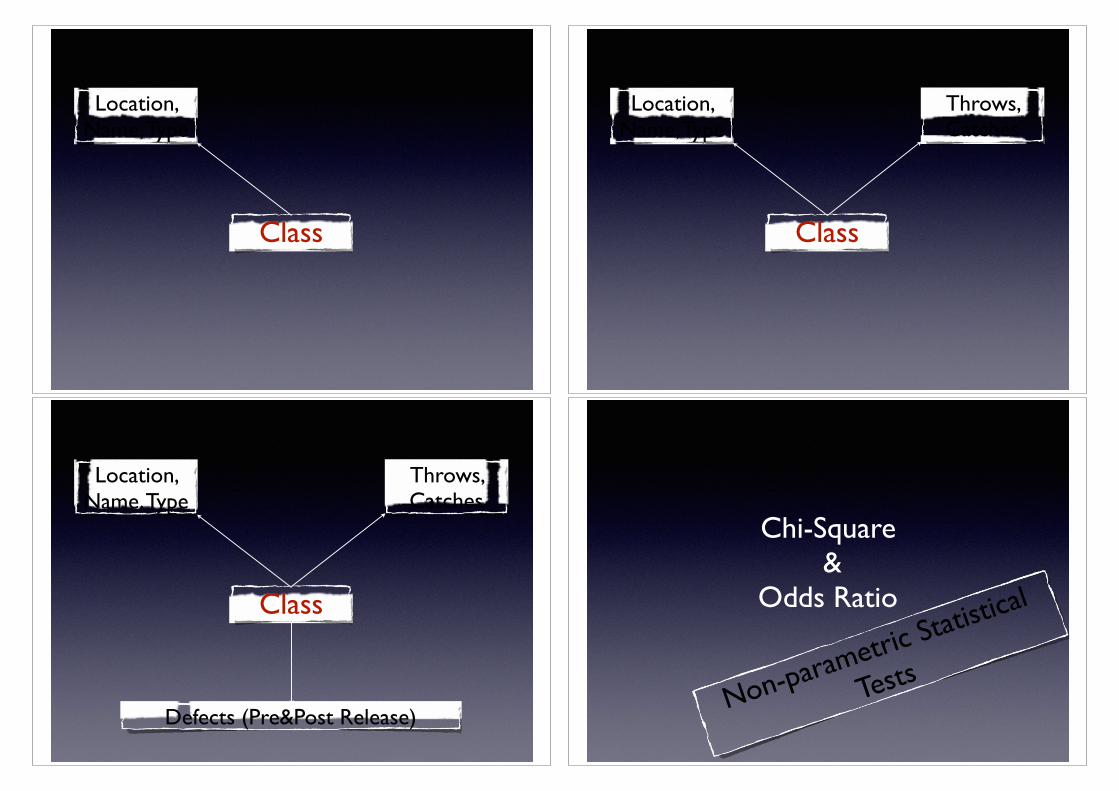
Chi-Square &
Odds Ratio
Non-parametric S
tatistical
Tests

No Exceptions
The Structure of the
Contingency Tables.
DefectsNo
Defects
No Exceptions
The Structure of the
Contingency Tables.
DefectsNo
Defects
No Exceptions
ExceptionsThe Structure of the
Contingency Tables.
p-value ? 0.05

p-value < 0.05
Correlation exists !
DefectsNo
Defects
No Exceptions < >
Exceptions > <
DefectsNo
Defects
No Exceptions < >
Exceptions > <
How Much ? Eclipse
2 2,1 3
Pre-ReleaseDefects 2,4 2,03 1,98
Post-ReleaseDefects 2,98 2,45 1,69

? Correlation exists !
Improper Usages of Exceptions &
Defects
Does any correlation exist ?
Improper Usages =
Exceptions handled by Superclasses
DefectsNo
Defects
No ImproperUsages
ImproperUsages
The Structure of the NEW
Contingency Tables.
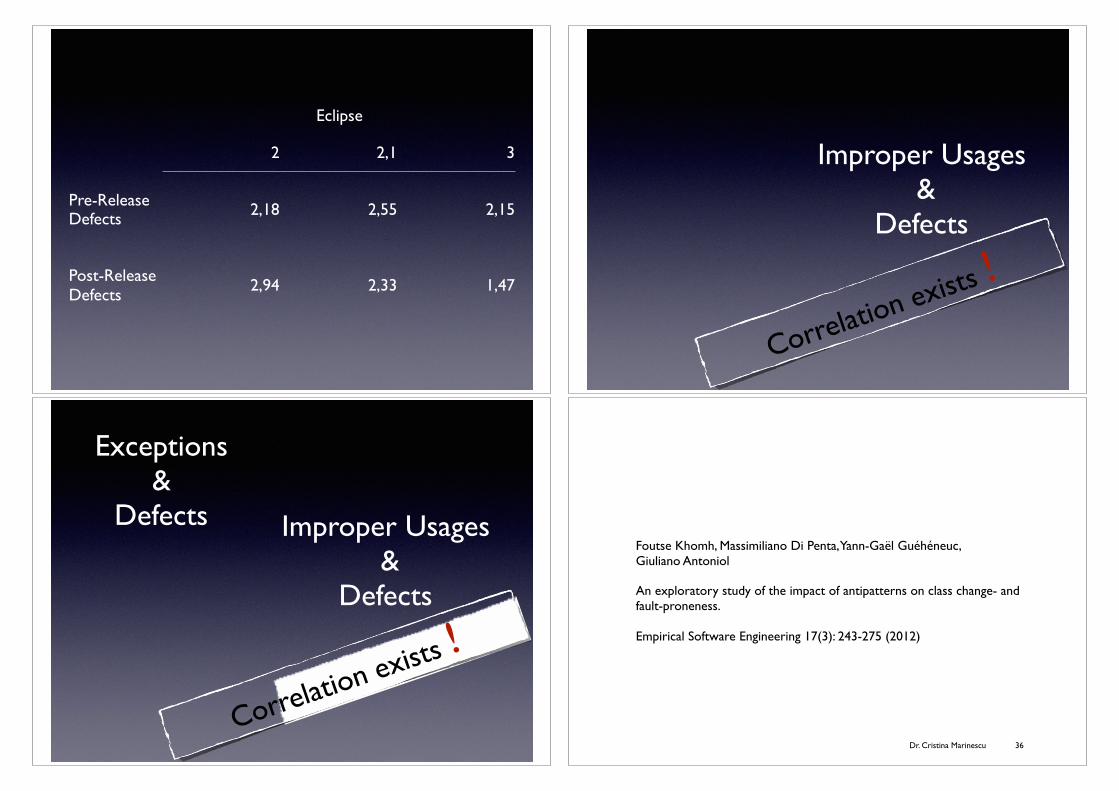
Eclipse
2 2,1 3
Pre-ReleaseDefects 2,18 2,55 2,15
Post-ReleaseDefects 2,94 2,33 1,47
Correlation exists !
Improper Usages &
Defects
Correlation exists !
Improper Usages &
Defects
Exceptions&
Defects
Dr. Cristina Marinescu
Foutse Khomh, Massimiliano Di Penta, Yann-Gaël Guéhéneuc, Giuliano Antoniol
An exploratory study of the impact of antipatterns on class change- and fault-proneness.
Empirical Software Engineering 17(3): 243-275 (2012)
36

Dr. Cristina Marinescu 37
Empir Software Eng
classification for Mylyn is only available for the first three releases (Eaddy et al.2008).)
We do not include release 2.1 of Eclipse in our study because we observed thatthe number of committed changes and fixed faults between release 2.1 and 2.1.1is about one order of magnitude smaller than those numbers between any othertwo subsequent releases. Also, the number of classes did not substantially changebetween 2.0, 2.1, and 2.1.1. Finally, the period of time between 2.1 and 2.1.1 is alsoshorter (three months) than those between other pairs of releases. Thus, we preferredto consider the period between releases 2.0 and 2.1.1 as one “release” for consistency.
For the four systems, it is relevant to study the relation between antipatterns,change- and fault-proneness, and class sizes, because the percentages of classesparticipating in antipatterns are not negligible. Figure 1 shows that these percentagesvary across releases in the four systems and that it is always higher than 45%, withpeaks as high as 80%. We further report that classes participating in antipatternsparticipate, in average, to two antipatterns in ArgoUML, three in Eclipse, two inMylyn, and two in Rhino and to, in maximum, between seven and nine antipatternsin ArgoUML, 13 and 24 antipatterns in Eclipse, six and seven antipatterns in Mylyn,and five and seven antipatterns in Rhino. (Detailed data is available elsewhere(Khomh et al. 2009a).)
Table 2 shows the distribution of the antipatterns of interest, detailed inSection 2.2. A cell in the table reports on the left side of the dash (respectively, onits right), the number of classes in the first release of a given system (respectively,its last), which participates in a given antipattern, followed by their percentages withrespect to the total numbers of classes. For example, the cell at the intersection ofthe ArgoUML column and the AntiSingleton row reports that in its first release,352 classes were AntiSingleton, representing 44.44% of the total number of itsclasses, while in the last release, only three classes were AntiSingleton, representing
40
50
60
70
80
90
1 2 3 4 5 6 7 8 9 10 11 12 13 14 15 16 17 18Releases
% o
f cla
sses
par
ticip
atin
g in
antip
atte
rns
ArgoUML Eclipse Mylyn Rhino
Fig. 1 Percentages of classes participating in antipatterns in the releases of the four systems
Dr. Cristina Marinescu
List of AntiPatterns...
38
AntiSingleton
Blob
ClassDataShouldBePrivate
ComplexClass
LargeClass
LazyClass
LongMethod
LongParameterList
MessageChain
RefusedParentBequest
SpaghettiCode
SpeculativeGenerality
SwissArmyKnife
Dr. Cristina Marinescu
Research Questions...
What is the relation between
anti-patterns and
change- & defect- proneness?
39 Dr. Cristina Marinescu
Research Questions...
What is the relation between
kinds of anti-patterns and
change- & defect- proneness?
40

Dr. Cristina Marinescu
Research Questions...
Does the presence of anti-patterns in classes
relate to the size of these classes?
41 Dr. Cristina Marinescu
Research Questions...
What kind of changes are performed on classes
participating or not in anti-patterns?
42
Dr. Cristina Marinescu 43
Empir Software Eng
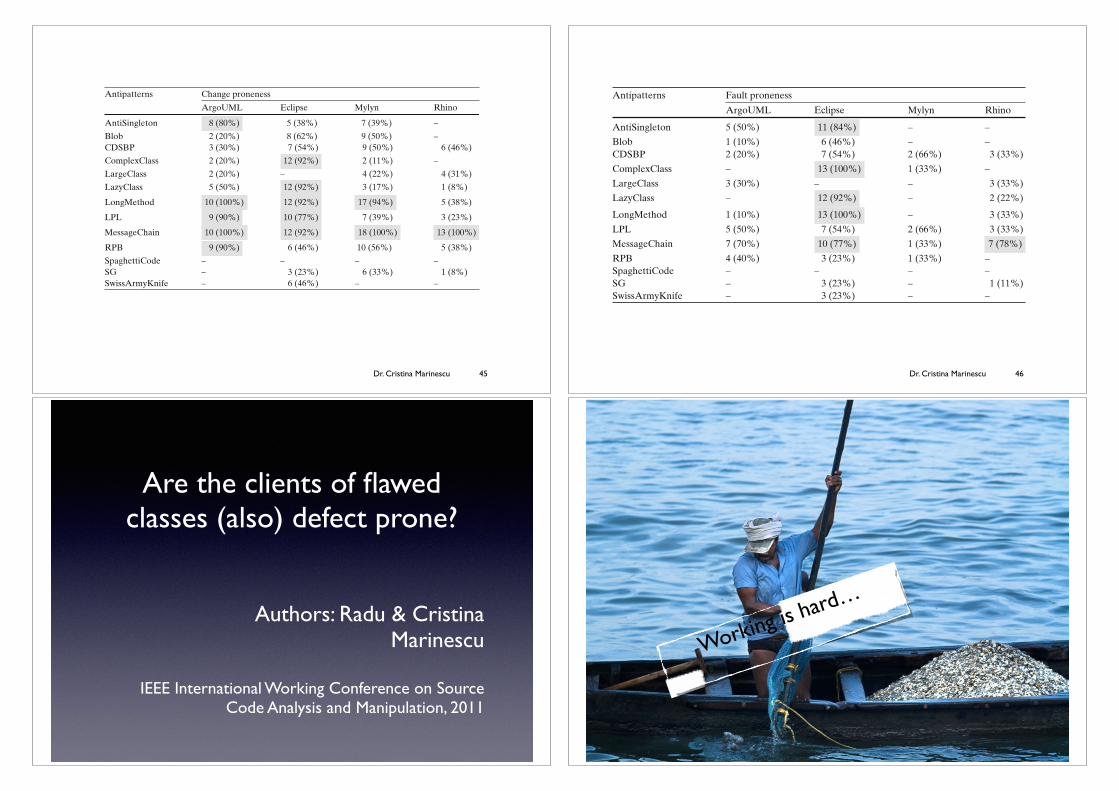
Table 3 Change-proneness ORs. Releases where Fisher’s exact test did not show significantdifferences are highlighted in gray; ORs < 1 are also highlighted in gray
RQ6 We again use Fisher’s exact test to compare the proportions of structuralchanges in classes participating in antipatterns with those of non-structural changes,also in classes not participating in any antipattern.
3 Study Results
This section reports the results of our empirical study, which are further discussed inSection 4. Detailed results can be found in a technical report (Khomh et al. 2009a)while raw data is available on-line.4
3.1 RQ1: What is the Relation between Antipatterns and Change-proneness?
Table 3 summarises the odds ratios when testing H01. Each row shows, for eachsystem, a release number and the ORs of classes participating in at least oneantipattern in that release to exhibit at least one change before the next release.In all releases, except Eclipse 1.0, Fisher’s exact test indicates a significant differenceof proportions between change-prone classes among those participating and not inantipatterns.
4http://www.ptidej.net/downloads/experiments/emse10
Dr. Cristina Marinescu 44
Empir Software Eng
more than 75% of the releases. Other antipatterns have significant impact on a subsetof the systems: LongMethod in ArgoUML, Eclipse, and Mylyn; LongParameterListin ArgoUML and Eclipse; AntiSingleton and RefusedParentBequest in ArgoUML;Complexclass and LazyClass in Eclipse.
We conclude that there is a relation between kinds of antipatterns and change-proneness but not for all antipatterns and not consistently across systems andreleases.
3.3 RQ3: What is the Relation between Antipatterns and Fault-proneness?
Table 5 summarises Fisher’s exact test results and ORs for H03. Similarly toTable 3, each row shows, for each system, a release number and the ORs of classesparticipating to at least one antipattern in that release to exhibit at least one fault-fixing change before the next release. The differences in proportions are significantand thus we can reject H03 in all cases. The proportion of classes participating inantipatterns and reported in faults is between 1.32 and 31.29 times larger than thatof other classes.
Odds ratios for faults are not always higher than those for changes: althoughclasses participating in antipatterns are more likely to exhibit fault-fixing changesthan other classes, they seem to be even more likely to undergo restructuring changesin addition to fault-fixing changes than other classes.
Therefore, we conclude that there is a relation between antipatterns and fault-proneness; although this relation is not as strong as the relation with change-proneness.
Table 5 Fault-proneness ORs. Releases where Fisher’s exact test did not show significant differencesare highlighted in gray
Dr. Cristina Marinescu 45
Empir Software Eng
Odds ratios vary across systems and, within each system, across releases. Whilein few cases, ORs are close to 1, i.e., the odds is even that a class participating in anantipattern changes or not, in some pairs of systems/releases, such as ArgoUML 0.20,Mylyn 2.0M3, or Rhino 1.5R41, ORs are greater than 25. Overall, ORs for Eclipseare lower than those of other systems, by one or two orders of magnitude. The oddratios of classes participating in some antipatterns to change are, in most cases, higherthan that of other classes.
We therefore conclude that, in most cases, there is a relation between antipatternsand change-proneness: a greater proportion of classes participating in antipatternschange with respect to other classes. The rejection of H01 and the ORs provide aposteriori concrete evidence of the impact of antipatterns on change-proneness.
3.2 RQ2: What is the Relation between Kinds of Antipatternsand Change-proneness?
Table 4 summarises the results of the logistic regression for the relations betweenchange-proneness and the different kinds of antipatterns. A cell in the table re-ports the number (and percentage) of releases, for a given system, in which theparticipation of classes in a given antipattern significantly correlate with change-proneness. For example, the cell at the intersection of the ArgoUML column andthe AntiSingleton row indicates that, in eight releases of ArgoUML out of ten (80%),classes participating in the AntiSingleton antipattern were significantly more change-prone than other classes.
From Table 4, we can reject H02 for some antipatterns, i.e., for antipatterns thatare significantly correlated to change-proneness in at least 75% of the releases, high-lighted in gray. Following our analysis method, only MessageChain has a significantimpact on change-proneness in all systems: classes participating in this antipatternare more likely to change than classes participating in other or no antipattern in
Table 4 Number (percentage) of releases where each antipattern significantly correlates withchange-proneness
Dr. Cristina Marinescu 46
Empir Software Eng
3.4 RQ4: What is the Relation between Particular Kinds of Antipatternsand Fault-proneness?
Table 6 reports the results of the logistic regression for the relations betweenfault-proneness and kinds of antipatterns. Similarly to Table 4, a cell in the tablereports the number (and percentage) of releases, for a given system, in which theparticipation of classes in a given antipattern significantly correlates with fault-proneness. For Mylyn, we could analyse only three releases for fault-proneness andfor Rhino, only nine releases, because of the limited number of faults occurring insome releases (<10). We can reject H04 for MessageChain in Eclipse and Rhino;AntiSingleton, ComplexClass, LazyClass and LongMethod in Eclipse.
We conclude that there is a relation between kinds of antipatterns and fault-proneness but not for all antipatterns and not consistently across systems andreleases.
3.5 RQ5: Do the Presence of Antipatterns in Classes Relate to the Sizesof These Classes?
We found that, as expected, classes participating in some specific kinds of antipat-terns are significantly larger than classes not participating in antipatterns (with amedium to large effect size). (Detailed results are reported in the technical report(Khomh et al. 2009a).) Yet, we observe the following exceptions:
– Classes participating in AntiSingleton are not significantly larger than classes notparticipating in any antipattern in ten out of 18 Mylyn releases;
– Classes participating in LazyClass are significantly smaller than other classes inall the analysed releases of ArgoUML, Mylyn, and Rhino. This observation wasexpected because, by definition, LazyClasses are small;
Table 6 Number (percentage) of releases where each antipattern significantly correlates with fault-proneness
Are the clients of flawed classes (also) defect prone?
Authors: Radu & Cristina Marinescu
IEEE International Working Conference on Source Code Analysis and Manipulation, 2011
Working is hard…

...especially when resources
are flawed
Clients of Flawed Classes vs.
Defects
Does any correlation exist in
Eclipse ?
Class Dat
a Class
Feature Envy God Class Bra
in Class
has defects (pre and post release)
Class
hasdesign flaws
has provider classeswith design flaws
?

Chi-Square Odds Ratio
Mann-Whitney
Non-parametric statistical testsflawed providers correlates with defects!
flaws / flawed providers vs.
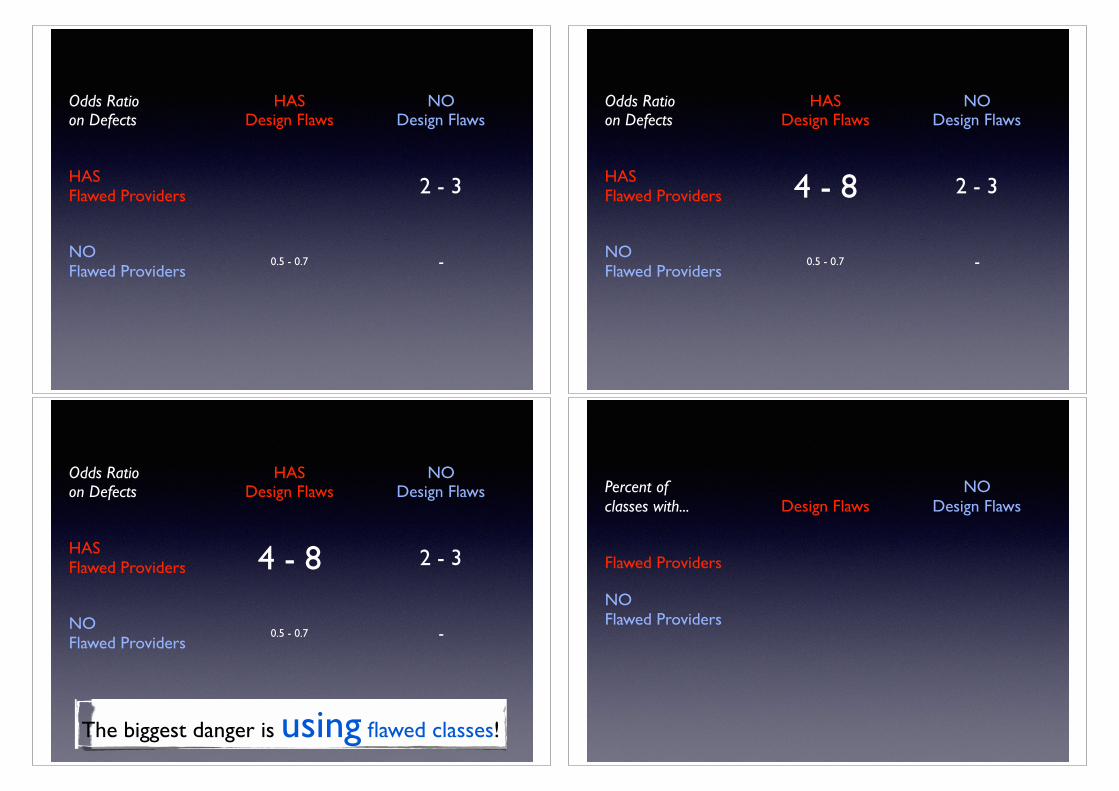
defects
Odds Ratio on Defects
HASDesign Flaws
NO Design Flaws
HAS Flawed Providers
NOFlawed Providers -
Odds Ratio on Defects
HASDesign Flaws
NO Design Flaws
HAS Flawed Providers
NOFlawed Providers
0.5 - 0.7 -
Odds Ratio on Defects
HASDesign Flaws
NO Design Flaws
HAS Flawed Providers 2 - 3
NOFlawed Providers
0.5 - 0.7 -
Odds Ratio on Defects
HASDesign Flaws
NO Design Flaws
HAS Flawed Providers 4 - 8 2 - 3
NOFlawed Providers
0.5 - 0.7 -
Odds Ratio on Defects
HASDesign Flaws
NO Design Flaws
HAS Flawed Providers 4 - 8 2 - 3
NOFlawed Providers
0.5 - 0.7 -
The biggest danger is using flawed classes!
Percent of classes with... Design Flaws
NO Design Flaws
Flawed Providers
NOFlawed Providers

Percent of classes with... Design Flaws
NO Design Flaws
Flawed Providers12
NOFlawed Providers
7
Percent of classes with... Design Flaws
NO Design Flaws
Flawed Providers12 42
NOFlawed Providers
7 40
Dr. Cristina Marinescu
Ralph Peters, Andy Zaidman
Evaluating the Lifespan of Code Smells using Software Repository Mining.
European Conference on Software Maintenance and Reengineering, 2012
63 Dr. Cristina Marinescu
Engineers are aware of code smells, but are not very concerned with their impact, given the low refactoring activity.
64

Dr. Cristina Marinescu
Research Questions (RQ)
RQ1
Are some types of code smells refactored more and quicker than other smell types?
65 Dr. Cristina Marinescu
Research Questions (RQ1)
66
GodClass
FeatureEnvy
DataClass
Message Chain
Long Parameter
List
Avg 49,2 % 40,39 % 55,69 % 47,04 % 49,41 %
Sd 12,1 % 18,08 % 20,79 % 18,76 % 12,81 %
Dr. Cristina Marinescu
Research Questions (RQ)
RQ2
Are relatively more code smells being refactored at an early or later stage of a system’s life cycle?
67 Dr. Cristina Marinescu
Research Questions (RQ)
RQ3
Do some developers refactor more code smells than others and to what extend?
68
Dr. Cristina Marinescu
Research Questions (RQ)
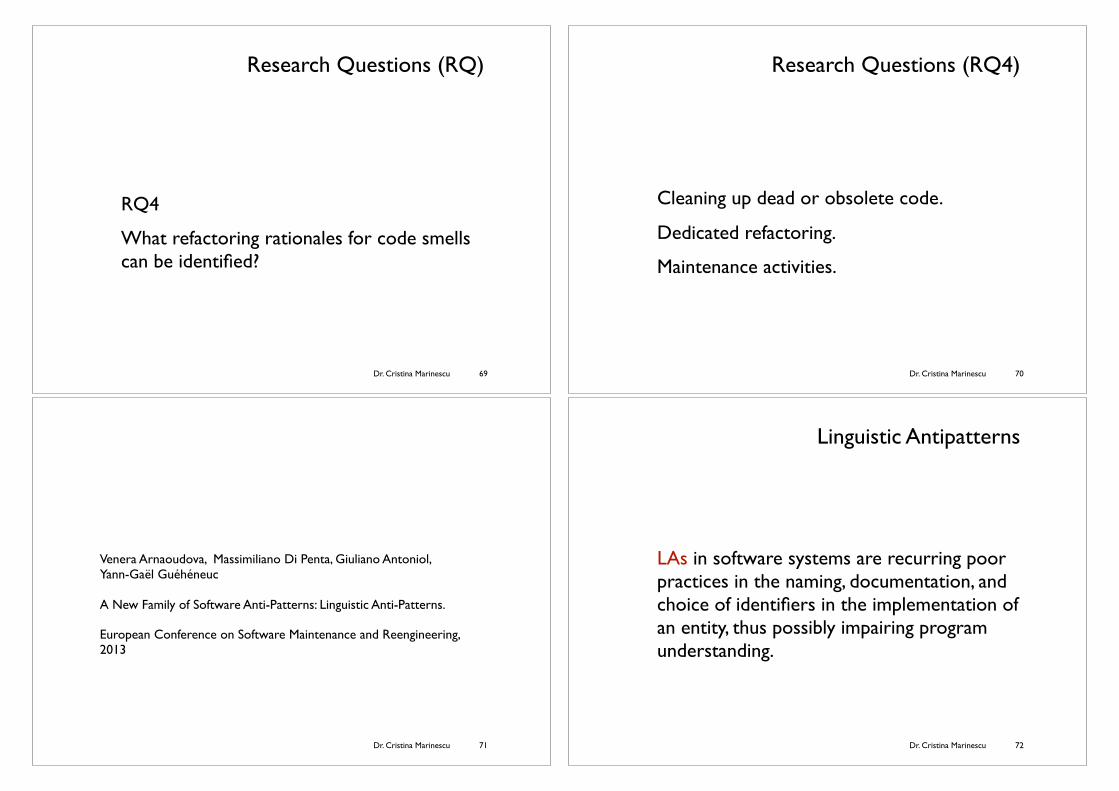
RQ4
What refactoring rationales for code smells can be identified?
69 Dr. Cristina Marinescu
Research Questions (RQ4)
Cleaning up dead or obsolete code.
Dedicated refactoring.
Maintenance activities.
70
Dr. Cristina Marinescu
Venera Arnaoudova, Massimiliano Di Penta, Giuliano Antoniol, Yann-Gaël Guéhéneuc
A New Family of Software Anti-Patterns: Linguistic Anti-Patterns.
European Conference on Software Maintenance and Reengineering, 2013
71 Dr. Cristina Marinescu
Linguistic Antipatterns
LAs in software systems are recurring poor practices in the naming, documentation, and choice of identifiers in the implementation of an entity, thus possibly impairing program understanding.
72
Dr. Cristina Marinescu
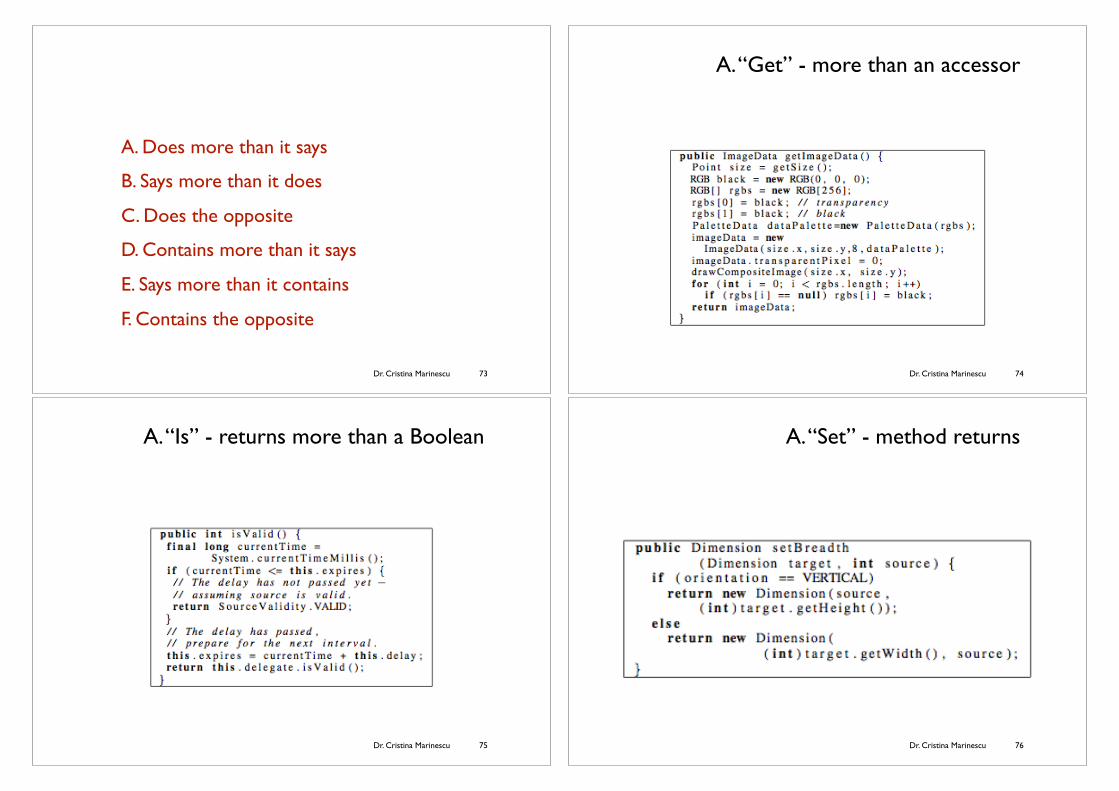
A. Does more than it says
B. Says more than it does
C. Does the opposite
D. Contains more than it says
E. Says more than it contains
F. Contains the opposite
73 Dr. Cristina Marinescu
A. “Get” - more than an accessor
74
Dr. Cristina Marinescu
A. “Is” - returns more than a Boolean
75 Dr. Cristina Marinescu
A. “Set” - method returns
76

Dr. Cristina Marinescu
A. Expecting but not getting a single instance
77 Dr. Cristina Marinescu
B. Not implemented condition
78
Dr. Cristina Marinescu
B. Validation method does not confirm
79 Dr. Cristina Marinescu
B. “Get” method does not return
80
Dr. Cristina Marinescu
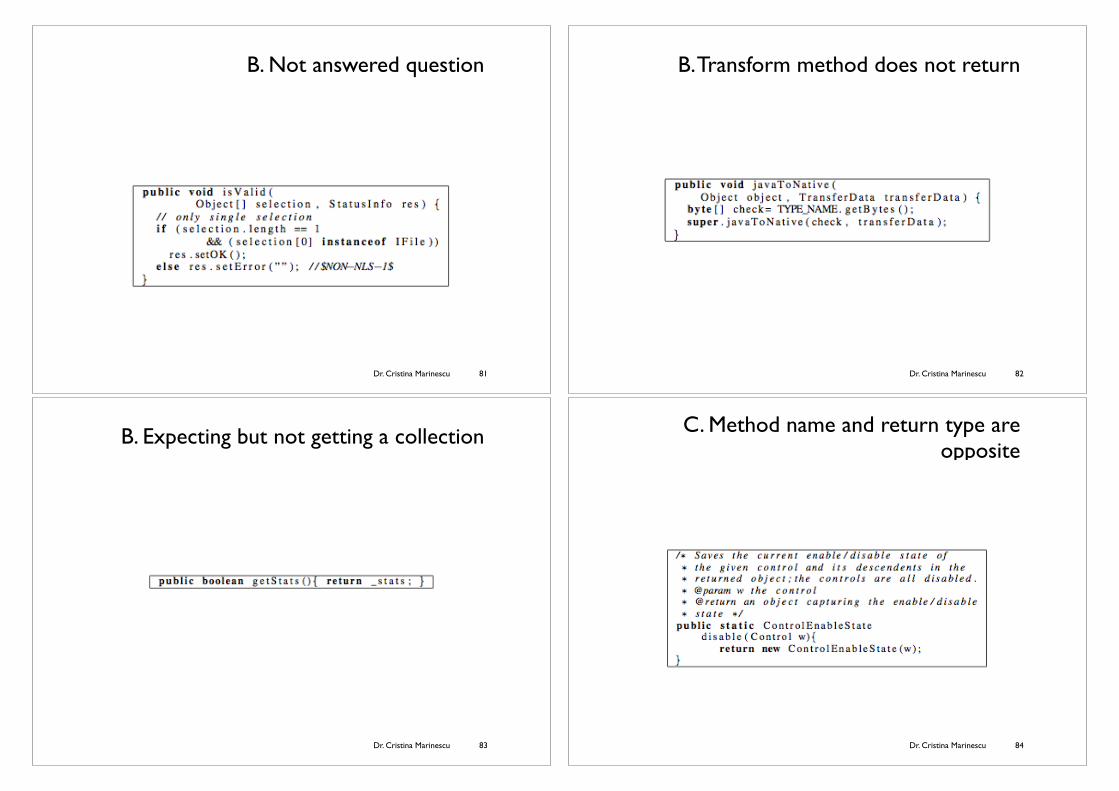
B. Not answered question
81 Dr. Cristina Marinescu
B. Transform method does not return
82
Dr. Cristina Marinescu
B. Expecting but not getting a collection
83 Dr. Cristina Marinescu
C. Method name and return type are opposite
84

Dr. Cristina Marinescu
C. Method signature and comment are opposite
85 Dr. Cristina Marinescu
D. Contains more than it says
1. Says one but contains many
Vector _target;
2. Name suggests Boolean but type does not
int[] isReached;
86
Dr. Cristina Marinescu
E. Says more than it contains
private static boolean _stats = true;
87 Dr. Cristina Marinescu
F. Contains the opposite
1. Attribute name and type are opposite
MAssociationEnd start = null;
2. Attribute signature and comment are opposite
88

Dr. Cristina Marinescu 89 Dr. Cristina Marinescu
Nachiappan Nagappan, Brendan Murphy, Victor R. Basili
The influence of organizational structure on software quality: an empirical case study.
International Conference of Software Engineering, 2008
90
Dr. Cristina Marinescu
Conway’s Law
91 Dr. Cristina Marinescu
Conway’s Laworganizations that design systems are constrained to produce systems which are copies of the communication structure of these organizations.
92
Dr. Cristina Marinescu 93
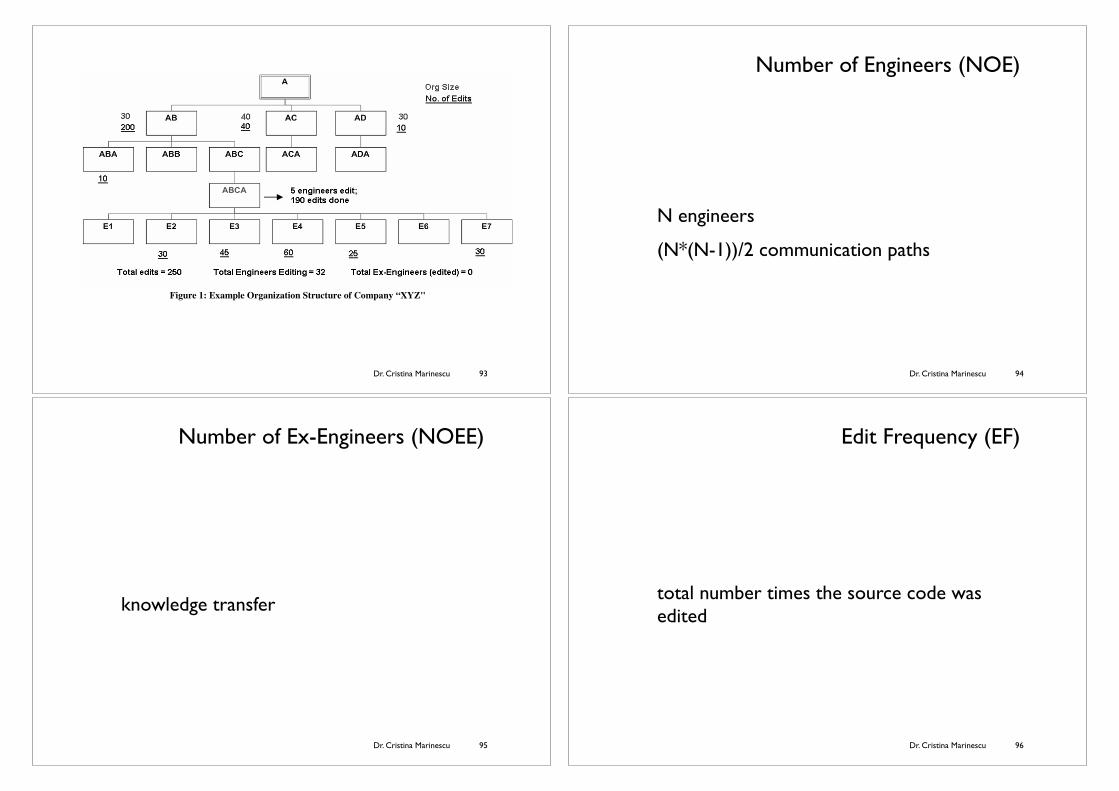
Figure 1: Example Organization Structure of Company “XYZ"
2. Number of Ex-Engineers (NOEE): This is the total number of unique engineers who have touched a binary and have left the company as of the release date of the software system (in our case A.dll). Implications: This measure deals with knowledge transfer. If the employee(s) who worked on a piece of code leaves the company then there is a likelihood that the new person taking over might not be familiar with the design rationale, the reasoning behind certain bug fixes, and information about other stake holders in the code. Example: This measure too is a straight forward value extracted from the VCS and checking against the org structure. In this example there were zero ex-engineers.
3. Edit Frequency (EF): This is the total number times the source code, that makes up the binary, was edited. An edit is when an engineer checks code out of the VCS, alters it and checks it back in again. This is independent of the number of lines of code altered during the edit. Implications: This measure serves two purposes. One being that, if a binary had too many edits it could be an indicator of the lack of stability/control in the code from the different perspectives of reliability, performance etc. , this is even if a small number of engineers where making the majority of the edits. Secondly, it provides a more complete view of the distribution of the edits: did a single engineer make majority of the edits, or were they widely distributed amongst the engineers?. The EF cross balances with NOE and NOEE to make sure that a few engineers making all the edits do not inflate our measurements and ultimately affect our predict model. Also if the engineers who made most of the edits have left the company (NOEE) then it can lead to the above discussed issues of knowledge transfer. Example: In our example the edit frequency is 250 also extracted from the VCS.
4. Depth of Master Ownership (DMO): This metric determines the level of ownership of the binary depending on the number of edits done. The organization level of the person whose reporting engineers perform more than 75% of
the rolled up edits is deemed as the DMO. The DMO metric determines the binary owner based on activity on that binary. Our choice of 75% is based on prior historical information on Windows to quantify ownership. Implications: The deeper in the tree is the ownership the more focused the activities, communication, and responsibility. A deeper level of ownership indicates less diffusion of activities, a single point of approval/control which should improve intellectual control. If a binary does not have a clear owner (or has a very low DMO at which 75% of the edits toll up) then there could be issues regarding decision-making when performing a risky bug fix, lack of engineers to follow-up if there is an issue, understanding intersecting code dependencies etc. A management owner who has not made a large number of edits (i.e. not familiar with the code) may not be able to make the above decisions without affecting code quality. Example: In our above example more than 75% of the edits roll up to the engineer ABCA (190 edits out of a total of 250). Hence the DMO measure in this case is 2 (level 0 is AB, AC and AD; Level 1 is ABA to ADA. Person A being the top person is not involved in the technical day to day activities). The overall org owner for this org is AB.
5. Percentage of Org contributing to development (PO): The ratio of the number of people reporting at the DMO level owner relative to the Master owner org size. Implications: The lower the percentage the more local is the ownership and contributions to the binary leading to lower coordination/communication overhead across organizations and improved synchronization amongst individuals, better intellectual control and provide a single point of contact. This metric minimizes the impact of an unbalanced organization, whereby the DMO may be two levels deep but 90% of the total organization reports into that DMO. Example: In our example this ratio is (7/30)*100. Seven engineers report to ABCA and the org to which ABCA belongs to is of size 30.
6. Level of Organizational Code Ownership (OCO): The percent of edits from the organization that contains the binary
Dr. Cristina Marinescu
Number of Engineers (NOE)
N engineers
(N*(N-1))/2 communication paths
94
Dr. Cristina Marinescu
Number of Ex-Engineers (NOEE)
knowledge transfer
95 Dr. Cristina Marinescu
Edit Frequency (EF)
total number times the source code was edited
96

Dr. Cristina Marinescu
Depth of Master Ownership (DMO)
level of ownership (> 75%)
ABCA (190/250)
97
Figure 1: Example Organization Structure of Company “XYZ"
2. Number of Ex-Engineers (NOEE): This is the total number of unique engineers who have touched a binary and have left the company as of the release date of the software system (in our case A.dll). Implications: This measure deals with knowledge transfer. If the employee(s) who worked on a piece of code leaves the company then there is a likelihood that the new person taking over might not be familiar with the design rationale, the reasoning behind certain bug fixes, and information about other stake holders in the code. Example: This measure too is a straight forward value extracted from the VCS and checking against the org structure. In this example there were zero ex-engineers.
3. Edit Frequency (EF): This is the total number times the source code, that makes up the binary, was edited. An edit is when an engineer checks code out of the VCS, alters it and checks it back in again. This is independent of the number of lines of code altered during the edit. Implications: This measure serves two purposes. One being that, if a binary had too many edits it could be an indicator of the lack of stability/control in the code from the different perspectives of reliability, performance etc. , this is even if a small number of engineers where making the majority of the edits. Secondly, it provides a more complete view of the distribution of the edits: did a single engineer make majority of the edits, or were they widely distributed amongst the engineers?. The EF cross balances with NOE and NOEE to make sure that a few engineers making all the edits do not inflate our measurements and ultimately affect our predict model. Also if the engineers who made most of the edits have left the company (NOEE) then it can lead to the above discussed issues of knowledge transfer. Example: In our example the edit frequency is 250 also extracted from the VCS.
4. Depth of Master Ownership (DMO): This metric determines the level of ownership of the binary depending on the number of edits done. The organization level of the person whose reporting engineers perform more than 75% of
the rolled up edits is deemed as the DMO. The DMO metric determines the binary owner based on activity on that binary. Our choice of 75% is based on prior historical information on Windows to quantify ownership. Implications: The deeper in the tree is the ownership the more focused the activities, communication, and responsibility. A deeper level of ownership indicates less diffusion of activities, a single point of approval/control which should improve intellectual control. If a binary does not have a clear owner (or has a very low DMO at which 75% of the edits toll up) then there could be issues regarding decision-making when performing a risky bug fix, lack of engineers to follow-up if there is an issue, understanding intersecting code dependencies etc. A management owner who has not made a large number of edits (i.e. not familiar with the code) may not be able to make the above decisions without affecting code quality. Example: In our above example more than 75% of the edits roll up to the engineer ABCA (190 edits out of a total of 250). Hence the DMO measure in this case is 2 (level 0 is AB, AC and AD; Level 1 is ABA to ADA. Person A being the top person is not involved in the technical day to day activities). The overall org owner for this org is AB.
5. Percentage of Org contributing to development (PO): The ratio of the number of people reporting at the DMO level owner relative to the Master owner org size. Implications: The lower the percentage the more local is the ownership and contributions to the binary leading to lower coordination/communication overhead across organizations and improved synchronization amongst individuals, better intellectual control and provide a single point of contact. This metric minimizes the impact of an unbalanced organization, whereby the DMO may be two levels deep but 90% of the total organization reports into that DMO. Example: In our example this ratio is (7/30)*100. Seven engineers report to ABCA and the org to which ABCA belongs to is of size 30.
6. Level of Organizational Code Ownership (OCO): The percent of edits from the organization that contains the binary
Dr. Cristina Marinescu
Percentage of Org Contributing to development (PO)
ratio of the number of people reporting at the DMO level owner relative to the Master org size
7/3098
Figure 1: Example Organization Structure of Company “XYZ"
2. Number of Ex-Engineers (NOEE): This is the total number of unique engineers who have touched a binary and have left the company as of the release date of the software system (in our case A.dll). Implications: This measure deals with knowledge transfer. If the employee(s) who worked on a piece of code leaves the company then there is a likelihood that the new person taking over might not be familiar with the design rationale, the reasoning behind certain bug fixes, and information about other stake holders in the code. Example: This measure too is a straight forward value extracted from the VCS and checking against the org structure. In this example there were zero ex-engineers.
3. Edit Frequency (EF): This is the total number times the source code, that makes up the binary, was edited. An edit is when an engineer checks code out of the VCS, alters it and checks it back in again. This is independent of the number of lines of code altered during the edit. Implications: This measure serves two purposes. One being that, if a binary had too many edits it could be an indicator of the lack of stability/control in the code from the different perspectives of reliability, performance etc. , this is even if a small number of engineers where making the majority of the edits. Secondly, it provides a more complete view of the distribution of the edits: did a single engineer make majority of the edits, or were they widely distributed amongst the engineers?. The EF cross balances with NOE and NOEE to make sure that a few engineers making all the edits do not inflate our measurements and ultimately affect our predict model. Also if the engineers who made most of the edits have left the company (NOEE) then it can lead to the above discussed issues of knowledge transfer. Example: In our example the edit frequency is 250 also extracted from the VCS.
4. Depth of Master Ownership (DMO): This metric determines the level of ownership of the binary depending on the number of edits done. The organization level of the person whose reporting engineers perform more than 75% of
the rolled up edits is deemed as the DMO. The DMO metric determines the binary owner based on activity on that binary. Our choice of 75% is based on prior historical information on Windows to quantify ownership. Implications: The deeper in the tree is the ownership the more focused the activities, communication, and responsibility. A deeper level of ownership indicates less diffusion of activities, a single point of approval/control which should improve intellectual control. If a binary does not have a clear owner (or has a very low DMO at which 75% of the edits toll up) then there could be issues regarding decision-making when performing a risky bug fix, lack of engineers to follow-up if there is an issue, understanding intersecting code dependencies etc. A management owner who has not made a large number of edits (i.e. not familiar with the code) may not be able to make the above decisions without affecting code quality. Example: In our above example more than 75% of the edits roll up to the engineer ABCA (190 edits out of a total of 250). Hence the DMO measure in this case is 2 (level 0 is AB, AC and AD; Level 1 is ABA to ADA. Person A being the top person is not involved in the technical day to day activities). The overall org owner for this org is AB.
5. Percentage of Org contributing to development (PO): The ratio of the number of people reporting at the DMO level owner relative to the Master owner org size. Implications: The lower the percentage the more local is the ownership and contributions to the binary leading to lower coordination/communication overhead across organizations and improved synchronization amongst individuals, better intellectual control and provide a single point of contact. This metric minimizes the impact of an unbalanced organization, whereby the DMO may be two levels deep but 90% of the total organization reports into that DMO. Example: In our example this ratio is (7/30)*100. Seven engineers report to ABCA and the org to which ABCA belongs to is of size 30.
6. Level of Organizational Code Ownership (OCO): The percent of edits from the organization that contains the binary
Dr. Cristina Marinescu
Level of Organizational Code Ownership (OCO)
percents of edits from the org that contains the owner
200/25099
Figure 1: Example Organization Structure of Company “XYZ"
2. Number of Ex-Engineers (NOEE): This is the total number of unique engineers who have touched a binary and have left the company as of the release date of the software system (in our case A.dll). Implications: This measure deals with knowledge transfer. If the employee(s) who worked on a piece of code leaves the company then there is a likelihood that the new person taking over might not be familiar with the design rationale, the reasoning behind certain bug fixes, and information about other stake holders in the code. Example: This measure too is a straight forward value extracted from the VCS and checking against the org structure. In this example there were zero ex-engineers.
3. Edit Frequency (EF): This is the total number times the source code, that makes up the binary, was edited. An edit is when an engineer checks code out of the VCS, alters it and checks it back in again. This is independent of the number of lines of code altered during the edit. Implications: This measure serves two purposes. One being that, if a binary had too many edits it could be an indicator of the lack of stability/control in the code from the different perspectives of reliability, performance etc. , this is even if a small number of engineers where making the majority of the edits. Secondly, it provides a more complete view of the distribution of the edits: did a single engineer make majority of the edits, or were they widely distributed amongst the engineers?. The EF cross balances with NOE and NOEE to make sure that a few engineers making all the edits do not inflate our measurements and ultimately affect our predict model. Also if the engineers who made most of the edits have left the company (NOEE) then it can lead to the above discussed issues of knowledge transfer. Example: In our example the edit frequency is 250 also extracted from the VCS.
4. Depth of Master Ownership (DMO): This metric determines the level of ownership of the binary depending on the number of edits done. The organization level of the person whose reporting engineers perform more than 75% of
the rolled up edits is deemed as the DMO. The DMO metric determines the binary owner based on activity on that binary. Our choice of 75% is based on prior historical information on Windows to quantify ownership. Implications: The deeper in the tree is the ownership the more focused the activities, communication, and responsibility. A deeper level of ownership indicates less diffusion of activities, a single point of approval/control which should improve intellectual control. If a binary does not have a clear owner (or has a very low DMO at which 75% of the edits toll up) then there could be issues regarding decision-making when performing a risky bug fix, lack of engineers to follow-up if there is an issue, understanding intersecting code dependencies etc. A management owner who has not made a large number of edits (i.e. not familiar with the code) may not be able to make the above decisions without affecting code quality. Example: In our above example more than 75% of the edits roll up to the engineer ABCA (190 edits out of a total of 250). Hence the DMO measure in this case is 2 (level 0 is AB, AC and AD; Level 1 is ABA to ADA. Person A being the top person is not involved in the technical day to day activities). The overall org owner for this org is AB.
5. Percentage of Org contributing to development (PO): The ratio of the number of people reporting at the DMO level owner relative to the Master owner org size. Implications: The lower the percentage the more local is the ownership and contributions to the binary leading to lower coordination/communication overhead across organizations and improved synchronization amongst individuals, better intellectual control and provide a single point of contact. This metric minimizes the impact of an unbalanced organization, whereby the DMO may be two levels deep but 90% of the total organization reports into that DMO. Example: In our example this ratio is (7/30)*100. Seven engineers report to ABCA and the org to which ABCA belongs to is of size 30.
6. Level of Organizational Code Ownership (OCO): The percent of edits from the organization that contains the binary
Dr. Cristina Marinescu
Overall Organizational Ownership(OOW)
ratio of the percentage of people at the DMO level making edits relative to the total engineers editing
5/32 high value = better100
Figure 1: Example Organization Structure of Company “XYZ"
2. Number of Ex-Engineers (NOEE): This is the total number of unique engineers who have touched a binary and have left the company as of the release date of the software system (in our case A.dll). Implications: This measure deals with knowledge transfer. If the employee(s) who worked on a piece of code leaves the company then there is a likelihood that the new person taking over might not be familiar with the design rationale, the reasoning behind certain bug fixes, and information about other stake holders in the code. Example: This measure too is a straight forward value extracted from the VCS and checking against the org structure. In this example there were zero ex-engineers.
3. Edit Frequency (EF): This is the total number times the source code, that makes up the binary, was edited. An edit is when an engineer checks code out of the VCS, alters it and checks it back in again. This is independent of the number of lines of code altered during the edit. Implications: This measure serves two purposes. One being that, if a binary had too many edits it could be an indicator of the lack of stability/control in the code from the different perspectives of reliability, performance etc. , this is even if a small number of engineers where making the majority of the edits. Secondly, it provides a more complete view of the distribution of the edits: did a single engineer make majority of the edits, or were they widely distributed amongst the engineers?. The EF cross balances with NOE and NOEE to make sure that a few engineers making all the edits do not inflate our measurements and ultimately affect our predict model. Also if the engineers who made most of the edits have left the company (NOEE) then it can lead to the above discussed issues of knowledge transfer. Example: In our example the edit frequency is 250 also extracted from the VCS.
4. Depth of Master Ownership (DMO): This metric determines the level of ownership of the binary depending on the number of edits done. The organization level of the person whose reporting engineers perform more than 75% of
the rolled up edits is deemed as the DMO. The DMO metric determines the binary owner based on activity on that binary. Our choice of 75% is based on prior historical information on Windows to quantify ownership. Implications: The deeper in the tree is the ownership the more focused the activities, communication, and responsibility. A deeper level of ownership indicates less diffusion of activities, a single point of approval/control which should improve intellectual control. If a binary does not have a clear owner (or has a very low DMO at which 75% of the edits toll up) then there could be issues regarding decision-making when performing a risky bug fix, lack of engineers to follow-up if there is an issue, understanding intersecting code dependencies etc. A management owner who has not made a large number of edits (i.e. not familiar with the code) may not be able to make the above decisions without affecting code quality. Example: In our above example more than 75% of the edits roll up to the engineer ABCA (190 edits out of a total of 250). Hence the DMO measure in this case is 2 (level 0 is AB, AC and AD; Level 1 is ABA to ADA. Person A being the top person is not involved in the technical day to day activities). The overall org owner for this org is AB.
5. Percentage of Org contributing to development (PO): The ratio of the number of people reporting at the DMO level owner relative to the Master owner org size. Implications: The lower the percentage the more local is the ownership and contributions to the binary leading to lower coordination/communication overhead across organizations and improved synchronization amongst individuals, better intellectual control and provide a single point of contact. This metric minimizes the impact of an unbalanced organization, whereby the DMO may be two levels deep but 90% of the total organization reports into that DMO. Example: In our example this ratio is (7/30)*100. Seven engineers report to ABCA and the org to which ABCA belongs to is of size 30.
6. Level of Organizational Code Ownership (OCO): The percent of edits from the organization that contains the binary

Dr. Cristina Marinescu
Organizational Intersection Factor(OIF)
number of different org that that contribute greater than 10% of edits
lower value = better101
Figure 1: Example Organization Structure of Company “XYZ"
2. Number of Ex-Engineers (NOEE): This is the total number of unique engineers who have touched a binary and have left the company as of the release date of the software system (in our case A.dll). Implications: This measure deals with knowledge transfer. If the employee(s) who worked on a piece of code leaves the company then there is a likelihood that the new person taking over might not be familiar with the design rationale, the reasoning behind certain bug fixes, and information about other stake holders in the code. Example: This measure too is a straight forward value extracted from the VCS and checking against the org structure. In this example there were zero ex-engineers.
3. Edit Frequency (EF): This is the total number times the source code, that makes up the binary, was edited. An edit is when an engineer checks code out of the VCS, alters it and checks it back in again. This is independent of the number of lines of code altered during the edit. Implications: This measure serves two purposes. One being that, if a binary had too many edits it could be an indicator of the lack of stability/control in the code from the different perspectives of reliability, performance etc. , this is even if a small number of engineers where making the majority of the edits. Secondly, it provides a more complete view of the distribution of the edits: did a single engineer make majority of the edits, or were they widely distributed amongst the engineers?. The EF cross balances with NOE and NOEE to make sure that a few engineers making all the edits do not inflate our measurements and ultimately affect our predict model. Also if the engineers who made most of the edits have left the company (NOEE) then it can lead to the above discussed issues of knowledge transfer. Example: In our example the edit frequency is 250 also extracted from the VCS.
4. Depth of Master Ownership (DMO): This metric determines the level of ownership of the binary depending on the number of edits done. The organization level of the person whose reporting engineers perform more than 75% of
the rolled up edits is deemed as the DMO. The DMO metric determines the binary owner based on activity on that binary. Our choice of 75% is based on prior historical information on Windows to quantify ownership. Implications: The deeper in the tree is the ownership the more focused the activities, communication, and responsibility. A deeper level of ownership indicates less diffusion of activities, a single point of approval/control which should improve intellectual control. If a binary does not have a clear owner (or has a very low DMO at which 75% of the edits toll up) then there could be issues regarding decision-making when performing a risky bug fix, lack of engineers to follow-up if there is an issue, understanding intersecting code dependencies etc. A management owner who has not made a large number of edits (i.e. not familiar with the code) may not be able to make the above decisions without affecting code quality. Example: In our above example more than 75% of the edits roll up to the engineer ABCA (190 edits out of a total of 250). Hence the DMO measure in this case is 2 (level 0 is AB, AC and AD; Level 1 is ABA to ADA. Person A being the top person is not involved in the technical day to day activities). The overall org owner for this org is AB.
5. Percentage of Org contributing to development (PO): The ratio of the number of people reporting at the DMO level owner relative to the Master owner org size. Implications: The lower the percentage the more local is the ownership and contributions to the binary leading to lower coordination/communication overhead across organizations and improved synchronization amongst individuals, better intellectual control and provide a single point of contact. This metric minimizes the impact of an unbalanced organization, whereby the DMO may be two levels deep but 90% of the total organization reports into that DMO. Example: In our example this ratio is (7/30)*100. Seven engineers report to ABCA and the org to which ABCA belongs to is of size 30.
6. Level of Organizational Code Ownership (OCO): The percent of edits from the organization that contains the binary
Dr. Cristina Marinescu
Prediction based on Organizational Structure
Precision = 86.2%
Recall = 84.0%
102