empirical analysis of renewable energy …
TRANSCRIPT

EMPIRICAL ANALYSIS OF RENEWABLE ENERGY CONSUMPTION (REC) IN ASEAN-5
i
EMPIRICAL ANALYSIS OF RENEWABLE ENERGY
CONSUMPTION (REC) IN ASEAN-5
BY
BEH CHI YING
GOH MEI YING
LEE EI WEI
LEE XIN MEI
WONG LING
A final year project submitted in partial fulfillment of the
requirement for the degree of
BACHELOR OF BUSINESS ADMINISTRATION (HONS)
BANKING AND FINANCE
UNIVERSITI TUNKU ABDUL RAHMAN
FACULTY OF BUSINESS AND FINANCE
DEPARTMENT OF FINANCE
MAY 2020

EMPIRICAL ANALYSIS OF RENEWABLE ENERGY CONSUMPTION (REC) IN ASEAN-5
ii
Copyright @ 2020
ALL RIGHTS RESERVED. No part of this paper may be reproduced, stored in a
retrieval system, or transmitted in any form or by any means, graphic, electronic,
mechanical, photocopying, recording, scanning, or otherwise, without the prior
consent of the authors.

EMPIRICAL ANALYSIS OF RENEWABLE ENERGY CONSUMPTION (REC) IN ASEAN-5
iii
DECLARATION
We hereby declare that:
(1) This undergraduate FYP is the end result of our own work and that due
acknowledgement has been given in the references to ALL sources of information
be they printed, electronic, or personal.
(2) No portion of this FYP has been submitted in support of any application for any
other degree or qualification of this or any other university, or other institutes of
learning.
(3) Equal contribution has been made by each group member in completing the FYP.
(4) The word count of this research report is 13347 words.
Name of Student: Student ID: Signature:
1. Beh Chi Ying 16ABB02597
2. Goh Mei Ying 16ABB03223
3. Lee Ei Wei 16ABB03266
4. Lee Xin Mei 16ABB02957
5. Wong Ling 16ABB03224
Date: 23 April 2020

EMPIRICAL ANALYSIS OF RENEWABLE ENERGY CONSUMPTION (REC) IN ASEAN-5
iv
ACKNOWLEDGEMENT
We would like to take this opportunity to convey our appreciation to those who
gave us support and assistance to bring this research completed successfully.
First of all, we would like to express our very great appreciation to our beloved final
year project supervisor, Dr Vikniswari a/p Vija Kumaran. We greatly appreciate the
insight and expertise of our supervisor. Meanwhile, she had given us a lot of
guidance in the whole progress of our research. Dr Vikniswari will also provide us
valuable recommendations to solve the problems that we faced throughout the
research.
Besides that, we would like to express our gratitude to our examiner, Mr Lim Chong
Heng. His valuable recommendations had helped us to complete the research.
Moreover, we appreciate our university, Universiti Tunku Abdul Rahman (UTAR)
for providing us this precious opportunity to conduct the research. During the
progress of this research, we have gained a lot of useful knowledge and experience
that we unable to learn from the textbooks. UTAR has provided some facilities such
as reading materials, equipment and others necessary resources that make us to have
a better environment to conduct our research.
Last but not least, a deepest appreciation is given to our teammates Beh Chi Ying,
Goh Mei Ying, Lee Ei Wei, Lee Xin Mei and Wong Ling who have contributed
their effort, time and useful suggestions in the completion of this research. Without
the teamwork and contribution between our teammates, this research will not be
completed successfully.

EMPIRICAL ANALYSIS OF RENEWABLE ENERGY CONSUMPTION (REC) IN ASEAN-5
v
DEDICATION
This work is dedicated to our research supervisor, Dr Vikniswari a/p Vija Kumaran.
She had given valuable guidance and advice throughout this research project when
we faced problems.
Lastly, this research also dedicated to our fellow groupmates. With effort of all
groupmates, we able to complete this research successfully.

EMPIRICAL ANALYSIS OF RENEWABLE ENERGY CONSUMPTION (REC) IN ASEAN-5
vi
TABLE OF CONTENTS
Page
Copyright Page………………………………………………………… ii
Declaration…………………………………………………………….. iii
Acknowledgment……………………………………………………… iv
Dedication……………………………………………………………... v
Table of Contents································································ ix
List of Tables ···································································· x
List of Figures ··································································· xi
List of Abbreviations ··························································· xiii
List of Appendices ······························································ xiv
CHAPTER 1 OVERVIEW……………………………………………. 1
1.0 Introduction…………………………………………….. 1
1.1 Research Background…………………………………... 5
1.2 Problem Statement……………………………………… 9
1.3 Research Question……………………………………… 9
1.4 Research Objective……………………………………... 9
1.5 Scope of Research……………………………………… 9
1.6 Significant of Study…………………………………….. 11
1.7 Chapter Summary………………………………………. 12
CHAPTER 2 LITERATURE REVIEW………………………………. 13
2.0 Introduction…………………………………………….. 13
2.1 Theoretical Review……………………………………... 13
2.1.1 The Environmental Kuznets Curve (EKC) Theory 15

EMPIRICAL ANALYSIS OF RENEWABLE ENERGY CONSUMPTION (REC) IN ASEAN-5
vii
2.2 Research Framework…………………………………… 15
2.3 Empirical Review………………………………………. 15
2.3.1 REC…………………………………………….. 16
2.3.2 CO2 emission and REC………………………… 18
2.3.3 Economic growth and REC…………………….. 19
2.3.4 Trade openness and REC……………………….. 20
2.3.5 Oil price and REC………………………………. 21
2.3.6 Trade openness as interaction term……………... 21
2.4 Chapter Summary………………………………………. 22
CHAPTER 3 METHODOLOGY……………………………………... 23
3.0 Chapter Introduction……………………………………. 23
3.1 Source of Data………………………………………….. 23
3.2 Data Description………………………………………... 24
3.3 Econometric Framework……………………………….. 25
3.3.1 Basic Model…………………………………….. 25
3.3.2 Empirical Model 1……………………………… 25
3.3.3 Empirical Model 2……………………………… 26
3.4 Model Estimation……………………………………….. 26
3.4.1 Panel Unit Root Test (PURT)…………………… 27
3.4.2 Pooled Ordinary Least Square (POLS)…………. 28
3.4.3 Fixed Effect Model (FEM)……………………… 28
3.4.4 Random effect Model (REM)…………………… 29
3.4.5 Hausman Test…………………………………… 30
3.4.6 Breusch-Pagan Lagrange Multiplier Test (LM)… 31

EMPIRICAL ANALYSIS OF RENEWABLE ENERGY CONSUMPTION (REC) IN ASEAN-5
viii
3.4.7 Multicollinearity………………………………… 32
3.4.8 Normality Test………………………………….. 33
3.5 Chapter Summary………………………………………. 33
CHAPTER 4 DATA ANALYSIS…………………………………….. 34
4.0 Introduction…………………………………………….. 34
4.1 Panel Unit Root Test (PURT)…………………………... 35
4.2 Panel Data Models……………………………………… 35
4.2.1 Pooled OLS…………………………………….. 36
4.2.2 FEM…………………………………………….. 37
4.2.3 REM……………………………………………. 38
4.3 Model Comparison……………………………………… 38
4.3.1 Model 1…………………………………………. 39
4.3.2 Model 2…………………………………………. 40
4.4 Diagnostic Checking……………………………………. 40
4.4.1 Multicollinearity………………………………… 40
4.4.2 Normality……………………………………….. 41
4.5 Discussion………………………………………………. 41
4.6 Conclusion……………………………………………… 41
CHAPTER 5 CONCLUSION…………………………………………. 42
5.0 Summary of Finding……………………………………. 42
5.1 Implication of Study……………………………………. 42
5.2.1 Low Carbon Cites Framework (LCCF)………… 43
5.2.2 Subsidy Reform Policy…………………………. 44
5.2.3 Trade Policy…………………………………….. 44

EMPIRICAL ANALYSIS OF RENEWABLE ENERGY CONSUMPTION (REC) IN ASEAN-5
ix
5.2 Limitation………………………………………………. 45
5.3 Recommendation……………………………………….. 45
References……………………………………………………………… 53
Appendices……………………………………………………………... 70
EMPIRICAL ANALYSIS OF RENEWABLE ENERGY CONSUMPTION (REC) IN ASEAN-5
x
LIST OF TABLES
Page
Table 4.1: Panel Unit Root Test ………………………………………. 34
Table 4.2: Panel Data Models for Model 1 …………………………… 37
Table 4.3: Panel Data Models for Model 2 …………………………… 37
Table 4.4: Model Comparison for Model 1 …………………………… 38
Table 4.5: Model Comparison for Model 2 …………………………… 39

EMPIRICAL ANALYSIS OF RENEWABLE ENERGY CONSUMPTION (REC) IN ASEAN-5
xi
LIST OF FIGURES
Page
Figure 2.1: Inverted U-shaped EKC ………………………………. 13

EMPIRICAL ANALYSIS OF RENEWABLE ENERGY CONSUMPTION (REC) IN ASEAN-5
xii
LIST OF ABBREVIATIONS
LM Breusch-Pagan Lagrange Multiplier Test
BP Statistical Review of WE British Petroleum Statistical Review of World Energy
CO2 Carbon Dioxide
CDE Carbon Dioxide Emission
DM Decision Making
FEM Fixed Effect Model
GDPPC GDP Per Capita
IPCC Intergovernmental Panel on Climate Change
JB test Jarque-Bera test
NCO National Coordination Office
NDRC National Development and Reform Commission
NRE Non-Renewable Energy
OP Oil Price
PURT Panel Unit Root Test
POLS Pooled Ordinary Least Square
REM Random Effect Model
RE Renewable Energy
REC Renewable Energy Consumption
TO Trade Openness
TS Test Statistic

EMPIRICAL ANALYSIS OF RENEWABLE ENERGY CONSUMPTION (REC) IN ASEAN-5
xiii
EIA U.S. Energy Information Administration
VIF Variance Inflation Factor
WDI World Development Indicators

EMPIRICAL ANALYSIS OF RENEWABLE ENERGY CONSUMPTION (REC) IN ASEAN-5
xiv
LIST OF APPENDICES
Page
Appendix 1: Model 1…………………………………………………….. 62
Appendix 2: Model 2…………………………………………………….. 70

EMPIRICAL ANALYSIS OF RENEWABLE ENERGY CONSUMPTION (REC) IN ASEAN-5
Page 1 of 70
CHAPTER 1: OVERVIEW
1.0 Introduction
This chapter had explained the background, issues, questions, and objectives of this
research. This chapter also discussed the significant of variables that contributed to
this research.
1.1 Research Background
Over past decades, non-renewable energy that will run out in future has become
worldwide concern. Most of the non-renewable energy is fossil fuel, which include
natural gas, coal and petroleum. These energies are non-sustainable and is the main
contributor that caused global warming and climate change due to CO2 emission
from burning of fossil fuel. To protect the next generation, switching of non-
renewable energy to renewable energy is the significant action that must be taken
immediately. Renewable energy, such as wind, solar and hydro energy is
sustainable and clean energy which can mitigate climate change.
Renewable energy development and consumption have become a trend among
ASEAN-5 countries (Malaysia, Philippines, Indonesia, Vietnam and Thailand) due
to rapid growth in urbanization for past three decades. ASEAN countries are blessed
with diverse renewable energy. For example, Indonesia, Philippines, Vietnam and
Thailand are richly with coal, oil and natural gas, while Malaysia is richly in
petroleum. However, a small number of ASEAN countries are rely on the import of
fossil fuel. For instance, Philippines and Thailand also rely on import of energy
even they have produced their own energy. However, the supply of energy is unable
to fulfil the demand for their country. To fulfil the demand, import of fossil fuel is
needed for ASEAN countries. The import of fossil fuel was bought the concern of
the risk of supply shortage and price fluctuation.
As ASEAN-5 countries has noticed that non-renewable energy has bring various
adverse effects that mentioned above, ASEAN-5 countries are encouraged to put

EMPIRICAL ANALYSIS OF RENEWABLE ENERGY CONSUMPTION (REC) IN ASEAN-5
Page 2 of 70
effort in development and consumption in RE. Based on ASEAN Plan of Action on
Science, Technology, and Innovation for 2016-2025 (2017), all ASEAN countries
are agreed to meet target of 23% renewable energy by year 2025. To meet the target,
members of ASEAN-5 countries had taken various actions in development and
consumption for renewable energy. According to The Star (2019), Malaysia
government has been implemented 80 initiatives that relate to energy, especially
renewable energy and R&D. Other than initiatives such as improving Net Energy
Metering (NEM) and Energy Efficiency (EE), there are also RM2 billion Large
Scale Solar 3, which is a project that has the objective with increase electricity
generation from REC (MAQO Group, 2019).
National Renewable Energy Programme (NREP) which clearly outlined the targets,
strategies, planning and tools that help the country to achieve the goals that set in
Renewable Energy Act of 2008 within timeframe of 2011 to 2030 was
implementing in Philipines. The total awarded projects under Renewable Energy
Law in Philippines in 2016 was 657 and these projects are mainly focus on
hydropower and solar resources (Philippine Department of Energy Portal, 2016). In
Indonesia, Electricity Supply Business Plan (RUPTL) 2018-2027 was issued to
increase renewable energy output. In this plan, around USD 30 billion was invested
for NRE and it was 32% from total power plant investment (PLN, 2018). According
to Chen (2019), Thailand had implemented innovative blockchain technology
which can minimize the transfer cost and ensure the transparency of the trading.
Based on this study, it concerns on the four variables which include economic
growth, CO2 emission, oil price and trade openness as the determinants of REC in
ASEAN-5 countries.
The independent variable, economic growth that has the proxy of GDP per capita
which indicates the measurement for economy of a country explain with total
population and also reflect the living standard of a country (Amadeo, 2019). Based
on Shahbaz, Hye, Tiwari and Leitão (2013), when the economic growth rise, the
usage of energy will increase and this will lead to the rapid grow of economy. For
example, during year 2010 to year 2013, GDP per capita of Malaysia had increased,
the REC also increased too. Based on Cho, Heo and Kim (2015), something affect
decrease in economic growth rate, such as Gross Domestic Product (GDP) per

EMPIRICAL ANALYSIS OF RENEWABLE ENERGY CONSUMPTION (REC) IN ASEAN-5
Page 3 of 70
capita may have negative influence to the renewable energy growth. Therefore,
economic downturn may harm renewable energy growth, such as during the great
recession 2008. As a result, GDP growth of Malaysia had decrease to 0.1% at fourth
quarter compared with 5.9% at the first three quarter (Goh and Lim, 2010). In
contrast, REC will raise as strengthen the policies to grow the economy. Since year
1995, economic of ASEAN-5 country had grew more than 4% annually, this had
created increase twice in consumption of renewable energy. They also expected the
demand of renewable energy will increase continuously with 4.7% per year
(Thomas, 2019). The Southeast Asia Energy Outlook report showed that domestic
manufacturing sector had opportunity to grow, such as solar manufacturing industry
in Thailand had raised output of Photovoltaic for international markets. This will
strengthen the economy of the country by consume more renewable energy (The
ASEAN Post Team, 2018).
CO2 emission or in another term as greenhouse (GHG) gas, is a form of gas which
absorbs and diffuses radiation of thermal, and also maintains a suitable temperature
for the mother Earth (Ritchie and Roser, 2017). CO2 emission usually happens
through the inflammation of non-renewable energy and the energy industry
contributes 33% of the whole amount of CO2 emission in global. Based on the data,
the overall trends for the CO2 emission in the ASEAN-5 is increasing either in a
rapid or slow rate, while Malaysia has the highest number of CO2 emission
followed by Thailand, Indonesia, Vietnam and Philippines. The Intergovernmental
Panel on Climate Change in 2007 has published about the awareness of global
warning with the main cause of the release of CO2 by all the countries (Sadorsky,
2009). Therefore, the people are seeking for solutions to reduce or maintain the CO2
emission. According to Chen (2018), there are more than 100 countries include the
ASEAN-5 had signed the “Kyoto Protocol to the United Nations Framework
Convention on Climate Change (Kyoto Protocol)”. The main objectives of the
Kyoto Protocol are to control the emission of human emitted GHG gas which is also
control the CO2 emission and to promote the renewable energy sources for every
country. Therefore, the ASEAN-5 is active in implementing the carbon-mitigating
projects in their country. For example, the Green Technology Application for the
Development of Low Carbon Cities (GTALCC) project in Malaysia, Low Carbon
City Pilot project in Thailand, Rehabilitation of Hydro Power Plants project in
EMPIRICAL ANALYSIS OF RENEWABLE ENERGY CONSUMPTION (REC) IN ASEAN-5
Page 4 of 70
Indonesia, Low Carbon Technology Catalogue in Vietnam and Quirino Forest
Carbon Project (QFCP) in Philippines. The main purpose of these projects is used
to increase the usage of renewable energy and to reduce the CO2 emission.
Trade openness or in another term as economic openness, is referring to a country
or economy that gives the authority or right to have trading with another country or
economy. The openness’s degree is able to calculate with the actual size of
registered imports and exports in a country’s economy (Keman, 2013). Based on
the data, the overall trends for the trade openness in the ASEAN-5 is increasing
either in a rapid or slow rate. According to the data found, the country with highest
number of trade openness falls to Thailand. Malaysia, Indonesia, Philippines and
Vietnam have lower number of trade openness compare to Thailand. Since
Malaysia produce a huge amount of palm oil, it can be used as an example.
According to Ooi (2019), Malaysian Palm Oil Board’s (MPOB) data shows that
Malaysia had exported palm oil, which is a renewable energy source, amounted to
RM65.41 billion in 2018. Palm oil plantation had covered 15% of the country and
it produced significant amount of combustible waste such as biomass from empty
fruit bunches and biogas from methane capture of oil palm, which all these leftover
materials will be considered as the renewable energy sources for the country to
generate electricity (Bayar, 2011). Indeed, Malaysia’s export volume of renewable
energy source (palm oil) able to stimulate the REC, which promotes more
renewable energy and transports these traded good to foreign countries. Same goes
to other ASEAN countries such as Thailand. According to Thailand’s Alternative
Energy (2014), from the plan, the Board of investment (BOI) administer
inducements and services to investors in various sectors. For illustration, the import
duties on machinery declines, for raw or essential material and exception from duty
on raw or essential materials for the usage in production for export. This will
increase the import and export in Thailand which will lead to the consumption and
production of the renewable energy. Next, Vietnam makes 3.4 gigawatts from solar
and wind power every year and exports them to Europe and United States. Vietnam
has huge number of natural endowments which included 4 to 5 kilowatt-hours per
square meter for solar and 3,000 kilometres of coastlines with constant winds in the
range of 5.5 to 7.3 meters per second (Breu, Castellano, Frankel & Rogers, 2019).
Moreover, Philippines continues to dominate production of coconut oil and trade it

EMPIRICAL ANALYSIS OF RENEWABLE ENERGY CONSUMPTION (REC) IN ASEAN-5
Page 5 of 70
to foreign countries (IndexBox, 2019). Indonesia focuses in trading biodiesel, which
the overall biodiesel exports were 173,542 kilolitres and the shipments mostly
headed to European Union (EU) and China. The sources that ASEAN-5 trade to
foreign countries are renewable energy sources and the consumption will have
significant impact on their trade openness (“Indonesia 2019 biodiesel exports to
rise”, 2019).
According to Kimberly (2019), crude oil is referring to the liquid fuel source that
located underground. Crude oil is basically obtained through drilling. Crude oil can
be get when the people heat and compress the organic materials over a long time
(“What is Crude Oil? A Detailed Explanation on this Essential Fossil Fuel”, 2009).
Since oil or oil products are considered to be the closest substitute for renewable
energy for most of the countries, the real crude oil prices are included in this
research (Rafiq & Alam, n.d.). The oil price is measured using the pump price of
gasoline which in the unit of US Dollar per litre. Based on Sadorsky (2009), oil
price has the negative impact towards the REC, which means that when there is an
increasing in oil price, REC will decrease. Omri & Nguyen (2014) found the same
results between the oil price and REC too. When the oil price increases by 1%, REC
will decrease around 0.34% and vice versa. The negative relationship between oil
price and REC is able to be explained on reasons. According to Foy, Sheppard &
Raval (2020), the price of oil will decrease which due to the decrement in the
demand of oil. This situation usually happens during economic downturn. Therefore,
as the closest substitute of oil products, the demand of RE will increase and lead to
the increment of REC. This due to the RE sources such as biofuels are still less
costly compare to their competitors, the margin of RE is considerable nowadays
(Anderson, 2015).
1.2 Problem Statement
Before the popularization of renewable energy, non- renewable energy such as
natural gas, coal and petroleum were widely used in commercial, residential and
transportation. The heavy used of non- renewable energy causes the scarcity of the
sources and serious environmental problem was incurred. To solve the problems,

EMPIRICAL ANALYSIS OF RENEWABLE ENERGY CONSUMPTION (REC) IN ASEAN-5
Page 6 of 70
renewable energy was introduced as an option to fulfil energy demand meanwhile
minimized the environmental problem. However, according to The World Bank
(n.d.), the overall percentage of REC in ASEAN-5 countries showed decreasing
trend from 1991 to 2015. There are several factors that will affect REC in ASEAN-
5 countries which are economic growth, CO2 emission, oil price and trade openness.
In this research, we would like to determine the relationship between REC and the
independent variables in ASEAN-5 countries.
During Great Recession 2008, the selected ASEAN countries had suffered a great
recession in their economic growth, especially Malaysia and Philippines. For
example, Malaysia had undergone the serious downturn in the history, and caused
the decrease in domestic economy by around 6% (Bank Negara Malaysia, 2009).
GDP per capita had decreased by around 13%, REC had decreased by around 10%.
GDP per capita of Philippines had decreased around 4% and REC had drop from
31.72% to 31.22% (World Development Indicators, 2019). Low GDP per capita
had led to low productivity in produce renewable energy. Low production of
renewable energy, the demand of renewable energy will decrease.
For the past decade, the ASEAN-5 country had presented increment trends whether
is rapid or slow growth in CO2 emission. According to the Star Online (2015), CO2
emission per capita will reached 12.1 tons per year in Malaysia. This is because the
increase in urbanization will cause CO2 emission to be raised too, the Malaysians
will move towards to a lifestyle of carbon-intensive. When the population is getting
bigger, the demand of automobiles for citizens and factories for industries will be
higher in addition CO2 emission will grow too. Therefore, the Malaysia government
tried to put effort on reducing carbon emissions by carrying out the carbon-
mitigating projects and applying the renewable energy initiatives. However, the
regulation on the mitigation and adaptation is still weak, so REC in Malaysia is still
low. REC in Malaysia was dropped by 3.41% in 2016, while CO2 emission in
Malaysia was at the highest rate among the time period of 1992-2016.
According to Coca (2018), Indonesia is approaching in the opposite direction based
on the rules to perform the Paris climate accords for 2020. The Indonesian
government’s intention to set up over 100 of coal-fired power plants which will
drag in more carbon-rich tropical forests deforestation in Indonesia. In addition,

EMPIRICAL ANALYSIS OF RENEWABLE ENERGY CONSUMPTION (REC) IN ASEAN-5
Page 7 of 70
there is an extension of car-centric transportation base installation among the
Indonesians. Based on these two situations, CO2 emission will grow rapidly in
Indonesia as the deforestation and transportation will release high amount of CO2
emission. In the matter of fact, Coca (2018) also stated that Indonesia actually has
tremendous renewable capacity with solar, hydro, wind and geothermal resources
in the country. However, due to the very little investments in renewable sector, there
are only 2% of that renewable capacity has been utilized in Indonesia. This shows
that the Indonesia government does not take advantage of its natural resources to
solve the high CO2 emission in the country.
Among the past five years, there is a rapid decrease in the trade openness of
Malaysia. Trade openness enables to boost the economic growth of the country by
importing and exporting the renewable energy sources. And, with the high-
technology of renewable energy, it is able to improve the environmental quality and
also increase REC. When the export volume of renewable energy in Malaysia
increases, the REC will increase too. This will also increase the production of
renewable energy in the country and export or deliver more exports goods to other
countries. Malaysia is one of the largest Photovoltaic (PV) makers globally and has
export to other country. Since Malaysia is one of the largest Photovoltaic (PV)
makers globally and has export to other country, solar panel can be used as an
example in this situation. According to Chu (2019), Malaysia can produce more
electricity (1.4 times) than electricity generates by combusting fossil fuel if all the
Peninsular Malaysia equipped with solar panels. Then, more solar can be exported
to the foreign country, the more the consumption of renewable energy. Thus, less
installation of solar panel in Malaysia is one of the issues that cause low REC.
According to Xinhuanet (2019), Vietnam’s power supply is reported that it is
running out soon due to there is a lot of Vietnam power projects left behind the
schedule. Although Vietnam has the large scale of hydropower sources, mostly the
large and medium-sized hydropower sources have been adopted, just left a few
small-sized hydropower sources for exploitation only. The hydropower will
constitute for 12.4% only of all supply of electricity in Vietnam by year 2030, which
causes the supply to be shortage soon. Therefore, Vietnam is planning to import
more annual electricity from China and Laos in the following years which are
expected to raise to 3000 megawatts by year 2025 and 5000 megawatt by year 2030.

EMPIRICAL ANALYSIS OF RENEWABLE ENERGY CONSUMPTION (REC) IN ASEAN-5
Page 8 of 70
The increment of importing electricity had significantly contributed to trade deficit,
which will affect REC indirectly. When Vietnam consumes more on imported
electricity, REC in Vietnam will decrease.
Indonesia, the oil outputs has been diminishing gradually in size due to ageing well
and lacklustre new reserves in the recent years, then making the country become a
net oil importer (Indonesia to boost use of RE, 2020). The main issue of Indonesia
is they rely more on the fossil fuel and due to the oil output issue, the country has
imported more fossil fuels from other country. The increase in the country’s import
of fossil fuel had significantly contributed to trade deficit, which indirectly affect
the consumption of renewable energy. The more the country consumes on non-
renewable energy, the lesser the REC.
During the Asian Financial crisis that occurred at year 1997, the oil price had been
decreased dramatically (Olowe, 2010). The crisis was started in Thailand due to the
weakening of Thai Baht. This crisis had affected the Asia countries afraid of the
declining of economy. The Asian Financial Crisis had also affected the countries
such as Malaysia, Indonesia, Philippines and so on. Malaysia is a net exporter of oil
and other countries are mostly the dependent of oil import. The currencies and the
price of the assets of these countries were declining and the debt of the countries
were increasing during that period. Due to economic slowdown of the affected
countries, the demand of the oil was decreasing and it affected the price of the oil
during that period. The price had fell to as low as $8 per barrel during the end of
1998. When the demand of oil had decreased, it will then lead to the increasing of
demand of renewable energy. Due to the shortening of oil revenue, it led to the
Russian Financial crisis which also occurred at 1998. The oil price was then
increased back to the highest level in November 2000.
Another issue of oil price is the oil price shock which occurred during the year of
2014. During the year 2014, the oil price fell dramatically. Hou, Jodie, Jane and
Dirk (2015) said that the oil price had been fallen from $112 per barrel to $48 per
barrel between the periods of June 2014 to January 2015. This had affected the
countries which import and export oil. Foo (2015) mentioned that purchasing power
will increase, industries’ production cost and inflation will be lowered down and if
the real oil price dropped. For example, the major oil importer, Indonesia, was

EMPIRICAL ANALYSIS OF RENEWABLE ENERGY CONSUMPTION (REC) IN ASEAN-5
Page 9 of 70
enhanced from the lower oil prices by regenerating the expensive fuel subsidy
programme. Other members of ASEAN-5 and oil importers such as Thailand will
get the biggest heir of the low oil price due to the countries are mostly depend on
the road transport. The low oil price caused the country to have more funds to invest
in other projects such as renewable energy which can bring advantages to the
countries. Since Malaysia, one of the major oil exporters will hurt badly compared
to other oil importers when the oil price is low. Therefore, the government can take
the chance to focus on the other industries.
1.3 Research Question
i. What are the factors affect REC in ASEAN-5 countries from year 1991 to
year 2015?
ii. How does trade openness act as interaction term and overall affect REC in
ASEAN-5 countries from year 1991 to year 2015?
1.4 Research Objective
i. To study the factors that affect REC in ASEAN-5 countries from year 1991
to 2015.
ii. To examine the effect of trade openness that acts as interaction term and
overall affect REC in ASEAN-5 countries from year 1991 to year 2015.
1.5 Scope of Research
The research will be conducted based on ASEAN-5 countries from year 1991 to
2015. ASEAN-5 countries that consists of Malaysia, Thailand, Philippines,
Vietnam and Indonesia. The dependent variable of the research is REC while the
independent variables are CO2 emission, oil price, trade openness and GDP per
capita. The interaction term for the research is trade openness.

EMPIRICAL ANALYSIS OF RENEWABLE ENERGY CONSUMPTION (REC) IN ASEAN-5
Page 10 of 70
1.6 Significant of Study
There are continued strongly rely on fossil fuels (non- renewable energy), which
can increase CO2 emission and raise the local air pollution rate, even though the
consumption of renewable energy had successfully implemented all around the
world. Rely on consumption of non- renewable energy (fossil fuels) will raise
emission of carbon dioxide by 60%. If this problem cannot be solved immediately,
health and pollution costs may increase to 225 billion US dollar annually when year
2025. To control this cost, ASEAN Centre for Energy decide to consume renewable
energy, since this choice is more cost-effective in term of pure economic. In year
2015, ministers of ASEAN decide a goal of consume 23% of RE when year 2025.
This target applied to increase the region’s REC by a-two-and-half-fold compared
with year 2014 (IRENA Quarterly, 2017). Besides, the increase of total population
had increased the consumption on natural resources, such as fossil fuels. This had
increased the depletion of fossil fuels, therefore the solution became the important
issue to be discussed. United Nations Framework Convention on Climate Change
(UNFCC) decided to consume renewable energy which are clean and environment
friendly (Kamaruddin Abdullah, 2005).
Research framework become more comprehensive if the model had extended and
adding interaction variable. Based on Lahiani, Sinha, and Muhammad Shahbaz,
there have many researches discuss the relationship between REC, economic
growth and CO2 emission. We found out adding more independent variable such
as trade openness able to provide contribution to the model. Trade openness
consider as gap variable because there has only few researches study it.
Trade openness as the interaction term in this research found that there is significant
effect with renewable energy consumption. The greater the trade openness, increase
in import and export, hence raise in use and production of renewable energy. To
raise the usage of renewable energy, trade openness will be the suitable policy to
control global warming (Omri and Nguyen, 2014). Based on Murshed (2018), trade
openness policies are able to act as the complement of environment polices, which
able to rise the usage of renewable energy while reduce the CO2 emission. Due to
trade openness, export of renewable energy facility of a country to another country
more convenient. Hence, able to influence the country which are using non-

EMPIRICAL ANALYSIS OF RENEWABLE ENERGY CONSUMPTION (REC) IN ASEAN-5
Page 11 of 70
renewable energy. The export of facility able to switch the consumption of non-
renewable energy to renewable energy.
Environmental Kuznets Curve (EKC) theory can help to justify the reason why we
choose trade openness act as an interaction term in our study. Trade openness is the
variable that can interact with the others three variables which are CO2 emissions,
Economic growth and oil price then affect the consumption of renewable energy.
In EKC theory, it explained the relationship between the environmental quality and
the development of economic. It had an idea of market forces will first increase
during the economy development, and then decrease the environmental quality
(further explanations in Chapter 2). For instance, trade openness enables CO2
emissions to raise and reduce at the same time through economic growth and
technological effect. At the time the economy grows to a certain period, people will
start to concern the environmental quality and then start to consume the renewable
energy. This showed that the increase in the trade openness will bring positive
relationship to the economic growth and will increase the CO2 emission, and at last
will increase the REC.
The contribution of REC are technological innovation and favourable government
policies. Countries which are members of ASEAN had agreed to have a target for
technological innovation that related to renewable energy, like floating solar panels
for better solar power efficiency (Thomas, 2019). For example, to have a better
performance for solar energy, Solar PV being produced. This technology will
increase the implementation of solar thermal in ASEAN country (“Scoping Study
on Intra-ASEAN Value Chain Cooperation and Trade…” , 2016). Besides, the
establishment of RE100 in year 2014, which is a collaboration with more than 100
enterprises to reach the target of 100% of renewable energy. This able to attract
consumer to increase the REC. This also will reduce the price of renewable energy,
hence increase the consumption because cost had reduced. ASEAN will become
potential place for renewable energy to develop with the huge potential in
renewable energy (Thomas, 2019).

EMPIRICAL ANALYSIS OF RENEWABLE ENERGY CONSUMPTION (REC) IN ASEAN-5
Page 12 of 70
1.7 Chapter Summary
In the research background, it consists of the introduction of the dependent variable
(REC) and independent variables (trade openness, oil price, CO2 emission and GDP
per capita). It then continues with the problem statement that determines the issues
of the variables in this research. Moreover, this chapter also includes the research
question and research objective which help to have a better idea on the concern and
aim of the research. Furthermore, this chapter also includes the scope of study and
the significant of study. In scope of study, it includes the region and variables that
involved in this research while in the significant of study discusses the contribution
of the variables.

EMPIRICAL ANALYSIS OF RENEWABLE ENERGY CONSUMPTION (REC) IN ASEAN-5
Page 13 of 70
CHAPTER 2: LITERATURE REVIEW
2.0 Introduction
In Chapter 2, the study discussed the literature review on the relationship between
dependent variable (REC) and four independent variables, which are economic
growth (GDP per capita), carbon dioxide emissions, oil price and also trade
openness.
Relevant theoretical framework on the dependent variable and independent
variables will be discussed and the relevant graph will be given. Moreover, it is
given the research framework of our study. Besides, this chapter also will show the
critical reviews from all the past researchers’ finding on all our independent
variables. Discussing the relationship between each independent variable with the
dependent variable.
2.1 Theoretical Review
2.1.1 The Environmental Kuznets Curve (EKC) Theory
The theoretical Environmental Kuznets Curve theory, which also known as EKC
concept, is taken into consideration in our research of study. EKC concept is
recognized by Grossman and Krueger in the early 1990s. The EKC theory is a kind
of theory that explains the relationship between the quality of environmental and
the development of economic. There are a few of views of the EKC concept. First
view is that the greater the activity of economic, the harmful the environment will
be, based on the statistics assumptions on the investments of technology and
environmental. Next, there is another view that when the income increases, the
requirement of improving the environmental quality will increase and the available
resources for investment will increase too (Stern, 2004).
From the Figure 2.1, it showed us the inverted U-shaped EKC. The Y-axis of the
graph is label as the level of environmental degradation while the X-axis is label as
GDP per capita (economic growth). This EKC graph used the idea that when the

EMPIRICAL ANALYSIS OF RENEWABLE ENERGY CONSUMPTION (REC) IN ASEAN-5
Page 14 of 70
economic development growth occurs, the environmental level will worsen at a
certain point. When the economy continues to grow and reaches a certain point of
GDP per capita, the money is then invested back to the environment. Then the
relationship between the environment and the society getting improves and the
ecosystem restored (Agarwal, 2020).
Figure 2.1
From the study by Yu, Nataliia, Yoo, & Hwang (2019), it said that trade is one of
the important factors that helps economies to reduce CO2 emission and maintains
economic growth simultaneously through the combination of scale, composition,
and technique effects. The increase in export will increase the CO2 emission,
however, the raise in import will lead to decrease in the CO2 emission. To makes
possible to increase and decrease at the same time through economic growth.
Sadeghieh (2016) support that GDP and CO2 emission will lead to higher REC in
the countries. The study by Boufateh (2018) stated that CO2 emission will general
raise during the beginning period of development before per capita income reaches
in a propelled phase of development, a turning point from which the CO2 emission
will in general fall. Moreover, in the study of Katircioglu (2017), it supports the
interaction between GDP and environmental pollution. Besides, it also shows that
changes in oil price significantly and negatively affect the EKC in such a dynamic
economy. Zaghdoudi (2017) supports the view that when increase in oil prices will

EMPIRICAL ANALYSIS OF RENEWABLE ENERGY CONSUMPTION (REC) IN ASEAN-5
Page 15 of 70
decreases in CO2 emission. This will indirectly affect the EKC phase of
development. Boufateh (2018) also stated that in general, these early examinations
concur on the significance of taking oil price in such a setting to the extent that the
direction towards an expansion in the domestic cost of polluting energies could
comprise an adequate measure adopted to decrease CO2 emission.
2.2 Research Framework
2.3 Empirical Review
2.3.1 REC
For past two decades, non-renewable energy is playing an important role in the daily
life of people and there were numbers of researches that focus on non-renewable
energy. However, there are also some researchers studied on REC in these few years.
There are a few researchers studied on the effect of financial development on REC
such as Anton & Nucu (2020) and Eren, Taspinar & Gokmenoglu (2019). Broad
money (M2), domestic credit, and bank asset are the categories in financial
development. There is positive effect between financial development and REC in
European Union from 1990-2015 and India from 1971-2015 respective in this both
papers.
Trade Openness REC
Oil Price
Economic Growth
CO2 emission

EMPIRICAL ANALYSIS OF RENEWABLE ENERGY CONSUMPTION (REC) IN ASEAN-5
Page 16 of 70
Some researchers have examined the relationship between urbanization and REC.
According to Salim & Shafiei (2014), there is no significant relationship between
urbanization and REC in OCED countries from 1980 to 2011. The data was adapted
from World Bank’s World. Besides, Yang, Zhang & Zhang (2016) found out that
the contribution of urbanization in RE was lesser than total energy consumption and
proven by logarithmic mean Divisia index (LMDI) method. The data of this
research were collected from Statistical Review of Word Energy 2013 for the year
1990-2012 in China. On the other hand, Askar (2016) was studied on the impact of
oil rent and natural gas rent on REC in Balkans countries. From the result of
dynamic panel data analysis, the researcher has found out that there is no
relationship between oil rents and positive and significant relationship between
natural gas rent and REC. The data was obtained from The World Bank’s World
Development Indicators (WDI) between the years of 1998-2011.
Based on Lin & Moubarak (2014), a positive relationship between labour and REC
was found in China from 1977-2011. This relationship was proven by
Autoregressive Distributed Lag approach (ARDL). Sadorsky (2009a) was studied
on the relationship of electricity price and REC in 18 emerging countries from1994-
2003. From the result of panel cointegration estimates there was a positive
relationship of electricity price and REC. When there is 1% increase in real income
per capita, consumption of renewable enegry per capita will increase by 3.5%.
There is another paper from same author was found out there is positive relationship
between electricity price and REC in G7 countries. The data was adapted from
United Nations economic data base between years 1980-2005.
2.3.2 CO2 emission and REC
Carbon dioxide (CO2) or in another term as greenhouse gas (GHG), is a form of
gas which absorb and diffuse radiation of thermal, and also maintaining a suitable
temperature for the mother Earth (Ritchie and Roser, 2017). There are certain
empirical studies shown that CO2 is one of the determinants that will affect REC.
Sadorsky (2009), Chen (2018), Lin & Okonkwo (2016), Lahaini, Sinha &
Muhammad Sbahbaz (2018), Lin & Moubarak (2014), Omri, Daly & Ngugen
(2015), Omri & Nguyen (2014) and Salim & Rafiq (2012) mentioned that there was

EMPIRICAL ANALYSIS OF RENEWABLE ENERGY CONSUMPTION (REC) IN ASEAN-5
Page 17 of 70
a positive relationship between CO2 and REC. Firstly, Sadorsky (2009) used error
correction model (ECM) approach ordinary least squares (OLS) to estimate the CO2
effect on REC among G7 countries from year 1980 to 2005. The increase of CO2
emission will lead to the increase of REC. The data for CO2 was adapted from the
U.S. Energy Information Administration (EIA). Besides, according to Chen (2018),
there was a positive relationship between CO2 emission and REC in the central
region of China from 1996 to 2013. The data of the research was adapted from
Intergovernmental Panel on Climate Change (IPCC), National Coordination Office
(NCO) on Climate Change and National Development and Reform Commission
(NDRC). The method that the researcher used was dynamic panel data model and
system GMM estimator. Lahaini, Sinha & Muhammad Sbahbaz (2018) found out
that there was positive relationship between CO2 emission and REC in G7 countries
except for Canada by using the data World Bank’s World Development Indicator
for the year 1995 to 2014. The methods used in the research were nonlinear
autoregressive distributed lag (NARDL) model and autoregressive distributed lag
(ARDL) model. Lin & Moubarak (2014) found out there is positive relationship
between CO2 emission and REC in the China from 1977 to 2011. When CO2
increase by 1%, REC will increase by 0.75%. The data of research was adapted
from China Energy Statistical Yearbooks. Based on Omri, Daly & Ngugen (2015),
there was a positive relationship between CO2 emission and REC among 64
countries. The data of research is adapted from British Petroleum Statistical Review
of World Energy (BP Statistical Review of WE) from 1990 to 2011. Besides that,
Salim & Rafiq (2012) stated that CO2 is positive and significant at 1% level in
Brazil, China, India, Indonesia, Philippines and Turkey from 1980 to 2006.
However, there is also negative relationship between CO2 emission and REC which
mentioned by Sebri & Salha (2014). The research was studied the relationship
between CO2 emission and REC from 1971-2010 in BRICS countries. The data
was retrieved from World Development Indicators database of World Bank. On the
other hand, Askar (2016) said that no relationship and significant effect was found
between CO2 emission and REC. The researcher had used Generalized Method of
Moments (GMM) to prove this relationship. The researcher had used the data from
World Bank’s WDI. All the data was adapted from 1998 to 2011. Chen (2018) also
highlighted that CO2 emission did not show significant relationship on REC in
EMPIRICAL ANALYSIS OF RENEWABLE ENERGY CONSUMPTION (REC) IN ASEAN-5
Page 18 of 70
western region of China from year 1996 to 2013. The data of the research was
adapted from IPCC, NCO on Climate Change and NDRC. The method that the
researcher used was dynamic panel data model and system GMM estimator.
2.3.3 Economic growth and REC
In this study, the proxy of economic growth used in our research is GDP per capita.
GDP per capita is the country’s GDP divided by the population (Kimberly, 2019).
Sadorsky (2009), Eren, Taspinar & Gokmenoglu (2019), Chen (2018), Omri &
Nguyen (2014), Md. Mahmudul Alam & Md. Wahid Murad (2020), Omri, Daly &
Ngugen (2015), Lin and Moubarak (2014), Cho, Heo and Kim (2015) and Usama
Al-mulali et al (2013) highlighted that GDP per capita has a positive relationship
with REC. Sadorsky (2019) found the positive relationship in the 18 emerging
countries. The 1% increase in GDP per capita will increase 3.39% to 3.45% of REC
in the year 1994 to 2003. The data for this research was from EIA. The method used
in the research was Ordinary Least Square (OLS) method. Besides, from the other
research from Sadorsky (2009), GDP per capita had a positive relationship with
REC. When GDP per capita increase by 1%, REC will increase by 8.44% in G7
countries in the year 1980 to 2005. The data of this research were all adapted from
EIA. The researchers had used Error Correction model (ECM) and Ordinary Least
Square (OLS) methods to prove this relationship. Furthermore, based on the
research of Chen (2018), 1% increase in GDP per capita will lead to 1.907%
increase in REC. The data of the research was adapted from IPCC, NCO on Climate
Change and NDRC. The method that the researcher used was dynamic panel data
model and system GMM estimator. The data was taken from the year 1996 to 2013.
Omri & Nguyen (2014) said that 1% increase in GDPPC will lead to 0.2% increase
in consumption of renewable energy. The researchers had used the data from the
year 1990 to 2011 which adapted from BP Statistical Review of WE and WDI The
method used in the research was panel unit root test and GMM estimator system.
According to Md. Mahmudul Alam & Md. Wahid Murad (2020), GDP per capita
and REC has a ppositive relationship among 25 OCED countries from the panel
unit-root test. Based on Omri, Daly & Ngugen (2015), there was a positive
EMPIRICAL ANALYSIS OF RENEWABLE ENERGY CONSUMPTION (REC) IN ASEAN-5
Page 19 of 70
relationship between GDP per capita and REC among 64 countries. The data of
research is adapted from World Bank Development Indicators from 1990 to 2011.
Lin & Moubarak (2014) found the positive relationship between GDP per capita
and REC in the China from 1977 to 2011. The 1% increase in GDP per capita will
lead to 0.61% increase in consumption of renewable energy. The data of research
was adapted from China Energy Statistical Yearbooks.
However, Askar (2016) found out that there was a negative relationship between
GDP per capita and REC. According to the result of system-GMM analysis from
Askar (2016), GDP per capita has a negative and significant relationship with REC.
2.3.4 Trade openness and REC
Trade openness is referring to the outward or inward orientation (import, export
and trade) of a given country’s economy. Trade openness is indicated by the share
of import and export in Gross Domestic Products (GDP). According to the research
of Omri, & Nguyen (2014), Md. Mahmudul Alam & Md. Wahid Murad (2020),
Omri, Daly& Ngugen, (2015), Askar (2016) and Sebri & Salha (2014), trade
openness is determined to have a positive impact on the REC. There is positive and
significantly results showed between trade openness and REC at the level of 1%
and 5%. In this study, the researcher investigated 64 countries over the period 1990-
2011 by using dynamic system-GMM panel. The data of trade openness is taken
from the World Bank’s WDI. When trade openness increases by 1%, REC increases
by around 0.25%. The findings stated that except for the high-income panel, trade
openness have a statistically significant impact on the REC. Md. Mahmudul Alam
& Md. Wahid Murad (2020) was mentioned that there a positive relationship
between trade openness with REC through the result of autoregressive distributed
lag approach, dynamic ordinary least squares and fully modified ordinary least
square. Based on Omri, Daly & Ngugen (2015), there was a positive relationship
between trade openness and REC among 64 countries. The data of research is
adapted from World Bank Development Indicators from 1990 to 2011. Askar (2016)
was stated that the trade openness is positive and significant at 5% level in Balkan
countries from 1998-2011. The researcher had use Generalized Method of Moments

EMPIRICAL ANALYSIS OF RENEWABLE ENERGY CONSUMPTION (REC) IN ASEAN-5
Page 20 of 70
(GMM) to prove this relationship. Lastly, Sebri & Salha (2014) was found out that
there was a positive relationship between trade openness and REC among BRICS
countries except South Africa from 1971-2010. This result is from FMOLS and
DOLS by adapted data from World Development Indicators database of World
Bank.
2.3.5 Oil price and REC
According to Kimberly (2019), crude oil is referring to the liquid fuel source that
located underground. The oil price is measured using the pump price of gasoline
which in the unit of US Dollar per litre. Lahiani & Muhammad Shahbaz (2018),
and Omri, Daly & Ngugen (2015) proved that there is positive relationship
between the real oil price and REC. According to Lahiani & Muhammad Shahbaz
(2018), increase in oil price will increase the consumption of renewable energy in
the long run in United Kingdom and France. The researchers had used the nonlinear
autoregressive distributed lag (NARDL) model in the research ad get the result
mentioned above. The data used in the research were collected from the Federal
Reserve Bank of St. Louis for the year 1955 to 2014 for G7countries. Besides, Omri,
Daly & Ngugen (2015) found out that when there is 1% increase in the real oil price,
it will lead to an increase of around 0.01% in REC. The data of the research are
adapted from BP Statistical Review of WE and World Bank Development
Indicators. The research was focusing on the year from 1990 to 2011 by using the
panel root test.
On the other hand, Lahiani, Sinha & Muhammad Shahbaz (2018), Omri & Nguyen
(2014), Rafiq & Alam (n.d.), Salim & Rafiq (2012) and Sadorsky (2009)
highlighted that there is a negative relationship between oil price and REC.
According to Lahiani & Muhammad Shahbaz (2018), decrease in oil price will
increase the REC in the long run in Italy. The researchers had used the nonlinear
autoregressive distributed lag (NARDL) model in the research ad get the result
mentioned above. The data used in the research were collected from the Federal
Reserve Bank of St. Louis for the year 1955 to 2014 for G7 countries. Besides that,
Omri & Nguyen (2014) mentioned that REC is affected negatively and significantly

EMPIRICAL ANALYSIS OF RENEWABLE ENERGY CONSUMPTION (REC) IN ASEAN-5
Page 21 of 70
by oil price in the middle-income countries. According to the research, 1% increase
in oil price will decrease the REC by around 0.34%. The research had used the data
for the year 1960 to 2011 and the research had completed by using the dynamic
system-GMM panel model. The data for the 64 countries were all obtained from BP
Statistical Review of WE and EIA. Rafiq & Alam (n.d.) also mentioned that there
is negative relationship between the real oil price and REC in Brazil, China, India,
Indonesia, Philippines and Turkey in the period from 1980 to 2006. The data for the
research were obtained from BP Statistical Review of WE and EIA. The researchers
had used ARDL model in the research. Sadorsky (2009) also found out that real oil
price brings the negative impact the REC in the G7 countries in the year 1980 to
2005. The G7 countries involved Canada, France, Germany, Italy, Japan, United
Kingdom, and United States. The data of the research are adapted from the EIA and
BP Statistical Review of World Energy. The researcher had used the Panel
cointegration estimates to get the result of the research.
On the other hand, Omri & Nguyen (2014) also stated that in low income and higher
income countries show no relationship between real oil price and REC. The research
had used the data for the year 1960 to 2011 and the research had completed by using
the dynamic system-GMM panel model. The data for the 64 countries were all
obtained from BP Statistical Review of WE and EIA.
2.3.6 Trade openness as interaction term
Trade openness as an interaction term in this research is able to bring indirect effect
to REC. Based on Sebri and Ben-Salha (2014), trade openness has a positive
relationship with GDR per capita and REC. This indicates that international trade
is bringing in technology for renewable energy while promoting the growth of
economic. In this research, it had mentioned that there is positive relationship
between CO2 and economic growth. This shows that the increase of development
in economic will bring positive impact to trade openness and will increase CO2
emission.

EMPIRICAL ANALYSIS OF RENEWABLE ENERGY CONSUMPTION (REC) IN ASEAN-5
Page 22 of 70
2.4 Chapter Summary
In this chapter, the theory that can induced all the variables is EKC theory. There is
a few studies in the past researches have proved that GDP per capita, CO2 emission,
oil price and trade openness can be related with this theory. Based on the past
research, all the variables showed either positive, negative or no relationship with
the dependent variable. However, some of the variables showed all the three
relationships or two relationships (positive and negative; positive and no
relationship) according to different researchers in different studies.
EMPIRICAL ANALYSIS OF RENEWABLE ENERGY CONSUMPTION (REC) IN ASEAN-5
Page 23 of 70
CHAPTER 3: METHODOLOGY
3.0 Chapter Introduction
In this chapter, we will define and describe the variables, state the theoretical model
and model estimation and discuss various tests that will be carried out.
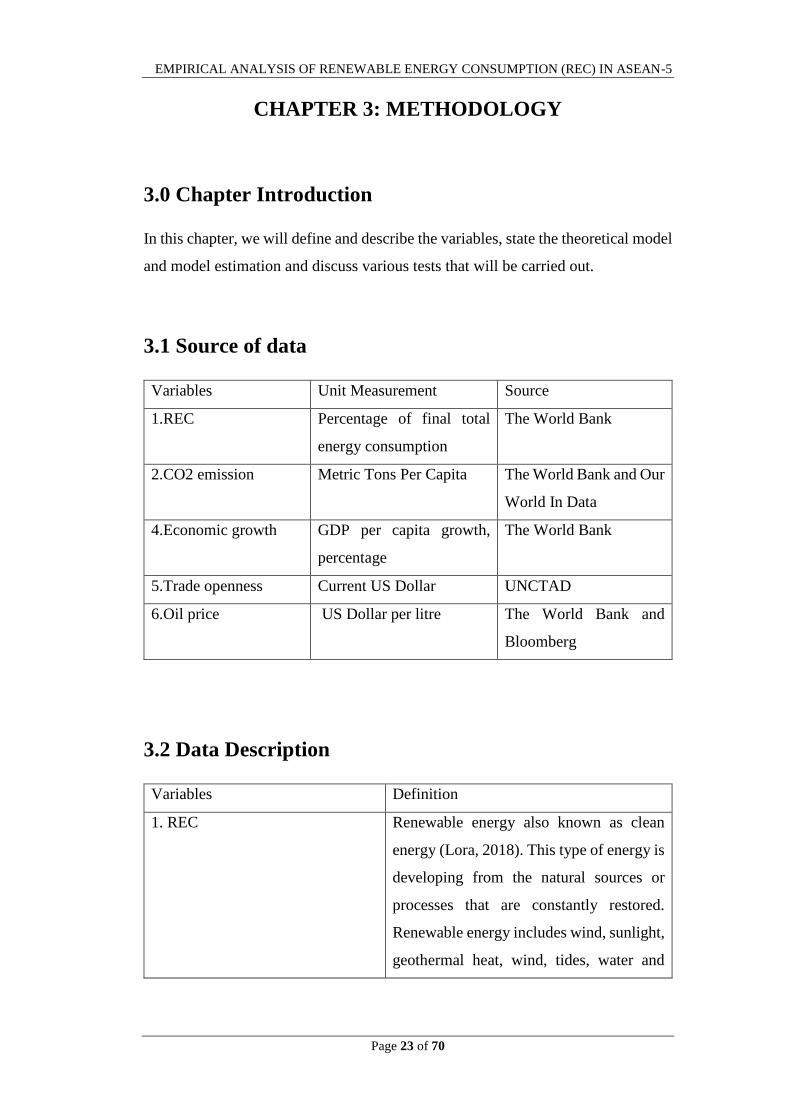
3.1 Source of data
Variables Unit Measurement Source
1.REC Percentage of final total
energy consumption
The World Bank
2.CO2 emission Metric Tons Per Capita The World Bank and Our
World In Data
4.Economic growth GDP per capita growth,
percentage
The World Bank
5.Trade openness Current US Dollar UNCTAD
6.Oil price US Dollar per litre The World Bank and
Bloomberg
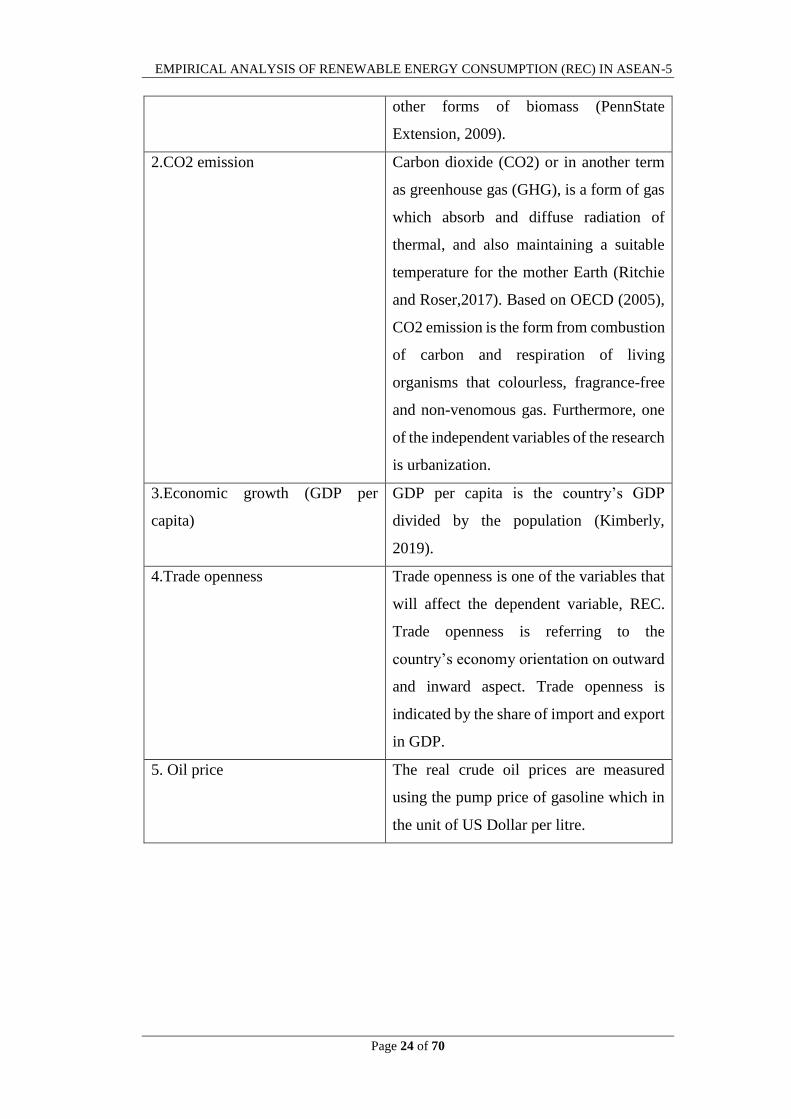
3.2 Data Description
Variables Definition
1. REC Renewable energy also known as clean
energy (Lora, 2018). This type of energy is
developing from the natural sources or
processes that are constantly restored.
Renewable energy includes wind, sunlight,
geothermal heat, wind, tides, water and
EMPIRICAL ANALYSIS OF RENEWABLE ENERGY CONSUMPTION (REC) IN ASEAN-5
Page 24 of 70
other forms of biomass (PennState
Extension, 2009).
2.CO2 emission Carbon dioxide (CO2) or in another term
as greenhouse gas (GHG), is a form of gas
which absorb and diffuse radiation of
thermal, and also maintaining a suitable
temperature for the mother Earth (Ritchie
and Roser,2017). Based on OECD (2005),
CO2 emission is the form from combustion
of carbon and respiration of living
organisms that colourless, fragrance-free
and non-venomous gas. Furthermore, one
of the independent variables of the research
is urbanization.
3.Economic growth (GDP per
capita)
GDP per capita is the country’s GDP
divided by the population (Kimberly,
2019).
4.Trade openness Trade openness is one of the variables that
will affect the dependent variable, REC.
Trade openness is referring to the
country’s economy orientation on outward
and inward aspect. Trade openness is
indicated by the share of import and export
in GDP.
5. Oil price The real crude oil prices are measured
using the pump price of gasoline which in
the unit of US Dollar per litre.

EMPIRICAL ANALYSIS OF RENEWABLE ENERGY CONSUMPTION (REC) IN ASEAN-5
Page 25 of 70
3.3 Econometric Framework
3.3.1 Basic model
Based on Sadorsky (2009), the basic model is formed with the functional form
REC= f (GDP, CDE, OP). The functional form can be expressed in the econometric
model as stated below:
𝑅𝐸𝐶𝑖𝑡 = 𝛽0𝑖𝑡+ 𝛽1𝐺𝐷𝑃𝑖𝑡 + 𝛽2𝐶𝐷𝐸𝑖𝑡 + 𝛽3𝑂𝑃𝑖𝑡 + +𝜀𝑖𝑡
Where REC = REC, measured in % of final total energy consumption
GDP = Economic growth, measured in GDPPC
CDE = CO2 emission measured in metric tons per capita
OP = Oil price, measured in US Dollar per litre
3.3.2 Empirical model 1
The first model for this research will include trade openness variable into basic
model. The functional form can be expressed in the econometric model as stated
below:
𝑅𝐸𝐶𝑖𝑡 = 𝛽0𝑖𝑡+ 𝛽1𝐺𝐷𝑃𝑃𝐶𝑖𝑡 + 𝛽2 log (𝐶𝐷𝐸)𝑖𝑡 + 𝛽3𝑂𝑃𝑖𝑡 + 𝛽4 log (𝑇𝑂)𝑖𝑡 + 𝜀𝑖𝑡
Where REC = Renewable energy consumption, measured in % of final total energy
consumption
GDPPC = Economic growth, measured in GDP per capita growth (%)
CDE = CO2 emission, measured in metric tons per capita
OP = Oil price, measured in US Dollar per litre
TO = Trade Openness, measured in US dollars at current prices in millions
EMPIRICAL ANALYSIS OF RENEWABLE ENERGY CONSUMPTION (REC) IN ASEAN-5
Page 26 of 70
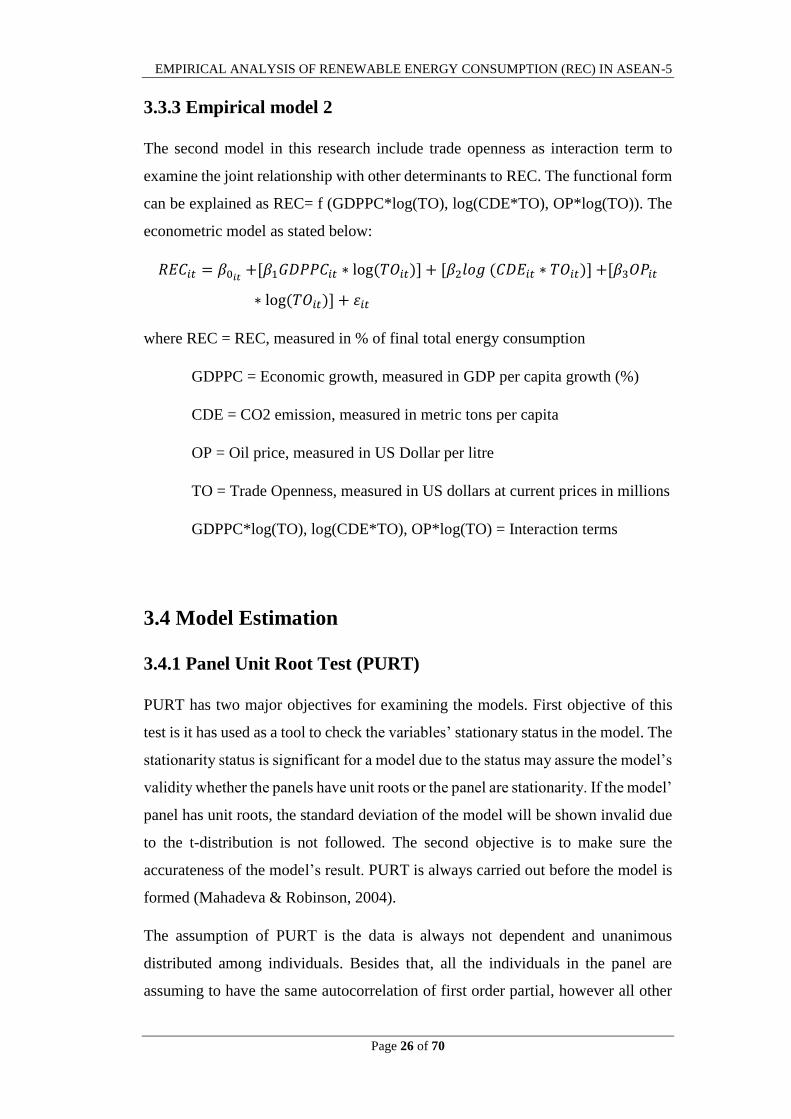
3.3.3 Empirical model 2
The second model in this research include trade openness as interaction term to
examine the joint relationship with other determinants to REC. The functional form
can be explained as REC= f (GDPPC*log(TO), log(CDE*TO), OP*log(TO)). The
econometric model as stated below:
𝑅𝐸𝐶𝑖𝑡 = 𝛽0𝑖𝑡+ [𝛽1𝐺𝐷𝑃𝑃𝐶𝑖𝑡 ∗ log (𝑇𝑂𝑖𝑡)] + [𝛽2𝑙𝑜𝑔 (𝐶𝐷𝐸𝑖𝑡 ∗ 𝑇𝑂𝑖𝑡)] + [𝛽3𝑂𝑃𝑖𝑡
∗ log (𝑇𝑂𝑖𝑡)] + 𝜀𝑖𝑡
where REC = REC, measured in % of final total energy consumption
GDPPC = Economic growth, measured in GDP per capita growth (%)
CDE = CO2 emission, measured in metric tons per capita
OP = Oil price, measured in US Dollar per litre
TO = Trade Openness, measured in US dollars at current prices in millions
GDPPC*log(TO), log(CDE*TO), OP*log(TO) = Interaction terms
3.4 Model Estimation
3.4.1 Panel Unit Root Test (PURT)
PURT has two major objectives for examining the models. First objective of this
test is it has used as a tool to check the variables’ stationary status in the model. The
stationarity status is significant for a model due to the status may assure the model’s
validity whether the panels have unit roots or the panel are stationarity. If the model’
panel has unit roots, the standard deviation of the model will be shown invalid due
to the t-distribution is not followed. The second objective is to make sure the
accurateness of the model’s result. PURT is always carried out before the model is
formed (Mahadeva & Robinson, 2004).
The assumption of PURT is the data is always not dependent and unanimous
distributed among individuals. Besides that, all the individuals in the panel are
assuming to have the same autocorrelation of first order partial, however all other
EMPIRICAL ANALYSIS OF RENEWABLE ENERGY CONSUMPTION (REC) IN ASEAN-5
Page 27 of 70
parameters are allowable to change with ease across individuals in the process of
error (Barbieri, 2009).
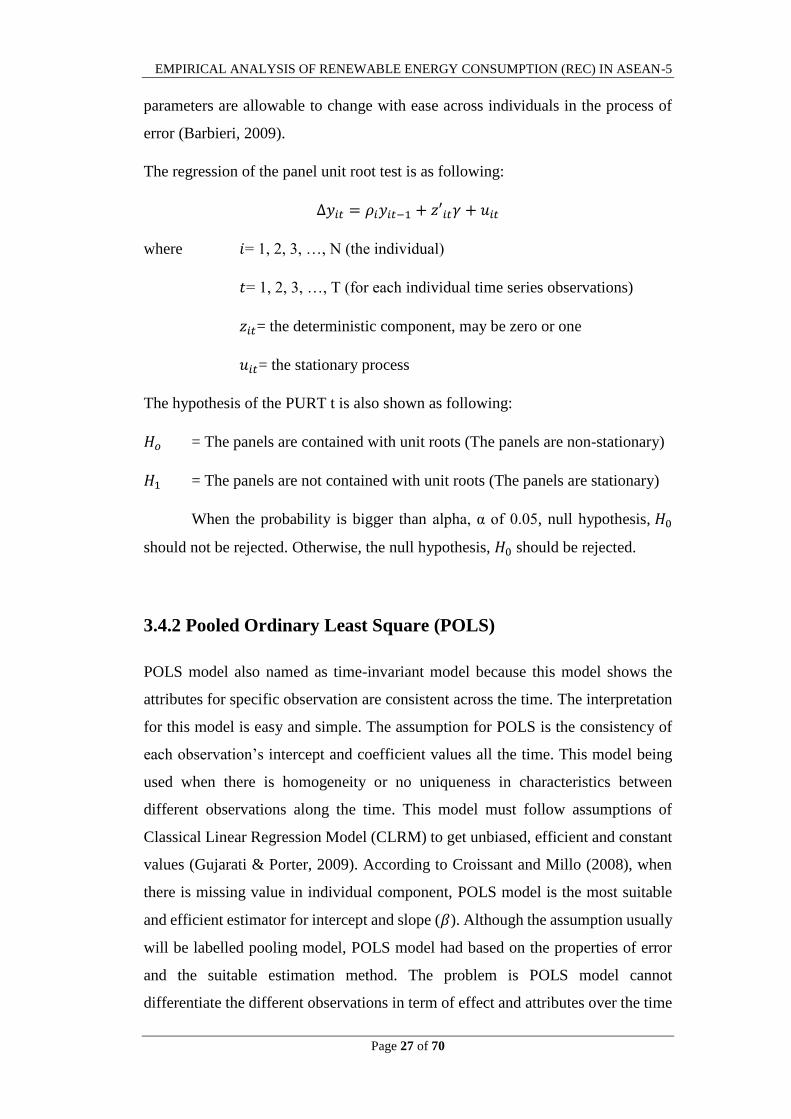
The regression of the panel unit root test is as following:
∆𝑦𝑖𝑡 = 𝜌𝑖𝑦𝑖𝑡−1 + 𝑧′𝑖𝑡𝛾 + 𝑢𝑖𝑡
where 𝑖= 1, 2, 3, …, N (the individual)
𝑡= 1, 2, 3, …, T (for each individual time series observations)
𝑧𝑖𝑡= the deterministic component, may be zero or one
𝑢𝑖𝑡= the stationary process
The hypothesis of the PURT t is also shown as following:
𝐻𝑜 = The panels are contained with unit roots (The panels are non-stationary)
𝐻1 = The panels are not contained with unit roots (The panels are stationary)
When the probability is bigger than alpha, α of 0.05, null hypothesis, 𝐻0
should not be rejected. Otherwise, the null hypothesis, 𝐻0 should be rejected.
3.4.2 Pooled Ordinary Least Square (POLS)
POLS model also named as time-invariant model because this model shows the
attributes for specific observation are consistent across the time. The interpretation
for this model is easy and simple. The assumption for POLS is the consistency of
each observation’s intercept and coefficient values all the time. This model being
used when there is homogeneity or no uniqueness in characteristics between
different observations along the time. This model must follow assumptions of
Classical Linear Regression Model (CLRM) to get unbiased, efficient and constant
values (Gujarati & Porter, 2009). According to Croissant and Millo (2008), when
there is missing value in individual component, POLS model is the most suitable
and efficient estimator for intercept and slope (𝛽). Although the assumption usually
will be labelled pooling model, POLS model had based on the properties of error
and the suitable estimation method. The problem is POLS model cannot
differentiate the different observations in term of effect and attributes over the time
EMPIRICAL ANALYSIS OF RENEWABLE ENERGY CONSUMPTION (REC) IN ASEAN-5
Page 28 of 70
period. When there is heterogeneity occurs in the estimated model, the estimated
value will become biased, inefficient and inconstant. Fixed Effect Model (FEM) or
Random Effect Model (REM) were suggested to apply to solve the problem of
heterogenity.
3.4.3 Fixed Effect Model (FEM)
FEM also known as Least Square Dummy Variable Model which is a regression
model that able to take into account of different characteristics from different
observations with dummy variables. There are three assumption in this model which
are the intercept are different across the dummy variables, slope of independent
variables are same and time variant. The regression of FEM can be written as:
𝑌𝑖𝑡 = ∝1+ ∝2 𝐷2𝑖 + ∝3 𝐷3𝑖 + ⋯ + ∝5 𝐷5𝑖 + 𝛽2𝑋𝑖𝑡 + 𝜀𝑖𝑡
Where 𝐷2𝑖 = 1 if country is Thailand
= 0 if otherwise
𝐷3𝑖 = 1 if country is Indonesia
=0 if otherwise
𝐷5𝑖 = 1 if country is Singapore
=0 if otherwise
𝑋𝑖𝑖 = factor affect REC (eg: Carbon dioxide emission, urbanization and
etc)
𝑡 = 1997-2016
Through FEM, the effect of each dummy variable of different variables is able to
capture. However, there are some limitations in FEM. First, FEM might cause
serious multicollinearity. Second, when there are large number of dummy variables
in model, it will lead to loss of useful information due to reduce in degree of
freedom. Last but not least, FEM might not able to identify impact of sometime-
invariant variables.

EMPIRICAL ANALYSIS OF RENEWABLE ENERGY CONSUMPTION (REC) IN ASEAN-5
Page 29 of 70
3.4.4 Random Effect Model (REM)
REM is adapted to test each observation of sample on their characteristic based on
random error term. While the random error term is to capture different characteristic
from different observation and not affected by time. Differ from FEM, REM is not
included dummy variable. In this model, the potential omitted variable is grouped
and become an independent variable. REM is assuming that the independent
variables are uncorrelated with the cross-sectional error component (Kenneth &
Jennie, 2010). By using REM, the number of unknown parameters will be reduced.
Besides that, there is lower probability of serious multicollinearity problem happen
in model due to reduce of independent variables. The sample equation of REM is
as below:
𝑌𝑖𝑡 = 𝛽1𝑖 + 𝛽2𝑋𝑖𝑡 + 𝑢𝑖𝑡
𝑌𝑖𝑡 = ( 𝛽1𝑖 + 𝜀𝑖) + 𝛽2𝑋𝑖𝑡 + 𝑢𝑖𝑡
𝑌𝑖𝑡 = 𝛽1 + 𝛽2𝑋𝑖𝑡 + 𝜀𝑖 + 𝑢𝑖𝑡
Where 𝛽1 = Intercept’s mean
𝛽2 = Slope of Independent variables
𝑋𝑖𝑡 = Independent variable
𝜀𝑖 = cross sectional error component
𝑢𝑖𝑡 = Cross sectional and time series error component’s combination
3.4.5 Hausman Test
Stephanie (2017) stated that Hausman Test which also known as Hausman
specification test is used in panel model to detect endogenous regressors (predictor
variables). Hausman Test also stated as a test for model misspecification that used
to determine whether FEM or REM should be used. The accuracy of the Hausman
test is a critical issue in panel data analysis. The null hypothesis (H0) is the preferred
model is random effects while the alternate hypothesis (H1) is the model is fixed
effects. The hypothesis testing is shown as below:

EMPIRICAL ANALYSIS OF RENEWABLE ENERGY CONSUMPTION (REC) IN ASEAN-5
Page 30 of 70
H0: The Random Effect Model (REM) is preferable.
H1: The Fixed Effect Model (FEM) is preferable.
This test is to determine whether there is a correlation between the unique errors
and the regressors in the model. The H0 shows that there is no correlation between
the two. If there is no correlation between the regressors and effects, the FEM and
REM are both consistent, however FEM is inefficient as compared to REM. If there
is a correlation, FEM is consistent and REM is inconsistent. Test statistic formula
is stated as below:
H = (βFE - βRE) [ Var (βFE) - Var (βRE) ]-1 - (βFE - βRE)
The decision rule shows that when the probability value (p-value) of H-statistics is
lower than the significance level (0.1/0.05/0.01), the H0 will be rejected. Otherwise,
do not reject H0. If H0 is being rejected, which means the REM is not suitable to use
and FEM is more preferable.
3.4.6 Breusch-Pagan Lagrange Multiplier Test (LM)
LM test statistics is well-known as cross section dependence diagnostic and
sometimes it also known as Breusch-Pagan-Godfrey Test (Stephanie, 2016). It
tested for random effects in a linear model based on POLS residuals. This test is
designed to test random effects depending on the value of the chi-squared. If the
null hypothesis is not rejected, the pooled regression model is appropriate. The null
hypothesis (H0) is the error variances are all equal Var[𝑢𝑡] = 0 while the alternate
hypothesis (H1) is the error variances are not equal Var[𝑢𝑡] ≠ 0. The hypothesis
testing is shown as below:
H0: Variances of error are constant Var[𝑢𝑡] = 0.
H1: Variances of error are not constant Var[𝑢𝑡] ≠ 0.
Firstly, estimate the model 𝑌 = 𝛽0 + 𝛽1𝑋1 + ⋯ + 𝛽𝑘𝛽𝑋𝑘 + 𝑢, then we compute a
𝜎2 =∑𝑢𝑖
2
𝑛 and 𝑃𝑖 =
𝑢𝑖2
𝜎2. In order to test the hypothesis, we need to estimate an
auxiliary model which P and X must linearity correlated, 𝑃 = 𝛽0 + 𝛽1𝑋1 +
𝛽2𝑋2 … + 𝛽𝑘𝛽𝑋𝑘 + 𝑣. Chi-squared critical value, 𝑋2𝛼, 𝑘.

EMPIRICAL ANALYSIS OF RENEWABLE ENERGY CONSUMPTION (REC) IN ASEAN-5
Page 31 of 70
The decision rule shows that when the probability value (p-value) is lower than the
Chi-squared critical value, the H0 will be rejected. Reject the H0 when the Chi-
squared is high. Otherwise, do not reject H0. If H0 is being rejected, which means
the REM is more preferable as compared to pooled OLS estimation.
However, if compare POLS and the panel FEM, with the used of F-statistic, reject
H0 when the F-test value is greater than the probability. Thus, FEM is more
preferable as compared to pooled OLS estimation.
3.4.7 Multicollinearity
Multicollinearity is a situation where two or more independent variables have a
perfect linear relationship between each other in a multiple regression equation. The
result will show large variances when there is multicollinearity in the model. When
there are large variances, the confidence interval will become wider. Other than that,
the coefficients might be poorly estimated, have signs that do not make sense and
the standard errors for the coefficients might be inflated (“Multicollinearity”, n.d.).
Insufficient of data will cause the multicollinearity appears in the model too.
To detect multicollinearity problem, Variance Inflation Factor (VIF) was suggested
to carry out. VIF is a method which can analyse the correlation between the
independent variables. The formula of VIF is illustrated as below:
𝑉𝐼𝐹 = 1
1 − 𝑅2
The 𝑅2 that stated in the formula is the coefficient of correlation between the 2
independent variables. VIF is started with the number of 1 and it has no upper limit.
There is no correlation between the independent variables when the value of VIF
equivalent to 1. While there is a moderate correlation between the variables when
VIF’s value less than 10 means that. When the VIF’s value that greater to 10 and
the R-squared value is more than means that the correlation between the
independent variables in the model is critical. Therefore, it will affect the poor
estimation of coefficients and the p-values are controversial. The other way to detect
the multicollinearity problem is the tolerance value (TOL). The formula of TOL is
as below:

EMPIRICAL ANALYSIS OF RENEWABLE ENERGY CONSUMPTION (REC) IN ASEAN-5
Page 32 of 70
𝑇𝑂𝐿 = 1
𝑉𝐼𝐹
TOL is the inverse of VIF. When the value of TOL is near to zero, it indicates that
the independent variable is highly correlated with the rest of the independent
variables and vice versa.
Multicollinearity problem can be solved by increasing the sample size. When the
data increased, the intensity of collinearity can be lowered down due to the
decreasing of standard errors. Furthermore, multicollinearity problem can be solved
by using the ridge regression. Ridge regression can be used to analyse the multiple
regression data that suffer from multicollinearity. Ridge regression does not require
unbiased estimators and it adds just enough bias to make the estimates
reasonably reliable approximations to true population values (Stephanie, 2017).
Last but not least, the multicollinearity problem can be solved by combining the
time-series and cross-sectional data as well as used the information from prior
research.
3.4.8 Normality test
This test is used to determine whether sample data has been drawn from a normally
distributed population (within some tolerance) (“Normality Test”, n.d.). The result
is not reliable if the normality assumption is not valid. The function of Jarque-Bera
test (JB test) is to detect the normality of the residual which testing the residual is
normally distributed or not.
Others normality test become unreliable when the sample size is large, thus JB test
was used when there is a large data set. A goodness-of-fit test is defined by whether
sample data have the skewness and kurtosis that are matching a normal distribution.
The formula for JB test is mentioned as below:
𝐽𝐵 = 𝑛[𝑆2
6+
𝑘2
24]
The n stated in the formula is the sample size of the observations, whereas s is the
skewness and k is the kurtosis. The null hypothesis (H0) of JB test is addressing as
the error term is normally distributed and the alternative hypothesis (H1) is
addressing as the error term is not normally distributed. For the decision rule, the

EMPIRICAL ANALYSIS OF RENEWABLE ENERGY CONSUMPTION (REC) IN ASEAN-5
Page 33 of 70
researchers have to state as reject the H0 if the JB test statistics is greater than the
critical value at the significant level of 1%, 5% or 10%, otherwise do not reject H0.
Then, check the p-value. Lastly, the make the decision of rejecting the H0 if the p-
value is less than the JB test statistic. The researchers must always check the p-
value. This is because a small p-value and a large chi-squared value meant that we
can reject the H0 and means that the data is normally distributed.
3.5 Chapter summary
This paper had provided the basic model and extension model for dependent and
independent variables. Next, we had discussed definition of variables and sources
of getting data of variables. We also discussed various tests which are PURT, POLS,
FEM, REM that will be carried out to examine the estimated model. In diagnostic
checking, we had stated the definition of each test, method to detect and solution
for multicollinearity problem. Multicollinearity problem can be detected by using
VIF and TOL. The solution for multicollinearity problem is decrease the standard
error through increase the sample size. Lastly, JB test had been used to test
normality of residual for testing the normality of model.

EMPIRICAL ANALYSIS OF RENEWABLE ENERGY CONSUMPTION (REC) IN ASEAN-5
Page 34 of 70
CHAPTER 4: DATA ANALYSIS
4.0 Introduction
This chapter will discuss the result that ran for all test from Chapter 3, and compare
the final result for both test in order to find out the suitable model.
4.1 Panel Unit Root Test (PURT)
Panel Unit Root Test is the usually way for researchers applied to examine for panel
data. It is used to test for the its stationarity. If the variable is not stationary, it will
cause pseudo regression problem which the result is pointless although there are
high significant t-ratios and high 𝑅2. In Eview, there are few types of Panel Unit
Root Test currently supported, and Levin, Lin, and Chu (LLC) tests is being
selected in our study. This test is carried out by using unit root on the level and
include in test equation of individual intercept. The null hypothesis for this test is
there is contain of unit root in panel variable whereas the alternative hypothesis is
there is no unit root (stationary) contain in panel variable. The decision rule for LLC
test is to reject null hypothesis when p-value is less than 1%,5% and 10% significant
levels. Null hypothesis being rejected means that there is stationary and no unit root
in the variable.
Result for model 1 in table 4.1 showed that all variables are significant at 1% in the
level form except CDE which is significant at 5% in the level form. On the other
side, model 2 (interaction terms model), showed that all interaction variables are
significant at level 1% in the level form. In conclusion for this, the result showed in
both models are stationary as they are all stationary at 1%, 5% or 10% significant
level in the level form.

EMPIRICAL ANALYSIS OF RENEWABLE ENERGY CONSUMPTION (REC) IN ASEAN-5
Page 35 of 70
Table 4.1: Panel Unit Root Test
Model
Variables
Levin, Lin & Chu t*
Individual Intercept and Trend
Level
Model 1 REC
GDPPC
LOG (CDE)
OP
LOG (TO)
-5.25772***
(0.0000)
-3.88038***
(0.0001)
-2.01963**
(0.0217)
-2.86644***
(0.0021)
-2.70755***
(0.0034)
Model 2 REC
GDPPC*LOG(TO)
LOG (CDE*TO)
OP*LOG(TO)
-5.25772***
(0.0000)
-4.12384***
(0.0000)
-3.05921***
(0.0011)
-2.72846***
(0.0032)
Notes: The asterisks *, **, and *** implies that the rejection of the null hypothesis
of non-stationary at 10%, 5%, and 1% significance level respectively.
4.2 Panel Data Models
4.2.1 Pooled OLS
The result of POLS model shows that the R-squared ( 𝑅2) of Model 1 is 0.796489
or known as 79.65% of the variation in dependent variable is explained by the
variation in all independent variables. When 𝑅2 equal to 1, it means a perfect fit.

EMPIRICAL ANALYSIS OF RENEWABLE ENERGY CONSUMPTION (REC) IN ASEAN-5
Page 36 of 70
Hence, it indicates that this is model has high goodness of fit as it is quite close to
perfect fit. The independent variables such as GDP is significant at 10% significant
level while CDE, OP and TO is significant at all significant level.
Besides, the result of POLS of Model 2 in Table 4.3 shows that the 𝑅2 is 0.68. It
means that there is 68.00% of variable in dependent variable is explained by the
variation in all the independent variables. TO multiply CDEs and TO multiply OP
are significant at all significant level. TO multiply the GDPPC is insignificant at all
significant level.
4.2.2 FEM
According to the FEM model’s result in Table 4.2, FEM model has the greatest
adjusted R-squared among the POLS model and REM model. The FEM model has
the value of 0.963435 in adjusted R-squared. The GDPPC, CDE, OP and TO are
showing the p-value of 0.5770, 0.9228, 0.0001 and 0.000 respectively. There are
two independent variables have remained statistically insignificant as their p-value
are higher than their level of significant of 10%, 5% and 1%, which are GDPPC and
CDE. In short, the p-value are larger than the significant level of 10%, 5% and 1%,
therefore there are sufficient evidence to conclude that GDPPC and CDE are
statistically insignificance. On the other hand, OP and TO are statistically
significance as its p-value 0.0000. In short, there are sufficient evidence to conclude
that OP and TO is statistically significance as its p-value is smaller than the
significance level of 10%, 5% and 1%.
Based on Table 4.3, the FEM model has the greatest adjusted R-squared among the
POLS model and the REM model. The FEM model has the value of 0.960800 of
adjusted R-squared. In the FEM model, the gross domestic product (GDP) interact
with TO showed a p-value of 0.4687. The independent variable has remained
statistically insignificant because the p-value is greater than the level of significant
of 10%, 5% and 1%. On the other hand, the CDEs (CO2) interact with TO and OP
(OP) interact with TO are statistically significance as their p-value 0.0000 and
0.0001 respectively. In short, there are sufficient evidence to conclude that CO2

EMPIRICAL ANALYSIS OF RENEWABLE ENERGY CONSUMPTION (REC) IN ASEAN-5
Page 37 of 70
interact with TO and OP interact with TO are statistically significance as their p-
value are lower than the significance level of 10%, 5% and 1%.
4.2.3 REM
From result of REM model in Table 4.2, the adjusted R squared of 0.789411 is equal
to POLS model but lower than FEM model. The GDP, CO2, OP and TO are
showing the p-value of 0.0000. In short, there are sufficient evidence to conclude
that all four variables are statistically significance as their p-value are lower than
the significance level of 10%, 5% and 1%.
According to Table 4.3, REM model displayed that its adjusted R squared of
0.725403 is greater than the POLS model’s adjusted R squared. However, in REM
model, there is an independent variable with interaction term has consisted a
different sign from theoretical expectation which is GDPPC interact with TO. The
GDPPC interact with TO is showing a p-value of 0.4711. In short, there is an
insufficient evidence to conclude that the variable is statistically significance as its
p-value higher than the significance level of 10%, 5% and 1%. On the other hand,
the remaining two variables which are CDE interact with TO and OP interact with
TO are statistically significant. These are due to their p-value of 0.0000 and 0.0001
respectively are lower than the significance level of 10%, 5% and 1%. To conclude
the that the two variables are statistically significant, their p-value is smaller than
the three significant levels.
Table 4.2: Panel Data Models for Model 1
Model 1
POLS FEM REM
C -10.73879
(0.5695)
144.6781***
(0.0000)
-10.73879
(0.1888)
GDPPC 0.358318*
(0.0838)
-0.052536
(0.5770)
0.358318***
(0.0001)
LOG (CDE) -21.64848***
(0.0000)
-0.317825
(0.9228)
-21.64848***
(0.0000)
OP -8.331844***
(0.0058)
6.930374***
(0.0001)
-8.331844***
(0.0000)

EMPIRICAL ANALYSIS OF RENEWABLE ENERGY CONSUMPTION (REC) IN ASEAN-5
Page 38 of 70
LOG (TO) -5.056720***
(0.0051)
-10.08106***
(0.0000)
5.056720***
(0.0000)
R-squared
Adjusted R-
squared
D-W test stat
0.796489
0.789411
0.091515
0.963435
0.960800
0.312814
0.796489
0.789411
0.091515
Notes: The asterisks *, **, and *** implies that the rejection of the null hypothesis
at 10%, 5%, and 1% significance level respectively.
Table 4.3: Panel Data Models for Model 2
Model 2
POLS FEM REM
C 141.8663***
(0.0000)
115.6307***
(0.0000)
116.2093
(0.0000)
GDPPC*LOG
(TO)
0.021848
(0.3312)
-0.005867
(0.4687)
-0.005834
(0.4711)
LOG (CDE*TO) -9.454418***
(0.0000)
-7.145106***
(0.0000)
-7.169159
(0.0000)
OP * LOG (TO) 0.649138***
(0.0067)
0.486668***
(0.0001)
0.490784
(0.0001)
R-squared
Adjusted R-
squared
D-W test stat
0.679975
0.671698
0.043430
0.963290
0.960995
0.278015
0.732325
0.725403
0.274734
Notes: The asterisks *, **, and *** implies that the rejection of the null hypothesis
at 10%, 5%, and 1% significance level respectively.
4.3 Model Comparison
4.3.1 Model 1
From LR test, we can find out the test statistic is 130.3611 and p-value is 0.0000,
which can conclude as significant. Because H1 is accepted at significant level of
0.01, 0.05 and 0.1. Hence, FEM is suitable model compared to POLS. In LM test,
the test statistic found was 530.1207 and p-value is 0.000. And the H0 is rejected
since the p-value is significant. From above result, we can conclude that REM is

EMPIRICAL ANALYSIS OF RENEWABLE ENERGY CONSUMPTION (REC) IN ASEAN-5
Page 39 of 70
preferable compared to POLS. In short, we can know that FEM and REM is
preferable compared to POLS.
To test which model is more preferable between FEM and Rem, Hausman test had
performed. From Hausman test, the result show that test statistic is 506.794673 and
p-value is 0.000. Therefore, reject H0 to conclude that REM is more suitable than
FEM. In conclusion, REM was the best model for panel data for REC.
4.3.2 Model 2
To compare POLS model and FEM model, Likelihood Ratio (LR) had tested. From
Table 4.5, the test statistic for LR test was 83.54051 with p-value of 0.0000.
Therefore, H0 is being rejected at 10% (0.1), 5% (0.05) and 1% (0.01) of significant
level. There is sufficient evidence to conclude that FEM model is suitable model
compared with POLS model. LM test, which compare POLS model and FEM
model showed the test statistic was 1024.578 and p-value was 0.0000. The H0 is
rejected at significant of 0.1, 0.05 and 0.1. Therefore, we can conclude that REM
model is model that desired compared to POLS model.
From LR and LM test, FEM model and REM model are preferable for Model 2.
Therefore, Hausman test tested to find out which more suitable for Model 2. From
Table 4.5, the test statistic was 0.729269 and p-value is 0.8663. The H1 is accepted
since p-value is insignificant. Therefore, we can conclude that REM model is
preferable to Model 2 compare to FEM model.
Table 4.4: Model Comparison for Model 1
Model 1
LR Test LM Test Hausman Test
TS 130.3611***
(0.0000)
530.1207***
(0.0000)
506.794673***
(0.0000)
DM Reject null
hypothesis
Reject null
hypothesis
Reject null
hypothesis
Conclusion FEM is preferable
REM is preferable FEM is preferable
Notes: The asterisks *, **, and *** implies that the rejection of the null hypothesis
at 10%, 5%, and 1% significance level respectively.

EMPIRICAL ANALYSIS OF RENEWABLE ENERGY CONSUMPTION (REC) IN ASEAN-5
Page 40 of 70
Table 4.5: Model Comparison for Model 2
Model 2
LR Test LM Test Hausman Test
TS 83.54051***
(0.0000)
1024.578***
(0.0000)
0.729269
(0.8663)
DM Reject null
hypothesis
Reject null
hypothesis
Do not reject
null hypothesis
Conclusion FEM is preferable REM is preferable REM is
preferable
Notes: The asterisks *, **, and *** implies that the rejection of the null hypothesis
at 10%, 5%, and 1% significance level respectively.
4.4 Diagnostic Checking
4.4.1 Multicollinearity
In addition, Variance Inflation Factors (VIF) is used to detect multicollinearity
problem. Based on Eviews result for Model 1, under the Centered VIF, we can see
that the variables in Model 1 have the Centered VIF that less than 10. Therefore,
we can conclude that Model 1 has no multicollinearity problem. Other than that,
based on the Eviews result for Model 2, under the Centered VIF, we can see that
the independent variables of Model 2 have the Centered VIF that less than 10.
Therefore, we can conclude that Model 2 has no multicollinearity problem.
4.4.2 Normality
Moreover, the Jarque-Bera test (JB test) had ran for normality test. Based on result
for Model 1, the test statistic is 3.362264 and the probability is 0.186163. From the
probability shown, we can conclude that the null hypothesis rejected due to the
probability (0.186163) is larger than 0.05. Therefore, the error term in Model 1 is
normally distributed. Furthermore, the result of Model 2 showed the test statistic is
5.027705 and the probability is 0.080956. From the probability shown, we can
conclude that we should not reject the null hypothesis due to the probability

EMPIRICAL ANALYSIS OF RENEWABLE ENERGY CONSUMPTION (REC) IN ASEAN-5
Page 41 of 70
(0.080956) is greater than 0.05. Therefore, the error term in Model 2 is normally
distributed.
4.5 Discussion
In Model 1, the real sign for OP was positive which consistent with our expected
sign. The positive relationship between OP and REC was proven by Omri, Daly &
Ngugen (2015). Meanwhile, CDE, GDPPC and TO have negative sign. Lahaini,
Sinha & Muhammad Sbahbaz (2018) and Sebri & Salha (2014) was prove that there
is a negative relationship between CDE and REC. While the negative relationship
between GDPPC and REC was justified in Askar (2016). Lastly, negative
relationship between TO and REC was supported in Sebri & Salha (2014). In Model
2, we found out there is positive relationship between OP*LOG(TO) and REC.
Besides that, there is an inverse relationship between GDPPC*LOG (TO) and
LOG(CDE*TO) with REC respectively.
4.6 Conclusion
In short, all variables were stationary in both models. The suitable model for Model
1 is FEM model, while REM model for Model 2. There were no multicollinearity
problem and the error terms are normally distributed in both models.

EMPIRICAL ANALYSIS OF RENEWABLE ENERGY CONSUMPTION (REC) IN ASEAN-5
Page 42 of 70
CHAPTER 5: CONCLUSION
5.1 Summary of Finding
This research is studying on the impact of economic growth, CO2 emission, trade
openness and oil price to the REC from the period 1991-2015 among the countries
of ASEAN-5 which are Malaysia, Thailand, Indonesia, Philippine, and Vietnam.
First of all, there are several tests have been carried out in our research which are
panel unit root test, POLS, FEM, REM, LR, LM, Hausman test, VIF test and JB
test. For panel unit root test, both models are stationary at 1%, 5% and 10%
significant level in the level form. On the other hand, model 2 which is the
interaction terms model give a result of all interaction variables are significant at
level 1% in the level form.
To test the best model for Model 1 and Model 2, LR test and LM test was carried
out and showed that POLS is not preferable as compared to FEM and REM for both
models. In comparison of FEM and REM, the Hausman test showed a result of
REM is the best model for model 1 while FEM is the best model for Model 2. After
performing multicollinearity test, the result proved that model 1 and model 2best
have no multicollinearity problem as both of the values in Centered VIF are less
than 10. Meanwhile, model 1 and model 2 are normally distributed in the JB test.
5.2 Implication of Study
5.2.1 Low Carbon Cites Framework (LCCF)
In September 2011, Malaysia was established Low Carbon Cites Framework
(LCCF). LCCF is a framework and assessment system to lead Malaysia cities
become low carbon cities. The objectives of LCCF are measure the real carbon
emission of the cities, guide local government in building a low carbon city and
attract attention of Malaysian toward the concept of low carbon cities (Green Tech
Malaysia, 2019). In July 2019, Green Tech Malaysia was launching Low Carbon
Cities 2030 which aim to reduce 40% of carbon emission by 2030 (Khoo, 2019).

EMPIRICAL ANALYSIS OF RENEWABLE ENERGY CONSUMPTION (REC) IN ASEAN-5
Page 43 of 70
To achieve this goal, Green Tech Malaysia was taken action by install solar panels
and the panels can generate up to 6,130kwh of clean energy of month. Although
overall of REC in Malaysia from 1992-2015 had decreased, however, start from
2011 there was an increasing trend of REC in Malaysia. Last but not least, launching
of LCCF also created awareness of Malaysia citizen and organization in building
green and better environment, there was increase of 7.1% licensed capacity for
renewable energy from 2015 to 2016 (Azlina Hashim, n.d.). We believe that the
implementation of LCCF able to increase the consumption of renewable energy in
long term. This is because the major contributor of carbon dioxide is non-renewable
energy and to lower the carbon emission, switching of non-renewable energy to
renewable energy was a best choice in long term.
5.2.2 Subsidy Reform Policy
The Subsidy Reform Policy can be defined as when the Government decided to
reallocate or abolish the subsidies to the country’s goods and services. Among the
list of the subsidies in a country, the energy subsidy is one of the major burdens for
a country. According to Asamoah, Hanedar and Shang (2017), the energy subsidies
are costly which cause the country’s public debt become greater or cut out the
productive of public spending. Besides, the energy subsidy may bring damage to
the nature environment, for example, when the subsidy of oil increase, will cause
people to consume more on oil and then the CO2 emission will increase. At the end,
the environment got affected. Therefore, the Subsidy Reform policy is able to solve
the energy subsidy problem in short or medium term.
Knowing that, the Subsidy Reform policy is able to affect the oil price and lead to
the consumption of renewable energy in the country. In Malaysia, the government
does implement the subsidy reform policy on the subsidies for petrol, liquefied
petroleum gas (LPG) and diesel in the year of 2010 (The Star Online, 2010). The
Prime Minister’s office announced that the subsidy reform is part of the gradual
subsidy rationalization program. First, the subsidy for diesel and RON95 had been
decreased by RM0.05 per litre while the subsidy for RON97 was removed. Besides,
the subsidy of LPG had also decreased by RM0.10 per kilogram.

EMPIRICAL ANALYSIS OF RENEWABLE ENERGY CONSUMPTION (REC) IN ASEAN-5
Page 44 of 70
When the energy subsidies were reforming, the price of the oil and gas will increase
and the people have to pay more on consuming the oil. Since the renewable energy
is considered an alternative of the oil, people will search for a cheaper price of
energy sources to consume it which is the renewable energy. Therefore, the REC
will increase and the damage caused to the environment will be decreased too. Last
but not least, Johansson and Goldemberg (2002) mentioned that the Subsidy
Reform policy is one of the best policy options in promoting REC.
5.2.3 Trade Policy
Trade policy is the law applicable to the exchange of internationally exchanged
goods or services, including subsidies, tariffs and import or export regulations
(Business Dictionary, 2019). Trade policy also known as commercial policy. This
policy directly influences the movement of trading goods and services. According
to Thanawat, Peng, Liang and Yao (2013), the trade openness and economic growth
have a positive relationship. When the trade openness increase in the countries, the
growth of the economy will become faster. When the countries tighten the trade
policy, the countries’ economy will be benefited (Rodrik, Subramanian & Trebbi,
2004 and Rodriguez & Rodrik, 2001 as cited in Thanawat, Peng, Liang & Yao,
2013). There are various types of trade policies, including national trade policy,
bilateral trade policy and international trade policy. By applying the trade policy,
the production and the consumption between nations has no restriction. Trade
policy has an important character in the economic conditions, but trade alone cannot
address all of the socio-economic and political challenges that influence the
economics. For instance, Malaysia, one of the members of ASEAN countries and
one of the world’s most open economies, the trade is equal to 130% of the GDP
(export.gov, n.d.). The trade policy of Malaysia is tolerant and translucent. The
trade policy has contributed 5% to the economic growth over the past few years.
The trade policy has an impact on the REC in an indirect way. When the trade policy
has been tightened by the government, the economic growth will increase, the
income of the public increase, thus, the usage of REC will increase. If the other
ASEAN countries apply the trade policy too, the economic growth of the countries
will increase too and this will lead to an increase of the usage of renewable energy.

EMPIRICAL ANALYSIS OF RENEWABLE ENERGY CONSUMPTION (REC) IN ASEAN-5
Page 45 of 70
5.3 Limitation
Furthermore, this research had recognized some weaknesses. First of all, there is
insufficient data for our research. In this research, the time period that have been
taken into account is year 1991 to 2015. The reason we take this time period is
because the data for the renewable energy consumption for some countries that
before and after this time period is missing. Other than this, the issues for the
variable is difficult to get too. Due to these reasons, we decided to do the research
for the year 1991 to 2015. Other than that, the proxy for oil price that we have used
in this research is pump price of gasoline which have the unit measurement of US
Dollar per litre. For most of the researches, the proxy of oil price will be US Dollar
per barrel. The reason that we do not follow the proxy as the most of the researches
is because there is insufficient data in the website as well as Bloomberg. Besides,
some of the websites contain charges. Therefore, it is hard for us to use US Dollar
per barrel as the proxy of oil price in this research.
.
5.4 Recommendation
For the future researches, it is suggested that the respective department need to
update the data of renewable energy consumption. This is to ease the researchers
and can come out with a more accurate forecast. Once the researchers have a
complete and reliable data, the results will be more accurate. Furthermore, when the
respective department release the updated data, the government can produce more
effective ways or schemes to increase the usage of renewable energy. When the
usage or renewable energy increases, the country will have lesser carbon dioxide
emission. Meanwhile, the air pollution of the country will reduce too.

EMPIRICAL ANALYSIS OF RENEWABLE ENERGY CONSUMPTION (REC) IN ASEAN-5
Page 46 of 70
Reference
Agarwal, P. (2020). The Environmental Kuznets Curve. Retrieved February 28,
2020 from, https://www.intelligenteconomist.com/kuznets-curve/
Amadeo, K. (2019). GDP Per Capita with its Formula and Country Comparisons.
Retrieved 26 June 2019, from https://www.thebalance.com/gdp-per-capita-
formula-u-s-compared-to-highest-and-lowest-3305848
Anderson, A. (2015, October 19). Will Lower Oil Prices Affect Renewable
Penetration? Retrieved from https://energywatch-inc.com/will-lower-oil-
prices-affect-renewable-penetration/
Anton, S.G., & Nucu, A.E.A. (2020). The effect of financial development on
renewable energy consumption. A panel data approach. Renewable
Energy, 147, 330-338.
Asamoah, A., Hanedar, E., & Shang, B. (2017, June 12). Energy subsidy
reform: Difficult yet progressing. Retrieved from
https://voxeu.org/article/energy-subsidy-reform-difficult-yet-progressing
ASEAN Plan of Action on Science, Technology, and Innovation for 2016-2025.
(2017). Retrieved 6 June 2019, from https://asean.org/storage/2017/10/01-
APASTI-2016-2025-FINAL.pdf
Askar, B. G. (2016). The determinants of renewable energy consumption:
An empirical analysis for the Balkans. European Scientific Journal,
12(11), 594-607.
Azlina Hashim. (n.d.). A case for renewable energy in Malaysia. Malaysian Green
Technology Corporation. Retrieved 16 February 2020, from
https://www.lccf.my/a-case-for-renewable-energy-in-malaysia/
Bank Negara Malaysia. (2009). Retrieved 26 June 2019,
from http://www.bnm.gov.my/files/publication/ar/en/2009/cp01.pdf
Barbieri, L. (2009). Panel unit root tests under cross-sectional dependence: An
overview. Journal of Statistics: Advances in Theory and Applications, 1(2),
117-158.
Bayar, T. (2011, September 16). Malaysia Explores Its Renewables Options.
Retrieved from
https://www.renewableenergyworld.com/articles/print/volume-14/issue-
5/solar-energy/malaysia-explores-its-renewables-options.html

EMPIRICAL ANALYSIS OF RENEWABLE ENERGY CONSUMPTION (REC) IN ASEAN-5
Page 47 of 70
Breu, M., Castellano, A., Frankel, D., & Rogers, M. (2019, January). Exploring
an alternative pathway for Vietnam's energy future. Retrieved from
https://www.mckinsey.com/featured-insights/asia-pacific/exploring-an-
alternative-pathway-for-vietnams-energy-future
Boufateh, T. (2018). The environmental Kuznets curve by considering
asymmetric oil price shocks: evidence from the top two.
Business Dictionary. (n.d.). Trade Policy. Retrieved
from http://www.businessdictionary.com/definition/trade-policy.html
Chen, S.H. (2019). The Diplomat. Thailand’s Renewable Energy Transitions:
A Pathway to Realize Thailand 4.0. Retrieved 25 June 2019, from
https://thediplomat.com/2019/03/thailands-renewable-energy-transitions-a-
pathway-to-realize-thailand-4-0/
Chen, Y.L. (2018). Factor influencing renewable energy consumption in China:
An empirical analysis based on provincial panel data. Journal of Cleaner
Production, 174, 605-615.
Chu, M. M. (2019, May 14). Malaysia can generate more electricity if all roofs
use solar panels, says Yeo. pp. 1–3. Retrieved 6 January 2020, from
https://www.thestar.com.my/news/nation/2019/05/14/malaysia-can-
generate-more-electricity-if-all-roofs-use-solar-panels-says-yeo/
Coca, N. (2018, December 6). The most important country for the global climate
no one is talking about. Retrieved from https://www.vox.com/energy-and-
environment/2018/12/5/18126145/indonesia-climate-change-deforestation
Croissant, Y., & Millo, G. (2008). Panel data econometrics in R: The plm
package. Journal of Statistical Software, 27(2).
Eren, B.M., Taspinar, N., & Gokmenoglu, K.K. (2019). The impact of
financial development and economic growth on renewable energy
consumption: Emperical analysis of India. Science of the total
environment, 663, 189-197.
Export.gov. (n.d.) Retrieved
from
https://2016.export.gov/malaysia/doingbusinessinmalaysia/eg_my_072633
.asp
Foo, N. (2015). Falling Crude Oil Prices: The impact on the economy of the

EMPIRICAL ANALYSIS OF RENEWABLE ENERGY CONSUMPTION (REC) IN ASEAN-5
Page 48 of 70
Asia-Pacific region. International Association for Energy Economics. 31-
33.
Foy, H., Sheppard, D., & Raval, A. (2020, March 18). Oil prices hit lowest level in
17 years as demand plunges. Retrieved from
https://www.ft.com/content/d63d0618-6928-11ea-800d-da70cff6e4d3
Gan, S. K., & Lim, M. M. H. (2010). The impact of the global financial crisis:
The case of Malaysia. Third World network (TWN).
Greenemeier, L. (2010, September 28). Crude alternatives: Energy
industry heavyweights debate fuels of the future. Retrieved from
https://www.scientificamerican.com/article/fuels-of-the-future/
Green Tech Malaysia. (2019). Building a low-carbon metropolis. Retrieved 16
February 2020, from https://www.greentechmalaysia.my/building-a-low-
carbon-metropolis/
Gujarati, D.N., & Porter, D.C. (2009). Basic econometrics. (5th ed.). Boston,
MA: McGraw-Hill/Irwin.
Hou, Z.B., Jodie, K., Jane,K. & Dirk, W.T.V. (2015). The Oil Price Shock of
2014. Drivers, Impacts and Policy Implications. Oversea Development
Institute.
IndexBox. (2019, September). Global Coconut Oil Market 2019 - the
Philippines Continues to Dominate Production and Trade. 3–5. Retrieved
5 January 2020 from https://www.globaltrademag.com/global-coconut-oil-
market-2019-the-philippines-continues-to-dominate-production-and-trade/
Indonesia 2019 biodiesel exports to rise. (2019, May 2). pp. 1–3. Retrieved 6
January 2020, from https://www.thestar.com.my/business/business-
news/2019/05/03/indonesia-2019-biodiesel-exports-to-rise/
Indonesia to boost use of renewable energy. (2020, January 31). pp. 1–3.
Retrieved
6 January 2020, from
https://www.thestar.com.my/news/regional/2020/01/31/indonesia-to-
boost-use-of-renewable-energy
IRENA Quarterly. (2017). Retrieved 24 July 2019, from
https://www.irena.org/-
/media/Files/IRENA/Agency/Quarterly/IRENA_Quarterly_2017_Q4.pdf

EMPIRICAL ANALYSIS OF RENEWABLE ENERGY CONSUMPTION (REC) IN ASEAN-5
Page 49 of 70
Johansson, T. B., & Goldemberg, J. (Eds.). (2002). Energy for
sustainable development: a policy agenda. United Nations Publications.
Kåberger, T. (2018). Progress of renewable electricity replacing fossil fuels. Global
Energy Interconnection, 1(1), 48-52.
Kamaruddin Abdullah. (2005). Renewable energy conversion and utilization
in ASEAN countries. Energy, 30(2-4), 119–128.
Katircioglu, S. (2017). Investigating the Role of Oil Prices in the Conventional EKC
Model: Evidence from Turkey. 7(5), 498–508. Retrieved February 28,
2020 from, https://doi.org/10.18488/journal.aefr/2017.7.5/102.5.498.508
Keman, H. (2013, June 04). Economic openness. Retrieved 6 December
2019, from https://www.britannica.com/topic/economic-openness
Kenneth, A. B., & Jennie, E.B. (2010). A general panel data with random and
fixed effects: A structural equations approach. Social Forces. 89(1), 1-34.
Retrieved from https://www.ncbi.nlm.nih.gov/pmc/articles/PMC3137523/
Khoo, E. (2019). Malaysia continues efforts to reduce carbon footprint. The Edge
Malaysia. Retrieved 16 February 2020, from
https://www.theedgemarkets.com/article/malaysia-continues-efforts-
reduce-carbon-footprint
Kimberly, A. (2019). Crude Oil, Its Types, Uses, and Impact. How It
Affects Everything You Buy. Retrieved from
https://www.thebalance.com/crude-oil-prices-trends-and-impact-on-
theeconomy-and-you-3305738
Lahiani, A., Sinha, A. & Muhammad Shahbaz. (2018). Renewable
energy consumption, income, CO2 emissions and oil prices in G7
countries: The importance of asymmetries. The Journal of Energy and
Development, 43(1), 157-191.
Lin, B., & Moubarak, M. (2014). Renewable energy consumption – Economic
growth nexus for China. Renewable and Sustainable Energy Reviews, 40,
111-117.
Mahadeva, L., & Robinson, P. (2004). Unit root testing to help model building.
Centre for Central Banking Studies, Bank of England.

EMPIRICAL ANALYSIS OF RENEWABLE ENERGY CONSUMPTION (REC) IN ASEAN-5
Page 50 of 70
MAQO Group. (2019). Large Scale Solar 3 (LSS3) Malaysia. Retrieved 24
June 2019, from http://www.maqosolar.com/large-scale-solar-malaysia/
Md. Mahmudul Alam & Md. Wahid Murad (2020). The impacts of economic
growth, trade openness and technological progress on renewable energy
use in organization for economic cooperation and development countries.
Renewable Energy 145, 382-390.
“Multicollinearity”. (n.d.). Retrieved from https://www.jmp.com/en_us/
statistics-knowledge-portal/what-is-multiple-
regression/multicollinearity.html
Murshed, M. (2018). Does improvement in trade openness facilitate renewable
energy transition? Evidence from selected South Asian economies. South
Asia Economic Journal, 19(2), 151–170.
Nguyen, K.H., & Kakinaka, M. (2018). Renewable energy consumption, carbon
emissions, and development 5 stages: Some evidence from panel
cointegration analysis. Renewable Energy, 132, 1049-1057.
“Normality Test”. (n.d.). Retrieved from https://www.originlab.com/doc/
Origin-Help/Normality-Test
Olowe, R. A. (2010). Oil price volatility, global financial crisis and the month-of-
the-year-effect. International Journal of Business and Management, 5(11),
156-170.
Omri, A., & Nguyen, K.D. (2014). On the determinants of renewable energy
consumption: International evidence. Applied Energy, 72, 554-560.
Omri, A., Daly, S., & Ngugen, D.C. (2015). A robust analysis of the relationship
between renewable energy consumption and its main drivers. Economics,
47(28), 2913-2923.
Ooi, T.C. (2019, November 14). Malaysia’s 2019’s palm oil exports may
tip 2018’sRM65b. pp. 1–5. Retrieved 6 January 2020, from
https://www.nst.com.my/business/2019/11/538407/malaysias-2019s-palm-
oil-exports-may-tip-2018s-rm65b
Pedace, R. (n.d.). Test for Heteroskedasticity with the White Test. Retrieved
from https://www.dummies.com/education/economics/econometrics/test-
for-heteroskedasticity-with-the-white-test/
PennState Extension. (2009). What Is Renewable Energy?. Retrieved July 21,

EMPIRICAL ANALYSIS OF RENEWABLE ENERGY CONSUMPTION (REC) IN ASEAN-5
Page 51 of 70
2019, from https://extension.psu.edu/what-is-renewable-energy.
Philippine Department of Energy Portal. (2016). Summary of RE Project as of
31 January 2016. Retrieved 24 June 2016, from
https://web.archive.org/web/20160402062721/http://www.doe.gov.ph/sum
mary-of-projects
PLN. (2018). Renewable Energy Development Plan. Retrieved 24 June 2019,
from https://www.jase-w.eccj.or.jp/indonesiaforum/pdf/11-
05_pln_jibf_supply.pdf
Ponnusamy, S. (2017, February 19). The Hicksian Method and The
Slutskian Method. Retrieved from https://owlcation.com/social-
sciences/The-Hicksian-Method-and-The-Slutskian-Method
Ritchie, H., & Roser, M. (2017, May 11). CO₂ and other Greenhouse Gas Emissions.
Retrieved from https://ourworldindata.org/co2-and-other-greenhouse-gas-
emissions
Sadorsky, P. (2009). Renewable energy consumption and income in emerging
economies. Energy Policy, 37, 4021-4028.
Sadorsky, P. (2009). Renewable energy consumption, co2 emissions and oil prices
in the G7 countries. Energy Policy, 31, 456-462.
Salim, R. A., & Rafiq, S. (2012). Why do some emerging economies proactively
accelerate the adoption of renewable energy? Energy Economics, 41,
1051-1057.
Salim, R. A., & Shafiei, S. (2014). Urbanization and renewable and
non-renewable energy consumption in OECD countries: An
empirical analysis. Economic Modelling, 38, 581-591.
Scoping Study on Intra-ASEAN Value Chain Cooperation and Trade in
Energy Efficiency and Renewable Energy Technologies. (2016). Retrieved
24 July 2019, from
https://www.greengrowthknowledge.org/sites/default/files/downloads/reso
urce/Scoping%20Study%20on%20Intra-
ASEAN%20Value%20Chain%20Cooperation%20and%20Trade%20in%2
0%20Energy%20Efficiency%20and%20Renewable%20Energy%20Techn
ologies.pdf
Sebri, M & Salha, O.B. (2014). On the causal dynamics between economic growth,

EMPIRICAL ANALYSIS OF RENEWABLE ENERGY CONSUMPTION (REC) IN ASEAN-5
Page 52 of 70
renewable energy consumption, CO2 emissions and trade openness: Fresh
evidence from BRICS countries. Renewable and Sustainable Energy
Reviews, 39, 14-23.
Shahbaz, M., Hye, Q. M. A., Tiwari, A. K., & Leitão, N. C. (2013). Economic
growth, energy consumption, financial development, international trade and
CO2 emissions in Indonesia. Renewable and Sustainable Energy Reviews,
25, 109–121.
Shinn, L. (2018). Renewable Energy: The Clean Facts. Retrieved July 21, 2019
from https://www.nrdc.org/stories/renewable-energy-clean-facts
Stephanie. (2016). What is the Breusch-Pagan-Godfrey Test? 19 June, 2–4.
Retrieved 22 July, 2019, from
https://www.statisticshowto.datasciencecentral.com/jarque-bera-test/
Stephanie. (2017). Hausman Test for Endogeneity ( Hausman Specification Test )
What is the Hausman Test ? 1–2. Retrieved 22 July, 2019, from
https://www.statisticshowto.datasciencecentral.com/hausman-test/
Stephanie. (2017). Ridge Regression: Simple Definition. Retrieved
from https://www.statisticshowto.datasciencecentral.com/ridge-regression/
Thailand’s Alternative Energy. (2014). 1–4. Retrieved 6 January 2020,
from https://www.boi.go.th/tir/issue/201403_24_3/42.htm
Thanawat Chalkual, Peng, J., & Liang, Y.J. (2013). Trade Policies and Economic
Growth. DPIBE. 33-35
The ASEAN Post Team. (2018). Renewable energy challenges for
ASEAN. Retrieved 26 June 2019, from
https://theaseanpost.com/article/renewable-energy-challenges-asean
The Star Online. (2010, July 15). Prices of sugar, petrol, LPG, diesel to go
up Friday. Retrieved from
https://www.thestar.com.my/news/nation/2010/07/15/prices-of-sugar-
petrol-lpg-diesel-to-go-up-friday
The Star Online. (2015, October 18). 10 tonnes of carbon dioxide from each
Malaysian. Retrieved from
https://www.thestar.com.my/news/nation/2015/04/08/10-tonnes-of-carbon-
dioxide-from-each-malaysian/#BrFvE7g0o6AGlPWf.99
The Star. (2019). Ministry to take on 80 initiatives. Retrieved 24 June 2019,

EMPIRICAL ANALYSIS OF RENEWABLE ENERGY CONSUMPTION (REC) IN ASEAN-5
Page 53 of 70
from https://www.thestar.com.my/news/nation/2019/05/04/ministry-to-
take-on-80-initiatives/
The World Bank. (n.d.). Renewable Energy Consumption (% of total final energy
consumption). Retrieved 26 June 2019, from
https://data.worldbank.org/indicator/EG.FEC.RNEW.ZS
Thomas, J. (2019). ASEAN fast becoming a renewable energy hub. Retrieved
26 June 2019, from https://theaseanpost.com/article/asean-fast-becoming-
renewable-energy-hub
What is Crude Oil? A Detailed Explanation on this Essential Fossil Fuel.
(2009). Retrieved from https://oilprice.com/Energy/Crude-Oil/What-Is-
Crude-Oil-A-Detailed-Explanation-On-This-Essential-Fossil-Fuel.html#
XINHUANET. (2019, May 29). Vietnam set to import more electricity from
China, Laos. Retrieved from http://www.xinhuanet.com/english/2019-
05/29/c_138100358.htm
Yang, J., Zhang, W., & Zhang, Z. (2016). Impacts of urbanization on renewable
energy consumption in China. Journal of Cleaner Production, 114, 443-
451.
Yobero, C. (2016). Methods for Detecting and Resolving Heteroskedasticity.
Retrieved from https://rstudio-pubs-
static.s3.amazonaws.com/187387_3ca34c107405427db0e0f01252b3fbdb.h
tml
Yu, C., Nataliia, D., Yoo, S., & Hwang, Y. (2019). Does trade openness convey a
positive impact for the environmental quality? Evidence from a panel of CIS
countries Does trade openness convey a positive impact for the. Eurasian
Geography and Economics, 60(3), 333–356.
Zaghdoudi, T. (2017). Oil prices, renewable energy, CO2 emissions and
economic growth in OECD. Economics Bulletin, 37(3), 1844–1850.

EMPIRICAL ANALYSIS OF RENEWABLE ENERGY CONSUMPTION (REC) IN ASEAN-5
Page 54 of 70
APPENDICES
Appendix 1: Model 1
Panel Unit Root
DV: Renewable Energy Consumption
IV: GDP per Capita
Panel unit root test: Summary
Series: REC
Date: 02/29/20 Time: 22:57
Sample: 1991 2015
Exogenous variables: Individual effects
User-specified lags: 1
Newey-West automatic bandwidth selection and Bartlett kernel
Balanced observations for each test
Cross-
Method Statistic Prob.** sections Obs
Null: Unit root (assumes common unit root process)
Levin, Lin & Chu t* -5.25772 0.0000 5 115
Null: Unit root (assumes individual unit root process)
Im, Pesaran and Shin W-stat -4.76343 0.0000 5 115
ADF - Fisher Chi-square 43.0716 0.0000 5 115
PP - Fisher Chi-square 50.0071 0.0000 5 120
** Probabilities for Fisher tests are computed using an asymptotic Chi
-square distribution. All other tests assume asymptotic normality.
Panel unit root test: Summary
Series: GDPPC
Date: 02/29/20 Time: 22:58
Sample: 1991 2015
Exogenous variables: Individual effects
User-specified lags: 1
Newey-West automatic bandwidth selection and Bartlett kernel
Balanced observations for each test
Cross-
Method Statistic Prob.** sections Obs
Null: Unit root (assumes common unit root process)
Levin, Lin & Chu t* -3.88038 0.0001 5 115
Null: Unit root (assumes individual unit root process)
Im, Pesaran and Shin W-stat -3.68441 0.0001 5 115
ADF - Fisher Chi-square 31.5010 0.0005 5 115
PP - Fisher Chi-square 42.2675 0.0000 5 120
** Probabilities for Fisher tests are computed using an asymptotic Chi
-square distribution. All other tests assume asymptotic normality.

EMPIRICAL ANALYSIS OF RENEWABLE ENERGY CONSUMPTION (REC) IN ASEAN-5
Page 55 of 70
IV: Log (CO2 emissions)
IV: Oil Price
Panel unit root test: Summary
Series: LOG(CDE)
Date: 02/29/20 Time: 23:00
Sample: 1991 2015
Exogenous variables: Individual effects
User-specified lags: 1
Newey-West automatic bandwidth selection and Bartlett kernel
Balanced observations for each test
Cross-
Method Statistic Prob.** sections Obs
Null: Unit root (assumes common unit root process)
Levin, Lin & Chu t* -2.01963 0.0217 5 115
Null: Unit root (assumes individual unit root process)
Im, Pesaran and Shin W-stat -0.00302 0.4988 5 115
ADF - Fisher Chi-square 8.28047 0.6015 5 115
PP - Fisher Chi-square 9.16479 0.5165 5 120
** Probabilities for Fisher tests are computed using an asymptotic Chi
-square distribution. All other tests assume asymptotic normality.
Panel unit root test: Summary
Series: OP
Date: 02/29/20 Time: 23:01
Sample: 1991 2015
Exogenous variables: Individual effects
User-specified lags: 1
Newey-West automatic bandwidth selection and Bartlett kernel
Cross-
Method Statistic Prob.** sections Obs
Null: Unit root (assumes common unit root process)
Levin, Lin & Chu t* -2.86644 0.0021 5 110
Null: Unit root (assumes individual unit root process)
Im, Pesaran and Shin W-stat -0.92921 0.1764 5 110
ADF - Fisher Chi-square 13.4952 0.1973 5 110
PP - Fisher Chi-square 3.27105 0.9743 5 115
** Probabilities for Fisher tests are computed using an asymptotic Chi
-square distribution. All other tests assume asymptotic normality.

EMPIRICAL ANALYSIS OF RENEWABLE ENERGY CONSUMPTION (REC) IN ASEAN-5
Page 56 of 70
IV: Log (Trade openness)
Pooled OLS
Panel unit root test: Summary
Series: LOG(TO)
Date: 02/29/20 Time: 23:01
Sample: 1991 2015
Exogenous variables: Individual effects
User-specified lags: 1
Newey-West automatic bandwidth selection and Bartlett kernel
Balanced observations for each test
Cross-
Method Statistic Prob.** sections Obs
Null: Unit root (assumes common unit root process)
Levin, Lin & Chu t* -2.70755 0.0034 5 115
Null: Unit root (assumes individual unit root process)
Im, Pesaran and Shin W-stat -0.61079 0.2707 5 115
ADF - Fisher Chi-square 12.3201 0.2642 5 115
PP - Fisher Chi-square 16.2325 0.0932 5 120
** Probabilities for Fisher tests are computed using an asymptotic Chi
-square distribution. All other tests assume asymptotic normality.
Dependent Variable: REC
Method: Panel Least Squares
Date: 02/29/20 Time: 23:02
Sample: 1991 2015
Periods included: 25
Cross-sections included: 5
Total panel (unbalanced) observations: 120
Variable Coefficient Std. Error t-Statistic Prob.
C -10.73879 18.82777 -0.570370 0.5695
GDPPC 0.358318 0.205428 1.744257 0.0838
LOG(CDE) -21.64848 1.567871 -13.80757 0.0000
OP -8.331844 2.962889 -2.812067 0.0058
LOG(TO) 5.056720 1.770579 2.855970 0.0051
R-squared 0.796489 Mean dependent var 30.55576
Adjusted R-squared 0.789411 S.D. dependent var 16.35842
S.E. of regression 7.506880 Akaike info criterion 6.910291
Sum squared resid 6480.624 Schwarz criterion 7.026436
Log likelihood -409.6174 Hannan-Quinn criter. 6.957458
F-statistic 112.5202 Durbin-Watson stat 0.091515
Prob(F-statistic) 0.000000

EMPIRICAL ANALYSIS OF RENEWABLE ENERGY CONSUMPTION (REC) IN ASEAN-5
Page 57 of 70
Fixed Effect Model
Dependent Variable: REC
Method: Panel Least Squares
Date: 02/29/20 Time: 23:02
Sample: 1991 2015
Periods included: 25
Cross-sections included: 5
Total panel (unbalanced) observations: 120
Variable Coefficient Std. Error t-Statistic Prob.
C 144.6781 16.89636 8.562680 0.0000
GDPPC -0.052536 0.093912 -0.559414 0.5770
LOG(CDE) -0.317823 3.272448 -0.097121 0.9228
OP 6.930374 1.743346 3.975329 0.0001
LOG(TO) -10.08106 1.668286 -6.042761 0.0000
Effects Specification
Cross-section fixed (dummy variables)
R-squared 0.963435 Mean dependent var 30.55576
Adjusted R-squared 0.960800 S.D. dependent var 16.35842
S.E. of regression 3.238816 Akaike info criterion 5.260331
Sum squared resid 1164.382 Schwarz criterion 5.469393
Log likelihood -306.6199 Hannan-Quinn criter. 5.345232
F-statistic 365.5857 Durbin-Watson stat 0.312814
Prob(F-statistic) 0.000000

EMPIRICAL ANALYSIS OF RENEWABLE ENERGY CONSUMPTION (REC) IN ASEAN-5
Page 58 of 70
Random Effect Model
Dependent Variable: REC
Method: Panel EGLS (Cross-section random effects)
Date: 02/29/20 Time: 23:03
Sample: 1991 2015
Periods included: 25
Cross-sections included: 5
Total panel (unbalanced) observations: 120
Swamy and Arora estimator of component variances
Variable Coefficient Std. Error t-Statistic Prob.
C -10.73879 8.123171 -1.321994 0.1888
GDPPC 0.358318 0.088631 4.042812 0.0001
LOG(CDE) -21.64848 0.676452 -32.00297 0.0000
OP -8.331844 1.278328 -6.517768 0.0000
LOG(TO) 5.056720 0.763910 6.619524 0.0000
Effects Specification
S.D. Rho
Cross-section random 1.01E-05 0.0000
Idiosyncratic random 3.238816 1.0000
Weighted Statistics
R-squared 0.796489 Mean dependent var 30.55576
Adjusted R-squared 0.789411 S.D. dependent var 16.35842
S.E. of regression 7.506880 Sum squared resid 6480.623
F-statistic 112.5202 Durbin-Watson stat 0.091515
Prob(F-statistic) 0.000000
Unweighted Statistics
R-squared 0.796489 Mean dependent var 30.55576
Sum squared resid 6480.624 Durbin-Watson stat 0.091515

EMPIRICAL ANALYSIS OF RENEWABLE ENERGY CONSUMPTION (REC) IN ASEAN-5
Page 59 of 70
Hausman Test
Correlated Random Effects - Hausman Test
Equation: Untitled
Test cross-section random effects
Test Summary Chi-Sq. Statistic Chi-Sq. d.f. Prob.
Cross-section random 506.794673 4 0.0000
Cross-section random effects test comparisons:
Variable Fixed Random Var(Diff.) Prob.
GDPPC -0.052536 0.358318 0.000964 0.0000
LOG(CDE) -0.317823 -21.648478 10.251328 0.0000
OP 6.930374 -8.331844 1.405134 0.0000
LOG(TO) -10.081056 5.056720 2.199621 0.0000
Cross-section random effects test equation:
Dependent Variable: REC
Method: Panel Least Squares
Date: 02/29/20 Time: 23:04
Sample: 1991 2015
Periods included: 25
Cross-sections included: 5
Total panel (unbalanced) observations: 120
Variable Coefficient Std. Error t-Statistic Prob.
C 144.6781 16.89636 8.562680 0.0000
GDPPC -0.052536 0.093912 -0.559414 0.5770
LOG(CDE) -0.317823 3.272448 -0.097121 0.9228
OP 6.930374 1.743346 3.975329 0.0001
LOG(TO) -10.08106 1.668286 -6.042761 0.0000
Effects Specification
Cross-section fixed (dummy variables)
R-squared 0.963435 Mean dependent var 30.55576
Adjusted R-squared 0.960800 S.D. dependent var 16.35842
S.E. of regression 3.238816 Akaike info criterion 5.260331
Sum squared resid 1164.382 Schwarz criterion 5.469393
Log likelihood -306.6199 Hannan-Quinn criter. 5.345232
F-statistic 365.5857 Durbin-Watson stat 0.312814
Prob(F-statistic) 0.000000

EMPIRICAL ANALYSIS OF RENEWABLE ENERGY CONSUMPTION (REC) IN ASEAN-5
Page 60 of 70
Lagrange Multiplier Test
Normality Test
Lagrange Multiplier Tests for Random Effects
Null hypotheses: No effects
Alternative hypotheses: Two-sided (Breusch-Pagan) and one-sided
(all others) alternatives
Test Hypothesis
Cross-section Time Both
Breusch-Pagan 530.1207 8.128207 538.2489
(0.0000) (0.0044) (0.0000)
Honda 23.02435 -2.851001 14.26471
(0.0000) (0.9978) (0.0000)
King-Wu 23.02435 -2.851001 20.25312
(0.0000) (0.9978) (0.0000)
Standardized Honda 36.60174 -2.675436 13.64737
(0.0000) (0.9963) (0.0000)
Standardized King-Wu 36.60174 -2.675436 26.16786
(0.0000) (0.9963) (0.0000)
Gourieroux, et al.* -- -- 530.1207
(0.0000)
0
2
4
6
8
10
12
14
-15 -10 -5 0 5 10 15
Series: Standardized Residuals
Sample 1991 2015
Observations 120
Mean -1.18e-16
Median 0.575423
Maximum 14.33075
Minimum -15.83954
Std. Dev. 7.379636
Skewness -0.276000
Kurtosis 2.393577
Jarque-Bera 3.362264
Probability 0.186163
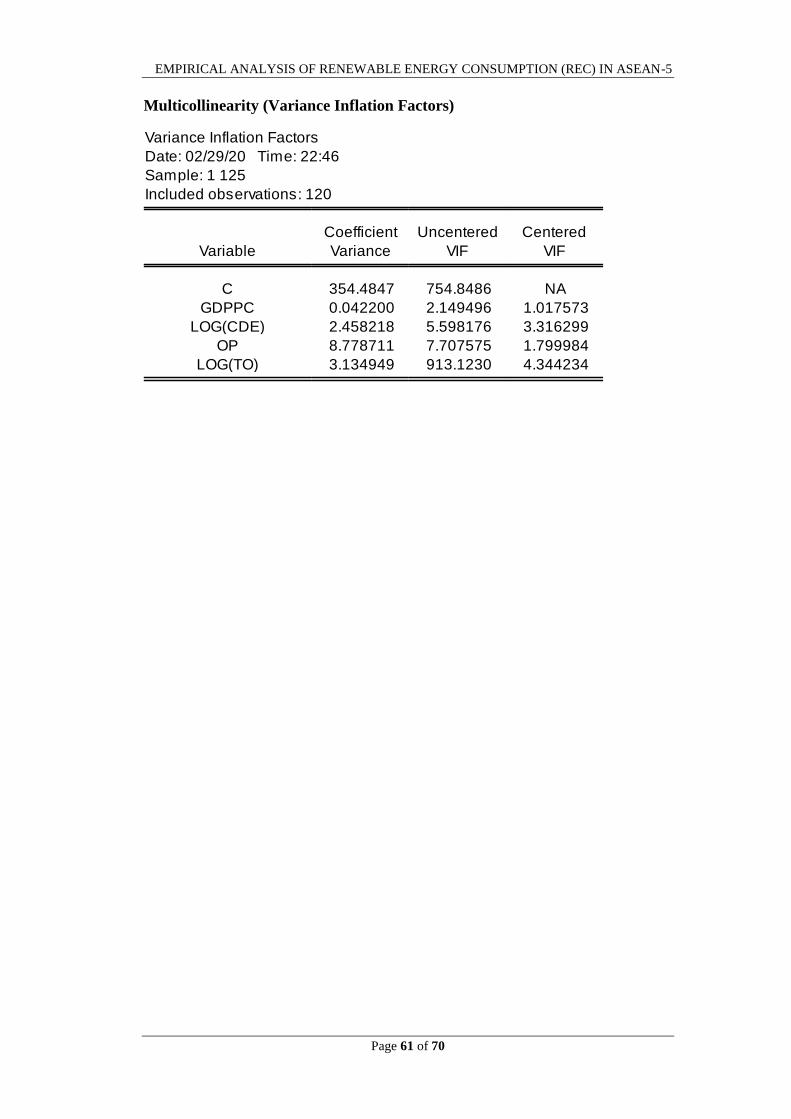
EMPIRICAL ANALYSIS OF RENEWABLE ENERGY CONSUMPTION (REC) IN ASEAN-5
Page 61 of 70
Multicollinearity (Variance Inflation Factors)
Variance Inflation Factors
Date: 02/29/20 Time: 22:46
Sample: 1 125
Included observations: 120
Coefficient Uncentered Centered
Variable Variance VIF VIF
C 354.4847 754.8486 NA
GDPPC 0.042200 2.149496 1.017573
LOG(CDE) 2.458218 5.598176 3.316299
OP 8.778711 7.707575 1.799984
LOG(TO) 3.134949 913.1230 4.344234

EMPIRICAL ANALYSIS OF RENEWABLE ENERGY CONSUMPTION (REC) IN ASEAN-5
Page 62 of 70
Likelihood Ratio
Panel Cross-section Heteroskedasticity LR Test
Equation: UNTITLED
Specification: REC C GDPPC LOG(CDE) OP LOG(TO)
Null hypothesis: Residuals are homoskedastic
Value df Probability
Likelihood ratio 130.3611 5 0.0000
LR test summary:
Value df
Restricted LogL -409.6174 115
Unrestricted LogL -344.4369 115
Unrestricted Test Equation:
Dependent Variable: REC
Method: Panel EGLS (Cross-section weights)
Date: 02/29/20 Time: 23:29
Sample: 1991 2015
Periods included: 25
Cross-sections included: 5
Total panel (unbalanced) observations: 120
Iterate weights to convergence
Convergence achieved after 11 weight iterations
Variable Coefficient Std. Error t-Statistic Prob.
C -16.28131 8.709768 -1.869316 0.0641
GDPPC 0.025455 0.060513 0.420653 0.6748
LOG(CDE) -25.76963 0.759317 -33.93790 0.0000
OP 3.665666 1.120978 3.270061 0.0014
LOG(TO) 5.526826 0.830684 6.653346 0.0000
Weighted Statistics
R-squared 0.958531 Mean dependent var 67.37864
Adjusted R-squared 0.957088 S.D. dependent var 44.54606
S.E. of regression 9.359216 Akaike info criterion 5.823948
Sum squared resid 10073.42 Schwarz criterion 5.940093
Log likelihood -344.4369 Hannan-Quinn criter. 5.871115
F-statistic 664.5331 Durbin-Watson stat 0.483048
Prob(F-statistic) 0.000000
Unweighted Statistics
R-squared 0.683670 Mean dependent var 30.55576
Sum squared resid 10073.25 Durbin-Watson stat 0.052651

EMPIRICAL ANALYSIS OF RENEWABLE ENERGY CONSUMPTION (REC) IN ASEAN-5
Page 63 of 70
Appendix 2: Model 2
Panel Unit Root Test
DV: GDP per Capita*Log (Trade Openness)
IV: Log (CO2 emissions*Trade Openness)
Panel unit root test: Summary
Series: GDPPC*LOG(TO)
Date: 02/29/20 Time: 23:20
Sample: 1991 2015
Exogenous variables: Individual effects
User-specified lags: 1
Newey-West automatic bandwidth selection and Bartlett kernel
Balanced observations for each test
Cross-
Method Statistic Prob.** sections Obs
Null: Unit root (assumes common unit root process)
Levin, Lin & Chu t* -4.12384 0.0000 5 115
Null: Unit root (assumes individual unit root process)
Im, Pesaran and Shin W-stat -3.83489 0.0001 5 115
ADF - Fisher Chi-square 32.7703 0.0003 5 115
PP - Fisher Chi-square 44.9681 0.0000 5 120
** Probabilities for Fisher tests are computed using an asymptotic Chi
-square distribution. All other tests assume asymptotic normality.
Panel unit root test: Summary
Series: LOG(CDE*TO)
Date: 02/29/20 Time: 23:21
Sample: 1991 2015
Exogenous variables: Individual effects
User-specified lags: 1
Newey-West automatic bandwidth selection and Bartlett kernel
Balanced observations for each test
Cross-
Method Statistic Prob.** sections Obs
Null: Unit root (assumes common unit root process)
Levin, Lin & Chu t* -3.05921 0.0011 5 115
Null: Unit root (assumes individual unit root process)
Im, Pesaran and Shin W-stat -0.75653 0.2247 5 115
ADF - Fisher Chi-square 11.5410 0.3169 5 115
PP - Fisher Chi-square 17.4216 0.0655 5 120
** Probabilities for Fisher tests are computed using an asymptotic Chi
-square distribution. All other tests assume asymptotic normality.

EMPIRICAL ANALYSIS OF RENEWABLE ENERGY CONSUMPTION (REC) IN ASEAN-5
Page 64 of 70
IV: Oil Price*Log (Trade Openness)
Pooled OLS
Panel unit root test: Summary
Series: OP*LOG(TO)
Date: 02/29/20 Time: 23:22
Sample: 1991 2015
Exogenous variables: Individual effects
User-specified lags: 1
Newey-West automatic bandwidth selection and Bartlett kernel
Cross-
Method Statistic Prob.** sections Obs
Null: Unit root (assumes common unit root process)
Levin, Lin & Chu t* -2.72846 0.0032 5 110
Null: Unit root (assumes individual unit root process)
Im, Pesaran and Shin W-stat -0.70782 0.2395 5 110
ADF - Fisher Chi-square 12.7019 0.2408 5 110
PP - Fisher Chi-square 3.01703 0.9810 5 115
** Probabilities for Fisher tests are computed using an asymptotic Chi
-square distribution. All other tests assume asymptotic normality.
Dependent Variable: REC
Method: Panel Least Squares
Date: 02/29/20 Time: 23:56
Sample: 1991 2015
Periods included: 25
Cross-sections included: 5
Total panel (unbalanced) observations: 120
Variable Coefficient Std. Error t-Statistic Prob.
C 141.8663 7.219153 19.65138 0.0000
GDPPC*LOG(TO) 0.021848 0.022388 0.975866 0.3312
LOG(CDE*TO) -9.454418 0.617672 -15.30653 0.0000
OP*LOG(TO) 0.649138 0.235002 2.762273 0.0067
R-squared 0.679975 Mean dependent var 30.55576
Adjusted R-squared 0.671698 S.D. dependent var 16.35842
S.E. of regression 9.372981 Akaike info criterion 7.346305
Sum squared resid 10190.92 Schwarz criterion 7.439221
Log likelihood -436.7783 Hannan-Quinn criter. 7.384038
F-statistic 82.15719 Durbin-Watson stat 0.043430
Prob(F-statistic) 0.000000

EMPIRICAL ANALYSIS OF RENEWABLE ENERGY CONSUMPTION (REC) IN ASEAN-5
Page 65 of 70
Fixed Effect Model
Dependent Variable: REC
Method: Panel Least Squares
Date: 02/29/20 Time: 23:23
Sample: 1991 2015
Periods included: 25
Cross-sections included: 5
Total panel (unbalanced) observations: 120
Variable Coefficient Std. Error t-Statistic Prob.
C 115.6307 5.756333 20.08756 0.0000
GDPPC*LOG(TO) -0.005867 0.008070 -0.727024 0.4687
LOG(CDE*TO) -7.145106 0.513923 -13.90306 0.0000
OP*LOG(TO) 0.486668 0.123650 3.935852 0.0001
Effects Specification
Cross-section fixed (dummy variables)
R-squared 0.963290 Mean dependent var 30.55576
Adjusted R-squared 0.960995 S.D. dependent var 16.35842
S.E. of regression 3.230729 Akaike info criterion 5.247633
Sum squared resid 1169.012 Schwarz criterion 5.433466
Log likelihood -306.8580 Hannan-Quinn criter. 5.323101
F-statistic 419.8433 Durbin-Watson stat 0.278015
Prob(F-statistic) 0.000000

EMPIRICAL ANALYSIS OF RENEWABLE ENERGY CONSUMPTION (REC) IN ASEAN-5
Page 66 of 70
Random Effect Model
Dependent Variable: REC
Method: Panel EGLS (Cross-section random effects)
Date: 02/29/20 Time: 23:24
Sample: 1991 2015
Periods included: 25
Cross-sections included: 5
Total panel (unbalanced) observations: 120
Swamy and Arora estimator of component variances
Variable Coefficient Std. Error t-Statistic Prob.
C 116.2093 9.050087 12.84069 0.0000
GDPPC*LOG(TO) -0.005834 0.008069 -0.723009 0.4711
LOG(CDE*TO) -7.169159 0.511707 -14.01028 0.0000
OP*LOG(TO) 0.490784 0.123301 3.980374 0.0001
Effects Specification
S.D. Rho
Cross-section random 15.71182 0.9594
Idiosyncratic random 3.230729 0.0406
Weighted Statistics
R-squared 0.732325 Mean dependent var 1.294383
Adjusted R-squared 0.725403 S.D. dependent var 6.108171
S.E. of regression 3.198952 Sum squared resid 1187.062
F-statistic 105.7873 Durbin-Watson stat 0.274734
Prob(F-statistic) 0.000000
Unweighted Statistics
R-squared 0.636784 Mean dependent var 30.55576
Sum squared resid 11566.29 Durbin-Watson stat 0.028196

EMPIRICAL ANALYSIS OF RENEWABLE ENERGY CONSUMPTION (REC) IN ASEAN-5
Page 67 of 70
Hausman Test
Correlated Random Effects - Hausman Test
Equation: Untitled
Test cross-section random effects
Test Summary Chi-Sq. Statistic Chi-Sq. d.f. Prob.
Cross-section random 0.729269 3 0.8663
Cross-section random effects test comparisons:
Variable Fixed Random Var(Diff.) Prob.
GDPPC*LOG(TO) -0.005867 -0.005834 0.000000 0.7792
LOG(CDE*TO) -7.145106 -7.169159 0.002273 0.6139
OP*LOG(TO) 0.486668 0.490784 0.000086 0.6575
Cross-section random effects test equation:
Dependent Variable: REC
Method: Panel Least Squares
Date: 02/29/20 Time: 23:24
Sample: 1991 2015
Periods included: 25
Cross-sections included: 5
Total panel (unbalanced) observations: 120
Variable Coefficient Std. Error t-Statistic Prob.
C 115.6307 5.756333 20.08756 0.0000
GDPPC*LOG(TO) -0.005867 0.008070 -0.727024 0.4687
LOG(CDE*TO) -7.145106 0.513923 -13.90306 0.0000
OP*LOG(TO) 0.486668 0.123650 3.935852 0.0001
Effects Specification
Cross-section fixed (dummy variables)
R-squared 0.963290 Mean dependent var 30.55576
Adjusted R-squared 0.960995 S.D. dependent var 16.35842
S.E. of regression 3.230729 Akaike info criterion 5.247633
Sum squared resid 1169.012 Schwarz criterion 5.433466
Log likelihood -306.8580 Hannan-Quinn criter. 5.323101
F-statistic 419.8433 Durbin-Watson stat 0.278015
Prob(F-statistic) 0.000000

EMPIRICAL ANALYSIS OF RENEWABLE ENERGY CONSUMPTION (REC) IN ASEAN-5
Page 68 of 70
Lagrange Multiplier Test
Normality Test
Lagrange Multiplier Tests for Random Effects
Null hypotheses: No effects
Alternative hypotheses: Two-sided (Breusch-Pagan) and one-sided
(all others) alternatives
Test Hypothesis
Cross-section Time Both
Breusch-Pagan 1024.578 11.72398 1036.302
(0.0000) (0.0006) (0.0000)
Honda 32.00903 -3.424030 20.21265
(0.0000) (0.9997) (0.0000)
King-Wu 32.00903 -3.424030 28.35968
(0.0000) (0.9997) (0.0000)
Standardized Honda 43.03708 -3.272405 19.96597
(0.0000) (0.9995) (0.0000)
Standardized King-Wu 43.03708 -3.272405 33.70366
(0.0000) (0.9995) (0.0000)
Gourieroux, et al.* -- -- 1024.578
(0.0000)
0
2
4
6
8
10
-15 -10 -5 0 5 10 15 20
Series: Standardized Residuals
Sample 1991 2015
Observations 120
Mean 2.03e-14
Median -2.265059
Maximum 21.11259
Minimum -17.76694
Std. Dev. 9.254080
Skewness 0.251825
Kurtosis 2.132891
Jarque-Bera 5.027705
Probability 0.080956

EMPIRICAL ANALYSIS OF RENEWABLE ENERGY CONSUMPTION (REC) IN ASEAN-5
Page 69 of 70
Multicollinearity (Variance Inflation Factors)
Variance Inflation Factors
Date: 02/29/20 Time: 22:50
Sample: 1 125
Included observations: 120
Coefficient Uncentered Centered
Variable Variance VIF VIF
C 52.11617 71.18660 NA
GDPPC*LOG(TO) 0.000501 2.192445 1.018478
LOG(CDE*TO) 0.381519 80.38380 1.185075
OP*LOG(TO) 0.055226 4.568930 1.200738

EMPIRICAL ANALYSIS OF RENEWABLE ENERGY CONSUMPTION (REC) IN ASEAN-5
Page 70 of 70
Likelihood Ratio
Panel Cross-section Heteroskedasticity LR Test
Equation: UNTITLED
Specification: REC C GDPPC*LOG(TO) LOG(CDE*TO) OP*LOG(TO)
Null hypothesis: Residuals are homoskedastic
Value df Probability
Likelihood ratio 83.54051 5 0.0000
LR test summary:
Value df
Restricted LogL -436.7783 116
Unrestricted LogL -395.0080 116
Unrestricted Test Equation:
Dependent Variable: REC
Method: Panel EGLS (Cross-section weights)
Date: 02/29/20 Time: 23:27
Sample: 1991 2015
Periods included: 25
Cross-sections included: 5
Total panel (unbalanced) observations: 120
Iterate weights to convergence
Convergence achieved after 7 weight iterations
Variable Coefficient Std. Error t-Statistic Prob.
C 161.6871 3.369555 47.98472 0.0000
GDPPC*LOG(TO) 0.006871 0.012149 0.565546 0.5728
LOG(CDE*TO) -11.49641 0.292175 -39.34773 0.0000
OP*LOG(TO) 1.570538 0.106779 14.70825 0.0000
Weighted Statistics
R-squared 0.938365 Mean dependent var 60.82370
Adjusted R-squared 0.936771 S.D. dependent var 66.44900
S.E. of regression 10.12115 Akaike info criterion 6.650134
Sum squared resid 11882.76 Schwarz criterion 6.743050
Log likelihood -395.0080 Hannan-Quinn criter. 6.687867
F-statistic 588.6808 Durbin-Watson stat 0.261106
Prob(F-statistic) 0.000000
Unweighted Statistics
R-squared 0.626821 Mean dependent var 30.55576
Sum squared resid 11883.56 Durbin-Watson stat 0.066262