empirical analysis of drug approval-drug patenting linkage
TRANSCRIPT
Northwestern Journal of Technology and Intellectual PropertyVolume 8Issue 2 Spring Article 2
Spring 2010
Empirical Analysis of Drug Approval-DrugPatenting Linkage for High Value PharmaceuticalsRon A. Bouchard
Richard W. Hawkins
Robert Clark
Reider Hagtvedt
Jamil Sawani
This Article is brought to you for free and open access by Northwestern Pritzker School of Law Scholarly Commons. It has been accepted for inclusionin Northwestern Journal of Technology and Intellectual Property by an authorized editor of Northwestern Pritzker School of Law Scholarly Commons.
Recommended CitationRon A. Bouchard, Richard W. Hawkins, Robert Clark, Reider Hagtvedt, and Jamil Sawani, Empirical Analysis of Drug Approval-DrugPatenting Linkage for High Value Pharmaceuticals, 8 Nw. J. Tech. & Intell. Prop. 174 (2010).https://scholarlycommons.law.northwestern.edu/njtip/vol8/iss2/2
Empirical Analysis of Drug Approval- Drug Patenting Linkage for High Value Pharmaceuticals
Ron A. Bouchard, Richard W. Hawkins, Robert Clark, Reidar Hagtvedt, & Jamil Sawani
Spring 2010 VOL. 8, NO. 2
© 2010 by Northwestern University School of Law Northwestern Journal of Technology and Intellectual Property
N O R T H W E S T E R N J O U R N A L O F T E C H N O L O G Y
A N D I N T E L L E C T U A L P R O P E R T Y
Copyright 2010 by Northwestern University School of Law Volume 8, Number 2 (Spring 2010) Northwestern Journal of Technology and Intellectual Property
174
Empirical Analysis of Drug Approval- Drug Patenting Linkage for High Value Pharmaceuticals
By Ron A. Bouchard, Richard W. Hawkins, Robert Clark, Reidar
Hagtvedt, & Jamil Sawani*
I. INTRODUCTION
¶1 Global drug regulators have long privileged models of therapeutic product development that provide strong intellectual property rights to pharmaceutical firms, which are deemed necessary to offset large regulatory delays and the growing costs of drug development. Patent and, increasingly, regulatory rights are assumed to be essential for all stages of the therapeutic product lifecycle, including publicly-funded medical research, university technology transfer, private research and development activities, the regulatory submission cycle, and the post-market stage. Indeed, patent rights are seen to be so important to the drug development exercise that drug patenting and drug approval are now legally linked through a novel form of legal ordering referred to as “linkage regulations.” Linkage regulations allow firms to list patents deemed relevant to an already marketed product in order to extend market exclusivity. Generic firms must successfully litigate each patent on the patent register prior to gaining market entry. Patenting and litigation under linkage regulations are critical to brand-name and generic markets, as they represent a primary mechanism by which regulators promote drug development in exchange for intellectual property rights. The linkage regime in Canada has now reached a stage of some maturity since coming into force in 1993, providing an excellent opportunity to empirically investigate how patents and linkage regulations are intertwined and are employed by multinational pharmaceutical firms in order to protect high value innovations.
¶2 The present work was designed to empirically investigate two related phenomena within the context of the emerging linkage regulation model of intellectual property protection. The first was to probe the legal nexus between drug approval, drug patenting, and patent listing under the linkage regime for high value pharmaceuticals as vetted by regulators and the market. While the patent regime has been claimed by both pharmaceutical firms and regulators to be integral for innovative drug development, the
* Dr. Ron A. Bouchard is Associate Professor in the Faculties of Medicine & Dentistry and Law at the University of Alberta. Dr. Richard W. Hawkins is Professor and Canada Research Chair in the Faculty of Social Sciences at the University of Calgary. Dr. Bob Clark is at the University of Calgary, Faculty of Medicine. Dr. Reidar Hagtvedt is Visiting Professor at the University of Alberta. Mr. Sawani is a Research Assistant and student in the Faculty of Law. The authors are very grateful to Monika Sawicka, Chris McLelland, Kirsten Burrows and Cam Sklar for research assistance at varying stages of the work. The study was funded by a career establishment award (RAB) from the Alberta Heritage Foundation for Medical Research (AHFMR). Correspondence to: [email protected].
Vol. 8:2] Ron A. Bouchard et al.
175
role of drug approval-drug patenting linkage in pharmaceutical innovation is far less clear. Evidence relating to drug approval-drug patenting linkage, especially for high value pharmaceuticals, would therefore be valuable at a time when other jurisdictions might be contemplating similar provisions. The second was to address how certain characteristics of the existing drug approval framework, such as relatively low thresholds for drugs to accrue a new active substance designation (equivalent to a new chemical entity), to be approved as a follow-on drug as opposed to a new drug, and to go through an expedited rather than conventional approval process, might be linked to patenting and patent listing patterns. Given the requirement under linkage law for intellectual property protection to be linked to a specific drug submission, we were particularly interested in exploring data relating to what we refer to as a “paradoxical drug approval-drug patenting linkage.” That is, a legal linkage whereby the largest scope of intellectual property protection accrues to drugs with the least innovative character.
¶3 The remaining analysis is split into five parts. In Part II we provide background information relating to conventional patent law and emerging linkage regulations. In Part III we provide an overview of the methodology employed in our empirical study. In Part IV we describe the data relating to patenting and patent listing under the NOC Regulations. A number of different groups were analyzed: the entire cohort of drugs, most profitable drugs by sales, drugs approved via an expedited approval process without significant post-market conditions, drug approved via expedited approval with significant post-market conditions, and drugs approved via a combination of the latter two pathways. Approved drugs and patents were also analyzed in relation to their patent type classification (chemical, process, combination, use, etc.) and World Health Organization therapeutic class designation (cardiovascular, antibiotic, antineoplastic, etc.). In Part V we interpret the data and provide a brief synthesis of the results in relation to existing intellectual property and food and drug policy. Part VI is a summary and conclusions section.
II. BACKGROUND
A. Patents
¶4 A patent for invention is a property right granted by the government to an inventor. In most developed nations, property rights associated with a patent include the right to exclude others from making, using or selling an invention. In Canada, this right takes effect from the date the patent is granted for a period of 20 years after the filing date.1 In exchange for the grant of patent, inventors must provide a full description of the invention and how it is enabled so that the public can benefit from disclosure and use it to develop further innovations in that or related fields. This quid pro quo between the inventor and public is referred to as the traditional patent bargain,2 and was institutionalized for the first time in the English Statute of Monopolies 1623.3
1 Patent Act, R.S.C, ch. P 4, §§ 42, 44 (1985). 2 See Free World Trust v. Électro Santé Inc., [2000] 2 S.C.R. 1024, 2000 SCC 66, ¶ 13 (Can.);
Whirlpool Corp. v. Camco Inc., [2000] 2 S.C.R. 1067, 2000 SCC 67, ¶ 37 (Can.); Hotchkiss v. Greenwood, 52 U.S. 248 (1850); Graham v. John Deere Co., 383 U.S. 1, 5-9 (1965).
3 Statute of Monopolies, 1623, 21 Jac. 1, c. 23 (Eng.). The Supreme Court has noted that even prior to the Statute of Monopolies “the Crown rewarded an inventor with a limited monopoly in exchange for public disclosure of “a new invention and a new trade within the kingdom … or if a man hath made a new
NOR TH WES TERN JO URN AL O F TECH NO LO GY AND IN TE LLEC TU A L PRO PER TY [ 2 0 1 0
176
¶5 The requirements for patenting and the relation thereof to drug approval in Canada generally track those in other developed nations, particularly the United States (U.S.).4 Section 2 of the Canadian Patent Act defines an invention as any “new and useful art, process, machine, manufacture or composition of matter, or any new and useful improvement in any art, process, machine, manufacture or composition of matter.”5 An invention must meet three basic requirements in order to be patentable; the subject matter6 defined in the claims must be new, useful and non-obvious.7 The first requirement is met where the subject matter of the patent has not yet been disclosed to the public. The second is met where the subject matter provides sufficient utility or benefit to the public and achieves the purpose for which it came into being. The third is met where the subject matter constitutes an “inventive step” or manifests sufficient “inventive ingenuity” over the prior art to warrant the traditional patent bargain. Where an inventive step is lacking, a patent is not granted or, if granted, can be later ruled invalid on the grounds that it is “obvious” in light of the prior art, provided that the person skilled in the art would have been led directly and without difficulty to the solution taught by the patent.8
B. Linkage Regulations
When the claims at issue are deemed to be obvious or anticipated (for lack of novelty), they are struck down and can no longer be used to prohibit competitors from using the invention.
¶6 Patents are consistently claimed to be invaluable to drug development in the pharmaceutical industry,9 in part to compensate firms for long regulatory lag periods and the high costs of innovation. An element of pharmaceutical patent law unique to the U.S. and Canada is a relatively novel form of legal ordering referred to as “linkage regulations.” So named because they tie patent protection for marketed pharmaceuticals to the drug approval process, linkage regulations enable brand-name pharmaceutical firms to list as many patents as are deemed “relevant” to a marketed product on a patent register.10
discovery of any thing.” Free World Trust, [2000] 2 S.C.R. 1024, 2000 SCC 66, ¶ 13.
4 The requirements for patenting in the United States are set out in the U.S. Patent Act, 35 U.S.C. §§ 1–376 (2006).
5 Patent Act, R.S.C, ch. P 4, § 2. 6 Section 27(4) of the Canadian Patent Act stipulates that the subject matter of the patent must be
defined distinctly and explicitly in the claims section of the patent. 7 Patent Act, R.S.C, ch. P 4, § 28.2(1) (subject matter defined in the claims must not have been
disclosed more than one year before the filing date); id. § 28.3 (subject-matter must not “have been obvious on the claim date to a person skilled in the art or science to which it pertains”). See also Henriksen v. Tallon Ltd., [1965] R.P.C. 434 (Can.); Burton Parsons v. Hewlett Packard (Canada) Ltd. [1976] S.C.R. 555 (Can.).
8 See Beecham Canada Ltd. v. Procter & Gamble Co., [1982] 61 C.P.R. (2d) 7 (Can.). 9 See generally MICHELE BOLDRIN & DAVID LEVINE, AGAINST INTELLECTUAL MONOPOLY, chs. 8, 9
(Cambridge Univ. Press 2008) (“Does Intellectual Property Increase Innovation?” and “The Pharmaceutical Industry”); Stuart Macdonald, When Means Become Ends: Considering the Impact of Patent Strategy on Innovation, 16 INFO. ECON. & POL’Y 135 (2004), available at http://www.stuartmacdonald.org.uk/pdfs/Macdonald.pdf.
Blockbuster drugs coming off patent protection can in this manner have a
10 See generally Edward Hore, A Comparison of US and Canadian Laws as They Affect Generic Pharmaceutical Drug Entry, 55 FOOD & DRUG L.J. 373 (1992); Ron A. Bouchard, Should Scientific Research in the Lead-up to Invention Vitiate Obviousness Under the Patented Medicines (Notice of Compliance) Regulations: To Test Or Not To Test? 6 CAN. J. L. & TECH. 1 (2007); Ron A. Bouchard,
Vol. 8:2] Ron A. Bouchard et al.
177
period of market exclusivity that is significantly extended beyond that for the originating patent (e.g., on the new active substance or new chemical entity). In Canada this occurs under the Patented Medicines (Notice of Compliance) Regulations (NOC Regulations).11
¶7 The Canadian linkage regulations were modeled after the U.S. Hatch-Waxman linkage regime,
12 under which patent protection under the Patent Act13 is legally tied to drug approval under the Food, Drug & Cosmetic Act14 via patent listings in the Orange Book.15 The NOC Regulations came into force in 1993, at which time they replaced provisions in the Patent Act directed to compulsory licensing. Prior to 1993, patent protection and regulatory approval of pharmaceuticals were governed by different statutes as well as different policy goals and objectives.16
¶8 The enabling section in the Patent Act for the NOC Regulations is contained in the section on infringement.
Thus, compared to the 400 year old patent system, the linkage regime represents a novel and emerging intellectual property paradigm for protecting pharmaceutical inventions.
17
Living Separate and Apart is Never Easy: Inventive Capacity of the PHOSITA As the Tie That Binds Obviousness and Inventiveness, 4 U. OTTAWA L. & TECH. J. 1 (2007).
11 Patented Medicines (Notice of Compliance) Regulations SOR/1993-133 (Can). 12 Drug Price Competition and Patent Term Restoration Act of 1984, 21 U.S.C § 355 (2006). 13 35 U.S.C. §§ 1-376 (2006). 14 Federal Food, Drug and Cosmetic Act, 21 U.S.C. §§ 301–97 (2006). 15 Drugs approved by the FDA are listed in its “Approved Drug Products with Therapeutic Equivalence”
publication, commonly known as the “Orange Book.” 21 U.S.C. § 355(j)(7)(A) (2006). For a description of the Orange Book in the context of patent litigation and drug development, see Andrew A. Caffrey & Jonathan M. Rotter, Consumer Protection, Patents and Procedure: Generic Drug Market Entry and the Need to Reform the Hatch-Waxman Act, 9 VA. J.L. & TECH. 1, 4-7 (2004) and Rebecca S. Eisenberg, Patents, Product Exclusivity, and Information Dissemination: How Law Directs Biopharmaceutical Research and Development, 72 FORDHAM L. REV. 477 (2003).
16 See AstraZeneca Canada Inc. v. Canada (Minister of Health), [2006] 2 S.C.R. 560, 2006 SCC 49 (Can.). In AstraZeneca Canada, the court noted that
The NOC Regulations lie at the intersection of two regulatory systems with sometimes conflicting objectives. First, is the law governing approval of new drugs, which seeks to ensure the safety and efficacy of new medications before they can be put on the market. The governing rules are set out in the Food and Drugs Act, R.S.C. 1985, c. F-27 (“FDA”) and the Food and Drug Regulations, C.R.C. 1978, c. 870. The FDA process culminates (if successful) in the issuance of a NOC to an applicant manufacturer by the Minister of Health on the advice of his officials in the Therapeutic Products Directorate. The FDA objective is to encourage bringing safe and effective medicines to market to advance the nation’s health. The achievement of this objective is tempered by a second and to some extent overlapping regulatory system created by the Patent Act, R.S.C. 1985, c. P-4. Under that system, in exchange for disclosure to the public of an invention, including the invention of a medication, the innovator is given the exclusive right to its exploitation for a period of 20 years. Until 1993, the two regulatory systems were largely kept distinct and separate.
Id. at ¶ 12 (some emphasis added). 17 The relevant provisions state that:
It is not an infringement of a patent for any person to make, construct, use or sell the patented invention solely for uses reasonably related to the development and submission of information required under any law of Canada, a province or a country other than Canada that regulates the manufacture, construction, use or sale of any product.
Patent Act, R.S.C, ch. P 4, § 55.2(1) (1985), and:
This, however, should not be taken to indicate that actions
The Governor in Council may make such regulations as the Governor in Council considers necessary for preventing the infringement of a patent by any person who makes, constructs, uses or sells a patented invention in accordance with subsection (1), including, without limiting the generality of the foregoing, regulations : (a) respecting the
NOR TH WES TERN JO URN AL O F TECH NO LO GY AND IN TE LLEC TU A L PRO PER TY [ 2 0 1 0
178
under the NOC Regulations are parallel to a conventional infringement proceeding. Drug patenting, including the legal analysis of validity and infringement, is inexorably tied to the output of the drug approval exercise. To market a drug product in Canada, drug manufacturers (brand or generic) must first obtain regulatory approval for the relevant medicinal product. The form of this approval in Canada is referred to as a Notice of Compliance (NOC), which is received from the Minister of Health pursuant to regulations promulgated under the Food and Drugs Act.18 The Minister is obliged to issue a NOC to a drug manufacturer where the drug has met all of the required regulatory standards pertaining to the safety and efficacy of the drug in question. Brand-name drug companies submit a New Drug Submission (NDS) containing “test data,” including clinical trial and experimental data, relevant to the demonstration of health and safety. Generic firms on the other hand submit an Abbreviated New Drug Submission (“ANDS”) based not on original test data but rather on bioequivalence19 to the relevant Canadian reference product.20
¶9 Under the NOC Regulations, a “first person,” typically a brand-name sponsor, may list patents on the patent register in connection with drug products for which they hold regulatory approval.
21 If a “second person,” typically a generic sponsor, files a submission that makes a comparison or reference to the first person’s drug based on bioequivalence, the Minister may not issue a NOC for the generic drug until the second person has addressed all listed patents. As noted above, where a generic firm files a submission that makes a comparison or reference to the first person’s drug, regulators may not issue a NOC to the generic until the second person has addressed all relevant listed patents. This means the second person must accept that it will either not obtain regulatory approval relevant to its ANDS until expiry of all listed patents22
conditions that must be fulfilled before a notice, certificate, permit or other document concerning any product to which a patent may relate may be issued to a patentee or other person under any Act of Parliament that regulates the manufacture, construction, use or sale of that product, in addition to any conditions provided for by or under that Act . . . .
Patent Act, R.S.C, ch. P 4, § 55.2(4). 18 Food and Drug Regulations, C.R.C., ch. 870 (1978). 19 The term “bioequivalence” refers to the scientific basis on which generic and brand-name drugs are
compared. To be considered bioequivalent, the bioavailability of two products must not differ significantly when the two products are given in studies at the same dosage under similar conditions. A product may still however be considered bioequivalent to a second product with different pharmacological or pharmaceutical characteristics if the difference is noted in the labelling and doesn't affect the drug's safety or effectiveness or change the drug's effects in any medically significant way. In its Guidance Document, the FDA defines bioequivalence as:
[T]he rate and extent to which the active ingredient or active moiety is absorbed from a drug product and becomes available at the site of action. For drug products that are not intended to be absorbed into the bloodstream, bioavailability may be assessed by measurements intended to reflect the rate and extent to which the active ingredient or active moiety becomes available at the site of action.
or to avoid this situation it must serve an “allegation” on the first person (Notice of Allegation) that
FOOD AND DRUG ADMIN., U.S. DEP’T OF HEALTH AND HUMAN SERVS., GUIDANCE FOR INDUSTRY: BIOAVAILABILITY AND BIOEQUIVALENCE STUDIES FOR ORALLY ADMINISTERED DRUG PRODUCTS — GENERAL CONSIDERATIONS (2003), available at http://www.fda.gov/downloads/Drugs/GuidanceComplianceRegulatoryInformation/Guidances/ucm070124.pdf.
20 Food and Drug Regulations, C.R.C., § C.08.002.1. 21 Patented Medicines (Notice of Compliance) Regulations SOR/1993-133, §§ 3, 4 (Can). 22 Id. at § 5(1)(a).
Vol. 8:2] Ron A. Bouchard et al.
179
the listed patent or patents are invalid or will not be infringed by its submission,23 together with a detailed statement of the legal and factual basis of the allegation.24 When served with a Notice of Allegation a brand-name sponsor may within 45 days commence a judicial review application for an order that the NOC not be issued to the generic sponsor.25
¶10 Where the brand-name sponsor does commence such an application, a NOC will not be issued until the earliest of 24 months, until determination of the issues in court, or patent expiry.
26 In other words, by merely commencing the proceeding, the applicant receives an automatic injunction (also referred to an “automatic stay”) under circumstances where the merits of the case are not determined by the court and indeed without having to satisfy the criteria courts would normally require before enjoining issuance of an NOC.27 At the hearing of a judicial review application under the NOC Regulations the court must determine whether the generic manufacturer’s allegation is legally “justified.” If the court finds the allegation is not so justified, the court must issue an “order of prohibition” preventing the Minister from issuing the NOC until patent expiry.28 If, on the other hand, the court finds the allegation is justified, the application is dismissed,29
¶11 Unlike parallel litigation under the U.S. Hatch-Waxman linkage regime, an action under the NOC Regulations is by way of judicial review. Therefore, it does not constitute an action for infringement.
and a NOC may be granted to the generic sponsor provided that regulatory review is complete and no other litigation is outstanding.
30 A formal decision on patent infringement or validity cannot be determined in NOC proceedings, notwithstanding the fact that judicial pronouncements on validity or infringement amount to the same thing and utilize infringement case law as precedent.31 The Federal Court of Appeal has held that the object of litigation under the NOC Regulations is solely to decide issuance of a NOC under the Food and Drug Regulations.32 If a party seeks a formal decision on patent infringement or invalidity, they must avail themselves of remedies under the Patent Act.33 Indeed, recent cases have arisen where pharmaceutical patents have been deemed either invalid or not infringed under NOC Regulations and valid or infringed in a later infringement proceeding.34
23 Id. at § 5(1)(b). 24 Id. at § 5(3)(a). 25 Id. at § 6(1). 26 Id. at § 7. If litigation was commenced prior to March 12, 1998 however, the automatic stay was 30
months as under U.S. Hatch-Waxman legislation. 27 See Bayer A.G. v. Canada, [1993], 51 C.P.R. (3d) 329, 337 (Can.); Merck Frosst Canada Inc. v.
Apotex, [1998] 80 C.P.R. (3d) 368, ¶ 33 (Can.). 28 Patented Medicines (Notice of Compliance) Regulations SOR/1993-133, at § 6(1). 29 See Pharmacia Inc. v. Canada, [1994] 58 C.P.R. (3d) 209, 217 (Can.); Pfizer Canada Inc. v. Nu-Pharm
Inc., [1998] 83 C.P.R. (3d) 1, 4 (Can.); Apotex Inc. v. Canada, [1997] 76 C.P.R. (3d) 1, 11-12 (Can.). 30 See Eli Lilly & Co. v. Apotex Inc., [1997] 76 C.P.R. (3d) 1, 5–6 (Can.). 31 Ron A. Bouchard, Should Scientific Research in the Lead-up to Invention Vitiate Obviousness Under
the Patented Medicines (Notice of Compliance) Regulations: To Test or Not to Test?, 6 CAN. J. L. TECH. 1 (2007); Ron A. Bouchard, Living Separate and Apart is Never Easy: Inventive Capacity of the PHOSITA as the Tie that Binds Obviousness and Inventiveness in Pharmaceutical Litigation, 4 Ottawa L. & Tech. J. (In Press), available at SSRN: http://ssrn.com/abstract=958927 (2007).
32 Merck Frosst Canada Inc. v. Canada [1994] 55 C.P.R. (3d) 302, 319 (Can.). 33 See Pharmacia Inc., 58 C.P.R. (3d), at 217; Merck Frosst Canada Inc., 55 C.P.R. (3d) at 320. 34 Bouchard, supra note 10, at 7-18.
NOR TH WES TERN JO URN AL O F TECH NO LO GY AND IN TE LLEC TU A L PRO PER TY [ 2 0 1 0
180
¶12 Judicial review under the NOC Regulations is considered to be an expedited proceeding, and thus summary in nature. Therefore, it does not entail full exploration of evidentiary matters that would otherwise be before the court in an infringement proceeding,35
¶13 Under the provisions of the Canadian linkage regime, each patent listed on the patent register must be demonstrated in litigation to be invalid or not infringed for generic market entry. The patent register is thus said to be “the linchpin of the NOC Regulations” regime.
particularly viva voce evidence that is otherwise central to a patent infringement proceeding. Rather, litigation consists of an out of court exchange of affidavit evidence and cross-examination, followed by a 1-2 day hearing. Typically, numerous motions precede the actual hearing, including multiple variations on those to receive or exclude evidence. Even though judicial review proceedings under the NOC Regulations are deemed to be summary in nature, in practice it can often take up to two years to get to a hearing, which is roughly equivalent to the time required to obtain regulatory approval.
36 The threshold for listing is relevance to an existing drug product. Early Federal Court of Appeal jurisprudence in Eli Lilly v. Canada37 rejected the notion of a strict relevance requirement, opting instead for a narrow statutory reading to the effect that patents need only be relevant to a medicine rather than the drug form specifically approved by regulators. In other words, patents could be listed generally for a drug rather than against a specific drug submission. In 2006, the government issued a Regulatory Impact Analysis Statement (RIAS) accompanying amendments to the NOC Regulations explaining that listed patents were required to contain at least one specific claim to the medical ingredient, formulation, dosage form or use for which approval was granted.38 This was followed by the decision of the Supreme Court of Canada in AstraZeneca v. Canada,39
35 Merck Frosst Canada Inc., 55 C.P.R (3d) at 320. 36 Wyeth Canada v. Ratiopharm Inc., [2007] 60 C.P.R. (4th) 375, ¶ 22 (Can.). In Wyeth Canada, the
court elaborated: Pursuant to subsection 4(1) of the NOC Regulations, the right to have a patent listed on the patent register in respect of a certain drug may be exercised only by a drug manufacturer that has filed a NDS for that drug. That provision is enforced through subsection 4(5), which provides that a patent list must identify the NDS to which it relates and the date on which the NDS was filed. In addition, subsection 3(3) of the NOC Regulations provides that a patent cannot be listed until the NDS that is the basis for the listing application is approved by the Minister and a NOC is issued for the drug in response to that NDS. Thus, every patent listing is permanently tied to a specific NOC filed by the innovator and its originating NDS, as well as to the drug in respect of which the patent is listed. For that reason, a particular patent listing may be identified as a listing ‘against’ a certain NOC.
37 Eli Lilly Canada v. Canada, [2003] 3 F.C. 140 (Can.). 38 The Regulatory Impact Analysis Statement accompanying SOR/2006-242 contains an in depth
discussion of that policy, as well as the role played by the PM(NOC) Regulations. The history of the relevance requirement is reviewed in a later Regulatory Impact Analysis Statement relating to the Patented Medicines (Notice of Compliance) Regulations PM(NOC) Regulations) issued April 3, 2009.
39 AstraZeneca Canada Inc. v. Canada, [2006] 2 S.C.R. 560, 2006 SCC 49 (Can.).
which supported a specific relevance requirement and cast doubt on the reasoning employed by lower courts in defending a general listing requirement. The Federal Court of Appeal, citing AstraZeneca, reversed its earlier ruling that a patent containing a claim for the medicine in a drug is listed generally against the drug, rather than against the specific submission for a notice of compliance upon which
Vol. 8:2] Ron A. Bouchard et al.
181
the patent list is based.40 The government issued a revised guidance document in 2009 attempting to harmonize previous jurisprudence and policy grounds supporting a specific listing requirement.41
¶14 The intensity of the volleying back and forth between litigants, legislators, and the courts over the issue of relevance suggests that framing a system of pharmaceutical innovation around the nexus between drugs that have already been approved and continuing patenting activity on these older products represents a contentious model of innovative drug development. As noted by the Federal Court of Appeal in Wyeth v. Ratiopharm, a generic sponsor initially may be “required to address every patent listed in respect of the Canadian reference product to which the proposed generic version is compared, whether or not the patent is properly listed.”
42 While the U.S. and Canada are currently the only two jurisdictions formally employing linkage regulations to stimulate innovation, there is movement afoot to institute linkage regulation regimes in other jurisdictions at the same time as the U.S. moves towards including provisions of this nature more broadly in its international trade agreements.43 As with the patent bargain, the stated purpose of the linkage regulations regime is to provide monopoly rights to private firms in exchange for new and innovative drugs while at the same time facilitating the timely entry of generic drugs.44
¶15 The combination of the automatic injunction, the low relevance requirement for listing patents on the patent register, the potentially endless number of patents listed for attractive drug candidates, and the summary nature of the proceedings compared to conventional infringement actions is viewed by many to present an effective and efficient mechanism for brand-name sponsors to “evergreen” blockbuster products coming off patent.
45
40 Wyeth Canada, 60 C.P.R. (4th) 375 at 29. 41 Guidance Document: Patented Medicines (Notice of Compliance) Regulations, http://www.hc-
sc.gc.ca/dhp-mps/prodpharma/applic-demande/guide-ld/patmedbrev/pmreg3_mbreg3-eng.php (Apr. 3, 2008).
42 Wyeth Canada, 60 C.P.R. (4th) 375 at 34. 43 Judit Rius Sanjuan, Patent-Registration Linkage (Apr. 3, 2006) (unpublished manuscript, on file with
the Consumer Project on Technology), available at http://www.cptech.org/publications/CPTechDPNo2Linkage.pdf.
44 The “original policy intent” of Parliament in enacting the NOC Regulations—to balance patent enforcement over new and innovative drugs with the timely market entry of generic drugs—is set out in numerous government Regulatory Impact Analysis Statements (RIASs), which the Supreme Court of Canada ruled are proper evidence of legislative intent. See Biolyse Pharma Corp. v. Bristol-Myers Squibb Co., [2005] 1 S.C.R. 533, 2005 SCC 26, ¶¶ 47, 156-157 (Can.). Evidence of legislative intent regarding balancing patent enforcement and generic entry can be found in early RIAS documents. For example, see: C. Gaz. Vol. 132, No. 7 – March 12, 1998; C. Gaz. Vol. 133, No. 21 – October 1, 1999. Evidence of legislative intent regarding both balancing patent enforcement and generic entry in the context of the “original policy intent” of encouraging development of new and innovative drugs can be found in later RIAS and Guidance Documents. For example, see: C. Gaz. Vol. 138, no. 50 – December 11, 2004; C. Gaz. Vol. 140, No. 24 - June 17, 2006; C. Gaz. Vol. 142, No. 13 – June 25, 2008. An example of the latter language is found in the June 17, 2006 RIAS (at 1510), which states: “The Government's pharmaceutical patent policy seeks to balance effective patent enforcement over new and innovative drugs with the timely market entry of their lower priced generic competitors. The current manner in which that balance is realized was established in 1993, with the enactment of Bill C-91, the Patent Act Amendment Act, 1992, S.C. 1993, c. 2.” (emphasis added). For commentary relating to U.S. linkage regulations, see Caffrey & Rotter, supra note 15.
The ability of the linkage regulations regime to provide a broad scope of
45 “Evergreening” refers to undue extension of the statutory monopoly attached to drug product by means of listing on the patent register multiple patents with obvious or uninventive modifications. Under
NOR TH WES TERN JO URN AL O F TECH NO LO GY AND IN TE LLEC TU A L PRO PER TY [ 2 0 1 0
182
intellectual property protection to follow-on drugs in particular is enhanced in light of the wide definition of a new active substance (NAS), the wide range of chemical modifications to existing drugs allowed under the follow-on, or supplemental new drug submission (SNDS), the approval pathway, and the wide berth given for drugs to undergo expedited review.
¶16 Given the legal requirement that patent protection under the NOC Regulations is specific to a particular submission, the wide berth for approval of new (NAS) and follow-on (SNDS) drugs raises the possibility of a paradoxical drug approval-drug patenting linkage. For example, in both policy documents and case law, it is invariably assumed that there is a positive, if not linear, correlation between the scope of intellectual property protection afforded by the linkage regime and the degree of innovation associated with a particular drug product. A positive (and linear) correlation would be consistent with the intent of the federal government to balance patent enforcement over new and innovative drugs with the timely market entry of generic drugs. However, the fact that pharmaceutical companies are focusing more on evergreening older products and on incremental drug development rather than breakthrough drug development suggests that firms may be leveraging legal loopholes favouring enhanced patent protection for drugs with low innovative value. This may undermine the intent of government to use the “special enforcement provisions” of the linkage regime to protect only those patents associated with new and innovative drugs. To the extent patent protection is extended for already marketed drugs, it might also contravene the second pillar of the government’s policy to facilitate the timely market entry of lower priced generic products.
¶17 Given the discussion thus far, it is not surprising that concerns have been voiced with increasing frequency over the willingness of the public to underwrite the high cost of drugs that are extensions of already marketed products and that offer little or no improvement in therapeutic value.46
such circumstances, the patentee prolongs its monopoly beyond what the public has agreed to pay. See Whirlpool Corp. v. Camco Inc., [2000] 2 S.C.R. 1067, 2000 SCC 67, ¶ 37 (Can.); Bristol-Myers Squibb Co. v. Canada (Attorney General), [2005] 1 S.C.R. 533, 2005 SCC 26, ¶ 66; AstraZeneca Canada Inc. v. Canada, [2006] 2 S.C.R. 560, 2006 SCC 49, ¶ 39. According to the highly regarded “Romanow Report”:
A particular concern with current pharmaceutical industry practice is the process of “evergreening,” where manufacturers of brand name drugs make variations to existing drugs in order to extend their patent coverage. This delays the ability of generic manufacturers to develop cheaper products for the marketplace and it is a questionable outcome of Canada’s patent law.
COMM’N ON THE FUTURE OF HEALTH CARE IN CANADA, BUILDING ON VALUES: THE FUTURE OF HEALTH CARE IN CANADA 208 (2002), available at http://www.cbc.ca/healthcare/final_report.pdf. In the U.S., undue use of linkage regulations to prolong the patent monopoly has been referred to as “abuse of the automatic stay provision.” See Caffrey & Rotter, supra note 15, at 13.
46 See generally JAMES LOVE, CONSUMER PROJECT ON TECH., EVIDENCE REGARDING RESEARCH AND DEVELOPMENT INVESTMENTS IN INNOVATIVE AND NON-INNOVATIVE MEDICINES (2003), available at http://www.cptech.org/ip/health/rnd/evidenceregardingrnd.pdf; Joel Lexchin, Intellectual Property Rights and the Canadian Pharmaceutical Marketplace: Where Do We Go From Here?, 35 INT’L. J. HEALTH SERV. 237, 243 (2005); Drugs in 2001: A Number of Ruses Unveiled, 11 PRESCRIBE INT’L 58 (2002); see also Ron A. Bouchard & Trudo Lemmens, Privatizing Biomedical Research—A ‘Third Way’, 26 NATURE BIOTECHNOLOGY 31 (2008). But see Joshua Cohen & Kenneth Kaitin, Follow-On Drugs and Indications: The Importance of Incremental Innovation to Medical Practice, 15 AM. J. THERAPEUTICS 89 (2008).
Therapeutic product development therefore represents an excellent target for empirical studies of the relationship between legal incentives for innovation and resulting product development. As pointed out repeatedly
Vol. 8:2] Ron A. Bouchard et al.
183
over the last decade,47
¶18 Our goal in the current study is to empirically probe the legal and functional link between drug approval, drug patenting, and drug litigation for high value pharmaceutical innovations. As already noted, patenting and litigation under linkage regulations are critical to both brand-name and generic markets, as they represent the primary mechanism by which regulators promote drug development in exchange for intellectual property rights. We were also interested in gathering data pertaining to the manner in which certain characteristics of drug approval-drug patenting linkage, such as how the threshold requirements for an NAS, SNDS approval and expedited review, might direct firm patenting and linkage regulations activities.
robust conclusions regarding the consequences for technological innovation of changes in patent policy are few and far between, in large part owing to a lack of empirical data. The same applies in the reverse, as governments have specific legal and policy goals in mind when drafting law and regulations that are reviewable by the courts in judicial review proceedings. The present study was designed specifically to investigate whether and how the NOC Regulations have encouraged the development of new and innovative drugs since being enacted.
III. METHODS
A. General
¶19 The term “drug approval-drug patent linkage” is used throughout this Article to refer to the specific legal nexus between drug approval under food and drug law and drug
47 See, e.g., Adam B. Jaffe, The U.S. Patent System in Transition: Policy Innovation and the Innovation Process, 29 RESEARCH POL’Y 531 (2000), available at http://ssrn.com/abstract=198989. Jaffe notes that it is possible that the R&D boom in the late 1970s and early 1980s would not have been so large or lasted so long without enhanced IP rights, that it is “disquieting, however, that there is so little empirical evidence that what is widely perceived to be a significant strengthening of intellectual property protection had significant impact on the innovation process.” Id. at 540. He also notes that “[o]verall, there is a noticeable gap between the highly developed theoretical literature on patent scope and the limited empirical literature.” Id. at 548. He posits that “[t]his limited success is due partially to the difficulty of measuring the parameters of patent policy, and partly due to the difficulty of discerning statistically significant effects when many things have been changing at the same time. But it should surely be viewed as a challenge to researchers to try to do more.” Id. at 554. Other authors suggest that
the range of arguments about the positive social value of patents is obviously much wider than the area of strong empirical studies explored to date. An analyst, citing earlier studies that appear to have shown limited social value, obviously is vulnerable to the argument that those studies do not provide evidence on some of the possibly most important functions patents serve. . . . .
We cannot present here an empirically supported and intellectually persuasive argument on this broad question. The important empirical research that needs to be done in order to map out the basic facts simply has not been done yet . . . .
Roberto Mazzoleni & Richard Nelson, The Benefits and Costs of Strong Patent Protection: a Contribution to the Current Debate, 27 RESEARCH POL’Y 273, 280 (1998). In a meta-analysis of empirical studies of whether introducing or strengthening patent protection leads to greater innovation, Boldrin and Levine “identified twenty three economic studies that have examined this issue empirically. . . . The executive summary: these studies find weak or no evidence that strengthening patent regimes increases innovation; they find evidence that strengthening the patent regime increases . . . patenting!” BOLDRIN & LEVINE, supra note 9, at 192. See also Keith Pavitt, National Policies for Technical Change: Where Are the Increasing Returns to Economic Research?, 93 PROCEEDINGS NAT’L ACAD. SCI. 12693 (1996); JAMES BESSEN & MICHAEL J. MEURER, PATENT FAILURE: HOW JUDGES, BUREAUCRATS, AND LAWYERS PUT INNOVATORS AT RISK (2008).
NOR TH WES TERN JO URN AL O F TECH NO LO GY AND IN TE LLEC TU A L PRO PER TY [ 2 0 1 0
184
patenting under patent legislation via the linkage regulations regime, in this case the Patented Medicine (Notice of Compliance) Regulations, or NOC Regulations. Drugs were analysed in this study in two ways. First, the characteristics of the entire cohort of 95 drugs (Cohort) were evaluated. Patenting per calendar year, patenting expressed as year after the first instance on the drug, patent listing per year, cumulative patenting and patent listing, and the temporal lag between the average date of drug approval, the average date of patent issue and the average date of patent listing were also explored. Finally, patent type classifications and therapeutic class for drugs and patents for the Cohort were investigated. Secondly, drugs were sub-divided into 4 further groups: Most Profitable drugs (n=33), Priority Review (n=40), drugs receiving an NOC with conditions (NOC/c; n=16) and drugs receiving NOC/c approvals that were also approved via Priority Review (PR-NOC/c; n=6). All drugs had at least one approval in between 2001 and 2008, as described in Sawicka & Bouchard.48
¶20 As indicated by the designations just described, expedited approvals were divided into three categories. The reason for this approach is that NOCs can be granted in an expedited fashion under Canadian food and drug law in two primary ways which can be combined to create a third category.
Drugs were thus split into categories representing products already vetted by the market to be blockbuster in nature and those that were granted expedited review status by regulators in the hopes they would be.
49 The first is through Priority Review,50 which refers to the fast-tracking of eligible drug candidates intended for the treatment, prevention, or diagnosis of serious, life-threatening or severely debilitating diseases or conditions wherein there exists an unmet medical need or for which a substantial improvement in the benefit-risk profile is demonstrated.51 Evidentiary requirements for safety, efficacy, and quality parallel those for non-priority submissions; the main difference being an accelerated review time.52 The second is the “NOC with conditions” (NOC/c) pathway.53 NOC/c approval is granted for eligible NDS or SNDS submissions directed to serious, life-threatening or severely debilitating diseases or conditions for which there is promising evidence of clinical effectiveness based on available data.54 In addition to less onerous evidentiary requirements, the review process for NOC/c approval is significantly accelerated.55
48 Monika Sawicka & Ron A. Bouchard, Empirical Analysis of Canadian Drug Approval Data 2001-
2008: Are Pharmaceutical Players “Doing More With Less?”, 3 MCGILL J.L. & HEALTH. 87 (2009). 49 For a detailed discussion of expedited review pathways in Canada, see Ron A. Bouchard & Monika
Sawicka, The Mud and the Blood and the Beer: Canada’s Progressive Licensing Framework for Drug Approval, 3 MCGILL J.L. & HEALTH 51, 56-60 (2009).
50 HEALTH CANADA, GUIDANCE FOR INDUSTRY: PRIORITY REVIEW OF DRUG SUBMISSIONS (2006), available at http://www.hc-sc.gc.ca/dhp-mps/alt_formats/hpfb-dgpsa/pdf/prodpharma/priordr-eng.pdf.
51 Id. at 1-2. 52 See Trudo Lemmens & Ron A. Bouchard, Regulation of Pharmaceuticals in Canada, in CANADIAN
HEALTH LAW AND POLICY 326, 328 (Jocelyn Downie, Timothy Caulfield & Colleen Flood, eds., Toronto: LexisNexis, 3d ed. 2007).
The main difference with Priority Review is that NOC/c licensure is
53 NOC/c approvals are granted pursuant to § C.08.004(1), in compliance with the conditions of use stipulated in § C.08.002(1)(g), C.08.002(1)(h), C.08.006(2)(b), and C.05.006(2)(a) of the Food and Drug Regulations, supra note 18.
54 HEALTH CANADA, GUIDANCE FOR INDUSTRY: NOTICE OF COMPLIANCE WITH CONDITIONS (2007), available at http://www.hc-sc.gc.ca/dhp-mps/alt_formats/hpfb-dgpsa/pdf/prodpharma/noccg_accd-eng.pdf.
55 HEALTH CANADA, ACCESS TO THERAPEUTIC PRODUCTS: THE REGULATORY PROCESS IN CANADA – TARGET REVIEW TIMES (2006), available at http://www.hc-sc.gc.ca/ahc-asc/pubs/hpfb-dgpsa/access-therapeutic_acces-therapeutique-eng.php#6.2.
Vol. 8:2] Ron A. Bouchard et al.
185
granted on the condition that the sponsor perform additional studies to confirm alleged benefits. The third category, PR-NOC/c approvals, are drugs that represent the highest potential value for pharmaceutical firms. This is because of the combination of expedited review with lower pre-approval evidentiary requirements that would be seen by regulators to be aimed at target populations with the highest degree of unmet medical needs and/or benefit/risk.
¶21 The Canadian Intellectual Property Office (CIPO) website provides public access to its comprehensive electronic database housing all patents issued or pending issuance in Canada. The database contains patent documents from 1869 to the present. The electronically available patent information consists of patent document images which include the patent cover page, abstract, claims, description, drawings and bibliographic and text data which provide a patent summary, patent details and the patent claims excised of all drawings.56
¶22 Presently, the database permits searching for patent documents by number, by words in the invention, inventor country, owner, owner country, title, abstract, and claims’ fields or by International Patent Classification (IPC), Canadian Patent Classification (CPC), Patent Cooperation Treaty (PCT) applications, availability of license, and language of filing. These searches can be combined or modified by Boolean operators and restricted to selected date ranges on any date field. The search results screen lists all patents captured by a particular search string by their patent number and truncated title. Details of patents can be viewed by clicking on the patent number.
The online portal allows for searches to be performed against the bibliographic and text data fields only. Images are not searchable but can be viewed for any particular patent that has been returned in a given search.
¶23 Patents within the CIPO database are not classified according to claimed uses for which the inventions have acquired patent protection or by the products and technologies that apply or make use of the protected invention. This makes it difficult to link patented inventions to the commercial products for which they provide exclusivity. In the case of medicinal drugs, this shortcoming makes it difficult to link drug patents to the brand-name drug products for which they provide brand-name pharmaceutical companies with commercial exclusivity. Canadian brand-name pharmaceutical companies can voluntarily list patents relevant to drug products approved for use and sale in Canada by registering these patents with the Canadian Patent Register (CPR) pursuant to NOC Regulations. As noted supra, patent listing under the CPR is analogous to listing of patents in the Orange Book under the U.S. Hatch-Waxman linkage regime. As registering patents is voluntary and at the discretion of the individual pharmaceutical companies, the patent list cannot be considered comprehensive or even representative of all patents associated with a specific drug product. Specific searches of the CIPO and other data bases were thus undertaken.
56 In particular, the Patent Summary includes the patent number, application number, English title,
French title, and abstract, and the Patent Details include the patent’s Canadian Patent Classification (CPC), International Patent Classification, Inventors, Owners, Applicants, Agent, Date of Issue, Date of Filing, the availability of a license, the language of filing, Patent Cooperation Treaty (PCT) status, and application priority date.
NOR TH WES TERN JO URN AL O F TECH NO LO GY AND IN TE LLEC TU A L PRO PER TY [ 2 0 1 0
186
B. Drug Patenting
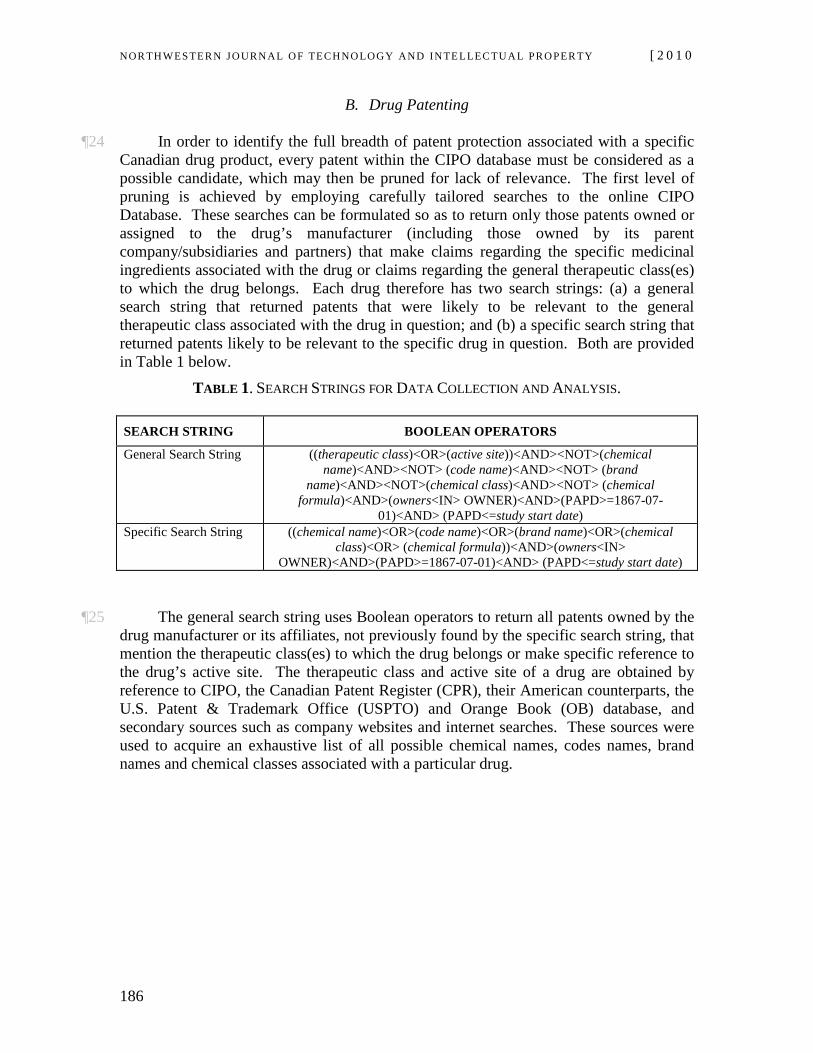
¶24 In order to identify the full breadth of patent protection associated with a specific Canadian drug product, every patent within the CIPO database must be considered as a possible candidate, which may then be pruned for lack of relevance. The first level of pruning is achieved by employing carefully tailored searches to the online CIPO Database. These searches can be formulated so as to return only those patents owned or assigned to the drug’s manufacturer (including those owned by its parent company/subsidiaries and partners) that make claims regarding the specific medicinal ingredients associated with the drug or claims regarding the general therapeutic class(es) to which the drug belongs. Each drug therefore has two search strings: (a) a general search string that returned patents that were likely to be relevant to the general therapeutic class associated with the drug in question; and (b) a specific search string that returned patents likely to be relevant to the specific drug in question. Both are provided in Table 1 below.
TABLE 1. SEARCH STRINGS FOR DATA COLLECTION AND ANALYSIS.
SEARCH STRING BOOLEAN OPERATORS
General Search String ((therapeutic class)<OR>(active site))<AND><NOT>(chemical name)<AND><NOT> (code name)<AND><NOT> (brand
name)<AND><NOT>(chemical class)<AND><NOT> (chemical formula)<AND>(owners<IN> OWNER)<AND>(PAPD>=1867-07-
01)<AND> (PAPD<=study start date) Specific Search String ((chemical name)<OR>(code name)<OR>(brand name)<OR>(chemical
class)<OR> (chemical formula))<AND>(owners<IN> OWNER)<AND>(PAPD>=1867-07-01)<AND> (PAPD<=study start date)
¶25 The general search string uses Boolean operators to return all patents owned by the drug manufacturer or its affiliates, not previously found by the specific search string, that mention the therapeutic class(es) to which the drug belongs or make specific reference to the drug’s active site. The therapeutic class and active site of a drug are obtained by reference to CIPO, the Canadian Patent Register (CPR), their American counterparts, the U.S. Patent & Trademark Office (USPTO) and Orange Book (OB) database, and secondary sources such as company websites and internet searches. These sources were used to acquire an exhaustive list of all possible chemical names, codes names, brand names and chemical classes associated with a particular drug.
Vol. 8:2] Ron A. Bouchard et al.
187
Process
Chemical (enantiomer)
Combination Therapy
Delivery
Chemical (salt)
Combination Therapy
SALMETEROL
FLUTICASONE
ADVAIR
ADVAIR +
DISKUS
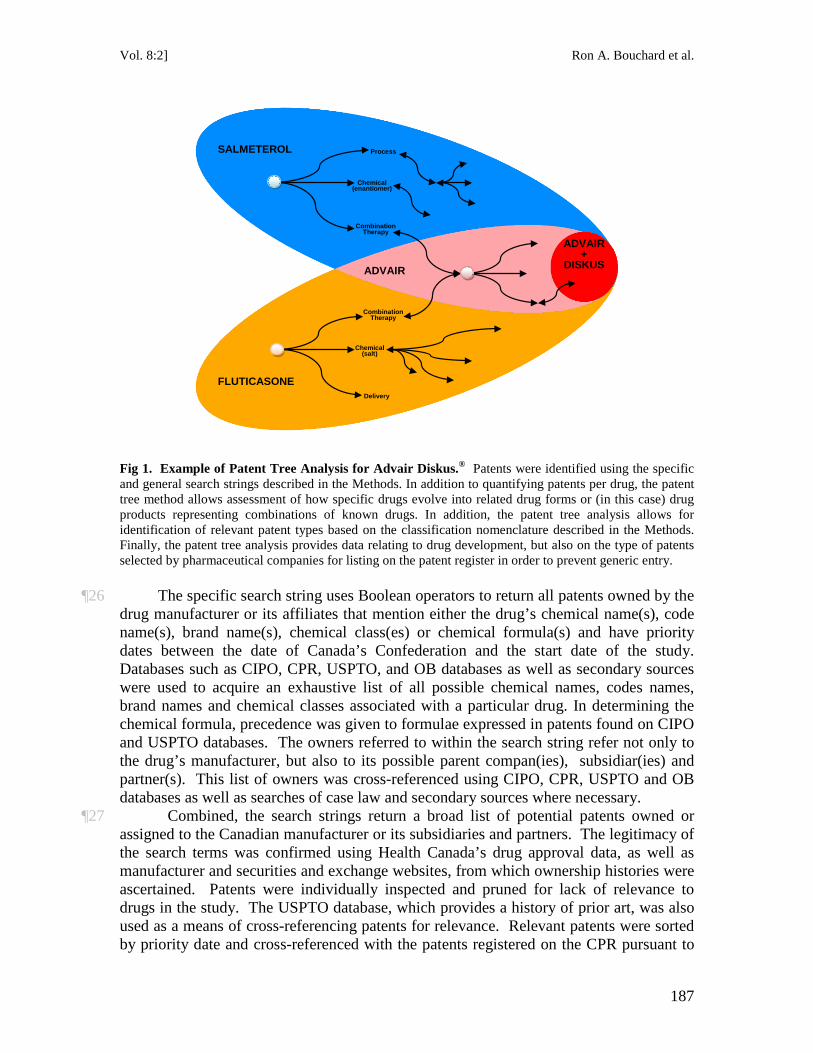
Fig 1. Example of Patent Tree Analysis for Advair Diskus.®
¶26 The specific search string uses Boolean operators to return all patents owned by the drug manufacturer or its affiliates that mention either the drug’s chemical name(s), code name(s), brand name(s), chemical class(es) or chemical formula(s) and have priority dates between the date of Canada’s Confederation and the start date of the study. Databases such as CIPO, CPR, USPTO, and OB databases as well as secondary sources were used to acquire an exhaustive list of all possible chemical names, codes names, brand names and chemical classes associated with a particular drug. In determining the chemical formula, precedence was given to formulae expressed in patents found on CIPO and USPTO databases. The owners referred to within the search string refer not only to the drug’s manufacturer, but also to its possible parent compan(ies), subsidiar(ies) and partner(s). This list of owners was cross-referenced using CIPO, CPR, USPTO and OB databases as well as searches of case law and secondary sources where necessary.
Patents were identified using the specific and general search strings described in the Methods. In addition to quantifying patents per drug, the patent tree method allows assessment of how specific drugs evolve into related drug forms or (in this case) drug products representing combinations of known drugs. In addition, the patent tree analysis allows for identification of relevant patent types based on the classification nomenclature described in the Methods. Finally, the patent tree analysis provides data relating to drug development, but also on the type of patents selected by pharmaceutical companies for listing on the patent register in order to prevent generic entry.
¶27 Combined, the search strings return a broad list of potential patents owned or assigned to the Canadian manufacturer or its subsidiaries and partners. The legitimacy of the search terms was confirmed using Health Canada’s drug approval data, as well as manufacturer and securities and exchange websites, from which ownership histories were ascertained. Patents were individually inspected and pruned for lack of relevance to drugs in the study. The USPTO database, which provides a history of prior art, was also used as a means of cross-referencing patents for relevance. Relevant patents were sorted by priority date and cross-referenced with the patents registered on the CPR pursuant to
NOR TH WES TERN JO URN AL O F TECH NO LO GY AND IN TE LLEC TU A L PRO PER TY [ 2 0 1 0
188
linkage regulations. Each patent identified in this manner is recorded within a comprehensive database that classifies each patent by drug product, International Patent Code, owner(s), filling date, issue date, priority date, patent type and presence on the Canadian Patent Register. All of this information is easily obtained for each patent on CIPO except for the patent type and the patent’s presence on the CPR. In all, the two search strings returned over 20,000 patents for analysis. Patents were reviewed and pruned for relevance according to the methodology described. The resulting database contained 3,850 patents deemed relevant to the Cohort of 95 drugs. Patent trees where constructed whereby the number, type and timing of patents granted in relation to a specific drug or follow-on drugs could be assessed and visualized. An example of such an analysis is provided in Fig. 1.
C. Patent Listing
¶28 Patents may be listed on the Canadian Patent register (CPR) provided that they are legally relevant to the already marketed Canadian Drug Product against which they are listed. A patent’s presence on the CPR thus signals that the listing pharmaceutical company acknowledges the patent to be an effective mechanism to enforcing its commercial exclusivity on the drug product to which the patent has been linked. Registered patents are typically the subject of much litigation and constitute valuable data regarding how many patents granted for a specific drug product are listed on the CPR and thus deemed valuable by pharmaceutical companies in regards to protecting blockbuster drugs coming off patent.57
D. Patent Class
The CPR website provides access to all patents currently registered to brand-name firms in relation to Canadian Drug Products and also provides the data for all patents removed from the register due to expiration or invalidity since 2002. Upon request, the CPR was able to provide additional information regarding patents that were removed from the database prior to 2002 for the purposes of this study. The comprehensive database obtained provides an exhaustive list of all patents that effectively contribute to the commercial exclusivity of Canadian Drug Products investigated in this study. We quantified patents identified that were listed on the Canadian Patent Register under the NOC Regulations. Patents listed on the register can be litigated numerous times owing to the fact that they can be listed for multiple Drug Identification Numbers (DINs) under the NOC Regulations. For our purposes, only the date of first instance (the earliest date on which the patent was registered) for each patent was collected and analyzed.
¶29 The growing divergence between breakthrough drugs and “me too” and Line Extension drugs is becoming of increasing concern to policy-makers and payers in light of the growing basket of intellectual property and regulatory rights attached to these products regardless of whether they are new or follow-on in nature. The primary regulatory mechanisms underpinning patent and linkage incentives for developing
57 For a discussion of evergreening in the context of U.S. and Canadian linkage regulations, see Caffrey
& Rotter, supra note 15 and Hore, supra note 10.
Vol. 8:2] Ron A. Bouchard et al.
189
follow-on drugs are: the broad range of substances falling within the definition of a New Active Substance (NAS) and the range of substances and uses meeting the requirements for a Supplemental New Drug Submission (SNDS) supporting line extension and other follow-on drugs.
¶30 Previously referred to as a “New Chemical Entity” (NCE),58 the definition of a NAS encompasses a wide range of chemically active substances, including (a) a chemical or biological substance not previously approved for sale as a drug, (b) an isomer, derivative, or salt of a chemical substance that is already approved for sale as a drug but differing in properties with regard to safety and efficacy, or (c) a biological substance previously approved for sale as a drug, but differing in molecular structure, nature of the source material or even manufacturing process.59 The scope of regulatory approval based on a NAS is therefore very broad, and forms the basis for a wide berth of new (NDS) and supplementary (SNDS) drug submissions, including whether drugs are classified as First in Class or “Me Too” drugs.60 An SNDS in particular may be filed for changes to a drug that is already marketed by a sponsor,61 including minor changes to dosage, strength, formulation, manufacture, labelling, route of administration, or indication.62 Thus, small changes in chemical properties, route of administration or use may result in approval within NDS or SNDS approval streams. Importantly, patents may be listed on the patent register in respect of both NDS and SNDS drugs.63
58 Letter from E. Somers, Health Canada, on New Active Substances (June 4, 1991), available at
http://www.hc-sc.gc.ca/dhp-mps/alt_formats/hpfb-dgpsa/pdf/prodpharma/nas_nsa_pol-eng.pdf [hereinafter Health Canada, New Active Substances Letter]; Health Canada, NOC Database Terminology (Oct. 1, 2004), available at http://www.hc-sc.gc.ca/dhp-mps/prodpharma/notices-avis/noc-acc/term_noc_acc-eng.php.
59 Health Canada “NAS”, supra note 58; see also Health Canada NOC Database Terminology, supra note 58.
60 Sawicka & Bouchard, supra note 49. 61 Food and Drug Regulations, C.R.C., § C.08.003. 62 Id. at § C.08.003(2). See also Lemmens & Bouchard, supra note 52, at 326. 63 According to §§ 4(2) and 4(3) of the NOC Regulations:
(2) A patent on a patent list in relation to a new drug submission is eligible to be added to the register if the patent contains (a) a claim for the medicinal ingredient and the medicinal ingredient has been approved through the issuance of a notice of compliance in respect of the submission; (b) a claim for the formulation that contains the medicinal ingredient and the formulation has been approved through the issuance of a notice of compliance in respect of the submission; (c) a claim for the dosage form and the dosage form has been approved through the issuance of a notice of compliance in respect of the submission; or (d) a claim for the use of the medicinal ingredient, and the use has been approved through the issuance of a notice of compliance in respect of the submission.
(3) A patent on a patent list in relation to a supplement to a new drug submission is eligible to be added to the register if the supplement is for a change in formulation, a change in dosage form or a change in use of the medicinal ingredient, and (a) in the case of a change in formulation, the patent contains a claim for the changed formulation that has been approved through the issuance of a notice of compliance in respect of the supplement; (b) in the case of a change in dosage form, the patent contains a claim for the changed dosage form that has been approved through the issuance of a notice of compliance in respect of the supplement; or (c) in the case of a change in use of the medicinal ingredient, the patent contains a claim for the changed use of the medicinal ingredient that has been approved through the issuance of a notice of compliance in respect of the supplement.
Patented Medicines (Notice of Compliance) Regulations SOR/93-133, §§ 4(2), 4(3) (Can), available at
NOR TH WES TERN JO URN AL O F TECH NO LO GY AND IN TE LLEC TU A L PRO PER TY [ 2 0 1 0
190
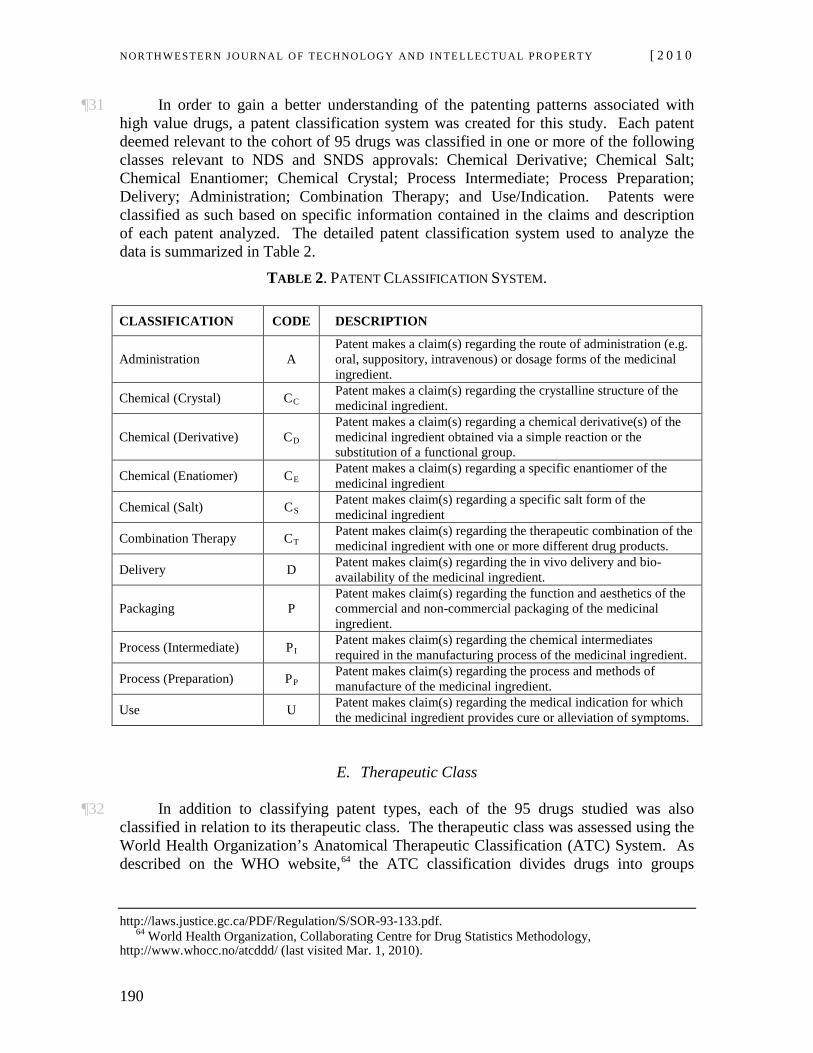
¶31 In order to gain a better understanding of the patenting patterns associated with high value drugs, a patent classification system was created for this study. Each patent deemed relevant to the cohort of 95 drugs was classified in one or more of the following classes relevant to NDS and SNDS approvals: Chemical Derivative; Chemical Salt; Chemical Enantiomer; Chemical Crystal; Process Intermediate; Process Preparation; Delivery; Administration; Combination Therapy; and Use/Indication. Patents were classified as such based on specific information contained in the claims and description of each patent analyzed. The detailed patent classification system used to analyze the data is summarized in Table 2.
TABLE 2. PATENT CLASSIFICATION SYSTEM.
CLASSIFICATION CODE DESCRIPTION
Administration A Patent makes a claim(s) regarding the route of administration (e.g. oral, suppository, intravenous) or dosage forms of the medicinal ingredient.
Chemical (Crystal) C Patent makes a claim(s) regarding the crystalline structure of the medicinal ingredient. C
Chemical (Derivative) CPatent makes a claim(s) regarding a chemical derivative(s) of the medicinal ingredient obtained via a simple reaction or the substitution of a functional group.
D
Chemical (Enatiomer) C Patent makes a claim(s) regarding a specific enantiomer of the medicinal ingredient E
Chemical (Salt) C Patent makes claim(s) regarding a specific salt form of the medicinal ingredient S
Combination Therapy C Patent makes claim(s) regarding the therapeutic combination of the medicinal ingredient with one or more different drug products. T
Delivery D Patent makes claim(s) regarding the in vivo delivery and bio-availability of the medicinal ingredient.
Packaging P Patent makes claim(s) regarding the function and aesthetics of the commercial and non-commercial packaging of the medicinal ingredient.
Process (Intermediate) P Patent makes claim(s) regarding the chemical intermediates required in the manufacturing process of the medicinal ingredient. I
Process (Preparation) P Patent makes claim(s) regarding the process and methods of manufacture of the medicinal ingredient. P
Use U Patent makes claim(s) regarding the medical indication for which the medicinal ingredient provides cure or alleviation of symptoms.
E. Therapeutic Class
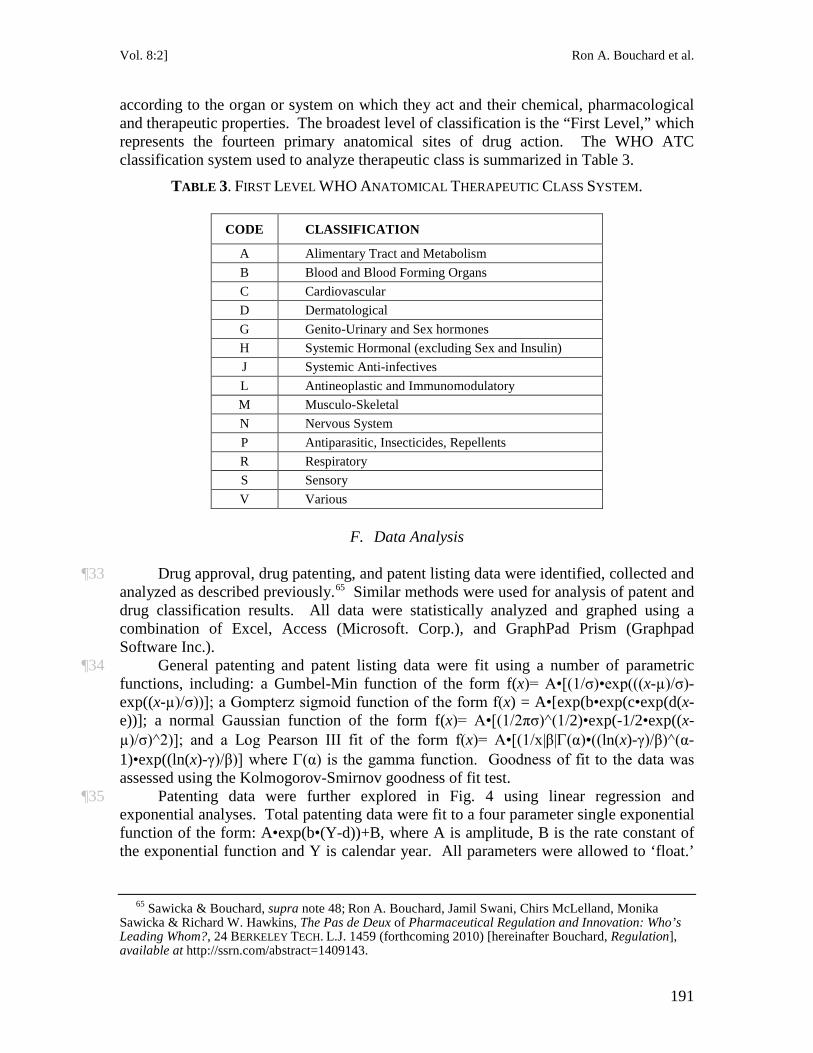
¶32 In addition to classifying patent types, each of the 95 drugs studied was also classified in relation to its therapeutic class. The therapeutic class was assessed using the World Health Organization’s Anatomical Therapeutic Classification (ATC) System. As described on the WHO website,64
http://laws.justice.gc.ca/PDF/Regulation/S/SOR-93-133.pdf.
64 World Health Organization, Collaborating Centre for Drug Statistics Methodology, http://www.whocc.no/atcddd/ (last visited Mar. 1, 2010).
the ATC classification divides drugs into groups
Vol. 8:2] Ron A. Bouchard et al.
191
according to the organ or system on which they act and their chemical, pharmacological and therapeutic properties. The broadest level of classification is the “First Level,” which represents the fourteen primary anatomical sites of drug action. The WHO ATC classification system used to analyze therapeutic class is summarized in Table 3.
TABLE 3. FIRST LEVEL WHO ANATOMICAL THERAPEUTIC CLASS SYSTEM.
CODE CLASSIFICATION
A Alimentary Tract and Metabolism B Blood and Blood Forming Organs C Cardiovascular D Dermatological G Genito-Urinary and Sex hormones H Systemic Hormonal (excluding Sex and Insulin) J Systemic Anti-infectives L Antineoplastic and Immunomodulatory M Musculo-Skeletal N Nervous System P Antiparasitic, Insecticides, Repellents R Respiratory S Sensory V Various
F. Data Analysis
¶33 Drug approval, drug patenting, and patent listing data were identified, collected and analyzed as described previously.65
¶34 General patenting and patent listing data were fit using a number of parametric functions, including: a Gumbel-Min function of the form f(x)= A•[(1/σ)•exp(((x-µ)/σ)-exp((x-µ)/σ))]; a Gompterz sigmoid function of the form f(x) = A•[exp(b•exp(c•exp(d(x-e))]; a normal Gaussian function of the form f(x)= A•[(1/2πσ)^(1/2)•exp(-1/2•exp((x-µ)/σ)^2)]; and a Log Pearson III fit of the form f(x)= A•[(1/x|β|Γ(α)•((ln(x)-γ)/β)^(α-1)•exp((ln(x)-γ)/β)] where Γ(α) is the gamma function. Goodness of fit to the data was assessed using the Kolmogorov-Smirnov goodness of fit test.
Similar methods were used for analysis of patent and drug classification results. All data were statistically analyzed and graphed using a combination of Excel, Access (Microsoft. Corp.), and GraphPad Prism (Graphpad Software Inc.).
¶35 Patenting data were further explored in Fig. 4 using linear regression and exponential analyses. Total patenting data were fit to a four parameter single exponential function of the form: A•exp(b•(Y-d))+B, where A is amplitude, B is the rate constant of the exponential function and Y is calendar year. All parameters were allowed to ‘float.’
65 Sawicka & Bouchard, supra note 48; Ron A. Bouchard, Jamil Swani, Chirs McLelland, Monika
Sawicka & Richard W. Hawkins, The Pas de Deux of Pharmaceutical Regulation and Innovation: Who’s Leading Whom?, 24 BERKELEY TECH. L.J. 1459 (forthcoming 2010) [hereinafter Bouchard, Regulation], available at http://ssrn.com/abstract=1409143.
NOR TH WES TERN JO URN AL O F TECH NO LO GY AND IN TE LLEC TU A L PRO PER TY [ 2 0 1 0
192
We also tested a two-parameter single exponential equation of the form: A•exp(b•(Y-V), where V was fixed at 1977 (the beginning of the data set) or 1993 (the coming into force date of the linkage regulations regime). We further probed whether the coming into force of the linkage regulations regime resulted in a different exponential function using a linear regression analysis. Data were fit by an exponential functional of the form: Y= α • exp[(β0+β1 I)t+ε], where Y is total patents, ε is a noise term with zero mean and constant variance, t is the year, and I is an indicator variable taking on the value 1 for year 1993 and later, and zero otherwise. A log transform was used to test the null hypothesis that β1
=0 using linear regression.
IV. RESULTS
A. Cohort
1. Drug Patenting & Patent Listing
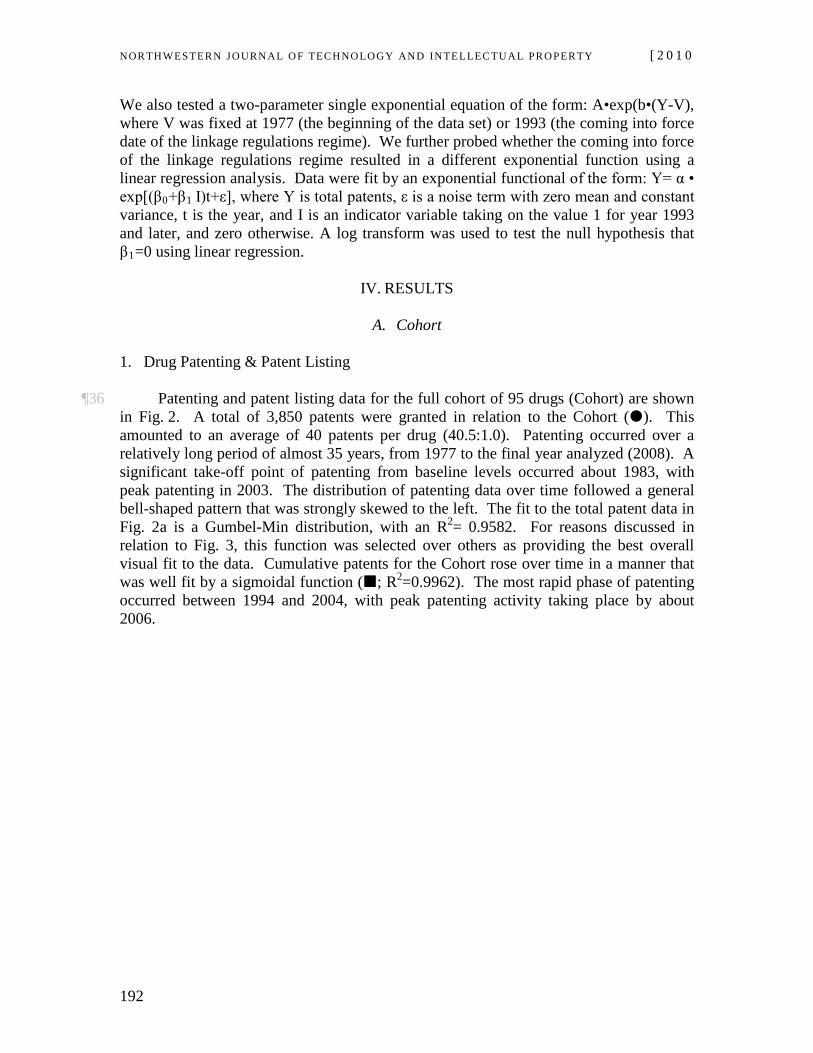
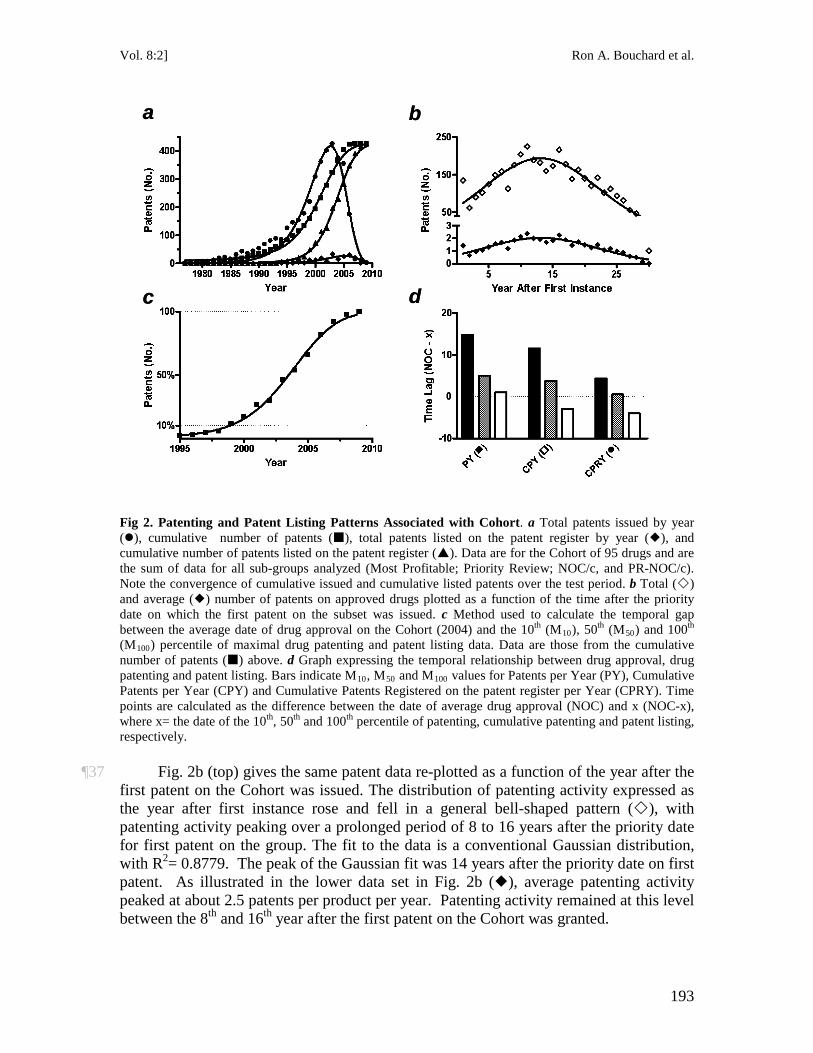
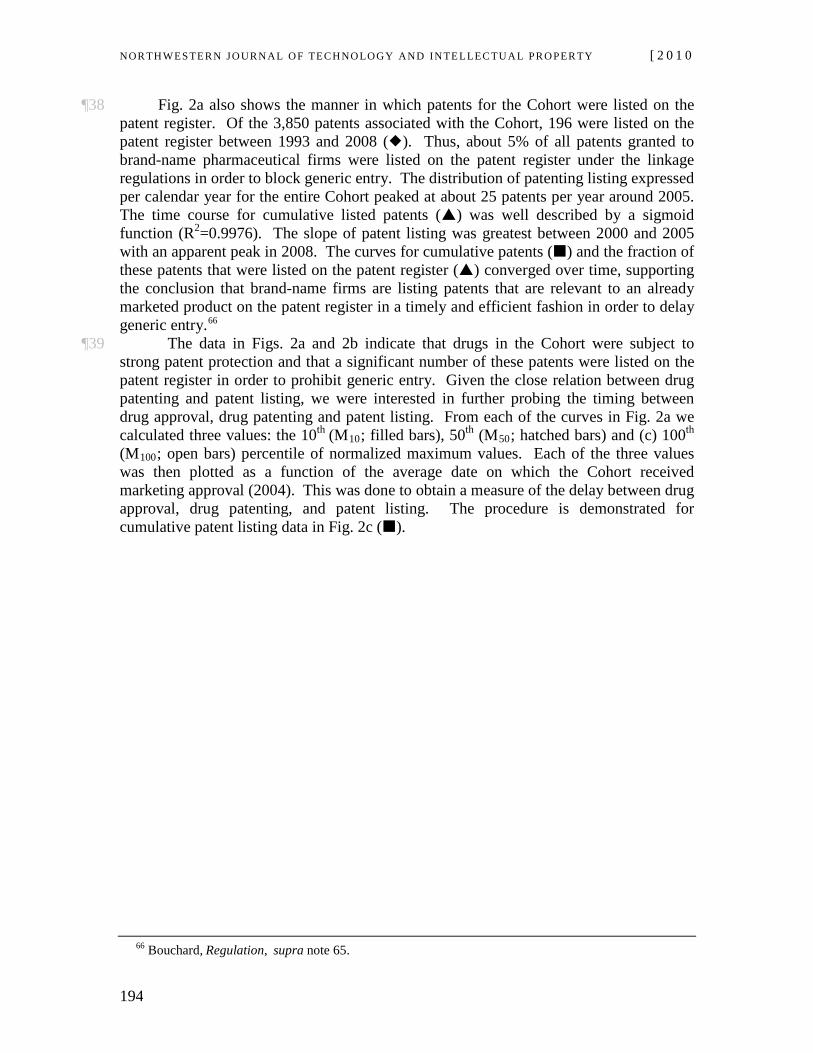
¶36 Patenting and patent listing data for the full cohort of 95 drugs (Cohort) are shown in Fig. 2. A total of 3,850 patents were granted in relation to the Cohort (). This amounted to an average of 40 patents per drug (40.5:1.0). Patenting occurred over a relatively long period of almost 35 years, from 1977 to the final year analyzed (2008). A significant take-off point of patenting from baseline levels occurred about 1983, with peak patenting in 2003. The distribution of patenting data over time followed a general bell-shaped pattern that was strongly skewed to the left. The fit to the total patent data in Fig. 2a is a Gumbel-Min distribution, with an R2= 0.9582. For reasons discussed in relation to Fig. 3, this function was selected over others as providing the best overall visual fit to the data. Cumulative patents for the Cohort rose over time in a manner that was well fit by a sigmoidal function (; R2=0.9962). The most rapid phase of patenting occurred between 1994 and 2004, with peak patenting activity taking place by about 2006.
Vol. 8:2] Ron A. Bouchard et al.
193
a
c
b
d
a
c
b
d
Fig 2. Patenting and Patent Listing Patterns Associated with Cohort. a Total patents issued by year (), cumulative number of patents (), total patents listed on the patent register by year (), and cumulative number of patents listed on the patent register (). Data are for the Cohort of 95 drugs and are the sum of data for all sub-groups analyzed (Most Profitable; Priority Review; NOC/c, and PR-NOC/c). Note the convergence of cumulative issued and cumulative listed patents over the test period. b Total () and average () number of patents on approved drugs plotted as a function of the time after the priority date on which the first patent on the subset was issued. c Method used to calculate the temporal gap between the average date of drug approval on the Cohort (2004) and the 10th (M10), 50th (M50) and 100th (M100) percentile of maximal drug patenting and patent listing data. Data are those from the cumulative number of patents () above. d Graph expressing the temporal relationship between drug approval, drug patenting and patent listing. Bars indicate M10, M50 and M100 values for Patents per Year (PY), Cumulative Patents per Year (CPY) and Cumulative Patents Registered on the patent register per Year (CPRY). Time points are calculated as the difference between the date of average drug approval (NOC) and x (NOC-x), where x= the date of the 10th, 50th and 100th
¶37 Fig. 2b (top) gives the same patent data re-plotted as a function of the year after the first patent on the Cohort was issued. The distribution of patenting activity expressed as the year after first instance rose and fell in a general bell-shaped pattern (), with patenting activity peaking over a prolonged period of 8 to 16 years after the priority date for first patent on the group. The fit to the data is a conventional Gaussian distribution, with R
percentile of patenting, cumulative patenting and patent listing, respectively.
2= 0.8779. The peak of the Gaussian fit was 14 years after the priority date on first patent. As illustrated in the lower data set in Fig. 2b (), average patenting activity peaked at about 2.5 patents per product per year. Patenting activity remained at this level between the 8th and 16th year after the first patent on the Cohort was granted.
NOR TH WES TERN JO URN AL O F TECH NO LO GY AND IN TE LLEC TU A L PRO PER TY [ 2 0 1 0
194
¶38 Fig. 2a also shows the manner in which patents for the Cohort were listed on the patent register. Of the 3,850 patents associated with the Cohort, 196 were listed on the patent register between 1993 and 2008 (). Thus, about 5% of all patents granted to brand-name pharmaceutical firms were listed on the patent register under the linkage regulations in order to block generic entry. The distribution of patenting listing expressed per calendar year for the entire Cohort peaked at about 25 patents per year around 2005. The time course for cumulative listed patents () was well described by a sigmoid function (R2=0.9976). The slope of patent listing was greatest between 2000 and 2005 with an apparent peak in 2008. The curves for cumulative patents () and the fraction of these patents that were listed on the patent register () converged over time, supporting the conclusion that brand-name firms are listing patents that are relevant to an already marketed product on the patent register in a timely and efficient fashion in order to delay generic entry.66
¶39 The data in Figs. 2a and 2b indicate that drugs in the Cohort were subject to strong patent protection and that a significant number of these patents were listed on the patent register in order to prohibit generic entry. Given the close relation between drug patenting and patent listing, we were interested in further probing the timing between drug approval, drug patenting and patent listing. From each of the curves in Fig. 2a we calculated three values: the 10
th (M10; filled bars), 50th (M50; hatched bars) and (c) 100th (M100
66 Bouchard, Regulation, supra note
; open bars) percentile of normalized maximum values. Each of the three values was then plotted as a function of the average date on which the Cohort received marketing approval (2004). This was done to obtain a measure of the delay between drug approval, drug patenting, and patent listing. The procedure is demonstrated for cumulative patent listing data in Fig. 2c ().
65.
Vol. 8:2] Ron A. Bouchard et al.
195
a
c
b
d
1980 1985 1990 1995 2000 2005 20100
100
200
300
400
Year
Pate
nts
(No.
)
1980 1985 1990 1995 2000 2005 20100
100
200
300
400
Year
Pate
nts
(No.
)1980 1985 1990 1995 2000 2005 2010
0
100
200
300
400
Year
Pate
nts
(No.
)
1980 1985 1990 1995 2000 2005 20100
100
200
300
400
Year
Pate
nts
(No.
)
Fig 3. Goodness of Fit for Patent Distribution Expressed per Calendar Year. Total patents plotted by calendar year () fit to a Gumbel-Min, b conventional Gaussian, and c Log-Pearson functions. The Kolmogorov-Smirnov (K-S) test was used as a goodness of fit test for the relationship of data points to the functions chosen. K-S statistics for Gumbel-Min, Gaussian and Person functions were 0.1037, 0.1073, and 0.1699, respectively. Data were also poorly fit to the sum of two normal Gaussian distributions (d). The Pearson function fit the low rising component and peak component well, but did not fit the second more rapid component well. The single Gaussian missed both the slow and rapid rising phases and only fitted the peak portion of the bell-shaped data set. By contrast, the Gumbel-Min function fit the rapidly rising, peak and descending portions of the data set, leaving the slowly rising lower amplitude portion poorly fit. As the Gumbel-Min had the best K-S score and visually fit the data sets the most accurately of the fits tested, it was used for comparative purposes from this point forward.
¶40 The procedure described above differs slightly from that used in our pilot study of drug patenting and patent listing for a smaller cohort of most profitable drugs (n=16).67 There, we calculated the inflection point at which the data deviated most strongly from baseline values, as well as the point at which each curve reached the 50th and 95th percentile of maximum values. The inflection point was calculated as the zero point of the second derivative of fits to the data. The reason for using a different method in the present work is that total patenting activity in our pilot study was reasonably well fit using a Gaussian distribution. By contrast, the skewed relationship observed with a much larger data set (n=95 drugs; Fig. 2a) resulted in a slow rather than sharp and a, potentially, bimodal rise in patenting activity, necessitating use of simpler M10, M50 and M100
67 Id. at 1496-97.
values.
NOR TH WES TERN JO URN AL O F TECH NO LO GY AND IN TE LLEC TU A L PRO PER TY [ 2 0 1 0
196
¶41 As illustrated in Fig 2d, there was a significant lag between the date on which drug approval was granted and the dates on which patents on the same drug product were granted. This gap was observed independent of whether patents were expressed by year of grant (Patent per Year; PY) or cumulatively (Cumulative Patents per Year; CPY), and likely reflects the regulatory lag between drug patenting and drug approval. As patenting activity shifted from 10% to 50% and eventually 100% maximal values, the gap between M10, M50 and M100 values and date of average drug approval (NOC-x) progressively declined. Even so, M10 and M50
¶42 The data were different for patent listing. As demonstrated in Fig. 2d, average M
remained 4-15 years earlier than the date of average approval for patenting expressed per year and cumulative patenting.
10 and M50 data for cumulative patents listed on the register per year (Cumulative Patents Registered per Year; CPRY) exceeded the null point by only 4 and 0.5 years compared to 12 and 5 years for CPY. Therefore, both the take-off point (M10) and the point of half maximal (M50
¶43 The data in Fig. 2d show that the lag between the average date of drug approval and the average date of cumulative patent listing decreased progressively over the course of the test period. For example, the differential between M
) patent listing occurred much closer to the date of average drug approval for the Cohort compared to patenting activity expressed per year or cumulative patenting. In fact, data points for 50% and 100% CPRY were 0.5 and -4.0 years on either side of the null point.
10 and M100
¶44 As demonstrated in Fig. 2a, the distribution of patenting data over time was far from symmetrical and therefore was not Gaussian in nature. The distribution skewed strongly to the left. There was a slow lead up of patenting activity for the years leading up to the coming into force of linkage regulations in 1993. From that point onwards, the data were more in line with a conventional bell-shaped distribution. This raises the question of whether there is more than one underlying process contributing to total patenting activity and, if so, what its characteristics might be. In order to determine which statistical distribution best fits the patenting data for the Cohort, we tested a wide array of statistical distributions (n=61)
values decreased from 15.75 years for PY, to 8.5 years for CPY, and 0.25 years for CPRY. Ironically, the average date of approval for the Cohort drugs was actually 4 years later than the average date of cumulative patent listing (NOC-x = -4.0). The likely reason for this result is the relative speed and flexibility of the process for patent listing compared to that for drug approval. Patent listing occurs on the order of days. This is a much shorter time frame than that for even supplemental (SNDS) drug approval, which occurs over a shorter time span than conventional new (NDS) drug approval. Combined, the data suggest that patent listing under linkage regulations may be a better proxy for drug approval (and thus potentially a better surrogate for drug development incentives) than drug patenting per se.
68
68 Beta, Burr, Burr (4P), Cauchy, Chi-Squared, Chi-Squared (2P), Dagum, Dagum (4P), Erlang,
Erlang (3P), Error, Error Function, Exponential, Exponential (2P), Fatigue Life, Fatigue Life (3P), Frechet, Frechet (3P), GammaGamma (3P), Gen. Extreme Value, Gen. Gamma, Gen. Gamma (4P), Gen. Pareto, Gumbel Max, Gumbel Min, Hypersecant, Inv. Gaussian, Inv. Gaussian (3P), Johnson SB, Johnson SU, Kumaraswamy, Laplace, Levy, Levy (2P), Log-Gamma, Logistic, Log-Logistic, Log-Logistic (3P), Lognormal, Lognormal (3P), Log-Pearson 3, Nakagami, Normal, Pareto, Pareto 2, Pearson 5, Pearson 5 (3P), Pearson 6, Pearson 6 (4P), Pert, Power Function, Rayleigh, Rayleigh (2P), Reciprocal, Rice, Student's t, Triangular, Uniform, Weibull, Weibull (3P).
for goodness of fit using the Kolmogorov-Smirnov goodness of fit test. The best scoring distribution across the data set was the
Vol. 8:2] Ron A. Bouchard et al.
197
Gumbel-Min distribution (0.1037 K-S Score), followed by the Log-Pearson III distribution (0.1073 K-S Score). For comparison purposes, the normal Gaussian distribution is also shown, which had a K-S score of 0.1699. Data and fits for the three distributions are provided in Figs. 3a-c. The Pearson function fit the low rising component and peak component well, but did not fit the second more rapid component well. The single Gaussian missed both the slow and rapid rising phases and only fit the peak portion of the bell-shaped data set. By contrast, the Gumbel-Min function fit the rapidly-rising, peak and descending portions of the data set, leaving the slowly rising lower amplitude portion poorly fit. As the Gumbel-Min had the best K-S score and visually fit the data sets the most accurately of the fits tested, it was used for visual comparative purposes from this point forward.
¶45 The fits in Figs. 3a-3b suggest that there may be two components to the rising phase of the patenting curve. We attempted to further characterize this possibility in a number ways. The first step was to determine if the data represented the sum of two bell-shaped distributions. We fit the data to two Gaussian functions; one from 1977 to 1993 and the other from 1993 to 2009. The break point of 1993 was selected as this is where the slower component of patenting appeared to evolve into a faster component on visual inspection. As shown in Fig. 3d, the data were not well fit using this procedure. In particular, data points between 1991 and 1996, encompassing the potential transition point from a slow to fast component, were very poorly fit. Also, the declining phase of patenting activity between 2005 and 2009 was poorly fit. Thus, we concluded the data did not represent a sum of two Gaussian functions.
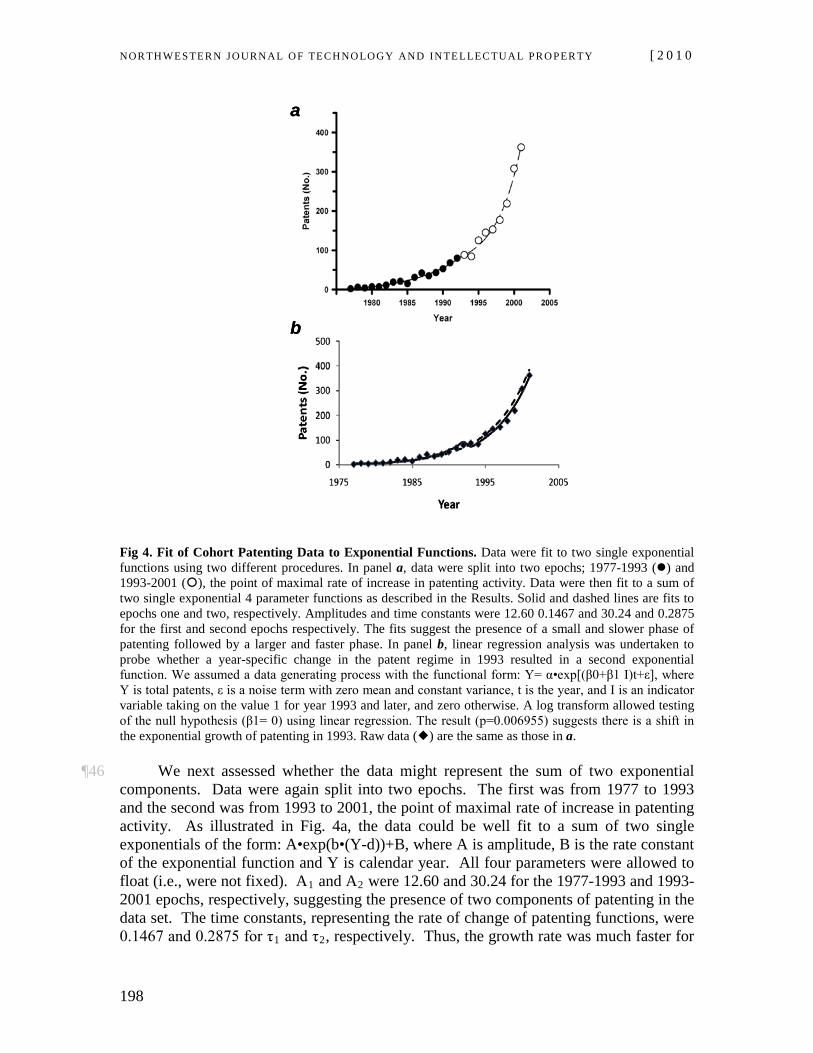
NOR TH WES TERN JO URN AL O F TECH NO LO GY AND IN TE LLEC TU A L PRO PER TY [ 2 0 1 0
198
a
b
a
b
Fig 4. Fit of Cohort Patenting Data to Exponential Functions. Data were fit to two single exponential functions using two different procedures. In panel a, data were split into two epochs; 1977-1993 () and 1993-2001 (), the point of maximal rate of increase in patenting activity. Data were then fit to a sum of two single exponential 4 parameter functions as described in the Results. Solid and dashed lines are fits to epochs one and two, respectively. Amplitudes and time constants were 12.60 0.1467 and 30.24 and 0.2875 for the first and second epochs respectively. The fits suggest the presence of a small and slower phase of patenting followed by a larger and faster phase. In panel b, linear regression analysis was undertaken to probe whether a year-specific change in the patent regime in 1993 resulted in a second exponential function. We assumed a data generating process with the functional form: Y= α•exp[(β0+β1 I)t+ε], where Y is total patents, ε is a noise term with zero mean and constant variance, t is the year, and I is an indicator variable taking on the value 1 for year 1993 and later, and zero otherwise. A log transform allowed testing of the null hypothesis (β1= 0) using linear regression. The result (p=0.006955) suggests there is a shift in the exponential growth of patenting in 1993. Raw data () are the same as those in a.
¶46 We next assessed whether the data might represent the sum of two exponential
components. Data were again split into two epochs. The first was from 1977 to 1993 and the second was from 1993 to 2001, the point of maximal rate of increase in patenting activity. As illustrated in Fig. 4a, the data could be well fit to a sum of two single exponentials of the form: A•exp(b•(Y-d))+B, where A is amplitude, B is the rate constant of the exponential function and Y is calendar year. All four parameters were allowed to float (i.e., were not fixed). A1 and A2 were 12.60 and 30.24 for the 1977-1993 and 1993-2001 epochs, respectively, suggesting the presence of two components of patenting in the data set. The time constants, representing the rate of change of patenting functions, were 0.1467 and 0.2875 for τ1 and τ2, respectively. Thus, the growth rate was much faster for
Vol. 8:2] Ron A. Bouchard et al.
199
the second larger amplitude phase of patenting (1/0.2875= 3.48 years) compared to the smaller and slower first phase of patenting (a/0.1467= 6.82 years). In other words, the amount of patenting was 2.5x greater and 2.0x faster in between 1993-2001 than between 1977-1993. A similar result was obtained when a 2-parameter equation was used: A•exp(b•(Y-V)), where V is a fixed parameter (1977 or 1993). A1, A2, τ1 and τ2, were 5.4058, 73.5989, 0.1772 and 0.1971, respectively. Thus, for both 2 and 4 parameter exponentials, there was a large, fast and later phase of patenting superimposed on a relatively small, slower and earlier phase of patenting.69
¶47 A linear regression analysis was undertaken to probe whether a year-specific change in the patent regime in 1993 resulted in a second exponential function (Fig. 4b). We assumed a data generating process with the functional form: Y= α•exp[(β
0+β1 I)t+ε], where Y is total patents, ε is a noise term with zero mean and constant variance, t is the year, and I is an indicator variable taking on the value 1 for year 1993 and later, and zero otherwise. A log transform allowed testing of the null hypothesis (β1
69 A significant difference, however, was that the rate constant for the second phase (1/0.1971= 5.07
years) was only slightly faster than for the first phase (1/0.1772= 5.64 years) when V is fixed. Indeed when the second epoch is broadened from 2001 to 2003 the rate constant in years was actually larger (7.75 and 5.96 years) than that for the first epoch for both the four and two parameter tests. This result, which likely reflects an incomplete data base towards the end of the test period, is discussed more fully in the Limitations section below.
= 0) using simple linear regression. The associated p-value of 0.006955 supports the conclusion that there is a shift in the exponential growth of patenting in 1993. However, the negative sign on the coefficient suggests that the growth in total patenting follows a slightly slower growth exponential after 1993 than before. Both approaches in Fig. 4 assume underlying exponential functions. The first allows more parameters to shift, but does not test whether the change in 1993 is statistically significant. The second allows only one parameter to change, but includes a hypothesis test to demonstrate that the change is statistically significant, and therefore we may conclude that the regime change had a measurable effect. This shows up in a slight bump in 1993. Since the change in legal framework would suggest a shift at this time, and because the hypothesis test confirms that a change took place, we conclude that the growth in total patenting was affected when the linkage regime came into force in 1993.
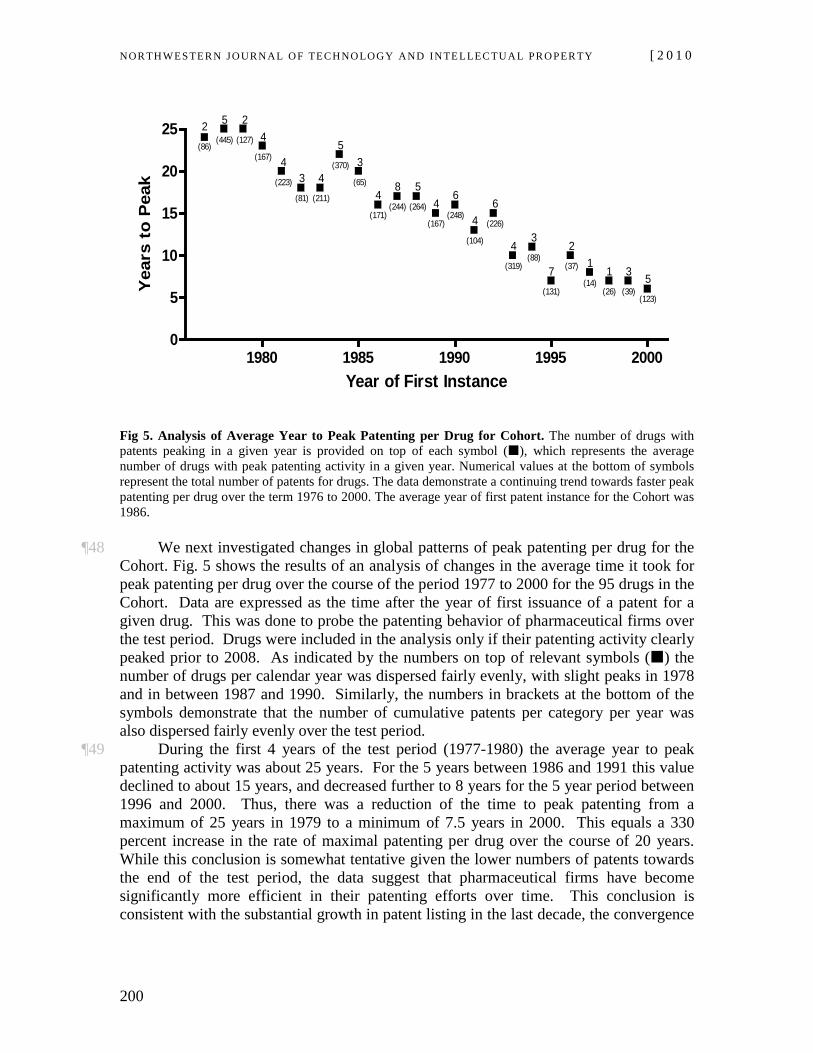
NOR TH WES TERN JO URN AL O F TECH NO LO GY AND IN TE LLEC TU A L PRO PER TY [ 2 0 1 0
200
1980 1985 1990 1995 20000
5
10
15
20
25 2(86)
5(445)
2(127) 4
(167) 4(223) 3
(81)
4(211)
5(370) 3
(65)4
(171)
8(244)
5(264) 4
(167)
6(248) 4
(104)
6(226)
4(319)
3(88)
7(131)
2(37) 1
(14)1
(26)
3(39)
5(123)
Year of First Instance
Yea
rs t
o P
eak
Fig 5. Analysis of Average Year to Peak Patenting per Drug for Cohort. The number of drugs with patents peaking in a given year is provided on top of each symbol (), which represents the average number of drugs with peak patenting activity in a given year. Numerical values at the bottom of symbols represent the total number of patents for drugs. The data demonstrate a continuing trend towards faster peak patenting per drug over the term 1976 to 2000. The average year of first patent instance for the Cohort was 1986.
¶48 We next investigated changes in global patterns of peak patenting per drug for the Cohort. Fig. 5 shows the results of an analysis of changes in the average time it took for peak patenting per drug over the course of the period 1977 to 2000 for the 95 drugs in the Cohort. Data are expressed as the time after the year of first issuance of a patent for a given drug. This was done to probe the patenting behavior of pharmaceutical firms over the test period. Drugs were included in the analysis only if their patenting activity clearly peaked prior to 2008. As indicated by the numbers on top of relevant symbols () the number of drugs per calendar year was dispersed fairly evenly, with slight peaks in 1978 and in between 1987 and 1990. Similarly, the numbers in brackets at the bottom of the symbols demonstrate that the number of cumulative patents per category per year was also dispersed fairly evenly over the test period.
¶49 During the first 4 years of the test period (1977-1980) the average year to peak patenting activity was about 25 years. For the 5 years between 1986 and 1991 this value declined to about 15 years, and decreased further to 8 years for the 5 year period between 1996 and 2000. Thus, there was a reduction of the time to peak patenting from a maximum of 25 years in 1979 to a minimum of 7.5 years in 2000. This equals a 330 percent increase in the rate of maximal patenting per drug over the course of 20 years. While this conclusion is somewhat tentative given the lower numbers of patents towards the end of the test period, the data suggest that pharmaceutical firms have become significantly more efficient in their patenting efforts over time. This conclusion is consistent with the substantial growth in patent listing in the last decade, the convergence
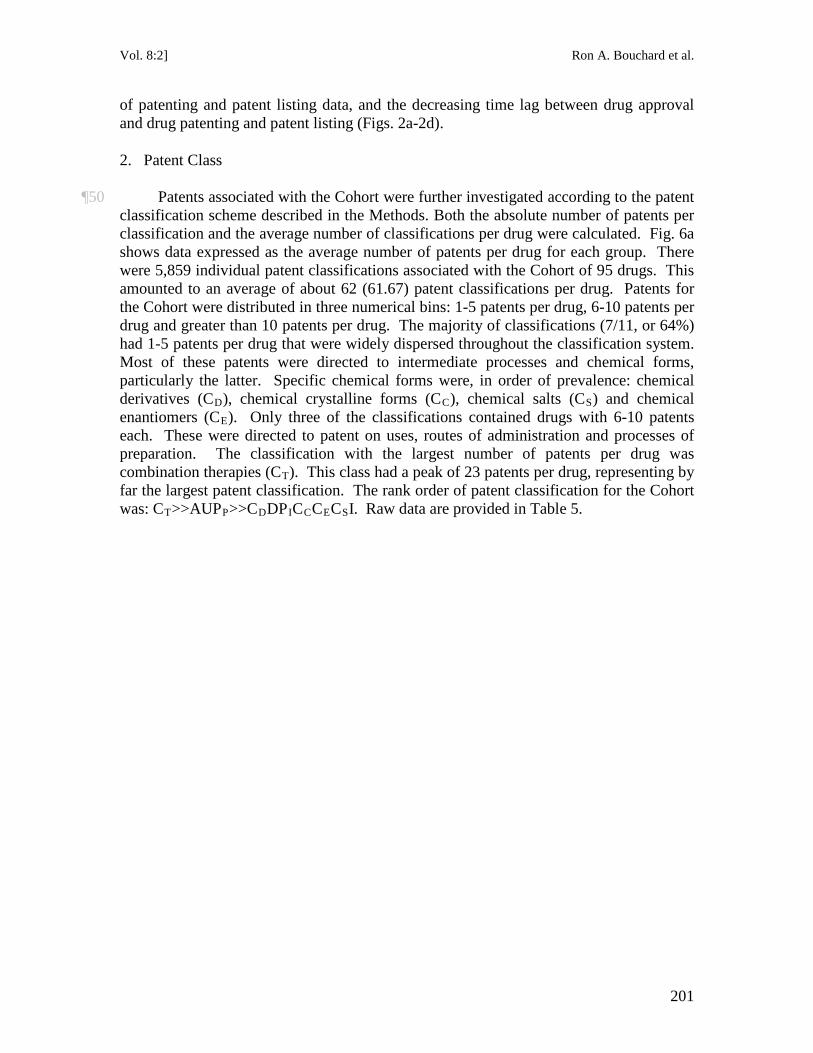
Vol. 8:2] Ron A. Bouchard et al.
201
of patenting and patent listing data, and the decreasing time lag between drug approval and drug patenting and patent listing (Figs. 2a-2d).
2. Patent Class
¶50 Patents associated with the Cohort were further investigated according to the patent classification scheme described in the Methods. Both the absolute number of patents per classification and the average number of classifications per drug were calculated. Fig. 6a shows data expressed as the average number of patents per drug for each group. There were 5,859 individual patent classifications associated with the Cohort of 95 drugs. This amounted to an average of about 62 (61.67) patent classifications per drug. Patents for the Cohort were distributed in three numerical bins: 1-5 patents per drug, 6-10 patents per drug and greater than 10 patents per drug. The majority of classifications (7/11, or 64%) had 1-5 patents per drug that were widely dispersed throughout the classification system. Most of these patents were directed to intermediate processes and chemical forms, particularly the latter. Specific chemical forms were, in order of prevalence: chemical derivatives (CD), chemical crystalline forms (CC), chemical salts (CS) and chemical enantiomers (CE). Only three of the classifications contained drugs with 6-10 patents each. These were directed to patent on uses, routes of administration and processes of preparation. The classification with the largest number of patents per drug was combination therapies (CT). This class had a peak of 23 patents per drug, representing by far the largest patent classification. The rank order of patent classification for the Cohort was: CT>>AUPP>>CDDPICCCECSI. Raw data are provided in Table 5.
NOR TH WES TERN JO URN AL O F TECH NO LO GY AND IN TE LLEC TU A L PRO PER TY [ 2 0 1 0
202
A C C C C CT D P P P U0
5
10
15
20
25
A Cc CD CE CS CT D P PI PP UPatent Class
Pate
nts
(No.
)
A B C J L M N R S V0
5
10
15
20
25
Therapeutic Class (ATC)
Dru
gs (N
o.)
A B C J L M N H S V0
100200300400500600700800900
Therapeutic Class (ATC)
Pate
nts
(No.
)
A B C J L M N R S V0
25
50
75
100
125
Therapeutic Class (ATC)
Pate
nts/
Dru
g (N
o.)
a
c
b
d
Fig 6. Patent Classifications and Drug Classifications for Cohort. a Bar graph illustrating patent classifications for the Cohort of 95 drugs. There were 5,859 individual patent classifications associated with the Cohort, amounting to 61 classifications per drug. The majority of classifications (7/11) had 1-5 patents per drug widely dispersed throughout the classification system. Most were directed to intermediate processes and chemical forms, particularly chemical derivatives, chemical crystalline forms, chemical salts and chemical enantiomers. Two classifications contained drugs with 6-10 patents each. These were directed to patent on uses and routes of administration. Combination therapies was the largest class, with 23 patents per drug. Panels b-d are bar graphs showing data for the Cohort analyzed with respect to the First Level WHO Anatomic Therapeutic Class drug classification scheme. Data are expressed as number of drugs in the Cohort per ATC class (b), number of patents in the Cohort per ATC class (c) and number of patents per drug per ATC class (d). Details of both classification systems are described in Methods.
¶51 In addition to the detailed patent classification scheme described above, we also
derived a simplified patent classification scheme. The rationale for undertaking this procedure was that patents are often referred to simply as ‘chemical’, ‘process’, ‘combination’ or ‘use’ patents. For convenience, the Delivery and Packaging classes in the detailed scheme were folded into the Administration class. The 5,859 classifications were directed fairly broadly to combination (36.7%), route of administration (23.9%), use (15.0%), process (12.7%) and chemical (12%) patents. The rank order of general patent classifications was CT>A>UPC. Raw data for the Cohort are provided in Table 6. The large number of patents and patent classifications associated with the Cohort (Fig. 6; Tables 5 and 6) indicate there is a large ‘pool’ of highly diverse patents from which to draw for both NDS and SNDS submission and patent listing purposes.
Vol. 8:2] Ron A. Bouchard et al.
203
3. Therapeutic Class
¶52 The final analysis for the Cohort was by WHO therapeutic class. Generally, the drugs analyzed in this study fell into 10 of the 14 WHO ATC classes. As illustrated in Fig. 6b, the Cohort of 95 drugs could be divided into three discrete groups: 0-5; 5-15 and greater than 15 drugs per class. The largest group was Antineoplastic/Immunomodulator (n=23). The second largest was composed of Alimentary Tract & Metabolism (n=12), Cardiovascular System (n=16), Systemic Anti-infectives (n=15), and Nervous System (n=15) classes. Together these groupings accounted for the large majority of drugs (81 of 95; 85.26%). The remaining 14 drugs were dispersed among five further classes with much smaller values: Blood & Blood Forming Organs (n=2); Musculo-Skeletal System (n=3); Respiratory System (n=5); Sensory Organs (n=2); and Various (n=2). The rank order of WHO classifications for the Cohort was for L>CJNA>>RMBSV. Raw data for the Cohort are provided in Table 7.
¶53 In addition to drugs per therapeutic class, we also analyzed patents per therapeutic class. Figs. 6c and 6d show a comparison of total patents and patents per drug plotted against ATC class. As indicated by the data in the bar graphs, there was substantial variability in the number of patents associated with the various therapeutic classes depending on whether the data were plotted as total number of patents per class or average number of patents per drug per class. Of 3,850 patents granted on the entire Cohort, 46% (n=1,750; 45.5%) were associated with only two therapeutic classes: Antineoplastic/Immunomodulator (n=900) and Cardiovascular (n=850). A second, and equally large grouping (n=1725; 44.81%) was composed of Alimentary Tract and Metabolism (n=400), Nervous System (n=400), Anti-infectives (n=350) and Musculo-Skeletal (n=350), and Hormonal (n=225), with remaining patents (10%) split between Sensory Organs (n=50), Blood Forming Organs (n=5); and Various (n=5). As such, the rank order of total patents distributed within the WHO ATC classification was: LC>NMJH>>SBV.
¶54 Fig. 6d shows patents analyzed per drug for the various therapeutic classes. While the Cohort had on average 40 patents per drug (Fig. 1), the average number of patents per ATC classification varied tremendously, from a low of 3.5 to a high of 116. The largest class by far was Musculo-Skeletal drugs, which had an average of 116 patents per drug. This was followed by Cardiovascular (n=55), Respiratory (n=45), Antineoplastic/Immunomodulator (n=38), Alimentary Tract and Metabolism (n=33), Sensory Organs (n=27), Nervous System (n=25), Anti-infectives (n=25), Blood (n=5) and Various (n=3.5). The most significant deviation of patenting per ATC class from total patenting data was that while almost 50% of all patents were distributed within the Antineoplastic, Immunomodulatory and Cardiovascular classifications (Fig. 6c), peak patenting activity per drug was associated with a much more broad set of therapeutic classifications (Fig. 6d). The rank order of patents per drug per ATC class was: M>CRLA>SNC>BV.
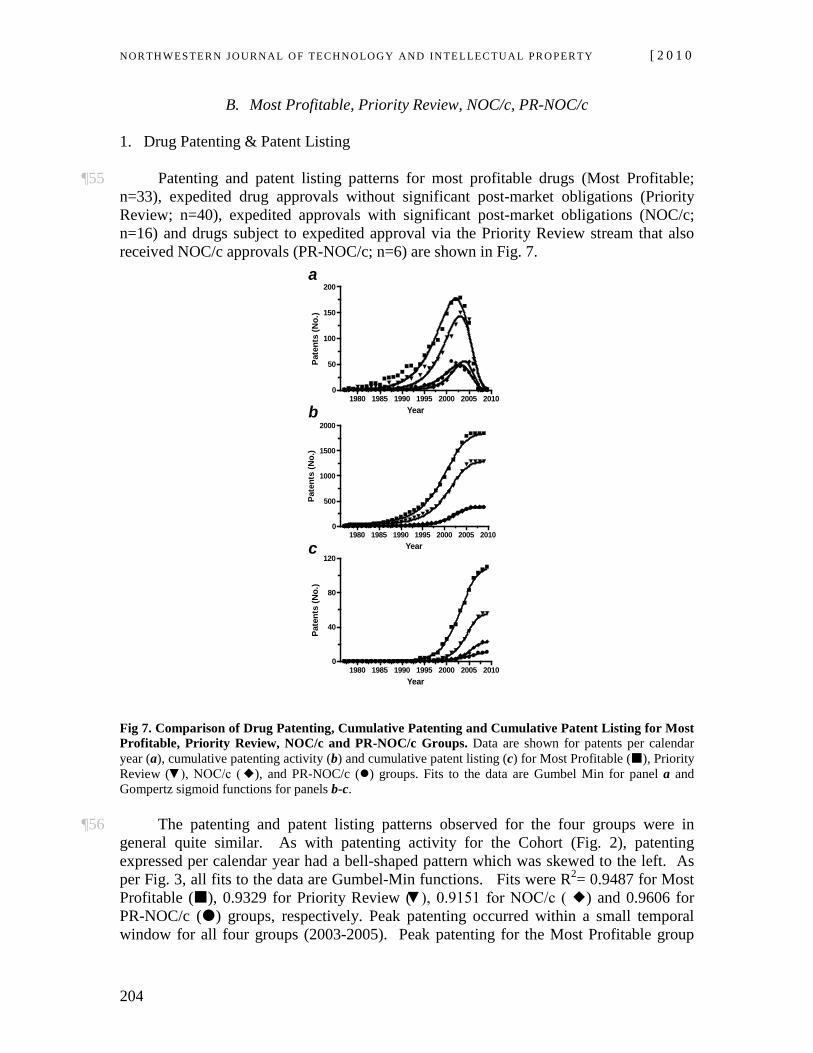
NOR TH WES TERN JO URN AL O F TECH NO LO GY AND IN TE LLEC TU A L PRO PER TY [ 2 0 1 0
204
B. Most Profitable, Priority Review, NOC/c, PR-NOC/c
1. Drug Patenting & Patent Listing
¶55 Patenting and patent listing patterns for most profitable drugs (Most Profitable; n=33), expedited drug approvals without significant post-market obligations (Priority Review; n=40), expedited approvals with significant post-market obligations (NOC/c; n=16) and drugs subject to expedited approval via the Priority Review stream that also received NOC/c approvals (PR-NOC/c; n=6) are shown in Fig. 7.
1980 1985 1990 1995 2000 2005 20100
50
100
150
200
Year
Pate
nts
(No.
)
1980 1985 1990 1995 2000 2005 20100
500
1000
1500
2000
Year
Pate
nts
(No.
)
1980 1985 1990 1995 2000 2005 20100
40
80
120
Year
Pate
nts
(No.
)
a
c
b
Fig 7. Comparison of Drug Patenting, Cumulative Patenting and Cumulative Patent Listing for Most Profitable, Priority Review, NOC/c and PR-NOC/c Groups. Data are shown for patents per calendar year (a), cumulative patenting activity (b) and cumulative patent listing (c) for Most Profitable (), Priority Review (▼), NOC/c (), and PR-NOC/c () groups. Fits to the data are Gumbel Min for panel a and Gompertz sigmoid functions for panels b-c.
¶56 The patenting and patent listing patterns observed for the four groups were in general quite similar. As with patenting activity for the Cohort (Fig. 2), patenting expressed per calendar year had a bell-shaped pattern which was skewed to the left. As per Fig. 3, all fits to the data are Gumbel-Min functions. Fits were R2= 0.9487 for Most Profitable (), 0.9329 for Priority Review (▼), 0.9151 for NOC/c ( ) and 0.9606 for PR-NOC/c () groups, respectively. Peak patenting occurred within a small temporal window for all four groups (2003-2005). Peak patenting for the Most Profitable group
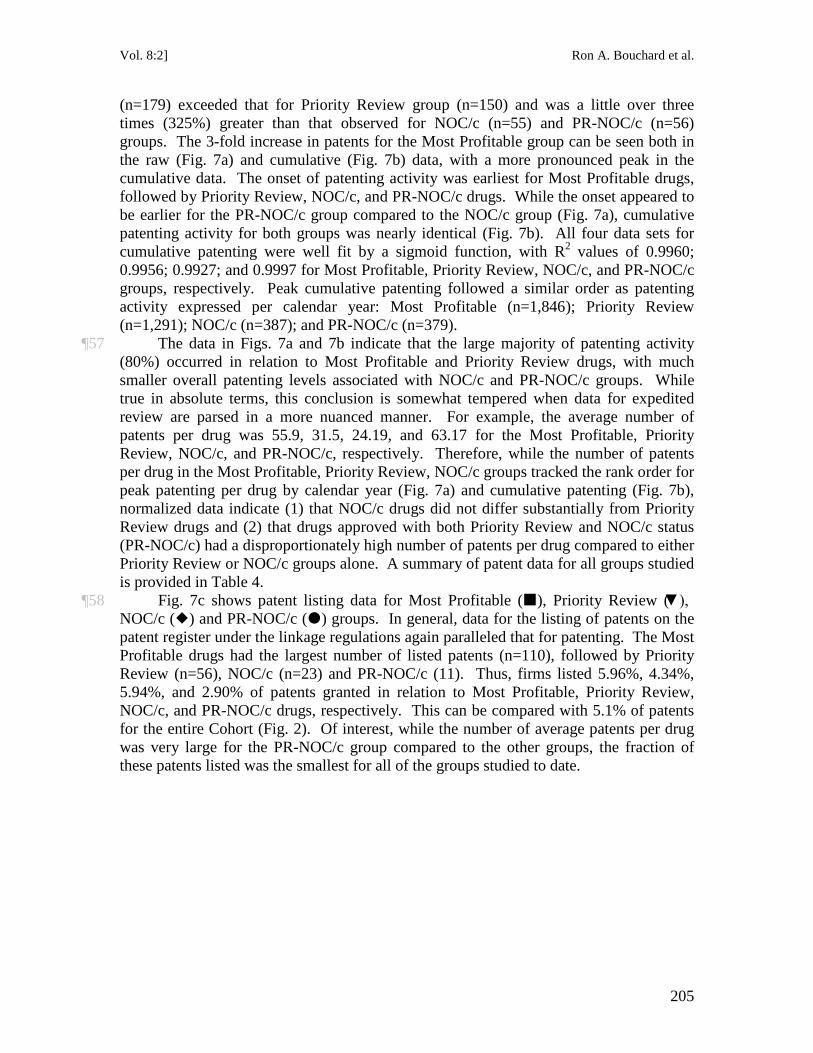
Vol. 8:2] Ron A. Bouchard et al.
205
(n=179) exceeded that for Priority Review group (n=150) and was a little over three times (325%) greater than that observed for NOC/c (n=55) and PR-NOC/c (n=56) groups. The 3-fold increase in patents for the Most Profitable group can be seen both in the raw (Fig. 7a) and cumulative (Fig. 7b) data, with a more pronounced peak in the cumulative data. The onset of patenting activity was earliest for Most Profitable drugs, followed by Priority Review, NOC/c, and PR-NOC/c drugs. While the onset appeared to be earlier for the PR-NOC/c group compared to the NOC/c group (Fig. 7a), cumulative patenting activity for both groups was nearly identical (Fig. 7b). All four data sets for cumulative patenting were well fit by a sigmoid function, with R2
¶57 The data in Figs. 7a and 7b indicate that the large majority of patenting activity (80%) occurred in relation to Most Profitable and Priority Review drugs, with much smaller overall patenting levels associated with NOC/c and PR-NOC/c groups. While true in absolute terms, this conclusion is somewhat tempered when data for expedited review are parsed in a more nuanced manner. For example, the average number of patents per drug was 55.9, 31.5, 24.19, and 63.17 for the Most Profitable, Priority Review, NOC/c, and PR-NOC/c, respectively. Therefore, while the number of patents per drug in the Most Profitable, Priority Review, NOC/c groups tracked the rank order for peak patenting per drug by calendar year (Fig. 7a) and cumulative patenting (Fig. 7b), normalized data indicate (1) that NOC/c drugs did not differ substantially from Priority Review drugs and (2) that drugs approved with both Priority Review and NOC/c status (PR-NOC/c) had a disproportionately high number of patents per drug compared to either Priority Review or NOC/c groups alone. A summary of patent data for all groups studied is provided in Table 4.
values of 0.9960; 0.9956; 0.9927; and 0.9997 for Most Profitable, Priority Review, NOC/c, and PR-NOC/c groups, respectively. Peak cumulative patenting followed a similar order as patenting activity expressed per calendar year: Most Profitable (n=1,846); Priority Review (n=1,291); NOC/c (n=387); and PR-NOC/c (n=379).
¶58 Fig. 7c shows patent listing data for Most Profitable (), Priority Review (▼), NOC/c () and PR-NOC/c () groups. In general, data for the listing of patents on the patent register under the linkage regulations again paralleled that for patenting. The Most Profitable drugs had the largest number of listed patents (n=110), followed by Priority Review (n=56), NOC/c (n=23) and PR-NOC/c (11). Thus, firms listed 5.96%, 4.34%, 5.94%, and 2.90% of patents granted in relation to Most Profitable, Priority Review, NOC/c, and PR-NOC/c drugs, respectively. This can be compared with 5.1% of patents for the entire Cohort (Fig. 2). Of interest, while the number of average patents per drug was very large for the PR-NOC/c group compared to the other groups, the fraction of these patents listed was the smallest for all of the groups studied to date.
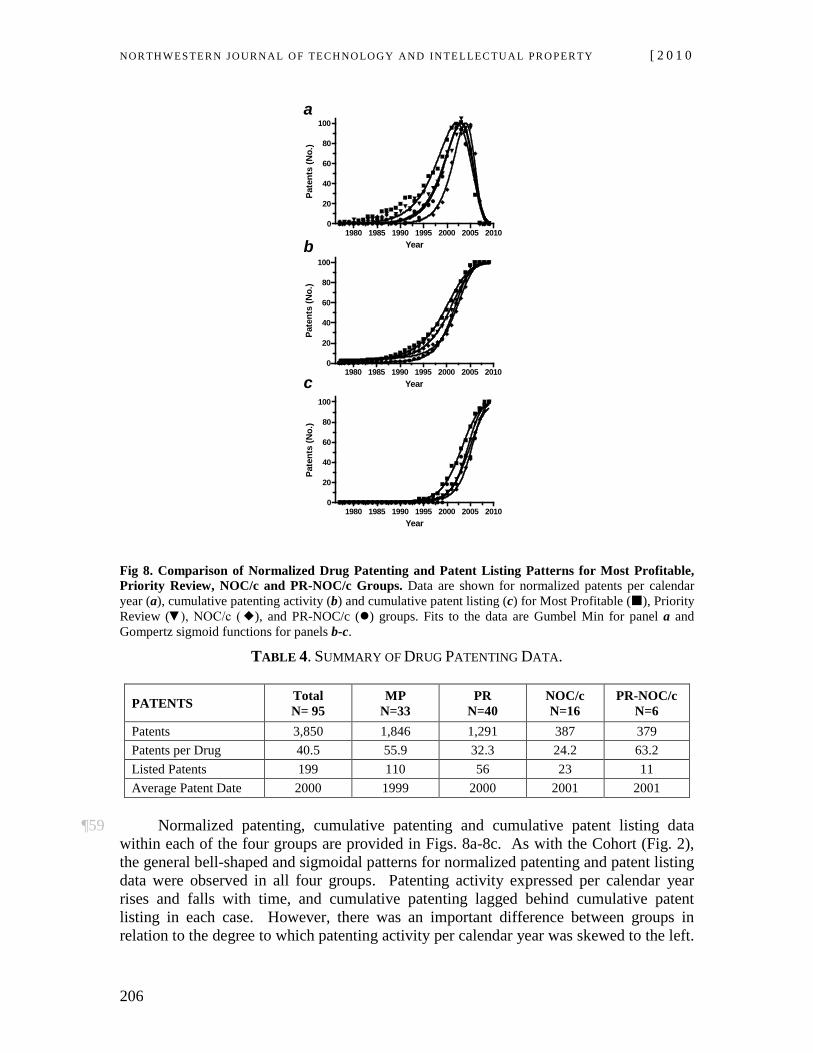
NOR TH WES TERN JO URN AL O F TECH NO LO GY AND IN TE LLEC TU A L PRO PER TY [ 2 0 1 0
206
1980 1985 1990 1995 2000 2005 20100
20
40
60
80
100
Year
Pate
nts
(No.
)
1980 1985 1990 1995 2000 2005 20100
20
40
60
80
100
Year
Pate
nts
(No.
)
1980 1985 1990 1995 2000 2005 20100
20
40
60
80
100
Year
Pate
nts
(No.
)
a
c
b
Fig 8. Comparison of Normalized Drug Patenting and Patent Listing Patterns for Most Profitable, Priority Review, NOC/c and PR-NOC/c Groups. Data are shown for normalized patents per calendar year (a), cumulative patenting activity (b) and cumulative patent listing (c) for Most Profitable (), Priority Review (▼), NOC/c (), and PR-NOC/c () groups. Fits to the data are Gumbel Min for panel a and Gompertz sigmoid functions for panels b-c.
TABLE 4. SUMMARY OF DRUG PATENTING DATA.
PATENTS Total N= 95
MP N=33
PR N=40
NOC/c N=16
PR-NOC/c N=6
Patents 3,850 1,846 1,291 387 379 Patents per Drug 40.5 55.9 32.3 24.2 63.2 Listed Patents 199 110 56 23 11 Average Patent Date 2000 1999 2000 2001 2001
¶59 Normalized patenting, cumulative patenting and cumulative patent listing data
within each of the four groups are provided in Figs. 8a-8c. As with the Cohort (Fig. 2), the general bell-shaped and sigmoidal patterns for normalized patenting and patent listing data were observed in all four groups. Patenting activity expressed per calendar year rises and falls with time, and cumulative patenting lagged behind cumulative patent listing in each case. However, there was an important difference between groups in relation to the degree to which patenting activity per calendar year was skewed to the left.
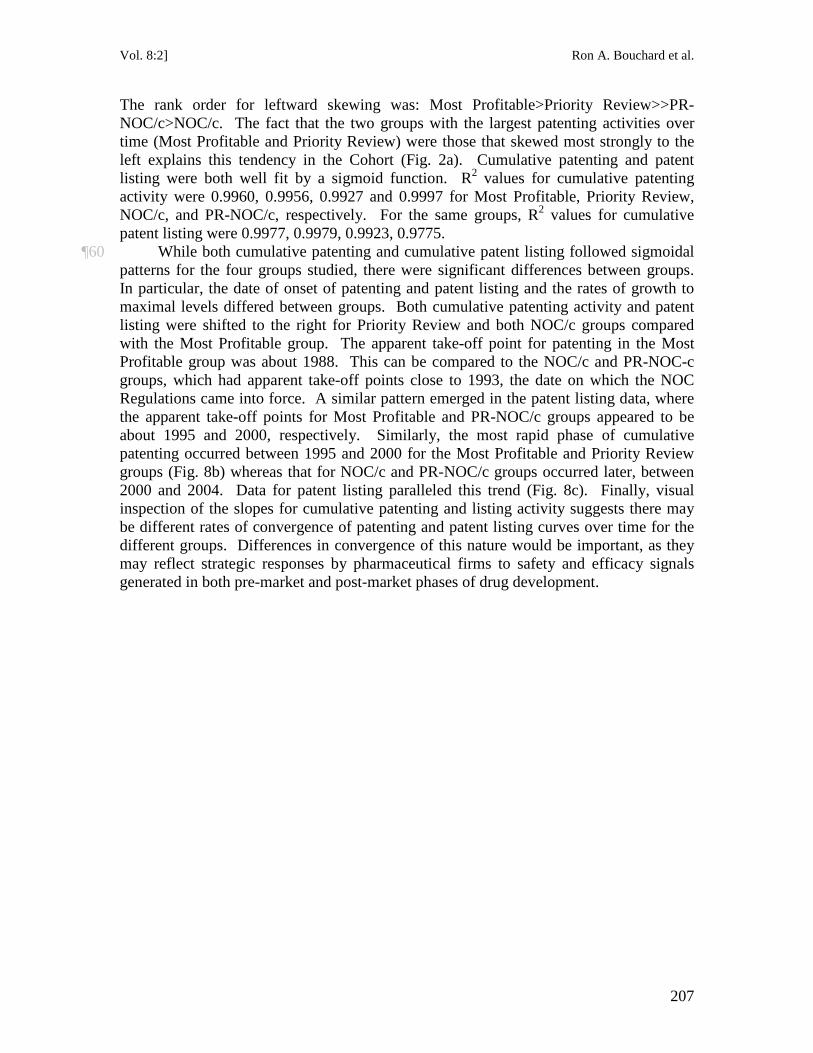
Vol. 8:2] Ron A. Bouchard et al.
207
The rank order for leftward skewing was: Most Profitable>Priority Review>>PR-NOC/c>NOC/c. The fact that the two groups with the largest patenting activities over time (Most Profitable and Priority Review) were those that skewed most strongly to the left explains this tendency in the Cohort (Fig. 2a). Cumulative patenting and patent listing were both well fit by a sigmoid function. R2 values for cumulative patenting activity were 0.9960, 0.9956, 0.9927 and 0.9997 for Most Profitable, Priority Review, NOC/c, and PR-NOC/c, respectively. For the same groups, R2
¶60 While both cumulative patenting and cumulative patent listing followed sigmoidal patterns for the four groups studied, there were significant differences between groups. In particular, the date of onset of patenting and patent listing and the rates of growth to maximal levels differed between groups. Both cumulative patenting activity and patent listing were shifted to the right for Priority Review and both NOC/c groups compared with the Most Profitable group. The apparent take-off point for patenting in the Most Profitable group was about 1988. This can be compared to the NOC/c and PR-NOC-c groups, which had apparent take-off points close to 1993, the date on which the NOC Regulations came into force. A similar pattern emerged in the patent listing data, where the apparent take-off points for Most Profitable and PR-NOC/c groups appeared to be about 1995 and 2000, respectively. Similarly, the most rapid phase of cumulative patenting occurred between 1995 and 2000 for the Most Profitable and Priority Review groups (Fig. 8b) whereas that for NOC/c and PR-NOC/c groups occurred later, between 2000 and 2004. Data for patent listing paralleled this trend (Fig. 8c). Finally, visual inspection of the slopes for cumulative patenting and listing activity suggests there may be different rates of convergence of patenting and patent listing curves over time for the different groups. Differences in convergence of this nature would be important, as they may reflect strategic responses by pharmaceutical firms to safety and efficacy signals generated in both pre-market and post-market phases of drug development.
values for cumulative patent listing were 0.9977, 0.9979, 0.9923, 0.9775.
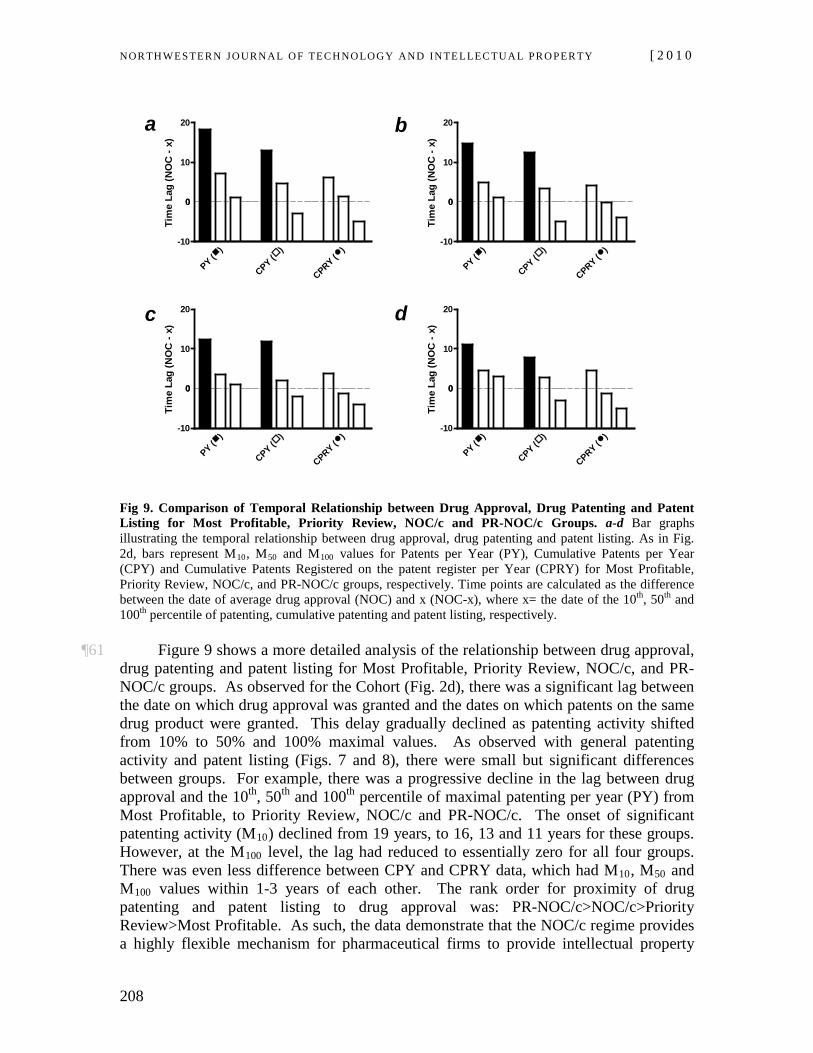
NOR TH WES TERN JO URN AL O F TECH NO LO GY AND IN TE LLEC TU A L PRO PER TY [ 2 0 1 0
208
0
)PY (
)
CPY ()
CPRY (-10
10
20
0
Tim
e La
g (N
OC
- x)
0
)PY (
)
CPY ()
CPRY (-10
10
20
0
Tim
e La
g (N
OC
- x)
0
)PY (
)
CPY ()
CPRY (-10
10
20
0
Tim
e La
g (N
OC
- x)
0
)PY (
)
CPY ()
CPRY (-10
10
20
0
Tim
e La
g (N
OC
- x)
a
c
b
d
Fig 9. Comparison of Temporal Relationship between Drug Approval, Drug Patenting and Patent Listing for Most Profitable, Priority Review, NOC/c and PR-NOC/c Groups. a-d Bar graphs illustrating the temporal relationship between drug approval, drug patenting and patent listing. As in Fig. 2d, bars represent M10, M50 and M100 values for Patents per Year (PY), Cumulative Patents per Year (CPY) and Cumulative Patents Registered on the patent register per Year (CPRY) for Most Profitable, Priority Review, NOC/c, and PR-NOC/c groups, respectively. Time points are calculated as the difference between the date of average drug approval (NOC) and x (NOC-x), where x= the date of the 10th, 50th and 100th
¶61 Figure 9 shows a more detailed analysis of the relationship between drug approval, drug patenting and patent listing for Most Profitable, Priority Review, NOC/c, and PR-NOC/c groups. As observed for the Cohort (Fig. 2d), there was a significant lag between the date on which drug approval was granted and the dates on which patents on the same drug product were granted. This delay gradually declined as patenting activity shifted from 10% to 50% and 100% maximal values. As observed with general patenting activity and patent listing (Figs. 7 and 8), there were small but significant differences between groups. For example, there was a progressive decline in the lag between drug approval and the 10
percentile of patenting, cumulative patenting and patent listing, respectively.
th, 50th and 100th percentile of maximal patenting per year (PY) from Most Profitable, to Priority Review, NOC/c and PR-NOC/c. The onset of significant patenting activity (M10) declined from 19 years, to 16, 13 and 11 years for these groups. However, at the M100 level, the lag had reduced to essentially zero for all four groups. There was even less difference between CPY and CPRY data, which had M10, M50 and M100 values within 1-3 years of each other. The rank order for proximity of drug patenting and patent listing to drug approval was: PR-NOC/c>NOC/c>Priority Review>Most Profitable. As such, the data demonstrate that the NOC/c regime provides a highly flexible mechanism for pharmaceutical firms to provide intellectual property
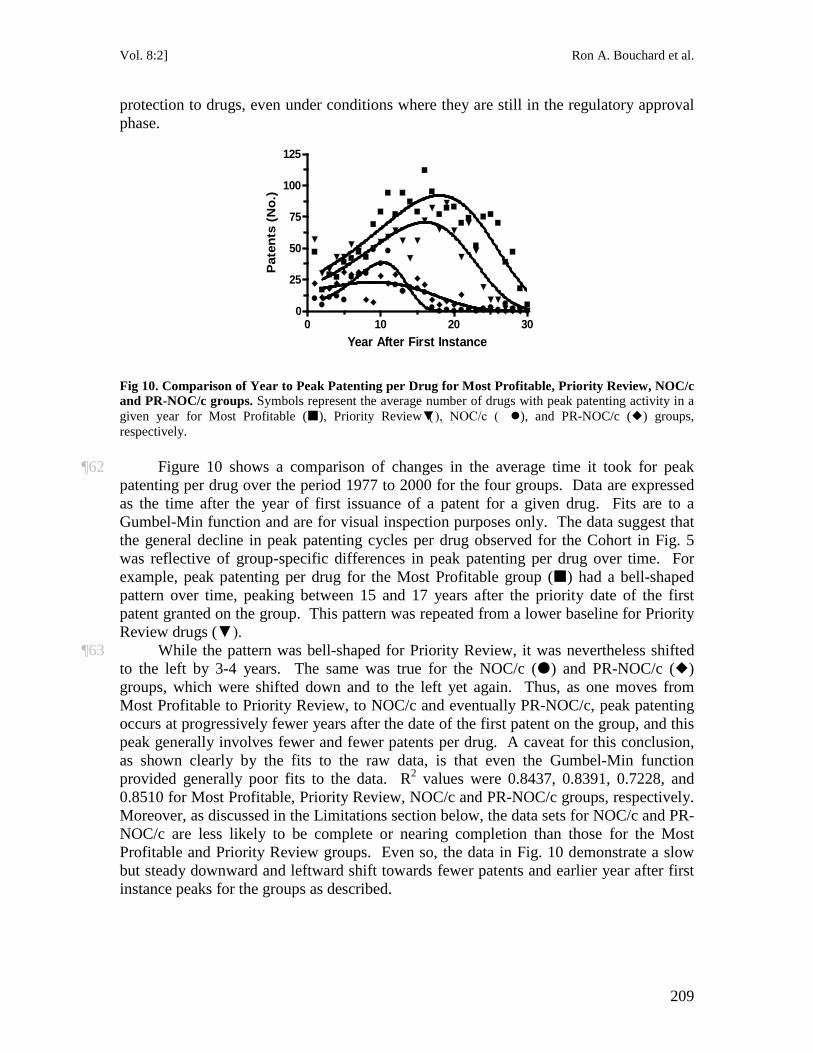
Vol. 8:2] Ron A. Bouchard et al.
209
protection to drugs, even under conditions where they are still in the regulatory approval phase.
0 10 20 300
25
50
75
100
125
Year After First Instance
Pat
ents
(N
o.)
Fig 10. Comparison of Year to Peak Patenting per Drug for Most Profitable, Priority Review, NOC/c and PR-NOC/c groups. Symbols represent the average number of drugs with peak patenting activity in a given year for Most Profitable (), Priority Review (▼), NOC/c ( ), and PR-NOC/c () groups, respectively.
¶62 Figure 10 shows a comparison of changes in the average time it took for peak patenting per drug over the period 1977 to 2000 for the four groups. Data are expressed as the time after the year of first issuance of a patent for a given drug. Fits are to a Gumbel-Min function and are for visual inspection purposes only. The data suggest that the general decline in peak patenting cycles per drug observed for the Cohort in Fig. 5 was reflective of group-specific differences in peak patenting per drug over time. For example, peak patenting per drug for the Most Profitable group () had a bell-shaped pattern over time, peaking between 15 and 17 years after the priority date of the first patent granted on the group. This pattern was repeated from a lower baseline for Priority Review drugs (▼).
¶63 While the pattern was bell-shaped for Priority Review, it was nevertheless shifted to the left by 3-4 years. The same was true for the NOC/c () and PR-NOC/c () groups, which were shifted down and to the left yet again. Thus, as one moves from Most Profitable to Priority Review, to NOC/c and eventually PR-NOC/c, peak patenting occurs at progressively fewer years after the date of the first patent on the group, and this peak generally involves fewer and fewer patents per drug. A caveat for this conclusion, as shown clearly by the fits to the raw data, is that even the Gumbel-Min function provided generally poor fits to the data. R2
values were 0.8437, 0.8391, 0.7228, and 0.8510 for Most Profitable, Priority Review, NOC/c and PR-NOC/c groups, respectively. Moreover, as discussed in the Limitations section below, the data sets for NOC/c and PR-NOC/c are less likely to be complete or nearing completion than those for the Most Profitable and Priority Review groups. Even so, the data in Fig. 10 demonstrate a slow but steady downward and leftward shift towards fewer patents and earlier year after first instance peaks for the groups as described.
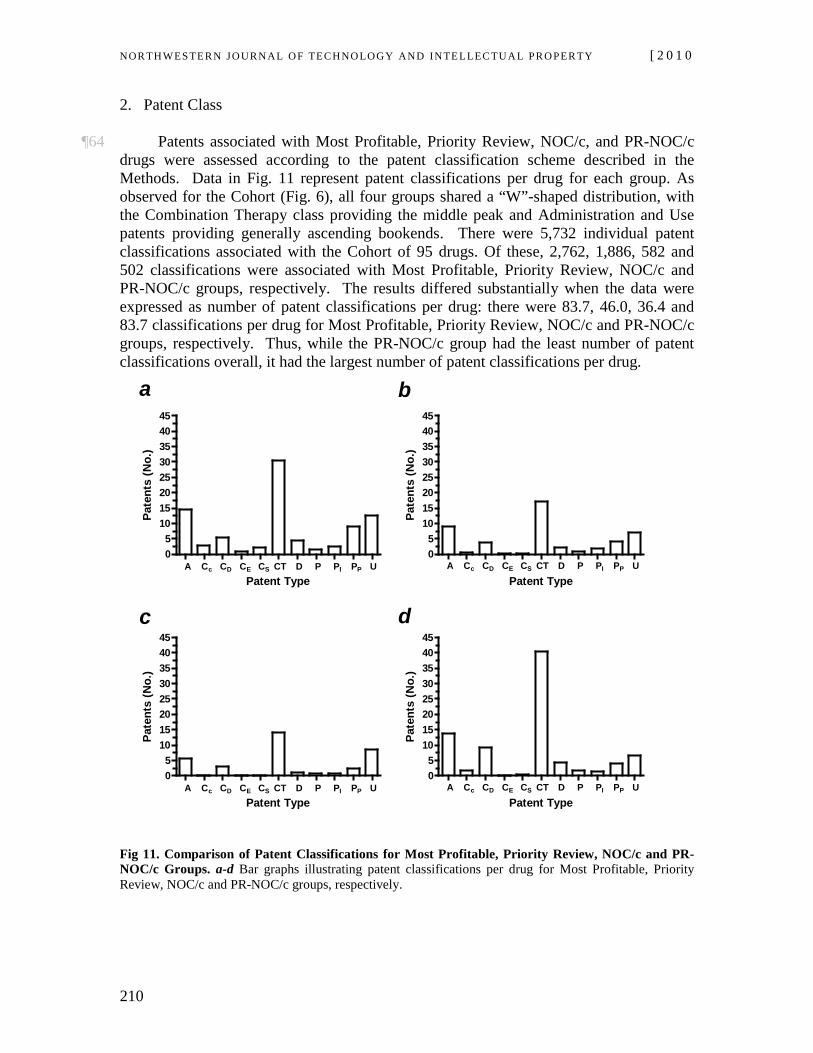
NOR TH WES TERN JO URN AL O F TECH NO LO GY AND IN TE LLEC TU A L PRO PER TY [ 2 0 1 0
210
2. Patent Class
¶64 Patents associated with Most Profitable, Priority Review, NOC/c, and PR-NOC/c drugs were assessed according to the patent classification scheme described in the Methods. Data in Fig. 11 represent patent classifications per drug for each group. As observed for the Cohort (Fig. 6), all four groups shared a “W”-shaped distribution, with the Combination Therapy class providing the middle peak and Administration and Use patents providing generally ascending bookends. There were 5,732 individual patent classifications associated with the Cohort of 95 drugs. Of these, 2,762, 1,886, 582 and 502 classifications were associated with Most Profitable, Priority Review, NOC/c and PR-NOC/c groups, respectively. The results differed substantially when the data were expressed as number of patent classifications per drug: there were 83.7, 46.0, 36.4 and 83.7 classifications per drug for Most Profitable, Priority Review, NOC/c and PR-NOC/c groups, respectively. Thus, while the PR-NOC/c group had the least number of patent classifications overall, it had the largest number of patent classifications per drug.
A C C C C CT D P P P U05
1015202530354045
A Cc CD CE CS CT D P PI PP UPatent Type
Pate
nts
(No.
)
A C C C C CT D P P P U05
1015202530354045
A Cc CD CE CS CT D P PI PP UPatent Type
Pate
nts
(No.
)
A C C C C CT D P P P U05
1015202530354045
A Cc CD CE CS CT D P PI PP UPatent Type
Pate
nts
(No.
)
A C C C C CT D P P P U05
1015202530354045
A Cc CD CE CS CT D P PI PP UPatent Type
Pate
nts
(No.
)a
c
b
d
Fig 11. Comparison of Patent Classifications for Most Profitable, Priority Review, NOC/c and PR-NOC/c Groups. a-d Bar graphs illustrating patent classifications per drug for Most Profitable, Priority Review, NOC/c and PR-NOC/c groups, respectively.
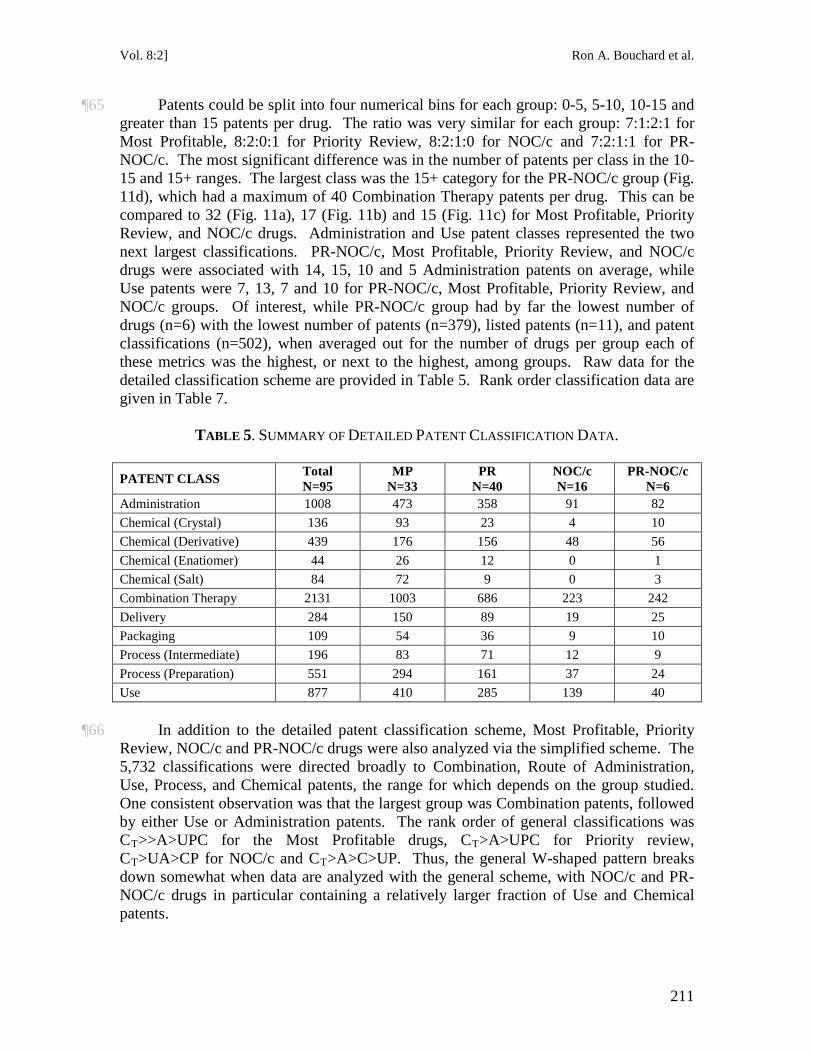
Vol. 8:2] Ron A. Bouchard et al.
211
¶65 Patents could be split into four numerical bins for each group: 0-5, 5-10, 10-15 and greater than 15 patents per drug. The ratio was very similar for each group: 7:1:2:1 for Most Profitable, 8:2:0:1 for Priority Review, 8:2:1:0 for NOC/c and 7:2:1:1 for PR-NOC/c. The most significant difference was in the number of patents per class in the 10-15 and 15+ ranges. The largest class was the 15+ category for the PR-NOC/c group (Fig. 11d), which had a maximum of 40 Combination Therapy patents per drug. This can be compared to 32 (Fig. 11a), 17 (Fig. 11b) and 15 (Fig. 11c) for Most Profitable, Priority Review, and NOC/c drugs. Administration and Use patent classes represented the two next largest classifications. PR-NOC/c, Most Profitable, Priority Review, and NOC/c drugs were associated with 14, 15, 10 and 5 Administration patents on average, while Use patents were 7, 13, 7 and 10 for PR-NOC/c, Most Profitable, Priority Review, and NOC/c groups. Of interest, while PR-NOC/c group had by far the lowest number of drugs (n=6) with the lowest number of patents (n=379), listed patents (n=11), and patent classifications (n=502), when averaged out for the number of drugs per group each of these metrics was the highest, or next to the highest, among groups. Raw data for the detailed classification scheme are provided in Table 5. Rank order classification data are given in Table 7.
TABLE 5. SUMMARY OF DETAILED PATENT CLASSIFICATION DATA.
PATENT CLASS Total N=95
MP N=33
PR N=40
NOC/c N=16
PR-NOC/c N=6
Administration 1008 473 358 91 82 Chemical (Crystal) 136 93 23 4 10 Chemical (Derivative) 439 176 156 48 56 Chemical (Enatiomer) 44 26 12 0 1 Chemical (Salt) 84 72 9 0 3 Combination Therapy 2131 1003 686 223 242 Delivery 284 150 89 19 25 Packaging 109 54 36 9 10 Process (Intermediate) 196 83 71 12 9 Process (Preparation) 551 294 161 37 24 Use 877 410 285 139 40
¶66 In addition to the detailed patent classification scheme, Most Profitable, Priority Review, NOC/c and PR-NOC/c drugs were also analyzed via the simplified scheme. The 5,732 classifications were directed broadly to Combination, Route of Administration, Use, Process, and Chemical patents, the range for which depends on the group studied. One consistent observation was that the largest group was Combination patents, followed by either Use or Administration patents. The rank order of general classifications was CT>>A>UPC for the Most Profitable drugs, CT>A>UPC for Priority review, CT>UA>CP for NOC/c and CT
>A>C>UP. Thus, the general W-shaped pattern breaks down somewhat when data are analyzed with the general scheme, with NOC/c and PR-NOC/c drugs in particular containing a relatively larger fraction of Use and Chemical patents.
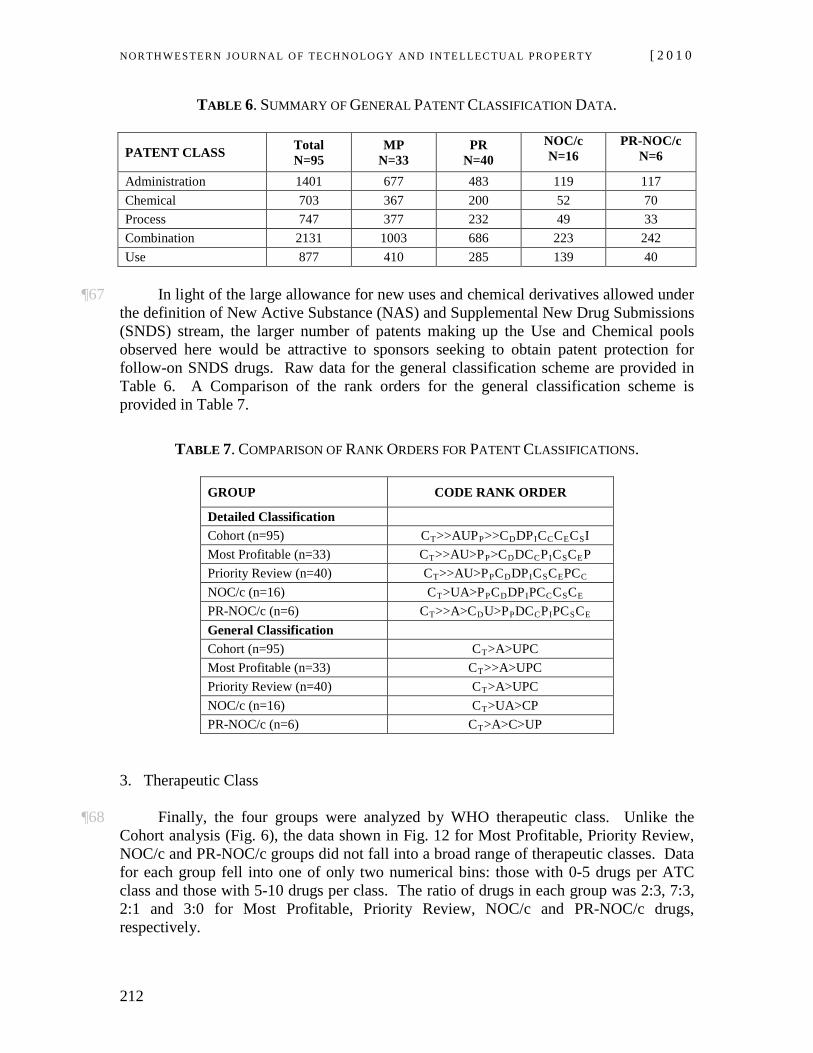
NOR TH WES TERN JO URN AL O F TECH NO LO GY AND IN TE LLEC TU A L PRO PER TY [ 2 0 1 0
212
TABLE 6. SUMMARY OF GENERAL PATENT CLASSIFICATION DATA.
PATENT CLASS Total N=95
MP N=33
PR N=40
NOC/c N=16
PR-NOC/c N=6
Administration 1401 677 483 119 117 Chemical 703 367 200 52 70 Process 747 377 232 49 33 Combination 2131 1003 686 223 242 Use 877 410 285 139 40
¶67 In light of the large allowance for new uses and chemical derivatives allowed under
the definition of New Active Substance (NAS) and Supplemental New Drug Submissions (SNDS) stream, the larger number of patents making up the Use and Chemical pools observed here would be attractive to sponsors seeking to obtain patent protection for follow-on SNDS drugs. Raw data for the general classification scheme are provided in Table 6. A Comparison of the rank orders for the general classification scheme is provided in Table 7.
TABLE 7. COMPARISON OF RANK ORDERS FOR PATENT CLASSIFICATIONS.
GROUP CODE RANK ORDER
Detailed Classification Cohort (n=95) CT>>AUPP>>CDDPICCCECSI Most Profitable (n=33) CT>>AU>PP>CDDCCPICSCEP Priority Review (n=40) CT>>AU>PPCDDPICSCEPCC NOC/c (n=16) CT>UA>PPCDDPIPCCCSCE PR-NOC/c (n=6) CT>>A>CDU>PPDCCPIPCSCE General Classification Cohort (n=95) CT>A>UPC Most Profitable (n=33) CT>>A>UPC Priority Review (n=40) CT>A>UPC NOC/c (n=16) CT>UA>CP PR-NOC/c (n=6) CT>A>C>UP
3. Therapeutic Class
¶68 Finally, the four groups were analyzed by WHO therapeutic class. Unlike the Cohort analysis (Fig. 6), the data shown in Fig. 12 for Most Profitable, Priority Review, NOC/c and PR-NOC/c groups did not fall into a broad range of therapeutic classes. Data for each group fell into one of only two numerical bins: those with 0-5 drugs per ATC class and those with 5-10 drugs per class. The ratio of drugs in each group was 2:3, 7:3, 2:1 and 3:0 for Most Profitable, Priority Review, NOC/c and PR-NOC/c drugs, respectively.
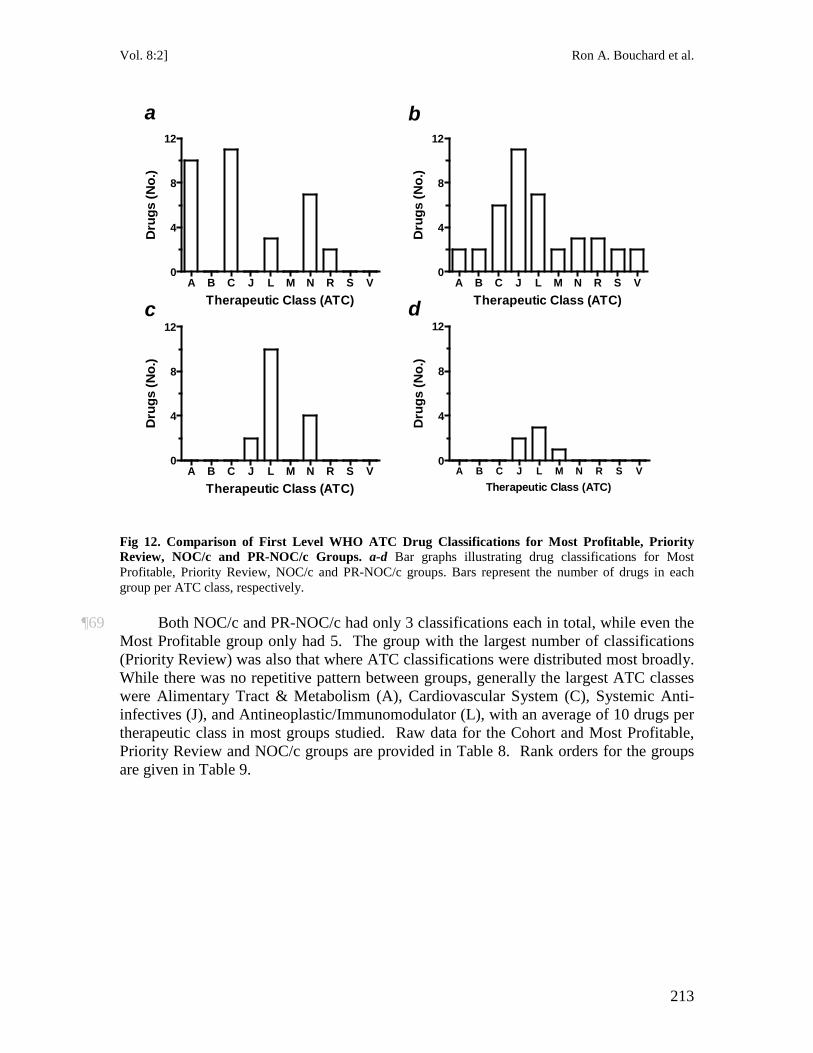
Vol. 8:2] Ron A. Bouchard et al.
213
A B C J L M N R S V0
4
8
12
Therapeutic Class (ATC)
Dru
gs (N
o.)
A B C J L M N R S V0
4
8
12
Therapeutic Class (ATC)
Dru
gs (N
o.)
A B C J L M N R S V0
4
8
12
Therapeutic Class (ATC)
Dru
gs (N
o.)
A B C J L M N R S V0
4
8
12
Therapeutic Class (ATC)
Dru
gs (N
o.)
a
c
b
d
Fig 12. Comparison of First Level WHO ATC Drug Classifications for Most Profitable, Priority Review, NOC/c and PR-NOC/c Groups. a-d Bar graphs illustrating drug classifications for Most Profitable, Priority Review, NOC/c and PR-NOC/c groups. Bars represent the number of drugs in each group per ATC class, respectively.
¶69 Both NOC/c and PR-NOC/c had only 3 classifications each in total, while even the
Most Profitable group only had 5. The group with the largest number of classifications (Priority Review) was also that where ATC classifications were distributed most broadly. While there was no repetitive pattern between groups, generally the largest ATC classes were Alimentary Tract & Metabolism (A), Cardiovascular System (C), Systemic Anti-infectives (J), and Antineoplastic/Immunomodulator (L), with an average of 10 drugs per therapeutic class in most groups studied. Raw data for the Cohort and Most Profitable, Priority Review and NOC/c groups are provided in Table 8. Rank orders for the groups are given in Table 9.
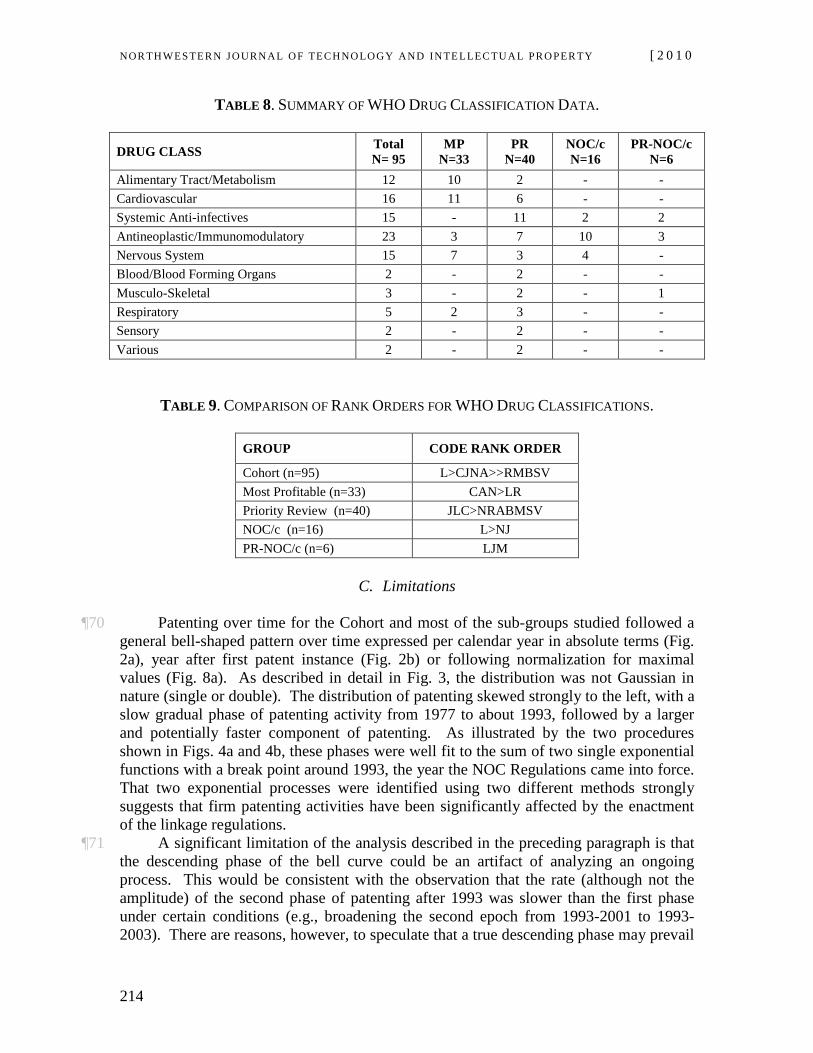
NOR TH WES TERN JO URN AL O F TECH NO LO GY AND IN TE LLEC TU A L PRO PER TY [ 2 0 1 0
214
TABLE 8. SUMMARY OF WHO DRUG CLASSIFICATION DATA.
DRUG CLASS Total N= 95
MP N=33
PR N=40
NOC/c N=16
PR-NOC/c N=6
Alimentary Tract/Metabolism 12 10 2 - - Cardiovascular 16 11 6 - - Systemic Anti-infectives 15 - 11 2 2 Antineoplastic/Immunomodulatory 23 3 7 10 3 Nervous System 15 7 3 4 - Blood/Blood Forming Organs 2 - 2 - - Musculo-Skeletal 3 - 2 - 1 Respiratory 5 2 3 - - Sensory 2 - 2 - - Various 2 - 2 - -
TABLE 9. COMPARISON OF RANK ORDERS FOR WHO DRUG CLASSIFICATIONS.
GROUP CODE RANK ORDER
Cohort (n=95) L>CJNA>>RMBSV Most Profitable (n=33) CAN>LR Priority Review (n=40) JLC>NRABMSV NOC/c (n=16) L>NJ PR-NOC/c (n=6) LJM
C. Limitations
¶70 Patenting over time for the Cohort and most of the sub-groups studied followed a general bell-shaped pattern over time expressed per calendar year in absolute terms (Fig. 2a), year after first patent instance (Fig. 2b) or following normalization for maximal values (Fig. 8a). As described in detail in Fig. 3, the distribution was not Gaussian in nature (single or double). The distribution of patenting skewed strongly to the left, with a slow gradual phase of patenting activity from 1977 to about 1993, followed by a larger and potentially faster component of patenting. As illustrated by the two procedures shown in Figs. 4a and 4b, these phases were well fit to the sum of two single exponential functions with a break point around 1993, the year the NOC Regulations came into force. That two exponential processes were identified using two different methods strongly suggests that firm patenting activities have been significantly affected by the enactment of the linkage regulations.
¶71 A significant limitation of the analysis described in the preceding paragraph is that the descending phase of the bell curve could be an artifact of analyzing an ongoing process. This would be consistent with the observation that the rate (although not the amplitude) of the second phase of patenting after 1993 was slower than the first phase under certain conditions (e.g., broadening the second epoch from 1993-2001 to 1993-2003). There are reasons, however, to speculate that a true descending phase may prevail
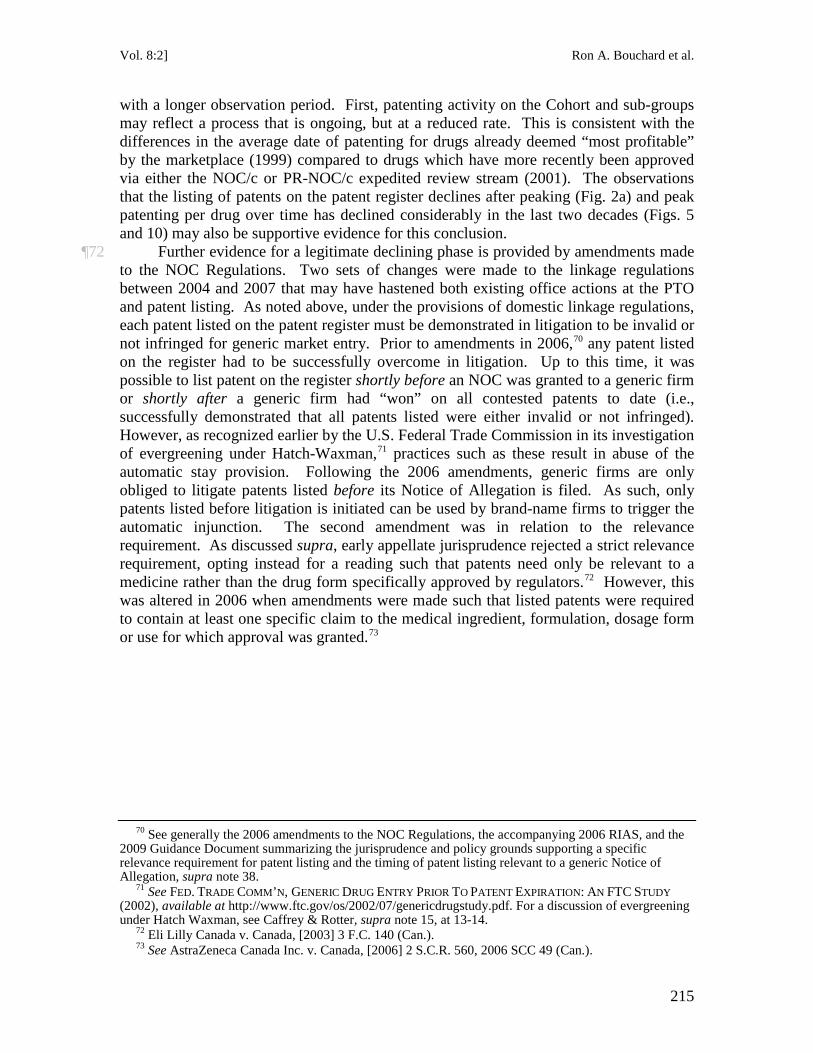
Vol. 8:2] Ron A. Bouchard et al.
215
with a longer observation period. First, patenting activity on the Cohort and sub-groups may reflect a process that is ongoing, but at a reduced rate. This is consistent with the differences in the average date of patenting for drugs already deemed “most profitable” by the marketplace (1999) compared to drugs which have more recently been approved via either the NOC/c or PR-NOC/c expedited review stream (2001). The observations that the listing of patents on the patent register declines after peaking (Fig. 2a) and peak patenting per drug over time has declined considerably in the last two decades (Figs. 5 and 10) may also be supportive evidence for this conclusion.
¶72 Further evidence for a legitimate declining phase is provided by amendments made to the NOC Regulations. Two sets of changes were made to the linkage regulations between 2004 and 2007 that may have hastened both existing office actions at the PTO and patent listing. As noted above, under the provisions of domestic linkage regulations, each patent listed on the patent register must be demonstrated in litigation to be invalid or not infringed for generic market entry. Prior to amendments in 2006,70 any patent listed on the register had to be successfully overcome in litigation. Up to this time, it was possible to list patent on the register shortly before an NOC was granted to a generic firm or shortly after a generic firm had “won” on all contested patents to date (i.e., successfully demonstrated that all patents listed were either invalid or not infringed). However, as recognized earlier by the U.S. Federal Trade Commission in its investigation of evergreening under Hatch-Waxman,71 practices such as these result in abuse of the automatic stay provision. Following the 2006 amendments, generic firms are only obliged to litigate patents listed before its Notice of Allegation is filed. As such, only patents listed before litigation is initiated can be used by brand-name firms to trigger the automatic injunction. The second amendment was in relation to the relevance requirement. As discussed supra, early appellate jurisprudence rejected a strict relevance requirement, opting instead for a reading such that patents need only be relevant to a medicine rather than the drug form specifically approved by regulators.72 However, this was altered in 2006 when amendments were made such that listed patents were required to contain at least one specific claim to the medical ingredient, formulation, dosage form or use for which approval was granted.73
70 See generally the 2006 amendments to the NOC Regulations, the accompanying 2006 RIAS, and the
2009 Guidance Document summarizing the jurisprudence and policy grounds supporting a specific relevance requirement for patent listing and the timing of patent listing relevant to a generic Notice of Allegation, supra note
38. 71 See FED. TRADE COMM’N, GENERIC DRUG ENTRY PRIOR TO PATENT EXPIRATION: AN FTC STUDY
(2002), available at http://www.ftc.gov/os/2002/07/genericdrugstudy.pdf. For a discussion of evergreening under Hatch Waxman, see Caffrey & Rotter, supra note 15, at 13-14.
72 Eli Lilly Canada v. Canada, [2003] 3 F.C. 140 (Can.). 73 See AstraZeneca Canada Inc. v. Canada, [2006] 2 S.C.R. 560, 2006 SCC 49 (Can.).
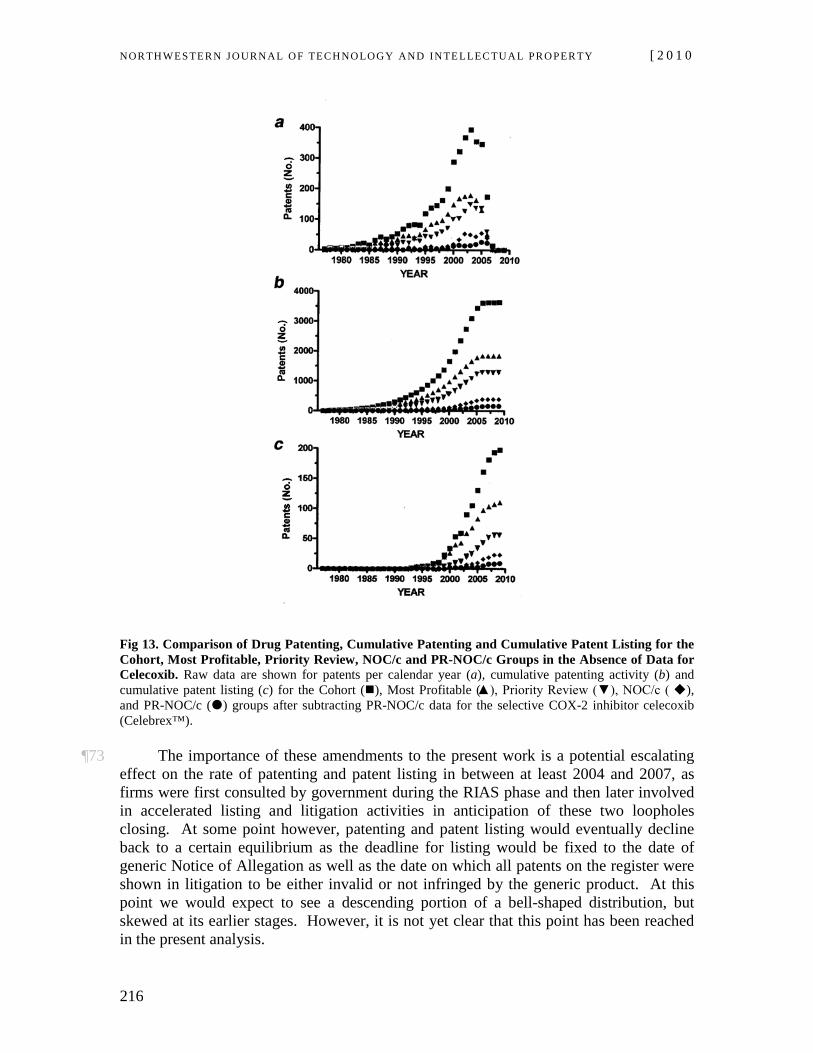
NOR TH WES TERN JO URN AL O F TECH NO LO GY AND IN TE LLEC TU A L PRO PER TY [ 2 0 1 0
216
Fig 13. Comparison of Drug Patenting, Cumulative Patenting and Cumulative Patent Listing for the Cohort, Most Profitable, Priority Review, NOC/c and PR-NOC/c Groups in the Absence of Data for Celecoxib. Raw data are shown for patents per calendar year (a), cumulative patenting activity (b) and cumulative patent listing (c) for the Cohort (), Most Profitable (▲), Priority Review (▼), NOC/c ( ), and PR-NOC/c () groups after subtracting PR-NOC/c data for the selective COX-2 inhibitor celecoxib (Celebrex™).
¶73 The importance of these amendments to the present work is a potential escalating effect on the rate of patenting and patent listing in between at least 2004 and 2007, as firms were first consulted by government during the RIAS phase and then later involved in accelerated listing and litigation activities in anticipation of these two loopholes closing. At some point however, patenting and patent listing would eventually decline back to a certain equilibrium as the deadline for listing would be fixed to the date of generic Notice of Allegation as well as the date on which all patents on the register were shown in litigation to be either invalid or not infringed by the generic product. At this point we would expect to see a descending portion of a bell-shaped distribution, but skewed at its earlier stages. However, it is not yet clear that this point has been reached in the present analysis.
Vol. 8:2] Ron A. Bouchard et al.
217
¶74 A second limitation of the analysis was that the PR-NOC/c results described in Figs. 7-12 were strongly influenced by patenting and patent listing data associated with just one drug, celecoxib.74
Including data for this drug in the PR-NOC/c group had the effect of increasing total patenting per year and cumulative patenting to the level of the NOC/c group (Figs. 7a and 7b) and shifting cumulative patenting (Fig. 8b) and patent listing (Fig. 8c) to the left compared to the NOC/c group. As illustrated by the raw data in Fig 13, when the results for celecoxib are subtracted, there is a progressive trend downward and to the right for peak, cumulative, and normalized patenting and patent listing with a clear and distinct rank order of: Cohort>Most Profitable>Priority Review>NOC/c>PR-NOC/c. While this renders the visual representation and separation of the data visually cleaner, we nevertheless felt it was appropriate to include all data for the PR-NOC/c group. The rationale for this strategy was that celecoxib is an excellent example of the type of drug regulators hope to see going through expedited review and onto Most Profitable status.
V. DISCUSSION
¶75 Our analysis of drug approvals, drug patenting and patent listing under linkage regulations yields a number of important observations. First, the data demonstrates that both the traditional patent and emerging linkage regulation regimes are heavily used by pharmaceutical firms. Data on the Cohort of 95 drugs indicate that for every drug marketed there were at least 40 patents per drug and of these about 5% were listed on the patent register in order to prevent generic entry. While 5% may seem a small fraction for listing, strategic placement of a very small number of patents on the patent register over time has been empirically shown to effectively double the period of patent protection on blockbuster drugs, from an average term of 22 years to a term of 43 years.75
¶76 Second, the data show increasing use of linkage regulations over time. When analyzed in relation to drug approval data, the results suggest that intellectual property protection via linkage regulations may in fact be a better proxy for innovation by firms than drug patenting per se. Combined, the patent and linkage regulation regimes provide substantial legal protection for high value pharmaceuticals. Indeed, over the last three decades, firms have engaged in progressively faster drug approval, patenting and patent listing in order to broaden the area fenced in by these mechanisms.
¶77 Third, the array of patent classifications supporting this endeavour is substantial, encompassing a broad range of chemical, use, process, combination, and delivery patents. These patents can in turn be used to support both a broad array of “new” and “follow-on” drug approvals and for patent listing purposes in order to prevent generic entry on already approved drugs. Fourth, patents identified in this study are directed to a broad scope of therapeutic classes, with particular concentrations in the areas of unmet medical need preferred by drug regulators and the market. Fifth, while patent protection under the linkage regime is specific to a particular submission, the data suggest that firms are well
74 Celecoxib is a non-steroidal anti-inflammatory used in the treatment of osteoarthritis, rheumatoid
arthritis, pain, menstruation, colonic and rectal polyps. Marketed by Pfizer as Celebrex™, it is a selective noncompetitive inhibitor of cyclooxygenase-2 (COX-2) enzyme.
75 Bouchard, Regulation, supra note 65.
NOR TH WES TERN JO URN AL O F TECH NO LO GY AND IN TE LLEC TU A L PRO PER TY [ 2 0 1 0
218
poised to leverage loopholes in operation of the regulations supporting a paradoxical drug approval-drug patenting linkage.
¶78 Finally, data on PR-NOC/c and NOC/c approvals indicate that the linkage regime represents a highly flexible tool in the hands of sophisticated firms. Combined with relatively low evidentiary thresholds for certain types of new and follow-on drug approvals, the speed of patent listing and relatively low relevance requirements for listing enable pharmaceutical firms to rapidly identify attractive drug targets for legal protection, even during the regulatory approval stage. Together, the results show that the existing drug approval system, traditional patent law, and the emerging linkage regime operate in an interdependent and iterative manner to provide a strong mechanism for pharmaceutical firms to efficiently identify attractive drug candidates for intellectual property rights protection at all stages of development, including drugs about to come off patent protection, drugs moving through the regulatory approval stage, and drugs that are currently in development.
A. Drug Patenting
¶79 The data demonstrate that the patent regime is heavily utilized by pharmaceutical firms in order to legally protect attractive drug candidates. This includes drugs that already have strong market value (Most Profitable) as well as drugs that underwent some form of expedited approval in the hopes they would (Priority Review; NOC/c; PR-NOC/c). As illustrated in Fig 2a, the average drug in the Cohort was associated with a very large number of patents (3,850), corresponding to a patent per drug ratio of 40:1. These patents were issued over a substantial term of close to 35 years, with the most rapid patenting occurring over a comparatively short time frame (1997-2004; Fig. 2a). Averaged patenting activity exhibited a significant plateau over an eight year period after the year of first instance (Fig. 2b). During this time, peak patenting was maintained at an average of about 2.5 patents per drug per year.
¶80 The data in Figs. 3 and 4 strongly suggest there were multiple phases of patenting activity. Fits to the data suggest there were at least two components, a slower and smaller amplitude component up to 1993 and a faster and larger amplitude component following 1993. More specifically, the amount of patenting was approximately 2.5 times greater and 2.0 times faster in between 1993-2001 than patenting patterns from 1977-1993. The break in patenting activity in 1993 correlates well with the effective date of the domestic linkage regulations regime. As such, the data indicate the linkage regulations regime itself has significantly influenced patenting activity by pharmaceutical firms.
¶81 A related observation was that overall patenting activity for the Cohort exhibited a steady decline in the time taken to achieve peak patenting per drug over the term 1977-2000 (Fig. 5). Indeed, there was a threefold increase in the rate of peak patenting per drug over the test period. Together, the data in Figs 2-5 suggest that pharmaceutical firms have become increasingly efficient at using the patent regime over the last three decades.
¶82 Data in Fig. 6 and Tables 5-7 illustrate that the Cohort was associated with a substantial array of patent classifications and WHO drug classifications. There were 5,859 individual patent classifications on the Cohort. This yielded an average of close to 62 classifications per marketed drug. These were distributed widely across functional
Vol. 8:2] Ron A. Bouchard et al.
219
patent types, with particular concentrations for Combination Therapy, Use and Administration patents, and a second large grouping for Chemical and Process patents. As already noted, the two main regulatory mechanisms underpinning a paradoxical drug approval-drug patent linkage are the wide definition of a New Active Substance (NAS) and the wide scope of uses and chemical derivatives permitted under the Supplementary New Drug Submission (SNDS) stream.
¶83 As noted earlier, a NAS may include isomers, derivatives, or salts of chemical substances already approved for sale or biological substances previously approved but differing in molecular structure, nature of the source material or even manufacturing process.76
¶84 The patent classification data reported here demonstrate that the patent pool supporting submissions directed either to a NAS or the SNDS approval stream is very large indeed. Importantly, these patents can also be used to prohibit generic entry on already approved drugs via the patent listing provisions. Thus, the broad patent classifications observed here can be used to (1) support follow-on drug development and (2) prevent generic entry on drugs that are already on the market and coming off patent.
Similarly, an SNDS may be filed for changes to a drug that is already marketed by a sponsor, including minor changes to dosage, strength, formulation, manufacture, labeling, route of administration, or use/indication. Therefore, it is noteworthy that the three largest patent classes for the Cohort were combination therapies, uses and routes of administrations. Each of these patent classifications lends itself well to follow-on drug development. It may also be observed that the patent classification typically thought to underwrite breakthrough drug development, Chemical patents, represented the smallest fraction of classifications studied.
¶85 Figures 6b-d and related tables show that there was a wide range of WHO therapeutic classes represented by the Cohort. Nevertheless, the majority (81 of 95) of drugs were located in the Antineoplastic/Immunomodulator, Alimentary Tract & Metabolism, Cardiovascular, Systemic Anti-infective, and Nervous System classifications. The distribution of drugs (Fig. 6a), and patents associated with them (Fig. 6c), in the Cohort are similar to recent data reported for domestic ethical sales by therapeutic class.77
As illustrated by comparison data in Table 10, the top therapeutic classes by ethical sales were Cardiovascular, Psychotherapeutics, Gastro-Intestinal, Oncology, Arthritics, Bronchial, Analgesics, Neurological and Anti-infectives. Assuming it is reasonable to fold lipid lowering drugs into the Cardiovascular class, psychotropics within the Neurological class, and analgesics within the Anti-Arthritic class, the top seven therapeutic classes by domestic ethical purchase strongly track the top six WHO ATC therapeutic classes observed in this study. When developing high value drugs, pharmaceutical firms are therefore ensuring strong representation of drug candidates and associated patents in therapeutic classes that are already well established in the market, with a smaller but still significant fraction in the areas of unmet medical need associated with Priority Review and NOC/c approvals..
76 Health Canada, New Active Substances Letter, supra note 58; Health Canada NOC Database
Terminology, supra note 58. 77 IMS CONSULTING, CANADIAN PHARMACEUTICAL INDUSTRY REVIEW 64-65 (2008).
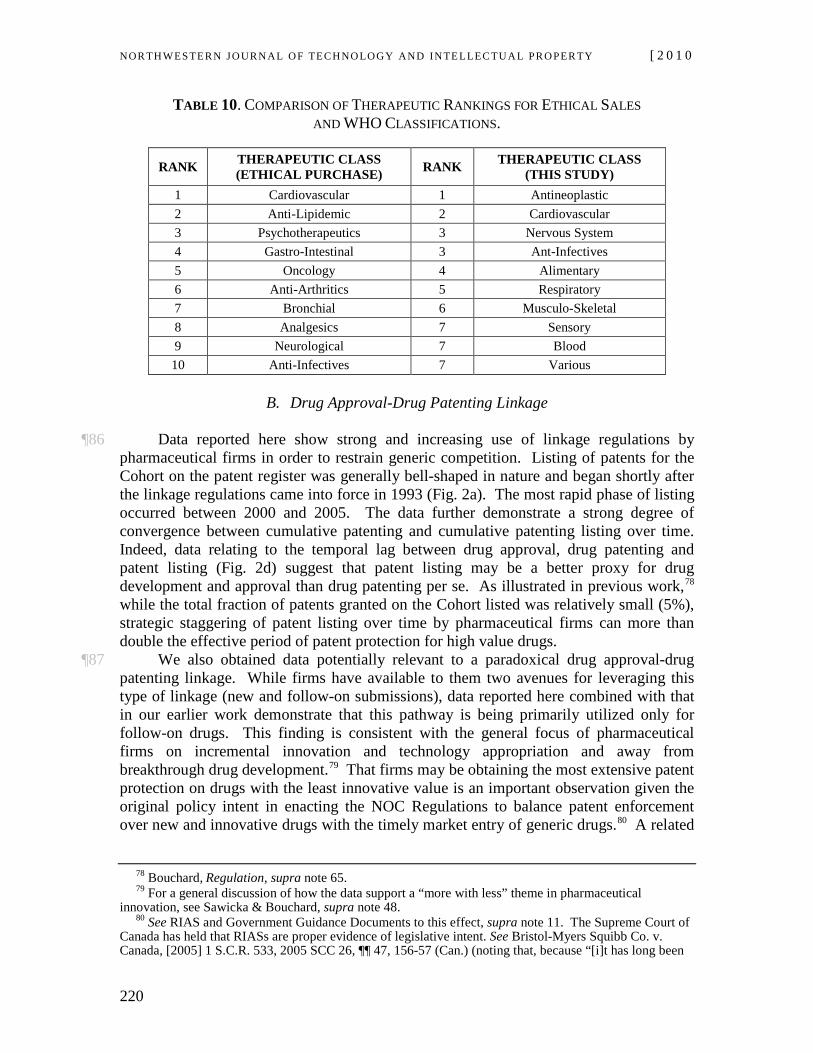
NOR TH WES TERN JO URN AL O F TECH NO LO GY AND IN TE LLEC TU A L PRO PER TY [ 2 0 1 0
220
TABLE 10. COMPARISON OF THERAPEUTIC RANKINGS FOR ETHICAL SALES AND WHO CLASSIFICATIONS.
RANK THERAPEUTIC CLASS (ETHICAL PURCHASE) RANK THERAPEUTIC CLASS
(THIS STUDY) 1 Cardiovascular 1 Antineoplastic 2 Anti-Lipidemic 2 Cardiovascular 3 Psychotherapeutics 3 Nervous System 4 Gastro-Intestinal 3 Ant-Infectives 5 Oncology 4 Alimentary 6 Anti-Arthritics 5 Respiratory 7 Bronchial 6 Musculo-Skeletal 8 Analgesics 7 Sensory 9 Neurological 7 Blood 10 Anti-Infectives 7 Various
B. Drug Approval-Drug Patenting Linkage
¶86 Data reported here show strong and increasing use of linkage regulations by pharmaceutical firms in order to restrain generic competition. Listing of patents for the Cohort on the patent register was generally bell-shaped in nature and began shortly after the linkage regulations came into force in 1993 (Fig. 2a). The most rapid phase of listing occurred between 2000 and 2005. The data further demonstrate a strong degree of convergence between cumulative patenting and cumulative patenting listing over time. Indeed, data relating to the temporal lag between drug approval, drug patenting and patent listing (Fig. 2d) suggest that patent listing may be a better proxy for drug development and approval than drug patenting per se. As illustrated in previous work,78
¶87 We also obtained data potentially relevant to a paradoxical drug approval-drug patenting linkage. While firms have available to them two avenues for leveraging this type of linkage (new and follow-on submissions), data reported here combined with that in our earlier work demonstrate that this pathway is being primarily utilized only for follow-on drugs. This finding is consistent with the general focus of pharmaceutical firms on incremental innovation and technology appropriation and away from breakthrough drug development.
while the total fraction of patents granted on the Cohort listed was relatively small (5%), strategic staggering of patent listing over time by pharmaceutical firms can more than double the effective period of patent protection for high value drugs.
79 That firms may be obtaining the most extensive patent protection on drugs with the least innovative value is an important observation given the original policy intent in enacting the NOC Regulations to balance patent enforcement over new and innovative drugs with the timely market entry of generic drugs.80
78 Bouchard, Regulation, supra note
A related
65. 79 For a general discussion of how the data support a “more with less” theme in pharmaceutical
innovation, see Sawicka & Bouchard, supra note 48. 80 See RIAS and Government Guidance Documents to this effect, supra note 11. The Supreme Court of
Canada has held that RIASs are proper evidence of legislative intent. See Bristol-Myers Squibb Co. v. Canada, [2005] 1 S.C.R. 533, 2005 SCC 26, ¶¶ 47, 156-57 (Can.) (noting that, because “[i]t has long been
Vol. 8:2] Ron A. Bouchard et al.
221
observation is that the linkage regime was intended to operate in accordance with established principles of patent law and to further the societal imperative of encouraging the development of novel medical therapies.81 That private firms may be obtaining extended patent protection for weakly inventive products while at the same time generic competition is chilled and public are deprived of reasonably priced pharmaceuticals raises the possibility that the quid pro quo of the traditional patent bargain is breached, yielding a result that would be at odds with legislative intent. The implication of our empirical data for the vires of the NOC Regulations is the subject of additional work by our group.82
C. System Flexibility and “Rights Layering”
¶88 The data in the later half of the Article illustrate that, in combination, the evidentiary requirements for drug approval, drug patenting under the traditional patent system and drug patenting and listing under the emerging linkage regime provide pharmaceutical firms with a large degree of flexibility in layering intellectual property rights on high value drugs in a manner that is both absolute and strongly context-specific.
¶89 A dominant pattern emerged when patenting and patent listing data for the Most Profitable, Priority Review, NOC/c and PR-NOC/c groups were analysed. Patenting activity expressed per calendar year was generally bell-shaped and skewed to the left (Figs. 7a and 8a) and cumulative patenting and patent listing data were well fit by sigmoidal functions (Figs. 7b and 7c). The strongest patenting activity occurred between 1998 and 2003 (Fig. 8b), while the strongest listing activity occurred later, between 2000 and 2005 (Fig. 8c). The time lag between drug approval and cumulative patent listing was much reduced compared to cumulative patenting or patenting activity expressed per calendar year (Figs. 9a-9d). Finally, there was a wide distribution of patent classifications for all groups, with a similar “W”-shaped pattern and similar classification peaks (Fig. 11). This suggests that pharmaceutical firms are leveraging a harmonized drug development, patenting and patent listing strategy for all groups studied.
¶90 Despite these similarities, however, there were significant differences between groups that are revealing. As illustrated in Fig. 7, peak patenting, cumulative patenting and cumulative listing were much greater for Most Profitable and Priority Review drugs compared to either NOC/c or PR-NOC/c drugs. Approximately 80% of all patents and listed patents were associated with the Most Profitable and Priority Review groups. Of interest, these two groups also displayed the most leftward skewing in the distribution of total patenting activity (Fig. 8) and the earliest onset of cumulative patenting (Fig. 8b) and cumulative patent listing (Fig. 8c) activity. By contrast, patenting activity per year was much more symmetrical for both NOC/c and PR-NOC/c groups (Figs. 8a and 13), and cumulative patenting and patent listing was shifted to the right in both groups (Figs. 8b, 8c and 13), with PR-NOC/c drugs being shifted farthest to the right. The general established that the usage of admissible extrinsic sources regarding a provision's legislative history and its context of enactment could be examined,” “it is useful to examine the RIAS, prepared as part of the regulatory process”).
81 C. Gaz., Vol. 138. No. 50. (Dec. 11, 2004). 82 See Ron A. Bouchard, I’m Still Your Baby: Canada’s Continuing Support of U.S. Linkage Regime for
Pharmaceuticals, 15 MARQ. INTELL. PROP. L. REV. (forthcoming 2011), available at http://ssrn.com/abstract=1537988.
NOR TH WES TERN JO URN AL O F TECH NO LO GY AND IN TE LLEC TU A L PRO PER TY [ 2 0 1 0
222
order of Most Profitable>Priority Review>NOC/c>PR-NOC/c was repeated when differences in peak patenting per drug over time were assessed. As one moved progressively through this spectrum, peak patenting occurred in progressively fewer years after the date of patent first instance and this peak was progressively lower in number (Fig. 10). That the Most Profitable group would have the greatest patenting, patent listing, patent classification values is not surprising given that this group of drugs has already been identified by the market as highly profitable. This is corroborated by the fact that this group had the earliest average patent priority date (Table 4) and cumulative patenting and patent listing activity.
¶91 Differences in the data are consistent with the observation that one group (Most Profitable) has already reached “high value” status, while the remaining three (Priority Review, NOC/c, PR-NOC/c) were more recently approved in the hopes they would do so. Thus, it is not surprising that the Most Profitable group had the strongest and earliest patenting and patent listing trends (Figs. 7 and 8). Of interest, there was a 5 year gap between the mid-point of normalized patenting for the four sub-groups studied (Fig. 8a) which declined to only two years for cumulative patent listing (Fig. 8b). This corresponded to the observation that the lag between approval and patenting and patent listing was tightest for NOC/c and PR-NOC/c approvals compared to Most Profitable, with Priority Review in between (Fig. 9). Combined, the data demonstrate a strong degree of responsiveness by both regulators and firms to regulatory signals suggesting a drug candidate may be a high value drug.
¶92 A second major contributing factor for differences between the Priority Review, NOC/c and PR-NOC/c groups is the issue of post-market evidentiary requirements. For instance, we observed stronger and earlier patenting and patent listing for Priority Review compared to NOC/c and PR-NOC/c groups (Figs 7 and 8). It may be recalled that Priority Review represents a pathway for expedited review with no change in pre-market evidentiary requirements, whereas NOC/c and PR-NOC/c approvals entail significant post-market safety and efficacy reporting requirements. While the Priority review group had about three times the patenting activity and patent listing than either NOC/c group (Fig. 7), it is noteworthy that the speed of patenting and, particularly, patent listing were very similar in the three groups (Fig. 8), indicating that firms can make up lost ground when regulatory signals favouring drug approval arise.
¶93 Considerations such as these also likely inform data pertaining to differences in peak patenting per drug when expressed as year after first instance (Fig 10). The largest peak (~100 patents per drug, peaking 20 years after first instance) was observed for the Most Profitable group, which corresponded to data for patenting activity over time (Fig. 7). This was followed by Priority Review (~75 patent per drug, peaking 17 years after first instance), NOC/c (~40 patents per drug, peaking 10 years after first instance) and then PR-NOC (~25 patents per drug, peaking 8-9 years after first instance) groups. The fact that peak patenting for the Most Profitable group was earliest for patenting activity compared to all other groups analysed and latest for peak patenting per drug is likely explained by the lack of regulatory lag for approval and post-market obligations and the accrual of an established market for Most Profitable drugs. On this basis, it is not surprising that Priority Review group had the next fastest patenting per group cycle and that the two NOC/c groups had the fastest patenting cycles. Priority Review involves no additional post-market evidentiary obligations whereas NOC/c approvals do and
Vol. 8:2] Ron A. Bouchard et al.
223
therefore the market has time to solidify earlier. Thus, the diminished and faster NOC/c and PR-NOC/c patenting per drug data simply reflect the ongoing nature of approval and patenting for these groups.
¶94 The data described thus far also demonstrate that firms are able to identify attractive drug candidates early in the approval process. At this point, firms begin the process of layering patents, listing patents on the patent register, and obtaining further patents with broad classifications to expand the boundary of legal protection afforded by the patent and linkage regulation regimes. This, in turn, allows firms to fill coffers with candidates for later NDS and SNDS submissions. It is worth pointing out that the linkage regime in combination with the existing drug regulatory regime has proven to be a highly flexible tool in the hands of sophisticated pharmaceutical firms. The combination of the speed of patent listing compared with patenting and the relatively low relevance requirement for listing has enabled pharmaceutical firms to rapidly identify attractive drug targets for legal protection even during the regulatory approval stage. This goal is supported by the large number of patents and patent classifications observed here and the wide berth in regulatory requirements for approval of NAS and SNDS drugs.
¶95 The group that best exemplifies the flexibility of the drug approval-drug patenting linkage is the combined PR-NOC/c group. This category represents perhaps the best bet of pharmaceutical sponsors in the high risk stakes of drug development. It offers the most favourable balance of expedited review with minimally intrusive post-marketing obligations for therapeutic niches with known demand. Composed of the smallest number of drugs in the Cohort, the characteristics of this group differed substantially for almost all metrics studied when the data were normalized. For example, while the PR-NOC/c group had by far the lowest number of drugs (n=6) with the lowest number of patents (n=379), listed patents (n=11), and patent classifications (n=502), when averaged out for the number of drugs per group each of these metrics was the highest, or next to the highest, among the groups. PR-NOC/c drugs had an average of 63 patents per drug (Table 4), 2% of which were listed on the patent register. The average number of patents was 56% greater than the next highest group, represented by Most Profitable drugs.
¶96 While 2% listed patents is lower than listing percentages for the other groups (Most Profitable, 5.96%; Priority Review, 4.34%; NOC/c, 5.94%), it is noteworthy that the average patent date for PR-NOC/c drugs was almost two years later than that for the Cohort or Most Profitable groups (Table 4). As such, both conventional patent protection and linkage regulation protection would be extended by 3 to 5 years compared to other groups studied. An extra period of patent protection of this nature is not inconsiderable, as is now recognized in the context of both brand-name and generic first mover status. The PR-NOC/c group also had the smallest drug approval to patenting/patent listing lag differential (Fig. 9), with both 50th and 100th percentile patent listing occurring prior to the average date of drug approval. Therefore, the regulatory lag for PR-NOC/c drugs would be reduced correspondingly. Finally, PR-NOC/c drugs had 83.7 patent classifications per drug (Fig. 11; Tables 5 and 6). Notwithstanding the smaller range of WHO ATC classifications compared to other groups (Fig. 12), this would open a large patent pool to underpin future patent listing efforts to delay generic competition via linkage regulations as well as to support future follow-on drug development via the conventional patent system. The closest group in each of these metrics was the NOC/c
NOR TH WES TERN JO URN AL O F TECH NO LO GY AND IN TE LLEC TU A L PRO PER TY [ 2 0 1 0
224
group, which represents the group with the least amount of pre-market evidentiary requirements in exchange for expedited review compared to the PR-NOC/c group.
¶97 As illustrated in Fig. 12, there were also differences in the profiles of WHO therapeutic classes between groups. Of particular interest is the observation that the requirements for (a) effective treatment, prevention or diagnosis of a disease, (b) evidence of a significant increase in safety and efficacy or decrease in risk such that overall risk-benefit profile is improved, and (c) examples offered by regulators of what constitutes a serious or life-threatening disease and a severely debilitating disease for NOC/c83 and Priority Review84 approvals appear to be very similar, despite substantial differences in therapeutic classification data for these groups (Fig. 12). Data for Priority Review were well distributed throughout all 10 ATC classes with concentrations in the groups discussed above. By contrast, the distribution of classes for both the NOC/c and PR-NOC/c were highly curtailed and narrowly distributed amongst Antineoplastic and Immunomodulatory, Systemic Anti-infective, Nervous System and Musculo-Skeletal classifications. While one might assume that Most Profitable drugs differ from Priority Review and NOC/c groups due to the possibility that the most profitable and/or innovative drug development may occur outside of regulatory preferences or unmet medical need, there is no clear explanation for the observed differences between NOC/c and Priority Review groups at present. A partial explanation may be that trends for the two groups have reversed over the last decade, with a cross over point around 2005.85
D. Implications for Global Drug Development & Regulation
¶98 While our study was based on domestic Canadian data, we argue that the results are significant within the global context of drug regulatory reform and innovation policy. First, almost all major pharmaceutical companies are headquartered in either the United States or the European Union.86 Products in smaller markets such as Canada therefore reflect therapeutic product development and intellectual property strategies of multinational firms rather than domestic firms. Secondly, efforts have been underway for some time to harmonize the goals and mechanisms of drug regulation globally. Over the last decade, regulators in Canada have harmonized their regulatory approval requirements to parallel those of the U.S. Food & Drug Administration (FDA) and its European counterpart (EMEA), a trend that will only gain traction as jurisdictions embrace the principles of lifecycle-based regulation.87 Third, global systems of translational research and national science and technology policy are closely integrated and likewise mirror one another, in large part due to the success of the U.S. biotechnology enterprise.88
83 HEALTH CANADA, GUIDANCE FOR INDUSTRY: NOTICE OF COMPLIANCE WITH CONDITIONS (NOC/C)
(2006), available at http://www.hc-sc.gc.ca/dhp-mps/alt_formats/hpfb-dgpsa/pdf/prodpharma/noccg_accd-eng.pdf [hereinafter NOC/c Guidance Document].
84 See also HEALTH CANADA, PRIORITY REVIEW OF DRUG SUBMISSIONS (2007), available at http://www.hc-sc.gc.ca/dhp-mps/alt_formats/hpfb-dgpsa/pdf/prodpharma/noccg_accd-eng.pdf.
Fourth,
85 See Sawicka & Bouchard, supra note 48. 86 BOLDRIN & LEVINE, supra note 9, at 241. 87 See Hans-Georg Eichler et al., Balancing Early Market Access to New Drugs With the Need for
Benefit/Risk Data: A Mounting Dilemma, 7 NATURE REVS. DRUG DISCOVERY 818, 823-24 (2008); Bouchard & Sawicka, supra note 49.
88 Sheila Jasanoff, The Life Sciences and the Rule of Law, 319 J. MOLECULAR BIOLOGY 891 (2002).
Vol. 8:2] Ron A. Bouchard et al.
225
qualitative trends in approval of new and follow-on drugs track one another fairly closely in most major jurisdictions, and the drug patents that we analyzed represent high value drugs not only in Canada, but also in U.S. and E.U. markets. Given that the already small number of multinational pharmaceutical corporations responsible for global drug innovation are doing so increasingly in partnership with drug regulators,89 it is reasonable to speculate that drug development and regulation is steadily converging upon a risk management philosophy whereby critical benefit-risk calculations for product development are made based on legal incentives provided for by regulators. 90
¶99 Importantly, our findings do not indicate abnormal behavior by pharmaceutical companies. Rather, the data lend themselves to the conclusions that the pharmaceutical industry has engaged in very effective intellectual property lobbying over the last two decades and that these lobbying efforts have increasingly informed the drug development strategies of multinational pharmaceutical companies. As acknowledged by the Supreme Court of Canada, it is perfectly acceptable that pharmaceutical firms avail themselves of loopholes that allow product evergreening after the original patent has expired under conditions where the government has made, and continues to make, such loopholes available.
91
VI. SUMMARY & CONCLUSIONS
¶100 The present work was designed to empirically investigate two related phenomenon within the context of emerging linkage regime models of intellectual property protection. The first was to probe the linkage between drug approval and patent listing for high value pharmaceuticals. While the patent regime has for decades been claimed by both pharmaceutical firms and regulators to be integral for innovative drug development, the role of drug approval-drug patenting linkage in this process is unclear. Indeed, a growing cache of empirical studies of the patenting behaviour of large pharmaceutical firms suggests that pharmaceutical firms have become highly adept at leveraging legal and regulatory opportunities offered to them favouring low risk high reward drug products. Empirical evidence relating to drug approval-drug patenting linkage would therefore be valuable at a time when jurisdictions other than the U.S. and Canada are contemplating bringing into force similar provisions. A second consideration was to address how certain characteristics of the existing regulatory approval scheme, such as the relatively low threshold for NAS status and approval via the SNDS stream and provisions relating
89 See generally Mary E. Wiktorowicz, Emergent Patterns in the Regulation of Pharmaceuticals:
Institutions and Interests in the United States, Canada, Britain, and France, 28 J. HEALTH POL., POL’Y & L. 615 (2003).
90 Organization for Economic Co-operation and Development, typically referred to as the OECD. See generally http://www.oecd.org/home/0,2987,en_2649_201185_1_1_1_1_1,00.html.
91 Discussing the general relevance requirement articulated by the Federal Court of Appeal in Eli Lilly Canada Inc. v. Canada 2003 FCA 24, Justice Binnie has stated:
Given the evident (and entirely understandable) commercial strategy of the innovative drug companies to evergreen their products by adding bells and whistles to a pioneering product even after the original patent for that pioneering product has expired, the decision of the Federal Court of Appeal would reward evergreening even if the generic manufacturer (and thus the public) does not thereby derive any benefit from the subsequently listed patents). AstraZeneca Can., Inc. v. Canada, [2006] S.C.R. 560, 2006 SCC 52, ¶ 39 (Can.).
NOR TH WES TERN JO URN AL O F TECH NO LO GY AND IN TE LLEC TU A L PRO PER TY [ 2 0 1 0
226
to expedited approval for drugs might be linked to firm patenting and patent listing patterns. Accordingly, we investigated patent and therapeutic classes preferred by firms in their efforts to support new and follow-on drug development. Of particular interest was to obtain objective data relating to the possibility that firms might be leveraging loopholes in the regulatory and legislative structure underpinning the linkage regime in favour of a paradoxical drug approval-drug patenting linkage. That is, whether firms may be obtaining the greatest intellectual property protection for products with the least innovative value and smallest development costs.
¶101 Our analysis of drug approvals, drug patenting and patent listing under the domestic linkage regulation regime demonstrates strong, increasing and faster utilization of both traditional patent law and emerging linkage regulation regimes by pharmaceutical firms. There were a large number of patents, patent classifications and therapeutic classes for every drug studied. Moreover, firms are listing a significant number of these patents in order to delay generic entry. The results also demonstrate that pharmaceutical companies are becoming increasingly efficient at both patenting and patent listing over time. Indeed, results such as those presented here suggest that the legal protection afforded by the combination of traditional patent law and novel linkage regulations creates an unprecedented legal mechanism that simultaneously protects existing high value drug products from generic competition and allows for further follow-on drug development.
¶102 As discussed here and elsewhere,92
¶103 Not surprisingly, the functional scope of patent classifications identified in this work was substantial, and encompassed a wide range of chemical, use, combination, process, and administration/delivery patents. Similarly, both patents and drugs in the cohort studied were directed to an equally broad scope of therapeutic classes, with particular concentrations in the areas of unmet medical need preferred by drug regulators and the marketplace. Combined, the broad scope of patent type and therapeutic classifications observed here have the potential to support a vast array of new and follow-on drugs, including those meeting the requirements of First in Class drugs approved in the less onerous follow-on SNDS approval stream.
there is a wide berth for the definition of a New Active Substance (NAS) under domestic food and drug law and the type of chemicals and uses allowed under the supplemental, or SNDS, drug approval stream. The definition of a NAS is important as it determines whether a drug will be classified as a “First in Class” or “Me Too” drug, with correlated market price differentials and regulatory preferences. Similarly, the specific combination of chemical structure and use dictates whether a drug is approved via either the “new” or “follow-on” NDS or SNDS approval streams. Of relevance to the present study, a broad range of patent classifications would support a range of high reward low risk product development strategies relating to both new and follow-on drug development.
¶104 Finally, the evidence reported here suggests that the linkage regime provides a highly flexible tool in the hands of sophisticated pharmaceutical firms. The number and array of patent types, the speed of patent listing, the automatic injunction, and the low relevance requirement for listing combined with low evidentiary requirements for new (NAS) and follow-on (SNDS) drug development enable pharmaceutical firms to rapidly identify attractive drug targets for legal protection both during and after regulatory
92 Bouchard, Regulation, supra note 65.
Vol. 8:2] Ron A. Bouchard et al.
227
approval. This property of the linkage regulation regime is demonstrated most effectively by the unique patenting, patent listing and patent classifications of drugs receiving the PR-NOC/c designation. Similar trends were observed with NOC/c and Priority Review groups, but to a lesser extent.
¶105 Together, the results reported here show that the combination of conventional patent law, emerging linkage regulation regimes and existing drug approval framework provide a powerful mechanism for multinational pharmaceutical firms to efficiently and effectively identify attractive new and follow-on drug candidates for market exclusivity. The linkage regulation regime in particular has proven to be an excellent vehicle for firms to obtain extended legal protection on drugs at all stages of development, including drugs about to come off patent protection, drugs moving through the regulatory approval stage, and drugs that are currently in development.