empathizing with france and pakistan on agricultural subsidy issues … · 949 empathizing with...
TRANSCRIPT

949
Empathizing with France and Pakistan on Agricultural Subsidy Issues in the Doha Round
Raj Bhala∗
ABSTRACT
Among the most contentious issues (if not the most contentious issue) in the Doha Round negotiations are agricultural subsidies. Developed countries stand accused of selfish adherence to domestic support and export subsidies that impoverish farmers in developing countries. Developing countries are blamed for self-inflicted wounds, caused by stubborn adherence to protectionist policies, covering both agricultural and industrial sectors. Agricultural subsidy cuts, as well as increased market access, are politically impossible for developed countries to concede without reciprocal access from developing countries, not only on farm products, but also in non-agricultural markets and service sectors. There has been, and continues to be, plenty of dialogue among the trade officials of WTO Members. Is it a dialogue of the deaf? Do developed countries appreciate that poor countries face daunting challenges in reforming their trade regimes? While the challenges must be faced sooner or later, do developed countries understand the fine line in some developing countries between aggressive trade liberalization urged by moderates and descent into a failed statehood dominated by autarkic
∗ Rice Distinguished Professor, The University of Kansas, School of Law; J.D., Harvard (1989); M.Sc., Oxford (1986); M.Sc., London School of Economics (1985); A.B., Duke (1984). Marshall Scholar (1984–86). Member, Council on Foreign Relations, Royal Society for Asian Affairs, and Fellowship of Catholic Scholars. Author, Modern GATT Law (Sweet & Maxwell 2005), International Trade Law (Lexis, 2nd ed. 2000, 3rd ed. forthcoming 2007–08), and Trade, Development, and Social Justice (Carolina Academic Press 2003). The Author would like to thank his Research Assistant, Mr. Owen Andrew Grieb, University of Kansas J.D. Class of 2007, for his indispensable help on this work. An earlier draft of this Article was presented on 16 February 2007 at Symposium sponsored by the Vanderbilt Journal of Transnational Law entitled: “From Hand to Mouth, Via the Lab and the Legislature: International Regulations to Secure the Food Supply.” The Author is also grateful to Jamie Allyson Lang, Executive Development Editor, Vanderbilt Journal of Transnational Law, for her assistance and support.

950 VANDERBILT JOURNAL OF TRANSNATIONAL LAW [Vol. 40:949
extremists? Conversely, do developing countries appreciate that developed countries may have legitimate concerns about the economic and non-economic functions of their farm sector? Do they appreciate the progress made in reform to this sector? This Article explores these questions in two steps. First, Pakistan and France are case studies of the Group of 20 (G-20) developing countries and the European Union (EU), respectively. The problems faced in each country, in respect of agriculture, are presented. For Pakistan, special attention is paid to rural poverty in the context of overall economic reform pushed forth by President Pervez Musharraf. For France, emphasis is placed on how the EU Common Agricultural Policy (CAP) works and has been altered since the 1992 MacSharry Reform. Second, the G-20 and EU negotiating positions in the Doha Round on agricultural subsidies are explained and analyzed. These positions relate directly to the difficulties faced by the likes of Pakistan and France in their agricultural sectors. Empathy is the theme underlying this Article. Neither side should demonize or be demonized by the other. Both sides have legitimate concerns, not the least of which is food security, a constant worry in front-line states on the “War on Terror,” and a founding principle of the CAP.
TABLE OF CONTENTS I. FROM THE FARM TO THE NEGOTIATING TABLE ............. 951 II. ECONOMIC REFORM AND PAKISTANI FARMING ............. 954
A. Diagnosis of Major Economic Problems ............ 954 B. Initial Treatments ............................................... 957 C. Trade and Agriculture ........................................ 960
III. FRENCH FARMING AND THE CAP .................................. 964 A. Multi-Functionality ............................................ 964 B. Social Justice ...................................................... 967 C. Operation of the CAP .......................................... 970 D. The 1992 MacSharry Reform, Agenda 2000, and the 2003 De-Coupling .................................. 977
IV. PROPOSALS ON AGRICULTURAL SUBSIDIES ................... 981 A. From the G-20 ..................................................... 981 B. From the EU........................................................ 984
V. EMPATHY ....................................................................... 985
2007] EMPATHIZING ON AGRICULTURAL SUBSIDY ISSUES 951
We recall the long-term objective referred to in the Agreement [on Agriculture] to establish a fair and market-oriented trading system through a program of fundamental reform encompassing strengthened rules and specific commitments on support and protection in order to correct and prevent restrictions and distortions in world agricultural markets. We reconfirm our commitment to this program. Building on the work carried out to date and without prejudging the outcome of the negotiations we commit ourselves to comprehensive negotiations aimed at: substantial improvements in market access; reductions of, with a view to phasing out, all forms of export subsidies; and substantial reductions in trade-distorting domestic support. We agree that special and differential treatment for developing countries shall be an integral part of all elements of the negotiations and shall be embodied in the Schedules of concessions and commitments and as appropriate in the rules and disciplines to be negotiated, so as to be operationally effective and to enable developing countries to effectively [sic] take account of their development needs, including food security and rural development. We take note of the non-trade concerns reflected in the negotiating proposals submitted by Members and confirm that non-trade concerns will be taken into account in the negotiations as provided for in the Agreement on Agriculture.
WORLD TRADE ORGANIZATION, DOHA DECLARATIONS, Ministerial Declaration ¶ 13 at 6 (adopted 14 November 2001) (emphasis added).
I. FROM THE FARM TO THE NEGOTIATING TABLE
The economic position of farmers in a country—coupled with attitudes in the country about the social role agriculture should play—shape, and even determine, proposals put forth by negotiators from that country in world trade talks. That is the simple proposition that this Article explores, with particular reference to agricultural subsidies and the Doha Development Agenda (DDA, or Doha Round). There ought not to be anything controversial about this proposition. Countries negotiate out of perceived (or misperceived) self-interest on agricultural trade, just as they do on matters of war and peace. Surely, if trade officials are tabling offers on cutting “Amber Box” subsidies, restricting overall outlays, or re-defining the “Blue Box,” the details of those offers should be consistent with their national agricultural interests.1 What if, however, countries do not really seem to understand the aspirations and fears of other countries? If the economic position of farmers and attitudes about the social role of farming are so important, then why is the Doha Round foundering over agricultural
1. Familiarity with the WTO Agreement on Agriculture is assumed. For a review of the key concepts, see RAJ BHALA, INTERNATIONAL TRADE LAW: INTERDISCIPLINARY THEORY AND LEGAL PRACTICE chs. 45–46 (3d ed. forthcoming 2007–08) (manuscript on file with author); Raj Bhala, World Agricultural Trade in Purgatory: The Uruguay Round Agricultural Agreement and its Implications for the Doha Round, 79 N.D. L. REV. 691, 691–830 (2003).

952 VANDERBILT JOURNAL OF TRANSNATIONAL LAW [Vol. 40:949
subsidy (as well as market access) issues? After all, the positions and attitudes of the principal cohorts (developing countries, coalesced by the September 2003 Cancún Ministerial Conference into the Group of 20 (G-20);2 the European Union (EU); and the United States) are readily observable, widely reported, and endlessly studied.3 There should be no surprises as to what impels bargaining positions on farm subsidies; certainly, negotiators can expect what is coming to the table and map out points at which proposals might intersect. Manifestly, that has not been the case, nor has it been the case ever since the DDA was launched in November 2001.4 Indeed, contrary to what might be the conventional wisdom, it is questionable whether the principal cohorts empathize with each other's economic positions and social attitudes. That is not to suggest that representatives of WTO Members are dullards; quite the opposite. Regardless, exceptional intelligence does not always translate into empathy, which, in turn, can lead to compromise. It is worth inquiring whether economic positions of farmers, social attitudes toward farming, and the linkages to negotiating proposals might be better understood. That is also true for food security and multi-functionality, which are important concepts animating these positions, attitudes, and proposals.5 More specifically, Parts II-IV below discuss the G-20 developing countries, the EU, and agricultural subsidy controversies in the Doha Round. The point for debate is whether the offers are grounded in
2. The G-20, an outgrowth from the September 2003 Cancún Ministerial Conference, includes Argentina, Bolivia, Brazil, Chile, China, Cuba, Egypt, Guatemala, India, Indonesia, Mexico, Nigeria, Pakistan, Paraguay, Philippines, South Africa, Tanzania, Thailand, Uruguay, Venezuela, and Zimbabwe. Kevin C. Kennedy, The Incoherence of Agricultural, Trade, and Development Policy for Sub-Saharan Africa: Sowing the Seeds of False Hope for Sub-Saharan Africa’s Cotton Farmers?, 14 KAN. J.L. & PUB. POL’Y 307, 367 n.115 (2005). 3. See, e.g., Kevin C. Kennedy, International Trade in Agriculture: Where We’ve Been, Where We Are, And Where We’re Headed, 10 MICH. ST. J. INT’L L. 1 (2001); Sungjoon Cho, Doha’s Development, 25 BERKELEY J. INT’L L. 165 (2007). 4. See generally Cho, supra note 3, at 170 (discussing dead-locked negotiations in the Doha Round). 5. Food security, of course, is a concept dependent in part on the country in question. Often, it is thought of in terms of self-sufficiency, as in China, India, and Pakistan. Arguably, the EU approach under the CAP is adequacy of essential food supplies—but not complete independence from all foreign sources. For least -developed countries, and net food-importing countries, food security is provided (if at all) by a combination of aid and adequate supplies of basic food stuffs from external sources on reasonable terms. Subsidized food (e.g., through export credits) actually is important to such countries, and subsidy cuts by the likes of the EU can have adverse consequences (reduced supplies at higher prices), as the WTO essentially recognizes in its discussions of agricultural trade liberalization. See World Trade Organization, Ministerial Decision on Measures Concerning the Possible Negative Effects of the Reform Program on Least-Developed and Net Food-Importing Developing Countries (adopted Dec. 15, 1993 and Apr. 14, 1994), available at http://www.wto.org/english/docs_e/legal_e/35-dag_e.htm.

2007] EMPATHIZING ON AGRICULTURAL SUBSIDY ISSUES 953
different economic status quos in the agricultural sectors of developing and European countries, as well as contrasting attitudes about the roles of agriculture in a modern society. Particular attention is given to facts about Pakistan as a case study for the G-20 and data about France as a predicate for the Common Agricultural Policy (CAP). In keeping with the opening proposition, it is suggested that links between economic positions and social attitudes, on the one hand, and subsidy proposals, on the other hand, do, indeed, exist.6 Put simply, as Part II explains, Pakistani farmers cannot compete in the long run with the European (or for that matter, U.S.) treasury. Pakistan remains highly dependent on its agricultural sector.7 Food security matters to this front-line state in the War on Terror.8 Pakistani society is largely agrarian, and rife with divisions.9 However, Pakistan aspires to be the first modern Islamic industrialized country, and not to be outdone by its arch-rival, secular India.10 Pakistan has had this aim ever since it was led to independence from British colonial rule by the Quaid-I-Azam (great leader), Mohammad Ali Jinnah, while Mahatma Gandhi and Jawaharlal Nehru brought India through the turmoil of the Partition of 15 August 1947.11
As Part III discusses, French—yes, French—farmers are increasingly worse off, at a time when the European public demands that agriculture play a multi-functional role in European society. The demands of the public, coupled with the difficulties French farmers face, are the latest chapter in the history of the CAP, which was founded centrally on food security.12 Much scorn has been heaped on the CAP by developing and least-developed countries, as well as by the United States. Yet, the founding purposes and actual operation—as distinct from deleterious effects—of the CAP are not well understood. Accordingly, Part III also offers an economic discussion of the workings of the CAP.
6. The Author is not arguing these links are exclusive. As the Doha Round negotiating record indicates, and as the United States position embodies, agricultural subsidies and market access are part of a broader balance of concessions that involve non-agricultural market access (NAMA). See BHALA, supra note 1, chs. 3–4. 7. PERVEZ MUSHARRAF, IN THE LINE OF FIRE 194 (2006). 8. See id. (discussing Pakistan’s efforts to increase the productivity of its agriculture sector). 9. Id. 10. See id. at 181–96 (discussing Pakistan’s efforts to revive its economy). 11. There are many excellent treatments of this history, including LARRY COLLINS & DOMINIQUE LAPIERRE, FREEDOM AT MIDNIGHT (1st ed. 1975); see also AKBAR S. AHMED, JINNAH, PAKISTAN, AND ISLAMIC IDENTITY (1997) (discussing, inter alia, the vision for Pakistan of its founder). On GATT, Pakistan, and India, see Raj Bhala, The Forgotten Mercy: GATT Article XXIV:11 and Trade on the Subcontinent, 2002 N.Z. L. REV. 301, 301–37 (2002). 12. See infra Part III.

954 VANDERBILT JOURNAL OF TRANSNATIONAL LAW [Vol. 40:949
The two sides—Pakistan and France, or more generally, the G-20 and EU—have been talking past one another in the Doha Round.13 That is clear from the huge demands placed on the EU by the G-20 proposal for subsidy cuts and the comparably modest reductions offered hesitatingly in the October 2005 EU Proposal. Special attention in Part III is given to how the CAP operates. Part IV turns to an analysis of the G-20 and EU proposals.14 An explanation of the proposals highlights the realities of farming in countries like Pakistan and France. Finally, Part V provides concluding observations.
II. ECONOMIC REFORM AND PAKISTANI FARMING
A. Diagnosis of Major Economic Problems
Perhaps no country has been at the front line of the War on Terror, for a longer period of time and at greater cost, than Pakistan. Perhaps no leader has led his country in this war at greater personal physical risk than President Pervez Musharraf (he has survived no fewer than nine assassination attempts).15 If there is a link between income poverty specifically, or a sense of oppression generally, on the one hand, and the conditions fertile for terrorism, on the other hand, then President Musharraf—a General and Army Chief—undoubtedly is aware of that link.16 Indeed, he writes about it in his important autobiography, In the Line of Fire (2006).17 In Chapter 19 of his autobiography, “Kick-Starting the Economy,” President Musharraf identifies the major economic problems faced by Pakistan.18 To be sure, parts of his book are excessively self-flattering. A reader might be temped to look at the litany of Pakistan’s woes and infer that the President dates them from October 1999, when he took power in a military coup d’etat. One might even conclude that the President exacerbates those woes
13. See supra note 2. See generally BHALA, supra note 1. Pakistan is a member of the G-20 negotiating block of developing countries in the Round. France is, of course, a founding member of the EU. 14. Space does not permit a full analysis of the October 2005 Portman Proposal from the United States. This Proposal is analyzed in BHALA, supra note 1. 15. See MUSHARRAF, supra note 7, 1–7. 16. See generally Quentin Peel, Malaysian PM urges battle against “roots of terror,” not symptoms, FIN. TIMES, Jan. 29, 2007, at 7 (interview with Malaysian Prime Minister Abdullah Badawi, who notes (inter alia): “People want their children to be employed. People want schools. People want economic programmes to enable them to get employment and earn some money. That is what they have in common.”) The term “income poverty” is distinguished from other forms and measures of poverty, as Nobel Prize winning economist Amartya Sen explains in DEVELOPMENT AS FREEDOM 87–92 (1999). The various concepts and measures are defined in RAJ BHALA, DICTIONARY OF INTERNATIONAL TRADE (1st ed. forthcoming 2008) (manuscript on file with author). 17. See MUSHARRAF, supra note 7, at 1–7. 18. Id. at 181–96.

2007] EMPATHIZING ON AGRICULTURAL SUBSIDY ISSUES 955
so as to (1) justify his takeover and (2) show improvements under his rule. That temptation should be resisted as Pakistan's problems are objectively serious. Those problems include: ● Corruption
Rampant corruption and cronyism in public and private enterprises, including commercial banks and other financial institutions, has traditionally been a fact of everyday Pakistani life.19
● Mismanagement Public-sector enterprises have been grossly mismanaged. Examples of mismanaged public sector enterprises include: Cotton Export Corporation, Karachi Electric Supply Corporation, Pakistan International Airlines, Pakistan National Shipping Corporation, Pakistan Railway, Pakistan Steel Mills, Rice Export Corporation of Pakistan, and Water and Power Development Authority.20 These entities play a prominent role in the economy, yet despite subsidies, have lost (as of 1999) about U.S. $2 billion annually.21
● Physical Infrastructure The physical infrastructure on which agricultural, industrial, and service-sector development is based is decrepit. For much of the 1980s and 1990s, there was hardly any increase in Public Sector Development Program (PSDP) funding (e.g., whereas funding was 90 billion Pakistani rupees in 1988, it was just 110 billion rupees eleven years later in 1999).22
● Public Finance Official coffers have long suffered from nearly stagnant tax revenues. For example, there was an increase of just 50% across the eleven year period 1988-1999, from 200 to 302 billion Pakistani rupees.23 This problem stems partly from an inchoate, corrupt income tax collection system, partly from high tax rates, and partly from a proliferation of taxes, the last two of which encourage tax evasion.24 The result has been large and persistent fiscal deficits and growing public debt.25
● Investment Decelerating investment rates and pathetically low levels of foreign direct investment (FDI) have characterized Pakistan’s
19. Id. at 181. 20. Id. 21. Id. at 186. 22. Id. at 187. 23. Id. 24. Id. at 186–87. 25. Id.

956 VANDERBILT JOURNAL OF TRANSNATIONAL LAW [Vol. 40:949
economy.26 For example, the level in 1999 was $300 million; while it was up 500% by 2005, the absolute amount that year was still just $1.5 billion.27
● Human Capital The level of human capital—a key source of economic growth—is low28 as measured by almost any benchmark, including educational enrollment and attainment (with notable male-female gaps), and health care quality and delivery.29
● Foreign Exchange Rate For most of its history, Pakistan’s foreign exchange rates have been administratively determined.30 To cope with poor balance-of-payments performances, the government has nearly continuously devalued the Pakistani rupee, resulting in instability and uncertainty for exporters, importers, and foreign direct investors.31
● Foreign Exchange Earnings Stagnant exports and declining foreign exchange earnings for many sustained periods have led to large and persistent current account deficits in Pakistan (e.g., $5 billion in 1999).32 They also have been associated with growing external debt (e.g., from $20 billion in 1988 to $39 billion in 1999).33 Pakistan has had to spend 66% of its export revenues on debt servicing.34
● Industrial Capacity and Tariffs Idle capacity has plagued almost all of Pakistan’s industrial sectors.35 In part, high tariffs on raw materials and industrial machinery have caused this problem.36 High tariffs raise the costs of manufacturing and make Pakistani products uncompetitive internationally, which in turn exacerbate problems with foreign exchange rate and earnings.
● Energy Dependence Heavy reliance on imports for petroleum and petroleum-related goods, as well as edible oils and tea (the latter two of which are staples for poor Pakistanis), creates two kinds of vulnerabilities.37 First, these items are price inelastic, so the
26. Id. at 189. 27. Id. 28. Id. at 193. 29. Id. 30. Id. at 183. 31. Id. 32. Id. at 187. 33. Id. at 181, 187–88, 191. 34. Id. 35. Id. at 183. 36. Id. 37. Id. at 188.

2007] EMPATHIZING ON AGRICULTURAL SUBSIDY ISSUES 957
country is susceptible to price shocks and related effects when prices rise.38 Second, the country is susceptible to supply disruptions, insofar as political or war risks become manifest and adversely affect shipment from a supplying country.39
The very diagnosis of Pakistan’s economic blight is scary. Unfortunately, as anyone familiar with the country knows, it is spot on.40 Given this diagnosis, President Musharraf dubs Pakistan—at least as it stood when he took over in a military coup d’etat in October 1999—as a “one-tranche country.”41 After the President’s coup, the country would draw down on the first tranche of a loan from the International Monetary Fund (IMF), but would abandon its economic restructuring program, on which subsequent tranches were conditioned, simply to avoid politically unpopular decisions and appease preferred interest groups.42 Indeed, the President readily admits that Pakistan nearly a “failed state,” a “defaulted state,” and even a “terrorist state.”43
B. Initial Treatments
How has Pakistan, at least under President Musharraf, responded to the diagnosis? In brief, since 1999 the government has taken a number of difficult measures designed to treat the problems.44 They include: ● Accountability
The government strengthened mechanisms for accountability by more rigorously prosecuting corruption cases (especially of high level officials) and enforcing corruption laws, and through more transparent, uniform procedures for drafting and implementing regulations.45
38. Id. 39. Id. 40. The Author had the privilege of visiting Pakistan in March 2001 and remains grateful for the many insights gained from that trip and subsequent contacts and research, particularly to Mr. Muhammad Ali Nawazish Pirzada, Esq., a practicing attorney and law school professor in Lahore. 41. MUSHARRAF, supra note 7, at 184. See generally id. at 120–34 (detailing General Musharraf’s takeover in what he calls a “countercoup”). 42. See, e.g., JOHN HEAD, THE FUTURE OF THE GLOBAL ECONOMIC ORGANIZATIONS 25 (2005) (on the subject of IMF conditionality). 43. MUSHARRAF, supra note 7, at 139, 191. 44. See id. at 181–96. 45. Id. at 185.

958 VANDERBILT JOURNAL OF TRANSNATIONAL LAW [Vol. 40:949
● De-regulation The government fully or partially liberalized or privatized many state-owned enterprises (SOEs).46
● Physical Infrastructure Pakistan embarked on a physical infrastructure development program, funded by a 300% increase in the PSDP allocation (from 110 billion Pakistani rupees in 1999 to 300 billion rupees in 2006), which addresses the needs to (1) boost water reservoir capacity; (2) line water courses (at a cost of $1 billion) to stop leaking and spilling; (3) encourage water conservation; (4) laser-level all agricultural land (i.e., calibrate precisely the level of farm land) to avoid wasteful water runoff; (5) provide safe drinking water; (6) enhance irrigation and drainage systems; (7) improve road and highway networks and upgrade port and terminal facilities; and (8) provide reliable electricity and gas energy.47
● Technology The government increased the number of Pakistani cities connected to the Internet (from 39 cities in 1999 to 2,000 cities in 2006), addressing the technology gap within the country and between Pakistan and other countries.48
● Communication By increasing tele-density (the number of phones as a percentage of a population) from 2.9% in 2003 to 16% in 2006, increasing the number of cell phones in the same period from 600,000 to over 30 million, and constructing a wireless local loop for rural areas, the government enhanced communications services within the country.49
● Government Expenditures The President froze the defense budget (despite continued tension with India over Kashmir, as well as dangerous security issues in Balochistan, Northwest Frontier Province, and Waziristan) in order to reduce public sector deficits and debt. This move led to a cut in the deficit from double digits in the mid-1990s to under 4% by 2005. The government also enacted a fiscal responsibility law, making it illegal for the public sector debt of the central government to exceed 60% of gross domestic product (GDP).50
46. Id. at 189. 47. Id. at 184, 187, 192, 194–95. 48. Id. at 195. 49. Id. 50. Id. at 187, 191.

2007] EMPATHIZING ON AGRICULTURAL SUBSIDY ISSUES 959
● Taxation Pakistan cut its tax rates, as well as the number of taxes, and rationalized the tax regime to increase fiscal revenues (essentially, though not explicitly, based on a supply-side macroeconomic model). This resulted in a 130% increase in revenues from U.S. $5.1 billion in 1999 to $11.7 billion in 2005, and more than doubled revenue from 302 billion Pakistani rupees in 2000 to 700 billion rupees in 2006.51
● Human Capital The government sought to enhance human capital creation by building more and better quality schools, increasing enrollment rates (especially of girls at primary, secondary, and tertiary levels), and upgrading health care facilities.52
● Foreign Exchange By freeing the Pakistani rupee to float on world markets and thereby avoiding the instability and uncertainty surrounding administratively determined devaluations, the government stabilized the currency at about 60 rupees per U.S. dollar during 2002-2005.53
● Foreign Debt Pakistan renegotiated the entire stock of its bilateral external debt through the Paris Club consortium. This renegotiation secured favorable terms for the loans, such as: a repayment period of thirty-eight years with a fifteen year grace period; paying off the most expensive loan and foreign currency deposits owed to foreign banks; obtaining both debt relief and new loans, thereby reducing the debt stock by no less than 30%, reducing the overall foreign debt from $39 billion to $36 billion, and reducing the annual debt servicing liability from $5 billion to $2 billion. (Given the contemporaneous decline in overall foreign debt and the rise in GDP, Pakistan’s debt-to-GDP ratio has fallen from 101% in 1999 to 60% in 2005. However, this ratio is still uncomfortably high.)54
● International Financing The government raised capital directly on international financial markets by issuing Islamic bonds (sukuk) in the Gulf States and incurring dollar-denominated debt of ten- to thirty-year maturity at interest rates as low as 2% above U.S. Treasury rates.55
51. Id. at 187, 192. 52. Id. at 193, 310–13. 53. Id. 183, 192. 54. Id. at 187–88, 191. 55. Id. at 193.

960 VANDERBILT JOURNAL OF TRANSNATIONAL LAW [Vol. 40:949
● Financial Institutions Pakistan improved the efficiency of its financial institutions, especially of key commercial banking transactions like money transmission.56
● Tariff Reductions The government slashed tariffs on raw materials and industrial machinery, with a view to encouraging the use of idle production capacity and stimulating indigenous industrial enterprises.57
● Energy Resources The government developed the country’s energy sources by increased prospecting for oil and natural gas; constructing five large dams for hydro-electricity generation; converting power plants that burned imported furnace oil to ones that operate on indigenous natural gas; and planning for transit fee revenues and export possibilities in the event that oil and gas pipelines are built in Pakistan to connect China (and possibly India) with sources in Iran, Qatar, or Turkmenistan.58
While widespread, these initial treatments are not entirely comprehensive. They do not, for instance, directly address the problem of corruption at low and middle levels of administration. Nor do they address long-term concerns about a return to democratically elected civilian leadership in Pakistan. Accordingly, the above measures are not final treatments; they will undoubtedly need future adjustment and refinement.
C. Trade and Agriculture
What problems does Pakistan face with respect to international trade, and specifically in relation to its agricultural sector?59 Simply put: ● Poverty
“Poverty” is perhaps the one word answer to the question. By any measure of income poverty, Pakistan remains a poor country.60 In 2005, GDP equaled $125 billion, up from $65 billion in 1999.61 While GDP growth rates have picked up, from 3.1% in 1999 to 8.4% in 2005, such growth rates are necessary to keep up with Pakistan’s growing population.62 GDP per capita
56. Id. at 183, 190. 57. Id. at 183, 188–90. 58. Id. at 192. 59. See id. at 194–95 (discussing problems with Pakistan’s agriculture sector and efforts to rectify them). 60. See id. at 193–96 (discussing efforts to reduce this poverty). 61. Id. at 191. 62. Id.

2007] EMPATHIZING ON AGRICULTURAL SUBSIDY ISSUES 961
increased from $460 to $800 during this period, but that is still only a bit more than double the absolute poverty line of $1 per day – and tens of millions of Pakistanis live below that line. The poverty rate also doubled from 18% in 1988 to 34% in 1999.63
● Agrarian Society Closely related to its poverty is Pakistan’s population distribution. Pakistan remains largely an agrarian society.64 Over 65% of Pakistanis live in rural areas.65 They eke out a low level of sustenance through basic agricultural activities and animal husbandry.66 Moreover, their loyalties remain bound by tribe and clan, and divisions among Sunni and Shi’ite sects run deep.67
● Low Value-Added Agricultural Exports Pakistan adds little value to what it makes and ships abroad. For instance, Pakistan is the fifth largest producer of milk in the world, but it makes almost no other dairy goods.68 Pakistan also has fruits and vegetables of exquisite quality, but with little in the way of food processing, the country adds minimal value to them upon exportation.69 The results of an agro-based industry initiative have yet to be realized (including a white revolution to establish special milk-collection and chiller-storage systems, which will enable the production of butter, cheese, yogurt, and milk powder).
● Diversity of Exports Despite recent signs of industrial growth (e.g., 18.2% in 2004 and 14.6% in 2005), Pakistani exports are not diverse.70 Overwhelmingly, they consist of agricultural commodities, plus textile and apparel.71 Pakistan cannot hope to stake its entire economic future on adding value in the agricultural, textile, and apparel sectors.72 Agricultural, textile, and apparel commodities account for small percentages of the value of total world trade.
63. Id.; see also Asna Afzal, Pakistan, The WTO, and Labor Reform, 29 B.C. INT’L & COMP. L. REV. 107 (2006) (discussing growing poverty levels in Pakistan). India, a fellow member of the G-20, faces a similar problem as Pakistan in respect of mass rural poverty. The scale in India, of course, is vastly larger. There are 650 million rural poor in India. See Daniel Pruzin, EU, U.S. Eye Possible Market Access Deal On Key Farm Products to Revive Doha Talks, 24 INT’L TRADE REP. 119, 120 (2007). 64. MUSHARRAF, supra note 7, at 194. 65. Id. 66. Id. 67. See id. at 275–83 (discussing the rise of religious extremism and terrorism). 68. Id. at 195. 69. Id. 70. Id. at 188–89. 71. Id. 72. See id. at 188 (stating that agriculture and textiles only account for 6–8% of total world trade).

962 VANDERBILT JOURNAL OF TRANSNATIONAL LAW [Vol. 40:949
In contrast, 61% of total world trade is in engineering, heavy industry, and high technology products.73 Thus, Pakistan has small slices of modest markets in global trade.
● Foreign Exchange Position With gains in exports (from $7.8 billion in 1999 to $17 billion in 2006), Pakistan’s foreign-exchange reserve position has improved from the dangerous $300 million in 1999, which is two weeks’ worth of imports (well below economists’ recommendations of keeping at least three months on hand), to $12.5 billion in 2005, equal to 10 months worth of imports.74 However, Pakistan’s import bill has grown remarkably, and outstripped its rise in export earnings.75 The higher import bill results not only from imports of necessary capital goods (e.g., machinery used to build new industrial facilities and equipment to modernize infrastructure), but also from increased imports of oil and other energy items that are necessary to fuel Pakistan’s industrial aspirations.76 Accordingly, Pakistan needs to consider balancing its import payment obligations with increased foreign exchange earnings—gain, through higher value-added exports and a greater diversity of exports.
What policy responses are prudent to deal with poverty, particularly in rural areas, and the lack of either high-value-added exports or a diverse export base? In brief, the treatments include: ● Agricultural Infrastructure
Pakistan is in the midst of major agricultural infrastructure improvements, including: (1) boosting water reservoir capacity, (2) lining water courses with bricks (at a cost of $1 billion) to stop leaking and spilling, (3) encouraging water conservation, and (4) laser-leveling all agricultural land (i.e., calibrating precisely the level of farm land) to avoid wasteful water runoff.77 These improvements, if completed successfully, could expand arable land in the country by 2.88 million acres.78
● Agricultural Productivity Pakistan is attempting yield-intensification schemes designed to increase the output per acre of arable land, thereby increasing the income of farmers. It is also working to ease credit access and credit terms for farmers (e.g., increasing the pool of loanable
73. Id. 74. To be precise, foreign exchange reserves in the State Bank of Pakistan, at one point in October 1999, stood at ten days worth of imports. See id. at 139, 191. 75. Id. at 191–92. 76. Id. 77. Id. at 194–95. 78. Id.

2007] EMPATHIZING ON AGRICULTURAL SUBSIDY ISSUES 963
funds, and creating a three year revolving credit system for farmers that eliminates the middlemen to whom farmers must sell crops in order to repay loans).79
● Industrial-Led Growth Pakistani exports grew roughly 125% between 2002 and 2006, yet the country has not built an export-led industrial sector (in obvious contrast to Hong Kong, Korea, Singapore, and Taiwan, the “East Asian Tigers” in the post-World War II era).80 In order to do so, Pakistan must not only continue with tariff and non-tariff barrier reforms, and encourage foreign direct investment (FDI), but it must also aggressively market its products around the world, in part though the Export Promotion Bureau (EPB).
● Debt Servicing Pakistan’s ratio of debt-to-foreign-exchange earnings has improved considerably since the late nineties. In 1999, its ratio of 347% compared unfavorably even against highly indebted poor countries (HIPCs), which have a 250% or greater debt-to-foreign exchange earnings ratio.81 Nonetheless, Pakistan’s debt-to-foreign-exchange earnings ratio remains unacceptably high, at 137% in 2005.82 The country still needs to devote lower levels of earnings to debt service.
Are the “dreaded words ‘failed state’” a “distant memory,” as President Musharraf claims?83 Reasonable minds might beg to differ. What ought to be clear is that it is not in the interest of the world trading system, nor the global economic order generally, for Pakistan to become a failed state. No failed state contributes to stability, prosperity, or growth. Certainly, whether Pakistan emerges as a significant part of the world trading system, or slides back toward the hell of failed statehood, does not depend entirely on the outcome of agricultural subsidy negotiations. Other trade issues—including the extent to which Pakistan must provide non-agricultural market access (NAMA) to industrial products from other countries, and the reciprocal concessions it gains on NAMA for its products—will affect its future economic performance. And, of course, the outcome of the War on Terror, in which Pakistan is inextricably engaged, will affect this performance. Nevertheless, how Pakistan is treated by developed countries on farm subsidies is one piece, small but important, in the overall puzzle of its future. Not surprisingly, then, Pakistan—
79. Id. 80. Id. at 189–90. 81. Id. at 192. 82. Id. 83. Id. at 191.

964 VANDERBILT JOURNAL OF TRANSNATIONAL LAW [Vol. 40:949
together with its G-20 partners—has urged the likes of the EU, Japan, and the United States to cut their agricultural subsidies and thereby give its farmers a chance to compete on a somewhat more level playing field than the gradient currently perceived to exist.84
III. FRENCH FARMING AND THE CAP
A. Multi-Functionality
Thousands of miles away from Pakistan, a different battle is being fought over how international trade, agriculture, security, and poverty interact. The battle is within the EU, and—in the Doha Round—between the EU and developing countries. The specific issue of contention is how the EU’s CAP operates, and how (even whether) it should be changed. It is easy to lambaste the CAP. Has it not protected inefficient European farmers for decades from long-needed reforms that could be brought about by free trade?85 Has it not driven farmers in developing and least-developed countries further into poverty, and jeopardized farmers in other developed countries by causing overproduction in certain products—mountains of butter and maize, lakes of wine—and thus caused price suppression or depression? Are not French farmers, in particular, infamous for being pampered and obstructionist? Study after study, especially by NGOs, testifies to the greed underlying the CAP. After reading the studies, one might conclude that it is better to be a cow in the EU than a denizen in a least-developed country, since the cow gets a subsidy larger than the per-capita income of the sorry chap in the least-developed nation.86
84. See infra Part IV, § A. 85. The first common market organization (CMO) under the CAP was established in 1962 for cereals and related goods. In 1964, CMOs for milk and other dairy products were set up. The last CMO, for sugar, was set up in 1968. That year is significant because continental European leaders, led by France’s President, General Charles de Gaulle, sought to have the CAP in place before the United Kingdom joined the European Community (EC) in 1973. Then, and to the present, the United Kingdom inclines toward a more liberalized view of agricultural trade than many continental states, preferring to keep food prices low and thereby bolster the competitiveness of the industrial sector through low labor costs. See Gerrit Meester, European Union, Common Agricultural Policy, and World Trade, 14 KAN. J.L. & PUB. POL’Y 389, 390–91 (2005). 86. See, e.g., OXFAM UNITED KINGDOM, RIGGED RULES AND DOUBLE STANDARDS 111–19 (2003) (discussing protectionist measures, especially subsidies in the agricultural sector, by developed countries that hurt developing nations and which are contrary to the free-market rhetoric of these developed countries); see also Org. for Econ. Co-operation & Dev., Agriculture Policies in OECD Countries: A Positive Reform Agenda, Nov. 6, 2002, COM/AGR/TD/WP(2002)19/FINAL, available at http://www.olis.oecd.org/olis/2002doc.nsf/ 43bb6130e5e86e5fc12569fa005d004c/7d605f12fed04929c1256c5d00368d88/$FILE/JT00134699.PDF (outlining an agenda for agricultural reform in OECD countries).

2007] EMPATHIZING ON AGRICULTURAL SUBSIDY ISSUES 965
Politician after politician, in the U.S. and other agriculture-exporting countries, demands an end to the CAP. Still, for over half a century, the CAP has stood. What’s more, it has been an organizing principle of the European project. Why? The key to the answer is to consider the role—or roles—of agriculture in a modern society. To what social model of agriculture are EU citizens profoundly and legitimately attached? Agriculture is more than just growing food in an efficient manner, with production allocated according to the Ricardian paradigm of comparative advantage.87 It is also food security for a country—indeed, it is about national security. It is about environmental stewardship for children and grandchildren. It is about culture and identity. “Multifunctionality” is the word that characterizes the social model of agriculture accepted in the EU, and increasingly even among non-EU, free-trade oriented countries.88 Thus, conventional economic attacks on the CAP miss the mark. They do not acknowledge the multiple purposes the CAP serves. Indeed, food security was and remains a founding purpose of the European Economic Community (EEC) formed by the 1957 Treaty of Rome, and of the CAP. Specifically, Article 39 of the EEC Treaty, now Article 33 of the Treaty of the European Union, articulates five specific objectives for the CAP, two of which are clearly about food security:
● To increase agricultural productivity by promoting technical progress and by ensuring the rational development of agricultural production and the optimum utilization of the factors of production, in particular, labor; ● Thus, to ensure a fair standard of living for the agricultural community, in particular by increasing the individual earnings of persons engaged in agriculture; ● To stabilize markets; ● To assure the availability of supplies; ● To ensure that supplies reach consumers at reasonable prices. . . .89
The first goal is about efficiency. The second goal is about fairness, and more broadly, the rural way of life. The third goal is about certainty, and is indirectly related to food security. The fourth and fifth goals are self-evidently about food security.
87. See generally Daniel J. Gifford, The Robert E. Hudec Article on Global Trade: Trade and Tensions, 15 MINN. J. INT’L L. 297, 300 (2006) (discussing the Ricardian paradigm). 88. See generally William J. Even, Green Payments: The Next Generation of U.S. Farm Programs?, 10 DRAKE J. AGRIC. L. 173, 190 (2005) (discussing the concept of “multifunctionality” as a social model of agriculture). 89. Meester, supra note 86, 390 (emphasis added).

966 VANDERBILT JOURNAL OF TRANSNATIONAL LAW [Vol. 40:949
As time passes, and the number of World War II survivors diminishes, it becomes easier to ignore one—if not the primary—central intent behind the CAP: avoid the food deprivations many Europeans faced during the 1939-45 conflagration and its aftermath.90 Even today, who recalls that the EU was a net importer of some food items (e.g., beef and cereals) in the mid-1950s through the mid-1970s?91 Accordingly, the CAP did not begin as an export subsidy program.92 Rather, it was designed to guarantee high prices to farmers.93 The mechanism to effect the guarantee, in essence, was government purchasing. The EEC—now EU—agreed to purchase a farm product whenever the price of that product fell below a specific support level.94 For any particular commodity, if the support level exceeded its world market price, then the possibility existed that consumers might undermine the CAP by importing a like commodity.95 Thus, the purchasing scheme had to be accompanied by, and is still accompanied by, at least one significant tariff barrier: initially, a variable import levy that would offset any difference between prices in the European and world markets.96 In other words, a restrictive tariff policy was necessary to avoid substitution or arbitrage. Yet, during the 1970s and since, support prices set by the EU have been far in excess of world prices.97 Responding not to free trade prices, but instead to CAP price signals, EU farmers have over-produced.98 In other words, they have supplied the European public with far more food than it can possibly consume.99 The EU has dealt with the surfeits in two basic ways: ● Intervention Buying: Buying food at a support or intervention
price, which is above world market prices, and storing the so-called “intervention stocks”; or
● Export Subsidies: Providing subsidies to farmers through a refund scheme to cover the difference between the internal EU market price and lower world market prices in order to export food.100
90. Id. at 389. 91. Id. at 394–95. 92. Id. at 390. 93. Id. 94. Id. at 392. 95. Id. at 391. 96. Id. 97. Id. at 392. 98. Id. 99. Id. 100. Id. at 392–93.

2007] EMPATHIZING ON AGRICULTURAL SUBSIDY ISSUES 967
As to the first response, in 1985, for example, the EU had to buy 780,000 tons of beef, 1.2 million tons of butter, and 12 million tons of wheat.101 The second response is supposed to avoid endless increases in food stockpiles.102 The choice, which the EU makes, between the purchase and warehouse on the one hand, and the export refund options on the other, depends on international political and economic factors. The choice amounts to a balancing act. If export refunds are too high, then world market prices may fall because of the extra EU output on world markets. If support prices are too high, then production surpluses may be too great to stockpile. In trying to balance the variables and deal with over-production, not infrequently, the EC resorts to two other strategies: dumping food on world markets or donating food to specific countries.103
There is another reason criticism of the CAP often misses the mark: it is insufficiently nuanced. Has the EU applied all three CAP instruments—production subsidies (i.e., price support through intervention buying), variable import levies (i.e., tariff protection), and export subsidies (specifically, refunds)—to all farm products? The answer is “no.”104 Table I below shows the categories of products to which the EU traditionally has applied the various instruments. The obvious inference to draw is that the CAP does not distort all markets in equal amounts at all times.
B. Social Justice
The contemporary concept of multifunctionality, and the historical food security rationale for the CAP, explains why criticisms of the CAP sometimes miss the mark. There is yet another reason: social justice. From a philosophical—indeed, theological—perspective, why are the income and work of a farmer in a poor country more important than the livelihood of a farmer in a rich country? If every farmer, like every human being, is made in the image of a Divine Creator, then each farmer has equal human dignity. There must be some basis on which to prefer the interests of one over the other. One such basis is the doctrine, emanating from Catholic “Social Justice Theory,” of the preferential option for the poor.105 While all persons have human dignity, the poor deserve
101. Id. 102. Id. 103. Id. 104. See infra Table I. 105. See RAJ BHALA, TRADE, DEVELOPMENT, AND SOCIAL JUSTICE 373–450 (2003) (discussing social justice theory as a justification for giving trade preferences to poor countries).

968 VANDERBILT JOURNAL OF TRANSNATIONAL LAW [Vol. 40:949
special attention simply because they are relatively worse off. As Pope John Paul II put it, “Suffering man belongs to us.”106
TABLE I: APPLICATION OF CAP POLICY TOOLS
TO SPECIFIC AGRICULTURAL PRODUCTS
CAP Policy Tool Agricultural Products All 3 Tools Applied: ● Production Subsidies (Price Support/Intervention) ● Import Levy (Tariff Protection) ● Export Subsidies (Refunds)
Beef Cereals Dairy Olive Oil Table Wine Sugar
Only 1 or 2 Tools Applied, and Only in Specific Market Situations: For example, just ● Production Subsidies (Price Support/Intervention) or a combination of ● Import Levy (Tariff Protection) ● Export Subsidies (Refunds)
Eggs Fruit Pork Poultry Vegetables
Coverage Only For Processing (i.e., no support for commodity, but premiums offered to processors)
Oilseeds Protein crops (collectively, along with other products, referred to as “cereals substitutes”)
No CAP Coverage (i.e., no support for commodity or processed product)
Consumption and seed potatoes Flowers Flower Bulbs Ornamental Plants
However, are farmers in poor countries relatively worse off? Of course the broadly applicable answer is “yes.” This response leads to a second question, however: there are poor—or increasingly vulnerable—farmers in rich countries, too. Consider the following facts about French agriculture:107
106. The Suffering Person Belongs to Us All, L’OSSERVATORE ROMANO (The Vatican), Jan. 17, 2007, at 3; The Rule for Charity: “Good Should be Done Well!,” L’OSSERVATORE ROMANO (The Vatican), Jan. 10, 2007, at 5. 107. See Martin Arnold, Poorer French Farmers Buck Income Trend, FIN. TIMES, Jan. 11, 2007, at 3. The conclusions that follow about French agriculture are drawn largely using data from Insee, the official French statistical agency, the French National Institute for Agricultural Research, and Eurostat.

2007] EMPATHIZING ON AGRICULTURAL SUBSIDY ISSUES 969
● Fewer Farms For the fifty year period 1955-2005, France lost 100 farms every day.108 In that half-century, the number of farms shrank from 2.3 million to 545,000.109
● Fewer Farmers In the twenty-five year period 1970-2005, the number of French farmers fell by two-thirds, from 3.3 million to 1.1 million.110 Conversely, in the same quarter century, French farms have grown in average size, from nineteen hectares to fifty hectares.111 Overall, French farms are halfway between the large, industrialized farms of Northern Europe and the small, family farms of Southern and Eastern Europe.112
● Poorer Farmers French farmers are becoming poorer. In 1997, 13% of them earned less than half of the French median income.113 By 2003, the figure was 15.9%.114 To boost their income, more of them—and their spouses—are taking non-farm second jobs.115 In 1997, the share of non-agricultural income in the average French farming household was 19%.116 By 2003, it was 31%.117
● Relative Deprivation in the EU Theoretically, the concept of income poverty is poignant in a relative sense. Thus, relative income deprivation is all the more vexing for French farmers. In recent years across the EU, the average EU farmer has experienced rising farm income.118 Indeed, in Germany, the Netherlands, the United Kingdom, and the ten new member states that joined the EU effective 2005, farmers have benefited from dramatically rising incomes.119 However, during the same period 2000-2006, the incomes of Belgian, Greek, Italian, and French farmers have fallen.120
108. Id. 109. Id. 110. Id. 111. Id. 112. See id. (quoting Arnaud Petit of Copa-cocega, the European farming union). 113. Id. 114. Id. 115. Id. 116. Id. 117. Id. 118. Id. 119. Id. 120. Id.

970 VANDERBILT JOURNAL OF TRANSNATIONAL LAW [Vol. 40:949
● Relative Deprivation within France Within France, between 1997 and 2003, the average household experienced an income rise of 1.8% per annum, while the average farm household income dropped 1.8% per year.121 Even if (or when) the absolute income level of French farm households is equal or slightly above that of non-farm families, the former cohort is worse off.122 Since French farm families tend to be larger than French non-farm families (3.2 members versus 2.4 members), their per capita income is generally lower.123
● Fewer Exports While France is the biggest agricultural producer in the EU in terms of value as of 2004, the annual rate of its exports contracted from a 3.3% increase in 1999 to a 3.4% decrease in 2004.124
These facts are all the more poignant because they relate to the French. Free traders heap blame on French farmers for being among the most recalcitrant constituencies in the world trade community. Did they not nearly scupper the Uruguay Round, forcing a 1992 Blair House Accord and the creation of the “Blue Box” of subsidies for production set-aside payments (and then only after the U.S. had prevailed in the infamous Oilseeds dispute)?125 Did they not persistently and vociferously object to concessions by the EU in the Doha Round on agricultural tariff cuts and trimmings of the sensitive product list?126
C. Operation of the CAP
The core of the problem of over-production has been the level at which the EU sets support prices. This level is above not only the world market price that exists outside the EU and would exist in the EU with free trade and absent a CAP, but also above the price at which domestic EU demand and domestic EU supply would be in equilibrium without any importation of food items.127 In other words, the level at which the EU commits itself to intervene, and thus
121. Id. 122. See id. (citing Insee’s argument that French farmers are worse off than the average household because they have more children). 123. Id. 124. Id. 125. See RAJ BHALA, INTERNATIONAL TRADE LAW: THEORY AND PRACTICE 199–200 (2d ed. 2001) (discussing the weakness of pre-Uruguay Round Dispute Resolution in the context of the Oilseeds case, which took four and a half years to resolve). 126. See Alan Beattie, France Opposes More Farm Cuts, FIN. TIMES, Jan. 12, 2007, at 5 (describing how France said it would not accept deeper cuts in farm import tariffs from that which the European Union had already offered). 127. PAUL R. KRUGMAN & MAURICE OBSTFELD, INTERNATIONAL ECONOMICS: THEORY AND POLICY 198–99 (6th ed. 2003).

2007] EMPATHIZING ON AGRICULTURAL SUBSIDY ISSUES 971
guarantees to farmers, is above the EU market-clearing equilibrium price.128 Consequently, but for the CAP, the EU would be a net importer of food.129 Of course, that is exactly the situation the CAP founders sought to avoid. The graph below shows the operation of the CAP subsidy schemes130 and alternative price scenarios. The internal EU price without the CAP and without the EU importing food is PEU (where “EU” stands for “European Union”). At PEU, domestic supply and demand are in equilibrium. At this price, EU farmers produce QE, and EU families buy QE. The domestic market clears. At PCAP, the EU pays farmers at an above-equilibrium level. Farmers have an incentive to produce QSCAP (standing for “supply under the CAP”). Yet, EU families buy only QDCAP (standing for “demand under the CAP”). The difference between QSCAP and QDCAP is what the EU is obligated to buy and store. To avoid purchasing and warehousing this difference, the EU pays farmers to export this surplus. PWM is the world market price. If this level prevailed in the EU, then the EU would have to import food. That is because EU families would demand QDWM, but EU farmers would produce only QSWM. The difference would come from abroad. In sum, PEU is a market-clearing autarky price, PCAP is an interventionist price that generates an exportable surplus, and PWM is a free-trade price at which foreign nations have a comparative advantage in agriculture. Further, the graph below embodies the two kinds of CAP subsidies EU farmers receive. First, they are guaranteed the support price, PCAP. This support is linked to output—in effect, a production subsidy. Second, they receive the difference between the internal price PEU and world market price PWM for whatever output they ship overseas—in effect, an export subsidy. The EU uses the export subsidy to dispose of the surplus resulting from the production subsidy. Consequently, the graph also shows the cost of subsidization to the EU. That cost is the area ABQSCAPQDCAP. It reflects the quantity exported (QSCAP versus QDCAP) multiplied by the value of the total subsidy (PCAP versus PWM, reflecting the production support, PCAP versus PEU, and export support, PEU versus PWM). Finally, consider effects on Consumer and Producer Surplus of the different price
128. Id. 129. Id. 130. See id. at 198–200 (The Graph is adapted from Professors Krugman and Obstfeld and closely resembles the Neo-Classical economic analysis of a generic export subsidy from the perspective of the subsidizing country. In this Graph, for any particular farm product, the EU pays farmers an export subsidy equal to the difference between the price in the EU and world market price); See Meester, supra note 86, at 389–412 (The Charts are adapted from Professor Meester).

972 VANDERBILT JOURNAL OF TRANSNATIONAL LAW [Vol. 40:949
scenarios. At which price level are EU consumers best off? At which price level are EU farmers best off?
GRAPH: CAP SUBSIDIES, OVER-PRODUCTION. AND EXPORTABLE SURPLUSES
Price EU Supply CAP Support Price EU Price w/out CAP or Imports World Market Price EU Demand 0 QDCAP QSWM QE QDWM QSCAP Quantity As Charts I and II below indicate, the analysis above can be embellished with some important details about the actual operation of the CAP as it developed in the 1960s and as it has been reformed since then. There are actually four key prices: ● World Market Price, PWM—The EU gauges the world market
price based on CIF (cost, insurance, and freight) prices to principal European harbors.131
131. Meester, supra note 85, at 391–92.
A B PCAP
PEU
PWM

2007] EMPATHIZING ON AGRICULTURAL SUBSIDY ISSUES 973
● Target Price, PT—The EU Ministers of Agriculture meet annually to establish a desired internal (i.e., domestic EU) price for agricultural products, namely a Target Price.132 From the Target Price, PT, with respect to imports into the most significant EU ports (e.g., cereals shipped to Rotterdam), the EU Agriculture Ministers derive a minimum import price, also known as a threshold price.133
● Internal Market Price, PEU—In fact, the price in the EU for a particular agricultural product might not exactly equal the desired target, PT.134 Rather, depending on market conditions, the actual price PEU may vary between PT and the Intervention Price (discussed below).135 For example, if the EU experiences a deficit in the product in question, then the internal market price equals or exceeds PT.136 If there is an internal surplus, then the internal market price could be at or below the Intervention Price.137
● Intervention Price, PI—As indicated earlier, if and when markets for particular farm products in the EU do not clear, the EU purchases and stores the excess supply.138 Each EU member state has an “intervention office,” and this office is legally obligated to buy surplus production at the designated Intervention Price, PI.139 In the graph above and the earlier discussion, this price is called the Support Price, PCAP, which is a term by which the Intervention Price also is known.140 In brief, the Intervention Price provides a guaranteed safety net—support—to farmers.141
The CAP is designed to keep internal prices high (i.e., PT above PWM) thus guaranteeing income to both farmers and food production for consumers.142 To assure this differential, tariff protection is a key element of the CAP. Traditionally, the EU has imposed a variable import levy or tariff on farm imports that adjusts with any changes in
132. Id. 133. Id. 134. Id. 135. Id. 136. Id. 137. Id. 138. Id. 139. Id. 140. See supra Part III.C. 141. See Meester, supra note 85, at 391–92. In the Graph, PCAP is above PEU, indicating active intervention buying by the EU. In the Chart, PI (akin to PEU) is below PEU, highlighting both the role of PI as a minimum guaranteed floor price, and the reductions in this floor owing to CAP reforms. Furthermore, in the Graph, PEU reflects market clearing under autarky. In contrast, autarky is not assumed in the Charts. 142. Id.

974 VANDERBILT JOURNAL OF TRANSNATIONAL LAW [Vol. 40:949
the gap between internal prices (PT) and CIF prices (PWM).143 Any collected revenue would be applied toward the costs of agricultural programs such as feed and raw materials in exported livestock and other processed products.144
CHARTS: OPERATION OF THE CAP
Chart I: Pre-1992 MacSharry Reform
PT Variable PEU Import Levy Export Refund
PI PWM PWM Zero
Import Market Internal (Domestic) Export Market Market
143. Id. 144. Id.

2007] EMPATHIZING ON AGRICULTURAL SUBSIDY ISSUES 975
Chart II: After MacSharry Reform,
Agenda 2000, 2003 Mid-Term Review
Decoupled Single Farm Payment
Bound or Applied PEU Tariff Export Refund PI
PWM PWM Zero
Import Market Internal (Domestic) Export Market Market It is important to note that intervention and export refunds are a cost to the EU, as are direct income payments to farmers. These expenditures—in particular, income support—have grown considerably in recent decades. The whole system, which comes within the EU budget, is operated by the European Guidance and Guarantee Fund for Agriculture. Overall, the CAP consumes about forty percent of the EU budget (and France gets about twenty percent of CAP outlays).145 However, the system is not sustainable, and less so as EU membership expands to twenty-seven (as of January 2007) from its base of six founding states, and possibly beyond.146
Indeed, a key factor behind Agenda 2000 was enlargement—consumers in new Central and Eastern European member states had less purchasing power than Western European consumers, and could not afford high internal market prices.147 Conversely, the EU could not afford to make farmers in these states rich by paying high support prices for their output—which, of course, would exacerbate over-production problems anyway.148 On May 1, 2004, when the EU expanded by ten states, farmers in the new member states
145. Arnold, supra note 107, at 3 (indicating that the CAP is scheduled for review in 2012 and renegotiation in 2013). 146. Meester, supra note 85, at 404. 147. Id. at 400. 148. Id.

976 VANDERBILT JOURNAL OF TRANSNATIONAL LAW [Vol. 40:949
immediately became entitled to CAP market measures.149 However, their entitlement to direct income payments is phased in across ten years.150 Moreover, funding is co-financed, in part by the EU, and in part by national budgets and rural development schemes at the member state level.151 That is, in July 2004, the CAP was altered to bifurcate subsidies into levels: a basic level of set payments provided by the EU; and an added amount provided at a devolved level, namely, national governments.152 This reform was essential to securing French farming acquiescence to Polish entry into the EU.153 The French concern was that if subsidy payment sources were not split between supra-national and national levels, then the EU would be forced to cut subsidies because membership enlargement would stretch its budget.154 The two charts above illustrate the operation of the CAP based on the four aforementioned prices. Chart I is the CAP as initially established, while Chart II shows the shift toward direct income support following the 1992 MacSharry Reform (discussed below). The following are key common points and differences between the charts: ● Each chart depicts three markets for agricultural products
(commodities or processed): imports into the EU, the internal (domestic) EU market, and exports from the EU.
● Movement from left to right on each chart indicates importation of agricultural products (the left-hand most panel), the EU domestic market (the middle panel), and exportation of agricultural products (the right-hand most panel).
● On each chart, upward movement bespeaks rising prices. ● In each chart, in the two external markets, the World Market
Price PWM is the only relevant benchmark. At no point does PWM prevail in the internal market. Rather, the internal market is characterized by an actual price PEU; a government determined Target Price PT (which is the highest of all prices); and a government-set floor price that, if struck, will trigger official purchases and stockpiling PI to support farmers.
149. Id. at 404–05. 150. Id. 151. Id. 152. Id. 153. Id. 154. Id.

2007] EMPATHIZING ON AGRICULTURAL SUBSIDY ISSUES 977
● Regarding imports, the tariff is a variable levy in Chart I, but a fixed duty in Chart II. With a target to preserve, and with a hope of eschewing intervention, the EU adjusts the level of protection, hence the variable levy. The higher PT is in comparison with PWM, the larger the levy. With direct income support, the tariff can be, and is, fixed.
● Regarding the internal market, Chart I shows PT, whereas Chart II displays in its place a level of direct income support. In Chart II, the tariff rate is less important, in a sense, than in Chart I, because the tariff is not centrally aimed at avoiding the undermining of PT. Also, regarding the internal market, both charts indicate PI. However, Chart II shows a lower PI than Chart I, reflecting the cuts in support prices pursuant to CAP reforms.
● Both charts show the World Market Price, PWM, which is relevant to importation and exportation since it is the amount the EU would pay for non-EU farm products and the amount EU farmers would receive for exporting their goods.155 However, as both charts indicate, EU farmers also receive a subsidy—the export refund—if they ship their goods overseas.156 The lower PWM is in comparison with PEU, the greater the refund.
D. The 1992 MacSharry Reform, Agenda 2000, and the 2003 De-Coupling
One subsidy does not cure another. The CAP export subsidy regime is one scheme trying to cure a distortion—over-production—caused by the initial subsidy scheme linking payments to production.157 However, the regime only makes matters worse. Higher levels of EU farm exports, encouraged by export subsidies, tend to depress (or suppress) world market prices.158 In turn, the gap between EU support levels and world market prices yawns (or at least remains large). As the gap grows, the EU pays a larger subsidy, which in turn exacerbates the problem of over-production and leads to yet greater exportable surpluses. A vicious cycle, as it were, occurs. De-linking subsidies from production is an obvious way to deal with the cycle. On a few occasions, the EU has made reforms designed to de-couple payments from output.159 In 1992, the EU approved the “MacSharry Reform” (named after the EU Agricultural
155. Id. at 392, 398. 156. Id. 157. KRUGMAN, supra note 127, at 197–99. 158. Id. 159. Meester, supra note 85, at 398.

978 VANDERBILT JOURNAL OF TRANSNATIONAL LAW [Vol. 40:949
Commissioner who served from 1989-92).160 This reform measure cut support (intervention) prices and mandated production restrictions.161 The EU eliminated all price support for oilseeds and protein crops, and cut production by twenty percent and thirty-three percent for beef and cereals, respectively.162 But, to assist producers, they allowed for direct income payments to farmers.163 The variables in the formula to determine income compensation are historical areas under cultivation, yield, and livestock units.164 Such payments are conditional on set asides, i.e., farmers taking arable land out of cultivation (for crops), or establishing maximum densities per hectare (for livestock).165 The MacSharry Reform heralded a fundamental change in CAP philosophy. As initially conceived, the CAP required farmers to earn income from the market, but the government would intervene as necessary to affect prices.166 With the reform, the EU began backing away from intervention, and moving toward direct income support.167 Following the MacSharry Reform, the EU successfully pushed for creation of a “Blue Box” during Uruguay Round negotiations on the Agreement on Agriculture.168 The 1992 deal creating this Box is known as the “Blair House Accord” (after the Washington, D.C., location where it was reached).169 Subsidies that pay farmers based on setting aside parts of their fields are exempt from Aggregate Measure of Support (AMS) reduction commitments.170 In other words, the EU’s production-limiting direct-income support to farmers goes in the Blue Box.171
Bluntly put, without this deal the Uruguay Round would have collapsed. Accordingly, it is sometimes said that no multilateral trade round can advance until the EU forges a common negotiating position. The EU cannot do so until it comes to an agreement over hard choices about the CAP. The MacSharry Reform applied only to beef, cereals, oilseeds, and protein crops.172 To extend coverage, and to prepare for a new round—the Doha Round—of multilateral trade talks, the EU agreed
160. See id. at 398 (discussing the European Union’s approval of the MacSharry Reform). 161. Id. 162. Id. 163. Id. 164. Id. 165. Id. 166. Id. 167. Id. 168. Id. 169. Id. at 399. 170. Id. 171. Id. 172. Id.

2007] EMPATHIZING ON AGRICULTURAL SUBSIDY ISSUES 979
on “Agenda 2000.”173 Under this amendment to the CAP, the EU applied the MacSharry Reform to the dairy sector, made further cuts in intervention prices, and boosted direct income support.174 Significantly for farmers, their income payments are in nominal terms, i.e., they are not indexed to inflation, and thus eroded by cost of living increases. Moreover, the Agenda 2000 boost was not directly proportional to the cuts in intervention prices.175 The EU thought it unnecessary to make them so.176 Because the price of EU farm goods would fall given the CAP reforms, these products would be more competitive on world markets—and EU farmers would make more money the old fashioned way: namely, through free trade at a market price.177 Also significant for farmers was the express linking of income payments to the satisfaction of environmental conditions, a manifestation of multi-functionality.178 In June 2003, in connection with the “Mid-Term Review of Agenda 2000,” the EU approved further CAP changes.179 As with prior reforms, the 2003 package aimed to reduce production surpluses by lowering intervention prices and de-coupling subsidies from output—in effect, phasing out intervention buying.180 The EU decreased support prices for butter by twenty-five percent (across four years) and skim milk powder by fifteen percent (over three years).181 As with Agenda 2000, increases in income support only partly compensate for these decreases.182 The EU introduced “modulation”—cuts in income support to large farms so as to fund rural development initiatives.183 Most notably, the EU replaced multiple direct income payments with a single farm payment.184 Significantly, the EU entirely de-linked the single farm payment from what a farmer produces.185 The policy underlying disengaging income subsidies and farm production is to liberate farmers and thereby increase farm efficiency. Without having to pay attention to support payments, a farmer can make planting, growing, and harvesting decisions based on market signals. Continuing the theme of multi-functionality, in the 2003 reform the EU made the single payment contingent on satisfying not only environmental conditions,
173. Id. 174. Id. 175. Id. 176. Id. 177. Id. 178. Id. 179. Id. 180. Id. 181. Id. 182. Id. 183. Id. 184. Id. at 400. 185. Id.

980 VANDERBILT JOURNAL OF TRANSNATIONAL LAW [Vol. 40:949
but also on meeting standards on animal and plant welfare and food safety.186 These contingencies are known as “cross-compliance.”187 To be sure, the details of the June 2003 reforms are complicated and crop-specific. For example, that year, the EU stopped all intervention buying of rye.188 In December 2006, just before Bulgaria and Romania—two large maize producers—joined the EU, the EU announced it was ceasing intervention buying of unsold maize stocks.189 Eliminating maize-intervention buying cut the amount the EU spends on purchasing unsold cereals (U.S. $496 million) by a third, and cut the amount of maize projected to be in EU warehouses by 2013 from 18.3 million tons to 10 million tons.190 Hungarian farmers were the worst hit. They account for over ninety percent of the maize stocks.191 Because their country is landlocked, many preferred to sell maize to the EU rather than pay transport costs to sell on the market.192 The EU said it would sell off remaining maize stocks over five years (2007-2011), and that reduced-price corn from Hungary could be exported or used as feed for pigs and poultry.193 However, under the CAP reforms, full de-coupling does not occur for all products, and occurs only over a lengthy phase-in period for some products. The EU is deregulating the fruit, vegetable, and wine sectors, but not all at once.194 It is especially important to shift away from production-linked subsidies for raisins and tomatoes, which account for large shares of the intervention purchase budget, and the surfeit of which is either donated to charity or buried in a landfill.195 Ending intervention buying for barley and wheat is also critical, but is politically difficult. France is a large supplier of these products, and tenaciously supports the CAP.196 Such examples suggest that the sovereignty of individual EU member states complicates CAP reform. Indeed, the states have discretion to retain some links, on certain products, between income
186. Id. at 400–01. 187. Id. 188. Id. 189. See Andrew Bounds, Brussels Set to Bring Down Maize Mountain, FIN. TIMES, Dec. 12, 2006, at 2 (indicating that Mariann Fischer Boel, the European farms commissioner, aimed to cease intervention buying of unsold maize stocks before the accession of Bulgaria and Romania). 190. Id. 191. Id. 192. Id. 193. Id. 194. Id. 195. See id. (indicating that Brussels spends more than €800 million annually helping the fruit and vegetable sector, with tomatoes and raisins taking the biggest share of the funds, the result being that the excess produce is handed out to charities or buried in landfill). 196. Id.

2007] EMPATHIZING ON AGRICULTURAL SUBSIDY ISSUES 981
support and output.197 Therefore, the question is whether reforms to the CAP are, as yet, sufficiently far-reaching to break the vicious cycle and its untoward effects. What is unquestionable, however, is that the reformed CAP adduces multi-functionality. Providing direct income support is a policy about rural lifestyle and culture. Cross compliance obviously bespeaks concern about sustainability.
IV. PROPOSALS ON AGRICULTURAL SUBSIDIES
A. From the G-20
Not surprisingly, given the cruel nexus among trade, agriculture, and poverty in Pakistan (along with its G-20 partners), Pakistan has argued for aggressive cuts in farm subsidies by developed countries.198 While farmers in developing countries might be able to compete on a level playing field with developed-country producers, they cannot compete against the treasuries of the EU, Japan, the U.S., or other major countries. As Kamal Nath, the Indian Commerce Minister, put it in July 2006, “Subsistence and livelihood security are not negotiable. . . . It’s not the bottom line, it’s the only line.”199 Six months later, in January 2007, Nath echoed the sentiment: “This is not a matter of commerce, but of livelihood.”200 The G-20 Proposal emerged in the mid-fall of 2005, following an October 2005 offer by the United States (the “Portman Proposal,” named after the U.S. Trade Representative Rob Portman), and an EU
197. Id. 198. G-20, G-33 Ministers Underline Priorities Before "Decisive Phase" in Doha Talks, BRIDGES WKLY. TRADE NEWS DIG., June 13, 2007, available at http://www.ictsd.org/ weekly/ 07-06-13/story2.htm. 199. Daniel Pruzin, India’s Nath Unyielding in “Confessional” With Lamy, Repeats Demand for Flexibilities, 23 INT’L TRADE REP. 1089, 1089 (2006) (discussing the non-negotiable nature of livelihood security and subsistence for any country). 200. Alan Beattie, U.S. Farm Subsidies Weigh Down Efforts to Defrost Doha Talks, FIN. TIMES, Jan. 31, 2007, at 4 (indicating that rice is a case in point and quoting Susan Schwab, US Trade Representative, in her statement that the U.S. is a competitive exporter in rice and not by virtue of subsidies).
Research suggests otherwise. A paper presented to a UN conference in 2004 showed that American rice cost $331 . . . per ton to produce, compared with $70 for Thailand and $79 for Vietnam. The U.S. Department of Agriculture’s own assessment of the rice industry, published last month [December 2006], notes that U.S. farmers are losing market share in the two biggest rice-importing regions of the world, sub-Saharan Africa and the Middle East, because of competition from Pakistan, Vietnam and Thailand, which “typically sell long-grain milled rice at lower prices than the United States.”
Over the past four years [2003-2006], [U.S.] government handouts made up a remarkable 39 percent of US rice farmers’ total income.
Id. (emphasis added)

982 VANDERBILT JOURNAL OF TRANSNATIONAL LAW [Vol. 40:949
counter-offer in the same month.201 The G-20 Proposal covers the three key farm subsidy topics: (1) domestic support (particularly Amber Box subsidies), (2) export subsidies, and (3) the overall level of trade-distorting support (i.e., the sum of Amber and Blue Box subsidies and de minimis payments).202 Table II below sets out specifics on the first topic. Not surprisingly, given the agricultural challenges faced by G-20 members like Pakistan, this Plan calls for deep cuts (indeed, deeper than the EU or American plans).203 Moreover, the G-20 Plan exempts developing countries from Amber Box reduction commitments, if those countries have not already bound their level of spending in this Box.204 Because they intend to promote exports, or have that effect, agricultural export subsidies are the most trade-distorting form of farm support. The G-20 Plan identifies 2010 as the year by which agricultural export subsidies should be eliminated.205 Finally, a so-called “headline number” is the overall level of support. Here, too, the G-20 Plan is ambitious. It calls for harmonizing cuts in overall subsidies, as Table III summarizes.206
201. See BHALA, supra note 1, ch. 4, (analyzing these proposals, along with that of the G-10, which includes Iceland, Israel, Japan, Korea, Liechtenstein, Mauritius, Norway, Switzerland, and Taiwan. The proposals also address agricultural market access (i.e. tariff reduction and tariff rate quota expansion, and sensitive products), an admittedly critical and linked matter, but one which is beyond the scope of the present Article). 202. CHARLES E. HANRAHAN & RANDY SCHNEPF, CONGRESSIONAL RESEARCH SERV., WTO DOHA ROUND: THE AGRICULTURAL NEGOTIATIONS 12–13 (2007), available at http://www.nationalaglawcenter.org/assets/crs/RL33144.pdf. 203. See Daniel Pruzin, G-20 Criticizes U.S. Farm Bill Proposal, Says It Lacks Real Cuts, Subsidy Disciplines, 24 INT’L TRADE REPORTER (BNA) 192 (2007); G-20 Proposal on Market Access (Oct. 12, 2005), http://www.ictsd.org/ministerial/ hongkong/docs/G20proposal.pdf (last visited Nov. 25, 2007). 204. See G-20 Proposal on Market Access, supra note 203. 205. See id. 206. Id.
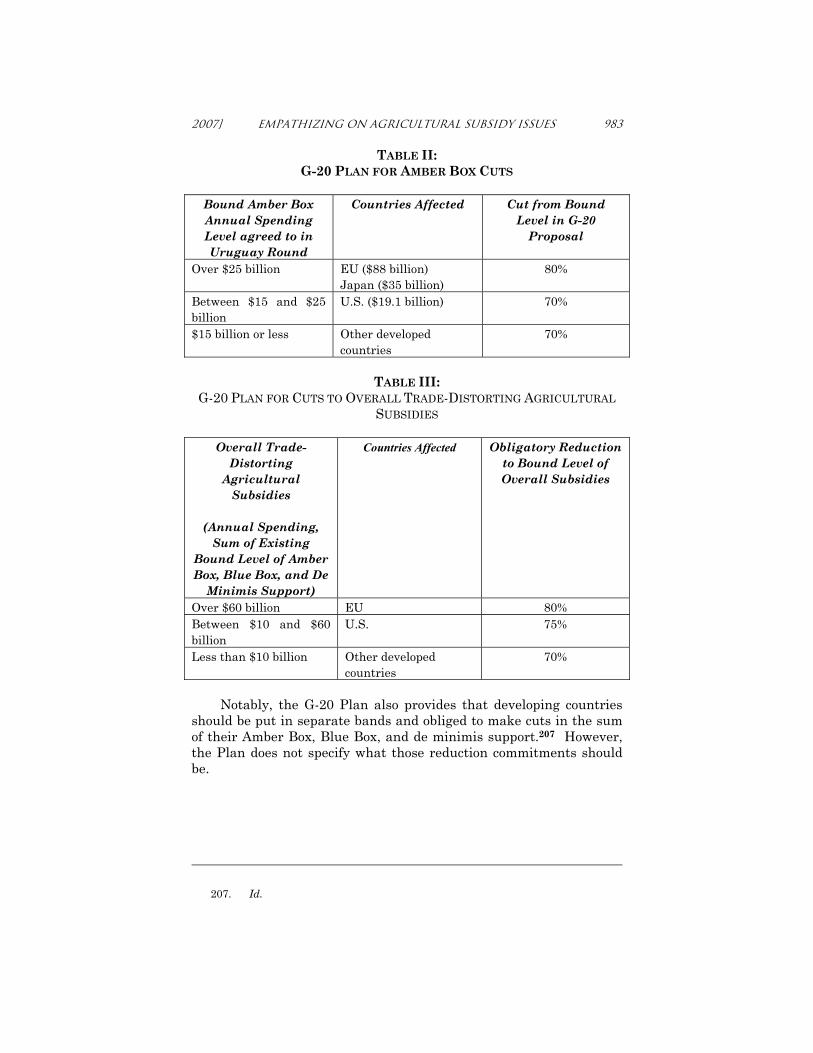
2007] EMPATHIZING ON AGRICULTURAL SUBSIDY ISSUES 983
TABLE II: G-20 PLAN FOR AMBER BOX CUTS
Bound Amber Box Annual Spending Level agreed to in Uruguay Round
Countries Affected Cut from Bound Level in G-20
Proposal
Over $25 billion EU ($88 billion) Japan ($35 billion)
80%
Between $15 and $25 billion
U.S. ($19.1 billion) 70%
$15 billion or less Other developed countries
70%
TABLE III:
G-20 PLAN FOR CUTS TO OVERALL TRADE-DISTORTING AGRICULTURAL SUBSIDIES
Overall Trade-
Distorting Agricultural
Subsidies
(Annual Spending, Sum of Existing
Bound Level of Amber Box, Blue Box, and De
Minimis Support)
Countries Affected Obligatory Reduction to Bound Level of Overall Subsidies
Over $60 billion EU 80% Between $10 and $60 billion
U.S. 75%
Less than $10 billion Other developed countries
70%
Notably, the G-20 Plan also provides that developing countries should be put in separate bands and obliged to make cuts in the sum of their Amber Box, Blue Box, and de minimis support.207 However, the Plan does not specify what those reduction commitments should be.
207. Id.

984 VANDERBILT JOURNAL OF TRANSNATIONAL LAW [Vol. 40:949
B. From the EU
It should not be surprising that the EU rejects the G-20 Proposal. The agricultural subsidy cuts demanded by the likes of Pakistan either do not acknowledge, or look suspiciously at, the operation and reform of the CAP, and the increasingly precarious position of many French farmers. The EU Proposal seems less comprehensive and less detailed than the G-20 offer with regard to subsidies. It lacks clear, bottom-line figures in all three topical areas: domestic support, export subsidies, and an overall trade-distorting cap. That is, first, the EU does not appear to have offered a precise figure for CAP subsidy cuts. Rather, it repeats a mantra: the CAP is undergoing reform, with a general shift away from trade-distorting production-based support to non-trade-distorting, de-coupled income support. The truth is that carrying out G-20 type cuts would be a shock for many in the EU. Second, on export subsidies, while the Portman Proposal (as well as British Prime Minister Tony Blair) accepts the 2010 date for elimination, the EU appears to refuse to match this offer.208 That refusal is expected because the EU spends more on direct export subsidies—$2 billion annually—than any other WTO Member, and accounts for ninety percent of all export subsidies paid by developed countries.209 The G-20 has had little choice but to watch the EU and United States battle over whether the United States uses food aid to dump surplus agricultural production, and what the appropriate definition of “export subsidy” should be (with the EU insisting on “parallelism,”210 meaning that all forms of export support—direct payments plus export credits, export credit guarantees, food aid, and insurance—should be included). Third, with respect to overall aggregate trade-distorting farm subsidy levels (Amber Box, Blue Box, and de minimis programs), the U.S. offer attracts much attention, especially from the EU, which rails against such a position. The Portman Proposal includes a cap of roughly $22.5 billion, entailing about a fifty-three percent cut from the current Limit.211 The EU urges the U.S. cap should be $15-17 billion, which would mean real cuts from America’s current actual
208. See BHALA, supra note 1, ch. 4. 209. Id.; see also International Centre for Trade and Sustainable Development, Doha Round Briefing Series: Agriculture, Vol. 4, Nov. 2005, at 9, available at http://www.ictsd.org/pubs/dohabriefings/Hong_Kong_Update/2-agriculture.pdf. 210. See BHALA, supra note 1, ch. 4. 211. Id.; see also Alan Beattie, U.S. and EU “Must Give Ground” on Trade, FIN. TIMES, Jan. 25, 2007, at 8.

2007] EMPATHIZING ON AGRICULTURAL SUBSIDY ISSUES 985
level of Amber Box spending of about $19.1 billion.212 The G-20 is highly critical of the U.S. position, saying that the American offer could allow it to increase subsidy expenditures.213 The G-20 queries the U.S.: Why not limit itself to $12 billion?214 In this debate, however, the EU seems to emerge without offering an unambiguous figure at which it is willing to cap aggregate farm expenditures.
V. EMPATHY
Manifestly, the G-20 and EU are far apart on agricultural subsidy issues. The likes of Pakistan and France essentially are talking past one another in the Doha Round. That non-dialogue is adduced by the wide gap in numbers in the respective farm subsidy proposals. It is the job of trade negotiators to bridge that gap. They cannot do so without empathizing with each other, and specifically with the farmers in other countries. There has been little of that in the Doha Round. Set amidst the technical complexities of agricultural trade economics and law, the point is simple. Countries are negotiating in the Doha Round over farm subsidies essentially on the basis of the realities they face. Those realities include aspirations and fears. To make progress in the talks (indeed, in any international trade negotiation), empathizing with aspirations and fears is essential. The short-run result may be less ambitious and slower progress toward farm-trade liberalization. The long-run gain, however, may be the avoidance of a collapsed trade round, as well as the bitterness and recriminations that are now exported in large volumes.
212. See Beattie, supra note 211, at 8 (indicating that the EU is asking for another two or three billion on top of the current proposal from the current US proposal of a 22.5 billion ceiling). 213. Id. 214. Id.