emotional response to sound - chalmers
TRANSCRIPT

Emotional response to sound Influence of spatial determinants
Master’s Thesis in the Master’s programme in Sound and Vibration
Fredrik Hagman
Department of Civil and Environmental Engineering
Division of Division of Applied Acoustics
Room Acoustics Group
CHALMERS UNIVERSITY OF TECHNOLOGY
Göteborg, Sweden 2010
Master’s Thesis 2010:157


MASTER’S THESIS 2010:157
Emotional response to sound
Influence of spatial determinants
Master’s Thesis in the Master’s programme in Sound and Vibration
FREDRIK HAGMAN
Department of Civil and Environmental Engineering Division of Division of Applied Acoustics
Room Acoustics Group
CHALMERS UNIVERSITY OF TECHNOLOGY
Göteborg, Sweden 2010


Emotional response to sound
Influence of spatial determinants Master’s Thesis in the Master’s programme in Sound and Vibration
FREDRIK HAGMAN
© FREDRIK HAGMAN, 2010
Master’s Thesis 2010:
Department of Civil and Environmental Engineering
Division of Applied Acoustics
Room Acoustics Group
Chalmers University of Technology
SE-412 96 Göteborg
Sweden
Telephone: + 46 (0)31-772 1000
Cover: Subjective perception of a scary tiger painted by 7 year old Moa Hagman. This picture is not just a masterpiece but also a remainder that emotions and the subjective expression of such differ among individuals.
Reproservice / Department of Civil and Environmental Engineering
Göteborg, Sweden 2010


I
Emotional response to sound
Influence of spatial determinants Master’s Thesis in the Master’s programme in Sound and Vibration FREDRIK HAGMAN Department of Civil and Environmental Engineering Division of Applied Acoustics Room Acoustics Group Chalmers University of Technology
ABSTRACT
The emotional content of sound is greatly utilized in our everyday life, whether it is music or speech. Sounds which does not carry information by linguistic or musical harmonic patterns such as sounds that we hear in our everyday life, so called ecological sounds, conveys also information but in a more subtle way. Our emotions serve us by relating to these sounds and their inherent meaning, but also involve the acoustic surrounding in order to facilitate for us to take appropriate actions. The room acoustic is of most importance when enhancing the impression of music and speech intelligibility but the room acoustic influence of ecological sounds are yet a rather unexplored area. This thesis strives to further this research area by analyzing the effect of room acoustic on emotional responses to ecological sounds.
Part 1 and Part 2 of this thesis evaluated the effect of an increased amount of early lateral reflections which in musical acoustics is correlated to an increased auditory source width. The effect was in part 1 evaluated on continuously moving sources in an approaching and receding scenario while part 2 handles the same room acoustic features but for discrete positions. The results of part 1 and 2 showed an influence of the lateral reflections for static sources but not for continuously moving sources. Further results in part 1 showed that while, for the main effect of looming, approaching sounds were perceived as more frightening and threatening than when receding.
Part 3 explores the effect of room size on emotional reactions to sound where three rooms with different room size were auralized with two positions in each. The results showed that the room size affects the emotional response to the sound such that an increase of room size increases the emotional response.
A difference between negative and neutral sounds were found for self reported arousal in many parts of the work which implies that neutral sounds in general are more affected by changes in the acoustic environment. This could indicate that the emotional content of the sound is the main determinant to whether acoustical cues are influencing the emotional response.

II

CHALMERS, Civil and Environmental Engineering, Master’s Thesis 2010:157 1
Contents ABSTRACT I
CONTENTS 1
ACKNOWLEDGEMENTS 3
INTRODUCTION 4
1 THEORY 5
1.1 Spatial hearing 5
1.2 Localization and perception 5
1.3 Distance cues 6
1.4 Perception of room acoustic 7
1.5 Ambisonics 8
1.6 Statistics 8
2 EMOTIONS AND HEARING 10
2.1 Measure of Emotion 12
2.1.1 Subjective Measures 12
2.1.2 Physiological measures 14
3 APPROACH 17
3.1 Sound evaluation 17
3.2 CATT-Acoustic 20
3.3 Test Procedure 23
3.4 Part 1 24
3.5 Part 2 25
3.6 Part 3 26
4 RESULTS 28
4.1 Part 1 28
4.2 Part 2 34
4.3 Part 3 37
5 DISCUSSION 41
5.1 Pleasantness effect 42
5.2 Effect of lateral reflections 42
5.3 Looming effect 45

CHALMERS, Civil and Environmental Engineering, Master’s Thesis 2010:157 2
5.4 Effect of Room Size 46
5.5 General discussion 51
6 CONCLUSION 53
7 FUTURE WORK 55
8 REFERENCES 56
APPENDIX A 58
Listening test 58
APPENDIX B 60
Initial test results

CHALMERS, Civil and Environmental Engineering, Master’s Thesis 2010:157 3
Acknowledgements I would like to thank the staff at Applied Acoustic for contributing to an open and inspiring environment at the department but foremost I would like to thank my supervisors at Chalmers, Daniel Västfjäll and Erkin Asutay for their rewarding conversations and welcoming attitude. It is greatly appreciated. This goes out to Pontus Larsson as well.

CHALMERS, Civil and Environmental Engineering, Master’s Thesis 2010:157 4
Introduction Sound can elicit emotions in the listener i.e. negative and positive feelings, a fact that has been well exploited in movie business. These elicited emotions in listeners are induced through the physical characteristics of the sound such as loud or dissonant sounds, but also through the fact that sound evoke associations and memories. The auditory system is not only a main channel for emotion induction, but is, more broadly, one of the main receptors for information about our surrounding.
When designing and analyzing acoustic environments, it is often done with emphasis on acoustic quality for musical or speaking performances. The most important parameter of such an analysis is the reverberation time. The reverberation time is an easy measureable parameter which, by some additional measurements gives further information about the early to late reverberation ratio, clarity, initial time delay gap etc. While some research has evaluated the influence of reverberation time from an emotional viewpoint, other room acoustic parameters, such as auditory source width, has not been analyzed from an emotional acoustic viewpoint. These quantities are mainly used in musical acoustics, but should nevertheless be important in all auditory perception.
Previous measurements and analysis has mainly been performed on auditory stimuli such as tones or noise in order to draw general conclusions. There is though another branch of this scientific field which considers ecological sounds i.e. sounds that acquire a meaning which can be related to, from an evolutionary viewpoint or some other mechanism which has influenced the human perception through the years of evolution. In order to achieve sounds with such properties, there should be an emphasis on acquire sounds which are free from bias due to cultural, geographical or developmental reasons. The stimuli selected for testing should thus be on such a basic evolutionary level that the influence of the human idiosyncrasies would play a minor role. This is a hard task and generalizations have to be done.
Sound sources radiating an increasing acoustic intensity has been shown to be perceived as moving towards a listener placed at some distance from the sound source. This phenomenon has been studied for stimuli such as tone bursts or noise as well as for ecological stimuli. In many of these studies the emotional reaction is enhanced when the object is perceived as approaching. Most of these studies have though been performed in free field condition without any interference from boundaries.
How room acoustic interact with our emotional perception is the main objective of this thesis. Sounds for which the emotional reactions are known from an evolutionary viewpoint are tested in various acoustic environments in order to investigate how our acoustic surroundings are influencing our emotional reaction to sound.

CHALMERS, Civil and Environmental Engineering, Master’s Thesis 2010:157 5
1 Theory
1.1 Spatial hearing
The ear input signals are the most important input signals to the subject for spatial hearing. Small variations on these signals can produce noticeable variations in spatial hearing (Blauert, 1997). Sound that reaches the ears will first encounter the pinna. It is a framework of cartilage covered with skin which has a shadowing effect for incoming sounds from behind and in front of the listener. The pinna also play an essential role in spatial hearing by acting as a linear filter whose transfer function depends on distance and direction of the sound source. This is happening due to resonances which arise in the complex structure of the pinna. These resonances are especially important to localize sound outside the horizontal plane and close to the median plane. Localization in the median plane is to some extent also dependent of memory cues. Via the cavum conchae, the ear canal opening, the sound then travels down the external ear canal, a slightly curved tube with its own transfer function. The ear canal is then terminated by the eardrum. Varying the pressure in the ear canal will set the eardrum in motion which is further transferred to the middle and inner ear. The highly irregular shape of the pinnae together with its variation among individuals makes it though hard to describe the pinnae in details but the pinnae forms, together with ear canal, a system of acoustic resonators. The degree to which individual resonances of this system are excited depends on the direction and distance of the sound source (Blauert, 1997). The hearing mechanism is clearly individual when it comes to the structure of for example the pinna. This is why the psychoacoustic term sound event is being used instead of just sound. Sound is what is being radiated from for example a loudspeaker while a sound event is the perceived sound for each individual listener. A sound can be radiated e.g. ultrasound without the presence of a sound event.
This is the feature of the ear that governs the spatial hearing. But before reaching the ears, the sound is also influenced by the head and torso. They are responsible of reflecting and shadowing incoming sound which introduces interaural time differences (ITD) and interaural level differences (ILD), crucial for the localization ability mainly in the horizontal plane.
1.2 Localization and perception
The human hearing is binaural i.e. humans have two ears which transforms incoming sound to nerve signals for the brain to process. Since the diameter of the average head is 16 cm, this will introduce an ITD for sound which is incoming from all angles except 0 and 180 degrees. The ability of hearing to perform cross-correlation on the two ear inputs helps localizing sounds from different directions. For frequencies below approximately 2 kHz, the human
CHALMERS, Civil and Environmental Engineering, Master’s Thesis 2010:157 6
hearing uses the phase difference for localization while at higher frequencies, the time differences in the signal envelope is the main cue to localization. In addition, at frequencies above 3-4 kHz when incoming no longer is diffracted around the head, the ILD is substantial which further improves the localization ability.
1.3 Distance cues
While the angular localization is rather accurate, the human ability to determine the distance to a sound source is much less accurate. Much research has been performed on static sources which reveal a tendency of listener to often underestimate the distance to sources which are far away while sources closer than 1 m often are overestimated (Zahorik, Brungart, & Bronkhorst, 2005.). The opposite effect has been found for tones and noise with continuously rising versus falling intensity where rising intensity sounds were perceived as stopping closer than sounds that were falling in intensity, despite identical stopping points (Neuhoff, 2001). These findings are based on intensity changes due to changes of the distance between listener and sound source but there are more acoustical cues which are important for the perception of sound source distance for example the tone colour. As a sound source approaches a listener a sensation called the proximity effect occurs. It is easily explained by the curves of equal loudness which states that the threshold of audibility is frequency dependent. Low frequency tones are perceived as lower in loudness compared to a 1 kHz tone if played back at the same sound pressure level. Consequently, when a sound source is approaching, the low frequency content will increase in loudness and become more audible rendering a perception of a darkening of the tone colour.
When considering enclosed spaces, further acoustic cues such as reverberation starts to influence the distance perception. The energy which reaches the ears directly from the source follows the inverse-square law while reflected sound from enclosing surfaces builds up to a reverberant energy. The ratio of the two energies is inversely related to the distance of the sound source. A sound source which is close to the listener will consequently produce more direct sound energy at the ear entrance which will increase the direct to reverberant ratio. Distance judgment is more accurate in a reverberant environment compared to an anechoic environment which suggests that direct to reverberant energy ratio may provide absolute distance information while intensity , which is the only distance cue in an anechoic environment, must be compared relative to other distances to improve distance accuracy (Zahorik, Brungart, & Bronkhorst, 2005.).

CHALMERS, Civil and Environmental Engineering, Master’s Thesis 2010:157 7
1.4 Perception of room acoustic
The degree of spaciousness of a room was until the 1960:s considered to be correlated with reverberation solely. In the late 60s though, propositions were made that there was an additional spatial phenomenon associated with early lateral reflections, referred to as spatial impression, SI.
Assuming a regular room with a single source, the direct sound governs in most cases the perceived direction of the sound source. This is the case because of “law of the first wave front” which implies that the direction, from which the first of several coherent sound contributions is heard, is perceived to be the direction of the sound source. The first wave front that reaches the listener is most cases the direct sound which greatly facilitates the localization ability. As more reflections are added, the localization of the source gets more cumbersome. If the sound source is placed outside the reverberation radius i.e. the distance from a source where the direct sound and the reflected sound are equal in level, the localization ability is badly impaired as soon as reflections are added. In an anechoic environment where all surfaces are fully absorbing, only the direct sound is present giving the source a sharp localization.
The direct sound combined with reflections from surrounding surfaces in an enclosed space builds up the sound field and the reverberation of the room which is governed by the reflections from surrounding surfaces and their acoustic properties regarding absorption and scattering. The reverberation time is defined as the time it takes for the energy density of the room to decline 60 dB after sound offset. Regarding perception, a relative small difference in reverberation time, down to approximately 0.05 seconds in a third-octave band, could be perceived. (Kleiner, 2008). If only considering the early reverberation time which correlates fairly well with the subjectively perceived reverberation time for continuous sounds, it can be divided into early reflections that reach the listener within the first 50 ms and late reflections which reach the listener from 50 ms up to approximately 150 ms. The lateral early reflections will not change the perceived placement of the source but instead create a feeling of an auditory broader sound source. This sensation is known as auditory, or apparent, source width (ASW). The 50 ms limit constitutes the temporal threshold were the human hearing are able to separate discrete sounds from each other. If the reflections occurring after 50 ms are fairly temporally uniform the effect of discrete sound events will not occur but instead the gathered reflections will produce a feeling of envelopment known as listener envelopment, LEV. The presence of the above mentioned sensations are though not just dependent of temporal behaviour but also of the relative level of the reflections compared to the direct sound from the sound source.
The direct sound in combination with reflections builds up a perceived auditory spaciousness around the listener.
CHALMERS, Civil and Environmental Engineering, Master’s Thesis 2010:157 8
The SI could be estimated by measuring the level of difference between direct sound and reverberant sound referred to as H (Hallabstand in german) (Kleiner, 2008) which is defined as equation (1):
10log direct
reverberation
EH
E
=
(1)
To fully characterize the SI the interaural cross-correlation (IACC) also needs to be considered. This is a cross correlation of the left and right channel from a binaural impulse response. In order to evaluate the ASW, a cross correlation of the first 80 ms could be used as a measure referred to as IACCe (Morimoto). This measure should be the average of three consecutive octave bands starting at 500 Hz. The IACC measure tells about the correlation between the left and right ear and to achieve as high SI as possible the correlation should consequently be kept low.
1.5 Ambisonics
Many psychoacoustic tests today are performed with headphones were the stimuli are presented binaurally. The main advantage of using headphones is the full control of the sound field which is achieved. Replacing the headphones by loudspeaker introduces more strictly demands on the listening room. To fully achieve a perfect auralization by loudspeakers the influence of the listening room needs to be negligible. This is in practice only achieved in an anechoic environment. In this thesis, the auralization is played back through an Ambisonics system, mainly because of curiosity from the author.
The Ambisonic technique is recording/playback technique that principally uses four sound pressure signals, X, Y, Z and W to represent the full geometry of the sound field. These signals are decoded to loudspeaker setting of your choice depending on height representation but with an absolute minimum of 4 loudspeakers for only horizontal representation. The signals to the loudspeakers should not be seen as separate signals but instead signals which are containing virtually all elements of the recording but with different relationships. The loudspeaker all together recreates the acoustic and ambience of the sound field.
1.6 Statistics
To be able to make comparisons and draw conclusions between different acoustic treatments on emotional response, a statistical analysis of the acquired data needs to be performed. The tool employed for the statistical analysis of this thesis was analysis of variance or ANOVA. The method is based on testing of the null hypothesis which is stated as:
H0 = the means of all analyzed parameters are the same
CHALMERS, Civil and Environmental Engineering, Master’s Thesis 2010:157 9
With the alternative hypothesis that:
HA = at least two of the means of all analyzed parameters differ
The ANOVA makes use of so called factors to define the different independent treatments which are made to the stimuli e.g. room size. These factors could have different levels e.g. small and big. Comparisons between populations are then made by analysing response variables which are the suitable numerical quantities to be measured.
To make the determination of whether the means differ or not, the ANOVA makes use of the variation between sample means and the inherent variation within each sample which forms the test statistic or F ratio according to equation (2).
between - samples variationtest statistic =
within - samples variation (2)
The sample variation measures in the numerator and denominator are calculated according to equation (3).
( )2
2
1
:
:
i
i
x xs
n
where
x thei th discreteobservation
x sample meanof observations
n number of samples in theobservation
−=
−
=
=
=
∑
(3)
This ratio of two variation measures follows a continuous probability distribution called an F distribution. The F distribution is different depending of the degree of freedom in the numerator and denominator, which is associated with the sum of squares, denoted df1 and df2 respectively. Large values of the F ratio implies differing mean values which then would mean that H0 should be rejected while small values would mean that H0 not should be rejected. This leads to that the ANOVA tests are upper-tail tests. The area above the F-ratio value denoted the P-value or observed significance level which states the probability that the F-ratio is at least as contradictory to H0 as the value shows. The smaller the P-value, the more contradictory is the data to H0. As a scientific rule of thumb the P-value should be lower than 0.05 in order to reject H0.

CHALMERS, Civil and Environmental Engineering, Master’s Thesis 2010:157 10
2 Emotions and Hearing We are constantly exposed to sound in our everyday life, in information and warning purpose but also regular naturally occurring sounds such as flushing the toilet which also serves an information sound. Most of these sounds are known to us when heard in the appropriate environment but if the environment is changed, the meaning and interpretation of the sound could be different. What if the flushing toilet is heard in a reverberant cave? With more knowledge of how our emotions influence our auditory perception, room acoustic parameters can be used to alter our behavioural patterns or attitudes towards sound events.
The term cognition is traditionally linked with terms like reason or thinking while emotion in the same context is thought of like soul, feeling or passion and there has been a traditional approach that cognition and emotion are counterparts to each other. Most theories today agree that these two instead are co-operating and that emotions should be seen as an informational system which either attracts or pull us away from objects or events, working as an alarm system for long time survival, in an evolutionary viewpoint. Most of the theories also subdivide the emotional process into several phenomena. First, there has to be an instigating event which triggers the system (1). The next step is an interpretation and a subsequent appraisal of the event (2) which is followed by physiological changes (3) and behavioural changes with action potential (4). Sometimes this also leads to a conscious awareness of these changes (5). Hence, emotions can change behavioural or physiological processes which further influence our perception, cognition and attention (Tajadura-Jiménez, 2008). The emotional process can further be divided into primary emotions which elicit immediately emotional responses related to determination of the perceived event as positive, negative or neutral, and secondary emotions which match the perceived event with previous experience from our memory related to potential benefits or threats conveyed by the event. Many theories have been proposed to how we process emotions which includes different levels. For this thesis I have chosen to adopt a theory dividing the emotional processing into three levels, subjective behavioural (not included) and physiological processes.
So how do sounds induce emotion? A theory that can be applied when trying to explain emotional reactions to sound is embodiment theory. Studies have shown that there is a reciprocal relationship between the bodily expression of emotion and the way that emotional information is attended and interpreted (Niedenthal, 2007). Simplified, it has been suggested that the human mind and body are connected when it comes to emotional induction. While emotional reactions clearly are a feature of the human mind, the body and its interaction with its surrounding environment, acts as an amplifier or attenuator of the emotional reactions. For example, restraining the body while hearing a train approaching would increase emotional activity. The sound is perceived as more unpleasant since you simply cannot move away from the

CHALMERS, Civil and Environmental Engineering, Master’s Thesis 2010:157 11
train. It can be stated that emotions serve a purpose by keeping a constant margin of safety around ourselves. If you were to be released, the train would not seem so frightening since you can move away from the danger, hence a lower emotional activity.
The embodied theory will be the viewpoint from which results are analyzed in this thesis i.e. that the listener uses its own body as reference frame when analyzing and determining emotional response to sound. This will be done by blocking all visual input stimuli and alter the room’s acoustic properties in order to evaluate differences in emotional responses.
Determinants which are influencing the emotional response to sound can be categorized as physical, spatial, cross-modal and identification of the sound source (Tajadura-Jiménez, 2008). The cross-modal determinants cover emotion induction due to relationships between different modalities, such as hearing and vision which is off topic for this thesis and will not be treated in the result analysis.
The physical determinants could be linked to the physical attributes of the sound source for example loudness or pitch. Pitch is a well known factor in sound design. When designing for example a high urgency sound to be used in warning situations, the human perception is strongly affected by pitch. A high pith sound conveys more urgency than a corresponding low pitch sound. Loudness is another factor which is highly influencing to emotional reactions. Research has shown that when presenting tones and noise with rising versus falling intensity, which is a physical determinant, to simulate approaching versus receding sources, the rising intensity scenario is perceived to change more in loudness even though the same loudness change is used for both scenarios (Neuhoff, 2001). Neuhoff also found that sounds that approached listeners were perceived as stopping closer than sounds that departed, despite identical stopping points which correlate well with the perceived loudness change. Neuhoff argues that this effect may provide a selective advantage by an increased margin of safety when exposed to approaching sounds, the listener will have longer time than expected to prepare for the source’s arrival. Another discussion by Guski, (Guski, 1992) proposed that, when an object is approaching, the primary role of the auditory system is that of warning, either to direct the visual system toward the object if time allows, or to initiate appropriate behaviors to avoid the object. The hearing system acts consequently as a helping hand to the visual system which is dominant but when outside the visual field, as the distance between a source and an observer decreases, the auditory system provides advance notice of the impending collision to allow for appropriate motor behaviors.
When increasing the starting intensity level while keeping the loudness change intact the difference in loudness change between rising and falling intensity was perceived as even higher i.e. the rising-intensity sound was perceived as changing more in loudness at high intensity levels (Neuhoff,

CHALMERS, Civil and Environmental Engineering, Master’s Thesis 2010:157 12
2001). This is consistent with a natural environment where it would be more critical to detect a close source than a distant one.
The spatial determinants are the cues that allow us to orient ourselves in our physical surroundings. The acoustic parameters described in section 1.4 are all spatial determinants which help us to locate ourselves and other possible objects just by auditory cues. Studies have shown that different reverberation times, a spatial determinant, alter the emotional response to sound. (Västfjäll, Larsson, & Kleiner, 2002). The further establishment of these determinants are the main purpose of this thesis.
The identification of the sound source is a very important determinant since the identification is crucial to be able to provide a meaning to the sound. For ecological sound sources the meaning of the sound could differ substantially depending on prior experience. The IADS (International Affective Digitized Sounds) database is a standardized database which consists of numerous sounds with their respective ratings of valence and arousal and dominance level (Bradley & Lang, 1999). This is the main source of sounds used in emotional acoustic research with ecological stimuli.
2.1 Measure of Emotion
Emotions are clearly a result of one individual’s feelings towards a stimuli and the interaction with the surrounding environment. Measurement of such an activity can be a subtle task and could be varying considerably. The main task when establishing the test setup is therefore to eliminate as many of these highly varying parameters as possible. This is mainly done by selecting stimuli with rather known emotional responses independent of age, gender and global origin.
2.1.1 Subjective Measures
The subjective measures strive to evaluate the conscious emotion perceived by the test participant known as self report. To characterize emotions, the dimensional theory is often employed by which emotions can be characterized with bipolar scales where the two mostly used are valence and arousal. The valence dimension stretches from pleasant to unpleasant while the arousal dimension reaches from activated to calm. These dimensions are suggested to be the major dimensions in which we interpret emotions and can be gathered into a structure where the perceived valence and arousal rating is combined into a two dimensional space according to Figure 1.

CHALMERS, Civil and Environmental Engineering, Master’s Thesis 2010:157 13
Figure 1. Two dimensional representation of valence and arousal
This two dimensional space can represent further emotional states which is called in the circumplex model of affection (Russell, 1980) and is illustrated in Figure 2.
Figure 2. The circumplex model of affection (adapted from Russell, 1980)
The self reports can be divided into either verbal or visual. Verbal self reports often relates to specific emotions and often includes descriptive answers of the perceived emotion or questions which typically urges the test participants to rate how much of an emotion that is perceived, known as single open ended questions.

CHALMERS, Civil and Environmental Engineering, Master’s Thesis 2010:157 14
Visual self reports are graphical representations of emotions where the test participants are urged to check a position which corresponds to the perceived emotion. One example of such a visual self report is the Self-Assessment Manikin (SAM) scale which was employed for this thesis. It is a 9-point scale for valence and arousal ratings that range from pleasant to unpleasant and calm to aroused, respectively according (see Figure 3 & Figure 4). The test participants are asked to check the position which best represents their current feeling.
Figure 3 SAM scale for valence rating
Figure 4 SAM scale for arousal rating
2.1.2 Physiological measures
Measuring emotions is a delicate task. While test participants could be presented with Figure 3 and Figure 4 be asked to rate their feelings towards a stimuli, this gives a subjective opinion which could be influenced by numerous parameters. The physiological measures are an objective way of measuring emotion. There are numerous physiological measures which can be used such as heartbeats, breathing pattern or EEG. For this thesis, electrodermal activity (EDA) and facial electromyography (EMG) have been used as measures which are explained further in the following section.
Electrodermal activity
Electrodermal activity (EDA) refers to all electrical phenomena in the skin. Skin conductance which is one form of EDA is a measure of changes in the skin´s ability to conduct electricity when an, imperceptible, external direct current of constant voltage is applied and is measured in microsiemens (µS). The term EDA is though commonly used for skin conductance as well and will be so in this thesis. The EDA is a good indicator of emotional arousal.
CHALMERS, Civil and Environmental Engineering, Master’s Thesis 2010:157 15
This is linked to the human sweat glands which tend to increase their sweat production when subjects are being exposed to emotionally arousing and stressful states. Also memory effects and exposure to novelty can increase sweat production. As more salt water from the glands is released, the skin conductance increases and an increase in the EDA results are shown. It is important to distinguish between sweating due to thermo regulation and emotional sweating which is that of interest. The palms of the hands and the soles of the feet are easy accessible and have a high density of sweat glands which is strongly related to mental processes such as emotional sweating rather than thermo regulation (Figner & Murphy). This makes these surfaces the best suited locations to measure skin conductance. In this thesis two electrodes were placed on the index and middle finger of the non-dominant hand.
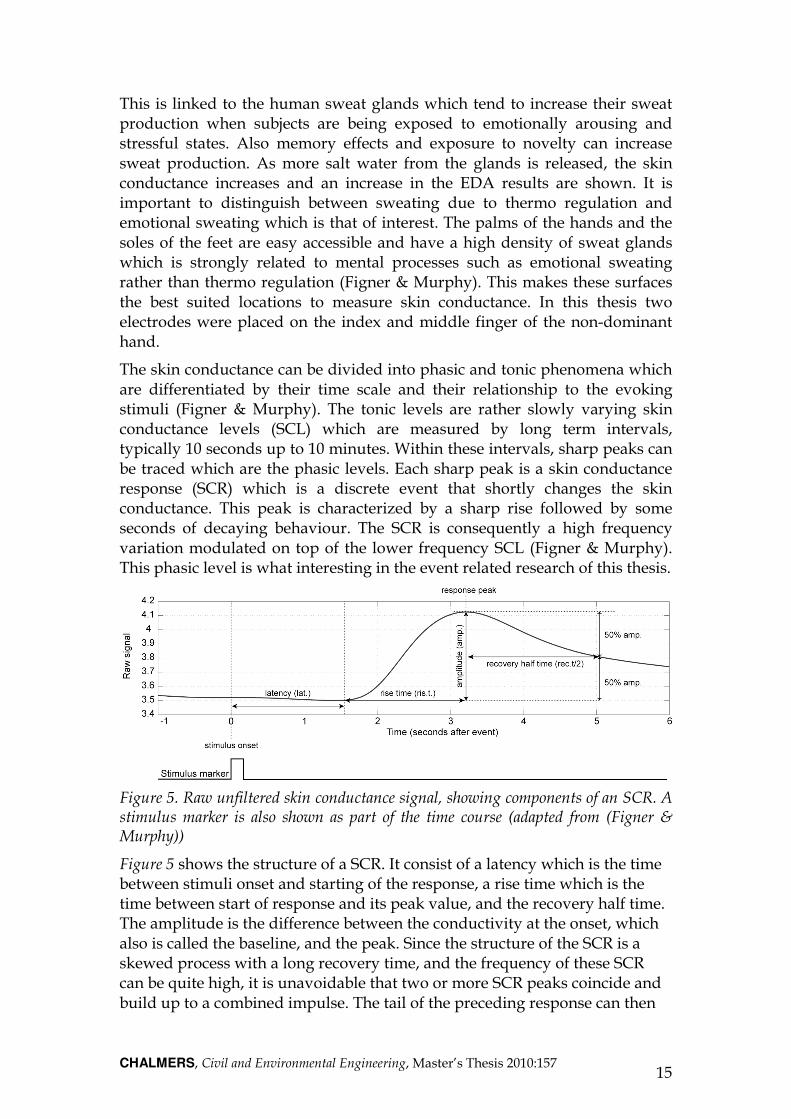
The skin conductance can be divided into phasic and tonic phenomena which are differentiated by their time scale and their relationship to the evoking stimuli (Figner & Murphy). The tonic levels are rather slowly varying skin conductance levels (SCL) which are measured by long term intervals, typically 10 seconds up to 10 minutes. Within these intervals, sharp peaks can be traced which are the phasic levels. Each sharp peak is a skin conductance response (SCR) which is a discrete event that shortly changes the skin conductance. This peak is characterized by a sharp rise followed by some seconds of decaying behaviour. The SCR is consequently a high frequency variation modulated on top of the lower frequency SCL (Figner & Murphy). This phasic level is what interesting in the event related research of this thesis.
Figure 5. Raw unfiltered skin conductance signal, showing components of an SCR. A stimulus marker is also shown as part of the time course (adapted from (Figner & Murphy))
Figure 5 shows the structure of a SCR. It consist of a latency which is the time between stimuli onset and starting of the response, a rise time which is the time between start of response and its peak value, and the recovery half time. The amplitude is the difference between the conductivity at the onset, which also is called the baseline, and the peak. Since the structure of the SCR is a skewed process with a long recovery time, and the frequency of these SCR can be quite high, it is unavoidable that two or more SCR peaks coincide and build up to a combined impulse. The tail of the preceding response can then

CHALMERS, Civil and Environmental Engineering, Master’s Thesis 2010:157 16
overlap the proceeding response which makes it hard to evaluate the amplitude of the individual peaks. Since the phasic level is event related, this is a rather important task. Research has shown that before a SCR, discrete bursts of the sudomotor nerve that control the sweat glands occur. These bursts have much shorter duration than an individual SCR, which is also delayed in relation to the sudomotor bursts (Alexander, Trengove, Johnston, Cooper, August, & Gordon, 2005). SCR responses that are linked to a specific event can consequently be masked by preceding responses related to something else. But important proceeding responses may also be masked if they are to close in time, whereupon no analysis can be performed on the specific event related conductivity. A method to be able to separate skin conductive responses were developed by (Alexander, Trengove, Johnston, Cooper, August, & Gordon, 2005) with the intention to decrease the time between stimuli and still be able to analyze their event relation. This method was adapted in this thesis with the main objective to be able to partly to distinguish the starting point of a SCR and partly to avoid startle effect by discrimination of all responses and its inherent tail before this starting point which otherwise would indicate an erroneous amplitude.
Facial electromyography
EDA does correlate with the arousal dimension of affect but does not tell whether the affect is positive or negative. In order to determine this dimension of affect other physiological measures needs to be employed such as facial muscle activity. The facial electromyography (EMG) is a method to measure muscle activity across certain facial muscles. The method originates from the idea that basic emotions such as anger are reflected as changes in facial expressions which can be detected visually. In order to measure more subtle facial expressions though, a more precise measure is needed which is EMG. Two muscles are involved in the facial expression generation, the Corugator Supercilii (CS) and the Zygomaticus Major (ZM). The CS is responsible for expressions related to unpleasant emotions such as frowning and can be measured by placing electrodes just above the eyebrow. The ZM activity is linked to pleasant emotions and is related to smiling. The electrodes to measure ZM activity are placed on the cheek on an imaginary line from the corner of the mouth to the lobe of the ear. The EMG measures are consequently valid measures to indicate valence with a high ZM activity indicating emotions which are happy or pleasant and a high CS activity indicating unpleasant emotions.

CHALMERS, Civil and Environmental Engineering, Master’s Thesis 2010:157 17
3 Approach
3.1 Sound evaluation
In order to make valid conclusions of the results, a set of emotionally well defined sounds needs to be arranged. The decision to be using ecological stimuli further stresses the importance of a clear sound identification in order to convey the right meaning to the stimuli.
The sounds were originally chosen to represent three categories, human, animal and environmental sounds. For each category two valence levels were chosen, negative and neutral. For each valence, two sounds were chosen to minimize introduction of errors due to a perceived wrong interpretation of the test participants. This gave 3 categories * 2 valences * 2 sound for each valence which equals 12 individual sounds.
The IADS database offers a variety of sound stimuli which are well defined regarding emotional reactions. There are though some flaws of the IADS database. Mainly, the sound quality which, by today's standards, is rather poor with a lot of noise introduced in the recording probably due to analogous recording devices. This could influence the credibility in the perception in a non desired way. Due to this only one sound was chosen from the database whereas the other sound stimuli had to be retrieved from other sources. This was done by inspecting sounds from various websites. The criterions for the selected sounds were a sample rate of 44.1 kHz and acceptable bit rate (at least 320 kbit/s). Further, all sounds had to be non-compressed and in the file format .wav. Also, since the sounds were to be auralized in different acoustic environments, the sounds had preferably to be recorded in an anechoic environment or with as little influence of the environment as possible, regarding reverberation time. One commercial website in particular offered a big variety of sounds with good quality and the majority of sounds were bought from here.
The chosen sounds was first to be evaluated in order to validate their expected value for valence and arousal. This was done in an initial listening test where 51 sounds were evaluated by 11 test participants. The sounds were evaluated using the SAM-scale to rate their respective valence and arousal ratings. Further verbal self reports were added where the participants were asked to judge how frightening the sound was and how much the sound represented a potential threat. Lastly, the participants were asked to rate “How relevant the sound is to evoke fear?” This question was included to discriminate sounds that could be perceived as ironic. For example, a screaming woman could induce large negative emotions for a test person if sounding natural. If not, the effect would be an opposite perception where the sound instead induces some kind of ironic effect and thus are being perceived as something almost positive which is not intended. Valence and arousal was rated on a 9-point scale ranging from “negative” to “positive” and “calm” to

CHALMERS, Civil and Environmental Engineering, Master’s Thesis 2010:157 18
“aroused” respectively. The three subsequent verbal self reports were also rated on a 9-point scale ranging from “not at all” to “very much”.
The test procedure was performed in a lecture hall at the Division of Applied Acoustics. The 11 test participants were in the age of 23-28 years with 9 males and 2 females. The test lasted for approximately 1 hour and 20 minutes and was conducted with all participants at the same time. Sounds stimuli were played in mono through headphones with no repetitions and all 5 questions were answered for each sound and directly after playback. No specific answering time was designed but was instead manually controlled.
Sounds for the final listening test were then chosen with respect to their mean valence, arousal, fear and threat ratings. All chosen sounds were also controlled with their relevance rating to prevent the “irony” effect mentioned before. Table 1 shows the chosen sounds and their respective ratings. For a complete table of all sounds in the initial test and their respective ratings see Appendix B.

CHALMERS, Civil and Environmental Engineering, Master’s Thesis 2010:157 19
Table 1 . Initial results for sound evaluation
Category Pleasantness Sound Mean Valence
Mean Arousal
Mean Fear
Mean Threat
Mean Relevance
Animal
Negative
Dog Growling 2,73 6,55 6,18 7,46 7,73
Tiger Roaring 3,18 6,09 4,91 6,46 6,82
Neutral
Cow Mooing 6,09 3,91 2,00 3,27 3,00
Hen Glug 6,09 4,27 1,64 2,00 2,46
Human
Negative
Baby Crying 2,46 6,27 3,91 4,73 4,82
Woman Screaming 2,27 7,18 6,00 6,64 7,64
Neutral
Heart beats 90 bpm 4,82 4,64 2,91 4,09 4,73
Breath Running 4,64 4,46 2,82 3,46 3,91
Environmental
Negative
EKG alarm 2,73 6,36 5,27 7,00 6,46
Car horn 2,55 6,91 5,09 6,09 6,27
Neutral
Knife Sharpening 4,64 4,46 3,27 5,18 5,64
Water boiling 4,91 4,36 2,27 3,09 2,36

CHALMERS, Civil and Environmental Engineering, Master’s Thesis 2010:157 20
3.2 CATT-Acoustic
The rooms to be auralized were designed with regards to the early reflections. The optimal case would be to change the geometry of the room to maximize the lateral reflections but since one aspect of emotional perception of rooms is dependent of possible escape routes, a change of geometry would make this estimation cumbersome. Therefore, two rooms were designed with identical shoebox shaped geometry, seen in Table 2. Instead the absorption and scattering properties of the rooms were altered. Room 1 was designed with totally absorptive ceiling, floor and wall behind the sound source. The side walls and the wall behind the receiver were designed with absorption coefficients taken from tables which represented ½ ‘’ gypsum board on 2x4 studs. Room 2 was designed to mimic an anechoic room or free-field conditions and all surfaces were consequently assigned totally absorbing properties. To eliminate flutter echo in Room 1, which could be heard in the early stage auralizations, the reflecting surfaces were given a scattering property which can be seen in Table 3, showing scattering coefficients by percent in octave bands ranging from 125 Hz to 4 kHz. The estimated reverberation time, seen in Figure 6, declares an audible difference in reverberation time between the rooms.
Table 2. Room dimensions part 1 (X = Positions with 0, 13 m increments ranging from 0, 13 m from the back wall until 6, 5 m from the back wall i.e. 0, 5 m from the source)
Width [m]
Height [m]
Length [m]
Room size 5 3 8
Source position 2,5 2 7
Receiver positions
2,5 2 X

CHALMERS, Civil and Environmental Engineering, Master’s Thesis 2010:157 21
Table 3 . Absorption and scattering properties of the rooms
Frequency [Hz]
Surface 125 500 1k 2k 4k 8k
Absorption coefficient [%]
Floor, Ceiling and Source wall
99
99
99
99
99
99
Room 1
Side walls and Listener
wall
29
10
5
4
7
9
Scattering coefficient [%]
Side walls and Listener
wall
40
40
40
40
50
60
Absorption coefficient [%]
All 99 99 99 99 99 99
Room 2 Scattering coefficient [%]
All 0 0 0 0 0 0
Figure 6. Estimated reverberation time for Room 1 and Room 2
125 250 500 1k 2k 4k 8k 16k
0.05
0.1
0.15
0.2
0.25
0.3
Frequency [Hz]
T-3
0 [
s]
Reverberation time part 1 & 2
Normal
Anechoic
CHALMERS, Civil and Environmental Engineering, Master’s Thesis 2010:157 22
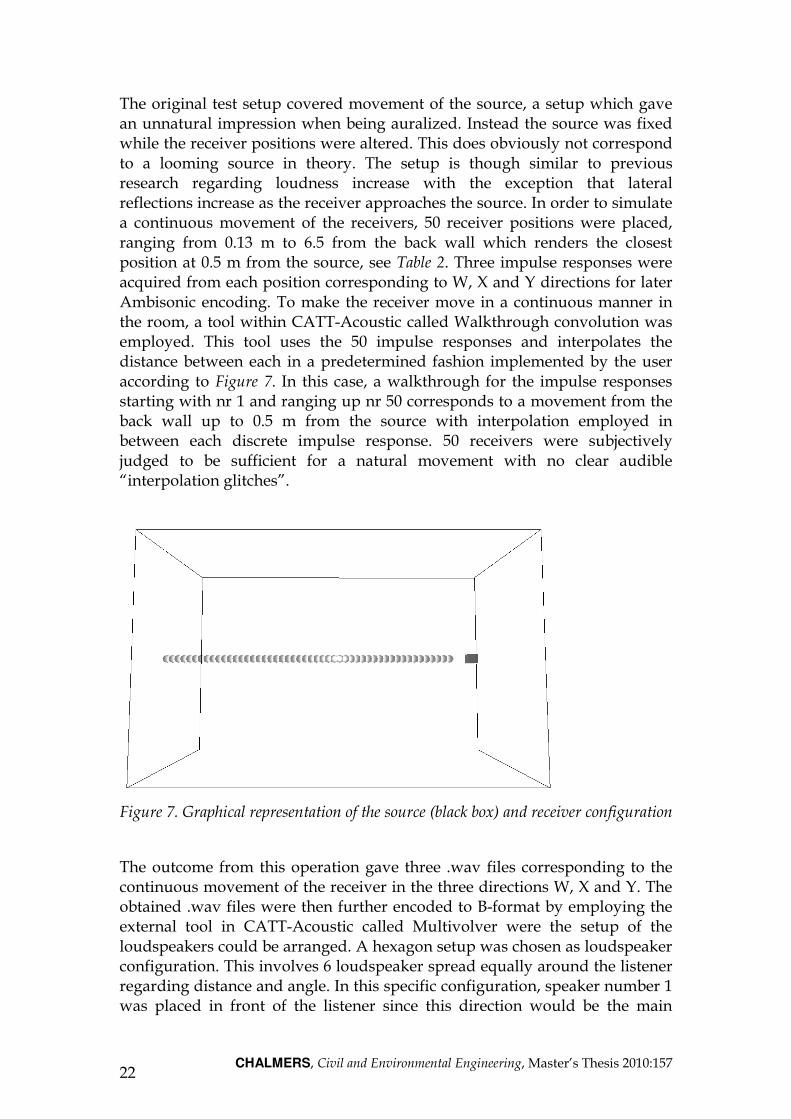
The original test setup covered movement of the source, a setup which gave an unnatural impression when being auralized. Instead the source was fixed while the receiver positions were altered. This does obviously not correspond to a looming source in theory. The setup is though similar to previous research regarding loudness increase with the exception that lateral reflections increase as the receiver approaches the source. In order to simulate a continuous movement of the receivers, 50 receiver positions were placed, ranging from 0.13 m to 6.5 from the back wall which renders the closest position at 0.5 m from the source, see Table 2. Three impulse responses were acquired from each position corresponding to W, X and Y directions for later Ambisonic encoding. To make the receiver move in a continuous manner in the room, a tool within CATT-Acoustic called Walkthrough convolution was employed. This tool uses the 50 impulse responses and interpolates the distance between each in a predetermined fashion implemented by the user according to Figure 7. In this case, a walkthrough for the impulse responses starting with nr 1 and ranging up nr 50 corresponds to a movement from the back wall up to 0.5 m from the source with interpolation employed in between each discrete impulse response. 50 receivers were subjectively judged to be sufficient for a natural movement with no clear audible “interpolation glitches”.
Figure 7. Graphical representation of the source (black box) and receiver configuration
The outcome from this operation gave three .wav files corresponding to the continuous movement of the receiver in the three directions W, X and Y. The obtained .wav files were then further encoded to B-format by employing the external tool in CATT-Acoustic called Multivolver were the setup of the loudspeakers could be arranged. A hexagon setup was chosen as loudspeaker configuration. This involves 6 loudspeaker spread equally around the listener regarding distance and angle. In this specific configuration, speaker number 1 was placed in front of the listener since this direction would be the main
CHALMERS, Civil and Environmental Engineering, Master’s Thesis 2010:157 23
direction of each sound. In this process the encoding of each sound (consisting of three impulse responses) were made to finally obtain the 6 separate .wav files corresponding to the 6 loudspeakers. The six files for each sound were then exported to Matlab and clustered in matrices generating one .wav file for each sound including six channels each, to facilitate the subsequent playback. The procedure explained above was done for both approaching and receding scenarios.
All sounds were exported to the Presentation, a software for visual and audio presentation together with data collection. A script for each test block was created including sounds to be used, times between stimuli presentation and presentation of questions.
All sounds were evaluated using the SAM scales (see Figure 3 & Figure 4) to rate their respective valence and arousal ratings. Further verbal self reports were included where the participants were asked to judge how frightening the sound was and how much the sound represented a potential threat on a 9-point scale ranging from “not at all” to “very much”.
Measurement of physiology was performed by attachment of reusable electrodes on the skin by adhesive disks. For EMG 4 mm Ag/AgCl electrodes were used while 8 mm Ag/AgCl electrodes were employed to acquire EDA response. The locations for the electrodes were first cleaned with cotton pads soaked in alcohol. The electrodes were then filled with electrode gel in order to assure conductivity. A commercial system named Biopac Systems consisting of a base module (MP150) in combination with a module for skin conductance (GSR100C) and two modules for CS and ZM (EMG100C) was used to acquire physiological responses. A separate laptop was then used for recording and monitoring of the data via the software Acqknowledge.
An M-audio FireWire 410 soundcard was employed for playback of sound where 7 channels were used. 6 channels for B-format audio presentation and 1 channel for a trigger signal, a 250 ms beep, which was intended to create the starting points for each new sound presented. This signal was sent 1 second before each sound onset to the Biopac system in order to correctly specify the starting of each sound for post-processing. Six Genelec 8030A bi-amplified monitors were used for audio presentation.
3.3 Test Procedure
The final test was performed at the Division of Applied Acoustics on Chalmers Technical University between the 12th and the 16th of April.
17 test participants were included in the test at ages between 20 and 37 years old (3 female, 14 male, mean=26, st.dev=3.7) No hearing loss was reported from any of the participants. The participants were naïve to the purpose of the study and were compensated with 2 cinema tickets for their participation.
The listening test was performed in a sound attenuated room with black cloth drapes on the walls, a sound absorbing ceiling and a concrete floor. At the

CHALMERS, Civil and Environmental Engineering, Master’s Thesis 2010:157 24
floor area closest and around the listening position a broadloom was placed in order to reduce the most pronounced reflections from the floor.
During the test, all lights were shut off except for a small LED guiding light mounted on the answering keyboard. This together with the black cloth drapes was done to suppress the feeling of the test room´s acoustic boundaries.
Loudness calibration was performed in a subjective manner by measuring sound pressure level with a sound pressure level meter at the position of the listener ear. The highest level of acceptance without generating too much of a startle effect due to excessive loudness, was subjectively set 80 dBA. All sounds were calibrated not to exceed this value.
The final listening test was subdivided into three parts:
• Part 1 covered continuously looming sources and the room acoustic influence of
approaching and receding sound sources respectively.
• Part 2 covered discretely moving sound events and the difference in emotional
response to those compared to continuously moving sound events.
• Part 3 strived to evaluate how room size influences the emotional response to sound
events.
3.4 Part 1
The main goal of part 1 was to evaluate how an increased amount of early reflections influence the emotional response when the sound source is moving towards and away from the listener. Continuously moving stimuli, which were auralized in two different rooms, were presented to the test participant. All stimuli in both rooms were played in an approaching scenario and a receding scenario. After the presentation of each stimuli the test participants had to rate their perceived emotional reaction towards the stimuli before hearing the next. Due to the embodied emotional theories, an approaching sound source will be conflicting with the emotional margin of safety while a receding sound will keep the same margin intact. The hypothesized result is a stronger emotional reaction for approaching sound sources compared to receding ones due to the threat increasing perception this will induce, hence hypothesis 1 is defined as follows:
Hypothesis 1: Approaching sounds will induce stronger emotional reactions than receding ones (Looming effect)
Due to the inherent emotional content of sounds, negative sounds should be inclined to be less influenced by the motion of the sound source compared to neutral sounds. I have chosen to express this hypothesis as “emotional headroom” which is small for negative sounds and larger for neutral sounds. The hypothesis is that larger “emotional headroom” will facilitate perception of determinants other than the emotional content of the sound. Hence hypothesis 2 is defined as:
CHALMERS, Civil and Environmental Engineering, Master’s Thesis 2010:157 25
Hypothesis 2: The emotional response to neutral sounds will be more affected by looming than negative sounds (Looming*Pleasantness effect)
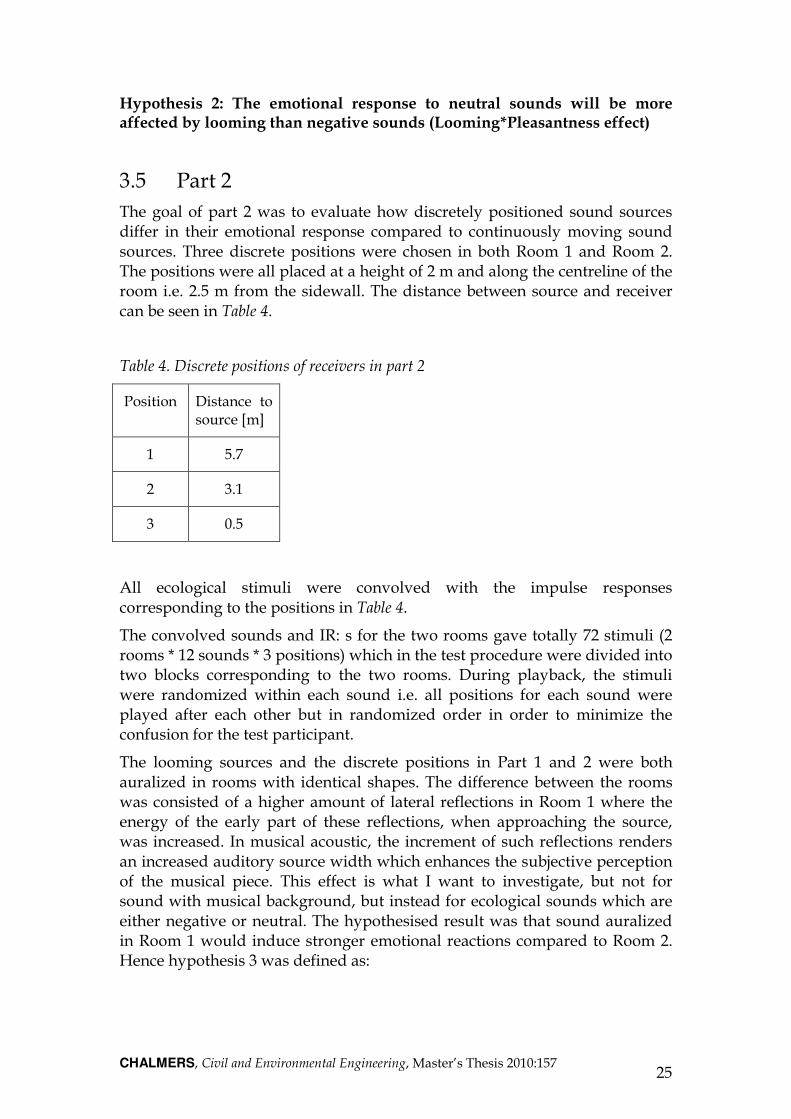
3.5 Part 2
The goal of part 2 was to evaluate how discretely positioned sound sources differ in their emotional response compared to continuously moving sound sources. Three discrete positions were chosen in both Room 1 and Room 2. The positions were all placed at a height of 2 m and along the centreline of the room i.e. 2.5 m from the sidewall. The distance between source and receiver can be seen in Table 4.
Table 4. Discrete positions of receivers in part 2
Position Distance to source [m]
1 5.7
2 3.1
3 0.5
All ecological stimuli were convolved with the impulse responses corresponding to the positions in Table 4.
The convolved sounds and IR: s for the two rooms gave totally 72 stimuli (2 rooms * 12 sounds * 3 positions) which in the test procedure were divided into two blocks corresponding to the two rooms. During playback, the stimuli were randomized within each sound i.e. all positions for each sound were played after each other but in randomized order in order to minimize the confusion for the test participant.
The looming sources and the discrete positions in Part 1 and 2 were both auralized in rooms with identical shapes. The difference between the rooms was consisted of a higher amount of lateral reflections in Room 1 where the energy of the early part of these reflections, when approaching the source, was increased. In musical acoustic, the increment of such reflections renders an increased auditory source width which enhances the subjective perception of the musical piece. This effect is what I want to investigate, but not for sound with musical background, but instead for ecological sounds which are either negative or neutral. The hypothesised result was that sound auralized in Room 1 would induce stronger emotional reactions compared to Room 2. Hence hypothesis 3 was defined as:

CHALMERS, Civil and Environmental Engineering, Master’s Thesis 2010:157 26
Hypothesis 3: For both looming and static sources, Room 1 i.e. the room with lateral reflections, will induce stronger emotional reactions than room 2 due to a perceived broader sound source.
This was hypothesized due to the fact that the reflecting walls of room 1 would increase the early lateral reflections and hence increase the ASW. This will influence the perceived width of the sound source and elicit stronger negative emotional reactions.
3.6 Part 3
The goal of part 3 was to evaluate the influence of room size on emotional response to sound. Three rooms with different dimensions were auralized. The absorption was kept constant in order to investigate the influence of room size on emotional response to sound stimuli. The same stimuli as in Table 1 were used. The room dimensions were designed in CATT-Acoustic according to Table 5.
Table 5 Room dimensions for part 3
Room Width Length Height
Small 2.5 4 1.5
Normal 5 8 3
Big 10 16 6
Within each room, the source position was kept constant and two different receiver positions were auralized. (see Table 6).
Table 6 Receiver and source positions for part 3(StR=Source to Receiver distance)
Room Position 1 (W; L; H) [m] Position 2 (W L H) [m] Source (W L H) [m]
Small 1.25; 1; 1 StR=2.5m
1.25; 2.5; 1 StR=1m
1.25; 3.5; 1
Normal 2.5; 2; 2 StR=5m
2.5; 5; 2 StR=2m
2.5; 7; 2
Big 5; 3; 2 StR=11m
5; 12; 2 StR=2m
5; 14; 2

CHALMERS, Civil and Environmental Engineering, Master’s Thesis 2010:157 27
Figure 8. Reverberation times for the three auralized rooms in part 3
Since the three rooms differed in size, the reverberation time also differed according to Figure 8. Research has shown that music and speech with high artificial reverberation times in auditory virtual environments induces more unpleasant reactions but also lower levels of experienced arousal than does medium and low reverberation times (Västfjäll, Larsson, & Kleiner, 2002). This is further validated in research by (Tajadura-Jiménez, 2008) which found that big rooms were perceived as more unpleasant than small rooms. The same study also found that this effect was valid for neutral sounds while negative sounds were moderately affected. This gave rise to the following hypotheses.
Hypothesis 4: A larger room will induce more unpleasant emotional reaction to the listener (Room effect).
Hypothesis 5: Neutral sounds will be more affected by differences in reverberation times.
125 250 500 1k 2k 4k 8k 16k
0.1
0.2
0.3
0.4
0.5
0.6
0.7
0.8
0.9
1
Frequency [Hz]
T-3
0 [
s]
Reverberation time part 3
Big
Midsize
Small

CHALMERS, Civil and Environmental Engineering, Master’s Thesis 2010:157 28
4 Results After acquiring the data from the test, the self reported ratings were exported to Matlab where data arrangement was made for further submitting to the software SPSS and repeated measures analyses of variance (ANOVA) was conducted. The factors of the ANOVA differed depending on which part to analyze. Part 1 had the within-participant factors of Room (lateral reflections vs. anechoic), Looming (approaching vs. receding) and Pleasantness (negative vs. neutral). The factors of part 2 and part 3 were Room, Position and Pleasantness. The outcome was analyzed regarding significance and significant main effects and interactions can be seen for the respective part in the following section.
The recordings from the physiology acquisition was exported to Matlab and filtered in order to extract the relevant data. The EDA signal was band-pass filtered between 0.2-2.5 Hz in order to eliminate changes in tonic level and eventual electrical noise. Data scored in this way has a lognormal distribution, hence the logarithms has to be taken of the data in order to reduce the data to a normal distribution.
The EMG signal was band-pass filtered between 10-400 Hz to remove conscious facial movement and electrical noise. A moving average filter was then applied to further extract the relevant information. The average activity during one second prior to sound onset is used as a baseline which later is subtracted from the measured activity after sound onset. Data was recorded for 7 seconds since this was the approximate length of all stimuli. The exact length differs some due to the nature of the ecological sounds and the temporal behavior which could influence the meaning of the sound if being abruptly cut. All physiology data was further normalized (z-scored).
4.1 Part 1
Pleasantness effect
The first parameter to explore is whether the sounds had different emotional content as intended during the design process. The results from the ANOVA can be seen in Table 7 and Table 8. The results show a significant effect of pleasantness as intended for all self reported measures as can be seen by the mean ratings in Table 9. For physiology, EDA is the only significant measure. All self reported measures clearly indicate that the negative stimuli have a more negative emotional content. This is further supported by the EDA which indicates a more arousing perception of negative sounds. The desired effect with a clear difference between the two groups of stimuli with different emotional content seems to be reached.

CHALMERS, Civil and Environmental Engineering, Master’s Thesis 2010:157 29
Table 7. ANOVA results for self reported pleasantness effect
Measure Valence Arousal Fear Threat
F-value 67.303 42.478 79.104 109.695
Significance 0.0 0.0 0.0 0.0
Table 8. ANOVA results for physiology for pleasantness effect
Measure CS ZM EDA
F-value 0.832 1.017 11.049
Significance 0.376 0.329 0.005
Table 9. Mean values of self reported pleasantness ratings
Pleasantness Valence Arousal Fear Threat
Negative 6.816 6.495 5.578 5.147
Neutral 4.848 4.728 3.711 3.397
Room effect
The ANOVA of the measured data shows no significant main effect of different rooms on either of the self reported or physiology measures.
Room * Pleasantness interaction
The ANOVA showed a marginally significant effect of rooms on pleasantness for arousal (F=3.51; p=0.079) among the self reported measures. No significant effect of rooms on pleasantness was to be found for physiological measures.

CHALMERS, Civil and Environmental Engineering, Master’s Thesis 2010:157 30
Figure 9. Room and pleasantness interaction for self reported ratings. Room 1 is shown to the left and Room 2 to the right for the respective measure.
The self reported ratings plotted in Figure 9, indicates that neutral sounds are considered more arousing in the anechoic room. To see the effects more clearly and see if there are any outliers in the data, Figure 10 below shows the behaviour of the room and pleasantness interaction by separate sounds. While the negative sounds, which are grouped to the left in the graph, shows a rather fluctuating behaviour in room differences, the neutral sounds, grouped to the right in the graph, shows a general tendency of being more arousing in room 2. The differences are rather small but for the neutral sounds, the effect is consistent over all stimuli.
Figure 10. Arousal room pleasantness effect by sound
Valence Arousal Fear Threat3
3.5
4
4.5
5
5.5
6
6.5
7
Self report
Ratings
Self reported Room and Pleasantness interaction
Negative
Neutral
Dog Tiger Baby WomanEKG Car Cow Hen Breath Heart Knife Water3.5
4
4.5
5
5.5
6
6.5
7
7.5
Sounds
Ratings
Arousal Room effect of Sound
Room 1
Room 2
NeutralNegative

CHALMERS, Civil and Environmental Engineering, Master’s Thesis 2010:157 31
Looming effect
There is a significant looming effect in the self report for valence (F=5.269; p=0.036), fear (F=6.117; p=0.025) and threat (F=6.812; p=0.019). For these measures, the approaching scenario is showing the highest ratings seen in Table 10.
Table 10. Mean values of self reported looming effect
Looming Valence Fear Threat
Approaching 5.9485 4.7819 4.4877
Receding 5.7157 4.5074 4.0564
Looming*Pleasantness interaction
There are significant effects for CS (F=5.484; p=0.033) and arousal (F=6.818; p=0.019).
Figure 11. Looming and pleasantness interaction for self reported ratings. Approaching sounds to the left and receding sounds to the right for all measures
Figure 11 shows the arousal ratings indicating that neutral stimuli are perceived more arousing when they are approaching compared to receding, while there is no such substantial arousal difference for negative stimuli. Hence, the difference between negative and neutral stimuli is more affected in the receding scenario. For the CS effect seen in Figure 12, negative stimuli are perceived more unpleasant when approaching while neutral sounds are
Valence Arousal Fear Threat3
3.5
4
4.5
5
5.5
6
6.5
7
Self Report
Ratings
Selfreport Looming and Pleasantness interaction
Negative
Neutral

CHALMERS, Civil and Environmental Engineering, Master’s Thesis 2010:157 32
perceived as more unpleasant when receding. The difference between negative and neutral stimuli is more affected by the approaching scenario.
Figure 12. Looming and pleasantness interaction for CS
Room*Looming interaction
Figure 13. Room looming interaction for self reported ratings. Room 1 to the left and Room 2 to the right for each measures
A marginally significant effect can be found for arousal (F=3.51; p=0.079). No physiology measures proved to be significant.
Approaching Receding-0.2
-0.15
-0.1
-0.05
0
0.05
0.1
0.15
Looming direction
Mean C
S a
ctivity (
z-s
core
)
Looming*Pleasantness physiology
Negative
Neutral
Valence Arousal Fear Threat4
4.2
4.4
4.6
4.8
5
5.2
5.4
5.6
5.8
6
Self report
Rating
Room*Looming selfreport
Approaching
Receding
CHALMERS, Civil and Environmental Engineering, Master’s Thesis 2010:157 33
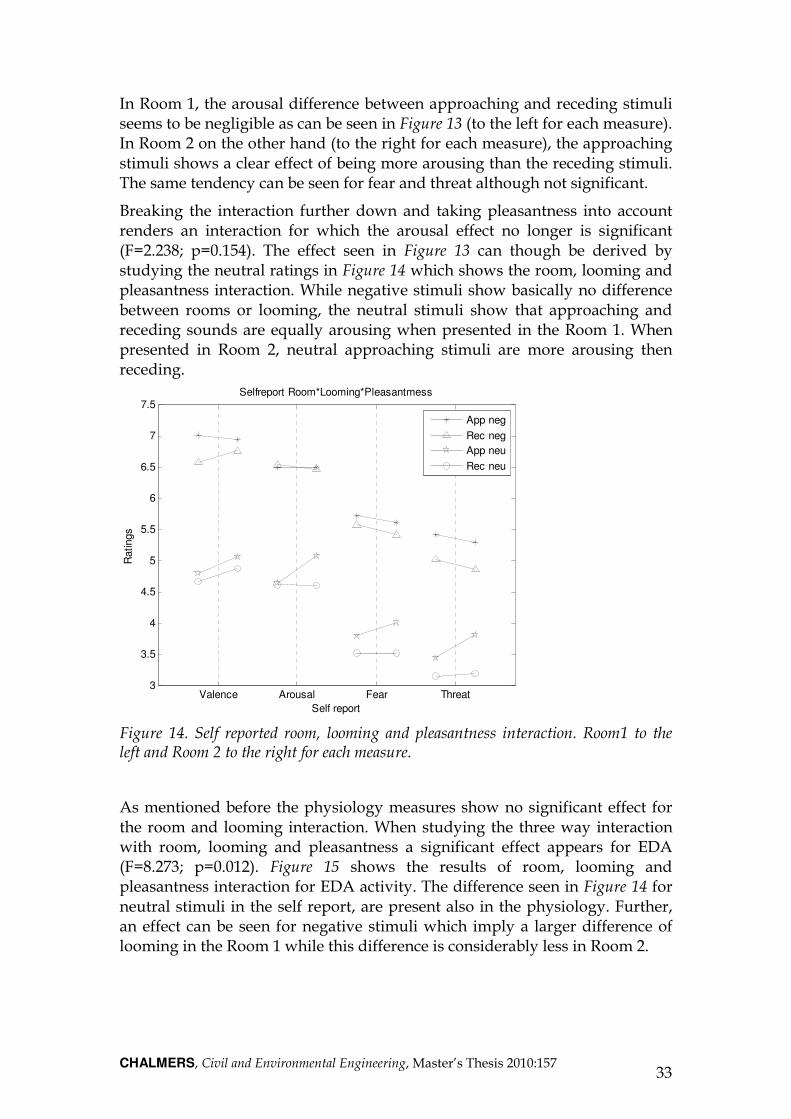
In Room 1, the arousal difference between approaching and receding stimuli seems to be negligible as can be seen in Figure 13 (to the left for each measure). In Room 2 on the other hand (to the right for each measure), the approaching stimuli shows a clear effect of being more arousing than the receding stimuli. The same tendency can be seen for fear and threat although not significant.
Breaking the interaction further down and taking pleasantness into account renders an interaction for which the arousal effect no longer is significant (F=2.238; p=0.154). The effect seen in Figure 13 can though be derived by studying the neutral ratings in Figure 14 which shows the room, looming and pleasantness interaction. While negative stimuli show basically no difference between rooms or looming, the neutral stimuli show that approaching and receding sounds are equally arousing when presented in the Room 1. When presented in Room 2, neutral approaching stimuli are more arousing then receding.
Figure 14. Self reported room, looming and pleasantness interaction. Room1 to the left and Room 2 to the right for each measure.
As mentioned before the physiology measures show no significant effect for the room and looming interaction. When studying the three way interaction with room, looming and pleasantness a significant effect appears for EDA (F=8.273; p=0.012). Figure 15 shows the results of room, looming and pleasantness interaction for EDA activity. The difference seen in Figure 14 for neutral stimuli in the self report, are present also in the physiology. Further, an effect can be seen for negative stimuli which imply a larger difference of looming in the Room 1 while this difference is considerably less in Room 2.
Valence Arousal Fear Threat3
3.5
4
4.5
5
5.5
6
6.5
7
7.5
Self report
Ratings
Selfreport Room*Looming*Pleasantmess
App neg
Rec neg
App neu
Rec neu

CHALMERS, Civil and Environmental Engineering, Master’s Thesis 2010:157 34
Figure 15. Room, looming and pleasantness interaction for EDA activity
4.2 Part 2
In the next block the participants were to judge sound that was auralized in three discrete positions of the room. No looming is considered, but instead the positions are played back to the test participant in randomized order. This was made with the intention that each position should be evaluated independent of last position.
This part of the research is meant to try to give answers to what the reasons are that makes the results in part 1. For example, is the motion, where we easily anticipate the direction, the main contributor to our experience or is the reason for our emotional state the actual momentarily position of the source? The rooms are the same as in part 1 of this thesis, see section 3.2. Hence no loudness calibration between rooms was made.
Room effect
The main room effect for part two shows a significant effect for fear (F=7.952, p=0.012) and threat (F=6.905, p=0.018), seen by mean values in Table 11, implying a more fearful and threatening perception of Room 1.
Table 11. Mean values for self reported room effect for part 2
Looming Fear Threat
Approaching 4.3693 4.0278
Receding 4.1078 3.8121
Normal Anechoic
-0.2
-0.1
0
0.1
0.2
0.3
0.4
Rooms
ED
A (
z-s
core
)
EDA Room*Looming *Pleasantness
App neg
App neu
Rec neg
Rec neu

CHALMERS, Civil and Environmental Engineering, Master’s Thesis 2010:157 35
Room*Position effect
Displaying the room effect by discrete steps in each of the rooms leads to the interaction between room and position. This interaction is significant for arousal (F=3.22; p=0.053). The arousal ratings over position can be seen in Figure 16. The difference in ratings between the rooms seems to change as the distance to the source is decreased. Room 2 is rated less arousing for position 1 and 2 but more arousing for position 3.
Figure 16. Room and position interaction for arousal
The physiology results in Figure 17, of this interaction gives a significant effect for CS (F=5.083, p=0.013). Disregarding position 1, the CS activity correlates fairly well with the arousal ratings. At position 2, the Room 2 is considered less arousing. For position 3 though, a shift in activity is occurring implying a more arousing perception of the anechoic room for this position.
Pos 1 Pos 2 Pos 34.5
5
5.5
6
6.5
7
Positions
Ratings
Arousal Room and Position interaction
Room1
Room2

CHALMERS, Civil and Environmental Engineering, Master’s Thesis 2010:157 36
Figure 17. Room and position interaction for CS activity
Room*Position*Pleasantness
There is a marginally significant interaction for valence (F=2.664, p=0.085) plotted in Figure 18. The interaction effect seems to be that at far distances the emotional response difference between the respective rooms is dependent of pleasantness. The room difference for neutral stimuli shows fluctuating emotional response over positions but with small differences. The negative stimuli however, shows a tendency of being perceive as more unpleasant in room 1 at position 1, then virtually no emotional difference at position 2, followed by a more unpleasant emotional response in the anechoic room for position 3.
Figure 18 Room, position and pleasantness effect on valence ratings
Pos 1 Pos 2 Pos 3-0.2
-0.1
0
0.1
0.2
0.3
0.4
0.5
Positions
Mean C
S a
ctivity (
z-s
core
)
CS Room and Position interaction
Room1
Room2
Pos 1 Pos 2 Pos 34
4.5
5
5.5
6
6.5
7
7.5
8
Positions
Ratings
Valence Room*Position*Pleasantness effect
Room1 neg
Room1 neu
Room2 neg
Room2 neu

CHALMERS, Civil and Environmental Engineering, Master’s Thesis 2010:157 37
4.3 Part 3
As mentioned in section 3.6, the last part was intended and designed to evaluate the difference in emotional perception between different sizes of rooms. The approach was simply to design three rooms which had the same properties regarding absorption and shape but differed in size. All sounds previously mentioned were then auralized in two positions for each room. One at a far field distance were the direct sound from the sound source would be less prominent and one position which would have a clear dominance of direct sound. The dimensions of the three rooms auralized can be seen from Table 5 where the two positions in each room can be seen as well.
Pleasantness effect
The two kind of pleasantness of stimuli was also tested to see if the desired effect was achieved. The ANOVA shows a clear significant effect of pleasantness over all parameters except EDA seen in Table 12 and Table 13. All measures indicate a stronger unpleasant perception of negative sounds as can be seen by mean values in Table 14 and Table 15. Although not a significant measure for this interaction the EDA activity is in the anticipated direction with negative stimuli showing the higher activity.
Table 12. ANOVA results for self reported pleasantness effect in part 3
Measure Valence Arousal Fear Threat
F-value 76.792 81.992 108.618 125.044
Significance 0.0 0.0 0.0 0.0
Table 13. ANOVA results for physiological pleasantness effect in part 3
Measure CS ZM EDA
F-value 13.385 4.859 0.359
Significance 0.002 0.042 0.557
Table 14. Mean values of self reported pleasantness ratings for part 3
Pleasantness Valence Arousal Fear Threat
Negative 7.417 6.998 5.659 5.364
Neutral 5.219 4.825 3.291 3.095

CHALMERS, Civil and Environmental Engineering, Master’s Thesis 2010:157 38
Table 15. Mean values of physiology activity for pleasantness effect in part 3
Pleasantness CS ZM EDA
Negative 0.124 0.057 0.031
Neutral -0.124 -0.057 -0.031
Room effect
A marginally significant effect could be seen for EDA (F=2.623, p=0.088). The reason for this effect is rather clear when studying the loudness differences between the rooms seen in Figure 19. Plotting the loudness derived from the averaged loudness values of the respective rooms for all stimuli, seen in Figure 20 gives an explanation to the odd behaviour of the EDA response.
Figure 19. Main room effect in part 3 for EDA
Figure 20. Loudness for all rooms in part 3
Big Normal Small-0.06
-0.04
-0.02
0
0.02
0.04
0.06
0.08
Room
ED
A (
z-s
core
)
Room effect EDA
Big Normal Small
91
91.2
91.4
91.6
91.8
92
92.2
92.4
Room
Loudness [
sone]
Loudness

CHALMERS, Civil and Environmental Engineering, Master’s Thesis 2010:157 39
Obviously the loudness is not in conformity with the intended loudness behaviour. The normal room has the highest loudness values which should be seen in the small room. This seemingly erroneous behaviour will reveal some interesting effects as can be seen in later discussions.
Position effect
The positions in this part consist of 2 discrete positions in each room. The main effect of the positions shows that there was a clear distinction between the positions for the self reported ratings seen in Table 16.
Table 16. ANOVA results for position effect
Measure Valence Arousal Fear Threat
F-value 31.013 42.448 38.577 71.032
Significance 0.0 0.0 0.0 0.0
With position 1 being the farthest and position 2 being the closest, there is a clear effect that closer position of the sound source induces more negative emotions for the participants, seen by the respective mean values in Table 17.
Table 17. Mean values of self reported ratings for position effect
Position Valence Arousal Fear Threat
Position 1 6.128 5.65 4.27 4.00
Position 2 6.508 6.173 4.68 4.459
Room*position
The most prominent result from part 3 is found for the room and position interaction. As seen in Table 18, all self reported measures are clearly significant
Table 18. ANOVA results for self reported room and position interaction
Measure Valence Arousal Fear Threat
F-value 4.562 8.274 7.175 6.353
Significance 0.018 0.001 0.003 0.005

CHALMERS, Civil and Environmental Engineering, Master’s Thesis 2010:157 40
Figure 21. Room and position interaction for self reported ratings. Each measure shows position 1 to the left and position 2 to the right.
As seen in Figure 21, the big room has the largest differences between positions of all parameters. For all measures, the changes then decreases in proportion to the room sizes with the small room showing the least emotional difference between positions in the room. This is a rather expected behaviour since the corresponding movement of the listening position is bigger as well.
Valence Arousal Fear Threat3.5
4
4.5
5
5.5
6
6.5
7
Selfreport
Ratings
Self reported Room and Position interaction
Big
Normal
Small

CHALMERS, Civil and Environmental Engineering, Master’s Thesis 2010:157 41
5 Discussion Hypothesis 1: Approaching sounds will induce stronger emotional reactions than receding ones (Looming effect)
Hypothesis 2: Hypothesis 3: The emotional response to neutral sounds will be more affected by looming than negative sounds (Looming*Pleasantness effect)
Hypothesis 3: For both looming and static sources, Room 1 i.e. the room with lateral reflection, will induce stronger emotional reactions than room 2 due to a perceived broader sound source.
Hypothesis 4: A larger room will induce stronger emotional reactions to the listener.
Hypothesis 5: Neutral sounds will be more affected by differences in room size.
Hypothesis 1 can be supported due to the main looming effect where approaching sound sources clearly were perceived as more unpleasant, fearful and threatening than receding ones. A significant effect for arousal also indicates a larger difference for neutral sounds when altering looming direction compared to negative sounds which are visually unaffected in arousal when varying looming directions. This indicates that the arousal ratings supports hypothesis 2. Physiology activity shows though a more unpleasant perception for approaching negative sources while no significant effect of looming could be seen for neutral sounds in physiology.
No effect of the intended auditory source width on emotional reactions could be found. The main room effect for part 2 which was found can be due to loudness differences at positions far away from the source. This means that hypothesis 3 has to be rejected for this test setup.
No main room effect was found for looming sources while this was the case for static sources. Since the test rooms are equal for part 1 and part 2, the continuous motion of looming sources seems to impede other emotional determinants hence; an emotional bias seems to exist for continuously moving sources which makes it emotionally prioritized.
The room size is clearly influential on emotional reactions to sound. At listening positions with an equal loudness, three different room sizes were compared which showed that large rooms are perceived as more unpleasant, arousing, fearful and threatening supporting hypothesis 4.
Further, hypothesis 5 cannot be supported even if neutral sounds seem to be more influenced by room size than negative sounds since the result is only marginally significant.

CHALMERS, Civil and Environmental Engineering, Master’s Thesis 2010:157 42
5.1 Pleasantness effect
The desired emotional effect of the chosen stimuli seems to be reached. The ANOVA results show a clear significant effect of pleasantness. This can be seen in the self report and physiology which clearly reveals a more negative impression of negative stimuli compared to neutral stimuli. This is valid for all parts of this thesis.
5.2 Effect of lateral reflections
The first hypothesis of part 1, i.e. the room with lateral reflections would induce higher negative emotions to the listener due to an increased apparent source width can be rejected in part 1. No significant effect was found for either self report or physiology.
For part 1, the ANOVA showed a significant three-way interaction of room, looming and pleasantness for EDA indicating a more arousing perception of approaching negative sounds in Room 1. Even though not significant, the tendency of negative sounds showing stronger emotional reactions when approaching in Room 1 is consistent with the self reported fear and threat ratings as well.
The self reported room and pleasantness interaction showed no such significant effect for negative sounds but a marginally significant interaction indicated a moderate difference in induced arousal between rooms for negative sounds while neutral sounds are more affected by the room manipulations. The room and looming interaction which also should be seen as marginally significant showed that the dissimilarity mainly lies within approaching sounds. Following the interaction further and including pleasantness in the interaction, seen in Figure 14, shows that neutral approaching sounds are mainly responsible for the effect. The same tendency for neutral sounds can be seen for fear and threat as well. Particularly the ratings for approaching neutral sounds seem to diverge, being perceived as more unpleasant in anechoic environment. This seems to correlate with the same significant effect for EDA which also shows larger difference between approaching and receding scenarios for neutral sounds in the anechoic room. Consequently, neutral sounds seem to be more affected by differences in the acoustic environment. A possible explanation to why larger differences can be seen for neutral stimuli could be that more of acoustical cues are being processed for neutral stimuli since less attention could be paid to the stimuli and more attention to the surrounding acoustic environment.
In part 2 where static sources were presented instead of continuously moving sources, a significant main room effect appears, indicating that Room 1 is considered more fearful and threatening. Studying the interaction between room and position it is rather evident that this perceived difference of rooms is due to loudness change which, at position 1 and 2, is clearly audible. Since the analyzed rooms of part 1 and part 2 are exactly the same, the question arises why no main room effect is seen for scenario with looming sources.

CHALMERS, Civil and Environmental Engineering, Master’s Thesis 2010:157 43
A disparity in spatial perception can be indicated which differs with regards to if the source is static or continuously moving. It seems that continuously moving sources renders a bias in the emotional processing which inhibits the evaluation of spatial and physical cues i.e. our emotional evaluation of the situation is linked to the motion of the source, leaving the impression of the room acoustics to a lower emotional importance.
A large contributor to emotional reactions when considering sound is the loudness. Since the absorption of the rooms is different the loudness of the sound when auralized needs to be analyzed to be able to make meaningful conclusions. The loudness difference between the two rooms for each position, seen in Figure 22, shows that at position 1 and 2, which corresponds to the farthest positions, the loudness difference is substantial. At position 1 though, the loudness difference is negligible. The loudness behaviour correlates also well with the emotional responses in Figure 16.
Figure 22. Loudness difference between positions in the auralized rooms for part 2
What differentiates part 1 and 2 is the ability to predict the motion of the source and a time to contact for continuously moving sources. A source in motion will be seen as a threat when approaching and the listeners focus must be tied to the motion of the source in order to update for eventual changes in direction. Even if receding sources are perceived less threatening, the direction of the source could still change whereupon focus still has to be paid to the source. The acoustic surrounding is maybe then of second interest while for static sources, there is no motion and hence more focus could be paid to the acoustic surrounding. While position 3 is very close to the source and should constitute a threat regardless of motion or not, position 1 and position 2 is probably responsible for the room difference since the distance to
Pos 1 Pos 2 Pos 370
75
80
85
90
95
Positions
Loudness [
sone]
Loudness for room and position
Room 1
Room 2

CHALMERS, Civil and Environmental Engineering, Master’s Thesis 2010:157 44
the source is larger which is less threatening more focus can be paid to the acoustics. Since the loudness difference between the rooms is rather large and definitively audible for these positions, the room difference for static sources could most probably be due to this loudness difference.
If explaining the room effect seen for static sources by loudness difference, this difference is present in part 1 as well. So why is there no room effect in part 1? One possible explanation would be that sounds presented with a continuously increasing loudness tend to be evaluated with regards to its terminal loudness (Teghtsoonian, Teghtsoonian, & Canévet, 2005). Since the terminal loudness is approximately equal for both rooms, see Figure 22, no differentiation between the rooms can be done. This phenomenon for increasing loudness is applicable for decreasing loudness as well but not nearly as potent as in the case of increasing loudness (Teghtsoonian, Teghtsoonian, & Canévet, 2005). The other possible explanation would be a bias in emotional processing for sources in continuous motion which suppresses the ability to emotionally evaluate spatial determinants.
When presenting the source motion by discrete steps instead of in a continuous manner, the differences between rooms becomes obvious. As mentioned before, this difference can be explained by an increasing loudness difference when moving away from the source due to the increase of loudness from reflected sound in Room 1. The loudness difference between the two rooms for each position, seen in Figure 22, shows a similar pattern to the emotional response in Figure 16. At position 1 and 2, which corresponds to the farthest positions, the loudness difference is considerably larger which affects the emotional response. At position 1 though, the loudness difference is negligible. Hence, the higher arousal rating in the room 2 for this position can be derived from something else than loudness difference. When comparing position 1, where the direct sound is very prominent, the loudness difference between the rooms is negligible rendering a more arousing perception of Room 2. No other explanation than a novelty effect was found for this perception i.e. the anechoic conditions is a new and unfamiliar environment which influences emotional reactions. The emotional response for position 1 is further supported by the CS activity seen in Figure 17, which indicates a more unpleasant perception in the anechoic room for position 3. Since the loudness difference is a highly affective and influential parameter and that position 3 shows a more unpleasant perception of the anechoic room, hypothesis 1 can be rejected. A more appropriate setup to examine the effect of ASW on emotional response would be to loudness calibrate the sounds in their respective environment and exclude anechoic conditions from the test environments. As for part 1, there is a difference in perception depending on pleasantness. Even though only an observable trend, the tendency is that neutral sounds are less influenced by the loudness difference between rooms. The shift as the discrete positions are approaching the source is though present for both negative and neutral sounds.
CHALMERS, Civil and Environmental Engineering, Master’s Thesis 2010:157 45
5.3 Looming effect
Neuhoff found that rising intensity tones are judged as having a greater loudness change than falling intensity tones and argues that if the auditory system is to provide advance warning of looming auditory motion, then a bias for rising intensity would serve this purpose well (Neuhoff, 2001). The main effect of looming for this thesis supports this theory that approaching auditory motion elicits stronger emotional reactions than receding auditory motion.The effect of looming is indisputable that approaching sources induces more negative emotions than receding sources. For threat and to some extent fear this effect is especially large which relates well to the embodied emotional theory since the margin of safety for these sound events should be perceived as violated. Thus, hypothesis 2 can consequently be supported.
The main looming effect proved to be significant where approaching sound sources clearly were perceived as more unpleasant, fearful and threatening than receding ones. A significant effect for self reported arousal also indicates a larger difference for neutral sounds when altering looming direction compared to negative sounds which are visually unaffected in arousal when varying looming directions. A possible reason for this effect could be the increase in emotional content which is induced when a sound is approaching compared with receding. For example, the sound of a male breathing, which was rated as neutral in the initial listening test, is probably perceived as less arousing than an approaching male breathing sound. For negative sounds though, the emotional content of the sound is kept constant independent of direction of looming, a tiger means danger at 5 m distance independent of how it is moving. The “emotional headroom” is too small. It is also important to remember that a high arousal rating does not have to imply a negative perception. Instead the neutral sounds can be seen as being perceived as more positively arousing when approaching.
Previous research has found that there was a large effect of looming for unpleasant sounds while neutral sound were almost unaffected and positive sounds were judged as more pleasant and less arousing when approaching compared to receding (Tajadura-Jiménez, 2008). A similar difference can be seen in the CS activity interaction, where neutral sounds are considered more unpleasant when receding than approaching, although less arousing. Negative sounds show a clear effect of being more unpleasant when approaching
The CS activity does partly contradict with the self reported responses. According to CS activity, negative sounds are perceived more unpleasant when approaching while the neutral sounds is perceived as more unpleasant when receding. Even if not significant, the perception of negative sounds can be supported by the self reported valence, fear and threat ratings which show the same pattern. This would mean that negative sounds is perceived as more

CHALMERS, Civil and Environmental Engineering, Master’s Thesis 2010:157 46
intimidating when approaching except for arousal level which is virtually unaffected by looming direction. The CS activity for neutral sounds does not correlate at all with the self reported valence ratings. The significant CS activity together with the significant self reported arousal would indicate that neutral sounds are perceived as more unpleasant but less arousing when receding implying an emotional sadness. This could be explained by the sound selection for example the “crying baby”. A crying baby which is receding could induce strong feeling of helplessness and indirectly a feeling of sadness. This does further implicate a more positive arousing perception of approaching neutral stimuli as indicated when combining the self reported arousal ratings and CS activity in Figure 11 andFigure 12. This can possibly be explained by the selection of stimuli. Some neutral sounds could have such inherent meaning that the effect of looming gives a non intended meaning to the sound. For example the sounds “heartbeat” could, when receding, be interpreted as a heart slowly fading out implying a human slowly dying which typically would be rated with unpleasantness and low arousal. This could also be the fact for the “breath” sound. Due to the consistency of the self reported ratings for neutral sounds, the CS activity for neutral sounds will be considered as an artefact of the test setup. Hypothesis 2 can therefore be rejected since the results show the opposite behaviour than hypothesized. Hypothesis 2 can though be conformed to arousal where neutral sounds seem to be more affected by looming than negative sounds.
5.4 Effect of Room Size
The room size is clearly influential to emotional reactions to sound. At listening positions with an equal loudness, three different room sizes were compared which showed that large rooms are perceived as more unpleasant, arousing, fearful and threatening.
The loudness changes in the rooms were not calibrated with regards to each other hence; the longer distance between the receiver positions in the bigger room gives a larger loudness change between positions in this room compared to the other rooms. The difference in emotional reaction between the positions in the respective room could also be explained for this reason. To see if the changes in induced emotions that were reported are due to the room differences or simply because of loudness differences, the loudness are calculated and displayed in Figure 23.

CHALMERS, Civil and Environmental Engineering, Master’s Thesis 2010:157 47
Figure 23. Loudness difference between positions in the auralized rooms for part 3
The expected loudness behaviour would be a larger loudness difference when increasing the room size. This can be seen for the big and small rooms. The normal room shows higher loudness for both positions compared to the small room but with such small difference that the perceived audible difference can be neglected. The change in loudness by position is consequently greater for the big room compared to the normal and small room. This is reflected also in the self reports were the big room has the largest emotional difference over positions. At position 2, the loudness in the normal room is also almost identical with the big room. The overall difference in loudness is though small and can be argued to influence the emotional reactions to any greater extent especially for position 2.
Loudness is clearly influencing the emotional response which can be seen for the big room at position 1. The loudness difference compared to the normal and small room at this position is too large whereupon the big room is showing lower ratings in all measures for this position. For position 1 where the listening positions deviated substantially in distance, the small room was considered the most intimidating. The loudness difference between the small and normal room can be seen as negligible whereupon the quite small but consistent ratings of the small room as being the most arousing, fearful or frightening at position1 cannot depend solely on loudness. It could though be explained by difference in perceived distance to the source. The listening position in the small room is situated at half the distance compared to the normal room. Further, the distance to reflecting walls are also less. Hence the amount of direct sound is larger for the small room compared to the midsized room even though equal loudness. This could be a possible explanation to the
Pos 1 Pos 288.5
89
89.5
90
90.5
91
91.5
92
92.5
93
93.5
Positions
Loudness [
sone]
Loudness for room and position
Big
Normal
Small

CHALMERS, Civil and Environmental Engineering, Master’s Thesis 2010:157 48
consistent stronger emotional responses in the small room. A coupled explanation has to do with the ASW. Less distance to the side walls combined with a closer distance to the source renders higher energy in the lateral reflections which could alter the perceived auditory source to a broader impression which further could elicit stronger emotional reactions.
For position 2 where the loudness is the same for all rooms there is clearly a shift in emotional responses implying a more intimidating perception of the big room. An impression of a large surrounding space is consequently perceived as a more fearful and threatening environment which supports hypothesis 4. This does not relate to the embodied emotional theory where the margin of safety is considered the main trigger to emotional reactions since the possible escape routes would be increased in a bigger room.
As can be seen in Figure 8, the reverberation time differs between the rooms due to the room size. The findings made by (Västfjäll, Larsson, & Kleiner, 2002) stated that in auditory virtually environments, higher reverberation times induced stronger negative emotional reactions then mid and low reverberation times. In this thesis these findings can be partly supported. At position 2, the most reverberant room induces the most negative emotional reactions but the same room is considered the least negative at position 1. Hence more spatial parameters are probably involved in the emotional processing of spatial cues.
The energy of the direct sound and early reflections are increasing for all rooms as the listening position gets closer to the sound source. Due to the distance to the side walls, the early reflections for the big room is considerably weaker compared the other rooms. Hence, position 2 in the big room is the only position which shows a greater energy contribution by the direct sound than the reverberant sound i.e. early and late reflections summed. The ASW, which was argued as being influencing the emotional response at position 1, seems to be of lower importance for position 2. Instead the distinct direct sound combined with a longer reverberation seems to be inducing the strongest emotional reactions.
A greater amount of direct sound, which gives the listener an impression of proximity to the source, seems to be main trigger to an increased emotional reaction. However, if no major distinction can be made regarding proximity, an increased reverberation will increase emotional reactions and render a more unpleasant emotional reaction.
When discussing in terms of temporal reflections, the difference between the rooms is the early reflections which not are as prominent for the big room as for the other rooms. The late reflections are strong enough to be audible which gives the distinct reverberation heard in auralizations of the big room. This means This increased LEV could be a possible explanation to the stronger emotional reaction in this room hence an increased feeling of being

CHALMERS, Civil and Environmental Engineering, Master’s Thesis 2010:157 49
enveloped by sound together with a sufficient amount of direct sound would elicit stronger feeling of unpleasantness, arousal, fear and threat
From an emotional viewpoint, assuming the distance to the sound source is kept constant at a close distance, a stimulus will be perceived more intimidating the larger the surrounding space is.
Past research found that the emotional response to a specific room was an interaction between the emotional valence that the listener attributes to the sound source itself and the perceived room size (Tajadura-Jiménez, 2008). It was also found that negative sounds were moderately affected by the different room size while small rooms were preferred over big rooms for neutral sounds No such significant interaction was found in this research, though a marginally significant interaction for valence (F=2.76; p=0.078) which indicates that the difference between negative and neutral sounds seem to increase when room size is decreased, seen in Figure 24, even though the difference of the mean values are rather small. A separate ANOVA of the two pleasantness factors showed that the results for the negative sounds proved to be significant while no significance was found for neutral stimuli.
Figure 24. Room pleasantness interaction for valence ratings
A general trend shows though that the emotional reaction is dependent of inherent pleasantness. In other words, neutral sounds show a greater dependence of room size with small rooms being perceived as less intimidating than big rooms, while negative sounds seems to be less affected by room size.
Big Normal Small4.5
5
5.5
6
6.5
7
7.5
8
8.5
Room
Rating
Room*Pleasantness effect
Negative
Neutral

CHALMERS, Civil and Environmental Engineering, Master’s Thesis 2010:157 50
Besides looming and room size, this difference depending on pleasantness can be seen for other self reported interactions although as strong tendencies. Room effect on pleasantness perception in part 1 for example, shows a strong tendency of arousal for neutral sounds being more influenced by room than arousal for negative sounds. The self reported room influence on looming perception shows the same tendency of being dependent of pleasantness, where a larger difference between approaching and receding sounds was found in the anechoic environment. Exploring this interaction further and considering pleasantness also, it is clear that the neutral sounds are responsible for this effect while the negative sounds are virtually unaffected by room differences. The significant three way interaction for EDA further supports the tendency of a larger difference in anechoic environment for neutral sounds.
This renders a possible conclusion that besides motion, emotional response to sound is first and foremost influenced by the inherent emotional content of the sound which is impeding the emotional processing of other determinants i.e. neutral sounds are shown to be more affected by acoustical manipulations made for the listening rooms, while negative sounds are moderately affected by the same changes.
This further emphasizes the importance of a careful sound selection when choosing stimuli for emotional acoustic tests.

CHALMERS, Civil and Environmental Engineering, Master’s Thesis 2010:157 51
5.5 General discussion
The main effect of pleasantness in part 1 and part 2 show that the sounds, in general, correspond to the designed purpose regarding emotion evoking. The self reports measures shows very large effects of the two emotions in the anticipated direction (negative sounds are negative and neutral sounds are more neutral) while physiological responses are somewhat harder to interpret. The activity over CS and EDA is in the anticipated direction while ZM shows somewhat erroneous values. This is probably due to the very nature of the ZM activity which according to (Larsen, Norris, & Cacioppo, 2003) is potentiated mainly by positive sounds. Neutral sounds on the other hand are not as good of a trigger to potentiate the ZM muscle. Negative sounds chosen for this experiment are on the extreme negative end of the pleasantness scale which induces movement of the facial muscles which do not correspond to smiling but rather to an enhanced frowning which includes the ZM muscle. As the ZM muscle is not potentiated very much by the neutral sounds, the negative sounds will then show the highest activity. For example, a woman screaming in agony potentiate the ZM muscle more than a mooing cow which implies that the ZM activity in this thesis cannot be trusted as an indicator of negative versus neutral pleasantness. This result from ZM is in this case off course a bias effect and will not be included in the final conclusion. CS is shown to be a more reliable measure which is potentiated by negative emotions and also inhibited by pleasant emotions and serves therefore as an excellent measure of valence.
EDA responses are highly affected by the startle response and should consequently be treated as rather unreliable until a proper method is developed which discretize the individual EDA activity impulses, and a clear differentiation of the startle response could be evaluated. In order to prevent the startle effect as much as possible, some kind of stimuli countdown could have been employed to notify the test participant of the sound onset.
The playback order of the sounds in block 3, 4 and 5 were not completely randomized but were instead presented in a consecutive order but with randomized order within each sound e.g. randomized position wise. It could be argued that all sounds should be presented in a random order but the reason to the chosen presentation setup was to eliminate confusion and to facilitate for the listener to hear differences between discrete positions. A pair comparison test could have been employed for part 1 where each stimulus in both rooms could have been presented in consecutive order. This could have facilitated the listener’s ability to differentiate between the rooms.
Selection of sound stimuli could also be argued about. The initial test was performed in order to derive emotional content for each selected sound. The original purpose of the sound selection was to divide the sound stimuli into three categories, animal, human and environmental. The sound evaluation was though made for static sounds played back in mono. The manipulation made regarding looming added an extra dimension of motion to the meaning of the sound. This may not pose a perception problem for animal and human

CHALMERS, Civil and Environmental Engineering, Master’s Thesis 2010:157 52
sounds but the environmental sounds might have suffered from an ambiguous perception due to motion. Especially the heart monitor and knife sound might have introduced a perceptive error when motion was involved which should have been avoided.
The emotional responses to sound events are highly dependent of age and life experience etc. Also gender affects the outcome of the initial test. The author noted a stronger reaction to the screaming woman sound from female test participants. A sound of a crying baby which is receding is most probably an unpleasant experience for a person with children of its own, while for a person with no experience with children, the sound event may instead be perceived totally different. More spread of gender and age in the listening test panel in order to get a more trustworthy result is therefore of utmost importance. The initial test for this thesis consisted of only 2 women while 3 women participated in the final test. A minority of the test panel were parents.
One question that arises is if the comparisons of the rooms are really a comparison of lateral reflections/no lateral reflections, or if the room difference could simply be seen as a non-anechoic/anechoic scenario. The room effect could possibly be influenced by the fact that room 2 is anechoic. Some reverberation could have been simulated in both rooms to inhibit the unpleasant effect that arises in anechoic rooms due to lack of reflections which renders an unnatural impression of the acoustic environment for the listener. Another approach would have been to alter the room geometry as a tool to increase/decrease lateral reflections. Once again, the current setup was chosen in order to eliminate confusion for the listener. The embodied emotional theory states that the emotional response consists of the inherent emotional response induced by the sound source, in collaboration with the surrounding environment. In terms of such parameters as possible escape ways, altering the room geometry to optimize the lateral reflections would most probably be generating artefacts in form of confused perception.

CHALMERS, Civil and Environmental Engineering, Master’s Thesis 2010:157 53
6 Conclusion When comparing looming and static sources in free-field conditions, and with reflective side walls, a difference of rooms on emotional reactions can be found for static sources but not for looming sources. The stronger reaction in the room with lateral reflections can be derived to an increased loudness in this room. The reason to why no room difference can be seen for continuous moving sources could be explained by an emotional bias for continuous motion which suppresses the perception of spatial and physical determinants.
Looming auditory motion seems to influence emotional reactions to sound in the direction of approaching sounds being perceived as more unpleasant, frightening and threatening.
The room size seems to influence emotional response to sound. The response is though dependent of position in the room and proximity to the source. When the receiver is placed in the far field in a reverberant environment, the margin of safety seems to be intact and is not so threatening. When comparing different room sizes with equal loudness for each room a more reverberant environment seems to be inducing more unpleasant reactions.
Both previous research and the findings for this thesis supports the statement that spatial cues alters the emotional response to sound. A more parametric control of emotional responses to different acoustic environment could thus enable a possibility for a sound designer to “fine-tune” the emotional response to a sound event by means of the auditory environment, especially for neutral sounds.
Applications for the findings of this thesis can for example be found in the entertainment industry were events often are presented in a 3-D manner such as movies and computer gaming. In the computer gaming business, auditory ambience is being used to further enhance the perception of being “within the game”. Spatial auditory ambiance effects of sound is a computational demanding task which can be facilitated and optimized by an adaptive procedure where less computational effort could be paid to spatial cues for negative sounds. There are applications for sound interface in the car industry which also makes use of auditory ambiance when presenting information and warning sounds and could thus benefit of this research regarding evoking attention. A high urgency warning sound which can be seen as a negative sound could for example be represented as a static sound with no added ambiance without too much performance impairment while information sounds which can be seen as neutral sounds could benefit of being continuously moving and auralized in a reflective environment.
The influence of acoustic surroundings on emotional response to sound could also be used within product sound quality especially if the surrounding environment of the product is relatively known. Additional research is then of course needed which studies the same effect but for artificial sounds if those is employed. As the car industry is more and more focused on electric cars,

CHALMERS, Civil and Environmental Engineering, Master’s Thesis 2010:157 54
which would reduce the loudness within the car compartment, the acoustic interior of the car compartment could also benefit of this research by design of an emotionally safe auditory environment.
The findings of this thesis could further be applied when designing venues specialized for recreational purposes where the perceived safeness of the listener is of importance such as health care environments. More knowledge in combination with parametric control of the room acoustic influence on emotional reactions is though crucial in order to extend the applicability to design of “custom made” auditory environments, so called soundscaping.

CHALMERS, Civil and Environmental Engineering, Master’s Thesis 2010:157 55
7 Future Work The influence of early lateral reflections could not be properly established, mainly due to a setup which created too much emotional bias by the anechoic environment. An alternative setup would be to exclude the anechoic environment and auralize two reflective rooms with equal acoustic properties regarding absorption and scattering but alter the room geometry to assure a higher amount of early reflections.
To further evaluate the influence of possible escape routes an interesting setup would be to allow the test participant to move in the room while playing looming sounds and study the motion pattern. Introducing more than one looming sound source would also force the listener to aurally evaluate a larger part of the room. In this way the influence of possible escape routes could be enhanced.
The findings of this thesis suggest that the emotional process for neutral sounds is receptive to changes in the acoustic environment. An interesting research would be to try to alter the emotional response by spatial cues i.e. create an adaptive way of altering emotion with parametric control. Studies have been made to alter the localization properties of sound with a more scary perception of sounds with an uncertain localization as a result (Ekman & Kajastila, 2009). Such an impression could be auralized by altering of the acoustic parameter clarity which is defined as the logarithmic ratio of early sound energy, arriving in the first 80 ms, to late sound energy, arriving after 80 ms. This could be performed by keeping the room size constant while altering absorption and scattering properties in order to see the effect of reflected energy on emotional response more clearly. This can be equated to an evaluation of the influence of localisation of the sound source which would be impaired when lowering the clarity. This could be further combined with sounds approaching from various angles. Further, correlation of reaction times and spatial effects could also be an interesting and relevant research topic.
The main objective for this thesis strived to examine how room acoustic interact with our emotional perception. Although the conclusion of this thesis takes the research some steps further more research is needed, partly to firmly establish the findings of this thesis but also to further examine our emotional interaction with our surrounding auditory environment.

CHALMERS, Civil and Environmental Engineering, Master’s Thesis 2010:157 56
8 References Alexander, D., Trengove, C., Johnston, P., Cooper, T., August, J., & Gordon, E. (2005). Separating individual skin conductance responses in a short interstimulus-interval paradigm. Journal of Neuroscience Methods 146 , 116–123.
Blauert, J. (1997). Spatial Hearing: The Psychophysics of Human Sound Localization. The MIT Press.
Bradley, M., & Lang, P. (1999). International affective digitized sounds (IADS):Stimuli ,instruction manual and affective ratings. Tech. Rep. No B-2. Gainesville, FL:The Center for Research in Psychophysiology, University of Florida .
Devore, J., & Farnum, N. (2005). Applied Statistics for Engineers and Scientists. Thomson Brooks/Cole.
Ekman, I., & Kajastila, R. (2009). Localisation Cues Affect Emotional Judgements – Results from a User Study on Scary Sound. Proc. AES 35th Conference on Audio for Games, February 2009, London, UK. CD-ROM.
Figner, B., & Murphy, R. (. (n.d.). Using skin conductance in judgment and decision making research. In M. Schulte-Mecklenbeck, A. Kuehberger, & R. Ranyard (Eds.), A handbook of process tracing methods for decision research. New York, NY: Psychology Press.
Griesinger, D. (1997). The psychoacoustics of apparent source width, spaciousness & envelopment in performance spaces. Acta Acustica Vol. 83 , 721-731.
Guski, R. (1992). Acoustic Tau: An Easy Analogue to Visual Tau? Ecological Psychology, 4(3) , 189-197.
Kleiner, M. (2008). Audio Technology & Acoustics. Division of Applied Acoustics, Chalmers University of Technology.
Larsen, J., Norris, C., & Cacioppo, J. (2003). Effects of positive and negative affect on electromyographic activity over zygomaticus major and corrugator supercilii. Psychophysiology, 40, 776–785 .
Neuhoff, J. (2001). An adaptive bias in the perception of looming auditory motion. Ecological Psychology, 13(2), 87-110.
Niedenthal, P. (2007). Embodying emotion. Science 316 , 1002-1005.
Russell, J. (1980). A circumplex model of affect. Journal of Personality and Social Psychology, 39(6) , 1161-1178.
Tajadura-Jiménez, A. (2008). Embodied psychoacoustics: Spatial and multisensory determinants of auditory induced emotion. Ph.D. Thesis, Chalmers University of Technology.
Teghtsoonian, R., Teghtsoonian, M., & Canévet, G. (2005). Sweep-induced acceleration in loudness change and the “bias for rising intensities”. Perception & Psychophysics, 67 (4), 699-712 .

CHALMERS, Civil and Environmental Engineering, Master’s Thesis 2010:157 57
Västfjäll, D., Larsson, P., & Kleiner, M. (2002). Emotion and Auditory Virtual Environments: Affect-Based Judgments of Music Reproduced with Virtual Reverberation Times. CYBERPSYCHOLOGY & BEHAVIOUR, Volume 5, number 1 .
Zahorik, P., Brungart, D. S., & Bronkhorst, A. W. (2005.). Auditory distance perception in humans: a summary of past and present research. Acta Acustica United with Acustica , vol. 91, pp. 409-420.

CHALMERS, Civil and Environmental Engineering, Master’s Thesis 2010:157 58
Appendix A
Listening test Evaluation of ecological stimuli
Welcome to this listening test. You will be presented with a number of different ecological sounds and after each sound you will be asked to judge the sounds from an emotional viewpoint. For each sound, I would first like you to rate your feeling towards the presented sound on the scale seen below. The upper scale shows 5 figures ranging from “sad” to “happy” and should be used to indicate if the sound has a negative or positive impact on you from an emotional viewpoint. The lower scale is an “arousal” scale which is ranging from “not activated” to “activated”. This scale should be used to indicate whether you feel calm or alert when presented with the sound. One of the circles underneath the scales corresponding to your opinion should be marked for each sound. You are not allowed to mark between the circles.
Secondly, I would like you to answer the questions according to your judgment of the sounds. Answer by putting a mark in the circles below the question. You are not allowed to mark between the circles. A final question is presented for each sound in which you are asked to identify the sound. Try to write what you think is making the sound. If you cannot identify the sound, try to explain how it sounds. You may answer either in single words or whole sentences.
Try to answer rather quickly, it is your first impression that is of importance and remember:
There is no right or wrong answers.
Thank you for your help!

CHALMERS, Civil and Environmental Engineering, Master’s Thesis 2010:157 59
Sound 1
How do you feel when you hear the sound?
How frightening is the sound to you?
Not at all 1 2 3 4 5 6 7 8 9 Very much
Does this sound represent a potential threat?
Not at all 1 2 3 4 5 6 7 8 9 Very much
How relevant do you think this sound is to evoke fear?
Not at all 1 2 3 4 5 6 7 8 9 Very much
Try to identify what you hear and write it on the line below.
………………………………………………………………………………………………………………………………………………………………
If you have any other comments, please write them on the line below.
………………………………………………………………………………………………………………………………………………………………

CHALMERS, Civil and Environmental Engineering, Master’s Thesis 2010:157 60
Appendix B
Category Pleasantness Sound Mean Valence
Mean Arousal
Mean Fear
Mean Threat
Mean Relevance
Animal
Negative
Dog 2,73 6,55 6,18 7,46 7,73
Tiger 3,18 6,09 4,91 6,46 6,82
Puma 3,64 5,91 4,46 5,00 5,73
Dober-man 3,82 5,27 4,46 5,73 5,91
Flies 2,27 7,00 5,82 7,91 7,46
Neutral
Cow 6,09 3,91 2,00 3,27 3,00
Hen 6,09 4,27 1,64 2,00 2,46
Chicken 6,73 3,18 1,36 1,36 1,36
Human
Negative
Baby 1 2,46 6,27 3,91 4,73 4,82
Baby 2 2,455 6,273 3,909 4,727 4,818
Female Scream 2,27 7,18 6,00 6,64 7,64
Heart
120 bpm 4,091 4,818 3,273 4,273 5,182
Male breath 3,636 4,818 3,364 4,727 5,636
Female Breath 3,909 5,455 4,727 4,000 5,000
Deep breath 3,727 5,000 4,364 5,545 5,818
261 (IADS) 2,545 5,727 3,545 4,091 4,091
276 (IADS) 1,636 7,273 6,455 6,818 8,182
Neutral
Heart 4,82 4,64 2,91 4,09 4,73
Run Breath 4,64 4,46 2,82 3,46 3,91

CHALMERS, Civil and Environmental Engineering, Master’s Thesis 2010:157 61
Category Pleasantness Sound Mean Valence
Mean Arousal
Mean Fear
Mean Threat
Mean Relevance
Human
Neutral
Male yawn 6,09 3,00 1,55 1,73 2,18
Female Yawn 5,55 2,64 1,00 1,00 1,00
Heart Normal 4,64 4,09 2,36 3,18 4,91
Heart 60 bpm 4,46 4,09 3,27 4, 00 5,91
Erotic breath 7,36 6,36 1,27 1,73 3,00
Fast breath 4,18 5,09 3,36 4,18 3,36
Snoring 4,18 5,00 2,36 2,27 2,73
Boy Laughter 7,73 4,46 1,36 1,27 1,46
110(IADS) 8,09 4,64 1,00 1,36 1,46
Environmental
Negative
Forest Fire2 3,82 5,00 3,36 4,27 4,27
Car Horn 2,55 6,91 5,09 6,09 6,27
Ekg failure 2,73 6,36 5,27 7,00 6,46
Ekg 1,91 7,55 5,91 7,82 7,27
Ekg combo 2,46 5,36 4,55 4,64 5,09
Ekg normal 3,36 5,00 3,82 4,64 4,91
Ekg slowing 2,64 6,00 3,64 4,36 4,27
602(IADS) 3,73 5, 00 3,91 5,82 6,82

CHALMERS, Civil and Environmental Engineering, Master’s Thesis 2010:157 62
Category Pleasantness Sound Mean Valence
Mean Arousal
Mean Fear
Mean Threat
Mean Relevance
Environmental
Neutral
Knife 4,64 4,46 3,27 5,18 5,64
Water Boil 4,91 4,36 2,27 3,09 2,36
Water Fountain 5,64 2,27 1,55 2,18 2,18
Forest Fire1 4,91 4,27 3,00 4,82 5,55
Fire 5,90 2,60 1,64 3,09 2,46
Micro-wave 5,46 2,91 1,36 1,55 1,82
Hair-dryer 4,00 4,91 2,46 2,55 3,00
Wooden clock 4,55 3,73 2,09 2,36 3,27
Respirator 4,00 4,27 3,27 3,82 3,91
Ekg Failure 3,27 4,82 3,00 3,27 3,82
721 (IADS) 7,36 4,46 1,27 1,36 1,27
Tones and noise
White noise 3,09 5,09 2,36 2,82 3,46
100Hz sine tone 4,18 3,55 2,55 2,27 2,82
500Hz sine tone 3,00 3,73 2,09 2,73 3,82
1kHz sine tone 2,46 5,55 3,00 3,09 3,18