emotion processing in female youth: testing the … · 2015; auerbach et al., 2016; hajcak et al.,...
TRANSCRIPT

OR I G I N A L ART I C L E
Emotion processing in female youth: Testingthe stability of the late positive potential
Erin Bondy1,2 | Jeremy G. Stewart1,2 | Greg Hajcak3 | Anna Weinberg4 |
Naomi Tarlow5 | Vijay A. Mittal6 | Randy P. Auerbach1,2
1Department of Psychiatry, HarvardMedical School, Boston, Massachusetts,USA2Center for Depression, Anxiety andStress Research, McLean Hospital,Belmont, Massachusetts, USA3Department of Psychology, Stony BrookUniversity, Stony Brook, New York, USA4Department of Psychology, McGillUniversity, Montreal, Quebec, Canada5Department of Psychology, University ofMiami, Coral Gables, Florida, USA6Department of Psychology, Departmentof Psychiatry, Institute for PolicyResearch, Department of Medical SocialSciences, Northwestern University,Evanston, Illinois, USA
CorrespondenceRandy P. Auerbach, Ph.D., ABPP,McLean Hospital, 115 Mill Street,deMarneffe, Room 240, Belmont, MA02478, USA.Email: [email protected]
Funding informationNational Institute of Mental Health(K23MH097786), Rolfe Fund, TommyFuss Fund (to R. P. A.)
AbstractThe Emotional Interrupt Task (EIT) has been used to probe emotion processing inhealthy and clinical samples; however, research exploring the stability and reliabilityof behavioral measures and ERPs elicited from this task is limited. Establishing thepsychometric properties of the EIT is critical, particularly as phenotypes and biologi-cal indicators may represent traitlike characteristics that underlie psychiatric illness.To address this gap, test-retest stability and internal consistency of behavioral indicesand ERPs resulting from the EIT in healthy, female youth (n5 28) were examined.At baseline, participants were administered the EIT while high-density 128-channelEEG data were recorded to probe the late positive potential (LPP). One month later,participants were readministered the EIT. Four principal findings emerged. First,there is evidence of an interference effect at baseline, as participants showed a slowerreaction time for unpleasant and pleasant images relative to neutral images, and test-retest of behavioral measures was relatively stable over time. Second, participantsshowed a potentiated LPP to unpleasant and pleasant images compared to neutralimages, and these effects were stable over time. Moreover, in a test of the differencewaves (unpleasant-neutral vs. pleasant-neutral), there was sustained positivity forunpleasant images. Third, behavioral measures and LPP demonstrated excellent inter-nal consistency (odd/even correlations) across conditions. Fourth, highlightingimportant age-related differences in LPP activity, younger age was associated withlarger LPP amplitudes across conditions. Overall, these findings suggest that the LPPfollowing emotional images is a stable and reliable marker of emotion processing inhealthy youth.
KEYWORD S
adolescents, emotion, ERPs
1 | INTRODUCTION
Emotions are complex psychological and physiological proc-esses that shape perception and understanding of the environ-ment (Dolan, 2002; Hajcak, Weinberg, MacNamara, & Foti,2012; Lang, 1984). As EEG provides excellent temporalresolution in the milliseconds range, it is an excellent tool toprobe the time course of neural responses to emotional
stimuli. An improved understanding of emotion processingis essential, as this may provide insight into deficits thatcharacterize psychiatric disorders.
Recent research exploring electrophysiological correlatesof emotion processing has focused on the late positive poten-tial (LPP). The LPP is a slow-wave ERP sensitive to emo-tional arousal that reflects elaborated attention towardaffective stimuli (Auerbach, Stanton, Proudfit, & Pizzagalli,
Psychophysiology. 2018;55:e12977.https://doi.org/10.1111/psyp.12977
wileyonlinelibrary.com/journal/psyp VC 2017 Society for Psychophysiological Research | 1 of 13
Received: 13 November 2016 | Revised: 20 June 2017 | Accepted: 11 July 2017
DOI: 10.1111/psyp.12977

2015; Auerbach et al., 2016; Hajcak et al., 2012). The LPPis larger following unpleasant and pleasant stimuli comparedto neutral stimuli (Cuthbert, Schupp, Bradley, Birbaumer, &Lang, 2000; Foti & Hajcak, 2008; Foti, Hajcak, & Dien,2009; Schupp et al., 2000). Generally, the LPP emerges asearly as 300 ms poststimulus (Cuthbert et al., 2000) andspans several hundred milliseconds to seconds (Foti & Haj-cak, 2008). The LPP is initially maximal over parietal sites(Schupp et al., 2000) and, later in its time course, often prop-agates to frontocentral regions (Auerbach et al., 2015; Foti &Hajcak, 2008). The LPP also appears to be a variant of theP300, a component that is maximal in parietal regions andemerges between 300–500 ms poststimulus (Olofsson, Nor-din, Sequeria, & Polich, 2008; Sutton, Braren, Zubin, &John, 1965). The P300, or P3, indexes increased attentiontoward salient stimuli, and, similar to the LPP, prior researchinvestigating the P300 has shown increased amplitudes foremotional relative to neutral stimuli (Hajcak, MacNamara, &Olvet, 2010; Polich & Kok, 1995). Taken together, whereasthe P300 reflects processes underlying preferential attentionto target stimuli, the longer time course of the LPP indexesprocesses related to sustained attention and encoding of emo-tional information (Dolcos & Cabeza, 2002).
Evidence from studies using emotional images showsgreater LPP amplitude during passive viewing of unpleasantand pleasant images compared to neutral images (Foti et al.,2009; Hajcak & Olvet, 2008; Weinberg & Hajcak, 2010).Although some studies have shown a larger LPP followingunpleasant relative to pleasant images (Hajcak & Olvet,2008; Kujawa, Klein, & Hajcak, 2013), this may reflect dif-ferences in the arousal ratings of the images (see Weinberg& Hajcak, 2010). Collectively, these findings suggest thatthe LPP reflects increased attention toward emotional stimuli(e.g., words, images) and, in some instances, is modulatedby valence (Auerbach et al., 2015, 2016; Speed, Nelson,Auerbach, Klein, & Hajcak, 2016).
To improve our understanding of pathophysiologicalprocesses underlying emotion processing, research hasprobed the LPP using the Emotional Interrupt Task (EIT;Mitchell, Richell, Leonard, & Blair, 2006). During the EIT,participants identify a target stimulus that is preceded andfollowed by task-irrelevant neutral, unpleasant, and pleasantimages selected from the International Affective Picture Sys-tem (IAPS; Lang, Bradley, & Cuthbert, 2008). Using theEIT, we can examine (a) behavioral measures of interferenceand task engagement, and (b) LPP as a function of stimulusvalence. In an undergraduate sample, Weinberg and Hajcak(2011a) found a larger LPP following unpleasant and pleas-ant images compared to neutral images; however, no differ-ences emerged in activity elicited by pleasant and unpleasantimages. Interestingly, the LPP following emotional imageswas associated with slower reaction times when identifying
target stimuli. Similarly, among 8- to 13-year-old children,increased LPP following pleasant and unpleasant images wasrelated to faster reaction times to targets (Kujawa, Klein, &Hajcak, 2012). In a study of at-risk youth (i.e., parental his-tory of depression), Nelson and colleagues (Nelson, Perlman,Hajcak, Klein, & Kotov, 2015) showed that parental depres-sion history was associated with attenuated LPP to neutraland emotional stimuli. Further, among healthy youth, Speedand colleagues (2015) demonstrated that higher extraversionwas associated with increased LPP to both pleasant andunpleasant images. Together, these findings suggest thatemotional stimuli result in increased LPP activity, which attimes may interfere with task performance.
In line with the Precision Medicine Initiative (Insel,Amara, & Baschke, 2015), identifying biological indicatorsthat predict treatment response is critical. Prior to testing pre-dictors, research must first examine core psychometric prop-erties, including test-retest stability (i.e., invariance overtime) and internal consistency (i.e., odd/even reliability; seeAuerbach et al., 2016; Cassidy, Robertson, & O’Connell,2012; Hess et al., 2017; Olvet & Hajcak, 2009; Tenke et al.,2017; Weinberg & Hajcak, 2011b). In research testing theEIT, Kujawa and colleagues (2013) showed 2-year stabilityof LPP amplitude in children 8 to 13 years old. At both thebaseline and follow-up assessments, there was a greater LPPfollowing pleasant and unpleasant images compared to neu-tral images, and unpleasant images elicited a greater LPP rel-ative to pleasant images. Age-related differences alsoemerged, as the LPP was maximal at occipital sites at thefirst assessment, when participants were younger, whereas theeffects were maximal in parietal electrodes 2 years later.
Together, these findings provide initial evidence for sta-bility of the LPP in a limited range of children and early ado-lescents. Further research, however, is needed to explorepsychometric properties across broader developmental peri-ods. To build on prior research, the current study examinedthe stability and reliability of behavioral indices and the LPP.Healthy, female youth aged 13 to 22 years completed a base-line and 1-month follow-up assessment. The following a pri-ori hypotheses were tested. First, consistent with prior EITresearch (Kujawa et al., 2013; Weinberg & Hajcak, 2011a),we expected that healthy youth would (a) show greater accu-racy and faster reaction times for neutral relative to pleasantand unpleasant images, and (b) exhibit greater LPP ampli-tudes to pleasant and unpleasant compared to neutral images.Second, we hypothesized that behavioral and ERP effectswould demonstrate stability (i.e., strong test-retest correla-tions) at the 1-month follow-up assessment. Last, weexpected age-related differences in LPP activity. Given priorwork demonstrating greater LPP in younger compared toolder youth (MacNamara et al., 2016), we expected thatyounger participants would demonstrate enhanced LPPs inparietal regions compared to older participants.
2 of 13 | BONDY ET AL.

2 | METHOD
2.1 | Procedure
The Institutional Review Board provided approval for thestudy. Assent was obtained from youth aged 13 to 17 years,and participants 18 years and older and legal guardians pro-vided written consent. Participants were recruited from thegreater Boston area through flyers, online advertisements,and direct mailing. Eligibility criteria included English flu-ency, right-handedness, and female sex. Exclusion criteriawere any history of psychiatric illness, psychotropic medica-tion use, organic brain syndrome, neurologic disorders, orseizures. At baseline, participants were administered a clini-cal interview assessing lifetime mental illness and a depres-sive symptom self-report measure. Within 1 to 2 weeks,participants completed the EIT while EEG data wererecorded. The mean length of time between the clinical andEEG assessment was 5.326 5.11 days. For the 1-month fol-low-up assessment, participants returned to the lab and werereadministered the self-report measure and EIT (while EEGdata were recorded). The length of time between the clinicaland EEG follow-up assessment was brief, 0.546 1.57 days.Participants were remunerated $100.
2.2 | Participants
The sample included healthy, female youth aged 13 to 22years with no lifetime psychopathology. Only female partici-pants were included to reduce heterogeneity. Thirty-threeparticipants were enrolled in the study; however, five youthwere excluded from analyses given poor EEG data quality(n5 1) and lack of follow-up EEG data (n5 4). Excludedparticipants (n5 5) and the final sample (n5 28) did not dif-fer in age, t(31)5 0.91, p5 .52, d5 0.38, race, v2(4)5 7.54,p5 .11, u5 0.48, or family income, v2(4)5 4.20, p5 .38,u5 0.37. The final sample (Mage5 17.61, SDage5 2.95)reported the following racial distribution: 21.4% Asian, 3.6%Black or African American, 64.3% White, and 10.7% morethan one race. The family income distribution included14.3% less than $10,000, 7.1% $25,000 to $50,000, 14.3%$50,000 to $75,000, 3.6% $75,000 to $100,000, 50% morethan $100,000, and 10.7% not reported.
2.3 | Instruments
2.3.1 | M.I.N.I. InternationalNeuropsychiatric Interview for Childand Adolescents (MINI-KID)
Participants were administered the MINI-KID (Sheehanet al., 2010), a structured diagnostic interview used to assessAxis I psychopathology in children and adolescents. The
MINI-KID has shown good reliability and validity (Sheehanet al., 2010). Postbaccalaureate research assistants, graduatestudents, and postdoctoral fellows administered the inter-views after receiving approximately 50 hr of training, whichincluded didactics, listening to past interviews, role play,mock interviews, and direct supervision.
2.3.2 | Beck Depression Inventory (BDI-II)
The BDI-II (Beck, Steer, & Brown, 1996) is a 21-item self-report questionnaire assessing depressive symptom severityover the past 2 weeks. Items range from 0 to 3, with higherscores indicating greater depression severity. The Cronbach’salpha for the BDI-II in the current study was 0.74 at thebaseline assessment and 0.88 at the follow-up assessment,suggesting good internal consistency.
2.4 | Experimental task
The EIT (Mitchell et al., 2006) included 60 images selectedfrom the IAPS (Lang et al., 2008): 20 neutral, 20 unpleasant,and 20 pleasant.1 According to IAPS normative adult ratings(9-point rating scale; Lang et al., 2008), pleasant imagesused were rated as more positive in valence (M5 7.51,SD5 0.51) than neutral images (M5 5.27, SD5 0.35),which were rated as more positive than unpleasant images(M5 3.09, SD5 0.76). Additionally, both pleasant(M5 5.03, SD5 0.77) and unpleasant images (M5 6.12,SD5 0.57) were rated as more arousing than neutral images(M5 2.99, SD5 0.68), though unpleasant images were ratedas more arousing than pleasant images. Images were pre-sented twice over three blocks for a total of 120 trials. Eachtrial began with a fixation cross presented for 800 ms. Then,an image was displayed for 1,000 ms, followed by a target(< or >) that was presented for 150 ms. Finally, the sameimage appeared on screen for an additional 400 ms. Partici-pants indicated whether the target arrow was pointing to theright or left by pressing the corresponding button on aresponse box. The intertrial interval was jittered between1,500 and 2,000 ms.
EIT behavioral outcomes included reaction time (RT)indexes for correct trials and overall accuracy for each stimu-lus type (pleasant, unpleasant, neutral). Previous researchindicates that RT distributions are not Gaussian (normal)
1IAPS images used. Practice images: 9421, 7140, 6260, 7460, 2206,2750, 9584, 7550, 9160, 2384; pleasant images: 1463, 1710, 1750,1811, 2070, 2091, 2092, 2224, 2340, 2345, 2347, 7325, 7330, 7400,8031, 8200, 8370, 8461, 8496, 8497; unpleasant images: 1050, 1052,1200, 1205, 1300, 1304, 1930, 2458, 2691, 2703, 2800, 2811, 2900,3022, 6190, 6213, 6231, 6510, 6571, 9600; neutral images: 2514, 2580,5390, 5395, 5500, 5731, 5740, 5900, 7000, 7002, 7009, 7010, 7026,7038, 7039, 7090, 7100, 7130, 7175, 7190.
BONDY ET AL. | 3 of 13

distributions; instead, ex-Gaussian distributions—a combina-tion of Gaussian and exponential distributions that rises rap-idly on the left side of the distribution and has a long tail tothe right—fit RT distributions optimally (e.g., Balota &Spieler, 1999). The main drawback of a central tendencyapproach (i.e., computing mean reaction time assuming anormal distribution), especially when untransformed RT dataare analyzed, is reduced power. Further, although using cut-offs (e.g., removing RTs longer than a certain absolute value;Mitchell et al., 2006) may improve power in some cases,when the true effect is actually in the long tail of the distribu-tion, cutoff methods produce Type II errors (see Whelan,2008, for a discussion).
Consequently, prior to analyzing the RT data, we fit anex-Gaussian distribution to each participant’s data using theR package retimes (Massidda, 2013). These distributionshave three parameters: the mean (mu) and standard deviation(sigma) of the Gaussian portion of the distribution, and themean of the exponential portion of the distribution (tau).Briefly, these three parameters were estimated using maxi-mum likelihood (ML) and implementing the simplex methodto establish the minimum of the objective function. We useda bootstrapping approach (5,000 samples with replacement)given our sample was relatively small. First, mu and sigmawere obtained with a Gaussian kernel estimator (see VanZandt, 2000), then tau was chosen within the bootstrappedvalues based on ML criterion.
Classically, mu and tau were proposed to reflect distinctprocesses where the former is influenced by individual dif-ferences in perception and response execution, whereas thelatter is more likely to reflect central decision-making proc-esses (Hohle, 1965). Critically, individual differences inattention selection tasks involving choices based on earlierlevel visual codes (e.g., direction of target) like the EIT typi-cally involve shifts in the entire distribution and may primar-ily affect mu (e.g., Spieler, Balota, & Faust, 1996). Amongother factors, tau is influenced by lapses of attention that pro-duce more frequent longer RT trials, thus creating changes inthe left tail of the ex-Gaussian distribution (e.g., Herveyet al., 2006). Given evidence that ex-Gaussian parameterscapture separable attentional and cognitive processes, weanalyzed mu and tau independently in primary RT analyses.2
To analyze accuracy for each stimulus type (pleasant,unpleasant, neutral), we first computed a count of errorsmade in each condition. To test the effects of stimulus typeand time on number of errors, we fit a within-subject Poissonregression model using generalized estimating equation(GEE). In the model, we used an autoregression correlationstructure and robust standard errors to control for
overdispersion in our data, which is in line with current rec-ommendations (e.g., Cameron & Trivedi, 2009). For all cor-relational analyses involving accuracy (e.g., test-retestestimates), we fit Poisson regression models with robuststandard errors and report betas and standard errors to cap-ture associations.3
2.5 | EEG recording, data reduction,and analysis
The EEG was recorded using a 128-channel HydroCel GSN(Electrical Geodesics, Inc., Eugene, OR). Continuous EEGdata, referenced to Cz, were sampled at 250 Hz. Electrodeimpedances were kept below 65 kX, and offline analyseswere performed using BrainVision Analyzer 2.1 software(Brain Products, Germany). EEG data were rereferenced tothe average reference, and low- and high-pass filters wereapplied at 0.1 and 30 Hz. An independent component analysis(ICA) transform was implemented to identify and remove eyemovement artifacts and eyeblinks using the following criteria:whole data, classic PCA sphering, infomax ICA, energyordering, and 512 convergence steps. For each trial, EEG datawere segmented 200 ms before the initial image onset andcontinued for 1,200 ms. A semiautomated procedure to rejectintervals for individual channels used the following criteria:(a) a voltage step> 50 lV between sample rates, (b) a voltagedifference> 300 lV within a trial, and (c) a maximum volt-age difference of< 0.50 lV within a 100-ms interval. All tri-als were also visually inspected, and further artifacts wererejected manually. After completing the data reduction steps,we then examined the average number of trials retained percondition (i.e., 40 trials/condition) across assessments: (a)neutral trials: 35.556 4.07, (b) unpleasant trials: 35.9663.91, (c) pleasant trials: 35.756 4.23.
ERPs were computed time-locked to pretarget neutral,unpleasant, and pleasant images, and the average amplitude200 ms before the pretarget stimulus onset was used as thebaseline. Only trials with a correct response between 150–1,500 ms after target onset were included in ERP averages.The LPP component was calculated as the mean activity atelectrode site Pz where the component was maximal acrossparticipants for the 400–1,000 ms poststimulus time win-dow.4 Difference waves also were computed to examine dis-crepancies between activity during emotional and neutralconditions (difference waves: unpleasant minus neutral vs.
2Analyses of sigma yielded nonsignificant results (i.e., no effect of con-dition, time, or their interaction; no evidence of test-retest reliability) andare available from the authors by request.
3In preliminary model building, we also fit negative binomial distribu-tion with log link to the number of errors and found that these models fitslightly less closely than Poisson models.4Given prior work demonstrating that an occipitally maximal LPP char-acterizes children and early adolescents (e.g., Kujawa et al., 2013), weexplored scalp topography maps comparing younger and older partici-pants. Participants exhibited similar parietal distribution across ages.
4 of 13 | BONDY ET AL.

pleasant minus neutral). In addition to probing subtraction-based difference scores, we computed standardized residuals(i.e., regressed neutral on unpleasant and pleasant images) toextract the unique variance in the emotional images afteraccounting for the neutral images, an alternative to comput-ing difference scores (see Levinson, Speed, Infantolino, &Hajcak, 2017; Meyer, Lerner, De Los Reyes, Laird, &Hajcak, 2017). All analyses were conducted with SPSS 22.0(IBM Corp., Armonk, NY). A repeated measures analysis ofvariance (rmANOVA) tested main effects of time (baseline,follow-up) and condition (neutral, unpleasant, pleasant) aswell as a Time 3 Condition interaction using a Greenhouse-Geisser correction. We expected a significant main effect ofcondition. To demonstrate stability of a given effect overtime, we anticipated that the main effect of time and theTime 3 Condition interaction would be nonsignificant. Totest whether age moderated LPP stability, we conducted anAge (continuous measure) 3 Time 3 Condition rmANOVAand, additionally, to determine whether younger participantsshow greater activity in occipital versus parietal regions(e.g., Hajcak & Dennis, 2009; Kujawa et al., 2013), we con-ducted Age (continuous measure) 3 Condition 3 Electrode(Pz, Oz) rmANOVAs at each time point.
We computed effect sizes (hp2) for all analyses, where
.02–.125 small, .13–.255medium, and� .265 large. Test-retest stability for behavioral and ERP measures was assessedusing Pearson product-moment correlations with the follow-ing criteria: .10–.295 small, .30–.495moderate,� .505 large (Cohen, 1988). The internal consistency ofbehavioral measures and the LPP were evaluated through test-ing the correlation of the odd and even trials. The Spearman-Brown prophecy formula (Nunnally, Bernstein, & Berge,1967) was used to correct these correlations because the total
number of items included in the averages is split in half(reliability5 2 * rodd/even/11 rodd/even). Spearman-Browncoefficients were evaluated where> .805 good/excellent,.70–.795 acceptable, and< .605 poor.
3 | RESULTS
3.1 | Descriptive statistics
Depressive symptoms were assessed at the baseline andfollow-up assessment (test-retest r5 .82, p< .001) to ensurethe nonclinical status across assessments. As expected,depressive symptom scores were low (baseline: 0.866 1.99;follow-up: 1.216 2.87) and did not differ over time, t(27)521.12, p5 .27, d520.24.
3.2 | Behavioral data
Behavioral data from the EIT are summarized in Table 1.
3.2.1 | Number of errors
In our omnibus GEE analysis, the effect of condition was notsignificant for number of errors, b520.02, SE5 0.44, v2(1,N5 168)5 0.003, p5 .96, OR5 0.98, 95% CI [0.41, 2.32],which may reflect high rates of accuracy across conditions.Additionally, neither the main effect of time, b520.18,SE5 0.53, v2(1, N5 168)5 0.12, p5 .73, OR5 0.83, 95%CI [0.30, 2.33], nor the Time 3 Condition interaction,b5 0.05, SE5 0.25, v2(1, N5 168)5 0.05, p5 .83,OR5 1.05, 95% CI [0.65, 1.72], was significant. Test-retestanalyses using a series of Poisson regression models revealedan association over time for neutral images, b5 0.14,SE5 0.05, v2(1, N5 28)5 6.71, p5 .01, OR5 1.15, 95%CI [1.03, 1.27], but not for pleasant, b5 0.03, SE5 0.08,v2(1, N5 28)5 0.18, p5 .68, OR5 1.03, 95% CI [0.89,1.20], or unpleasant, b5 0.07, SE5 0.10, v2(1, N5 28)50.56, p5 .45, OR5 1.08, 95% CI [0.89, 1.30], images.There also was strong internal consistency in accuracy at thebaseline (Spearman-Brown odd/even corrected reliability5.85) and follow-up (Spearman-Brown odd/even correctedreliability5 .78) assessments.
3.2.2 | Reaction time—Mu
In the rmANOVA model for mu, we found a main effect ofcondition, F(2, 54)5 7.21, p5 .003, hp
25 .21, and unexpect-edly this main effect was qualified by a significant Time 3
Condition interaction, F(2, 54)5 3.56, p5 .04, hp25 .12. As
hypothesized, the main effect of time was nonsignificant, F(1, 27)5 0.42, p5 .52, hp
25 .02. To decompose the interac-tion, we conducted follow-up simple effects analyses. In the
TABLE 1 Behavioral data from the Emotional Interrupt Task
Baseline (n5 28) Follow-up (n5 28)
Measure Mean SD Mean SD
Accuracy
Pleasant 0.96 0.06 0.96 0.04Unpleasant 0.96 0.05 0.97 0.03Neutral 0.97 0.05 0.97 0.03
Reaction time—mu (ms)
Pleasant 390.50 128.93 395.69 166.25Unpleasant 383.09 136.41 397.02 171.85Neutral 362.84 133.36 388.26 174.03
Reaction time—tau (ms)
Pleasant 44.21 23.42 60.31 43.38Unpleasant 53.77 28.10 60.94 43.33Neutral 65.55 43.90 61.64 38.72
Note. Reaction time measures are given for correct trials only.
BONDY ET AL. | 5 of 13

baseline simple effects model, the effect of condition wassignificant, F(2, 54)5 10.22, p< .001, hp
25 .27, such thatparticipants had slower RTs for both pleasant (M5 362.84,SE5 24.37) and unpleasant (M5 383.09, SE5 25.78) stim-uli compared to neutral (M5 362.84, SE5 25.20) stimuli,ps< .02, ds> 0.49. In contrast, RTs for pleasant andunpleasant trials did not significantly differ, p5 .11,d5 0.33. However, in the simple effects model for thefollow-up assessment, the effect of condition was nonsignifi-cant, F(2, 54)5 1.19, p5 .31, hp
25 .04. Further, for mu,there were significant associations over time for pleasant
(r5 .76, p< .001), unpleasant (r5 .72, p< .001), and neu-tral (r5 .68, p< .001) images (see Figure 1a,c,e).5 When
R = 0.52
0
200
400
600
800
1000
1200
0 500 1000 1500
FU P
LE
RT
mu
(ms)
BL PLE RT mu (ms)
(a) R = 0.22
0
50
100
150
200
0 20 40 60 80 100
FU P
LE
RT
tau
(ms)
BL PLE RT tau (ms)
(b)
R = 0.46
0
200
400
600
800
1000
1200
0 500 1000 1500
FU U
NP
RT
mu
(ms)
BL UNP RT mu (ms)
(c) R = 0.21
0
50
100
150
200
250
0 50 100 150
FU U
NP
RT
tau
(ms)
BL UNP RT tau (ms)
(d)
R = 0.46
0
200
400
600
800
1000
1200
0 500 1000 1500
FU N
EU
RT
mu
(ms)
BL NEU RT mu (ms)
(e)R = 0.17
0
30
60
90
120
150
180
0 100 200 300
FU N
EU
RT
tau
(ms)
BL NEU RT tau (ms)
(f)
FIGURE 1 Test-retest for reaction timemeasures at the baseline and follow-up assessments. BL5 baseline; FU5 follow-up; PLE5 pleasantimages; UNP5 unpleasant images; NEU5 neutral images. Correlations depicted include all participants
5Two participants were identified as univariate outliers (i.e., mu valuesfor all three conditions were 3 SD above the mean at the follow-upassessment). All reaction time analyses were run with and without theseparticipants. The results from the rmANOVA models did not changeappreciably. For test re-test correlations, the correlation between baselineand follow-up mu in the neutral condition was nonsignificant when theoutliers were removed (r5 .23, p5 .25). In contrast, the correlations forunpleasant (r5 .53, p5 .005) and pleasant (r5 .44, p5 .02) stimuliwere reduced, but remained statistically significant.
6 of 13 | BONDY ET AL.

examining raw mean reaction time, the Spearman-Browncorrected odd/even reliability was .99 at both the baselineand follow-up assessments, suggesting excellent internalconsistency.
3.2.3 | Reaction time—Tau
In the rmANOVA model for tau, the main effects of condi-tion, F(2, 54)5 2.00, p5 .14, hp
25 .07, and time, F(1,27)5 1.28, p5 .27, hp
25 .05, were nonsignificant, as well asthe Time 3 Condition interaction, F(2, 54)5 2.42, p5 .10,hp25 .08. However, for tau, there were significant associa-
tions over time for pleasant (r5 .46, p5 .01), unpleasant(r5 .46, p5 .01), and neutral (r5 .41, p5 .03) images (seeFigure 1b,d,f).
3.3 | ERPs
3.3.1 | LPP
In line with our hypothesis, there was a main effect of condi-tion, F(2, 54)5 8.78, p5 .001, hp
25 .25. Participants hadgreater sustained positivity to unpleasant and pleasant imagescompared to neutral images at both time points (Figure 2).As hypothesized, the time, F(1, 27)5 2.09, p5 .16,hp25 .07, and Time 3 Condition, F(2, 54)5 0.39, p5 .64,
hp25 .01, effects were nonsignificant. Additionally, there
were significant test-retest associations for neutral (r5 .54,p5 .003), unpleasant (r5 .87, p< .001), pleasant (r5 .73,p< .001; Figure 3) images. To demonstrate the internal reli-ability of the LPP, odd/even trial correlations were evaluated.Spearman-Brown corrected odd/even reliability suggestsexcellent internal consistency at each assessment (baseline:.93; follow-up: .92). Internal consistency also was examinedas a function of image valence: baseline (neutral: .84;unpleasant: .89; pleasant: .79) and follow-up (neutral: .90;unpleasant: .82; pleasant: .57).
3.3.2 | Difference waves
The Time 3 Condition rmANOVA using difference wavescores (unpleasant-neutral and pleasant-neutral) revealed asignificant main effect of condition, F(1, 27)5 6.70, p5 .02,hp25 .20. The unpleasant-neutral difference wave had greater
sustained positivity compared to the pleasant-neutral differ-ence. Neither the main effect of time, F(1, 27)5 0.49,p5 .49, hp
25 .02, nor the Time 3 Condition interaction, F(1, 27)5 0.13, p5 .72, hp
25 .01, was significant. The test-retest correlational analyses did not show significant associa-tions over time for difference scores (ps> .35). The internalconsistency of the pleasant-neutral difference score at base-line was modest (Spearman-Brown corrected odd/evenreliability5 .63), but the unpleasant-neutral difference scorewas poor (Spearman-Brown corrected odd/even
-2
0
2
4
6
8
10
12
-200 0 200 400 600 800 1000
Am
plitu
de (µ
V)
Time (ms)
Baseline Pleasant Unpleasant Neutral
-2
0
2
4
6
8
10
12
-200 0 200 400 600 800 1000
Am
plitu
de (µ
V)
Time (ms)
Follow-Up Pleasant Unpleasant Neutral
(b)
(a)
FIGURE 2 LPP activity during the emotional interrupt task. LPP activity at Pz in response to pleasant, unpleasant, and neutral images during the (a)baseline and (b) follow-up assessment. Scalp topographies reflect mean activation across conditions (pleasant, unpleasant, neutral images) at each assess-ment between 400–1,000ms poststimulus
BONDY ET AL. | 7 of 13

reliability5 .35). For the follow-up assessment, the internalreliability of the differences scores also was poor (Spearman-Brown corrected odd/even reliability� .47).
We also examined difference scores using a residual-based method. Similar to the subtraction-based differencescores, test-retest stability analyses of residual-based scoresalso were not significant (ps> .36). Additionally, at baselinethe internal reliability of the unpleasant residuals (Spearman-Brown corrected odd/even reliability5 .65) and pleasantresiduals (Spearman-Brown corrected reliability5 .64) weremodest. The internal consistency was poor at the follow-upassessments (Spearman-Brown corrected reliability � .52).
3.4 | Age-related differences
To test whether participant age in years (continuous measure)moderated LPP stability, we conducted an Age 3 Time 3
Condition rmANOVA. The Age 3 Time 3 Condition
interaction was nonsignificant, F(2, 52)5 0.35, p5 .67,hp25 .01, indicating that the LPP over time did not vary as a
function of participant age. Additionally, all lower-ordertwo-way interactions were nonsignificant (ps> .20,hp2< .06), and the main effects (time, condition) as reported
above did not change when age was included in the model.Interestingly, a significant main effect of age emerged, F(1,26)5 17.39, p< .001, hp
25 .40, such that younger partici-pants showed greater positivity compared to older partici-pants. A Pearson’s product-moment correlation indicatedthat age was inversely correlated with the LPP amplitudeacross conditions and assessments (r5 -.63, p< .001, Figure4a).
As prior work has shown that the LPP tends to be maxi-mal in occipital regions in younger individuals (Hajcak &Dennis, 2009; Kujawa et al., 2013), we conducted additionalanalyses testing differential activity in parietal and occipitalregions. Specifically, Age 3 Condition 3 Electrode (Pz, Oz)
R = 0.53
-2 0 2 4 6 8
10 12
-2 0 2 4 6 8 FU
LPP
PL
E (µ
V)
BL LPP PLE (µV)
(a)
R = 0.76
-5
0
5
10
15
-4 -2 0 2 4 6 8 10 12 14
FU L
PP U
NP
(µV
)
BL LPP UNP (µV)
(b)
R = 0.29
-5
0
5
10
15
20
-4 -2 0 2 4 6 8 10 12 14
FU L
PP N
EU
(µV
)
BL LPP NEU (µV)
(c)
FIGURE 3 Test-retest for LPP during baseline and follow-up assessments. BL5 baseline; FU5 follow-up; PLE5 pleasant; UNP5 unpleasant;NEU5 neutral
8 of 13 | BONDY ET AL.
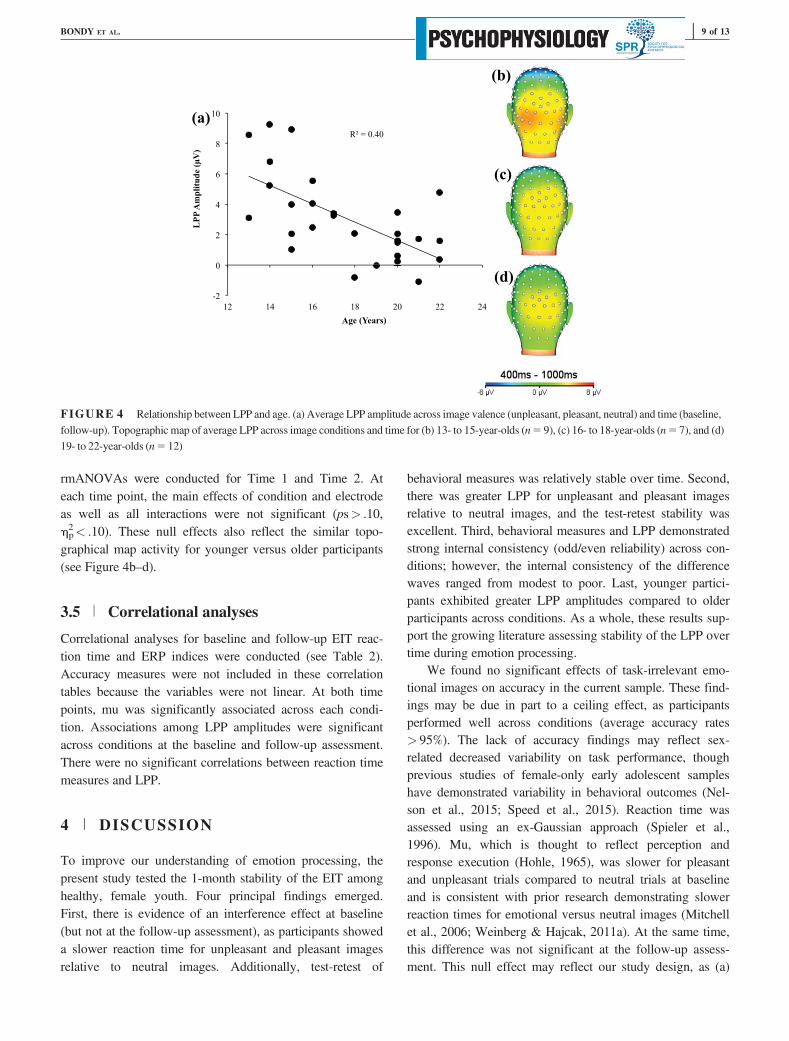
rmANOVAs were conducted for Time 1 and Time 2. Ateach time point, the main effects of condition and electrodeas well as all interactions were not significant (ps> .10,hp2< .10). These null effects also reflect the similar topo-
graphical map activity for younger versus older participants(see Figure 4b–d).
3.5 | Correlational analyses
Correlational analyses for baseline and follow-up EIT reac-tion time and ERP indices were conducted (see Table 2).Accuracy measures were not included in these correlationtables because the variables were not linear. At both timepoints, mu was significantly associated across each condi-tion. Associations among LPP amplitudes were significantacross conditions at the baseline and follow-up assessment.There were no significant correlations between reaction timemeasures and LPP.
4 | DISCUSSION
To improve our understanding of emotion processing, thepresent study tested the 1-month stability of the EIT amonghealthy, female youth. Four principal findings emerged.First, there is evidence of an interference effect at baseline(but not at the follow-up assessment), as participants showeda slower reaction time for unpleasant and pleasant imagesrelative to neutral images. Additionally, test-retest of
behavioral measures was relatively stable over time. Second,there was greater LPP for unpleasant and pleasant imagesrelative to neutral images, and the test-retest stability wasexcellent. Third, behavioral measures and LPP demonstratedstrong internal consistency (odd/even reliability) across con-ditions; however, the internal consistency of the differencewaves ranged from modest to poor. Last, younger partici-pants exhibited greater LPP amplitudes compared to olderparticipants across conditions. As a whole, these results sup-port the growing literature assessing stability of the LPP overtime during emotion processing.
We found no significant effects of task-irrelevant emo-tional images on accuracy in the current sample. These find-ings may be due in part to a ceiling effect, as participantsperformed well across conditions (average accuracy rates> 95%). The lack of accuracy findings may reflect sex-related decreased variability on task performance, thoughprevious studies of female-only early adolescent sampleshave demonstrated variability in behavioral outcomes (Nel-son et al., 2015; Speed et al., 2015). Reaction time wasassessed using an ex-Gaussian approach (Spieler et al.,1996). Mu, which is thought to reflect perception andresponse execution (Hohle, 1965), was slower for pleasantand unpleasant trials compared to neutral trials at baselineand is consistent with prior research demonstrating slowerreaction times for emotional versus neutral images (Mitchellet al., 2006; Weinberg & Hajcak, 2011a). At the same time,this difference was not significant at the follow-up assess-ment. This null effect may reflect our study design, as (a)
R = 0.40
-2
0
2
4
6
8
10
12 14 16 18 20 22 24
LPP
Am
plitu
de (µ
V)
Age (Years)
(a)
(b)
(c)
(d)
FIGURE 4 Relationship between LPP and age. (a) Average LPP amplitude across image valence (unpleasant, pleasant, neutral) and time (baseline,follow-up). Topographic map of average LPP across image conditions and time for (b) 13- to 15-year-olds (n5 9), (c) 16- to 18-year-olds (n5 7), and (d)19- to 22-year-olds (n5 12)
BONDY ET AL. | 9 of 13

test-retest was conducted during a 1-month time span, and(b) the second assessment included the third and fourth view-ing of the same images (during a relatively brief time win-dow). Unfortunately, this may have unduly influenced thelikelihood of instigating an interference effect at the behav-ioral level; yet, as our findings show, electrocortical dif-ferences persisted. Finally, task-irrelevant images did notsignificantly impact tau, which may not be surprising as tauindexes lapses in attention (e.g., Hervey et al., 2006). Over-all, the ex-Gaussian approach to model reaction time demon-strated a preliminary interference effect, and, more broadly,the EIT showed promising psychometric properties.
Consistent with prior work (Kujawa et al., 2012; Wein-berg & Hajcak, 2011a), participants exhibited greater positiv-ity to unpleasant and pleasant images compared to neutralimages across assessments. Further, the unpleasant-neutraldifference score was potentiated relative to pleasant-neutralimages. This suggests that unpleasant images elicited greater
positivity than pleasant images when compared to neutralimages, which may be a result of unpleasant images beingsignificantly more arousing than pleasant images. The LPPwas remarkably stable across conditions with large effectsizes, which is in line with previous work demonstratingstrong test-retest stability of the LPP (Auerbach et al., 2016;Kujawa et al., 2013). Similar stability estimates have beenshown for the P1, a component indexing semantic monitor-ing of emotional information, during a self-referential encod-ing task (Auerbach et al., 2016). By contrast, alternativeapproaches to probe emotion processing using fMRI may beless stable. For example, in a sample of healthy adolescentsviewing fearful, happy, and neutral faces, activation in theprefrontal cortex and amygdala (two regions implicated inemotion face processing) demonstrated poor-to-modest sta-bility (van den Bulk et al., 2013). Taken together, ERPs maybe a more stable and reliable tool to detect pathophysiologi-cal mechanisms associated with emotion processing.
TABLE 2 Pearson product-moment correlations among reaction time measures and ERPs at the baseline and follow-up assessment
Baseline 1 2 3 4 5 6 7 8 9
1. PLE RT mu
2. UNP RT mu .99**
3. NEU RT mu .97** .95**
4. PLE RT tau .30 .34 .33
5. UNP RT tau 2.01 2.09 .02 .49**
6. NEU RT tau .29 .32 .10 .45* .21
7. PLE LPP 2.09 2.10 2.07 .02 .07 2.03
8. UNP LPP .06 .04 .04 .21 .21 .25 .82**
9. NEU LPP 2.05 2.07 2.07 .10 .004 .11 .70** .74**
Follow-up 1 2 3 4 5 6 7 8 9
1. PLE RT mu
2. UNP RT mu .98**
3. NEU RT mu .98** .99**
4. PLE RT tau .18 .29 .25
5. UNP RT tau .48** .49** .54** .57**
6. NEU RT tau .34 .38* .28 .65** .52**
7. PLE LPP 2.23 2.20 2.25 .16 2.23 .16
8. UNP LPP 2.09 2.09 2.14 2.09 2.29 .09 .82**
9. NEU LPP 2.27 2.26 2.27 .03 2.29 .01 .76** .70**
Note. PLE5 pleasant images; UNP5 unpleasant images; NEU5 neutral images; RT5 reaction time; LPP5 late positive potential.a**p < .01. *p < .05.
10 of 13 | BONDY ET AL.

Test-retest reliability and internal consistency of theERPs was assessed using three different approaches. Whenprobing odd/even correlations and internal consistency foreach valence separately, results were in the excellent range.However, for difference scores and standardized residuals,neither approach showed significant test-retest reliability.This is consistent with prior research (Kujawa et al., 2013;Levinson et al., 2017), and it is not necessarily surprising astest-retest reliability of the difference and residualized scoresis often lower than the reliability of the constituent compo-nents (e.g., unpleasant, pleasant, neutral; see Meyer et al.,2017; but also see Edwards, 2001). Similarly, the internalconsistency using difference scores and residualizedapproaches were not as strong relative to testing each valenceseparately. These null effects raise important questions, asERPs tested by using change or residualized scores oftenrely on neutral stimuli to help interpret the amplitudes ofaffective stimuli (e.g., unpleasant, pleasant images). Despitethis potential reliability problem, these findings (and othersimilar results) do not necessarily suggest that researchersshould avoid difference or residualized scores. Rather, it isimportant to determine why the reliability may be suboptimaland if this may impact reproducibility. With regard to ourstudy, the LPP amplitudes are positively correlated, whichmay in part account for the poor reliability (Edwards, 2001).In other research there may be very clear mandates as to whyit would be important to use data reduction techniques. Thus,rather than having a blanket “should” or “should not” state-ment about the use of difference or residualized scores, webelieve it is more important to (a) be mindful of the EEG/ERP psychometric properties (and account for potential reli-ability issues), (b) tailor the data analytic approach to thecentral research question, and (c) determine whether findingscan be replicated (even in the absence of strong test-retestreliability of difference or residualized scores).
The study also sought to address important developmen-tal issues, particularly as it related to determining whetherage impacts LPP activity. Results indicated that younger agewas associated with greater LPP activity in parietal regionsacross conditions. These findings support prior work testingage-related electrocortical effects following emotion-basedimages. Specifically, MacNamara and colleagues (2016)tested age effects on the LPP during the presentation of emo-tional faces among youth aged 7 to 19 years. Relative toyounger children, older participants showed decreased posi-tivity following emotional but not neutral stimuli (geometricshapes). Age-related decreases in the LPP also have beendemonstrated in other tasks; when asked to attend to eitherpain or nonpain cues in images, adolescents exhibited apotentiated LPP compared to young adults (Mella, Studer,Gilet, & Labourie-Vief, 2012). Additionally, age-related dif-ferences in the LPP scalp distribution were explored, and
results indicated that LPP activity did not vary as a functionof electrode site (parietal vs. occipital) for younger versusolder youth (see Figure 4b–d). At the same time, this con-flicts with prior work in younger individuals that has oftenshown the LPP is maximal in occipital regions (e.g., Hajcak& Dennis, 2009; Kujawa et al., 2013). Together, these find-ings underscore the importance of testing whether age influ-ences LPP activity across development, as this may haveimportant implications for interpreting ERP effects.
Our results should be interpreted in light of several limi-tations. First, prior research using IAPS stimuli has demon-strated greater electrophysiological reactivity in femalesrelative to males during passive viewing of unpleasant stim-uli (Lithari et al., 2010), which underscores the importanceof testing sex-specific effects. However, as the current studyonly included female participants, we cannot determinewhether our effects generalize to males. Second, priorresearch has demonstrated that pubertal status influenceselectrophysiological responses in youth (e.g., processing ofemotional faces, fear-potentiated startle; Ferri, Bress, Eaton,& Proudfit, 2014; Schmitz, Grillon, Avenevoli, Cui, & Meri-kangas, 2014). At the same time, the present study did notassess pubertal status, and thus we cannot determine howpubertal status affects LPP stability. Third, this study exam-ined the stability of ERPs over a 1-month period, and, conse-quently, it is important to confirm these effects over a longerperiod of time. Fourth, IAPs images were used to standardizethe emotional stimuli across participants. However, the cur-rent study did not obtain subjective arousal ratings for eachimage, which may have facilitated an enhanced interpretationof our ERP effects. Additionally, images were presentedtwice during each administration of the EIT. Notably, weused the same paradigm as other published studies (e.g.,Kujawa et al., 2012, 2013; Nelson et al., 2015; Speed et al.,2015; Weinberg & Hajcak, 2011a), which then allowed us tocompare our behavioral and ERP effects to the extant litera-ture. At the same time, reviewing images multiple times dur-ing the trial may have an unmeasured impact on corepsychometric properties. Last, a number of factors, includingmenstrual cycle and circadian rhythm, may influence ERPamplitude (Polich & Kok, 1995), and thus future researchshould account for these potential effects.
In summary, prior research has shown that the LPP is astable and reliable marker of processing emotional words(Auerbach et al., 2016) and images (Kujawa et al., 2013).Toward the goal of identifying indicators of emotion proc-essing, the current findings provide further support for thestability and reliability of the LPP over time in healthy youth.Ultimately, an improved understanding of electrophysiologi-cal correlates of emotion processing may lead to insightregarding the onset and maintenance of debilitating psychiat-ric symptoms.
BONDY ET AL. | 11 of 13

ACKNOWLEDGMENTS
Randy P. Auerbach was partially supported through fund-ing from the National Institute of Mental Health (NIMH)K23MH097786, the Rolfe Fund, and the Tommy FussFund. The content is solely the responsibility of the authorsand does not necessarily represent the official views of theNational Institutes of Health or NIMH. Dr. Mittal is a con-sultant for Takeda Pharmaceuticals. No other authors reportany conflicts of interest.
REFERENCESAuerbach, R. P., Bondy, E., Stanton, C. H., Webb, C. A., Shankman,
S. A., & Pizzagalli, D. A. (2016). Self-referential processing inadolescents: Stability of behavioral and ERP markers. Psycho-physiology, 53(9), 1398–1406. https://doi.org/10.1111/psyp.12686
Auerbach, R. P., Stanton, C. H., Proudfit, G. H., & Pizzagalli, D. A.(2015). Self-referential processing in depressed adolescents: Ahigh-density event-related potential study. Journal of AbnormalPsychology, 124(2), 233–245. https://doi.org/10.1037/abn0000023
Balota, D. A., & Spieler, D. H. (1999). Word frequency, repetition,and lexicality effects in word recognition tasks: Beyond measuresof central tendency. Journal of Experimental Psychology: Gen-eral, 128(1), 32–55.
Beck, A. T., Steer, R. A., & Brown, G. K. (1996). Beck DepressionInventory manual (2nd ed.). San Antonio, TX: PsychologicalCorporation.
Cameron, A. C., & Trivedi, P. K. (2009). Microeconometrics usingSTATA (Vol. 5). College Station, TX: Stata Press.
Cassidy, S. M., Robertson, I. H., & O’Connell, R. G. (2012). Retestreliability of event-related potentials: Evidence from a variety ofparadigms. Psychophysiology, 49(5), 659–664. https://doi.org/10.1111/j.1469-8986.2011.01349.x
Cohen, J. (1988). Statistical power analysis for the behavioral scien-ces (2nd ed.). Hillsdale, NJ: Erlbaum.
Cuthbert, B. N., Schupp, H. T., Bradley, M. M., Birbaumer, N., &Lang, P. J. (2000). Brain potentials in affective picture process-ing: Covariation with autonomic arousal and affective report. Bio-logical Psychology, 52(2), 95–111.
Dolan, R. J. (2002). Emotion, cognition, and behavior. Science, 298(5596), 1191–1194. https://doi.org/10.1126/science.1076358
Dolcos, F., & Cabeza, R. (2002). Event-related potentials of emo-tional memory: Encoding pleasant, unpleasant, and neutral pic-tures. Cognitive, Affective, & Behavioral Neuroscience, 2(3),252–263. https://doi.org/10.3758/CABN.2.3.252
Edwards, J. R. (2001). Ten difference score myths. OrganizationalResearch Methods, 4(3), 265–287.
Ferri, J., Bress, J. N., Eaton, N. R., & Proudfit, G. H. (2014). Theimpact of puberty and social anxiety on amygdala activation tofaces in adolescence. Developmental Neuroscience, 36(3–4), 239–249. https://doi.org/10.1159/000363736
Foti, D., & Hajcak, G. (2008). Deconstructing reappraisal: Descrip-tions preceding arousing pictures modulate the subsequent neuralresponse. Journal of Cognitive Neuroscience, 20(6), 977–988.https://doi.org/10.1162/jocn.2008.20066
Foti, D., Hajcak, G., & Dien, J. (2009). Differentiating neuralresponses to emotional pictures: Evidence from temporal-spatialPCA. Psychophysiology, 46(3), 521–530. https://doi.org/10.1111/j.1469-8986.2009.00796.x
Hajcak, G., & Dennis, T. A. (2009). Brain potentials during affectivepicture processing in children. Biological Psychology, 80(3), 333–338. https://doi.org/10.1016/j.biopsycho.2008.11.006
Hajcak, G., & Olvet, D. M. (2008). The persistence of attention toemotion: Brain potentials during and after picture presentation.Emotion, 8(2), 250–255. https://doi.org/10.1037/1528-3542.8.2.250
Hajcak, G., MacNamara, A., & Olvet, D. M. (2010). Event-relatedpotentials, emotion, and emotion regulation: An integrativereview. Developmental Neuropsychology, 35(2), 129–155. https://doi.org/10.1080/87565640903526504
Hajcak, G., Weinberg, A., MacNamara, A., & Foti, D. (2012). ERPsand the study of emotion. In S. J. Luck & E. S. Kappenman(Eds.), The Oxford handbook of event-related potential compo-nents (pp. 441–474). New York, NY: Oxford University Press.
Hervey, A. S., Epstein, J. N., Curry, J. F., Tonev, S., Eugene Arnold,L., Keith Conners, C., . . . Hechtman, L. (2006). Reaction timedistribution analysis of neuropsychological performance in anADHD sample. Child Neuropsychology, 12(2), 125–140.
Hess, U., Arslan, R., Mauersberger, H., Blaison, C., Dufner, M.,Denissen, J. J., & Ziegler, M. (2017). Reliability of surface facialelectromyography. Psychophysiology, 54(1), 12–23. https://doi.org/10.1111/psyp.12676
Hohle, R. H. (1965). Inferred components of reaction times as func-tions of foreperiod duration. Journal of Experimental Psychology,69(4), 382–386.
Insel, P. A., Amara, S. G., & Blaschke, T. F. (2015). Introduction tothe theme “precision medicine and prediction in pharmacology.”Annual Review of Pharmacology and Toxicology, 55, 11–14.https://doi.org/10.1146/annurev-pharmtox-101714-123102
Kujawa, A., Klein, D. N., & Hajcak, G. (2012). Electrocortical reac-tivity to emotional images and faces in middle childhood to earlyadolescence. Developmental Cognitive Neuroscience, 2(4), 458–467. https://doi.org/10.1016/j.dcn.2012.03.005
Kujawa, A., Klein, D. N., & Proudfit, G. H. (2013). Two-year stabil-ity of the late positive potential across middle childhood and ado-lescence. Biological Psychology, 94(2), 290–296. https://doi.org/10.1016/j.biopsycho.2013.07.002
Lang, P. J. (1984). Cognition in emotion: Concept and action. In C.E. Izard, J. Kagan, & R. B. Zajonc (Eds.). Emotions, cognition,and behavior (pp. 192–226). Cambridge, UK: Cambridge Univer-sity Press.
Lang, P. J., Bradley, M. M., & Cuthbert, B. N. (2008). InternationalAffective Picture System (IAPS): Affective ratings of pictures andinstruction manual. Technical Report A-8. University of Florida,Gainesville, FL.
Levinson, A. R., Speed, B. C., Infantolino, Z. P., & Hajcak, G.(2017). Reliability of the electrocortical response to gains andlosses in the doors task. Psychophysiology, 54(4), 601–607.https://doi.org/10.1111/psyp.12813
Lithari, C., Frantzidis, C. A., Papadelis, C., Vivas, A. B., Klados, M.A., Kourtidou-Papadeli, C., . . . Bamidis, P. D. (2010). Are
12 of 13 | BONDY ET AL.

females more responsive to emotional stimuli? A neurophysiologi-cal study across arousal and valence dimensions. Brain Topogra-phy, 23(1), 27–40. https://doi.org/10.1007/s10548-009-0130-5
MacNamara, A., Verg�es, A., Kujawa, A., Fitzgerald, K. D., Monk, C.S., & Phan, K. L. (2016). Age-related changes in emotional faceprocessing across childhood and into young adulthood: Evidencefrom event-related potentials. Developmental Psychobiology, 58(1), 27–38. https://doi.org/10.1002/dev.21341
Massidda, D. (2013). Retimes: Reaction time analysis. R package(Version 0.1–2) [Computer software]. Retrieved from https://rdrr.io/cran/retimes/
Mella, N., Studer, J., Gilet, A. L., & Labouvie-Vief, G. (2012).Empathy for pain from adolescence through adulthood: An event-related brain potential study. Frontiers in Psychology, 3, 501.https://doi.org/10.3389/fpsyg.2012.00501
Meyer, A., Lerner, M. D., De Los Reyes, A., Laird, R. D., & Hajcak,G. (2017). Considering ERP difference scores as individual differ-ence measures: Issues with subtraction and alternative approaches.Psychophysiology, 54(1), 114–122. https://doi.org/10.1111/psyp.12664
Mitchell, D. G., Richell, R. A., Leonard, A., & Blair, R. J. R. (2006).Emotion at the expense of cognition: Psychopathic individualsoutperform controls on an operant response task. Journal ofAbnormal Psychology, 115(3), 559–666. https://doi.org/10.1037/0021-843X.115.3.559
Nelson, B. D., Perlman, G., Hajcak, G., Klein, D. N., & Kotov, R.(2015). Familial risk for distress and fear disorders and emotionalreactivity in adolescence: An event-related potential investigation.Psychological Medicine, 45(12), 2545–2556. https://doi.org/10.1017/S0033291715000471
Nunnally, J. C., Bernstein, I. H., & Berge, J. M. T. (1967). Psycho-metric theory (Vol. 226). New York, NY: McGraw-Hill.
Olofsson, J. K., Nordin, S., Sequeira, H., & Polich, J. (2008). Affec-tive picture processing: An integrative review of ERP findings.Biological Psychology, 77(3), 247–265. https://doi.org/10.1016/j.biopsycho.2007.11.006
Olvet, D. M., & Hajcak, G. (2009). Reliability of error-related brainactivity. Brain Research, 1284, 89–99. https://doi.org/10.1016/j.brainres.2009.05.079
Polich, J., & Kok, A. (1995). Cognitive and biological determinantsof P300: An integrative review. Biological Psychology, 41(2),103–146. https://doi.org/10.1016/0301-0511(95)05130–9
Schmitz, A., Grillon, C., Avenevoli, S., Cui, L., & Merikangas, K. R.(2014). Developmental investigation of fear-potentiated startleacross puberty. Biological Psychology, 97, 15–21. https://doi.org/10.1016/j.biopsycho.2013.12.002
Schupp, H. T., Cuthbert, B. N., Bradley, M. M., Cacioppo, J. T., Ito,T., & Lang, P. J. (2000). Affective picture processing: The latepositive potential is modulated by motivational relevance. Psycho-physiology, 37(2), 257–261.
Sheehan, D. V., Sheehan, K. H., Shytle, R. D., Janavs, J., Bannon,Y., Rogers, J. E., . . . Wilkinson, B. (2010). Reliability and valid-ity of the Mini International Neuropsychiatric Interview for
children and adolescents (MINI-KID). Journal of Clinical Psychi-atry, 71(3), 313–326. https://doi.org/10.4088/JCP.09m05305whi.
Speed, B. C., Nelson, B. D., Auerbach, R. P., Klein, D. N., & Haj-cak, G. (2016). Depression risk and electrocortical reactivity dur-ing self-referential emotional processing in 8 to 14 year-old girls.Journal of Abnormal Psychology, 125(1) 26–39. https://doi.org/10.1037/abn0000173
Speed, B. C., Nelson, B. D., Perlman, G., Klein, D. N., Kotov, R., &Hajcak, G. (2015). Personality and emotional processing: A rela-tionship between extraversion and the late positive potential inadolescence. Psychophysiology, 52(8), 1039–1047. https://doi.org/10.1111/psyp.12436
Spieler, D. H., Balota, D. A., & Faust, M. E. (1996). Stroop perform-ance in healthy younger and older adults and in individuals withdementia of the Alzheimer’s type. Journal of Experimental Psy-chology: Human Perception and Performance, 22(2), 461–479.
Sutton, S., Braren, M., Zubin, J., & John, E. R. (1965). Evoked-potential correlates of stimulus uncertainty. Science, 150(3700),1187–1188. https://doi.org/10.1126/science.150.3700.1187
Tenke, C. E., Kayser, J., Pechtel, P., Webb, C. A., Dillon, D. G.,Goer, F., . . . Parsey, R. (2017). Demonstrating test-retest reliabil-ity of electrophysiological measures for healthy adults in a multi-site study of biomarkers of antidepressant treatment response.Psychophysiology, 54(1), 34–50. https://doi.org/10.1111/psyp.12758
van den Bulk, B. G., Koolschijn, P. C. M., Meens, P. H., van Lang,N. D., van der Wee, N. J., Rombouts, S. A., . . . Crone, E. A.(2013). How stable is activation in the amygdala and prefrontalcortex in adolescence? A study of emotional face processingacross three measurements. Developmental Cognitive Neuro-science, 4, 65–76. https://doi.org/10.1016/j.dcn.2012.09.005
Van Zandt, T. (2000). How to fit a response time distribution. Psy-chonomic Bulletin & Review, 7(3), 424–465.
Weinberg, A., & Hajcak, G. (2010). Beyond good and evil: Thetime-course of neural activity elicited by specific picture content.Emotion, 10(6), 767–782. https://doi.org/10.1037/a0020242.
Weinberg, A., & Hajcak, G. (2011a). The late positive potential pre-dicts subsequent interference with target processing. Journal ofCognitive Neuroscience, 23(10), 2994–3007. https://doi.org/10.1162/jocn.2011.21630
Weinberg, A., & Hajcak, G. (2011b). Longer term test–retest reliabil-ity of error-related brain activity. Psychophysiology, 48(10),1420–1425. https://doi.org/10.1111/j.1469-8986.2011.01206.x
Whelan, R. (2008). Effective analysis of reaction time data. Psycho-logical Record, 58(3), 475–482.
How to cite this article: Bondy E, Stewart JG, HajcakG, et al. Emotion processing in female youth: Testingthe stability of the late positive potential. Psychophysi-ology. 2018;55:e12977. https://doi.org/10.1111/psyp.12977
BONDY ET AL. | 13 of 13