emission inventory scope 1 - 2 · emission inventory scope 1 - 2 d-env-gr-021 27/04/2016 2014...
TRANSCRIPT

Emission inventory
scope 1 - 2
D-ENV-GR-021
27/04/2016
2014 million manhours worked : 3,357089 1,071370 0,274769 0,791333 0,412309 0,807308
scope item unit
conversionfactor
unit to
kg CO2-eq.
data ton CO2-eq.kg CO2-eq. / 1000 manhour
data ton CO2-eq.kg CO2-eq. / 1000 manhour
data ton CO2-eq.kg CO2-eq. / 1000 manhour
data ton CO2-eq.kg CO2-eq. / 1000 manhour
data ton CO2-eq.kg CO2-eq. / 1000 manhour
1gas consumption for heating
natural gasm
3 1,89 31605,76 59,73 55,76 497915,28 941,06 3424,91 461063,8 871,41 1101,19 0,00 0,00 15126,9 28,59 35,41
1gas consumption for heating
propaneL 1,725 0,00 200060 345,10 1255,98 0,00 0,00 0,00 0,00 0,00 0,00
1gas consumption for welding
propanekg 2,974 5462,5 16,25 15,16 5835 17,35 63,16 56358 167,61 211,81 10989 32,68 79,26 26515,1 78,86 97,68
1gas consumption for welding
acethylenekg 3,385 19095 64,64 60,33 1995 6,75 24,58 20425 69,14 87,37 1488 5,04 12,22 0,00 0,00
1gas consumption for welding
CO 2 + Euromix (15% CO 2 )kg 1 23472,5 23,47 21,91 30153 30,15 109,74 18275 18,28 23,09 0 0,00 0,00 7515,1 7,52 9,31
1fuel consumption for transport of
passenger dieselL 3,2 307826 985,04 919,42 23050,83 73,76 268,45 28100 89,92 113,63 45000 144,00 349,25 0,00 0,00
1fuel consumption for transport of
goods diesel + fuel oilL 3,2 363001 1161,60 1084,22 24743 79,18 288,16 147866 473,17 597,94 0,0 0,00 0,00 551646,8 1765,27 2186,61
1fuel consumption for heating
fuel oilL 3,185 254151 809,47 755,55 59068 188,13 684,69 0,00 0,00 0,00 0,00 0,0 0,00 0,00
2electricity
graykWh 0,526 2559184,0 1346,13 1256,46 1294624,0 680,97 2478,34 4599174,5 2419,17 3057,08 2376819 1250,21 3032,21 1421059,6 747,48 925,89
2electricity
windkWh 0 1582790,2 0,00 0,00 800692,0 0,00 0,00 2844472,5 0,00 0,00 0,00 0,00 897511,0 0,00 0,00
2electricity
waterkWh 0 0,00 0,00 0,00 0,00 0,00 0,00 0,00 0,00 0,00 0,00
2electricity
biomasskWh 0,075 195625,8 14,67 13,69 98961,9 7,42 27,01 351564,0 26,37 33,32 0,00 0,00 94093,9 7,06 8,74
2electricity
thermalkWh 0 0,00 0,00 0,00 0,00 0,00 0,00 0,00 0,00 0,00 0,00
2electricity
solarkWh 0 17465,0 0,00 0,00 0,00 0,00 0,00 0,00 0,00 0,00 0,00 0,00
2city heating
browncoalGj 64,3 0,00 0,00 0,00 0,00 0,00 0,00 4616 296,81 719,87 0,00 0,00
2business travel - plane
<700kmkm 0,297 180568 53,63 50,06 5384 1,60 5,82 3620 1,08 1,36 28266 8,40 20,36 0,00 0,00
2business travel - plane
700-2500kmkm 0,2 84524 16,90 15,78 5336 1,07 3,88 1530 0,31 0,39 7200 1,44 3,49 0,00 0,00
2business travel - plane
>2500kmkm 0,147 410880 60,40 56,38 0 0,00 0,00 0 0,00 0,00 0 0,00 0,00 0,00 0,00
2business travel - train
intercitykm 0,024 8088 0,19 0,18 0,00 0,00 0,00 0,00 0,00 0,00 0,00 0,00
2business travel - train
high-speedkm 0,026 86608 2,25 2,10 0,00 0,00 0,00 0,00 0,00 0,00 0,00 0,00
white applicable, OK yellow applicable, no data or doubtfull grey not applicable
TOTAL Arendonk (incl. Group) Balen Hoboken Zary Newcastle Upon Tyne
% CO2-eq. ton CO2-eq. ton CO2-eq. % CO2-eq. kg CO2-eq. / 1000 manhour
ton CO2-eq. % CO2-eq. kg CO2-eq. / 1000 manhour
ton CO2-eq. % CO2-eq. kg CO2-eq. / 1000 manhour
ton CO2-eq. % CO2-eq. kg CO2-eq. / 1000 manhour
ton CO2-eq. % CO2-eq. kg CO2-eq. / 1000 manhour
gas consumption for heating 14,49% 2245,90 59,73 1,29% 55,76 1286,16 54,21% 4680,89 871,41 21,07% 1101,19 0,00 0,00% 0,00 28,59 1,09% 35,41
gas consumption for welding 3,47% 537,73 104,35 2,26% 97,40 54,26 2,29% 197,47 255,02 6,17% 322,27 37,72 2,17% 91,48 86,37 3,28% 106,99
fuel consumption for transport 30,79% 4771,95 2146,65 46,52% 2003,65 152,94 6,45% 556,61 563,09 13,61% 711,57 144,00 8,28% 349,25 1765,27 67,00% 2186,61
fuel consumption for heating 6,44% 997,60 809,47 17,54% 755,55 188,13 7,93% 684,69 0,00 0,00% 0,00 0,00 0,00% 0,00 0,00 0,00% 0,00
SUM SCOPE 1 55,19% 8553,17 3120,21 67,62% 2912,35 1681,49 70,87% 6119,67 1689,52 40,84% 2135,04 181,72 10,45% 440,73 1880,23 71,36% 2329,01
percentage of total scope 1 36,48% 19,66% 19,75% 2,12% 21,98%
electricity - gray 41,58% 6443,95 1346,13 29,17% 1256,46 680,97 28,70% 2478,34 2419,17 58,48% 3057,08 1250,21 71,91% 3032,21 747,48 28,37% 925,89
electricity - green 0,36% 55,52 14,67 0,32% 13,69 7,42 0,31% 27,01 26,37 0,64% 33,32 0,00 0,00% 0,00 7,06 0,27% 8,74
city heating - other 1,92% 296,81 0,00 0,00% 0,00 0,00 0,00% 0,00 0,00 0,00% 0,00 296,81 17,07% 719,87 0,00 0,00% 0,00
business travel 0,95% 147,26 133,38 2,89% 124,49 2,67 0,11% 9,70 1,38 0,03% 1,75 9,84 0,57% 23,85 0,00 0,00% 0,00
SUM SCOPE 2 44,81% 6943,54 1494,18 32,38% 1394,65 691,06 29,13% 2515,06 2446,91 59,16% 3092,14 1556,85 89,55% 3775,93 754,53 28,64% 934,63
percentage of total scope 2 21,52% 9,95% 35,24% 22,42% 10,87%
SUM TOTAL 15496,72 4614,39 4307,00 2372,56 8634,73 4136,44 5227,18 1738,57 4216,66 2634,77 3263,64
percentage of total 29,78% 15,31% 26,69% 11,22% 17,00%
Zary Newcastle-Upon-Tyne
S
C
O
P
E
1
S
C
O
P
E
2
Arendonk + Group Balen Hoboken

Emission inventory
scope 1 - 2
D-ENV-GR-021
27/04/2016
Arendonk (incl. Group)
30%
Balen15%
Hoboken27%
Zary11%
Newcastle Upon Tyne17%
TOTAL CO2 EMISSIONS PER FIRM
0,00
2000,00
4000,00
6000,00
8000,00
10000,00
12000,00
14000,00
16000,00
18000,00
TONS CO2 EMISSIONS
Scope 1 Scope 2 Total
gas consumption for heating
15%
gas consumption for welding
3%
fuel consumption for transport
31%
fuel consumption for heating
6%
electricity - gray42%
electricity - green0%
city heating - other2%
business travel1%
TOTAL CO2 EMISSIONS PER SOURCE
gas consumption for heating
1% gas consumption for welding
2%
fuel consumption for transport
47%
fuel consumption for heating
18%
electricity - gray29%
electricity - green0%
city heating - other0%
business travel3%
ARENDONK CO2 EMISSIONS PER SOURCE
gas consumption for heating
54%
gas consumption for welding
2%
fuel consumption for transport
7%
fuel consumption for heating
8%
electricity - gray29%
electricity - green0%
city heating -other
0% business travel0%
BALEN CO2 EMISSIONS PER SOURCE
gas consumption for heating
21%
gas consumption for welding
6%
fuel consumption for transport
14%fuel consumption
for heating0%
electricity - gray58%
electricity - green1%
city heating - other0%
business travel0%
HOBOKEN CO2 EMISSIONS PER SOURCE
gas consumption for heating
0%
gas consumption for welding
2%
fuel consumption for transport
8%fuel consumption
for heating0%
electricity - gray72%
electricity - green0%
city heating - other17%
business travel1%
ZARY CO2 EMISSIONS PER SOURCE
gas consumption for heating
1%
gas consumption for welding
3%
fuel consumption for transport
67%
fuel consumption for heating
0%
electricity - gray29%
electricity - green0%
city heating -other
0%
business travel0%
NEWCASTLE CO2 EMISSIONS PER SOURCE
0,00
1000,00
2000,00
3000,00
4000,00
5000,00
6000,00
7000,00
8000,00
9000,00
10000,00
Arendonk (incl.Group)
Balen Hoboken Zary Newcastle UponTyne
RELATIVE CO2 EMISSIONS in kg CO2 / 1000 working hours

Emission inventory
scope 1 - 2
D-ENV-GR-021
27/04/2016
2015 million manhours worked : 3,351975 1,101579 0,28203 0,741729 0,420559 0,806078
scope item unit
conversionfactor
unit to
kg CO2-eq.
data ton CO2-eq.kg CO2-eq. / 1000 manhour
data ton CO2-eq.kg CO2-eq. / 1000 manhour
data ton CO2-eq.kg CO2-eq. / 1000 manhour
data ton CO2-eq.kg CO2-eq. / 1000 manhour
data ton CO2-eq.kg CO2-eq. / 1000 manhour
1gas consumption for heating
natural gasm
3 1,89 32182 60,82 55,22 61742 116,69 413,76 620936 1173,57 1582,21 0,00 0,00 15103,8 28,55 35,41
1gas consumption for heating
propaneL 1,725 192 0,33 0,30 311623 537,55 1906,00 0,00 0,00 0,00 0,00 0,00 0,00
1gas consumption for welding
propanekg 2,974 0 0,00 0,00 8106 24,11 85,48 49716 147,86 199,34 10428 31,01 73,74 26474,8 78,74 97,68
1gas consumption for welding
acethylenekg 3,385 12070 40,86 37,09 15650 52,98 187,84 851 2,88 3,88 2160 7,31 17,39 0,00 0,00
1gas consumption for welding
CO 2 + Euromix (15% CO 2 )kg 1 23313 23,31 21,16 24904 24,90 88,30 15147,5 15,15 20,42 14400 14,40 34,24 7503,7 7,50 9,31
1fuel consumption for transport of
passenger dieselL 3,2 287386 919,64 834,83 22668 72,54 257,20 28544 91,34 123,15 46200 147,84 351,53 0,00 0,00
1fuel consumption for transport of
goods diesel + fuel oilL 3,2 740005 2368,02 2149,66 24332 77,86 276,08 145873 466,79 629,33 0,00 0,00 550806,5 1762,58 2186,61
1fuel consumption for heating
fuel oilL 3,185 294193 937,00 850,60 131780 419,72 1488,21 0,00 0,00 0,00 0,00 0,0 0,00 0,00
2electricity
graykWh 0,526 2359218,9 1240,95 1126,52 1451947,6 763,72 2707,95 4992379,3 2625,99 3540,37 2713277 1427,18 3393,54 1418894,9 746,34 925,89
2electricity
windkWh 0 1638630,2 0,00 0,00 1008471,6 0,00 0,00 3467530,5 0,00 0,00 0,00 0,00 896143,8 0,00 0,00
2electricity
waterkWh 0 0,00 0,00 0,00 0,00 0,00 0,00 0,00 0,00 0,00 0,00
2electricity
biomasskWh 0,075 18329,2 1,37 1,25 11280,4 0,85 3,00 38786,7 2,91 3,92 0,00 0,00 93950,6 7,05 8,74
2electricity
thermalkWh 0 7331,7 0,00 0,00 4512,2 0,00 0,00 15514,7 0,00 0,00 0,00 0,00 0,00 0,00
2electricity
solarkWh 0 109895,0 0,0 0,0 56402,2 0,0 0,0 193933,5 0,00 0,00 0,00 0,00 0,00 0,00
2city heating
browncoalGj 64,3 0,00 0,00 0,00 0,00 0,00 0,00 5876 377,83 898,39 0,00 0,00
2business travel - plane
<700kmkm 0,297 265770 78,93 71,66 0 0,00 0,00 0 0,00 0,00 28266 8,40 19,96 0,00 0,00
2business travel - plane
700-2500kmkm 0,2 509940 101,99 92,58 48208 9,64 34,19 66896 13,38 18,04 7200 1,44 3,42 0,00 0,00
2business travel - plane
>2500kmkm 0,147 108028 15,88 14,42 0 0,00 0,00 0 0,00 0,00 0 0,00 0,00 0,00 0,00
2business travel - train
intercitykm 0,024 364 0,01 0,01 0,00 0,00 0,00 0,00 0,00 0,00 0,00 0,00
2business travel - train
high-speedkm 0,026 148889 3,87 3,51 0,00 0,00 0,00 0,00 0,00 0,00 0,00 0,00
white applicable, OK yellow applicable, no data or doubtfull grey not applicable orange incomplete 100% of baseyear
TOTAL Arendonk (incl. Group) Balen Hoboken Zary Newcastle Upon Tyne
% CO2-eq. ton CO2-eq. ton CO2-eq. % CO2-eq. kg CO2-eq. / 1000 manhour
ton CO2-eq. % CO2-eq. kg CO2-eq. / 1000 manhour
ton CO2-eq. % CO2-eq. kg CO2-eq. / 1000 manhour
ton CO2-eq. % CO2-eq. kg CO2-eq. / 1000 manhour
ton CO2-eq. % CO2-eq. kg CO2-eq. / 1000 manhour
gas consumption for heating 11,23% 1917,51 61,16 1,06% 55,52 654,24 31,15% 2319,76 1173,57 25,85% 1582,21 0,00 0,00% 0,00 28,55 1,09% 35,41
gas consumption for welding 2,76% 471,00 64,17 1,11% 58,25 101,99 4,86% 361,62 165,88 3,65% 223,64 52,72 2,62% 125,37 86,24 3,28% 106,99
fuel consumption for transport 34,58% 5906,61 3287,65 56,75% 2984,49 150,40 7,16% 533,27 558,13 12,29% 752,48 147,84 7,34% 351,53 1762,58 67,00% 2186,61
fuel consumption for heating 7,94% 1356,72 937,00 16,17% 850,60 419,72 19,98% 1488,21 0,00 0,00% 0,00 0,00 0,00% 0,00 0,00 0,00% 0,00
SUM SCOPE 1 56,51% 9651,85 4349,98 75,09% 3948,86 1326,35 63,14% 4702,86 1897,59 41,80% 2558,33 200,56 9,95% 476,90 1877,37 71,36% 2329,01
percentage of total scope 1 45,07% 13,74% 19,66% 2,08% 19,45%
electricity - gray 39,84% 6804,19 1240,95 21,42% 1126,52 763,72 36,36% 2707,95 2625,99 57,84% 3540,37 1427,18 70,81% 3393,54 746,34 28,37% 925,89
electricity - green 0,07% 12,18 1,37 0,02% 1,25 0,85 0,04% 3,00 2,91 0,06% 3,92 0,00 0,00% 0,00 7,05 0,27% 8,74
city heating - other 2,21% 377,83 0,00 0,00% 0,00 0,00 0,00% 0,00 0,00 0,00% 0,00 377,83 18,75% 898,39 0,00 0,00% 0,00
business travel 1,37% 233,54 200,68 3,46% 182,18 9,64 0,46% 34,19 13,38 0,29% 18,04 9,84 0,49% 23,39 0,00 0,00% 0,00
SUM SCOPE 2 43,49% 7427,73 1443,01 24,91% 1309,94 774,21 36,86% 2745,14 2642,28 58,20% 3562,32 1814,85 90,05% 4315,32 753,39 28,64% 934,63
percentage of total scope 2 19,43% 10,42% 35,57% 24,43% 10,14%
SUM TOTAL 17079,58 5792,99 5258,80 2100,56 7448,00 4539,87 6120,65 2015,41 4792,22 2630,75 3263,64
percentage of total 33,92% 12,30% 26,58% 11,80% 15,40%
Zary Newcastle-Upon-Tyne
S
C
O
P
E
1
S
C
O
P
E
2
Arendonk + Group Balen Hoboken

Emission inventory
scope 1 - 2
D-ENV-GR-021
27/04/2016
Arendonk (incl. Group)
34%
Balen12%
Hoboken27%
Zary12%
Newcastle Upon Tyne15%
TOTAL CO2 EMISSIONS PER FIRM
0,00
2000,00
4000,00
6000,00
8000,00
10000,00
12000,00
14000,00
16000,00
18000,00
TONS CO2 EMISSIONS
Scope 1 Scope 2 Total
gas consumption for heating
11%
gas consumption for welding
3%
fuel consumption for transport
35%
fuel consumption for heating
8%
electricity - gray40%
electricity - green0%
city heating - other2%
business travel1%
TOTAL CO2 EMISSIONS PER SOURCE
gas consumption for heating
1%gas consumption
for welding1%
fuel consumption for transport
57%fuel consumption
for heating16%
electricity - gray21%
electricity - green0%
city heating - other0%
business travel4%
ARENDONK CO2 EMISSIONS PER SOURCE
gas consumption for heating
31%
gas consumption for welding
5%fuel consumption
for transport7%
fuel consumption for heating
20%
electricity - gray36%
electricity - green0%
city heating -other
0%business travel
1%
BALEN CO2 EMISSIONS PER SOURCE
gas consumption for heating
26%
gas consumption for welding
4%
fuel consumption for transport
12%fuel consumption
for heating0%
electricity - gray58%
electricity - green0%
city heating - other0%
business travel0%
HOBOKEN CO2 EMISSIONS PER SOURCE
gas consumption for heating
0%
gas consumption for welding
3%fuel consumption
for transport7%
fuel consumption for heating
0%
electricity - gray71%
electricity - green0%
city heating - other19%
business travel0%
ZARY CO2 EMISSIONS PER SOURCEgas consumption
for heating1%
gas consumption for welding
3%
fuel consumption for transport
67%
fuel consumption for heating
0%
electricity - gray29%
electricity - green0%
city heating -other
0%
business travel0%
NEWCASTLE CO2 EMISSIONS PER SOURCE
0,00
1000,00
2000,00
3000,00
4000,00
5000,00
6000,00
7000,00
8000,00
Arendonk (incl.Group)
Balen Hoboken Zary Newcastle UponTyne
RELATIVE CO2 EMISSIONS in kg CO2 / 1000 working hours
Emission inventory
scope 1 - 2
D-ENV-GR-021
27/04/2016
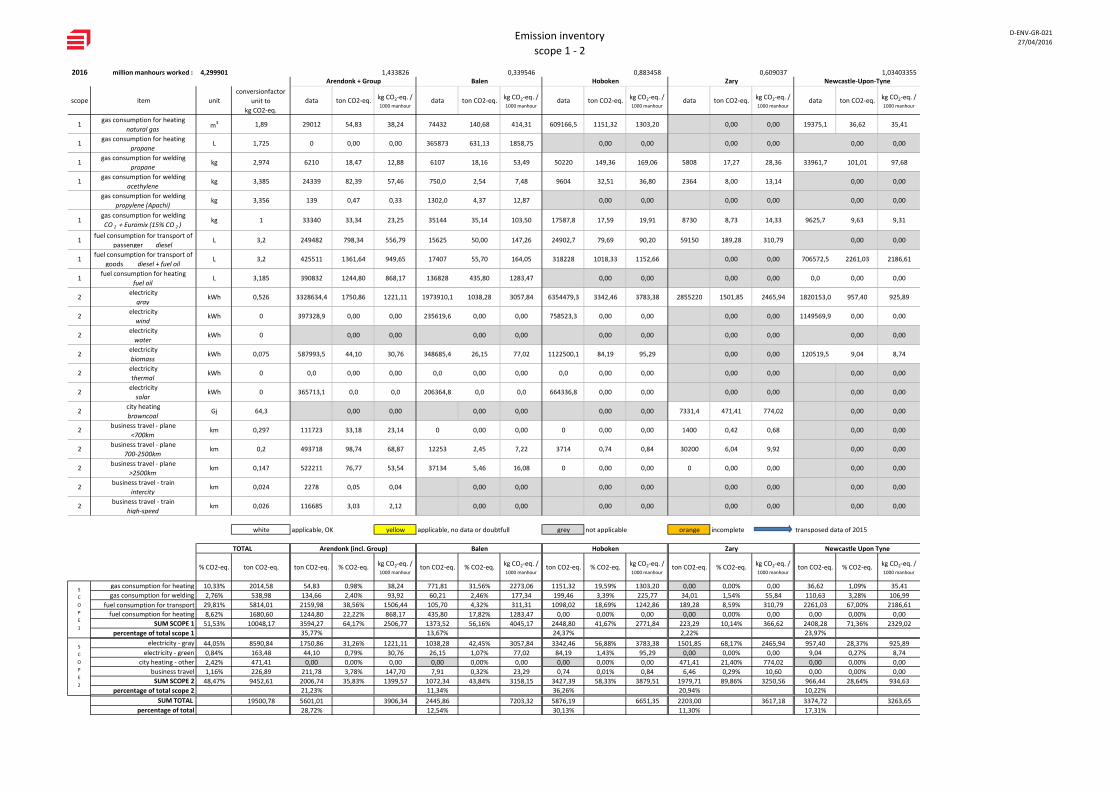
2016 million manhours worked : 4,299901 1,433826 0,339546 0,883458 0,609037 1,03403355
scope item unit
conversionfactor
unit to
kg CO2-eq.
data ton CO2-eq. kg CO2-eq. / 1000 manhour
data ton CO2-eq. kg CO2-eq. / 1000 manhour
data ton CO2-eq. kg CO2-eq. / 1000 manhour
data ton CO2-eq. kg CO2-eq. / 1000 manhour
data ton CO2-eq. kg CO2-eq. / 1000 manhour
1gas consumption for heating
natural gasm3 1,89 29012 54,83 38,24 74432 140,68 414,31 609166,5 1151,32 1303,20 0,00 0,00 19375,1 36,62 35,41
1gas consumption for heating
propaneL 1,725 0 0,00 0,00 365873 631,13 1858,75 0,00 0,00 0,00 0,00 0,00 0,00
1gas consumption for welding
propanekg 2,974 6210 18,47 12,88 6107 18,16 53,49 50220 149,36 169,06 5808 17,27 28,36 33961,7 101,01 97,68
1gas consumption for welding
acethylenekg 3,385 24339 82,39 57,46 750,0 2,54 7,48 9604 32,51 36,80 2364 8,00 13,14 0,00 0,00
gas consumption for welding
propylene (Apachi)kg 3,356 139 0,47 0,33 1302,0 4,37 12,87 0,00 0,00 0,00 0,00 0,00 0,00
1gas consumption for welding
CO 2 + Euromix (15% CO 2 )kg 1 33340 33,34 23,25 35144 35,14 103,50 17587,8 17,59 19,91 8730 8,73 14,33 9625,7 9,63 9,31
1fuel consumption for transport of
passenger dieselL 3,2 249482 798,34 556,79 15625 50,00 147,26 24902,7 79,69 90,20 59150 189,28 310,79 0,00 0,00
1fuel consumption for transport of
goods diesel + fuel oilL 3,2 425511 1361,64 949,65 17407 55,70 164,05 318228 1018,33 1152,66 0,00 0,00 706572,5 2261,03 2186,61
1fuel consumption for heating
fuel oilL 3,185 390832 1244,80 868,17 136828 435,80 1283,47 0,00 0,00 0,00 0,00 0,0 0,00 0,00
2electricity
graykWh 0,526 3328634,4 1750,86 1221,11 1973910,1 1038,28 3057,84 6354479,3 3342,46 3783,38 2855220 1501,85 2465,94 1820153,0 957,40 925,89
2electricity
windkWh 0 397328,9 0,00 0,00 235619,6 0,00 0,00 758523,3 0,00 0,00 0,00 0,00 1149569,9 0,00 0,00
2electricity
waterkWh 0 0,00 0,00 0,00 0,00 0,00 0,00 0,00 0,00 0,00 0,00
2electricity
biomasskWh 0,075 587993,5 44,10 30,76 348685,4 26,15 77,02 1122500,1 84,19 95,29 0,00 0,00 120519,5 9,04 8,74
2electricity
thermalkWh 0 0,0 0,00 0,00 0,0 0,00 0,00 0,0 0,00 0,00 0,00 0,00 0,00 0,00
2electricity
solarkWh 0 365713,1 0,0 0,0 206364,8 0,0 0,0 664336,8 0,00 0,00 0,00 0,00 0,00 0,00
2city heating
browncoalGj 64,3 0,00 0,00 0,00 0,00 0,00 0,00 7331,4 471,41 774,02 0,00 0,00
2business travel - plane
<700kmkm 0,297 111723 33,18 23,14 0 0,00 0,00 0 0,00 0,00 1400 0,42 0,68 0,00 0,00
2business travel - plane
700-2500kmkm 0,2 493718 98,74 68,87 12253 2,45 7,22 3714 0,74 0,84 30200 6,04 9,92 0,00 0,00
2business travel - plane
>2500kmkm 0,147 522211 76,77 53,54 37134 5,46 16,08 0 0,00 0,00 0 0,00 0,00 0,00 0,00
2business travel - train
intercitykm 0,024 2278 0,05 0,04 0,00 0,00 0,00 0,00 0,00 0,00 0,00 0,00
2business travel - train
high-speedkm 0,026 116685 3,03 2,12 0,00 0,00 0,00 0,00 0,00 0,00 0,00 0,00
white applicable, OK yellow applicable, no data or doubtfull grey not applicable orange incomplete transposed data of 2015
TOTAL Arendonk (incl. Group) Balen Hoboken Zary Newcastle Upon Tyne
% CO2-eq. ton CO2-eq. ton CO2-eq. % CO2-eq.kg CO2-eq. / 1000 manhour
ton CO2-eq. % CO2-eq.kg CO2-eq. / 1000 manhour
ton CO2-eq. % CO2-eq.kg CO2-eq. / 1000 manhour
ton CO2-eq. % CO2-eq.kg CO2-eq. / 1000 manhour
ton CO2-eq. % CO2-eq.kg CO2-eq. / 1000 manhour
gas consumption for heating 10,33% 2014,58 54,83 0,98% 38,24 771,81 31,56% 2273,06 1151,32 19,59% 1303,20 0,00 0,00% 0,00 36,62 1,09% 35,41
gas consumption for welding 2,76% 538,98 134,66 2,40% 93,92 60,21 2,46% 177,34 199,46 3,39% 225,77 34,01 1,54% 55,84 110,63 3,28% 106,99
fuel consumption for transport 29,81% 5814,01 2159,98 38,56% 1506,44 105,70 4,32% 311,31 1098,02 18,69% 1242,86 189,28 8,59% 310,79 2261,03 67,00% 2186,61
fuel consumption for heating 8,62% 1680,60 1244,80 22,22% 868,17 435,80 17,82% 1283,47 0,00 0,00% 0,00 0,00 0,00% 0,00 0,00 0,00% 0,00
SUM SCOPE 1 51,53% 10048,17 3594,27 64,17% 2506,77 1373,52 56,16% 4045,17 2448,80 41,67% 2771,84 223,29 10,14% 366,62 2408,28 71,36% 2329,02
percentage of total scope 1 35,77% 13,67% 24,37% 2,22% 23,97%
electricity - gray 44,05% 8590,84 1750,86 31,26% 1221,11 1038,28 42,45% 3057,84 3342,46 56,88% 3783,38 1501,85 68,17% 2465,94 957,40 28,37% 925,89
electricity - green 0,84% 163,48 44,10 0,79% 30,76 26,15 1,07% 77,02 84,19 1,43% 95,29 0,00 0,00% 0,00 9,04 0,27% 8,74
city heating - other 2,42% 471,41 0,00 0,00% 0,00 0,00 0,00% 0,00 0,00 0,00% 0,00 471,41 21,40% 774,02 0,00 0,00% 0,00
business travel 1,16% 226,89 211,78 3,78% 147,70 7,91 0,32% 23,29 0,74 0,01% 0,84 6,46 0,29% 10,60 0,00 0,00% 0,00
SUM SCOPE 2 48,47% 9452,61 2006,74 35,83% 1399,57 1072,34 43,84% 3158,15 3427,39 58,33% 3879,51 1979,71 89,86% 3250,56 966,44 28,64% 934,63
percentage of total scope 2 21,23% 11,34% 36,26% 20,94% 10,22%
SUM TOTAL 19500,78 5601,01 3906,34 2445,86 7203,32 5876,19 6651,35 2203,00 3617,18 3374,72 3263,65
percentage of total 28,72% 12,54% 30,13% 11,30% 17,31%
Zary Newcastle-Upon-Tyne
S
C
O
P
E
1
S
C
O
P
E
2
Arendonk + Group Balen Hoboken

Emission inventory
scope 1 - 2
D-ENV-GR-021
27/04/2016
Arendonk (incl. Group)
29%
Balen13%
Hoboken30%
Zary11%
Newcastle Upon Tyne17%
TOTAL CO2 EMISSIONS PER FIRM
0,00
5000,00
10000,00
15000,00
20000,00
25000,00
TONS CO2 EMISSIONS
Scope 1 Scope 2 Total
gas consumption for heating
10%
gas consumption for welding
3%
fuel consumption for transport
30%
fuel consumption for heating
9%
electricity - gray44%
electricity - green1%
city heating -other
2%
business travel1%
TOTAL CO2 EMISSIONS PER SOURCE
gas consumption for heating
1%
gas consumption for welding
2%
fuel consumption for transport
39%
fuel consumption for heating
22%
electricity - gray31%
electricity - green1%
city heating - other0%
business travel4%
ARENDONK CO2 EMISSIONS PER SOURCE
gas consumption for heating
32%
gas consumption for welding
3%fuel consumption for transport
4%fuel consumption
for heating18%
electricity - gray42%
electricity - green1%
city heating -other
0%business travel
0%
BALEN CO2 EMISSIONS PER SOURCE
gas consumption for heating
20%
gas consumption for welding
3%
fuel consumption for transport
19%
fuel consumption for heating
0%
electricity - gray57%
electricity - green1%
city heating -other
0%business travel
0%
HOBOKEN CO2 EMISSIONS PER SOURCE
gas consumption for heating
0%
gas consumption for welding
2%
fuel consumption for transport
9%fuel consumption
for heating0%
electricity - gray68%
electricity - green0%
city heating - other21%
business travel0%
ZARY CO2 EMISSIONS PER SOURCE
gas consumption for heating
1%gas consumption
for welding3%
fuel consumption for transport
67%
fuel consumption for heating
0%
electricity - gray29%
electricity - green0%
city heating -other
0%
business travel0%
NEWCASTLE CO2 EMISSIONS PER SOURCE
0,00
1000,00
2000,00
3000,00
4000,00
5000,00
6000,00
7000,00
8000,00
Arendonk (incl.Group)
Balen Hoboken Zary Newcastle UponTyne
RELATIVE CO2 EMISSIONS in kg CO2 / 1000 working hours

Emission inventory
scope 1 - 2
D-ENV-GR-021
27/04/2016
2017 million manhours worked : 5,038455 1,559898 0,376119 1,121572 0,769226 1,21164
scope item unit
conversionfactor
unit to
kg CO2-eq.
data ton CO2-eq. kg CO2-eq. / 1000 manhour
data ton CO2-eq. kg CO2-eq. / 1000 manhour
data ton CO2-eq. kg CO2-eq. / 1000 manhour
data ton CO2-eq. kg CO2-eq. / 1000 manhour
data ton CO2-eq. kg CO2-eq. / 1000 manhour
1gas consumption for heating
natural gasm3 1,89 38771 73,28 46,98 90349 170,76 454,01 574622 1086,04 968,32 0,00 0,00 22703 42,91 35,41
1gas consumption for heating
propaneL 1,725 0 0,00 0,00 413687 713,61 1897,30 0,00 0,00 0,00 0,00 0,00 0,00
1gas consumption for welding
propanekg 2,974 20334 60,48 38,77 11043 32,84 87,32 72447 215,47 192,11 4983 14,82 19,27 39795 118,36 97,68
1gas consumption for welding
acethylenekg 3,385 34255 115,95 74,33 500,0 1,69 4,50 3894 13,18 11,75 4662 15,78 20,52 0,00 0,00
gas consumption for welding
propylene (Apachi)kg 3,356 11306 37,94 24,32 1212,0 4,07 10,81 0,00 0,00 0,00 0,00 0,00 0,00
1gas consumption for welding
CO 2 + Euromix (15% CO 2 )kg 1 50473 50,47 32,36 36416 36,42 96,82 29769 29,77 26,54 7831 7,83 10,18 11279 11,28 9,31
1fuel consumption for transport of
passenger dieselL 3,2 279632 894,82 573,64 18380 58,82 156,38 25055,21 80,18 71,49 62950 201,44 261,87 0,00 0,00
1fuel consumption for transport of
goods diesel + fuel oilL 3,2 468062,1 1497,80 960,19 23562 75,40 200,46 446372 1428,39 1273,56 0,00 0,00 827934 2649,39 2186,61
1fuel consumption for heating
fuel oilL 3,185 453166 1443,33 925,27 160493 511,17 1359,07 0,00 0,00 0,00 0,00 0,00 0,00
2electricity
graykWh 0,649 0,00 0,00 0,00 0,00 0,00 0,00 3478000 2257,22 2934,41 2132784 1384,18 1142,40
2electricity
windkWh 0 0,00 0,00 0,00 0,00 0,00 0,00 0,00 0,00 1347021 0,00 0,00
2electricity
waterkWh 0 0,00 0,00 0,00 0,00 0,00 0,00 0,00 0,00 0,00 0,00
2electricity
biomasskWh 0,075 0,00 0,00 0,00 0,00 0,00 0,00 0,00 0,00 141220 10,59 8,74
2electricity
thermalkWh 0 0,00 0,00 0,00 0,00 0,00 0,00 0,00 0,00 0,00 0,00
2electricity
solarkWh 0 5552820 0,0 0,0 3549367 0,0 0,0 8227874 0,00 0,00 0,00 0,00 0,00 0,00
2city heating
browncoalGj 64,3 0,00 0,00 0,00 0,00 0,00 0,00 5978 384,39 499,70 0,00 0,00
2business travel - plane
<700kmkm 0,297 173925 51,66 33,11 702 0,21 0,55 22314 6,63 5,91 0 0,00 0,00 0,00 0,00
2business travel - plane
700-2500kmkm 0,2 1128436 225,69 144,68 34278 6,86 18,23 117725 23,55 20,99 2576 0,52 0,67 0,00 0,00
2business travel - plane
>2500kmkm 0,147 999147 146,87 94,16 47576 6,99 18,59 108002 15,88 14,16 0 0,00 0,00 0,00 0,00
2business travel - train
stoptrain / intercitykm 0,024 5675 0,14 0,09 0,00 0,00 0,00 0,00 0,00 0,00 0,00 0,00
2business travel - train
high-speedkm 0,026 139120 3,62 2,32 0,00 0,00 7242 0,19 0,17 0,00 0,00 0,00 0,00
white applicable, OK yellow applicable, no data or doubtfull grey not applicable orange incomplete transposed data of 2016
TOTAL Arendonk (incl. Group) Balen Hoboken Zary Newcastle Upon Tyne
% CO2-eq. ton CO2-eq. ton CO2-eq. % CO2-eq.kg CO2-eq. / 1000 manhour
ton CO2-eq. % CO2-eq.kg CO2-eq. / 1000 manhour
ton CO2-eq. % CO2-eq.kg CO2-eq. / 1000 manhour
ton CO2-eq. % CO2-eq.kg CO2-eq. / 1000 manhour
ton CO2-eq. % CO2-eq.kg CO2-eq. / 1000 manhour
gas consumption for heating 12,87% 2086,59 73,28 1,59% 46,98 884,37 54,63% 2351,31 1086,04 37,46% 968,32 0,00 0,00% 0,00 42,91 1,02% 35,41
gas consumption for welding 4,73% 766,35 264,85 5,75% 169,78 75,02 4,63% 199,46 258,42 8,91% 230,41 38,43 1,33% 49,96 129,63 3,07% 106,99
fuel consumption for transport 42,46% 6886,23 2392,62 51,99% 1533,83 134,21 8,29% 356,84 1508,57 52,03% 1345,05 201,44 6,99% 261,87 2649,39 62,83% 2186,61
fuel consumption for heating 12,05% 1954,50 1443,33 31,36% 925,27 511,17 31,58% 1359,07 0,00 0,00% 0,00 0,00 0,00% 0,00 0,00 0,00% 0,00
SUM SCOPE 1 72,10% 11693,68 4174,08 90,70% 2675,87 1604,77 99,13% 4266,67 2853,02 98,41% 2543,77 239,87 8,32% 311,84 2821,93 66,92% 2329,02
percentage of total scope 1 35,70% 13,72% 24,40% 2,05% 24,13%
electricity - gray 22,45% 3641,40 0,00 0,00% 0,00 0,00 0,00% 0,00 0,00 0,00% 0,00 2257,22 78,32% 2934,41 1384,18 32,83% 1142,40
electricity - green 0,07% 10,59 0,00 0,00% 0,00 0,00 0,00% 0,00 0,00 0,00% 0,00 0,00 0,00% 0,00 10,59 0,25% 8,74
city heating - other 2,37% 384,39 0,00 0,00% 0,00 0,00 0,00% 0,00 0,00 0,00% 0,00 384,39 13,34% 499,70 0,00 0,00% 0,00
business travel 3,01% 488,78 427,97 9,30% 274,36 14,06 0,87% 37,38 46,24 1,59% 41,23 0,52 0,02% 0,67 0,00 0,00% 0,00
SUM SCOPE 2 27,90% 4525,16 427,97 9,30% 274,36 14,06 0,87% 37,38 46,24 1,59% 41,23 2642,12 91,68% 3434,78 1394,77 33,08% 1151,14
percentage of total scope 2 9,46% 0,31% 1,02% 58,39% 30,82%
SUM TOTAL 16218,83 4602,05 2950,22 1618,83 4304,04 2899,26 2584,99 2881,99 3746,62 4216,70 3480,16
percentage of total 28,37% 9,98% 17,88% 17,77% 26,00%
Newcastle-Upon-Tyne
S
C
O
P
E
1
S
C
O
P
E
2
Arendonk + Group Balen Hoboken Zary

Emission inventory
scope 1 - 2
D-ENV-GR-021
27/04/2016
Arendonk (incl. Group)
28%
Balen10%
Hoboken18%
Zary18%
Newcastle Upon Tyne26%
TOTAL CO2 EMISSIONS PER FIRM
0,00
2000,00
4000,00
6000,00
8000,00
10000,00
12000,00
14000,00
16000,00
18000,00
TONS CO2 EMISSIONS
Scope 1 Scope 2 Total
gas consumption for heating
13%gas consumption
for welding5%
fuel consumption for transport
43%
fuel consumption for heating
12%
electricity - gray22%
electricity - green0%
city heating -other
2%
business travel3%
TOTAL CO2 EMISSIONS PER SOURCE
gas consumption for heating
2%gas consumption
for welding6%
fuel consumption for transport
52%
fuel consumption for heating
31%
electricity - gray0%
electricity - green0%
city heating - other0%
business travel9%
ARENDONK + GROUP CO2 EMISSIONS PER SOURCE
gas consumption for heating
55%
gas consumption for welding
5%
fuel consumption for transport
8%
fuel consumption for heating
31%
electricity - gray0%
electricity - green0%
city heating - other0%
business travel1%
BALEN CO2 EMISSIONS PER SOURCE
gas consumption for heating
37%
gas consumption for welding
9%
fuel consumption for transport
52%
fuel consumption for heating
0%
electricity - gray0%
electricity - green0%
city heating -other
0%business travel
2%
HOBOKEN CO2 EMISSIONS PER SOURCE
gas consumption for heating
0%
gas consumption for welding
1%fuel consumption
for transport7%
fuel consumption for heating
0%
electricity - gray78%
electricity - green0%
city heating - other14%
business travel0%
ZARY CO2 EMISSIONS PER SOURCE
gas consumption for heating
1%
gas consumption for welding
3%
fuel consumption for transport
63%
fuel consumption for heating
0%
electricity - gray33%
electricity - green0%
city heating - other0%
business travel0%
NEWCASTLE CO2 EMISSIONS PER SOURCE
0,00
500,00
1000,00
1500,00
2000,00
2500,00
3000,00
3500,00
4000,00
4500,00
5000,00
Arendonk (incl.Group)
Balen Hoboken Zary Newcastle UponTyne
RELATIVE CO2 EMISSIONS in kg CO2
/ 1000 working hours

Emission inventory
scope 1 - 2
D-ENV-GR-021
27/04/2016
2018 million manhours worked : 3,419640 1,022648 0,26708 0,970621 0,622649 0,536642
scope item unit
conversion
factor unit to
kg CO2-eq.
data ton CO2-eq. kg CO2-eq. / 1000 manhour
data ton CO2-eq. kg CO2-eq. / 1000 manhour
data ton CO2-eq. kg CO2-eq. / 1000 manhour
data ton CO2-eq. kg CO2-eq. / 1000 manhour
data ton CO2-eq. kg CO2-eq. / 1000 manhour
1gas consumption for heating
natural gasm3 1,89 28.921 54,66 53,45 71.327 134,81 504,75 366.443 692,58 713,54 0,00 0,00 29.919 56,55 105,37
1gas consumption for heating
propaneL 1,725 0,00 0,00 355.503 613,24 2296,10 0,00 0,00 0,00 0,00 0,00 0,00
1gas consumption for welding
propanekg 2,974 10.267 30,54 29,86 1.738 5,17 19,35 83.235 247,55 255,05 4.917 14,62 23,49 9.875 29,37 54,73
1gas consumption for welding
acethylenekg 3,385 3.975 13,46 13,16 140 0,47 1,77 2.381 8,06 8,30 1.846 6,25 10,04 0,00 0,00
gas consumption for welding
propylene (Apachi)kg 3,356 6.542 21,96 21,47 - 0,00 0,00 0,00 0,00 0,00 0,00 0,00 0,00
1gas consumption for welding
CO 2 + Euromix (15% CO 2 )kg 1 36.317 36,32 35,51 20.801 20,80 77,88 6.384 6,38 6,58 9.485 9,49 15,23 6.750 6,75 12,58
1fuel consumption for transport of
passenger dieselL 3,2 266.568 853,02 834,13 21.614 69,17 258,97 38.493 123,18 126,91 40.000 128,00 205,57 0,00 0,00
1fuel consumption for transport of
goods diesel + fuel oilL 3,2 396.697 1269,43 1241,32 20.619 65,98 247,05 421.090 1347,49 1388,27 0,00 0,00 334.944 1071,82 1997,27
1fuel consumption for heating
fuel oilL 3,185 321.526 1024,06 1001,38 180.714 575,57 2155,06 0,00 0,00 0,00 0,00 0,00 0,00
2electricity
graykWh 0,649 0,00 0,00 0,00 0,00 336.000 218,06 224,66 2.363.706 1534,05 2463,74 2.415.481 1567,65 2921,22
2electricity
windkWh 0 0,00 0,00 0,00 0,00 0,00 0,00 0,00 0,00 582.832 0,00 0,00
2electricity
waterkWh 0 0,00 0,00 0,00 0,00 0,00 0,00 0,00 0,00 0,00 0,00
2electricity
biomasskWh 0,075 0,00 0,00 0,00 0,00 0,00 0,00 0,00 0,00 101.852 7,64 14,23
2electricity
thermalkWh 0 0,00 0,00 0,00 0,00 0,00 0,00 0,00 0,00 0,00 0,00
2electricity
solarkWh 0 5.143.533 0,0 0,0 2.647.570 0,0 0,0 6.954.525 0,00 0,00 0,00 0,00 0,00 0,00
2city heating
browncoalGj 64,3 0,00 0,00 0,00 0,00 0,00 0,00 6.421 412,87 663,09 0,00 0,00
2business travel - plane
<700kmkm 0,297 656.107 194,86 190,55 2.476 0,74 2,75 20.505 6,09 6,27 - 0,00 0,00 0,00 0,00
2business travel - plane
700-2500kmkm 0,2 368.572 73,71 72,08 - 0,00 0,00 9.530 1,91 1,96 - 0,00 0,00 0,00 0,00
2business travel - plane
>2500kmkm 0,147 871.727 128,14 125,31 - 0,00 0,00 16.003 2,35 2,42 - 0,00 0,00 0,00 0,00
2business travel - train
stoptrain / intercitykm 0,024 17.090 0,41 0,40 0,00 0,00 0,00 0,00 0,00 0,00 0,00 0,00
2business travel - train
high-speedkm 0,026 183.943 4,78 4,68 0,00 0,00 - 0,00 0,00 0,00 0,00 0,00 0,00
white applicable, OK yellow applicable, no data or doubtfull grey not applicable orange incomplete transposed data of 2016
TOTAL Arendonk (incl. Group) Balen Hoboken Zary Newcastle Upon Tyne
% CO2-eq. ton CO2-eq. ton CO2-eq. % CO2-eq. kg CO2-eq. / 1000 manhour
ton CO2-eq. % CO2-eq. kg CO2-eq. / 1000 manhour
ton CO2-eq. % CO2-eq. kg CO2-eq. / 1000 manhour
ton CO2-eq. % CO2-eq. kg CO2-eq. / 1000 manhour
ton CO2-eq. % CO2-eq. kg CO2-eq. / 1000 manhour
gas consumption for heating 12,23% 1551,84 54,66 1,48% 53,45 748,05 50,34% 2800,85 692,58 26,10% 713,54 0,00 0,00% 0,00 56,55 2,06% 105,37
gas consumption for welding 3,60% 457,18 102,26 2,76% 100,00 26,44 1,78% 99,01 262,00 9,87% 269,93 30,36 1,44% 48,76 36,12 1,32% 67,31
fuel consumption for transport 38,83% 4928,08 2122,45 57,28% 2075,44 135,15 9,09% 506,01 1470,67 55,42% 1515,18 128,00 6,08% 205,57 1071,82 39,12% 1997,27
fuel consumption for heating 12,61% 1599,63 1024,06 27,64% 1001,38 575,57 38,73% 2155,06 0,00 0,00% 0,00 0,00 0,00% 0,00 0,00 0,00% 0,00
SUM SCOPE 1 67,27% 8536,73 3303,43 89,15% 3230,27 1485,21 99,95% 5560,94 2425,24 91,39% 2498,65 158,36 7,52% 254,33 1164,49 42,50% 2169,95
percentage of total scope 1 38,70% 17,40% 28,41% 1,86% 13,64%
electricity - gray 26,16% 3319,76 0,00 0,00% 0,00 0,00 0,00% 0,00 218,06 8,22% 224,66 1534,05 72,87% 2463,74 1567,65 57,22% 2921,22
electricity - green 0,06% 7,64 0,00 0,00% 0,00 0,00 0,00% 0,00 0,00 0,00% 0,00 0,00 0,00% 0,00 7,64 0,28% 14,23
city heating - other 3,25% 412,87 0,00 0,00% 0,00 0,00 0,00% 0,00 0,00 0,00% 0,00 412,87 19,61% 663,09 0,00 0,00% 0,00
business travel 3,25% 413,00 401,91 10,85% 393,01 0,74 0,05% 2,75 10,35 0,39% 10,66 0,00 0,00% 0,00 0,00 0,00% 0,00
SUM SCOPE 2 32,73% 4153,26 401,91 10,85% 393,01 0,74 0,05% 2,75 228,41 8,61% 235,33 1946,92 92,48% 3126,83 1575,29 57,50% 2935,45
percentage of total scope 2 9,68% 0,02% 5,50% 46,88% 37,93%
SUM TOTAL 12689,99 3705,35 3623,29 1485,95 5563,69 2653,65 2733,97 2105,27 3381,16 2739,77 5105,40
percentage of total 29,20% 11,71% 20,91% 16,59% 21,59%
Newcastle-Upon-Tyne
S
C
O
P
E
1
S
C
O
P
E
2
Arendonk + Group Balen Hoboken Zary
TOTAL CO2 EMISSIONS PER FIRMTONS CO2 EMISSIONS TOTAL CO2 EMISSIONS PER SOURCE

Emission inventory
scope 1 - 2
D-ENV-GR-021
27/04/2016
Arendonk (incl. Group)
29%
Balen12%
Hoboken21%
Zary16%
Newcastle Upon Tyne22%
TOTAL CO2 EMISSIONS PER FIRM
0,00
2000,00
4000,00
6000,00
8000,00
10000,00
12000,00
14000,00
TONS CO2 EMISSIONS
Scope 1 Scope 2 Total
gas consumption for heating
12%gas consumption
for welding4%
fuel consumption for transport
39%fuel consumption for heating
13%
electricity - gray26%
electricity - green0%
city heating -other
3%
business travel3%
TOTAL CO2 EMISSIONS PER SOURCE
gas consumption for heating
1%gas consumption
for welding3%
fuel consumption for transport
57%
fuel consumption for heating
28%
electricity - gray0%
electricity - green0%
city heating - other0%
business travel11%
ARENDONK + GROUP CO2 EMISSIONS PER SOURCE
gas consumption for heating
50%
gas consumption for welding
2%
fuel consumption for transport
9%
fuel consumption for heating
39%
electricity - gray0%
electricity - green0%
city heating - other0%
business travel0%
BALEN CO2 EMISSIONS PER SOURCE
gas consumption for heating
26%
gas consumption for welding
10%fuel consumption
for transport56%
fuel consumption for heating
0%
electricity - gray8%
electricity - green0%
city heating -other
0%business travel
0%
HOBOKEN CO2 EMISSIONS PER SOURCE
gas consumption for heating
0%
gas consumption for welding
1%fuel consumption
for transport6%
fuel consumption for heating
0%
electricity - gray73%
electricity - green0%
city heating - other20%
business travel0%
ZARY CO2 EMISSIONS PER SOURCE
gas consumption for heating
2%
gas consumption for welding
2%
fuel consumption for transport
39%
fuel consumption for heating
0%
electricity - gray57%
electricity - green0%
city heating - other0%
business travel0%
NEWCASTLE CO2 EMISSIONS PER SOURCE
0,00
1000,00
2000,00
3000,00
4000,00
5000,00
6000,00
Arendonk (incl.Group)
Balen Hoboken Zary Newcastle UponTyne
RELATIVE CO2 EMISSIONS in kg CO2
/ 1000 working hours

COMPARISON SCOPE 1-2 EMISSION ACROSS THE YEARS
2014 2015 2016 2017 2018 2019
Arendonk + Group 3120,2 4350,0 3594,27 4174,08 3303,43
Balen 1681,5 1326,3 1373,52 1604,77 1485,21
Hoboken 1689,5 1897,6 2448,80 2853,02 2425,24
Zary 181,7 200,6 223,29 239,87 158,36
Newcastle-Upon-Tyne 1880,2 1877,4 2408,28 2821,93 1164,49
Total 8553,2 9651,8 10048,17 11693,68 8536,73
Arendonk + Group 1494,2 1443,0 2006,74 427,97 401,91
Balen 691,1 774,2 1072,34 14,06 0,74
Hoboken 2446,9 2642,3 3427,39 46,24 228,41
Zary 1556,9 1814,8 1979,71 2642,12 1946,92
Newcastle-Upon-Tyne 754,5 753,4 966,44 1394,77 1575,29
Total 6943,5 7427,7 9452,61 4525,16 4153,26
Arendonk + Group 4614,4 5793,0 5601,01 4602,05 3705,35
Balen 2372,6 2100,6 2445,86 1618,83 1485,95
Hoboken 4136,4 4539,9 5876,19 2899,26 2653,65
Zary 1738,6 2015,4 2203,00 2881,99 2105,27
Newcastle-Upon-Tyne 2634,8 2630,8 3374,72 4216,70 2739,77
Total 15496,7 17079,6 19500,78 16218,83 12689,99
COMPARISON SCOPE 1-2 EMISSION ACROSS THE YEARS
2014 2015 2016 2017 2018 2019
Arendonk + Group 2912,4 3948,9 2506,8 2675,9 3230,3
ABSOLUTE (ton CO2)
RELATIVE (kg CO2/1000h)
s
c
o
p
e
1
s
c
o
p
e
1
s
c
o
p
e
2
t
o
t
a
l
0,02000,04000,06000,08000,0
10000,012000,014000,0
0,0
2000,0
4000,0
6000,0
8000,0
10000,0
0,0
5000,0
10000,0
15000,0
20000,0
25000,0
4000,05000,06000,07000,0

Balen 6119,7 4702,9 4045,2 4266,7 5560,9
Hoboken 2135,0 2558,3 2771,8 2543,8 2498,6
Zary 440,7 476,9 366,6 311,8 254,3
Newcastle-Upon-Tyne 2329,0 2329,0 2329,0 2329,0 2170,0
Total 2547,8 2879,5 2336,8 2320,9 2496,4
Arendonk + Group 1394,6 1309,9 1399,6 274,4 393,0
Balen 2515,1 2745,1 3158,2 37,4 2,8
Hoboken 3092,1 3562,3 3879,5 41,2 235,3
Zary 3775,9 4315,3 3250,6 3434,8 3126,8
Newcastle-Upon-Tyne 934,6 934,6 934,6 1151,1 2935,5
Total 2068,3 2215,9 2198,3 898,1 1214,5
Arendonk + Group 4307,0 5258,8 3906,3 2950,2 3623,3
Balen 8634,7 7448,0 7203,3 4304,0 5563,7
Hoboken 5227,2 6120,7 6651,3 2585,0 2734,0
Zary 4216,7 4792,2 3617,2 3746,6 3381,2
Newcastle-Upon-Tyne 3263,6 3263,6 3263,6 3480,2 5105,4
Total 4616,1 5095,4 4535,2 3219,0 3710,9
compared to previous year : 10,38% -10,99% -29,02% 15,28%
compared to base year 2014 : 10,38% -1,75% -30,27% -19,61%
s
c
o
p
e
1
s
c
o
p
e
2
t
o
t
a
l
0,01000,02000,03000,04000,05000,0
0,0
1000,0
2000,0
3000,0
4000,0
5000,0
0,0
2000,0
4000,0
6000,0
8000,0
10000,0