emf risk assessment: exposure assessment and safety
TRANSCRIPT

Research Collection
Doctoral Thesis
EMF risk assessmentExposure assessment and safety considerations in MRI and otherenvironments
Author(s): Murbach, Manuel J.
Publication Date: 2013
Permanent Link: https://doi.org/10.3929/ethz-a-010080329
Rights / License: In Copyright - Non-Commercial Use Permitted
This page was generated automatically upon download from the ETH Zurich Research Collection. For moreinformation please consult the Terms of use.
ETH Library

Diss. ETH No. 21514
EMF Risk Assessment:Exposure Assessment andSafety Considerations in
MRI and other Environments
A dissertation submitted to the
ETH ZURICH
for the degree of
DOCTOR OF SCIENCES(Dr. sc. ETH Zurich)
presented by
MANUEL JOHANNES MURBACH
Master of Science, ETH Zurichborn July 26, 1979
citizen of Zurich ZH
accepted on the recommendation of
Prof. Dr. K. P. Prussmann, examinerProf. Dr. N. Kuster, Prof. Dr. T. Samaras, co-examiners
2013


v
– it’s in between,where complexity kicks in.


Contents
Summary xiii
Zusammenfassung xvii
Acknowledgments xxi
1 Introduction 11.1 Exposure To Electromagnetic Fields . . . . . . . . . . 11.2 Electromagnetic Spectrum . . . . . . . . . . . . . . . 21.3 Outline of the Thesis . . . . . . . . . . . . . . . . . . 3
I Radiofrequency Exposure and Safety Issues inMagnetic Resonance Imaging 7
2 Background in MRI Safety 92.1 Motivation and Objectives . . . . . . . . . . . . . . . 92.2 Magnet Resonance Imaging (MRI) . . . . . . . . . . . 102.3 The B1 field in MRI . . . . . . . . . . . . . . . . . . . 112.4 RF Exposure in MR . . . . . . . . . . . . . . . . . . . 122.5 Limiting RF Exposure, IEC Standard . . . . . . . . . 162.6 Modeling of the Incident B1 Field . . . . . . . . . . . 172.7 RF Shimming and Multitransmit Coils . . . . . . . . . 202.8 RF Simulations with Human Anatomical Models . . . 222.9 Human Thermoregulation . . . . . . . . . . . . . . . . 23
2.9.1 Whole-Body Thermoregulation . . . . . . . . . 23
vii

viii CONTENTS
2.9.2 Local Thermoregulation . . . . . . . . . . . . . 242.10 Thermal Simulations . . . . . . . . . . . . . . . . . . 252.11 Thermal Dose (CEM43) and Damage Thresholds . . 252.12 Validation Methods . . . . . . . . . . . . . . . . . . . 272.13 Safety Standard and History of Safe Use (HoSU) . . . 28
3 Incident Field Measurements and Classification of MRIField Generating Units 293.1 Objectives . . . . . . . . . . . . . . . . . . . . . . . . . 293.2 Selected MR Systems . . . . . . . . . . . . . . . . . . . 293.3 Methods . . . . . . . . . . . . . . . . . . . . . . . . . . 31
3.3.1 RF Measurement Protocol . . . . . . . . . . . . 313.3.2 Measurement Phantoms, Jigs and Grid . . . . 313.3.3 Measurement Equipment . . . . . . . . . . . . 323.3.4 RF Test Sequence and Probe Calibration . . . 323.3.5 Data Evaluation . . . . . . . . . . . . . . . . . 35
3.4 Results . . . . . . . . . . . . . . . . . . . . . . . . . . . 353.5 Conclusions . . . . . . . . . . . . . . . . . . . . . . . . 36
4 Local SAR Enhancements in Anatomically Correct Chil-dren and Adult Models as a Function of Position within1.5 T MR body coil 414.1 Abstract . . . . . . . . . . . . . . . . . . . . . . . . . . 414.2 Introduction . . . . . . . . . . . . . . . . . . . . . . . . 424.3 Methods . . . . . . . . . . . . . . . . . . . . . . . . . . 44
4.3.1 Simulation Configuration . . . . . . . . . . . . 444.3.2 Electromagnetic Simulation . . . . . . . . . . . 464.3.3 Data Evaluation . . . . . . . . . . . . . . . . . 47
4.4 Results . . . . . . . . . . . . . . . . . . . . . . . . . . . 484.5 Uncertainty Analysis . . . . . . . . . . . . . . . . . . . 524.6 Discussion and Conclusion . . . . . . . . . . . . . . . . 52
5 Whole–Body and Local RF absorption in Human Mod-els as a Function of Anatomy and Position within 1.5TMR Body Coil 555.1 Abstract . . . . . . . . . . . . . . . . . . . . . . . . . . 555.2 Introduction . . . . . . . . . . . . . . . . . . . . . . . . 565.3 Methods . . . . . . . . . . . . . . . . . . . . . . . . . . 58

CONTENTS ix
5.4 Results . . . . . . . . . . . . . . . . . . . . . . . . . . . 61
5.5 Numerical Uncertainty . . . . . . . . . . . . . . . . . . 64
5.6 Discussion . . . . . . . . . . . . . . . . . . . . . . . . . 66
5.7 Conclusion . . . . . . . . . . . . . . . . . . . . . . . . 68
5.8 Acknowledgements . . . . . . . . . . . . . . . . . . . . 69
6 Thermal Damage Tissue Models Analyzed for Differ-ent Whole-Body SAR and Scan Duration for StandardMR Body Coils 71
6.1 Abstract . . . . . . . . . . . . . . . . . . . . . . . . . . 71
6.2 Introduction . . . . . . . . . . . . . . . . . . . . . . . . 72
6.3 Methods . . . . . . . . . . . . . . . . . . . . . . . . . . 74
6.3.1 Anatomical Models and Simulation Scenario . 74
6.3.2 Tissue Properties and Local Thermoregulation 75
6.3.3 Electromagnetic and Thermal Simulation . . . 78
6.3.4 Data Evaluation . . . . . . . . . . . . . . . . . 81
6.3.5 Thermal Doses (CEM43) and Damage Thresh-old Levels . . . . . . . . . . . . . . . . . . . . . 82
6.3.6 Experimental Validation . . . . . . . . . . . . . 83
6.4 Results . . . . . . . . . . . . . . . . . . . . . . . . . . . 84
6.5 Numerical Uncertainty . . . . . . . . . . . . . . . . . . 87
6.6 Discussion & Conclusion . . . . . . . . . . . . . . . . . 92
6.7 Acknowledgements . . . . . . . . . . . . . . . . . . . . 96
7 Outlook 97
7.1 Future Concepts for MRI Safety Standards . . . . . . 97
7.2 Compliance with Thermal (Dose) Based Safety Stan-dards. . . . . . . . . . . . . . . . . . . . . . . . . . . . 99
7.2.1 Pre-Scan Evaluation Methods . . . . . . . . . . 99
7.2.2 On-The-Fly Estimations . . . . . . . . . . . . . 100
7.2.3 On-The-Fly Monitoring, MRI Thermometry . . 100
7.3 Challenges in Parallel Transmit MRI . . . . . . . . . 101
7.4 Challenges in High Field MRI . . . . . . . . . . . . . . 102
II Exposure Assessment in Human for Health

x CONTENTS
Risk Research 103
8 Background in Human RF Provocation Studies 1058.1 Motivation and Objectives . . . . . . . . . . . . . . . 1058.2 Mobile Phone Exposure . . . . . . . . . . . . . . . . . 1068.3 Non-Thermal Effects . . . . . . . . . . . . . . . . . . . 107
8.3.1 Effect on EEG Spectral Power . . . . . . . . . 1088.3.2 Effect on Sleep-Dependent Performance Improve-
ment . . . . . . . . . . . . . . . . . . . . . . . . 1108.4 Hypothesized Interaction Mechanisms . . . . . . . . . 111
9 Flexible Human Exposure System for Hypothesis DrivenEMF Research 1139.1 Abstract . . . . . . . . . . . . . . . . . . . . . . . . . . 1139.2 Introduction . . . . . . . . . . . . . . . . . . . . . . . . 1149.3 Objectives . . . . . . . . . . . . . . . . . . . . . . . . . 1149.4 Methods . . . . . . . . . . . . . . . . . . . . . . . . . . 1159.5 Validation . . . . . . . . . . . . . . . . . . . . . . . . . 1189.6 Results . . . . . . . . . . . . . . . . . . . . . . . . . . . 1189.7 Study Configurations . . . . . . . . . . . . . . . . . . . 1229.8 Uncertainty . . . . . . . . . . . . . . . . . . . . . . . . 1229.9 Conclusions . . . . . . . . . . . . . . . . . . . . . . . . 123
10 Evaluation of Electrode Artifacts and Thermal Ripplesof EEG RF Experiments 12510.1 Abstract . . . . . . . . . . . . . . . . . . . . . . . . . . 12510.2 Introduction . . . . . . . . . . . . . . . . . . . . . . . . 12610.3 Methods . . . . . . . . . . . . . . . . . . . . . . . . . . 128
10.3.1 Setup A: Flat homogeneous model . . . . . . . 13110.3.2 Setup B: Flat tissue layered head model . . . . 13110.3.3 Setup C: Homogeneous SAM model . . . . . . 13110.3.4 Setup D: Anatomical model Ella . . . . . . . . 132
10.4 Results . . . . . . . . . . . . . . . . . . . . . . . . . . . 13310.4.1 Setup A: Flat homogeneous model . . . . . . . 13410.4.2 Setup B: Flat tissue layered head model . . . . 13410.4.3 Setup C: Homogeneous SAM model . . . . . . 13410.4.4 Setup D: Anatomical model Ella . . . . . . . . 13710.4.5 Translation of RF pulses to ∆T ripples . . . . 140

CONTENTS xi
10.4.6 Uncertainty Analysis . . . . . . . . . . . . . . . 140
10.4.7 Discussion and Conclusion . . . . . . . . . . . . 143
11 Stimulation of the brain with radiofrequency electro-magnetic field pulses affects sleep-dependent perfor-mance improvement 145
11.1 Abstract . . . . . . . . . . . . . . . . . . . . . . . . . . 145
11.2 Introduction . . . . . . . . . . . . . . . . . . . . . . . . 146
11.3 Materials and methods . . . . . . . . . . . . . . . . . . 148
11.3.1 Subjects . . . . . . . . . . . . . . . . . . . . . . 148
11.3.2 Procedure . . . . . . . . . . . . . . . . . . . . . 148
11.3.3 Exposure setup . . . . . . . . . . . . . . . . . . 149
11.3.4 EEG recordings . . . . . . . . . . . . . . . . . . 150
11.3.5 Spectral analysis . . . . . . . . . . . . . . . . . 151
11.3.6 Event-related spectral power (ERSP) and inter-trial coherence (ITC) . . . . . . . . . . . . . . . 151
11.3.7 Motor performance . . . . . . . . . . . . . . . . 152
11.3.8 Statistics . . . . . . . . . . . . . . . . . . . . . 153
11.4 Results . . . . . . . . . . . . . . . . . . . . . . . . . . . 154
11.4.1 Minor effects of RF EMF exposure on sleep ar-chitecture . . . . . . . . . . . . . . . . . . . . . 154
11.4.2 RF EMF changed EEG spectral power duringNREM sleep . . . . . . . . . . . . . . . . . . . 154
11.4.3 Induction of SWA by pulsed RF EMF . . . . . 155
11.4.4 RF EMF exposure affected sleep-dependent mo-tor performance improvement . . . . . . . . . . 158
11.5 Discussion . . . . . . . . . . . . . . . . . . . . . . . . . 160
11.6 Supplementary Materials . . . . . . . . . . . . . . . . 163
11.6.1 Exposure Setup . . . . . . . . . . . . . . . . . . 163
11.6.2 Dosimetric Evaluation . . . . . . . . . . . . . . 164
11.6.3 Exposure Condition . . . . . . . . . . . . . . . 165
12 Outlook 167
12.1 Current Status of EMF Sleep Research . . . . . . . . . 167
12.2 Interaction Mechanisms . . . . . . . . . . . . . . . . . 167
12.3 Future Research . . . . . . . . . . . . . . . . . . . . . 168

xii CONTENTS
III Epilogue 171
13 Conclusions 173
IV Appendix 177
A List of Acronyms 179
B List of Symbols 181
C List of Publications 183C.1 Journal Publications Included in this Thesis . . . . . . 183C.2 Other Journal Publications . . . . . . . . . . . . . . . 184C.3 Other Publications . . . . . . . . . . . . . . . . . . . . 185
Bibliography 195
Curriculum Vitae 213

Summary
Elevated levels of electromagnetic radiation in the MHz region (VHF– UHF, 30 – 3000 MHz) have been around for only little longer than acentury. Before Heinrich Hertz generated the first 40 MHz radiationin 1886 — proving their existence predicted by James Maxwell in 1864— electromagnetic exposure of living creatures below the spectrum ofthe sunlight (THz region) and above (quasi) static fields was limitedto thunderstorms and thermal atmospheric and cosmic backgroundnoise . It is not surprising that we do not have any natural sense forthis dimension of radiation.
Nowadays, a culmination of technical developments has changedthe situation dramatically. Human made electromagnetic fields (EMF)may reach high levels and are omnipresent. Thus, it’s adequate tocarefully evaluate all possible safety issues, especially since the effectsof radiation on the higher side of the spectrum (X-rays) had beendramatically underestimated.
Currently, the highest exposures for “Joe Public” originate from(1) mobile communication devices operating on the GSM, UMTS, orDECT standard of ca. 900 and 1900 MHz, and (2) in the clinical envi-ronment, inside a magnet resonance imaging (MRI) scanner, typicallyat 64 or 128 MHz.
In contrast to X-rays, the quantized energy of EMF in the MHzregion is not sufficient to directly interact with biomolecules such asDNA, and is thus referred to as non-ionizing radiation (NIR). Themain and undisputed safety-relevant effect of which is the heating ofconductive lossy matter, e.g., most biological tissues. Potential ef-fects of mobile phone exposure have usually been referred to as “non-
xiii

xiv SUMMARY
thermal biological response”, as the EMF-induced temperature in-creases are very small and considered biologically non-relevant. Thescientific and societal debate about adverse (or beneficial) non-thermaleffects is still ongoing. These two different safety concerns (thermaland non-thermal) are reflected in the two parts of my thesis.
Part I addresses unresolved issues in EMF exposure assessmentand evaluations for patients in an MRI environment, covering thewhole chain of interaction.
Chapter 3 describes the assessment of the radiofrequency (RF) in-cident field distributions in typical MRI scanners, which has closed acrucial gap for the classification of existing RF field distributions. Ascoil design is partially considered to be trade secrets by the MRI manu-facturers, typical field patterns and inter-brand comparisons were notavailable. Measurement procedures were defined and suitable equip-ment was selected for appropriate RF field assessments. The mea-surement results provide a gross overview of currently utilized coilgeometries and field distributions. Large variations in applied electricfield levels have been found, strongly depending on the bore size.
Human RF energy absorption is investigated in Chapters 4 & 5 asa function of different MRI positions for various anatomical humanmodels, and as a correlation to human anatomy. These studies provideprofound insights into the specific RF absorption mechanisms in MRI.High local levels of the 10 g-averaged peak spatial specific absorptionrate (psSAR10g) were found for torso imaging positions (> 80 W/kg)in the allowed MRI operating modes. The psSAR10g levels have aspread of a factor of 3 that correlates with gross body metrics (largerpatients have higher local exposure), and can increase by factor � 2when forming anatomical RF loops.
Chapter 6 addresses the RF-induced thermal load and potentialthermal tissue damage in MRI exposures. The vast thermal param-eter space has been fathomed by investigating the impact of thermaltissue properties, basal and thermoregulated blood perfusion, ther-mal boundary conditions (sweating, airflow), accumulation of ther-mal dose, and tissue damage thresholds. The human body has apronounced ability to maintain a stable core temperature, even at thehigh overall exposure levels in MRI. For local body temperatures, ourresults indicate a strong dependence on the local thermoregulation

xv
abilities by means of increased local vasodilation. The accumulatedthermal dose (CEM43) points towards safe MR scantimes on the orderof one hour for realistic scan scenarios. Full exploitation of the ex-posure limits defined in the product standards may result in thermaltissue damage; a revision of the corresponding standards is suggested.
Part II is dedicated to research on effects of low-level EMF inhumans, which are believed to be of a non-thermal nature, due tothe small temperature increases below 0.6°C. Besides the hardwareequipment and control software, the well-defined EMF exposure ofvolunteers requires a detailed dosimetric assessment and a profoundinvestigation on all potential confounders.
Adequate EMF exposure equipment for innovative research in hu-man provocation studies are presented in Chapter 9. Exposure levelsand patterns for both RF and extremely low frequency (ELF) fields,are estimated in detail and are validated experimentally. The assess-ment included functional subregions of the brain, as well as two dif-ferent RF frequencies and a comparison to older exposure equipmentfor the integration of former study conclusions.
Chapter 10 is dedicated to a specific potential confounder, assess-ing the effect of electroencephalographic (EEG) electrodes and theirleads within the RF field. This addresses concerns expressed by sev-eral members of the scientific community, and it is particularly impor-tant, as many studies applied EMF exposure with attached EEG elec-trodes. The various simulation and measurement results of this studyindicate that neither the locally enhanced field levels, the subsequenttemperature increase around the electrodes, nor the temperature rip-ples from RF pulsing is a plausible explanation for the observed EMFeffects in humans.
Finally, the Chapter 11 portrays a full human provocation study,assessing the effect of EMF by the means of sleep EEG recording andsleep-dependent performance improvement. In this joint project withthe University Children’s Hospital of Zurich, my part was to providea novel all–night EMF exposure system based on a circularly polar-ized patch antenna. Evaluation of the sleep EEG showed an increasedslow-wave activity towards the end of the sleep period and also afterthe RF EMF bursts in event-related EEG spectral power and phasechanges. Sleep-dependent performance improvement after overnight

xvi SUMMARY
RF EMF exposure was significantly reduced (–20%, P = 0.03) com-pared to the sham overnight treatment.
The Chapters 4 – 6 and 9 – 11 have been published in peer-reviewedjournals and were presented to standards building bodies and govern-ment agencies. The MT40 group working on the MRI product stan-dard IEC 60601-2-33 is integrating the findings in future revisions.
After a general introduction to EMF (Chapter 1), Parts I & IIbegin with backgrounds of their specific topics and conclude with anoutlook comprising future developments and challenges.

Zusammenfassung
Erhohte Pegel elektromagnetischer Strahlung im MHz-Bereich (VHF– UHF, 30 – 3000 MHz) gibt es noch nicht viel langer als ein Jahr-hundert. Nachdem James Maxwell im Jahr 1864 diese Art von elek-tromagnetischen Feldern vorausgesagt hatte, war es Heinrich Hertzder die erste 40 MHz Strahlung generierte. Zuvor war die Exposi-tion von Lebewesen ausserhalb der Spektren von Sonnenlicht (THzRegion) und (quasi) statischen Feldern beschrankt auf das thermischatmospharische und kosmische Hintergrundrauschen. So uberraschtes nicht, dass wir kein Sensorium fur diese Dimension von Strahlungentwickelt haben.
Heutzutage hat der technologische Fortschritt die Situation grund-legend verandert. Kunstliche elektromagnetische Felder (EMF) konnensehr hohe Niveaus erreichen und sind omniprasent. Deshalb ist esdurchaus ratsam, alle moglichen Sicherheitsrisiken grundlich auszulo-ten, zumal die Gesundheitseffekte im hoheren Bereich des Spektrums(Rontgenstrahlen) drastisch unterschatzt wurden.
Im Moment werden die hochsten Strahlenbelastungen fur den Durch-schnittsburger verursacht von (1) mobilen Kommunikationsgeraten imGSM, UMTS oder DECT Standard bei ca. 900 oder 1900 MHz, und(2) von Kernspin Tomographen (Magnetresonanz Imaging, MRI) ineinem klinischen Umfeld, typischerweise bei 64 oder 128 MHz.
Im Gegensatz zur Rontgenstrahlung ist die quantifizierte Energievon EMF in der MHz Region viel zu klein, um direkt mit biologischenMolekulen — z.B. mit der DNS — zur interagieren. Deshalb wird dieseStrahlung als nicht-ionisierend (NIR) bezeichnet. Ihre unstrittig aner-kannte Wirkung ist die Erhitzung von verlustbehafteten Materialien,
xvii

xviii ZUSAMMENFASSUNG
also von fast allen biologischen Geweben. Mogliche Effekte der Strah-lung von Mobiltelefonen werden ublicherweise als “nicht-thermischebiologische Reaktion” bezeichnet, da die EMF-induzierten Tempera-turerhohungen sehr klein sind, und als biologisch nicht-relevant erach-tet werden. Die wissenschaftliche und soziale Debatte uber schadliche(oder auch nutzliche) nicht-thermische Effekte ist noch immer im Gan-ge. Diese zwei unterschiedlichen Sicherheitsbedenken (thermisch undnicht-thermisch) reflektieren sich in den zwei Teilen meiner Doktorar-beit.
Teil I widmet sich wenig geklarten Belangen in der Beurteilungund Einschatzung der elektromagnetischen Exposition von Patientenin Kernspin Tomographen. Dabei wird die notige Bandbreite abge-deckt, von der Feld Erzeugung bis zur moglichen thermischen Gewe-beschadigung.
Kapitel 3 beschreibt die Beurteilung von einfallenden radiofre-quenz (RF) Feldern in typischen MRI Apparaten. Dies schliesst eineentscheidende Lucke in der Klassifizierung von bestehenden RF Feld-verteilungen. Da das Design von MRI Spulen von den Herstellern teil-weise als Geschaftsgeheimnis gehandhabt wird, waren typische Feld-muster und Vergleiche zwischen Topographen nur bedingt verfugbar.Messverfahren wurden definiert und MRI kompatibles Messequipmentselektiert fur eine zweckdienliche Felddaten-Erhebung. Die Resulta-te geben eine grobe Ubersicht von den derzeitig verwendeten Spu-lengeometrien und Feldverteilungen. Es wurden grosse Unterschiededer elektrischen Feldpegel gefunden, besonders in Abhangigkeit vomRohrendurchmesser.
Die RF Energie Absorption im Menschen wurde im Kapitel 4 & 5untersucht, dies in Abhangigkeit von unterschiedlichen Bildgebungs-Positionen in verschiedenen anatomischen Modellen und als Korrela-tion zur menschlichen Anatomie. Diese Studien erlauben einen tief-schurfenden Einblick in die spezifischen Absorptions-Mechanismen inMRI Geraten. Hohe lokale Werte in der 10 g gemittelten raumlichenspezifischen Absorptionsrate (psSAR10g) wurden gefunden in TorsoScan-Positionen (> 80 W/kg) innerhalb der erlaubten MRI Operations-Modi. Die psSAR10g Werte sind um einen Faktor 3 verteilt und kor-relieren mit generellen Korpergrossen (grossere Patienten haben ei-ne grossere lokale Exposition). Das Formieren von sogenannten RF-

xix
Schleifen kann die lokale Exposition nochmals um einen Faktor � 2erhohen.
Kapitel 6 befasst sich mit den RF induzierten Temperaturbela-stung und der potenziell daraus resultierenden thermischen Gewe-beschadigung. Der gewaltige Parameter-Raum wurde ausgelotet durchUntersuchung der Einflusse von thermischen Gewebeeigenschaften,von der basalen und thermoregulierten Blutperfusion, der thermischenRandbedingungen (Transpiration, Atmung), der Akkumulation derthermischen Dosis und durch das Anwenden von gewebespezifischenSchadigungs-Schwellenwerten. Der menschliche Korper hat eine aus-gepragte Fahigkeit, die innere Korpertemperatur konstant zu halten,sogar bei den hohen Expositionen im MRI. Fur die lokalen Tempera-turen zeigen unsere Resultate eine starke Abhangigkeit von der lokalenThermoregualtion, welche sich vor allem durch einen erhohten Blut-fluss in den lokal erweiterten Gefassen auszeichnet. Die Auswertungder kumulierten thermischen Dosis (CEM43) deutet auf thermisch un-bedenkliche Scanzeiten in der Grossenordung von einer Stunde fur rea-listische MRI Scan-Szenarien. Werden jedoch die in den Produktstan-dards festgelegten Expositionslimiten bis zum Aussersten ausgereizt,konnen thermische Gewebeschadigungen nicht ausgeschlossen werden;deshalb wird eine Revision der entsprechenden Standards empfohlen.
Teil II setzt sich mit den Effekten von tiefen EMF Expositionen aufden Menschen auseinander, welche aufgrund der kleinen Temperatur-anstiege — ublicherweise unter 0.6°C — als nicht-thermisch eingestuftwerden. Neben den ganzen Geratschaften und der Kontrollsoftwarebenotigt eine klar definierte Exposition von Versuchspersonen eine de-taillierte dosimetrische Beschreibung und eine rigorose Uberprufungaller moglichen Storfaktoren.
Geeignetes Equipment fur innovative Forschungsstudien am men-schen wird in Kapitel 9 vorgestellt. Die Expositionsbelastungen sowiedie Feldverteilungen in RF und extrem tieffrequenten (ELF) Feldernwerden im Detail bestimmt und mittels Experimenten validiert. Funk-tionellen Subregionen im Gehirn wurden muteinbezogen, ebenso wieverschiedene RF Frequenzen und ein Vergleich zu fruheren Systemen.
Das Kapitel 10is dedicated to a specific potential confounder, assessing the effect
of electroencephalographic (EEG) electrodes and their leads within

xx ZUSAMMENFASSUNG
the RF field. This addresses concerns expressed by several membersof the scientific community, and it is particularly important, as manystudies applied EMF exposure with attached EEG electrodes. Thevarious simulation and measurement results of this study indicate thatneither the locally enhanced field levels, the subsequent temperatureincrease around the electrodes, nor the temperature ripples from RFpulsing is a plausible explanation for the observed EMF effects inhumans.
Finally, the Chapter 11 portrays a full human provocation study,assessing the effect of EMF by the means of sleep EEG recording andsleep-dependent performance improvement. In this joint project withthe University Children’s Hospital of Zurich, my part was to providea novel all–night EMF exposure system based on a circularly polari-zed patch antenna. Evaluation of the sleep EEG showed an increasedslow-wave activity towards the end of the sleep period and also afterthe RF EMF bursts in event-related EEG spectral power and phasechanges. Sleep-dependent performance improvement after overnightRF EMF exposure was significantly reduced (–20%, P = 0.03) com-pared to the sham overnight treatment.
The Chapters 4 – 6 and 9 – 11 have been published in peer-reviewedjournals and were presented to standards building bodies and gover-nment agencies. The MT40 group working on the MRI product stan-dard IEC 60601-2-33 is integrating the findings in future revisions.
After a general introduction to EMF (Chapter 1), Parts I & IIbegin with backgrounds of their specific topics and conclude with anoutlook comprising future developments and challenges.

Acknowledgments
This thesis represents my 5 years of work at the IT’IS Foundationas a PhD Student. It’s been a extraordinarily great and challengingtime, and at first, I’d like to thank my friends and family — and thosefriends that became family — for their unconditional support. Andthank you, Salome, for being awesome.
I was warned not to join the IT’IS Foundation from several sides.But I’m grateful that I did. I started working at Zeughausstrasse 43in February 2007, and enrolled for the PhD program in 2008. It’sbeen a fascinating culmination of people, knowledge, and spirit.
I’d like to thank the director of the IT’IS Foundation, Prof. NielsKuster, for giving me the chance to take part in this venture. It’s rareto meet someone with such elevated levels of vision, intelligence, com-mitment, and demand. His ability to multitask and to stay focusedat the same time is outstanding.
My studies would not have been successful without the excellentacademic environment I found myself in. I would like to express mygratitude to Prof. Klaas Prussmann and his staff at the BiomedicalInstitute for welcoming me into their research group and for supervis-ing my work. And I’d like to thank Prof. Theodoros Samaras, whosescientific backup was fundamental, and his enthusiastic approach towork has pushed me forward.
Further, I’d like to thank all friends and co-workers at ”Zeugi”,the exceptional crew of IT’IS, SPEAG, and ZMT. They incrediblyenriched my daily life and supported me in many ways. I received a lotof outstanding inspiration from Sven, who has been sitting across frommy desk for all these years, from scientific background knowledge to
xxi

xxii ACKNOWLEDGMENTS
good music. I enjoyed fruitful discussions with all other IT’IS projectleaders: Marie-Christine, Andreas, Myles, Esra, Michael, Eugenia,Mark, Earl, and Ferenc.
For the human provocation studies and sleep research, I very muchenjoyed the collaboration with Prof. Peter Achermann’s group andthe joint work with Maria Christopoulou. My deepest gratitude goesto Peter, Sabine, Sarah, Aleksandra, and Marc. I enjoyed the hoursspent in your sleep-cave. Also, I’m grateful for the excellent jointventure with Reto Huber and Caroline Lustenberger. The largestpart of these studies were conducted within the NRP57 framework,where I’d like to thank Alexander Borbely, Sonja Nevogetic, SabineRegel, and Mirjana Moser.
The MRI related research would not have been possible withoutthe support of Andreas, Esra, Earl, and Max; the incredible staff ofIBT: Klaas, David, Roger; and all partners from the MRI+ frame-work: Gerard van Rhoon, Georg Frese, Gerhard Brinker, Johan vanden Brink, and Wolfgang Kainz.
I had many extremely friendly encounters through the worldwidedistribution of my exposure systems (sXc). Meike Mevissen and Em-ina Besic in Switzerland and many others from my more than 30customers all over Europe, the U.S., China, Japan, and Israel.
The “Zeugi” family has tremendously grown during my time here.The number of people has doubled, giving a nice mix of newcomersand “old fighters”. Thanks to my most faithful allies through theseyears, (more or less in order of appearance) Sven, Marie-Christine,Bruno, Michael, Myles, Maria, Eugene, Peter S., Peter F., Mar, Iris,Adamos, Juliette, Anastasija, Davnah, and many more.
It was brilliant to have an administration that “just works”! Jacque-line, Yvonne, Theresa, Sibyl, and Rebekka covered any administra-tive question and my need for shipping logistics. Software came fromabove, the incredible SEMCAD team, Nik, Stefan B., Pedro, Mar,and many more; hardware came from below, Bruno, Peter, Manuel,Sasha, Mirko, and their team. And my English writing got so muchbetter, thanks to Jane and Pat!
Finally, I’d like to thank all financial contributors, the NFP57 Na-tional Research Program, Forschungsstiftung Mobilkommunikation,the CTI for supporting the MRI+ project, the European frameworkprojects SEAWIND and ARIMMORA, as well as to all MRI Manu-

xxiii
facturers that contributed to my studies: Siemens, Philips, GE, andToshiba.
My deepest thankfulness belongs to my parents, Lea and Herbert,for their unshakable support. And from all stories I’ve heard from myDad, earning a PhD was a similar process 40 year ago.


Chapter 1
Introduction
1.1 Exposure To Electromagnetic Fields
We are subjected to continuous exposure of a broad range of electro-magnetic fields (EMF), every day. The sun may be the most promi-nent source, together with other natural sources, like the earth’s mag-netic field. A detailed overview of all types of EMF can be found inSection 1.2.
Within recent decades, exposures to EMF in the MHz region (VHF– UHF, 30 – 3000 MHz) have increased continuously, due to thevast number of novel wireless applications. The best known exam-ples in everyday life are radio and television broadcasting services,mobile phone communication services, and wireless LAN computernetworks. In a medical framework, typical sources of EMF are mag-netic resonance imaging (MRI), hyperthermia cancer treatments, anddiathermy in muscle relaxation.
The exposure levels for all EMFs must be limited to prevent ad-verse health effects on our bodies. A number of national and interna-tional organizations have issued guidelines for limiting exposures forthe general public and occupational staff (e.g. ICNIRP [1] and IEEEC95.1 [2]). The process can be vaguely compared to, for example,limiting exposure to bacteria in the food industry or managing thetoxicity of tap water.
1

2 CHAPTER 1. INTRODUCTION
For medical applications, risk-benefit considerations may lead torelaxed (or non-existent) limits when supervised by a medical doctor.MRI manufacturers generally comply with the product standard IEC60601-2-3 [3] that has the aim to internationally establish basic safetyrequirements for MRI equipment to provide protection for patients,and which has significantly relaxed exposure limits compared to thegeneral public (factor > 30 in SAR). The rationale for this relax-ation lies primarily in the risk-benefit considerations for the patient.The potentially high diagnostic benefit justifies higher short-term ex-posures, compared to the omnipresent EMFs from end-user lifestylegadgets.
The assessment of actual exposure levels and patterns is generallyreferred to as “dosimetry”, the accurate estimation of doses, especiallyin radiation. With respect to my studies, the dosimetric assessmentis a matter of characterizing the local and global energy depositionin the human body, as well as estimating the subsequent temperatureelevations.
1.2 Electromagnetic Spectrum
The electromagnetic spectrum describes the different appearances ofEMF. Although all of them are subject to the same principal mecha-nisms (i.e., the Maxwell equations [4]), there are considerable differ-ences in the way they interact with us. An overview that distinguishesnatural from human-made EMF is shown in Figure 1.1. The main andundisputed EMF effects on living matter can be categorized accord-ing to frequency: < 1 MHz: induced currents cause nerve stimula-tions; 1 MHz – 1 THz: induced currents cause tissue heating; 1 THz –1 PHz: photochemical effects; and > 1PHz: chemical ionization thatcan lead to, e.g., DNA damage. There is, however, some overlappingbetween these categories. RF ablation, e.g., is strongly heating thetissue at ≈ 400 kHz without causing nerve stimulation.
While the focus for MR exposures is on limiting tissue heating,there is some concern regarding non-thermal effects of EMF of powerlines and wireless communication. As discussed in Part II of thisthesis, there is indication for currently unknown non-thermal effectmechanisms for pulsed radiofrequency (RF) EMF fields.

1.3. OUTLINE OF THE THESIS 3
100 103 106 109 1012 1015 1018 1021
1 Hz 1 kHz 1 MHz 1 GHz 1 THz 1 PHz 1 EHz 1 ZHz
ELF LF VHF/UHF Microwave Infrared Ultraviolet X-RayVisible
Power lines
non-ionizing (NIR) ionizing
Earth’s magnetic fieldLightning
Major sunlight components
AM radio
Induced currents Nerve stimulation
Medical X-RaysMRIMobile phones, WLAN
Induced currents Heating
Unknown mechanisms Physiological effects?
Optical Photochemical effects
Chemical ionization DNA damage
Figure 1.1: The electromagnetic spectrum with selected natural andartificial sources, and physiological effects.
1.3 Outline of the Thesis
This thesis is divided into two major parts: Part I: exposure assess-ments in MRI environments, where thermal effects are the primaryconcern, and Part II: human EMF provocation studies, including thedevelopment of adequate equipment for research on non-thermal ef-fects.
Background and motivation are given separately for Parts I & II,due to the intrinsically different objectives. A general introductionand the epilogue tie the two parts together.
• Chapter 1: Introduction to exposure electromagnetic fields(EMF), their applications and interaction with the humanbody, and an outline of this thesis.
Exposure assessments in MR environments (Part I):
• Chapter 2: Motivation, objectives, and background in MRsafety, including an introduction to MR physics, utilized
4 CHAPTER 1. INTRODUCTION
EMF entities, typical exposure patterns, simulation tech-niques, human thermoregulation, and current safety stan-dards.
• Chapter 3: Incident field assessments for classification ofselected MRI scanners in terms of RF incident fields. Ap-propriate measurement equipment, phantoms, and proce-dures are presented, as well as the results of the field dis-tributions and peak magnitudes.
• Chapter 4: Local exposure enhancements for a broad rangeof anatomical human models in various imaging positionswithin an 1.5 T MRI scanner.
• Chapter 5: Correlation of exposure levels with various large-scale anatomical properties of several human models andimaging positions.
• Chapter 6: Thermal dose and tissue damage evaluations fordifferent MRI scan durations, including detailed discussionof human thermoregulation and a human skin temperaturevalidation measurement.
• Chapter 7: Outlook and challenges for future developmentsin MRI safety standards.
Exposure assessments for human EMF provocation studies (Part II):
• Chapter 8: Background and summary of human RF provo-cation studies.
• Chapter 9: Description of a novel flexible human EMFexposure system for innovative research on bioeffects.
• Chapter 10: Evaluation of the effect of EEG electrodes onthe exposure pattern.
• Chapter 11: Human sleep study: Effect of EMF on sleep-dependent performance improvement.
• Chapter 12: Outlook and challenges in EMF sleep research
Epilogue (Part III):

1.3. OUTLINE OF THE THESIS 5
• Chapter 13: Conclusions and outlook in human EMF ex-posure.

6 CHAPTER 1. INTRODUCTION

Part I
RadiofrequencyExposure and SafetyIssues in Magnetic
Resonance Imaging
7


Chapter 2
Background in MRISafety
2.1 Motivation and Objectives
In medical technology within a clinical environment, multiple groups— patients, hospital, medical doctors and staff, manufacturers, andregulatory bodies — have each their own special interests and de-mands. One common interest is the safety of the medical application.My studies aim to push further the development of safety guidelinesand RF exposure limitation regimes for emerging MRI technologies.
Objectives are, therefore:
• assessing the electromagnetic RF exposure within the MRI scan-ner
• isolating most important factors in energy absorption
• accurate modeling of thermal simulations including human ther-moregulation
• assessing thermal dose and putting it into context with damagethreshold limits
9

10 CHAPTER 2. BACKGROUND IN MRI SAFETY
2.2 Magnet Resonance Imaging (MRI)
The nuclear magnetic resonance (NMR) phenomenon was discoveredin 1946 by Felix Bloch and Edward M. Purcell [5]. A set of atomic nu-clei have nuclear spin, which is influenced by the molecular structure.Thus, specific material properties can be deduced from the nuclearspins. Their spatial allocation allows the imaging variant of magnetresonance imaging (MRI). Since 1972, MRI has gained broad attentionas a fascinating non-invasive approach for imaging anatomical struc-tures, spectral determination of biological substances, and elucidationof physiological processes.
In a static magnetic field B0, the nuclear spins have energy Em;when normalized to Em = 0 at B0 = 0,
Em = −µzB0 = −mγ~B0 (2.1)
with µz being the z-component of the magnetic moment, m the mag-netic quantum number, γ the gyromagnetic ratio, and ~ the reducedPlanck constant.
By adding the energy ∆E between two quantum levels, the mag-netic moments can be flipped (spin nutation), while the energy mustcome from an alternating field to satisfy the resonance condition forthe frequency ωo.
∆E = ~ω0 (2.2)
By inserting Eqn. 2.1 into Eqn. 2.2, with ∆E = Em and m = −1, theLarmor frequency ω0 can be derived
2πf0 = ω0 = γB0 (2.3)
which results in the typical value of f0 = 64 MHz at B0 = 1.5 Tfor the hydrogen nucleus, which has a gyromagnetic ratio of γ =2π· 42.6 MHz/T.
Thus, when applying an alternating magnetic field with the Lar-mor (resonance) frequency, energy is absorbed by the nuclear spins

2.3. THE B1 FIELD IN MRI 11
and reradiated during the relaxation. This forms the basic principleof MR imaging, which thus needs three electromagnetic entities forthe desired operation:
• B0: Static magnetic field: for alignment of the spins. –Clinically established scanners have field strengths of 1.5 T or3 T, with development towards 7 T, 9.4 T and beyond.
• G: Gradient fields: for applying spatially and temporally differ-ent effective magnetic fields. –Switching magnetic fields with frequency components up to ca.100 kHz.
• B1: Radiofrequency (RF) field: for the spin nutation at the Lar-mor resonance frequency. –Circularly polarized RF fields with frequencies of, e.g., 64 or 128 MHz,depending on the magnetic flux density.
Static fields can induce vertigo, nausea, and a metallic taste inthe mouth [3], but are surprisingly well tolerated by living matter.High switching rates of the gradient fields induce peripheral nervestimulation, which must be limited [3]. This thesis focuses on the RFexposures from the B1 field, which may lead to considerable thermalload, as derived in Chapter 6.
2.3 The B1 field in MRI
The B1 RF field is responsible for the nutation of the nuclear spins attheir resonance frequency. It should be, thus, circularly polarized, nor-mal to the static magnetic field, and be largely homogeneous aroundthe field of view (FOV). Traditionally, this excitation is provided bya birdcage coil (Figure 2.1) or TEM volume resonator. There arealso alternative approaches, such as the waveguide modes of travelingwaves [6].
As only the rotational component of B1 contributes to the spinnutation, the B1 (total field) can be decomposed into two transversecircularly polarized components B1+, B1− and the z-component B1zas in Eqn. 2.4, where B1 is the total magnetic field, ax, ay, and

12 CHAPTER 2. BACKGROUND IN MRI SAFETY
az are the coordinate system unity vectors (see Figure 2.1 for theirorientations).
B1+ =1
2(B1(r) · ax + jB1(r) · ay) (2.4)
B1− =1
2(B1(r) · ax − jB1(r) · ay)∗
B1z = B1(r) · az
B1+, the right-hand circularly polarized component (rotating clock-wise) with respect to B0, is solely responsible for the nutation of spinsfrom the Z-direction towards the X-Y-plane. The longer the B1+ RFpulse is applied, the larger the so-called ‘flip angle’ of spin nutation.The B1− and B1z fields are parasitic, i.e., they increase the energyabsorption in the patient but do not contribute to imaging. For ex-ample, application of a linearly polarized B1 field results in B1+ andB1− of equal magnitude, which is 3 dB, a factor of 2 in power, less ef-fective, i.e., resulting in a factor of 2 lower signal to noise ratio (SNR)for a given input power. In efficient coil designs, the B1+ significantlyexceeds B1− and B1z, at least for the FOV (Figure 2.1).
Please note that, as defined above, B1+, B1− are complex scalarfields. The magnitude of B1+ is most important for imaging, as itdefines the flip angle. For depicting theB1-field, the scalar field B1rmsis used.
2.4 RF Exposure in MR
In most cases, the limiting factor for applied B1 field levels is theenergy absorption of the body, as explained below in Chapter 2.5. Themajor pathway of energy absorption is via induced RF eddy-currentsby the time-varying B1 field. A typical absorption pattern can beseen in Chapter 5, Figure 5.2. These currents typically get higherwith radial distance from the body center. At low field strengths,B1 behaves quasi-statically, with small phase delays throughout thebody (around 45◦ at 1.5 T, 64 MHz). At 3 T and above, the shorterwavelength (roughly 30 cm at 128 MHz inside average human tissues)causes significant phase delays at the center of the body (> 90◦). The

2.4. RF EXPOSURE IN MR 13
B1rms
FOV
0
-10
-20
-30
-40
-50
dB
z
x
y
isocenter
B1 B1rms B1z,rms|B1+| |B1-|
Figure 2.1: Typical birdcage resonator with B1 field and its homogene-ity at the center (FOV). The B1 field can be decomposed into B1+,B1− and B1z. B1+ is responsible for the spin nutation and shouldthus be the component with the highest magnitude and uniformity.

14 CHAPTER 2. BACKGROUND IN MRI SAFETY
subsequent induction of eddy-currents renders a far more complexabsorption distribution in the human body.
To a lesser extent, local energy absorption is also influenced bystray E-fields close to the birdcage structure. While the induced eddy-currents have similar patterns for most MRI scanners, the absorptionof the stray E-fields are highly birdcage-design specific and depend onthe proximity of the patient to the birdcage.
The pivotal parameter for quantizing the deposited energy andfor safety guidelines is the spatial specific absorption rate (SAR),which is a metric for power absorption per mass entity with the unitW/kg. Multiple averaging schemes are defined to accurately charac-terize different exposure scenarios. The whole body averaged SAR(wbSAR) equals the total power administered to the patient dividedby the patient mass. It serves as a surrogate for systemic thermal load— triggering whole body thermoregulation — but also as a warrantfor localized exposure in body coils, which is not limited separately,see Chapter 2.5. The normal basal metabolic rate in humans is ca.1.5 W/kg but can easily reach 6 W/kg at high activity levels. MRIexposures typically don’t exceed levels of about to 3.5 W/kg wbSARand should, thus, be tolerated under normal circumstances, in termsof overall heat dissipation capabilities.
Head and extremity imaging is better characterized by the headaveraged SAR (headSAR) and partial body SAR (pbSAR). Both val-ues estimate the averaged SAR of only the actually exposed part ofthe body.
Finally, for the quantification of localized exposures, spatial SARis averaged over any 10 g of continuous tissues (sSAR10g), and thehighest value found (i.e., the “hotspot”) represents the peak spatialSAR (psSAR10g). This metric was originally intended as a surrogatefor local thermal load, but it also eliminates possible small-scale andstair-casing errors from electromagnetic simulations. However, dueto the large tissue and perfusion inhomogeneity of the human body,there is very limited correlation between psSAR and thermal load, es-pecially with local thermoregulation. The exact averaging techniquesare defined in the IEEE standard [7]. A visualization of the differentdistributions is depicted in Figure 2.2.

2.4. RF EXPOSURE IN MR 15
0
-3
-6
-9
-12
-15
dB
3D CAD Model
Head SAR
wbSAR
Voxel SAR
psSAR10g
sSAR10g
Discretized model(voxelled)
Figure 2.2: Anatomical model Duke as a 3D model, as well as indiscretized slice view. The different SAR averaging schemes are illus-trated on an exposure pattern originating from an 1.5 T birdcage inthe heart imaging position (slice field view).

16 CHAPTER 2. BACKGROUND IN MRI SAFETY
2.5 Limiting RF Exposure, IEC Standard
To prevent excessive heating, the maximum RF exposure must bemanaged. The discussion about safe MRI exposure levels began di-rectly invention of the technique in the 1970s [8]. In the late 1980s,the limitations were relaxed significantly when FDA reclassified MRIscanners from class III to class II devices [9], driven by studies suchas [10]. The governing temperature limits were set to 38°C in the head,39°C in the trunk, and 40°C in the extremities. Via the IEC60601-2-33 product standard [3], energy absorption limits were derived fromthe thermal limits. This limitation regime has remained largely un-changed until today.
A comparison of two important current safety guidelines is givenin Table 2.1. Mobile phones, e.g., generally have to comply with theICNIRP [1] limit for the general public, since most countries haveadopted their limits directly from ICNIRP. In medical applications,risk-benefit considerations often lead to less conservative limits. MRImanufacturers generally comply with the IEC 60601-2-33 [3]. Thereare three Operating Modes (OM) defined, reflecting the differentrisk-benefit considerations: (A) Normal , (B) First Level Con-trolled, and (C) Second Level Controlled. For (B), medicalsupervision is needed, while (C) requires the explicit authorization ofthe local investigational review board.
ICNIRP [1] IEC [3] Typicalgeneral public First Level OM MR Exposure
wbSAR 0.08 W/kg 4 W/kg < 3.7 W/kgheadSAR (no limit) 3.2 W/kg < 2.4 W/kgpsSAR10g 2 W/kg (no limit)1 < 802 W/kg
Table 2.1: Overview of current safety guidelines compared to typicaland MR exposures
1no limit specified for body coils, 20–40 W/kg for local transmit arrays.2up to > 150 W/kg can be reached in body coils.

2.6. MODELING OF THE INCIDENT B1 FIELD 17
Potential non-thermal effects are not considered for the RF ex-posures, as the potential risk is considered small compared to thediagnostic benefits. For example, the high RF-pulsing in MR may besufficient for the thermoelastic effect of microwave hearing [11], butthe relative weighted sound pressure level from the gradient coils istypically in the range of 110 dB(A) [12], exceeding any microwavehearing levels by far.
Whole-body average SAR values were introduced to limit the sys-temic thermal stress. When putting more energy into the body than itcan dissipate by thermoregulation, i.e., perspiration and respiration,this will eventually and ultimately discharge into systemic thermalbreakdown with resulting elevation of body core temperature. Valuesabove 39°C are considered problematic, therefore, scanning of patientswith elevated core temperatures, i.e., fever, is limited and prohibitedabove 39.5°C [3] .
The wbSAR of a patient can be assessed by measuring the powerdelivered to the coil, minus the reflected power and losses (resulting inthe total absorbed power in the patient), and dividing it by the patientmass. As this wbSAR limitation in body coils has been considered safefor decades, no limitations for localized SAR have been introduced [3].Chapter 4 demonstrates that psSAR10g values of up to 80 W/kgcan be found, even when in full compliance with the First LevelControlled OM, and up to > 200 W/kg when forming RF loopsas shown later in Figure 4.6, which exceeds the ICNIRP limits for thegeneral public by factors of 40 and 100, respectively.
2.6 Modeling of the Incident B1 Field
In my studies, we mainly used birdcage resonators for generating theB1 field. Birdcages have excellent homogeneity at the center of theircircular structures, as well as high efficiency due to their resonantdesign, thus allowing cost-effective implementation with small ampli-fiers. They can be divided into high-pass, low-pass and band-passdesigns. While in reality they are usually fed by two RF ports (IQfeeding), simulations can be performed with current-sources in thelegs, which enforces the desired birdcage mode directly. An overviewis given in Figure 2.3. Details about design and tuning of birdcage

18 CHAPTER 2. BACKGROUND IN MRI SAFETY
resonators can be found, e.g., in [13].
Band pass birdcageIQ feed
Leg feed
High pass C
I-source
Q-source
Leg-sourcesLow pass C
Figure 2.3: Schematic of a band-pass birdcage and visualization ofdifferent feeding structures: IQ-feed, typically with π/2 phase shift forquadrature excitation; leg-feed, which can directly enforce the desiredbirdcage mode.
The 1.5 T and below systems are usually operated in the circularpolarized (CP) mode, also called quadrature feed. The I and Q feedshave identical amplitudes and a fixed phase shift of π/2. Due to thelarge wavelength at 64 MHz, the body has a small influence, and thefield is mostly circularly polarized inside asymmetric biological tis-sues. At 3 T and above, the wavelength gets smaller — ca. 30 cm at128 MHz inside average human tissues — and, thus, distorts the ho-mogeneity due to the lossy tissues and axial asymmetry of the humanbody. To compensate for this effect, manufacturers use RF-shimming(see Chapter 2.7). Figure 2.4 illustrates the B1 field inside the emptyand the patient-loaded birdcage. While an almost ideal CP field canbe established in the empty birdcage (B1+ is widely equal to B1, B1−
is neglectable around the FOV), the presence of the lossy and asym-metric tissues decreases the circularity of B1 inside the body, whichreduces B1+ in certain regions.

2.6. MODELING OF THE INCIDENT B1 FIELD 19
0
-3
-6
-9
-12
-15
dB
|B1 +| (µT)
aEmpty With patient in birdcage
b
c
Figure 2.4: (a) Streamline and (b) vector field views (polarization el-lipses in black) of the B1-field inside the birdcage resonator, and (c)B1+ distribution with and without the presence of a patient. Thepresence of lossy tissues causes a phase delay of the B1-field via in-duced eddy currents.

20 CHAPTER 2. BACKGROUND IN MRI SAFETY
On the simulation side, there are possibilities other than tuning onthe IQ ports. A leg-feed birdcage enforces the circular mode, or a Huy-gens box approach applies the incident field by suppressing backscat-tering and the mismatch effects of the body. The latter has usuallybeen applied within this thesis, as it applies identical incident fieldsto all models (children, adults, obese, etc.) and also dramaticallyreduces the simulation space.
2.7 RF Shimming and Multitransmit Coils
B1+ homogeneity and efficiency can be significantly improved with al-ternative excitation schemes other than the standard CP mode. Theamplitude and phase of I and Q are adjusted for better CP in theregion of interest (ROI) inside the body. Depending on the imagingposition, the ROI could be the arm or torso region of a patient. Gen-erally, the ROI is always ≤ FOV. While some manufacturers may dothis with predefined look-up tables for different patient sizes, othersmay have fixed shifts or perform optimizations on-the-fly. Obviously,the implemented procedures are trade secrets. Figure 2.5 illustratesthe gain of RF shimming at 3 T optioned by adjusting the excita-tion from CP (I = 1∠0◦, Q = 1∠90◦) to a ROI-optimized excitation(I = 1∠0◦, Q = 0.35∠150◦). While the wbSAR remains identical, theB1+ level and uniformity in the ROI can be substantially improved,e.g., mean B1+ from 0.75 µT up to 1.2 µT and non-uniformity from18% down to 12% SD.
Evolving MRI generations offer more than two (I/Q) ports, withindividually adjustable amplitude and phases for all, e.g., 16, feedpoints. This technique is referred to as ”parallel transmit” (pTx) ormultitransmit. Different safety considerations are necessary for thisapproach, since the incident field pattern can change dramatically,and local energy absorption may be enhanced by a factor of up tomore than ten due to constructive interference [14].

2.7. RF SHIMMING AND MULTITRANSMIT COILS 21
a b
c d
16 8 4 2 1 0.5 W/kg
0 -3 -6 -9 -12 -15 dB
0 -3 -6 -9 -12 -15 dB
3 2.1 1.5 1.06 0.75 0.53 µT
psSAR psSAR
ROI
|B1+| |B1
+|
Circular polarization
wbSAR = 1 W/kg wbSAR = 1 W/kg
Polarization optimized for ROI
Figure 2.5: CP- and ROI-optimized excitations (applied polarizationellipses indicated) and their effects on psSAR (a,b) and B1+ distri-bution (c,d) for a constant wbSAR = 1 W/kg. The B1+ level anduniformity in the ROI (torso) can be substantially improved. Theexample case is for Duke inside a 3 T birdcage in pelvis imaging posi-tion.

22 CHAPTER 2. BACKGROUND IN MRI SAFETY
2.8 RF Simulations with Human Anatom-ical Models
There are several simulation techniques in computational electromag-netics (CEM), each with their advantages and weaknesses. For thebirdcage simulations, the method of moments (MOM) or the finite ele-ments method (FEM) may be the best choice, as they can treat curvedgeometrical objects more accurately than other methods. However,when complex anatomical models or structures are involved (e.g., pa-tient inside the birdcage), the simulation space can easily reach dimen-sions of 100 million voxels (three-dimensional pixels) or more, which iswell handled by the finite-difference time-domain (FDTD) technique.Calculations can be parallelized on graphic processors (GPU), whichshortens simulation time by factor > 100. However, as computers withlarge amounts of RAM become more and more available, anatomicalmodels may also be simulated with FEM, which may be better suitedfor resonant structures.
In the studies included within this thesis, all simulations were per-formed on SEMCAD X (versions 13.4–14.8), an FDTD simulationplatform jointly developed by SPEAG (Zurich, Switzerland) and theIT’IS Foundation.
To replicate realistic simulation scenarios, accurate 3-dimensionalhuman anatomical models are needed, with correctly assigned tissues.Models with increasing resolution and quality have been developed inrecent decades: the “visible human” developed in 1994 by the U.S.National Library of Medicine; the japanese female and male modelsHanako and Taro developed at the National Institute for Communica-tions Technology (NICT); and the Virtual Population [15], consistingof more than 10 models (children, adults, elderly, obese, pregnant),jointly developed by the FDA and the IT’IS Foundation. The assign-ment of dielectric properties to up to 90 different tissues and organs isaccording to literature values, as described in a comprehensive review[16] based on [17].
Chapters 4 and 5 are typical applications of EM simulation scenar-ios. The B1 field with and without an anatomical model is visualizedin Figure 2.4.

2.9. HUMAN THERMOREGULATION 23
2.9 Human Thermoregulation
The primary focus within these studies on thermoregulation is thedown-regulation of temperature as a response to excessive heating inthe MRI environment. We do not investigate thermoregulation dueto low-temperature stimuli.
There are two major thermoregulation regimes relevant in MRIexposures.
• whole-body heating / systemic thermoregulation
• localized heating / local thermoregulation
The two regimes are analogous to the difference between suffering fromheat-stroke (where no burn is visible) and burning a hand on a hotplate (where no heat-shock symptoms are expected). The first is easierto diagnose, as it can be estimated from elevated core temperature,increased heart rate, or extensive sweating and discomfort. The latteris more challenging and needs to be discussed thoroughly. Obviously,depending on the extent of the localized heating, the two regulationregimes may interact.
2.9.1 Whole-Body Thermoregulation
Experience from hyperthermia shows that very high wbSAR values(typically 6 – 10 W/kg) can be tolerated without systemic thermalbreakdown, i.e., without core-temperature elevation above 38 – 39°C[18]. While there is an ongoing debate about the exact systemic ther-moregulation mechanisms, the actual heat-loss pathways are clear.The most important factor may be behavioral thermoregulation, aswe actually seek shade when we’re hot in response to a conscious sen-sation of heat or pain. In MRI examinations, this would result inpatient feedback to the operator. On the physiological side, there arethe following mechanisms: (a) increased skin vasodilatation leads tohigher cooling of the blood, (b) skin temperature can be lowered bysweating, (c) elevated breathing rate enhances heat loss in the phar-ynx, trachea, and lungs, and (d) increased heart rate for more rapidrecuperation. Dehydration may impair whole-body thermoregulation.Monitoring and limiting body core temperature efficiently prevents

24 CHAPTER 2. BACKGROUND IN MRI SAFETY
systemic breakdown or adverse effects from whole-body heating. Thissimple measurement can be performed with a single oral or rectaltemperature probe.
2.9.2 Local Thermoregulation
Human response to local heating is far more challenging to assess.Also here, behavioral thermoregulation may be the most importantresponse, e.g., the dedicated spinal reflexes to withdraw the hand fromthe hot plate. However, as the hotspots from MRI exposure may oc-cur in tissues without thermal sensation, these mechanisms may beconsiderably constrained. Muscle, for example, does not cause a con-scious thermal sensation between 8 and 48°C, and pain sensation issignificant only at or above 48°C, which was determined by applica-tion of a hot isotonic saline intramuscular injection [19]. The mainphysiological tissue response to local heating is increased blood per-fusion [20], which enhances cooling in the affected region. Responsetimes are on the order of several minutes, and local blood flow can beupregulated by more than an order of magnitude [21]. Other mech-anisms are far less relevant for extensive local heating (> 20 W/kglocal SAR). Increased sweating and airflow leads to lower surface tem-peratures, but does not significantly affect structures with more thanabout 10 mm distance to the body surface, as blood temperature ismaintained via the whole-body thermoregulation.
This leaves the local blood perfusion increase as the primary mech-anism for local thermoregulation. The actual effect-magnitude, how-ever, is subject to many complex interactions and dependencies: (a)there are potentially large inter-subject variations; (b) the physical ex-tent of the heat administration influences the amount of blood avail-able according to the blood-compartment model; (c) blood is sub-sequently redistributed [22], and (d) thermal memories introduce adependency on the temperature history of the tissue, which may alsolead to an enhanced thermal resilience.
As discussed in Chapter 6, we mainly followed the work of Laakso et al.[21] with up to a factor of 32 increase in local bloodflow in skin and afactor of 15 in other tissues.

2.10. THERMAL SIMULATIONS 25
2.10 Thermal Simulations
The electromagnetic simulations and their RF energy absorption dis-tribution (SAR) can be used as input for thermal simulations. Thereare two major approaches — absolute temperature and temperatureincrease simulations — with two major solving strategies: transienttime-domain and steady-state solvers.
The Pennes bioheat equation (PBE, Eqn. 2.5) is well established:
ρc∂T
∂t= ∇ · (κ(~r)∇T (~r, t)) + g(~(r), t) (2.5)
g(~r, t) = ρQ+ ρS − ρbcbρω(T − Tb)
where T is the temperature at location ~r and time t, c the specific heatcapacity, κ the thermal conductivity, ρ the density, ω the perfusionrate, Q the metabolic heat generation rate and S the spatial specificabsorption rate (SAR). The index b indicates a property of blood. ThePBE performs well for the given exposure scenarios, given a relativelystable core temperature. However, it neglects certain aspects such asanisotropic heat-flux or varying blood temperatures along the vessel.
Thermal tissue properties are assigned with literature values, e.g.from [16], and contain high uncertainty and inter-subject variability.The major tissue response to temperatures significantly above 37°C(psSAR10g exposures above 20 W/kg) is increased bloodflow [20, 21].Thermal simulation results are presented in Chapter 6.
2.11 Thermal Dose (CEM43) and Dam-age Thresholds
Temperature alone is a poor surrogate for thermal stress on tissues.In fact, appropriate integration of temperatures over time is muchcloser related to the actual thermal tissue damage observed. Intu-itively, it is clear that holding your hand in 60°C water for 1 secondwill cause you less pain than leaving it there for several minutes. Themost prominent investigation on the corresponding correlations hasbeen conducted by Sapareto et al. [23], in which a mathematical

26 CHAPTER 2. BACKGROUND IN MRI SAFETY
translation of time-temperature combinations to cumulative equiva-lent minutes at 43°C (CEM43) is presented. Estimation of the ef-fective equivalent thermal stress is achieved via the integration of atemperature-weighted function over time:
CEM43(t) =
∫ tfinal
t0
R(43−T (t)dt (2.6)
where t0 signifies the beginning of the heating period and tfinal itsend. T (t) is the temperature of the tissue of interest at time t, andR is a constant equal to 0.5 for T (t) > 43°C, 0.25 for 39° < T (t) <43°C, and R = 0 for T (t) < 39°C.
For example, exposing skin tissue for 240 min to 43°C (CEM43= 240 min) causes symptoms equivalent to those caused by 960 min(16 h) at 42°C, 1 min at 51°C, or 0.1 s at 60°C. Different tissues havedifferent resiliencies to thermal load. Skin may tolerate up to CEM43= 240 min (as in the example above), more sensitive structures (e.g.,the blood-brain barrier) show significant adverse effects already atCEM43 = 2 min. From the skin example above, we can see that burnsmay result from touching objects hotter than 60°C, as the reactiontime of withdrawing your hand is longer than the skin can tolerate atthat temperature. The application of the CEM43 dose evaluation canbe found in Chapter 6.
From literature values, thermal damage threshold values for vari-ous tissues can be derived and divided into minor and significant ad-verse changes. The endpoints for estimating damage usually are basedon (1) histopathology, i.e., microscopic examination of tissue samples,(2) gross appearance, and (3) physiological function. The compre-hensive reviews of Dewhirst and Yarmolenko [24, 25] give excellentoverviews on the tissues’ thermal resilience. Damage thresholds forsevere effects can be categorized as follows (excerpt from [24]):
CEM43 = 2–20 min blood brain barrier (BBB), brain, boneCEM43 = 20–40 min small intestine, mammary glandCEM43 = 40–80 min muscle, cornea, lens, nerve, retinaCEM43 = > 80 min skin, fat, esophagus, prostate, rectum
In MRI exposures at 1.5 T and 3 T, the peak temperature usually

2.12. VALIDATION METHODS 27
occurs within muscle, skin, fat, or bone tissues. To facilitate the evalu-ations, we propose having a CEM43 threshold limit of CEM43 = 15 minfor these four tissues, and CEM43 = 2 min for all others. The15 min limit was chosen, as this is the threshold for bone, whichis the lowest in this group. Similar, BBB has the lowest threshold(CEM43 = 2 min) in all other tissues.
2.12 Validation Methods
Simulation results are susceptible to many biases and cumulative er-rors. A rigorous uncertainty budget is generated in all our studies toestimate the accuracy of our evaluations. However, a reality check inthe form of in vivo and human validations is indispensable. Unfortu-nately, access to local temperatures in humans is challenging. Thus,we pursued validations on different levels of abstraction.
Phantom Validation. The simulation results can be bench-marked against dosimetric measurements in phantoms. This has beenperformed for both EM and thermal experiments, e.g., in [26].
In Vivo Validation. Two project partners have performed val-idation measurements in swine. The Charie Hospital in Berlin foundalarmingly high local temperatures (up to 50°C) when exposing thepigs to 4 W/kg wbSAR for 60 min, which, in essence, cooked part ofthe muscle tissue. A group in Minnesota [27] found comparable re-sults. As the same 4 W/kg wbSAR level is allowed in clinical practice,pigs may have significantly lower thermoregulation abilities comparedto humans, or their thermoregulation may be influenced by the anes-thetics. However, it is questionable how many patients really areexposed to 4 W/kg for 60 min, as discussed in Chapter 2.13.
Human Validation. Invasive measurements in humans are chal-lenging. The EM simulation can be partially validated via B1+ scan-ner measurements. As this CP component of B1 is responsible for spinnutation, the relative distribution or B1+ can be estimated with ded-icated scan sequences [28]. Skin temperatures can be measured nearestimated hotspots for validation of transient temperatures, as de-scribed in Chapter 6. Internal temperatures, however, remain widelyunvalidated with this method. The most promising technique for fu-ture validation concepts is MRI thermometry, in which the proton

28 CHAPTER 2. BACKGROUND IN MRI SAFETY
resonance frequency shift (PRFS) [29] is used to assess the internaltemperature distribution non–invasively. While, so far, the measure-ment uncertainty on the order of 1°C in living subjects may be toohigh for validation purposes, future developments could allow this.
2.13 Safety Standard and History of SafeUse (HoSU)
At first sight, standard quadrature driven coils operated accordingto the product standard [3] are deemed safe, based on their remark-able history of safe use (HoSU), with incidents on the ppm scale [30].Despite very high localized RF exposure, introduction of more con-servative limits are not called for. However, there are indications thatthe allowance in the defined operating modes was very rarely fullyexploited. While wbSAR values of up to 4 W/kg are allowed [3],the actual wbSAR rarely exceeds 2 – 3 W/kg due to the (1) man-ufacturer’s safety margin and (2) frequent interruption between thescan sequences. The allowed maximum SAR-dose of 240 W·min/kg(4 W/kg for 60min) is believed to rarely (< 0.1%) exceed about150 W·min/kg. This data originates from personal communicationwith MR manufacturers and cannot be cited due to trade secrets.But it may lead to the conclusion that the HoSU only proves the safeuse of actually applied exposure levels, rather than of the currentlyallowed exposure level. A revision of IEC 60601-2-33 [3] is, therefore,recommended.
The challenge for future revisions of the safety guidelines, however,will be related to emerging new technologies, e.g., multitransmit coils,that cannot rely on this HoSU and need more sophisticated safetyassessments. An important step in this progress is presented withinthis thesis, by reproducing the HoSU. The developed accurate EM andthermal modeling methodologies can be adapted to novel exposurescenarios. An outlook is given in Chapter 7.

Chapter 3
Incident FieldMeasurements andClassification of MRIField Generating Units
3.1 Objectives
Within this classification report, the B1 incident field distributionsfrom seven of the most common MRI scanners have been assessed,allowing for a representative characterization of the RF components.The key parameters for the incident B1 fields include the volume ofB1, i.e., (a) geometry of the body-coil, (b) B1 field distribution, and(c) the orientation of the polarization of scanners from a specific man-ufacturer.
3.2 Selected MR Systems
There are only a few full system MRI suppliers worldwide: Siemens,GE, Phillips, Toshiba, Hitachi, and a few smaller ones such as Isol.
29

30 CHAPTER 3. INCIDENT FIELD MEASUREMENTS
Siemens, Philips and GE have a market share of about 80%. Thedistribution of the installed scanners as of 2007 was approximately asfollows: <0.5 T (open): 20%; 1.5 T: 66%; 3 T: 12%; a few units of 4 T,and about twenty 7 T scanners. Fewer than 3% are in the class 0.5 –1.0 T [31].
As this classification focuses on measurements of 1.5 T and 3 Tclosed-bore systems only, seven MRI scanners with cylindrical boreshave been identified, measured, and integrated in this report (see Ta-bles 3.1 and 3.2). The selection was based on (1) following publi-cations such as [32], (2) personal communications with radiologistsand company representatives, (3) relevance to the market, and (4)differences in body coil (length, diameter).
Manufacturer Philips Siemens Siemens GEScanner Achieva Avanto Espree TwinSpeed
Type 1.5 T 1.5 T 1.5 T 1.5 TSoftware 2.5.1.0 SyngoB15 SyngoB15 14.0 M5RF system Freewave TIM TIM76x32 HDxFrequency 63.9 63.6 63.6 63.86Peak power (kW) 25 15 22.4 16Peak B1 (µT) 27 30 23 25Location USZ Uni Basel Uni Basel KiSpi
Table 3.1: Selected 1.5 T MRI-scanners with nominal key parameters.
Manufacturer Philips Siemens GEScanner Achieva Verio TwinSpeed
Type 3 T 3 T 3 TSoftware 2.5.1.0 SyngoB15 14.0 M5RF system Freewave TIM120x32 HDxFrequency 127.73 123.2 127.73Peak power (kW) 25 35 35Peak B1 (µT) 13.5 23 25Location Uni Basel Uni Basel KiSpi
Table 3.2: Selected 3 T MRI-scanners, with nominal key parameters.

3.3. METHODS 31
3.3 Methods
3.3.1 RF Measurement Protocol
The field distribution of the B1 incident field has been assessed ac-cording to the measurement protocol in Table 3.3. Measurements ofone scanner took roughly 3 hours (not including preparations), andwas, therefore, usually performed at night at the different hospitalsites. The term “boresight” refers to the symmetry axis through thebore in the Z-direction, with the isocenter being the symmetry pointof the bore.
Activity Sequences Location
1 Identify isocenter Survey sequence Isocenter2 Field distribution Test sequence Boresight3 Field distribution Test sequence Other positions4 Body coil search Test sequence Trial and error5 Time domain measurement Test sequence Fixed position
1. The isocenter was identified with a liquid-filled phantom that included a“marker” region without liquid. The position has been adjusted until theoverview scan displayed the marker at the isocenter.
2. E-Field and H-field measurements were conducted in 50 mm steps along theboresight.
3. The probe positioner (Figure 3.1) was used to measure non-boresight positionsof the measurement grid
4. We searched for the field enhancements around the end-ring and loading capac-itors, to assess the birdcage geometry.
5. The time domain signal of the actual test sequence is measured to post-calibratethe RMS probes.
Table 3.3: Measurement sequence
3.3.2 Measurement Phantoms, Jigs and Grid
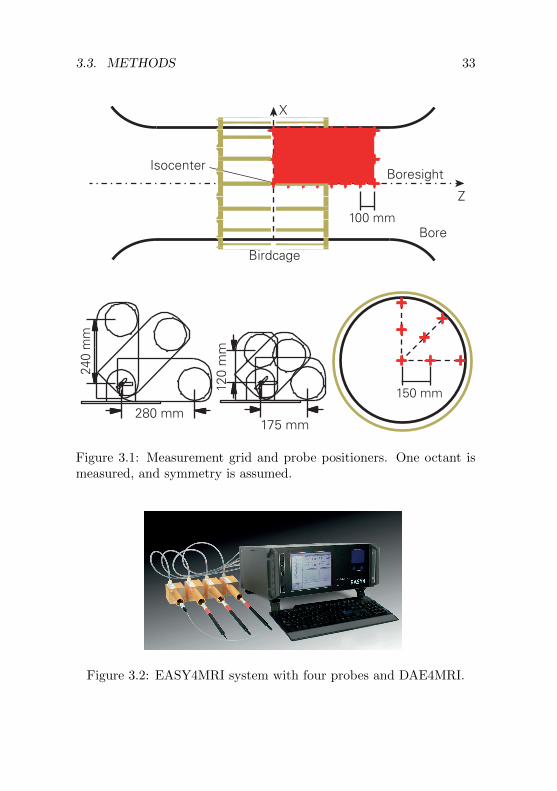
Figure 3.1 shows the measurement grid within the MRI machines. The∆Z grid is based on 100 mm Z-axis increments. The crosses representthe E- and H-field probe positions. On the boresight, the spacingwas reduced to 50 mm. The total number of envisioned points to be

32 CHAPTER 3. INCIDENT FIELD MEASUREMENTS
recorded was 62. In addition, a scan of the bore surface was performedto investigate the structure of the body coil. Measurements wereperformed only to the front of the iso-center and out to 700 mm fromthe iso-center, assessing one octant of the bore. The adjustment of thegrid was done on on-site. The measurement probes were supportedwith a custom probe positioner as shown in Figure 3.1. There is asupport base with adjustable legs and two different sized rotatableprobe holders designed to cover the range of required locations.
The measurement software is set up to accept as input a matrixdefining the X and Y coordinates of the measurement point and thento measure and step in the Z-direction as requested by an opticaltrigger. The software then records the probe values in the requiredformat for appropriate post processing. The collected data allowscontours to be plotted in sufficient detail to assess the consistency ofthe measurements.
3.3.3 Measurement Equipment
RF measurements were performed with a standalone data acquisitionsystem called EASY4MRI (Speag, Zurich, Switzerland), which hasbeen optimized for operation in MRI environments. The equipmentcan be seen in Figure 3.2, and the specifications are listed in Table 3.4.The electromagnetic immunity of the EASY4MRI measurement sys-tem was evaluated in 1.5 T and 3 T MRI machines [32]. The resultsare shown in Table 3.5.
3.3.4 RF Test Sequence and Probe Calibration
The measurements of the RF fields were performed with a simple testsequence, which allowed the RMS field probes to properly compen-sate for the crest factor; the use of a complex clinical sequence mightlead to results with high uncertainties. A sequence similar to our pro-posed waveform (Fig. 3.3) could be implemented on all scanners. Amanufacturer representative (application engineer) was in some casescalled in to program the machine for our test purpose. The actualwaveforms of the test sequences can be seen in Figures 3.4 and 3.6.The probes were calibrated post-hoc at 64/128 MHz in a TEM cell inair, where the H-fields are normal to the E-fields and transversal to
3.3. METHODS 33
175 mm
120
mm
240
mm
280 mm
Boresight
Bore
Z
X
Birdcage
Isocenter
150 mm
100 mm
Figure 3.1: Measurement grid and probe positioners. One octant ismeasured, and symmetry is assumed.
Figure 3.2: EASY4MRI system with four probes and DAE4MRI.

34 CHAPTER 3. INCIDENT FIELD MEASUREMENTS
E-field probe: SPEAG ER3DV6Frequency range 10 – 6000 MHzDynamic range 1 – 1000 V/mSpatial resolution < 7 mmDirectivity error < ±0.3 dBH-field probe: SPEAG H3DV7Frequency range 40 – 3000 MHzDynamic range 0.01 – 10 A/mSpatial resolution < 4 mmDirectivity error < ±0.2 dBData Acquisition Electronics SPEAG DAE4MRIInput range −100 – 300 mVPower Lithium polymer batteryOutput OpticalNoise <7 µVSampling rate 128 µsData Logger / Field Monitor SPEAG EASY4MRIDAE4MRI inputs 4× opticalDAE power output 4×Interfaces: ETHERNET, USBModes Monitoring, data recordingSampling rate 10 ms to hoursLoop Detector Omnisec, pn 7405-902Detector Diode Sn 208Size Diameter approx. 30 mmOscilloscope HS3 Handyscope
Table 3.4: Measurement equipment specifications
Data Acquisition H-Field E-FieldElectronics
Type DAEMRI H3DV7 ER3DV6
Acceleration < 0.1 g/T 0.01 g/T <0.01 g/TNoise, laboratory conditions) < 7 µV <10 mA/m <1 V/mNoise, 1.5 T static < 10 µV <10 mA/m <1.2 V/mNoise, 3 T static < 10 µV <10 mA/m <1.2 V/mNoise, 1.5 T static + gradient < 10 µV <10 mA/m <1.2 V/mNoise, 3 T static + gradient < 20 µV <17 mA/m <1.7 V/mNoise, 1.5 T static + gradient + RF < 40 µV n.a. n.a.Noise, 3 T static + gradient + RF < 40 µV n.a. n.a.
Table 3.5: EASY4MRI MRI-EMI results

3.4. RESULTS 35
the direction of propagation. The H-field can be calculated from theE-field with the aid of the wave impedance of free space.
1 ms 2 ms 1 ms 2 ms
Figure 3.3: Proposed RF pulse test sequence
3.3.5 Data Evaluation
All measured data were post-processed in Matlab (MathWorks, Nat-ick, US) and normalized to a B1rms value of 1 µT at the isocenter. Acomparison is made to the simulation values of the RF birdcage testsystems MITS 1.5 and MITS 3 (ZMT, Zurich, Switzerland). Simu-lations were performed with SEMCAD X (SPEAG, Zurich, Switzer-land). Because of the high axial symmetry, plotting of the X-Z-plane(X,Z > 0, Fig. 3.1) is considered sufficient to represent the entirefield.
3.4 Results
Results are shown in Figures 3.4 – 3.7. The B1-field distribution aswell as the stray E-fields have the same fundamental pattern for both,real MRI scanners and the MITS test systems. Variations originatefrom the length of the birdcage and the bore diameter (dimensionsare indicated on the graphs). The GE Twinspeed 3 T system exhibitsa different pattern especially in the B-field. The coil resonator typeand number of rungs could not be estimated free of doubt. Wide-boresystems as the measured Siemens Espree and Verio have much higherstray E-fields around the birdcage end-ring.

36 CHAPTER 3. INCIDENT FIELD MEASUREMENTS
3.5 Conclusions
While the essential field distribution is comparable, the between-scanner variations in the B1 field levels are considerably large. Es-pecially the stray E-fields around the end-rings of the birdcages canget very strong in wide-bore systems. While for bore diameters ≤600 mm the maximally measured E-field RMS values remain below400 V/m (normalized to 1 µT at isocenter), the accessible magnitudecan get up to 1000 V/m in wide-bore systems.
The B0 static magnetic field of Siemens and GE scanners are inopposite direction compared to the Philips magnet. Therefore, the cir-cular polarization of B1 has the opposite rotation direction for Philips,when accessing the magnet from the front.

3.5. CONCLUSIONS 37
MITS 1.5
GE Twinspeed 1.5T
Philips Achieva 1.5T
Siemens Avanto 1.5T
Siemens Espree 1.5T
x (m
m)
z (mm)
0 200 400 600
300
200
100
0
0 200 400 600
L = 650 mmØ = 750 mm
Ø = 600 mm
300
200
100
0
0 200 400 600
300
200
100
0
0 200 400 600
300
200
100
0
0 200 400 600
300
200
100
0
B-field dB(1 µT)
B-field dB(1 µT)
B-field dB(1 µT)
B-field dB(1 µT)
B-field dB(1 µT)
Time (ms)0 5 10 15 20Po
wer
(a.u
.)
Time (ms)
(simulation)
0 5 10 15 20Pow
er (a
.u.)
Time (ms)0 5 10 15 20Po
wer
(a.u
.)
Time (ms)0 5 10 15 20Po
wer
(a.u
.)
Time (ms)0 5 10 15 20Po
wer
(a.u
.)
L = 600 mm
L = 550 mm
L = 525 mm
L = 500 mm
Ø = 600 mm
Ø = 600 mm
Ø = 700 mm
B-Field
15
9
3
0
-3
-9
-15
dB
Figure 3.4: B1-field distributions of the MITS test system and theassessed 1.5 T scanners, and the applied test sequences

38 CHAPTER 3. INCIDENT FIELD MEASUREMENTS
MITS 1.5 16 rung birdcage
GE Twinspeed 1.5T 16 rung birdcage
Philips Achieva 1.5T 16 rung birdcage
Siemens Avanto 1.5T 16 rung birdcage
Siemens Espree 1.5T 16 rung birdcage
x (m
m)
z (mm)
0 200 400 600
300
200
100
0
0 200 400 600
L = 650 mmØ = 750 mm
Ø = 600 mm
300
200
100
0
0 200 400 600
300
200
100
0
0 200 400 600
300
200
100
0
0 200 400 600
300
200
100
0
15
9
3
0
-3
-9
-15
dB
E-field dB(100 V/m)
E-field dB(100 V/m)
E-field dB(100 V/m)
E-field dB(100 V/m)
E-field dB(100 V/m)
L = 600 mm
L = 550 mm
L = 525 mm
L = 500 mm
Ø = 600 mm
Ø = 600 mm
Ø = 700 mm
E-Field
Figure 3.5: Corresponding stray E-field distributions at 1.5 T

3.5. CONCLUSIONS 39
MITS 3
GE Twinspeed 3 T
Philips Achieva 3 T
Siemens Verio 3 T
x (m
m)
z (mm)
0 200 400 600
300
200
100
0
0 200 400 600
L = 480 mmØ = 750 mm
Ø = 600 mm
300
200
100
0
0 200 400 600
300
200
100
0
0 200 400 600
300
200
100
0
B-field dB(1 µT)
B-field dB(1 µT)
B-field dB(1 µT)
B-field dB(1 µT)
Time (ms)0 5 10 15 20Po
wer
(a.u
.)
Time (ms)
(simulation)
0 5 10 15 20Pow
er (a
.u.)
Time (ms)0 5 10 15 20Po
wer
(a.u
.)
Time (ms)0 5 10 15 20Po
wer
(a.u
.)
L = 600 mm
L = 400 mm
L = 400 mm
Ø = 600 mm
Ø = 700 mm
B-Field
15
9
3
0
-3
-9
-15
dB
Figure 3.6: B1-field distributions of the MITS test system and theassessed 3 T scanners, and the applied test sequences
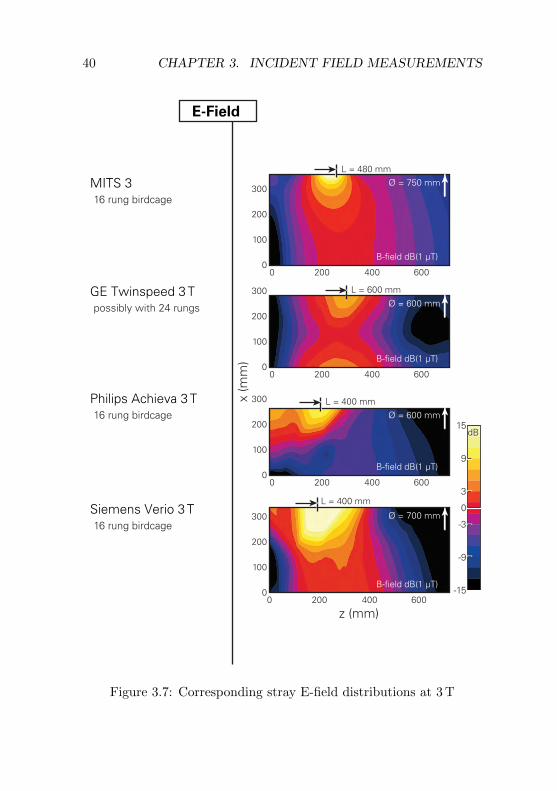
40 CHAPTER 3. INCIDENT FIELD MEASUREMENTS
MITS 3 16 rung birdcage
GE Twinspeed 3 T possibly with 24 rungs
Philips Achieva 3 T 16 rung birdcage
Siemens Verio 3 T 16 rung birdcage
x (m
m)
z (mm)
0 200 400 600
300
200
100
0
0 200 400 600
L = 480 mmØ = 750 mm
Ø = 600 mm
300
200
100
0
0 200 400 600
300
200
100
0
0 200 400 600
300
200
100
0
B-field dB(1 µT)
B-field dB(1 µT)
B-field dB(1 µT)
B-field dB(1 µT)
L = 600 mm
L = 400 mm
L = 400 mm
Ø = 600 mm
Ø = 700 mm
E-Field
15
9
3
0
-3
-9
-15
dB
Figure 3.7: Corresponding stray E-field distributions at 3 T

Chapter 4
Local SAREnhancements inAnatomically CorrectChildren and AdultModels as a Function ofPosition within 1.5 TMR body coil
4.1 Abstract
1Usage of magnetic resonance imaging (MRI) is continuously increas-ing due to its excellent soft-tissue contrast and improving diagnosticvalues. MRI also has the advantage that it operates without ioniz-ing radiation. The main safety concerns are torque, acceleration by
1This Chapter has been published in [33].
41

42 CHAPTER 4. LOCAL SAR ENHANCEMENTS
the static field, nerve stimulation by the gradient fields, and tissueheating by the radio-frequency (RF) fields. This paper investigates ifchildren and fetuses are at higher risks than adults when the currentRF regulations are applied. We analyzed and compared local absorp-tion hotspots, i.e., the peak spatial specific absorption rate averagedover any 10 g (psSAR10g) for five adults, three children of ages 5,11 and 14 years, and 1 pregnant female (36 weeks’ gestation) in 10different Z-positions (head to calves). In the First Level Con-trolled Operating Mode (4 W/kg whole-body averaged expo-sure), the psSAR10g values found for adults were as large as 60 W/kgin the trunk and 104 W/kg in the extremities. The correspondingvalues for children were 43 and 58 W/kg, respectively, and 14 W/kgfor the unborn child. Modeling of worst case anatomical RF loops cansubstantially increase the psSAR10g values, i.e., by factor >> 2.
The results suggest that local exposure for children and fetuses issmaller than for adults (15–75%), i.e., no special considerations forchildren and the unborn child are needed regarding psSAR10g due toRF. However, the local thermal load of the unborn may be significantlyincreased due to the high exposure average (up to 4 W/kg) of the non-perfused amniotic fluid.
4.2 Introduction
Magnetic resonance imaging (MRI) has established itself as a routinetechnique in medical diagnostics. The absence of ionizing radiation,the excellent soft-tissue contrast and flexibility are the major advan-tages of MR systems compared to computer tomography (CT). Thepotential patient risks due to torque and acceleration of ferromagneticobjects by the static field, nerve stimulation by the gradient fields,and local and whole-body tissue heating by induced eddy currentsfrom the radio-frequency (RF) fields must be carefully managed, theguidelines of which are defined in [3]. With respect to RF safety, thisstandard defines three Operating Modes (OM): (A) Normal, (B)First Level Controlled, and (C) Second Level Controlled.For (B), risk-benefit considerations and additional medical supervi-sion are needed, while (C) requires the explicit authorization of thelocal investigational review board. Within this study, the children

4.2. INTRODUCTION 43
and adult models are exposed to the First Level ControlledOM and the pregnant woman to NORMAL OM, representing clinicalrelevant worst-case RF exposures. RF exposure is usually expressedin terms of the specific absorption rate (SAR), with the principalunderlying mechanism of induced eddy currents by the time varyingB1 field, which is typically circularly polarized and perpendicular tothe Z-axis. Therefore, the highest SAR values are usually found inperipheral areas as eddy currents increase with radial distance.
The OMs are defined by limiting whole-body, partial-body andhead SAR (wbSAR, pbSAR, hdSAR). The standard does not limitlocal hotspots or peak spatial SAR averaged over any 10 g of tissue(psSAR10g). Limits for psSAR10g have not been defined for volumecoils, i.e., it is implicitly assumed that hazardous local hotspots areprevented if the large body averaged SAR limits are satisfied [34]. Thisstudy presents numerically derived SAR enhancements using 9 differ-ent anatomically correct human models in 10 different Z-positionswithin a generic 1.5 T MR body coil.
The psSAR10g values depend on:
• large anatomical features: height, weight, shoulder length, form-ing of current loops
• subjects’ position: x, y, z, relative to the body coil
• subjects’ posture: standard (lying on back), prone, sideways
• detailed anatomical features: dielectric contrasts, body con-straints
• birdcage geometry and field pattern.
These dependencies are best addressed by numerical investigationswith anatomically correct models. The largest obvious differencesbetween children and adults are the dimensions of the large anatomicalfeatures.

44 CHAPTER 4. LOCAL SAR ENHANCEMENTS
4.3 Methods
4.3.1 Simulation Configuration
In order to investigate the major impact parameters of anatomy andposition on local SAR enhancements, nine different anatomical modelswere used for numerical evaluations in ten different Z-axis positionseach (Fig. 4.1). The children Billie, Louis, and Roberta, and the adultsDuke, Fats, Ella, and pregnant Ella are part of the Virtual Population[35] (www.itis.ethz.com/vip). They have a resolution of less than0.9×0.9×2 mm3 and consist of more than 69 different organs andtissues, which have been reconstructed as triangular surface meshes.The Japanese Female Hanako and Japanese Male Taro were developedat the National Institute for Communications Technology (NICT). Anoverview of the models can be found in Table 4.1 and Figure 4.2).
Name Sex Age Height Weight BMI1 BSA1 No. of[years] [m] [kg] [kg/m2] [m2] tissues
Billie f 11 11.47 35.4 16.5 1.20 74Duke m 34 1.78 76.2 24.3 1.87 73Ella f 26 1.63 59.1 22.2 1.64 73Preg. Ella f 26 1.59 64.7 25.8 1.69 90
(36 weeks)2
Fetus f 0 0.50 3.0 12.0 0.20 26Fats m 37 1.82 120.2 36.4 2.46 76
Table 4.1: Overview of the anatomical models used for simulations.
The dielectric tissue properties have been assigned according to lit-erature values [17] that have recently been updated [16]). In terms ofdielectric properties, the placenta is assumed to correspond to muscleand the amniotic fluid to cerebrospinal fluid, as suggested in [37]. Re-cent measurements could not be extrapolated to the 1.5 T specific lar-mor frequency, but seem to support this assumption [38]. All digestivelumina are filled with air, unlike in comparable studies [39] which usedthe properties of muscle or surrounding tissues. The difference in MR
1Body mass index and body surface area [36].2Pregnant Ella has different height and weight than Ella, due to segmentation
changes.

4.3. METHODS 45
sourcescapacitors
Z-axis position-250 -125 0 125 250 375 500 625 750 875 mm
Figure 4.1: Top: generic birdcage body coil model with pregnant Ella.Bottom: positioning of anatomical models (graphic shows shifting ofbirdcage, assuming a fixed model position). Z=0 corresponds to theheart at the isocenter.

46 CHAPTER 4. LOCAL SAR ENHANCEMENTS
-250-125
0125250375500625750875
Duke Ella Fats Hanko Taro Billie Louis Pregnant
Headimaging position
Torsoimaging position
Legimaging position
Z-axis position (mm)
Fetus Roberta
Figure 4.2: Anatomical models used for numerical evaluations, allwith identical scaling and landmark position indication.
applications in terms of regional psSAR10g and wbSAR is marginal(<3%) as high- SAR regions always occur in peripheral areas. Ageneric 1.5 T birdcage model was used (16 rungs, 750 mm diameter,650 mm length), with 16 phase-adjusted current sources in the rungsand 63.3 pF end-ring capacitors for symmetrical quadrature feed at64 MHz. The models were placed in 10 shifted Z-positions (∆Z=125mm, values between Z=250 mm to Z=875 mm, with Z=0 mm corre-sponding to the heart at the isocenter, see Fig. 4.1). In the X and Ydirection, the center of the heart was kept on the Z-axis. The evalu-ation of left-circular (B1+) and right-circular (B1−field orientationsmainly revealed regional psSAR10g differences in the left/right armregions, but remained below 15% otherwise. Results are therefore re-strained to B1+ only. Anatomical RF loops were inhibited by ensuringa minimum of 2cm isolation between hands and hip, and between theinner thighs.
4.3.2 Electromagnetic Simulation
Numerical evaluation and dosimetry was conducted with SEMCAD X,V14.2 (SPEAG, Zurich, Switzerland). Due to the large number of sim-ulations, a Huygens Box approach was applied [40]. The incident fieldwas obtained for an empty birdcage with a grid optimized for the RFelements (minimum voxel size 0.4 mm). The result was used as input

4.3. METHODS 47
for the Huygens Box simulations with the anatomical model and auniform grid resolution of 2 mm (x,y,z). The effect of the backscat-tering on the coil system was neglected to enable comparison of theexposure of adults and children for the same incident field. For theapprox. 50 million voxels of the entire simulation space, the calcula-tion time was around 1 h per simulation on a hardware acceleratedcluster (SPEAG, Zurich, Switzerland).
4.3.3 Data Evaluation
Results were extracted for
• whole-body SAR (wbSAR)
• partial-body SAR (pbSAR), including exposed patient mass ac-cording to (IEC, 2010)
• head SAR (hdSAR)
• regional peak spatial SAR averaged over 10g (psSAR10g) withinfive different body regions: left arm, right arm, head, trunk,both legs. For the pregnant model, the fetus and amniotic fluidwere also processed as two additional body regions.
• average SAR (avSAR) of the amniotic fluid for the pregnantmodel
The region masks for the five body regions (seven when includingthe fetus and amniotic fluid) were applied to determine the distribu-tion of the spatial SAR averaged over 10 g (sSAR10 g) with in thebody, e.g., the psSAR10g of the fetus also included values from thesurrounding tissues or amniotic fluid for the averaging algorithm.
The psSAR10g values were normalized to the desired MR OM, usu-ally First Level Controlled according to [3], where the relevantguideline limits are wbSAR: 4 W/kg; hdSAR: 3.2 W/kg; and pbSAR:4–10 W/kg. The Normal OM was applied for the pregnant model:hdSAR: 3.2 W/kg, wbSAR: 2 W/kg, pbSAR 2–10 W/kg. Estimationof the pbSAR is calculated as the average SAR of the exposed patientmass. The effective volume of the generic body coil is estimated to bewithin ±360 mm from the isocenter, following the procedure describedin the standard [3].

48 CHAPTER 4. LOCAL SAR ENHANCEMENTS
4.4 Results
For a fixed B1rms field of 1 µT at the isocenter, wbSAR values upto 0.18 W/kg were obtained (children: 0.13 W/kg), hdSAR values upto 0.14 W/kg (children: 0.10 W/kg), and psSAR10g up to 3.2 W/kg(children 1.5 W/kg). The highest local SAR values were found in thearms for Z-positions with the abdomen in the isocenter (Z= +250 mm)(see Fig. 4.3).
On average, children reach 65% of the wbSAR but only 50% ofthe psSAR10g of the adult values. Thus, when normalizing to thewbSAR for the corresponding OM, the children’s average psSAR10gstill remains below the adult values.
Normalized to the First Level Controlled OM, this results inpsSAR10g values of up to 104 W/kg for adults, 58 W/kg for children,and 14 W/kg in the fetus, where the exposure of the mother is limitedby the regulations to the Normal OM.
There are no local SAR hotspots inside the skull or brain. Peakvalues tend to be around body hollows (axle, crotch), hard dielectriccontrasts and body constrictions (e.g. knee joint, wrist).
Figure 4.3) illustrates the SAR normalization procedures for themodel Ella. Four exposure scenarios were derived for statistical com-parison: (1) regional psSAR10g values of the head are considered forhead imaging positions; (2) in torso imaging positions, mainly thetrunk and arms are exposed, and the arms have the highest regionalpsSAR10g values; (3) the legs are mainly exposed in the correspond-ing leg imaging positions; (4) the trunk is never at maximum expo-sure, but is significantly exposed in all positions. The first 3 exposurescenarios correspond well with the 3 different limitation procedures(wbSAR, hdSAR, pbSAR). Figure 4.4) shows exposure values of thepregnant model, including the fetus and amniotic fluid. The high av-erage SAR (avSAR) of the non- perfused amniotic fluid may lead toan increased thermal load and indirect heating of the fetus. Exposurevalues are summarized in Table 2 and Figure 4.5).
Modeling of anatomical worst case RF loops show potential in-creases in psSAR10g of factor >>2. Figure 4.6 illustrates typical armloops for Duke (arms turned off sideways, hands touch hip) and Billie(only hand-hip touching), demonstrating psSAR10g enhancements offactor 3 and 2.7 respectively.

4.4. RESULTS 49
SAR per First Level Controlled
Reference position in z-axis (mm)
SAR for fixed B1rms = 1µT
-250 -125 0 125 250 375 500 625 750 8750
0.05
0.1
0.15
0.2
0.25
0.3
0.35
0.4
0.45
0.5
Ave
rage
SA
R (W
/kg)
-250 -125 0 125 250 375 500 625 750 8750
0.5
1
1.5
2
2.5
3
3.5
4
psSA
R10
g (W
/kg)
-250 -125 0 125 250 375 500 625 750 8750123456789
1011
-250 -125 0 125 250 375 500 625 750 8750
10
20
30
40
50
60
70
80
90
100
Arm left
wbSARheadSARpbSAR
wbSAR-limitheadSAR-limitpbSAR-limit
Arm rightHeadLegsTrunk
Ella
Ella
wbSAR pbSAR
limiting exposure
hdSAR
Exposure scenario Exposure in region
1 Head imaging Head2 Torso imaging Arms3 Leg imaging Legs4 All positions Trunk
4
3
2
1
Figure 4.3: Exposure normalization illustrated for Ella. Left: valuesfor a fixed B1rms = 1 mT field; right: normalized to First Levelcontrolled OM, where head-averaged SAR (hdSAR), whole-bodyaveraged SAR (wbSAR) and partial-body SAR (pbSAR) are limitingthe exposure in different landmark positions. Top: averaged SARvalues; bottom: corresponding local SAR values (psSAR10g).

50 CHAPTER 4. LOCAL SAR ENHANCEMENTS
SAR per Normal OMA
vera
ge S
AR
[W/k
g]ps
SAR
10g
[W/k
g]
-250 -125 0 125 250 375 500 625 750 8750
1
2
3
4
5
6
7
8
9
10
11
-250 -125 0 125 250 375 500 625 750 8750
10
20
30
40
50
60
70
80
90
100
Arm left
wbSARheadSARpbSAR
Arm rightHeadLegsTrunk
Pregnant
Mother
Mother
Pregnant
wbSARAmniotic fluidavSAR
Fetus
FetusFetusAmniotic fluid
wbSAR
limiting exposure
hdSAR
Reference position in z-axis [mm]
Figure 4.4: Eposure values of the pregnant model (mother and fetus)for Normal OM as function of landmark position. Top: whole-body (wbSAR), partial-body (pbSAR) and head SAR (hdSAR) val-ues, bottom: peak spatial SAR values averaged over any 10 g of tissues(psSAR10g). In Normal OM the pbSAR does not reach a limitingfunction.

4.4. RESULTS 51
Reference position in z-axis [mm]
psSA
R10
g pe
r Fi
rst
Leve
l Con
trol
le O
MN
orm
al O
M fo
r Pr
egna
nt F
emal
e [W
/kg]
-250 -125 0 125 250 375 500 625 750 8750
10
20
30
40
50
60
70
80
90
100
-250 -125 0 125 250 375 500 625 750 8750
10
20
30
40
50
60
70
80
90
100
-250 -125 0 125 250 375 500 625 750 8750
10
20
30
40
50
60
70
80
90
100
-250 -125 0 125 250 375 500 625 750 8750
10
20
30
40
50
60
70
80
90
100
Fetus
ArmsHeadLegsTrunk
Mean / Spread
All models Children
Adults Pregnant female
Figure 4.5: Maximum local psSAR10g as function of landmark posi-tion for different model subsets. Mean value (solid line) and min/maxspread are shown. Children: Billie, Louis, Roberta. Adults: Ella,Duke, Hanako, Taro Fats.

52 CHAPTER 4. LOCAL SAR ENHANCEMENTS
0
-3
-6
-9
-12
-15
dB
45 W/kg
120 W/kg Billie
189 W/kg
64 W/kg
RF Loop No Loop
Duke
>2 cm isolationDielectric contact
psSA
R10
g
Figure 4.6: Illustration of SAR enhancement for Billie and Duke, withand without anatomical RF loop. All normalized to First LevelControlled OM , same position and slice.
4.5 Uncertainty Analysis
The numerical uncertainty analysis was performed with Duke, follow-ing the concept of NIST TN1297 [41]. The analysis included errorsfrom (a) convergence, (b) model discretization, and (c) dielectric tis-sue properties. The combined RSS uncertainty remains below 11%,which is in agreement with the non-thermal uncertainty parametersof [39].
4.6 Discussion and Conclusion
In the First Level Controlled OM [3], the psSAR10g in adultsmay exceed 100 W/kg (potentially much higher when consideringloops). Additional studies are necessary to evaluate the thermal loadfor extensive scanning time. In comparison, the local SAR hotspotsin children of normal weight are weaker than in adults. Therefore, weconclude that no special safety considerations are needed for children.

4.6. DISCUSSION AND CONCLUSION 53
The maximum exposure of the fetus with the mother at NORMALOM is 13.6 W/kg psSAR10g, which is higher than the 9.2 W/kg es-timated in [37] and the 3.1 W/kg in [42]. This is explained by ourmodel being in a later gestational stage (36 weeks) and by the factthat the 10 g averaging cube was allowed to include neighboring tis-sues (e.g., amniotic fluid) in determining the psSAR10g of the fetus.The rational for the latter is that these tissues are thermally rele-vant. Values for the amniotic fluid are very similar (avSAR 4 W/kg,psSAR10g 14.2 W/kg in this study versus 3.4 W/kg and 12 W/kg in[42]. However, even though the fetus has no elevated psSAR10g, theeffect of the high average SAR in the surrounding amniotic fluid mustbe care- fully evaluated in thermal considerations.


Chapter 5
Whole–Body and LocalRF absorption inHuman Models as aFunction of Anatomyand Position within1.5T MR Body Coil
5.1 Abstract
1 Purpose: Radiofrequency (RF) energy deposition in magneticresonance imaging (MRI) must be limited to prevent excessive heat-ing of the patient. Correlations of RF absorption with large-scaleanatomical features (e.g. height) are investigated in this paper.
Theory and Methods: The specific absorption rate (SAR), asthe pivotal parameter for quantifying absorbed RF, increases withthe radial dimension of the patient and therefore with the large-scale
1This Chapter has been published in [43].
55

56 CHAPTER 5. LOCAL SAR AS A FUNCTION OF ANATOMY
anatomical properties. The absorbed energy in six human models hasbeen modeled in different Z-positions (head to knees) within a 1.5Tbodycoil.
Results: For a fixed B1+ incident field, the wbSAR can be upto 2.5 times higher (local SAR up to 7 times) in obese adult modelscompared to children. If the exposure is normalized to 4 W/kg whole-body SAR, the local SAR can well exceed the limits for local transmitcoils and shows inter-subject variations of up to a factor of three.
Conclusion: The correlations between anatomy and induced lo-cal SAR are weak for normalized exposure, but strong for a fixed B1+field, suggesting that anatomical properties could be utilized for fastSAR predictions. This study demonstrates that a representative vir-tual human population is indispensable for the investigation of localSAR levels.
5.2 Introduction
Magnetic resonance imaging (MRI) has become a routine technique inmedical diagnostics. It is often superior to other imaging techniques,such as computer tomography (CT), due to its excellent soft-tissuecontrast and its applicability in MR spectroscopy to non-invasivelyidentify metabolic changes. MRI is deemed safe if the potential haz-ards, such as mechanical forces (static magnetic fields), nerve stim-ulation (gradient fields) and local and whole-body tissue heating byradiofrequency (RF) fields, are carefully managed. Tissue heating iscontrolled for volume coils by limiting the whole-body SAR (wbSAR),head SAR and partial-body SAR (pbSAR) as defined in the IEC prod-uct standard [3]. The limitation values for the two relevant operatingmodes (OM), (a) normal and (b) first level controlled, are given inTable 5.1.
Induced eddy currents are the primary RF absorption mechanismof the B1 magnetic field exposures with the human body, i.e., thehighest energy deposition usually occurs in bodies with large tissuecross-sections. Therefore, large-scale anatomical properties may sig-nificantly influence the energy absorption levels. Recent studies haveevaluated only a small number of anatomical models or positions, e.g.,[34, 44], or they have not explored correlations to large-scale anatom-

5.2. INTRODUCTION 57
ical properties [33]. The induced eddy currents depend mainly on thecross-section of the body and the field strength normal to the cross-section and are therefore largely independent of birdcage design andX-Y-position of the human within the birdcage. In general, the B1field is rather homogenous in the field of view (FOV); it is larger nearthe metallic structure and decreases along the Z-axis. The formationof RF loops formed by the extremities may dramatically increase localSAR [33] and should thus be avoided.
The secondary RF absorption mechanism is the capacitive cou-pling of stray E-fields, predominantly close to the matching capaci-tors. The stray E-fields expose the tissues in close proximity to therungs and endrings, and strongly depend on the actual coil design(e.g. capacities in the rungs, distance of the shield). The size of thebody has no direct influence on the stray E-field absorption pattern.
The actual exposure is a superposition of B1-induced eddy currentabsorption and the localized stray E-field exposure. The effects of thestray E-fields are limited to the arm regions for typical (centered)postures, and therefore have a minor influence on trunk exposure andwbSAR. As stray E-fields are very design specific and a generaliza-tion is not possible, within this study, we focused on the B1-inducededdy current related exposure. Three children and three adult modelswere exposed (a) to a fixed incident B1+-field of 1µT in the centerof the empty birdcage, and (b) to an RF excitation level normalizedto the maximum allowed average output power according to the firstlevel controlled OM. Simulations were performed for 10 different Z-positions (head to knees) within a generic 1.5 Tesla MR body-coilat 64 MHz. The following physical large-scale anatomical properties(Table 5.1). are put into context with the numerically derived SARvalues:
• Unidimensional: body height, shoulder length
• Bidimensional: body surface area (BSA), frontal projection area(FPA), RF exposed FPA (eFPA)
• Volumetric: body weight
• Shape related: body mass index (BMI).

58 CHAPTER 5. LOCAL SAR AS A FUNCTION OF ANATOMY
The goal of this study is to evaluate the influence of large-scale anatom-ical properties on the whole-body averaged and local SAR. The aimis to clarify whether data about the coarse body size and shape ishelpful for estimating the RF energy deposition during MR exposure.
Normal OM First Level Controlled OM(W/kg) (W/kg)
Body coilswbSAR 2 4Head SAR 3.2 3.2pbSAR1 2–10 4–10psSAR10g Not Limited Not limited
Local transmit coilspsSAR10g head 10 20 (can reach > 60 W/kg
and trunk in body coils)psSAR10g 20 40 (can reach > 100 W/kg
extremities in body coils)
Table 5.1: SAR limitations as defined in [3] for body coils and localtransmit coils.
5.3 Methods
The evaluation was based on six anatomical human models (see Fig-ure 5.1 and Table 5.2). The children Billie, Louis, and Roberta, andthe adults Duke, Fats, and Ella are components of the Virtual Pop-ulation [35] (www.itis.ethz.com/vip). All models were positioned ina standard posture, i.e., lying on the back with the heart centeredon the boresight axis. Their minimal distance to the birdcage variedfrom 34 mm for Fats to 183 mm for Roberta (Table 5.2). To evaluatethe effect of rung proximity, Roberta was additionally simulated witha laterally shifted position, such that her proximity to the birdcagewas identical to that of Fats. RF loops formed by the extremities were
1partial-body SAR scales dynamically with the ratio r = exposed patientmass/total patient mass; Normal Mode: SARpartial-body = (10 – 8 · r) W/kg;First Level Mode: SARpartial-body = (10 – 6 · r) W/kg.

5.3. METHODS 59
suppressed by ensuring a minimal distance of 20 mm between handand hip, and between the inner thighs (recommended practice by themanufacturers).
Simulation scenarios were identical to Murbach et al. [33], in whichsimulations for 10 different landmark positions (∆Z = 125 mm, headto knees) within a generic 1.5T birdcage model were evaluated. Mostsimulations were performed in a long birdcage (large B1 volume):64 MHz, high-pass, leg feed, 16 rungs with 16 current sources, 750 mmdiameter, 650 mm length, shield 40 mm radial distance to birdcage,63 pF capacities in the endrings, B1 circularly polarized (CP) androtating clockwise when looking in Z-direction. The second one was ashort birdcage of 400mm length while the other dimensions are identi-cal to the first coil with rung capacities of 88 pF. The applied Huygensbox approach [33] ensured identical birdcage current distributions forall models and positions. The birdcages were tuned to the resonancefrequency using a broadband quadrature excitation with two ports inone endring. Thus, the applied incident fields correspond to an idealCP current distribution. Altered current distributions due to loadingswere not evaluated in this study as they depend on the design andimplementation.
AP1 AP2 AP3 AP4 AP5 AP6 AP7 Position
Model weight height BMI BSA shoulder FPA eFPA min. dist.(y-f/m) [kg] [m] [kg/m2] [m2] len. [m] [m2] [m2] to coil [m]Roberta (5f) 17.9 1.09 14.9 0.73 0.29 0.22 0.11-0.17 0.183Billie (11f) 35.4 1.47 16.5 1.2 0.36 0.37 0.12-0.24 0.145Louis (14m) 51.9 1.69 18.2 1.53 0.41 0.47 0.14-0.28 0.096Ella (26f) 59.1 1.63 22.2 1.61 0.43 0.5 0.14-0.30 0.104Duke (34m) 76.2 1.77 24.3 1.87 0.5 0.55 0.14-0.33 0.078Fats (37m) 120.2 1.82 36.4 2.44 0.51 0.71 0.18-0.45 0.034
Table 5.2: Anatomical Models and Large-Scale Properties AP1–AP7 Used for Simulations. AP7 scales dynamically with the model-position. The minimum distance to the coil depends on the lateraldimensions of the heart-centered models.
The dielectric tissue properties were assigned according to the com-prehensive literature review of Hasgall (www.itis.ethz.ch/database),the recommended dielectric properties of which are largely identicalto those proposed by Gabriel et al. [17]. Details about the electromag-

60 CHAPTER 5. LOCAL SAR AS A FUNCTION OF ANATOMY
netic (EM) simulations have been reported earlier [33]. All simulationswere performed with SEMCAD X Version 14.8, the simulation plat-form developed in-house jointly with SPEAG (Zurich, Switzerland)and commercialized by the latter, with a uniform and isotropic gridresolution of 2 mm. The data evaluation was based on wbSAR, headSAR, pbSAR (these values are necessary for normalization to the op-erating mode), and peak spatial SAR averaged over any 10 g of tissue(psSAR10g) for local peak SAR [7]. Simulations were performed withthe fixed birdcage current distribution resulting in an incident B1+ of1 µT at the isocenter (B1 more than 40 dB lower than B1+). With thepresence of the anatomical models, the induced eddy currents alter B1(Total field = incident field + scattered field). Normalization to themaximum allowance in the first level controlled OM was performedaccording to the standard [3].
For SAR comparison across the models, landmark positions weredefined relative to the models’ torso-heights (0% corresponding to theshoulder, 100% to the groin, Figure 5.1), since the basic anatomicaltorso dimensions are essential for constraining the induced eddy cur-rent patterns (Figure 5.2). Therefore, SAR values were interpolated(piecewise cubic) from the original spacing in the actual simulations(∆Z = 125 mm) and assigned to a 10% relative torso-height grid,which corresponds to an interpolated ∆Z between 44 mm (Roberta)and 79 mm (Fats) for the different models. The heart position wasbetween 20% and 30%. Shoulder and groin positions were identicalacross the models (i.e., 0% and 100%).
The investigated large-scale anatomical properties (AP1–7) usedfor deriving the correlations can be found in Table 5.2, together withthe actual values for the anatomical models and their minimum dis-tance to the birdcage. The FPA (frontal projection area of the X-Z-plane, Figure 5.1) was selected, as it represents the largest projectionof the human body, and therefore allows high induced eddy currents.The eFPA corresponded to the projection area within the active re-gion of the birdcage coil (±360 mm in Z-direction from the isocenter)and depended on the actual model position.
A non-linear correlation between large-scale anatomical propertiesand SAR is expected with several transition zones between differentcorrelation-mechanisms (e.g., from small models almost entirely in-side the birdcage towards models or positions with large portions out-

5.4. RESULTS 61
side the B1 field). The correlation function should also depend onthe nature of the large-scale anatomical property; the unidimensional(height, shoulder length), bidimensional (BSA, FPA, eFPA), volu-metric (weight) and shape related (BMI) anatomical properties havedifferent influences on SAR. Overall, the usage of simple linear re-gression lines showed the most consistent correlations, expressing thefitted SAR Sm for model m as a function of its large-scale anatomicalproperty (APm) as
Sm = f(APm) = a ·APm + b (5.1)
with the slope of the regression line a and the offset b. An ideallinear correlation would result in a zero-offset, since there can be noSAR without some tissue. However, this correlation model serveswell as a local linear approximation of the actual non-linear relation,
as introducing more complex functions (∝ AP 2m or ∝ AP 3/2
m ) did notimprove the predictions. For evaluating the correlation between thelarge-scale anatomical properties (AP1–7) and SAR, the coefficient ofdetermination r2 is introduced as
r2 = 1−∑m(Sm − Sm)2∑m(Sm − S)2
(5.2)
where Sm is defined in Equation 5.1, Sm is the actual SAR (eitherwbSAR or psSAR10g) of the model m and S is the average SAR overall 6 models.
5.4 Results
Figure 5.3 shows SAR values for all models and the correspondingcoefficients of determination (r2). In most cases, Roberta had thelowest exposure values and Fats the highest. As reported earlier [33],the psSAR10g in the first level controlled OM can reach values wellabove the current restrictions for surface coils (20 W/kg in the torsoand 40 W/kg in the extremities, Table 5.1). The values for Fats canexceed 60 W/kg (torso) and 80 W/kg (arms), while the predicted> 100 W/kg in the legs would require an average power fed to the coilthat is beyond the capacity of RF amplifiers in today’s scanners.

62 CHAPTER 5. LOCAL SAR AS A FUNCTION OF ANATOMY
Heart positions
not included within this study
not included within this study-40%
-20%
0%
20%
40%
60%
80%
100%
120%
140%
160%
Fats-37y Duke-34y Ella-26y Louis-14y Billie-11y Roberta-5y
XY
Z
head
shoulder
heart
lower sternum
abdomen
pelvis
groin
thighs
knee
Figure 5.1: The six anatomical models (size is normalized to torso-height) used in electromagnetic simulations and their landmark posi-tions. Electromagnetic simulations were conducted with the originalsize.
Generally, the best correlation values were found for BSA, shoulderlength and (exposed) frontal projection area. For a fixed B1+ field,the wbSAR values differed by up to a factor of 2.5 between the models,and good correlation with the anatomy in torso positions (landmark0–80%, r2 < 0.8, Figure 5.3b) was achieved. The psSAR10g reacheda 7-fold increase for large models with good correlations, except forthe groin imaging positions (80–100%, r2 < 0.8, Figure 5.3b).
When normalizing to first level controlled OM (i.e., in most cases,to wbSAR = 4 W/kg) psSAR10g varied by a factor of 3, indicat-ing variations in the relative distribution of the induced fields dueto (a) different relative extents of the B1 field and (b) small-scaleanatomy. These variations, however, cannot be reliably predictedbased on large-scale anatomical properties (generally r2 < 0.8, Fig-ure 5.3c), although there clearly is some relationship. Figure 5.4 showsfour selected example correlations, plotting psSAR10g in all modelsagainst the large-scale anatomical property of the body surface area(BSA). Good linearity was achieved for a fixed B1+ field and forcertain landmarks (e.g., the depicted 20% landmark shows better cor-

5.4. RESULTS 63
Current Density (A/m2) psSAR10g (W/kg)
a d ecb
X
Y
Z
Bird
cage
Z-d
imen
sion
Cen
ter
Boresight lines
-30 -24 -18 -12 -6 0dB
Figure 5.2: a–d: Streamline views of the simulated induced eddycurrent densities (phase of B1 with the highest rate of change in Y-direction is shown, resulting in maximum current induction). Theshaded area indicates the birdcage dimension in Z-direction. a: Duke(20% landmark) with the highest densities at the shoulders, esp. con-stricted near the neck. b: (80% landmark) constriction at the groinwith resulting high densities. c+d: Roberta and Fats (40% land-mark). The torso dimensions mainly restrain the typical eddy-currentpatterns. e: psSAR10g slice view of Fats, actual peak in wrist. Mod-els are exposed to (a–d) an incident B1+ of 1 µT at isocenter in theempty birdcage, 0 dB corresponds to 100 A/m2, and (e) maximumallowance in first level OM, 0 dB corresponds to 80 W/kg.

64 CHAPTER 5. LOCAL SAR AS A FUNCTION OF ANATOMY
relation than the 90% landmark). The r2 value was significantly lowerfor OM normalized exposure (Fig. 4b).
Fixed B1+ = 1µT
a b c
First level controlled OM
wbSAR
SAR
spr
ead
(W/k
g)
Model positionning (%)
Coe
f. of
det
erm
. (r2 )
psSAR10g
psSAR10g1
2
4
3
BSAShoulder lengtheFPA FPAWeightHeight BMI
0.20
0.16
0.12
0.08
0.04
0.00
3.53.02.52.01.51.00.50.0
12010080604020
0
1.0
0.9
0.8
0.7
0.6
0.5
1.0
0.9
0.8
0.7
0.6
0.5
1.0
0.9
0.8
0.7
0.6
0.5 -20 0 20 40 60 80 100 120 140 -20 0 20 40 60 80 100 120 140
-20 0 20 40 60 80 100 120 140 -20 0 20 40 60 80 100 120 140 -20 0 20 40 60 80 100 120 140
-20 0 20 40 60 80 100 120 140
Fats in 400mm coilRoberta close to rung
head
shou
lder
hear
t
low
er s
tern
um
abdo
men
pelv
is
groi
n
thig
hs
knee
FatsDukeElla
LouisBillieRoberta
Figure 5.3: a: wbSAR and (b+c) psSAR10g variation between the sixdifferent human models, and corresponding coefficients of determina-tion between SAR and the large-scale anatomical properties. Nor-malization to a fixed B1+ (a+b) and to first level OM (c). Lower r2
values are found for OM-normalized psSAR10g, and for BMI, weightand height (except for leg positions). Indicated correlations for twolandmark positions of interest (20% and 90%) (circles 1–4) are il-lustrated in Figure 5.4. For comparison, SAR values are shown forRoberta close to rung (identical distance to the birdcage as Fats) andFats in a shorter (400 mm) coil.
5.5 Numerical Uncertainty
The uncertainty of our results, i.e., wbSAR, psSAR10g and subse-quently r2, was determined based on the modeling parameter uncer-tainties from the underlying electromagnetic simulation, following the

5.5. NUMERICAL UNCERTAINTY 65
Body surface area, BSA (m2) B1+, B1
– (µT)
B1+
B1–
psSA
R10
g (W
/kg)
r2 = 0.98
r2 = 0.72 r2 = 0.53
r2 = 0.83
20% landmark (heart) 20% landmark(heart)
90% landmark (pelvis) 90% landmark (pelvis)
0.5 1 1.5 2 2.5 0.5 1 1.5 2 2.5 0 0.4 0.8 1.2 1.6 2.0
2
1.5
1
0.5
0
70
60
50
40
30
70
60
50
40
30
2
1.5
1
0.5
0
Fixed B1+ = 1µT First level controlled OM
1
2 4
3
FatsDukeEllaLouisBillieRoberta
a b
c
Roberta
Endrings
Roberta close to RungRoberta closeto Rung
Fats in400mm coil
Figure 5.4: psSAR10g for the different human models as a functionof the body surface area (BSA). Graphs are shown for a fixed B1+field (a) and normalized to First Level Controlled OM (b), and fortwo landmark positions of interest (20% and 90%). The coefficient ofdetermination is indicated, and corresponding data values from eachplot are shown in Figure 5.3 (circles 1–4). c: Roberta in standard po-sitioning within the birdcage incident field (B1+ = 1 µT at isocenter,90% landmark), and laterally shifted to the same endring distance asFats.

66 CHAPTER 5. LOCAL SAR AS A FUNCTION OF ANATOMY
concept of NIST TN1297 [41]. The combined uncertainty (RSS) wasestimated to be 0.41 dB (∼9%) for wbSAR and 0.52 dB (∼12%) forpsSAR10g, both in agreement with Bakker et al. [39], i.e., 10.6 and11.7% (see Table 5.3). The uncertainty for the calculated r2-valuesis non-linear (Equation 5.2). Approximated values are estimated forwhat is likely to cause the highest error deviations (–ui for Fats andRoberta, and +ui for the other models between).
Parameter Range ui
EM Simulation wbSAR psSAR10gConvergence Simulation length: +100% 0.03 dB 0.03 dBModel discretization Voxel size: 1.5, 3 mm 0.01 dB 0.26 dBDielectric parameter σ : ± 10% (all tissues) 0.10 dB 0.15 dBDielectric parameter ε : ± 10% (all tissues) 0.07 dB 0.09 dBDielectric contrast σ : ± 10% (single tissue1) 0.08 dB 0.17 dBDielectric contrast ε : ± 10% (single tissue1) 0.04 dB 0.04 dBDensity ρ : ± 10% 0.26 dB 0.26 dBSegmentation errors Quality of models [39] 0.28 dB 0.28 dB
SAR uncertainty, RSS 0.41 dB 0.51 dB(∼ 9%) (∼ 12%)
r2 uncertainty r2 > 0.95 < 0.13 dB (< 3%)r2 ≤ 0.95 < 0.31 dB (<7%)
Table 5.3: Standard uncertainty values are standard deviations(k = 1) in the assumed log-normal probability distribution. Be-cause they are uncorrelated, they can be combined by root-sum-square(RSS) procedures.
5.6 Discussion
For comparing SAR across different models, their relative positionswithin the birdcage were normalized to achieve similar exposure con-ditions. Using actual Z-positions or normalization to overall modelheight caused large differences (100–300 mm) in the relative locationof the shoulder and groin due to differences in size and relative sizes,e.g., leg-to-body ratio. As the trunk dimensions significantly influence
1muscle, skin, and fat evaluated

5.6. DISCUSSION 67
the induced eddy current pattern (Figure 5.2), the best landmark nor-malization in terms of SAR correlation is achieved for normalizationto torso dimensions. The residual non-correlation between the mod-els consequently originates from (a) the remaining differences in theexposure scenario (relative extent of the homogeneous B1 field, prox-imity to birdcage) and (b) the differences in small-scale anatomicalproperties of the models. Future studies could further investigate theunderlying mechanisms.
Except for leg positions, weight, height and BMI tend to havelower r2 values, and show a low coherence in all positions (large differ-ences for different landmark positions), i.e., the relative distributionof induced fields is poorly correlated with these parameters. BSA,shoulder length and (exposed) frontal projection area show very sim-ilar correlations, with generally less than 10% deviation from eachother. The wbSAR values (Figure 5.3a) show satisfying correlationswith the large-scale anatomical properties for thorax positions (0–80%landmarks). For very remote landmarks (e.g. –20%), the relation isinversed due to the large unexposed parts, while transition zones (–15to 0%, > 80%) do not allow wbSAR predictions based on large-scaleanatomical properties.
As psSAR10g values for a fixed B1+ field (Figure 5.3b) do notdepend on non-exposed masses, correlations are generally good, withr2 > 0.8 for most positions. For lower abdomen imaging (80–100%),small-scale anatomical variations around the groin, wrists, and handsare predominant, thus reducing the r2 values for large-scale anatom-ical properties. When normalizing to the first level controlled OM(Figure 5.3c), differences in psSAR10g across the models are reducedby approximately two. Correlations generally decrease below r2 = 0.8,resulting in uncertain direct psSAR10g predictions.
For psSAR10g limitation regimes, B1+ levels in combination withpatient anatomy information may thus be a better safety predictorthan wbSAR, i.e., maximum allowed averaged input power could bederived based on the patient’s position and large-scale anatomicalproperties. A combination of wbSAR, B1+ levels, anatomy and posi-tion may yield a more reliable safety management for psSAR10g. Inaddition to direct influences from anatomy on SAR, the formation ofanatomical RF loops (e.g., hand/hip or knee/knee touching) increasethe psSAR10g values by a factor �2 with unchanged B1 and wbSAR

68 CHAPTER 5. LOCAL SAR AS A FUNCTION OF ANATOMY
levels [33]. Thus, the stated correlations are valid only when strictlyinhibiting RF loops caused by physical contact of extremities.
To investigate effects of asymmetric positions, the Roberta modelhas been shifted though the Z-axis positions with identical lateral dis-tance to the birdcage as Fats (34 mm instead of 183 mm). This resultsin a smaller average distance between the birdcage and the trunk, andhigher incident B1 fields due to the characteristic field distribution ofthe birdcage (see Figure 5.4c). As indicated in Figure 5.3a, wbSARshows a constant increase in all positions. The psSAR10g for a fixedB1+ (Figure 5.3b) is almost identical at the 20% landmark (wherethe arm is between the two endrings), and elevated when the arm isin close proximity to the endring. The simulations with Fats within amuch shorter (400 mm) birdcage revealed small deviations comparedto the long birdcage (650 mm) in terms of psSAR10g (< 10% in mostlandmarks), while wbSAR values are smaller, as expected, due to thesmaller extent of the B1 field (Figure 5.3). Even when including thesetwo variations (lateral shift and shorter birdcage), correlations withr2 > 0.8 can be found in centered torso positions (20–60%) for wb-SAR, and in most torso positions (0–80%) for psSAR10g.
5.7 Conclusion
Local SAR levels in the normal and first level controlled OM mayexceed the limits for local transmit coils by more than a factor ofthree. For a fixed incident B1+ field, psSAR10g values can be es-timated from large-scale anatomical properties. When normalizingto the operating modes, this prediction is no longer reliable, leavingsmall-scale anatomy and local body shapes as the relevant parametersfor exposure differences between the human models. The variation inpsSAR10g, however, still shows a factor of approximately three.
Our study results suggest that in the future, anatomical propertiescould be utilized for fast local SAR predictions. For this, a representa-tive population of anatomically correct human models is indispensableto accurately estimate safe local SAR levels and to estimate the actualSAR correlations.

5.8. ACKNOWLEDGEMENTS 69
5.8 Acknowledgements
This study was supported by the EUREKA (E!4144) and CTI (9193.1)project MRI+.


Chapter 6
Thermal Damage TissueModels Analyzed forDifferent Whole-BodySAR and Scan Durationfor Standard MR BodyCoils
6.1 Abstract
1Purpose: This paper investigates the safety of radiofrequency(RF) induced local thermal hotspots within a 1.5T bodycoil by assess-ing the transient local peak temperatures as a function of exposurelevel and local thermoregulation in four anatomical human models indifferent Z-positions.
Methods: To quantize the effective thermal stress of the tissues,the thermal dose model CEM43 (cumulative equivalent minutes at
1This Chapter has been published in [45].
71

72 CHAPTER 6. THERMAL EVALUATIONS IN MR
43°C) was employed, allowing the prediction of thermal tissue damagerisk and the identification of potentially hazardous MR scan-scenarios.The numerical results were validated by B1+- and skin temperaturemeasurements.
Results: At continuous 4 W/kg whole-body exposure, peak tissuetemperatures of up to 42.8°C were computed for the thermoregulatedmodel (60°C in non-regulated case). When applying CEM43 dam-age thresholds of 15 min (muscle, skin, fat, bone) and 2 min (other),possible tissue damage cannot be excluded after 25 min for the ther-moregulated model (4 min in non-regulated).
Conclusion: The results are found to be consistent with the his-tory of safe use in MR scanning, but not with current safety guidelines.For future safety concepts, we suggest to use thermal dose models in-stead of temperatures or SAR. Special safety concerns for patientswith impaired thermoregulation (e.g., the elderly, diabetics) shouldbe addressed.
6.2 Introduction
Magnetic resonance imaging (MRI) has established itself as a routinetechnique in medical diagnostics. The absence of ionizing radiationand the excellent soft-tissue contrast are major advantages of MR sys-tems compared to computer tomography (CT). Guidelines have beendeveloped [3] to avoid potential patient risks due to (a) mechanicaltorque of metallic implants and acceleration of ferromagnetic objects,both by the static field, (b) nerve stimulation by the gradient fields,and (c) local tissue and whole-body heating by the radiofrequency(RF) fields. The history of safe use [30] indicates that quadrature-driven volume or body coils – as applied until today – are safe, whenoperated according to the guidelines.
In this paper, we analyze the locally induced temperature rise as afunction of scantime for different whole-body specific absorption rates(wbSAR) and different imaging positions. The estimated transienttemperature increases are then translated into effective thermal load,applying the thermal dose model of cumulative equivalent minutesat 43°C (CEM43) [23]. From literature values for maximum tolerableCEM43-doses [25], maximum allowed scantimes before potential tissue

6.2. INTRODUCTION 73
damage occurs can be derived.The CEM43 dose model expresses the thermal load on living tis-
sues by estimating the equivalent induced thermal stress in minutes at43°C. For example, exposing skin tissue for 16 min to 43°C (CEM43 =16 min) causes equivalent symptoms as 64 min at 42°C, or 1 minat 47°C. Different tissues have different resiliences to thermal load.While skin may tolerate more than CEM43 = 40 min, more sensitivestructures (e.g., blood brain barrier) show significant adverse effectsalready at CEM43 = 2 min.
In the current standard, absolute peak tissue temperatures are thegoverning limits, with maximum local tissue temperature of 40°C inthe first level controlled operating mode (OM) according to [3]. It isalso stated that higher temperatures are accepted for specific tissuesif no unacceptable risk for the patient occurs. However, there areno guidelines on how to control these limits. Only the wbSAR andpartial-body SAR (pbSAR) limits are provided, and these correlatepoorly with localized exposure (e.g. peak spatial SAR averaged overany 10 g of tissue, psSAR10g) [33], and even less so with the localtemperature increase, as shown in this study.
Assuming temperature independent dielectric parameters as a firstapproximation, the SAR distribution can be determined and trans-lated to the induced temporal temperature distribution via a ther-mal simulation. Key parameters that determine local temperatureincreases are: (a) the electromagnetic exposure level; (b) the spa-tial distribution of SAR, specific heat capacity, thermal conductivity,metabolic heat generation, and transient blood perfusion of the tissue;and (c) the thermal boundary conditions (convection, sweating, etc.).
RF induced temperature increases and local hotspots due to MRexposures were analyzed using anatomical models, e.g., in [34, 46, 42].The strong temperature dependence of perfusion has been consid-ered [34, 21], but without employing a transient thermal dose model(CEM43). Various thermoregulatory effects exist, such as whole-bodythermoregulation [47], redistribution of blood between body compart-ments and tissues [22] and local thermoregulation [48]. The latter isparticularly important with regard to local hotspots resulting fromMRI-induced heating [21].
Local SAR correlates poorly with temperature increase, even withtemperature independent perfusion values, because of the vast tis-

74 CHAPTER 6. THERMAL EVALUATIONS IN MR
sue parameter inhomogeneities in the human body. Non-linear localthermoregulation yields even weaker correlations. As the tempera-ture weighted time-integrals correlate best with tissue damage, safetyguidelines should be based on thermal dose models rather than lo-cal SAR or wbSAR limits. We, therefore, investigated the CEM43dose concept [25] to estimate potentially hazardous combinations ofexposure levels and MR scan setup configurations.
The overall goal of this study was to propose a novel safety ap-proach for MR RF exposures based on thermal dose models by:
• translating different MR RF exposure scenarios to transienttemperature increases in realistic human models and variousimaging positions
• determining the impact of local thermoregulation
• estimating cumulative equivalent minutes (CEM43) for differenttissues in the transient heating process
• deriving maximum scan times before reaching tissue-specific ther-mal dose thresholds.
• identifying potential hazardous MR scan scenarios and compar-ing those with the history of safe use
• validating the simulation models with B1+ and skin-temperaturemeasurements in one healthy subject
6.3 Methods
6.3.1 Anatomical Models and Simulation Scenario
Anatomical Models and Simulation Scenario The evaluation was basedon four different anatomical human models: Fats (m, 37y, 1.81 m,120 kg) representing an obese male; Duke (m, 34y, 1.78 m, 76 kg), anaverage sized adult male; Ella (f, 26y, 1.63 m, 59 kg) an anatomicallysmaller female model; and Billie (f, 11y, 1.45 m, 35.6 kg), a child.They were positioned in ten different Z-axis landmarks to identify theworst case exposure scenario. The selected models of the Virtual Pop-ulation ([35], www.itis.ethz.com/vip) are based on image data with a

6.3. METHODS 75
resolution better than 0.9 × 0.9 × 2 mm3, and consist of more than 69different organs and tissues which have been reconstructed as triangu-lar surface meshes allowing for flexible discretization. The models andtheir positioning are depicted in Fig. 1, together with the generic 1.5T birdcage models. The first model is the conservative birdcage withrespect to B1 excitation as defined in the ISO/TS10974 [49] (high-pass, leg feed, 16 rungs with 16 current sources, 750 mm diameter,650 mm length, tuned to 64 MHz circular polarization). The sec-ond birdcage is 400 mm long representing a shorter, more realisticbirdcage. The simulation scenarios are as described in [33].
6.3.2 Tissue Properties and Local Thermoregula-tion
The dielectric and basal thermal tissue properties (including the metabolicheat generation rate) were assigned according to the comprehensiveliterature review of Hasgall (www.itis.ethz.ch/database), the recom-mended dielectric properties of which are largely identical to thoseproposed in [17]. All digestive lumina were modeled as filled withair [33]. Thermal boundary conditions for systemic thermoregulation(sweating, breathing) are discussed later in the thermal simulationsection.
Accurate modeling of the local thermoregulation in human is chal-lenging, as many parameters have systemic thresholds and interac-tions (e.g. sweating onset; increases in blood perfusion, metabolicrates, and cardiac output), which are also dependent on the extent ofheat administration. Delayed temporal responses, thermal memories,and large inter-subject variations further complicate predictions. Forlocal hotspots above 20 W/kg psSAR10g, thermoregulated local per-fusion is the most important parameter for RF induced temperatureincrease [21], and is also the major tissue response to hyperthermia[50]. Experimental assessments in humans are rare and usually dateback some decades. They generally show perfusion saturation above43–45°C, but state different onset temperatures (34–42°C) and alsohave some differences in basal perfusion values.
Entire forearm perfusion in 5 subjects showed an exponential 10-fold increase between 34 and 45°C [51] and an overall 10-fold increasein 6 subjects at an elevated core temperature of 38°C [20]. The forearm

76 CHAPTER 6. THERMAL EVALUATIONS IN MR
18
30
42
56
68
80
92
104
116
128
lower head
upper sternum
heart
lower sternum
abdomen
pelvis
groin
upper thighs
thighs
knee
reference 0
FATS DUKEELLA BILLIE
Z-axis / imagingposition (cm)
capacitysource
650 mm(400 mm)
750 mm
650 mm birdcage
psSAR10g, 25dB psSAR10g, 25dB
400 mm birdcage
a
b c
0
-5
-10
-15
-20
-25
dB
Figure 6.1: a: The four anatomical models used in electromagneticand thermal simulations and their positioning within the 1.5T bird-cage (assuming fixed model position and movement of the birdcage).Imaging positions are indicated. b: 16-rung birdcage, 650 mm lengthused in general for the simulations, 400 mm for comparison. c: Il-lustrative SAR distribution for Fats in pelvis imaging position withinthe two birdcages.

6.3. METHODS 77
skin blood flow is reported to increase about 15-fold between 37 and45°C (16). Thermoregulated muscle blood flow in the thighs of morethan 20 subjects has been assessed by measuring the Xe133 washoutby X-ray (19), estimating a very steep 16-fold increase. Perfusion infat is estimated to reach a 10-fold increase at 45°C to match an ex-perimental study in 5 subjects (20). Clinical hyperthermia studiesestimate even higher thermoregulation capabilities, with a 42-fold in-crease in skin and 17-fold increase in muscle, to match their numerousexperimental results (> 3000 clinical hyperthermia treatments) (21).Most of the recent modeling studies may have underestimated ther-moregulation by applying increase factors up to 4 only (summarizedin [21]), while Laakso et al. [21] argues for a 32-fold (skin) and 15-fold (other tissues) perfusion increase, which starts directly at basaltemperature.
Based on this data, we widely followed the suggested model ofLaakso et al. [21], with two differences: (a) we applied thermoreg-ulation to skin, muscle and fat only, as literature values are moreabundant and peak temperatures exclusively occur within these threetissues; and (b) the increase depends on absolute temperatures (not onthe local temperature increase), because our validation measurementsin human skin did not support the assumption of significant perfusionincrease below 37°C. Thus, compared to Laakso, our thermoregula-tion model is less aggressive for tissues with basal temperatures below37°C (mainly skin) and does not include other tissues. It models anexponentially temperature dependent increase factor of 32 for skin(from 37 to 45°C), and a factor of 15 for muscle and fat (from 37 to43.3°C). The blood flow can be expressed as (similar to [21])
B(T ) = B0 · Lb(t) (6.1)
Lb(T ) = 1, T < 37◦C
Lb(T ) = 2T−37∆B , T ≥ 37◦C
max(Lb) = 32(skin), 15(muscle, fat)
where B(T ) is the perfusion rate at temperature T , Lb(T ) thelocal temperature dependent multiplier, B0 is the basal perfusion ator below 37°C, and ∆B (the local vasodilation parameter) = 1.6 tomatch the desired temperature dependent perfusion increase. The

78 CHAPTER 6. THERMAL EVALUATIONS IN MR
thermoregulated perfusion model is visualized in Figure 6.2. For allconsiderations, fat also includes subcutaneous adipose tissue (SAT).
Data analysis was performed for:
• constant (basal) perfusion (modeling a completely dysfunctionalthermoregulation)
• muscle, skin, and fat thermoregulated (fully functional/normal)
Although thermoregulatory processes show typical response timesin the order of 10 min, instantaneous regulation was implemented.This may result in a perfusion overestimation, especially within thefirst 10 min of heating (before full physiological response). Cardiacoutput increase is included in the local perfusion increase model.The impact of sweating, room temperature, and breathing is dis-cussed in the next section. No other temperature related effectswere considered, e.g., (a) change of electromagnetic energy absorption-distribution due to thermoregulation dependent dielectric parameter,(b) increased perfusion in tissues other than muscle, skin, and fat dueto the higher cardiac output, (c) stealing effect (11), or (d) behavioralthermoregulation, where the patient may tend to change posture whenfeeling excess heat.
6.3.3 Electromagnetic and Thermal Simulation
Details of the electromagnetic (EM) simulations can be found in [33].All simulations were performed using the finite difference time domain(FDTD) method with a uniform and isotropic grid resolution of 2 mm.The SAR distributions were used as input for the thermal simulations,which were conducted with SEMCAD X, V14.8 (jointly developedwith SPEAG, Zurich, Switzerland), based on the extended PennesBioheat equation (PBE, Eqn. 6.2):
ρc∂T
∂t= ∇ · (k(~r)∇T (~r, t)) + g(~(r), t) (6.2)
g(~r, t) = ρQ+ ρS − ρbcbρB(T − Tb)
where T is the temperature at location ~r and time t, c the specific heatcapacity, k the thermal conductivity, ρ the density, B the perfusion

6.3. METHODS 79
50x
40x
30x
20x
10x
1x35 37 39 41 43 45 47
Temperature (°C)
Rel
ativ
e th
erm
oreg
ulat
ed p
erfu
sion
incr
ease
constant (basal)
skin
skinmuscle and fat
skin Laakso et al.
appliedthermoregulation model
for comparison
muscle / fat
Figure 6.2: Applied temperature-dependent local blood perfusionmodel for skin, muscle and fat. The Laakso model starts regulating atbasal temperature already (around 35°C for skin), while the appliedmodel in this study depends on absolute temperatures. The abso-lute bloodflow is 106–3392 ml/min/kg for skin, 39–585 ml/min/kg formuscle and 33–495 ml/min/kg in fat.

80 CHAPTER 6. THERMAL EVALUATIONS IN MR
rate, Q the metabolic heat generation rate and S the spatial specificabsorption rate (SAR). The index b indicates a property of blood.
The body-core-temperature was assumed to be fixed with a basalmetabolic temperature (Tb) of 37°C, as its elevation is very smallcompared to local temperature increases [21]. This was confirmed inthe thermal validation measurement within this study, where 20 minwith 3.6 W/kg wbSAR only induced a rectal core temperature riseof < 0.3 K (compared to local skin temperature increases of almost5 K), and is also in agreement with observations from hyperthermia[18], where core temperature is usually not exceeding 38°C, even forwbSAR values of up to 10 W/kg. However, small core temperaturerises may still have a non-neglectable influence on thermal dose.
A Dirichlet thermal boundary condition was defined at majorblood vessels and a convection dependent boundary condition at theinterface to external and internal air (h = 6 and 10 W/m2/K, re-spectively, TAir = 25°C), which corresponds to normal breathing andnormal clothing with little airflow [52]. Air temperatures of up to25°C are allowed by the standard without reducing the exposure level[3]. Accurate modeling of the boundary condition is challenging, aspart of the patient is lying on a soft table. However, while the bound-ary to air plays the major role for overall systemic heat dissipation,it has only marginal influence on the local internal peak tempera-tures. And, as the core temperature was fixed in this study, theseboundary conditions had no influence on systemic heat dissipation inthe simulations. To confirm these assumptions, the worst-case expo-sure scenario with Fats was simulated with very aggressive air cooling(60 W/m2/K convection coefficient, additional 600 W/m2 constantheat flux from sweating, and TAir = 18°C), corresponding to heavysweating, fast airflow and increased breathing rate [53]. While the su-perficial 10 mm tissue layers showed significant temperature decreases(skin surface average from about 35 to 31°C), the extremity hotspotsin the wrist and the inner hotspot near the pelvic bone were not influ-enced. In reality (non-apriori-fixed core temperature), the sweatingrate is adjusted to help maintaining a stable core temperature.
The applied PBE model (Eqn. 6.2) does not consider certain as-pects, such as the variation of local blood temperature, the discrete-ness of vasculature and mass transport within vessels or the varyingbody-core-temperature. A time step of 2.6 s was chosen to maintain

6.3. METHODS 81
numerical stability in the 2 mm thermal simulation grid (CFL con-dition for stability). Conformal corrections were used to correct theoverestimation of surface heat flux (staircasing effect) in the voxelledFDTD model [54]. As the thermoregulated perfusion models cre-ate non-linear temperature increases, values could not be scaled withSAR (i.e. the thermoregulated model requires an individual simula-tion for each SAR exposure level). The explicit time-domain solverwas configured with a lead-time of 30 min (without heating) to reachthe baseline steady-state temperature distribution before heating withthe maximum allowed exposure level of the first level controlled op-erating mode (OM) according to [3]. The transient heating reachedsteady-state after about 20 min for the thermoregulated and 60 minfor the constant perfusion model, which is in agreement with timescale observations from, for example, hyperthermia [55]. The modeledinstantaneous thermoregulation underestimates the transient temper-atures during the heating phase, and overestimates temperatures inthe cooling phase, whereas it has marginal influence on steady-statetemperatures and reaching time. The cooling phase was not includedin the thermal dose evaluations, as peak temperatures drop rapidlyafter switching off the RF exposure, such that thermal dose (CEM43)does not increase significantly anymore.
6.3.4 Data Evaluation
The electromagnetic exposures were normalized to the maximal limitfor the first level controlled OM, i.e. wbSAR: 4 W/kg; head SAR:3.2 W/kg; and pbSAR: 4–10 W/kg [3]. The local peak temperature(pT) was evaluated for a single voxel, and averaged in volumes of1 cm3 (125 voxels) and 10 cm3 (1250 voxels); thermal dose evalu-ations were conducted with pT, i.e., exceeding the thermal damagethreshold for one tissue-voxel was considered as the limitation. ThepTs of all landmark positions (at steady-state) were separately evalu-ated for tissues with the greatest temperature increases (muscle, skin,fat) and within four body regions (head, trunk, arms, and legs). Forthe position with the highest relevant steady-state temperature (Fats,pelvis centered), the temperature histogram was extracted for differ-ent tissues, and the transient temperature profiles were evaluated andtranslated to thermal dose (CEM43) for Fats and Duke. Based on tis-
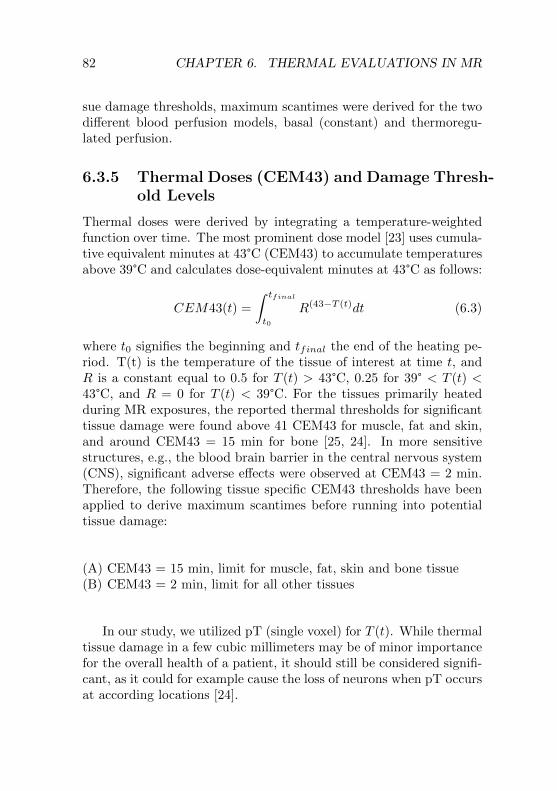
82 CHAPTER 6. THERMAL EVALUATIONS IN MR
sue damage thresholds, maximum scantimes were derived for the twodifferent blood perfusion models, basal (constant) and thermoregu-lated perfusion.
6.3.5 Thermal Doses (CEM43) and Damage Thresh-old Levels
Thermal doses were derived by integrating a temperature-weightedfunction over time. The most prominent dose model [23] uses cumula-tive equivalent minutes at 43°C (CEM43) to accumulate temperaturesabove 39°C and calculates dose-equivalent minutes at 43°C as follows:
CEM43(t) =
∫ tfinal
t0
R(43−T (t)dt (6.3)
where t0 signifies the beginning and tfinal the end of the heating pe-riod. T(t) is the temperature of the tissue of interest at time t, andR is a constant equal to 0.5 for T (t) > 43°C, 0.25 for 39° < T (t) <43°C, and R = 0 for T (t) < 39°C. For the tissues primarily heatedduring MR exposures, the reported thermal thresholds for significanttissue damage were found above 41 CEM43 for muscle, fat and skin,and around CEM43 = 15 min for bone [25, 24]. In more sensitivestructures, e.g., the blood brain barrier in the central nervous system(CNS), significant adverse effects were observed at CEM43 = 2 min.Therefore, the following tissue specific CEM43 thresholds have beenapplied to derive maximum scantimes before running into potentialtissue damage:
(A) CEM43 = 15 min, limit for muscle, fat, skin and bone tissue(B) CEM43 = 2 min, limit for all other tissues
In our study, we utilized pT (single voxel) for T (t). While thermaltissue damage in a few cubic millimeters may be of minor importancefor the overall health of a patient, it should still be considered signifi-cant, as it could for example cause the loss of neurons when pT occursat according locations [24].

6.3. METHODS 83
6.3.6 Experimental Validation
In a first step, the electromagnetic simulations were validated. Thesimulated B1+ field map of Duke (head imaging position) was com-pared with an MR scanner B1+ measurement of the actual person theDuke model is based on. The B1+ flip-angle measurement scan wasperformed in a Philips Achieva 3T, resulting in the absolute B1+ dis-tribution in the head [6]. The simulation was conducted with a genericbirdcage with dimensions similar to that of the Philips scanner (16-rung birdcage, 400 mm length). Field levels of the simulation werematched to the experiment by applying the same B1 field around thehead as measured with an H-field probe (H3DV7, SPEAG), calibratedfor the applied RF sequence.
In a second step, thermal validation measurements were performedwithin the 64 MHz body coil of the MITS1.5 system (ZMT, Zurich,Switzerland), providing excellent control and ease of access. The phys-ical birdcage geometry was identical to that of the generic model usedfor all simulations. The upper sternum of another volunteer (32y,male, healthy, 1.88 m) was positioned at the isocenter as the simu-lations identified anatomically well-defined hotspot positions at theshoulder in this imaging position. A circularly polarized RF field wasapplied, yielding B1+ values of 3.0 µT and 6.0 µT (assessed with H-field probes, H3DV7, SPEAG), exposing the volunteer with 0.9 W/kgand 3.6 W/kg wbSAR (two consecutive experiments with 60 min re-covery time in between). The exposure level was derived from thebirdcage power budget and verified by simulations given that Dukeand the volunteer have similar anatomical dimensions: height 1.79 vs.1.88 m; bmi 23.1 vs. 23.7 kg/m2; shoulder length 50 vs. 48 cm; age34 vs. 32 years. Three highly accurate high-resistance temperatureprobes (T1V3Lab, SPEAG) were placed at estimated temperaturehotspot regions on both shoulders (T1 and T2; see Results section)and in the rectum (T3). Placement uncertainty was about 20 mm.T1 (left shoulder) was thermally isolated with medical compresses,reducing the temperature gradient near the body surface.
The same scenario was simulated with Duke. The convection co-efficients on the ambient-air to skin boundary around T1 and T2 wereadjusted slightly in order to yield similar initial skin temperatures asin the measurement. Values for T1 (isolated) and T2 (non-isolated)

84 CHAPTER 6. THERMAL EVALUATIONS IN MR
convection coefficients were 10 and 15 W/m2/K, respectively, com-pared to 6 W/ m2/K in other simulations, and the background airtemperature was 24°C. The thermoregulated perfusion model was ap-plied. For comparison, the variations of the temperature profiles of400 surface skin voxels (10 × 20 × 2, two surface layers) around thehotspot regions were evaluated. This corresponds to a skin area of20 mm × 40 mm × 4 mm (about 3.5 g of skin, 2 mm voxel size),accounting for the probe placement uncertainty.
6.4 Results
Figure 6.3 shows the local peak temperatures for Duke and Fats indifferent landmark positions, normalized to first level controlled OM.The highest relevant temperatures are found in the pelvis imagingposition (Z = 80 cm), with values up to 42.8°C for a non-impairedtemperature-dependent perfusion model and 60°C for dysfunctionalthermoregulation. In leg imaging positions (Z = 104–128 cm), veryhigh B1+ fields are theoretically allowed by the standard (> 7 µT ) be-fore reaching the partial-body SAR limit, yielding high temperatures.However, none of the MR manufacturers is currently using such highfields in this landmark region, which does not imply that they may notconsider this in future systems. The pelvis imaging position is there-fore considered the relevant worst-case heating scenario. The uppersternum imaging position was chosen for validation measurements.Ella and Duke show comparable psSAR10g values, but Ella has lowerpeak temperatures, as the psSAR10g in Ella is located in tissues withhigher perfusion. Billie generally has lower values for psSAR10g andtemperature (results of Ella and Billie are not depicted).
The short birdcage (Figure 6.3 ) shows small deviations in SARand temperature (latter not depicted). Highly exposed regions havevery similar absorption patterns (Figure 6.1). The psSAR10g valuesdiffer by less than 20% in Fats, peak Temperatures by less than 1 K(constant perfusion) and 0.4 K (thermoregulated). Due to the morelocalized exposure of the short birdcage, the partial-body SAR limitis reached earlier, such that 4 W/kg wbSAR can only be applied incentered torso positions.
Thermal hotspots occur exclusively in muscle, fat, and skin. The

6.4. RESULTS 85
18 30 42 56 68 80 92 104 116 128 18 30 42 56 68 80 92 104 116 128
18 30 42 56 68 80 92 104 116 128 18 30 42 56 68 80 92 104 116 128
18 30 42 56 68 80 92 104 116 128 18 30 42 56 68 80 92 104 116 128
10090807060504030
10090807060504030
420
420
61595755535149474543413937
61595755535149474543413937
Reference positionin z-axis (cm)
UPP
ERST
ERN
UM
PELV
IS
FATSDUKEPe
ak te
mpe
ratu
re (°
C)
Peak
tem
pera
ture
(°C
)w
bSA
R a
nd p
sSA
R10
g (W
/kg)
armstrunkheadlegs
muscleskin fat
Constant perfusion Constant perfusion
SAR SAR
Thermoregulated perfusion Thermoregulated perfusion
psSAR10gwbSAR
400 mm birdcage comparison
wbSARheadSAR
partial-body-SAR
47
45
43
41
39
37
47
45
43
41
39
37
armstrunkheadlegs
Regions Tissuesmuscleskin fat
low
er h
ead
uppe
r ste
rnum
hear
t
low
er s
tern
um
stom
ach
pelv
is
groi
n
uppe
r thi
ghs
thig
hs
knee
Figure 6.3: psSAR10g, wbSAR, and steady-state peak temperatures(pT) as a function of landmark position for Duke and Fats and fordifferent perfusion models. All exposures are normalized to first levelcontrolled OM (the three different SAR limiting regimes are indi-cated). SAR values of the shorter 400 mm birdcage are shown forFats for comparison. Evaluated tissue temperatures are plotted forfour body regions and three tissues. Ella and Billie generally showlower temperature values (not depicted).

86 CHAPTER 6. THERMAL EVALUATIONS IN MR
temperature distribution at steady-state across different tissues andregions of interest for the worst-case position in Fats (pelvis imagingposition) is shown in Figure 6.4 . Although bones have lower SARvalues, they show high temperature increases because of their low per-fusion and proximity to strongly heated tissues. The CNS (includingthe spinal cord) and all other tissues have significantly lower peaktemperatures.
Figure 6.5a illustrates the heating process in the time-domainand the pT of different tissues for the pelvis imaging position ofFats. These transient peak temperatures are accumulated (CEM43)for heating with different wbSAR levels, and the wbSAR is plot-ted against the scantime of reaching the tissue damage thresholdlimits (Figure 6.5bc). When applying tissue specific thresholds forFats (Figure 6.5b), muscle tissue first reaches its damage threshold(CEM43 = 15 min) after 25 min continuous exposure with 4 W/kgwbSAR in the thermoregulated case (indicated with red circles), indi-cating that muscle would be the most vulnerable tissue according tothis approach. At constant perfusion, the threshold limit is reachedfirst by skin tissues, after 4 min. In Duke (Figure 6.5c), the thresholdvalues are reached after 55 min for the thermoregulated model (af-ter 10 min in the non-regulated case). Values for the other modelsare summarized in Table 6.1. Curves of the thermoregulated modelwere interpolated, as their non-linear temperature increases cannot bescaled with wbSAR.
The B1+ field distribution derived from the simulation shows goodqualitative correspondence to the relative MR flip-angle measurements(Figure 6.6). A statistical comparison, however, is challenging be-cause of the errors due to the coarse measurement grid and varioussmall-scale anatomical structures. In the visualized extraction lines,the B1+ field deviation is less than the combined expanded (k = 2)uncertainty of 2 dB (∼24%, field amplitude).
The thermal validation measurements and the corresponding sim-ulations are within the combined expanded (k = 2) uncertainty of 3.2dB (∼22%), thus supporting the assumption of high temperature in-duced perfusion changes, especially when comparing the performanceof the thermoregulated model against the constant model (Figure 6.7).The thermoregulation model according to Laakso would underesti-mate the peak temperatures in our measurement, as the thermoreg-

6.5. NUMERICAL UNCERTAINTY 87
ulation in skin would start at the basal temperature already. Thetemperature profiles of the 400 skin voxels were characterized by theirmean value, and 65% confidence interval (SD, k=1). The deviationof T2 in Figure 6.7b exceeded one SD, which may result from differ-ences in (a) positioning and (b) posture of the volunteer, (c) baselineperfusion in the low-dose experiment, (d) boundary conditions, and(e) anatomical structure. Figure 6.7c shows the delayed thermoreg-ulatory perfusion change, where the measured temperature suddenlystops increasing after 10 min (it even slightly decreases). The perfu-sion in the first 10 min is overestimated in the simulation because ofthe implemented immediate thermoregulation model.
PelvisFirst level OM Realistic OM1 Normal OM
(4 W/kg) (3 W/kg) (2 W/kg)
Model Regulated Constant psSAR10g Regulated Regulated ConstantFats-120kg 25 min 4 min 81 W/kg 56 min 140 min 9 minDuke-76kg 55 min 10 min 62 W/kg 170 min 402 min 26 minElla-59kg 106 min 11 min 65 W/kg 233 min > 600 min 28 minBillie-35kg 290 min 16 min 46 W/kg 560 min > 600 min 62 min
Table 6.1: Allowed Scantimes and Corresponding psSAR10g Valuesfor Reaching Tissue Specific CEM43 Thresholds
6.5 Numerical Uncertainty
The numerical and measurement uncertainty analysis (Table 6.2) wasbased on the concept of NIST TN1297 [41]. The thermoregulated tem-perature increase model and maximum scantime derivation is highlynon-linear. The corresponding uncertainty assessment was performedonly for the worst-case positioning (pelvis) with the Fats model, andcannot be used for other positions, models, or exposure levels. Theinfluence on our obtained results, i.e., peak temperature and derivedmaximum scantime, was determined based on the modeling param-eter uncertainties from (a) the underlying electromagnetic simula-tion and (b) the thermal simulation (Table 6.2). The combined root
13 W/kg wbSAR is assumed to be a realistic maximum exposure in first levelcontrolled OM (averaged over 1 hour), when considering the manufacturer’s safetymargin and frequent interruptions between sequences.

88 CHAPTER 6. THERMAL EVALUATIONS IN MR
58
53
48
43
38
33
Basal (constant) perfusion Thermoregulated perfusion
pT (voxel)pT1cm3
pT10cm3
Tem
pera
ture
at
stea
dy s
tate
for
first
leve
l con
trol
led
OM
(°C
)
PELVIS IMAGINGPOSITION
107
106
105
104
103
102
80 l
8 l
800 ml
80 ml
8 ml
0.8 ml
Tissue within1°C
Voxel within1°C
All
Mus
cle
Fat
Ski
nB
one
CN
SA
ll ot
her
All
Mus
cle
Fat
Ski
nB
one
CN
S All
othe
rA
ll ba
selin
e te
mpe
ratu
res
FATS
Figure 6.4: Histographic view of the temperature distribution acrosshighly exposed and other tissues of interest for Fats in the pelvis land-mark position, wbSAR=4 W/kg (first level controlled OM) and forconstant as well as thermoregulated perfusion. Voxel peak temper-ature (pT), pT1cm3 and pT10cm3 are indicated. CNS includes thespinal cord. The baseline temperatures are shown as well (thermalequilibrium before heating onset).

6.5. NUMERICAL UNCERTAINTY 89
Exposure time (min)
Tran
sien
t pT
(°C
)
PELVIS IMAGINGPOSITION
14
12
10
8
6
4
2
0
App
lied
wbS
AR
(W/k
g)
wbSAR = 4 W/kg
FATS
FATS
a b
d
0 10 20 30 40 50 60 0 10 20 30 40 50 60
c
MuscleSkinFat
BoneCNS
All otherInterpolation points for the non-linear thermoregulation model
FIRST LEVEL CONTROLLED OM
NORMAL OM
LEGEND FOR ALL FIGURESThermoregulated / Constant
Max. scantime (min)
CNSO
O
O
O
CNS CNS
CNSO
O
O
O
Tissue specific CEM43limits
Tissue specific CEM43limits
61595755535149474543413937
14
12
10
8
6
4
2
0
App
lied
wbS
AR
(W/k
g)
DUKE
0 10 20 30 40 50 60
Max. scantime (min)
in wrist (HS1)
at pelvic bone (HS2)
at pelvic bone (HS3)
15 min:muscle, fat, skin, bone
15 min:muscle, fat, skin, bone
2 min: all other
2 min: all other
60
55
50
45
40
35
60
55
50
45
40
35
HS2
Constant perfusion
Constant perfusion
Thermoregulatedperfusion
HS3
HS1
FATS
FATS
FATS
Temperature (°C)
Temperature (°C)
42.5
41
39.5
38
36.5
35
Figure 6.5: a: Transient peak temperature during MR exposure ofFats (all figures are in pelvis imaging position). b: Scan times for Fatsto reach the tissue specific CEM43 limits in the context of applied wb-SAR exposure levels (at 4 W/kg: muscle tissue first reaches its limitin the thermoregulated case, skin for the constant perfusion; indicatedwith red circles). c: Corresponding scantimes for Duke. d: tempera-ture distribution in coronal slices showing the different hotspot (HS)locations in Fats (different scales for constant and thermoregulatedperfusion).
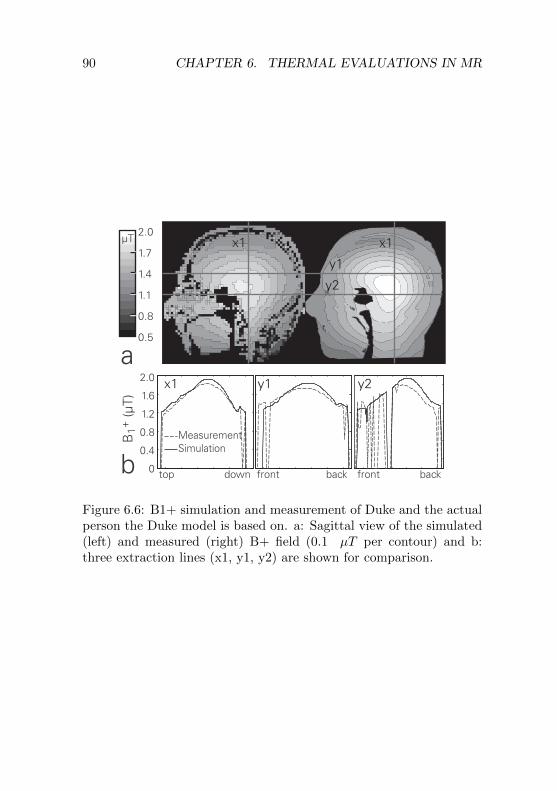
90 CHAPTER 6. THERMAL EVALUATIONS IN MR
2.0
1.7
1.4
1.1
0.8
0.5
2.0
1.6
1.2
0.8
0.4
0 top down front back front back
µT
y1
y1
MeasurementSimulation
x1
x1x1
y2
y2
B1+
(µT)
a
b
Figure 6.6: B1+ simulation and measurement of Duke and the actualperson the Duke model is based on. a: Sagittal view of the simulated(left) and measured (right) B+ field (0.1 µT per contour) and b:three extraction lines (x1, y1, y2) are shown for comparison.

6.5. NUMERICAL UNCERTAINTY 91
0.9 W/kg, t = 20 min 3.6 W/kg, t = 20 min
isolatedT2 T1
Tem
pera
ture
(°C
)
0.9 W/kg wbSAR
41.0
39.5
38.0
36.5
35.0
33.5
42
41
40
39
38
37
36
35
34
33
Time (min)
3.6 W/kg wbSAR
Measurement Simulation
T1 simulated with:constant (no regulation)Laakso (reg. above 35°C)this study (reg. above 37°C)
T1 (isolated)T2 (non-isolated)T3 (core temp.)
65% CI(SD, k=1)
0 10 20 30 40 50
0 10 20 30 40 50
38
37
36
35
34
33
Time (min)
Temperature (°C)a
b c
T1T2
Figure 6.7: a: Numerical prediction of hotspot locations in Duke,b: low- and c: high-dose experiment showing skin surface tempera-ture measurements near the predicted temperature hotspots on theshoulder (T1 thermally isolated, T2 non-isolated) and simulation ofthe same scenario using the thermoregulation model. The simulationcurves are the mean of 400 surface skin voxels and their 65% confi-dence interval (CI). This estimates the probe placement uncertainty(20 mm) at the high temperature gradient around the hotspot. Coretemperature remained stable during the experiments. Thermoreg-ulation starts above 37°C, except for the Laakso model. Constantperfusion and the Laakso thermoregulation model show considerabledeviation to our measurement results in skin.

92 CHAPTER 6. THERMAL EVALUATIONS IN MR
sum squared uncertainty (RSS, single standard deviations, k = 1)is estimated to be 0.51 dB (∼12%) for the local SAR enhancement(psSAR10g normalized to wbSAR) and 1.28 dB (∼30%) for peak tem-perature increase with constant perfusion (both in agreement with[39], i.e. 11% and 31%). The uncertainty for peak temperature in-crease in the thermoregulated case is lower (0.9 dB, ∼21%), as themodeled perfusion increase suppresses the variation (non-linear sup-pression). As the CEM43 dose accumulation increases by factor 4with each additional degree Celsius above 39°C (factor 2 above 43°C,Equation 6.3), uncertainty for thermal dose is non-linear for both per-fusion models. The derived maximum scantimes before reaching thedose limit have estimated uncertainty values of 1.2 dB (∼27%, con-stant perfusion) and 2.1dB (∼50%, thermoregulated). The measure-ment uncertainties for B1+ and temperature are 0.9 dB and 1.4 dB,respectively (see Table 6.2cd).
6.6 Discussion & Conclusion
Temperature-regulated perfusion significantly lowers the maximumtemperature increase compared to static perfusion values. At thefirst level controlled OM, it is about a factor 3–4 (from 8–23 K downto 3–6 K) depending on the model and position (Figure 6.3). Thethermoregulated perfusion is therefore the most influential parameterfor local temperature increase and related damage for the given ex-posure scenarios. Other factors, such as sweating, airflow, or roomtemperature, result in altered skin temperatures but have little in-fluence on local internal peak temperatures. Body core temperatureis considered fixed at 37°C, which was confirmed by the validationmeasurement and experience in hyperthermia, and thus also has a mi-nor influence on local temperatures. The peak temperature increasesin hyperthermia are similar for comparable SAR levels, but a directcomparison is difficult due to the intrinsic difference of exposure, i.e.,focused absorption versus B1+ homogeneity optimization.
In summary, the maximum scantimes of Table 6.1 (partially de-
1Relative local SAR uncertainty, as exposure is normalized to wbSAR.2Highly non-linear model. Values only valid for this specific worst-case (Fats,
pelvis position, first level OM)

6.6. DISCUSSION & CONCLUSION 93
Parameter Range ui
(a) EM Simulation psSAR10g per wbSAR1
Convergence Sim. length: +100% 0.03 dBModel discretization Voxel size: 0.5, 3 mm 0.26 dBDielectric parameter σ : ± 10% (all tissues) 0.05 dBDielectric parameter ε : ± 10% (all tissues) 0.17 dBDielectric contrast σ : ± 10% (single tissue) 0.09 dBDielectric contrast ε : ± 10% (single tissue) 0.08 dBDensity contrast ρ : ± 10% (single tissue) 0.26 dBSegmentation errors Quality of models [39] 0.28 dB
RSS: SAR uncertainty 0.51 dB[–11%;+12%]
(b) Thermal Simulation pT, Thermoreg. pT, Constant
Local SAR uncertainty from (a) 0.40 dB2 0.40 dB
Convergence Sin. length / timestep 0.04 dB2 0.05 dB
Model discretization Voxel size: 0.5, 3 mm 0.19 dB2 0.26 dB
Thermal parameter c : ± 10% (all tissues) 0.00 dB2 0.00 dB
Thermal parameter k : ± 10% (all tissues) 0.05 dB2 0.26 dB
Thermal parameter Q : ± 10% (single tissue) 0.08 dB2 0.02 dB
Blood heat capacity ρb · cb : ± 10% 0.16 dB2 0.16 dB
Thermal boundary cond. h : ± 50% 0.12 dB2 0.11 dB
Basal (constant) perf. B0 : ± 50% 0.26 dB2 1.14 dB
Perf. increase Lb : ± 50% 0.70 dB2 n.a.
RSS: Peak temperature increase uncertainty 0.90 dB2 1.28 dBactual estimated peak temperature 42.8°C 60°Cuncertainty interval in peak temperature [41.7°; 44.1°] [54.1°; 67.9°]
Corresponding max. scan time uncertainty 2.1 dB2 1.2 dB2
actual estimated value 25 min 4 minuncertainty interval [16; 41 min] [3; 5.3 min]
(c) B1+ validation measurementAssessment of relative B1+ map [28] 0.6 dBB-field probe uncertainty for B1+ measurement 0.6 dBAge induced changes (6 years between model
segmentation and B1+ mapping, from [39]) 0.3 dBHead positioning in scanner 0.1 dB RSS (a) + (c)
RSS: B1+ measurement uncertainty 0.9 dB 1.0 dB (k=1)uncertainty interval in peak temperature [–18; +22%] 2.0 dB (k=2)
(d) Temperature increase validation measurement(assessment for T1 at high dose experiment)Temperature probe uncertainty < 0.1 dBIncidence B1 field assessment 0.6 dBProbe placement (20 mm) 1.0 dBProbe thermal contact 0.5 dBVolunteer positioning (100mm) 0.3 dBDifferences between Duke and the actual volunteer 0.3 dBThermal equilibration 0.5 dB
RSS: B1+ measurement uncertainty 1.4 dB RSS (b) + (d)actual estimated temperature 39.5°C 1.6 dB (k=1)uncertainty interval [38.8°; 40.5°] 3.2 dB (k=2)
Table 6.2: Standard combined uncertainties for (a,b) the numericalevaluations (Fats in pelvis position), (c) the B1+ assessment, and (d)thermal measurements (Duke/volunteer in upper sternum position).Stated uncertainty values are standard deviations (k = 1) in the as-sumed log-normal probability distribution. Since they are uncorre-lated, they can be combined by root-sum-square (RSS) procedures.

94 CHAPTER 6. THERMAL EVALUATIONS IN MR
rived from Figure 6.5) have been estimated in the identified worst-case position (pelvis imaging) for the investigated models. The Fatsmodel reaches the damage threshold limits first in all configurations.At first glance, the history of safe use of whole-body MR coils seemsto contradict the presented thermal dose estimations as the currentsafety guidelines accept exposures in the first level controlled OM for60 minutes [3]. However, actual clinical use shows that:
1. The IEC standard is very rarely fully exploited:
(a) exposure is frequently interrupted (different sequences), lead-ing to lower average SAR
(b) the vast majority of scans is believed to be shorter than30min
(c) the manufacturers’ safety margins lead to an effective wb-SAR of presumably about 2.7–3.7 W/kg instead of theallowed 4 W/kg.
2. As most patients are awake during MR scans, they may pro-vide direct feedback on excessive heat sensations to the opera-tor. However, some tissue may have limited heat sensation (e.g.muscle [19]).
3. The actual thermal tissue damage thresholds in human mightactually be higher than the ones used for this study.
4. The peak temperature is reached in only a few cubic millime-ters of tissue (pT). The average temperature of the hottest 1 g oftissue is 0.5–1.0°C lower in the thermoregulated case (pT1cm3,Fig. 4), which would corresponds to factor 2?4 longer accept-able scantimes. It remains unclear whether exceeding damagethresholds in less than 1g of tissue could be acceptable in sometissues.
Therefore, the results of this study may well correspond with thehistory of safe use. All investigated human models accept roughly one

6.6. DISCUSSION & CONCLUSION 95
hour exposure to a realistic average wbSAR of 3 W/kg (Table 6.1). Onthe other hand, the study also demonstrates that the guideline limitfor local tissue temperatures (40°C, [3]) is exceeded in all positionsfor Fats and Duke in the first level controlled OM. Therefore, thecurrent safety guidelines should be revised. A new concept couldbe based on the thermal dose model (CEM43) in conjunction withtissue-specific thresholds. Such an implementation may be challengingdue to the complex thermal parameter space. Especially the highsensitivity of CEM43 below 43°C causes systematic problems, where adifference of only 1°C leads to factor of 4 change in allowed scantimes.Nevertheless, we believe that having a better surrogate for actualtissue damage with larger uncertainty may become more useful in thefuture than wbSAR and local SAR limitations which have very limitedcorrelation to tissue temperature and tissue damage. More researchon local thermoregulatory and tissue damage processes is therefore ofhigh importance. The investigated dose model also allows consideringtransient temperatures and tissue sensitivity.
The presented results indicate that the greatest health risk fromMR RF exposure can arise from a combination of (a) high exposurelevels (i.e., first level controlled OM), (b) long scantimes, (c) anatom-ically large and obese patients, and (d) patients with disabled or par-tially dysfunctional perfusion abilities (e.g. the elderly, diabetics) orheat sensation (e.g., paraplegics, [56]). As patients with impairedor dysfunctional thermoregulation abilities might require special con-siderations, it is important to derive sound tissue damage thresholdsand better thermoregulation modeling capabilities, based on accurateperfusion rates for the entire patient population.
In clinical practice, a different type of tissue damage mechanism iscurrently observed: High, very locally induced electric fields can leadto immediate burns. In many of these cases, the limbs or other bodyparts of the patients were in direct contact with RF coils or skin-to-skin contact points and loops were suspected to be responsible forthese injuries [57]. Other investigations are needed to understandhow to assess these burns due to high induced electric fields, wherethermoregulation is absent due to their acute nature.

96 CHAPTER 6. THERMAL EVALUATIONS IN MR
6.7 Acknowledgements
This study was supported by the EUREKA (E!4144) and CTI (9193.1)project MRI+.

Chapter 7
Outlook
7.1 Future Concepts for MRI Safety Stan-dards
Regarding RF exposures, current MRI safety standards [3] are basedmainly on whole-body SAR, head SAR and partial-body SAR. Thelocal SAR (psSAR10g) is limited only for local transmit coils, but notfor body coils. Limitations only rudimentarily include exposure time(via overall energy limit), and do not consider any transient heatingprocesses. These guidelines aim to limit whole-body thermal stressand local temperatures to acceptable levels. The approach is op-portunistic, as averaged SAR can be determined with high accuracy.However, recent studies have shown that the intended upper-boundtemperatures may be exceeded, even when complying with the sug-gested operating modes [34, 45].
By analogy driving speed is currently limited by engine powerrather than by speedometer. But speed is the source of danger indriving and engine power is a poor surrogate for speed as a meansto limit danger. In initial acceleration, a larger motor may even bedesirable, given that the speed limit will not be exceeded. Likewise,a surrogate for adverse health effects should be as close as possibleto the actual damage mechanism – even when it comes with higheruncertainty intervals. Future safety concepts should thus be based
97

98 CHAPTER 7. OUTLOOK
on thermal dose (e.g., CEM43) in conjunction with damage thresholdlimits, which is the most accurate proxy for tissue damage. This basicconcept, which is elaborated in Chapter 6, would allow higher initialRF exposures and potentially shorten scan times for most patients,while simultaneously improving safety. The concept is visualized inFigure 7.1.
wbSAR /image acquisition
performance
Current safety regime
Safety concept based on thermal dose
currently, power is limited
time (min)0 20
peaktemperature
thermal dose limitsmay be exceeded for prolonged scans
wbSAR /image acquisition
performance
relaxed power limitation
time (min)0 15
peaktemperature
thermal dose management
Figure 7.1: Schematic of the current safety regime (wbSAR limited),and a concept based on thermal dose management, which may allowhigher performance.

7.2. COMPLIANCE WITH SAFETY STANDARD 99
7.2 Compliance with Thermal (Dose) BasedSafety Standards.
In the current safety standard [3] as described in Chapter 2.5, coilpower must be limited so as not to exceed certain (1) wbSAR, (2)headSAR, and (3) partial-body (pb)SAR levels. The wbSAR can beassessed straightforwardly via the overall power budget of the coil, di-vided by the patient mass. For headSAR and pbSAR, manufacturersmust implement dedicated algorithms that estimate the respective ex-posures from patient anatomy (height, weight) and imaging position.
Additional (or alternative) steps are required to show compli-ance with a thermal-dose-based standard. Recent studies refinedthe thermal simulation model [46], included human thermoregulation[34], and investigated specifically vulnerable groups such as pregnantwomen [42, 58, 59] or patients with impaired thermoregulation [45].However, there is great uncertainty associated with temperature in-crease and thermoregulation in humans. Additional studies in thesefields are needed for a broad acceptance of a thermal-dose-based stan-dard, by further reducing uncertainties and including inter-subjectvariations.
Practical implementation of a thermal-dose standard would requiremanagement of the exposure levels throughout the scan sequences andwould also have to ensure that, e.g., the same patient is not scannedtwice without taking thermal dose history into account.
Because of these theoretical and practical implications, many MRIsafety experts do not yet feel comfortable with a transition from SAR-based limitation regimes to thermal-dose-based standards.
7.2.1 Pre-Scan Evaluation Methods
When evaluating the planned scan sequences for their exposure safety,the estimation of a transient “virtual peak temperature” (VPT) maylead to an appropriate thermal dose management. The VPT of thepatient is estimated from the planned sequences with their correspond-ing SAR levels. Thermal dose as CEM43 is accumulated for the wholeprocedure, and the scan is stopped after a defined threshold limit isreached (Figure 7.2). The corresponding functions to estimate the

100 CHAPTER 7. OUTLOOK
peak temperatures are determined by means of anatomical models,with the option to link the patient to a anatomically similar virtualmodel.
wbSAR
time (min)0 20
virtual pTthermal dose
thresholdreached
Figure 7.2: Schematic of the VPT estimation during a planned MRIscan.
7.2.2 On-The-Fly Estimations
To overcome the differences between the patient and the availableanatomical models, one could perform simulations with the currentpatient’s anatomy. By running a pre-scan, sufficient information isgathered for the segmentation, and the SAR simulations are per-formed together with the scan onset. This scenario is unlikely to beapplied in near future, as accurate segmentation of a patient currentlytakes several months. EM and thermal simulations, on the other side,could be performed within a few minutes in the near future.
7.2.3 On-The-Fly Monitoring, MRI Thermometry
As an alternative to SAR and temperature simulations, online mon-itoring of the thermal dose could be achieved with MRI thermome-try, which utilizes the proton resonance frequency shift (PRFS) [29]to assess absolute tissue temperatures directly via the scanner. The

7.3. CHALLENGES IN PARALLEL TRANSMIT MRI 101
quality and accuracy of MRI thermometry is increasing continuously.Uncertainties in the range of 1°C would already allow a beneficialmonitoring of hotspot areas. A monitoring thermometry scan couldbe performed, e.g., every 6 min, and identified hotspot areas could bemonitored even more frequently. There are still issues to resolve, asMRI thermometry has limited functionality in some tissues (e.g., fat),is susceptible to motion artifacts, and the hotspot may actually occuroutside the current field of view (FOV) of the scanner.
7.3 Challenges in Parallel Transmit MRI
Emerging scanner technologies – such as parallel transmit (pTx) –increase the need for dedicated safety assessment in the new envi-ronment [14, 44, 60]. The current safety regimes in MRI are widelybased on quadrature driven coils, with a remarkable history of safeuse during the past 30 years. The application of the RF energy withfixed amplitudes and phase shifts, or only limited deviations as in RFshimming, leads to very defined absorption distributions within thepatient’s body, which always scales with the wbSAR exposure. Emerg-ing scanner technology will be based on parallel transmit (pTx) coildesigns with many degrees of freedom, as the amplitude and phase ofeach rung (in a birdcage) can be adjusted individually. pTx allowsthe B1+ field to be focused on a desired location within the body, anda wide range of novel applications are believed to be in development.In addition to static multiport RF shimming, where the same pulseshape — with different amplitudes and phases — is delivered to allports, dynamic RF shimming excites each port with a different pulseshape. This allows an even more customized and time-varying B1+distribution, while the parameter space for excitation schemes gets ex-uberant. This makes safety assessment challenging, as not all of thedivergent excitations can be covered in the evaluations. A worst-caseevaluation for the entire parameter space would presumably result inoverly conservative restrictions. However, the effect of constructiveinterference of the parallel transmitting ports should not be underes-timated [14].

102 CHAPTER 7. OUTLOOK
7.4 Challenges in High Field MRI
The evolving field strengths of the static magnet (currently 9 T andbeyond) lead to higher RF frequencies (ca. 42 MHz per Tesla; upto 500 MHz in high-field MRI). At the same time, dynamic tech-niques, such as RF shimming and pTx, are more benign, by mini-mizing B1+ non-uniformity caused by the smaller wavelengths andsubsequent phase delays inside the body. Besides the challenges insafety assessment of pTx systems (Chapter 7.3), the higher RF fre-quency shows less uniform exposures and has the potential to formmore localized hotspots. The resulting SAR distributions must beassessed for undesired hotspots to be prevented [61].

Part II
Exposure Assessment inHuman for Health Risk
Research
103


Chapter 8
Background in HumanRF Provocation Studies
8.1 Motivation and Objectives
There is increasing evidence that pulse-modulated radio frequencyelectromagnetic fields (RF-EMF), such as those emitted by mobilephones, can alter brain physiology [62, 63, 64, 65, 66, 67, 68, 69]. Thereported effects include changes in EEG, regional cerebral blood flow(rCBF), sleep architecture, brain glucose metabolism, sleep-dependentperformance improvement, and cognitive functions. However, conclu-sions about possible adverse effects on human health are premature,as the underlying mechanisms are as yet unknown. Additional stud-ies are needed to define the critical field parameters, e.g., amplitudemodulation or field distribution, to eventually identify a physiologicalinteraction mechanism.
Besides epidemiological, in vitro, and in vivo studies, potentialEMF effects need to be assessed in human provocation studies. Al-though this means that guideline limits generally cannot be exceeded,there is no alternative for assessing immediate effects on humans.Study endpoints range from head imaging modalities like positronemission tomography (PET) [69] and near infrared imaging (NIRI)[70], via sleep and wake electroencephalography (EEG), to cognitive
105

106 CHAPTER 8. BACKGROUND HUMAN RF EXPOSURE
tasks, subjective well-being [71], and hormone production (e.g. mela-tonin) [72].
Objectives with respect to this thesis are to provide high-qualityEMF exposure equipment and to investigate effects, e.g., RF relatednoises, that may compromise the blinded protocol or the non-thermalnature of the findings.
8.2 Mobile Phone Exposure
Nowadays, exposure to electromagnetic fields in the MHz region isomnipresent. Exposures to broadcasting services such as AM radio(around 1 MHz), FM radio (100 MHz), and television (50–950 MHz)have been around for decades. Mobile phone and data communica-tion has grown exponentially in the last 20 years, with anticipatedsaturation within the next few years, as the number of mobile phonesubscribers is approaching the size of the entire human population.The older generation GSM/DCS/2G phones (900 and 1800 MHz) arebeing replaced with UMTS/3G (1950 MHz), but phones retain back-wards compatibility so far. For short-distance communication, thecordless landline phone (DECT, 1880 MHz), WLAN, and Bluetooth(2400 MHz) are predominant. Emerging technologies such as LTEoperate multiple bands between 800 and 2600 MHz.
Since EMF power levels decrease dramatically with distance (1/r2),the downlink communication — from the base station to the mobiledevice — generally results in very low exposure levels, with smallvariations during daytime. The opposite is the case for the uplinkconnection, where the mobile device emits in close proximity, butmainly when the services are actually being used. Figure 8.1 givesa qualitative overview on typical exposure levels and times and visu-alizes the resulting total absorbed energy (dose). Due to the poorlyimplemented power control, the highest exposure levels today origi-nate from GSM/2G mobile phones, exceeding the typical mean outputpower of 3G/UMTS by about a factor of 100 [73]. When consideringthe dose, the DECT base station emits high levels as well, as the stan-dard DECT protocol has no power control implemented, and the basestation is located relatively nearby. The exposure level in MRI scan-ners can be hundred times higher than with GSM phones. Exposure

8.3. NON-THERMAL EFFECTS 107
time, however, is very small when averaged over prolonged periods.Ty
pica
l exp
osur
e le
vel
psSA
R10
g (W
/kg)
Downlink(Basestation)
Radio / TVBroadcasting
GSM/UMTS
WLAN
DECT
GSM
WLANBluetooth
RFID
DECT
UMTS/3G
Uplink(Handheld)
Exposure time at typical level (time/day)
20
2
0.2
0.02
0.002
0.0002 1.5min 15min 2.4h 24h
DO
SE
(MRI)
Figure 8.1: Qualitative illustration of exposure levels typically reachedas a function of the corresponding exposure times. Exposure dose(total absorbed energy) is the product of exposure level and time.Dose is generally not limited. MRI is inserted for comparison; a typicalscan lasts about 20 min.
Exposure of the general public is limited in terms of exposurelevel, but not in terms of exposure time and dose [1]. The ICNIRPguidelines, which are adopted as written by most countries, define anupper limit for the general public of 2 W/kg psSAR10g and 0.08 W/kgwbSAR (for explanation of the averaging algorithms see Chapter 2.4).
8.3 Non-Thermal Effects
Exposures in compliance with the ICNIRP guideline limit for the gen-eral public, i.e., < 2 W/kg psSAR10g, result in temperature increasesbelow 0.3°C in the brain and 0.6°C in the whole head [74]. Possi-ble effects of, e.g., mobile phone radiation are therefore referred to as“non-thermal”, i.e., the actual temperature elevation is believed not

108 CHAPTER 8. BACKGROUND HUMAN RF EXPOSURE
to be perceived and not to measurably influence cognitive functions.In contrast to MRI exposure, thermoregulation is not initiated anddoes not have any influence on the small temperature increase [21].
Nevertheless, the thermoplastic expansion of pulsed EMF fieldsmay still be non-neglectable. For very high pulses, the well-establishedeffect of microwave hearing [75] leads to a conscious perception ofan acoustic signal, with an involved temperature ripple of less than10−6 K. Potential perception of any kind of microwave hearing wasusually suppressed in human studies by introducing an environmentalbackground noise. Whether thermoplastic expansion could accountfor other non-acoustic perceptions is not known.
However, there is an increasingly large body of evidence for non-thermal effects of modulated EMF on the central nervous system(CNS) in humans, but still little is known about the underlying mech-anism or whether these effects may cause adverse health consequences.The following sections contain a selection of results from recent sleepstudies. The exposure system described in Chapter 9 has been de-signed to further investigate CNS responses in hypotheses-driven re-search. In most studies, electroencephalography (EEG) or positronemission tomography (PET) was used to detect effects on the CNS.
8.3.1 Effect on EEG Spectral Power
Borbely et al. [62] exposed 24 young males to an intermittent radia-tion schedule (900 MHz, GSM-modulation, 1 W/kg psSAR10g, 15-minON / 15-min OFF) for an entire night’s sleep episode. Besides somesmall effects on the amount of waking after sleep onset, they found anEEG spectral power increase in the non-rapid-eye-movement (REM)sleep period. The maximum rise occurred in the 10 – 11 Hz and 13.5– 14 Hz bands (Figure 8.2).
A replication study [63] on these effects was performed in 2000,but with a new setup for unilateral exposure of the brain, the systemprecedent to the one described in Chapter 9. The main objective wasto minimize the uncertainties regarding the head position during sleepin the former study. 16 subjects were exposed either in the left, theright, or neither of the hemispheres for 30 min prior to a 3-h day-time sleep episode (900 MHz, GSM-modulation, 1 W/kg psSAR10g).Again, a maximum rise in the spectral power in the 9.75 – 11.25 Hz

8.3. NON-THERMAL EFFECTS 109
and 12.5 – 13.25 Hz band was found during the initial phase of sleep.The unilateral exposure during waking induced no hemispheric asym-metry of the EEG power during sleep (Figure 8.3).
Frequency [HZ] Time after lights off [h]
EE
G p
ower
den
sity
[fie
ld %
of
sham
]
EE
G p
ower
[fie
ld %
of
sham
]p-value
Figure 8.2: EMF exposure during sleep and enhanced spectral powerof nonREM sleep EEG in the 7 – 14 HZ range during initial phase ofsleep
To establish a dose-response relationship, the influence of EMF ex-posure was investigated by varying the signal intensity [64]. The headof 15 healthy male subjects was unilaterally exposed for 30 min priorto sleep (900 MHz, GSM-modulation, 0.2 and 5 W/kg psSAR10g).Sleep architecture was not affected by EMF exposure. Analysis of thesleep EEG revealed a dose-dependent increase of power in the spindlefrequency range in non-REM sleep (Figure 8.4). This study is thefirst to reveal indications of a dose-response relationship due to EMFfield intensity.
Similar effects were reported in a more recent study [65], also with14 Hz modulation instead of the 217 Hz used with GSM signals. Thereis also indication that low-frequency magnetic field exposure may havecomparable effects, and that a broader range of EEG frequencies maybe affected [66]. Increased sensitivity in adolescents was not observed[67].

110 CHAPTER 8. BACKGROUND HUMAN RF EXPOSURE
EE
G p
ower
den
sity
[f
ield
% o
f sh
am]
left hemisphere right hemisphere
Figure 8.3: EMF exposure during waking prior to sleep affected spec-tral power of nonREM sleep EEG during the initial phase of sleep.Unihemispheric exposure did not result in hemispheric asymmetry.
8.3.2 Effect on Sleep-Dependent Performance Im-provement
Another recent study [76] explores possible mechanisms of how ra-diofrequency electromagnetic fields (RF EMF) affect cortical activityduring sleep and impact sleep-dependent performance changes. Six-teen male subjects were trained in a motor task to be used to as-sess changes in overnight performance improvement before exposureovernight to pulsed RF EMF. Each 500 ms RF EMF burst was com-prised of 7× 7.1 ms pulses, each with a peak spatial specific absorptionrate averaged over 10 g (psSAR10g) of 10 W/kg, at a burst repetitionrate of 0.25 – 0.8 Hz, resulting in an average whole-night psSAR10g of0.15 W/kg. Electroencephalograms (EEG) were recorded in parallelduring the entire sleep period. The slow-wave activity (SWA, 0.75 –4.5 Hz) increased towards the end of the sleep period and also afterthe RF EMF bursts in event-related EEG spectral power and phasechanges. Sleep-dependent performance improvement after overnightRF EMF exposure was significantly reduced (–20%, P = 0.03) com-pared to the sham overnight treatment. The changes in the time

8.4. HYPOTHESIZED INTERACTION MECHANISMS 111
Figure 8.4: Dose-dependent effect of RF EMF exposure on EEGpower spectra in non-REM sleep. Relative EEG power density spec-tra (100% = sham) are illustrated. Three conditions were applied:sham, 0.2 and 5 W/kg RF EMF exposure (10 g-averaged peak spatialSAR).
course of the SWA during overnight exposure may reflect an inter-action of RF EMF with the renormalization of cortical excitabilityduring sleep. Overnight exposure to pulsed RF EMF appears to neg-atively impact sleep-dependent performance improvement.
8.4 Hypothesized Interaction Mechanisms
Several experimental artifact confounders have been suspected to beresponsible for observed effects. For example, the presence of themetallic EEG electrodes were believed to cause strongly enhancedinduced fields due to the coupling of the incident fields with the elec-

112 CHAPTER 8. BACKGROUND HUMAN RF EXPOSURE
trode assembly, or the subsequent temperature increase at the tip ofthe electrodes was speculated be responsible for the EEG spectralpower enhancements. These confounding effects have been discussedin Chapter 10 and are believed unlikely to explain the observed effects.
As observation of a robust effect currently remains elusive, theproposed interaction mechanisms remain vague. Oscillatory brain ac-tivity caused by sensory perception of RF EMF, or non-synaptic orephaptic coupling of cortical neurons have been suggested as poten-tial mediators [76]. The nature of the findings generally seem to pointtowards a non-thermal effect [77].

Chapter 9
Flexible HumanExposure System forHypothesis Driven EMFResearch
9.1 Abstract
1A novel exposure system for double-blind human electromagnetic(EM) provocation studies has been developed that satisfies the preci-sion, control of fields and potential artifacts, and provides the flexi-bility to investigate the response of hypotheses-driven EM field expo-sure schemes on brain function ranging from extremely low frequencies(ELF) to radio frequency (RF) fields. Among the many special fea-tures, it can provide the same exposure of the lateral cerebral cortexat two different RF frequencies (900 MHz and 2140 MHz), but withdifferent exposure levels at subcortical structures, and in addition al-lows for uniform ELF magnetic field exposure of the brain. The RFmodulation and the ELF signal are obtained by a freely programmablearbitrary signal generator allowing a wide range of worst-case exposure
1This Chapter has been published in [78].
113

114 CHAPTER 9. HUMAN RF EXPOSURE
scenarios to be simulated, including those caused by wireless devices.RF pulses with more than 60 W/kg peak spatial specific absorptionrate averaged over 10 g tissue (psSAR10g) can be reached, allowinghigh peak-to-average ratios of >30 at the exposure limit of 2 W/kgpsSAR10g. Assessed SAR efficiencies are 0.50 W/kg (900 MHz) and0.39 W/kg (2140 MHz) per 1 W forward power. The ELF magneticfield exposure of the brain has a deviation from uniformity of 8% (stan-dard deviation) and the achievable maximum amplitudes are 800 A/mat 50 Hz and 140 A/m at 1 kHz. A rigorous dosimetric assessmenthas been performed for various different brain tissues and structures.
9.2 Introduction
Previous research has shown that pulse-modulated radiofrequency(RF) electromagnetic fields (EMF) approximating the exposure frommobile phones affect the waking and sleep electroencephalogram (EEG)[79, 80, 81, 68, 82, 65] when applying 30 min EMF exposure prior tosleep and to waking EEG recording. Significant effects have been ob-served for pulse-modulated exposures below peak spatial specific ab-sorption rates (psSAR) of 2 W/kg (whole head), where the brain andskin temperature increase is estimated to be about 0.14 K and 0.4 Kand remains below 0.25 K and 0.6 K [83, 74, 84]. No effects were ob-served when continuous wave (CW) fields with identical psSAR valueswere applied [81, 82]. In addition, effects on regional cerebral blood-flow [81, 85] and more recently on brain glucose metabolism have beenreported [69].
9.3 Objectives
The objective of this study is to develop an advanced exposure systemto empower researchers to investigate a number of hypotheses derivedfrom the above-mentioned body of experimental evidence. Specifi-cally, this includes the hypotheses that biological responses to RFexposure depend on the modulation frequency or time-domain char-acteristics of the modulation, peak-to-average ratios (PAR), intermit-tency, exposed functional subregions of the central nervous system

9.4. METHODS 115
(CNS) (e.g., cortex versus subcortical brain regions), and combinedRF and extremely low frequency (ELF) magnetic field exposures. Thedeveloped system has to comply with the minimal requirements ofreproducibility [86], while also providing additional detailed informa-tion of the applied worst-case exposure scenario, including evaluationof various functional subregions of the brain. A comparison to actualmobile phone exposure patterns can be found elsewhere [87].
9.4 Methods
The exposure system is based on planar patch antennas, which areused for the carrier frequencies of 900 MHz and 2140 MHz (SPA860/65/9/0/V and SPA2000/80/8/0/V, Huber+Suhner, Herisau, Switzer-land), and fixed on low-reflecting, low-loss stands (wood) at a heightof 130 cm from the floor. Either the 900 MHz or the 2140 MHz an-tenna is assembled inside a box of low dielectric material (εr = 2.5,σ < 0.15 mS/m), surrounded by Helmholtz-like coils for ELF expo-sure (Fig. 9.1). The subjects sit on a height adjustable seat with theirhead supported by styrofoam mounts such that the ear canal is situ-ated horizontally at the center and vertically 42 mm below the centerof the antenna patch. The distance between the antenna and the headis 110 mm (900 MHz) and 180 mm (2140 MHz).
The ELF exposure is realized using two Helmholtz-like coils oneach side of the head. Although their rectangular shape (330 mm x390 mm) and higher separation distance (257±20 mm depending onthe subject’s anatomy) is different from the original Helmholtz de-sign, sufficient homogeneity of the magnetic field is achieved. Theear canal is 82 mm below the center line between the coils. Elec-tric current through the dual winding (2 x 23 windings per coil) iseither parallel or anti-parallel for ELF exposure and sham exposure,respectively. The coils are powered by a voltage controlled currentsource (VCCS, SPEAG, Zurich, Switzerland). The two separate in-stallations for RF 900 MHz and RF 2140 MHz (both enhanced withELF exposure) are not visually distinguishable as the antennas orcoils are assembled within the low-loss enclosures (Fig 9.1). The sig-nal for the RF modulation envelope and the ELF magnetic field isgenerated by an arbitrary function generator (Agilent 33220A, Agi-

116 CHAPTER 9. HUMAN RF EXPOSURE
lent Technologies, Santa Clara, CA), allowing any 14-bit, 50 MSa/s,64 k-point waveform. An RF generator is used for modulations upto 50 kHz (R&S SML02, Rohde&Schwarz, Munich, Germany). TheELF current source allows frequency components up to 1.3 kHz, whichis sufficient to simulate the main ELF components generated by thecurrents in mobile phones [88].
The whole system is computer controlled and monitored usinga custom-made software package written in C++. The applied RFpower is controlled via bi-directional couplers and calibrated Schot-tky diodes. A set of randomized exposure conditions can be definedto allow a fully double-blind protocol. Since exposure safety is espe-cially important in human experimental test systems with high peakSAR values, forward and reflected power is continuously monitored,controlled and logged (10 s sampling). The system aborts immedi-ately if the expected forward power is exceeded by more than 10%. Awatch-dog safety hardware circuit prevents exposure in case of a soft-ware failure, and RF amplifiers operate 1 dB below their maximumoutput power. To inhibit any potential acoustic perception of vibra-tion by the patch antenna driven with high peak-to-average power, alow brown noise (spectral density proportional to 1/f2) is added whennecessary, using a loud speaker [65]. Type-A weighted average soundpressure levels are estimated to be <35dB without noise (below thethreshold of the device) and 43±2 dB with applied brown noise atthe position of the subject’s head, assessed using the RO-1350A (Ro-line/ROTRONIK, IEC-651 standard, Bassersdorf, Switzerland) soundlevel meter.
Numerical dosimetry and optimization was conducted with thesimulation platform jointly developed by the IT’IS Foundation andSPEAG (Zurich), and which has been commercialized by the latter(SEMCAD X, V13.4). The finite difference time domain (FDTD)solver was applied for the RF analysis in combination with the SEM-CAD extension for the analysis of exposure levels at functional sub-regions of the brain (1105 regions in the Talairach-space) [89]. Thereference and uncertainty analysis was performed with the 26-year-oldfemale ’Ella’ from the Virtual Family [35] (www.itis.ethz.ch/vip). Thedielectric tissue properties have been assigned according to literaturevalues [17] that have recently been updated [16]. The grid resolutionhad a minimal voxel size of 0.2 mm (x, y, z direction) in the patch

9.4. METHODS 117
Antenna:either 900 or 2140 MHz
Coil wires
BOX
217
mm
310 mm
110 mm180 mm
257 ± 5 mm
Coil feed
Control PC
RF Modulation
ELF
Sig
nal
Mea
sure
men
t
RF Signal
Function GeneratorAgilent 33220A
GPIB
RF GeneratorR&S SML02
Data LoggerAgilent 34970A
Coupler
Shunt
Hardware watch dog
900/2140 MHzAntenna
ELF coilsELF Amplifier
0.75 0.60 0.45 0.3 0.15 0
DASY measurement SEMCAD simulation Deviation Magnetic field psSAR10g = 0.44 W/kg psSAR10g = 0.49 W/kg 10.4%
psSAR10g = 0.39 W/kg psSAR10g = 0.40 W/kg 1.6%
SAR 5 4 3 2 1 0
dB
900
MH
z
H-fi
eld
[A/m
]
x-distance [mm]
H-fi
eld
[A/m
]
2140
MH
z
SAM head dimension
-150 -100 -50 0 50 100 150
x1x2x3
sim. / measurement
x4x5x6
sim. / measurement
A
D E
C
B
RF Amplifier
500
400
300
200
100
0
500
400
300
200
100
0
Figure 9.1: (A) Subject within the exposure system with attachedHelmholtz-like coils. (B) Schematic of the exposure system hardware,and (C) of the boxed antenna enclosures with antenna positions (ei-ther the 900 MHz or the 2140 MHz antenna), coil housings and ‘Ella’[35]. (D) SAM head surface SAR exposure comparison of measure-ment and simulation, as well as (E) the simulated and measured valuesof the ELF magnetic field (measurement positions x1-x6 indicated inFig. 9.2).

118 CHAPTER 9. HUMAN RF EXPOSURE
antenna and a maximum size of 0.9 mm in the exposed tissues, lead-ing to approx. 10 million voxels for the head and 60 million voxelsfor the entire simulation space. For numerical variability evaluations,two additional anatomical head models were used: the 34-year-oldmale adult ’Duke’ (image resolution and segmentation characteristicscorrespond to ’Ella’; [35]), and the 40-year-old European female ’HR-EF1’ with a coarser than state-of-the-art resolution of 1 mm in theear region and 3 mm for the rest of the head. The latter was in-cluded for comparison with the precedent exposure system [90]. Themagneto quasi static low frequency solver of SEMCAD X was appliedto analyze the ELF magnetic field coil system, using a 2.5 mm gridresolution and low frequency current sources for the two coils.
9.5 Validation
Experimental validation was performed by comparing the RF expo-sure of the specific anthropomorphic mannequin (SAM, IEEE 1528-2003) in simulations with measurements obtained from the near fieldscanner DASY5/NEO (SPEAG), equipped with a calibrated dosimet-ric SAR probe (ET3DV6) and tissue simulating liquid (HSL-U10).The ELF magnetic field was validated using a Gaussmeter (FH49,Magnet-Physik, Germany) equipped with a 3 axis, temperature regu-lated magnetic field probe (HS-ZOA71-3208-05-T, probe diameter: 8mm). The measured x-axes (x1-x6) are indicated in Figure 9.2.
9.6 Results
The dosimetric results of the RF system are summarized in Table 9.1.The configuration was optimized to achieve a similar exposure at thelevel of the lateral cerebral cortex with maximum exposure differencein the thalamus. This was obtained by selecting the two differentcarrier frequencies 900 and 2140 MHz and optimization for minimaldifferences between the average SAR induced in eight selected Ta-lairach regions (grey matter within T1-T8, see Figure 9.2) by varyingthe distance of the patch antennas from the head. The results weredistances of 110 mm and 180 mm for the 900 MHz and 2140 MHz an-

9.6. RESULTS 119
tenna, respectively, with a global psSAR10g ratio of 1.4 (e.g., values of1 W/kg at 900 MHz and 1.4 W/kg at 2140 MHz). The correspondingpsSAR10g efficiencies are 0.50 W/kg and 0.39 W/kg for 1 W forwardpower at the antenna feed point. The exposure of the different braintissues and Talairach regions was characterized by the mean value,standard deviation, and psSAR1g. The experimental validation re-sulted in differences to the numerical prediction of 10.4% (900 MHz)and 1.6% (2140 MHz) that are well within the combined numericaland experimental uncertainty (see also Fig 9.1).
The ELF magnetic field over the volume of the brain has a stan-dard deviation of 8%, except for the marginally exposed medulla ob-longata (Fig. 9.2), and the achievable peak exposures are 800 A/m at50 Hz and 140 A/m at 1 kHz. Sham exposure (anti-parallel currents)is >43 dB below the ELF exposure. The average deviation betweenELF simulation and measurement remained below 7% (Fig. 9.1).

120 CHAPTER 9. HUMAN RF EXPOSURE
0 -3 -6 -9 -12 -15 dB
164 116 82 58 41 29 A/mrms
MIDDLE FRONTAL
GYRUS
INF. FRONTAL
GYRUS
SUP. TEMPORAL GYRUS
INF. TEMPORAL GYRUS
PO
ST
CE
NTR
AL
GY
RU
S
PR
EC
EN
TRA
L G
YR
US
INF. PARIETALLOBULE
MID. TEMPORAL GYRUS
1 0.32 0.1 0.032 0.01 0.003 W/kg
sim
ilar
late
ral c
orte
x ex
posu
re *
* quantitative comparisonusing eight Talairachregions of the lateral cortex(gray matter within T1–T8)
0 -5 -10 -15 -20 -25 dB
T4
T7 T6
T2
T3T8
T5T1
x1
x2
x3
x4
x5
x6
Axial,center of thalamus
Coronal,center of thalamus
Sagittal,center of head
SAR distributionon suface oflateral cortex
Tissue model
Magnetic FieldELF - Setup
900MHzRF - Setup
psSAR10g = 1 W/kg
2140MHzRF - Setup
psSAR10g = 1.4 W/kg
Figure 9.2: SAR distribution (axial, coronal, sagittal slices; lateralexposed cortex surface view) and selected Talairach regions (T1-T8).RF exposure levels are optimized for similar lateral cortex exposure(outermost 2-4 mm of the cortex). Maximum SAR not present indepicted slices. Illustration with RF exposure of the left hemisphere.

9.6. RESULTS 121B
oth
hem
isphere
sE
xp
ose
dhem
isphere
Nonexp
ose
dhem
.V
ari
ati
on
Uncert
.T
ala
irach
regio
n
1ga
avb
SDc
Lossd
1g
av
SD
Loss
1g
av
SD
1g
av
1g
av
No.
av
Var.
Unc,
W/kg
W/kg
W/kg
mW
W/kg
W/kg
W/kg
mW
W/kg
W/kg
W/kg
%%
%%
W/kg
%%
Zurich
Setup,Ella
T1
0.3
315
3
Gre
ym
att
er
1.0
60.1
60.2
0116
1.0
60.2
90.2
2102
0.1
80.0
40.0
312
20
53
T2
0.4
422
4
Whit
em
att
er
0.7
20.1
20.1
351
0.7
20.2
00.1
344
0.1
20.0
30.0
317
27
35
T3
0.7
118
2
Gre
y+
Whit
em
att
er
1.0
20.1
50.1
8167
1.0
20.2
60.2
0146
0.1
80.0
40.0
312
21
73
T4
0.1
717
5
Thala
mus
0.3
10.1
80.0
72.4
0.3
10.2
30.0
61.5
0.1
50.1
30.0
235
35
15
16
T5
0.6
416
3
Bra
in(w
ithout
CSF
)1.3
20.1
50.1
8201
1.3
20.2
60.2
0174
0.1
80.0
40.0
421
22
44
T6
0.3
618
5
Bra
in(w
ith
CSF
)1.3
30.1
80.2
4284
1.3
30.3
00.2
8241
0.2
90.0
50.0
516
22
43
T7
0.2
817
3
Tota
lhead
1.7
20.1
30.2
4605
1.7
20.2
30.3
1525
0.2
90.0
40.0
516
16
81
T8
0.5
716
2
BoX
-900M
Hz
T1
0.3
715
3
Gre
ym
att
er
1.0
60.1
90.2
2135
1.0
60.3
30.2
4117
0.2
20.0
50.0
412
20
53
T2
0.6
922
4
Whit
em
att
er
0.7
20.1
40.1
461
0.7
20.2
40.1
451
0.1
60.0
40.0
417
27
35
T3
0.6
418
2
Gre
y+
Whit
em
att
er
1.0
30.1
70.2
0196
1.0
30.3
00.2
1168
0.2
10.0
50.0
412
21
73
T4
0.2
517
5
Thala
mus
0.3
70.2
10.0
72.9
0.3
70.2
50.0
81.7
0.1
80.1
70.0
235
35
15
16
T5
0.6
616
3
Bra
in(w
ithout
CSF
)1.1
90.1
70.1
9228
1.1
90.2
90.2
1193
0.2
10.0
50.0
421
22
44
T6
0.5
918
5
Bra
in(w
ith
CSF
)1.4
20.2
00.2
7327
1.4
20.3
40.3
2272
0.4
20.0
70.0
716
22
43
T7
0.4
217
3
Tota
lhead
1.5
50.1
40.2
6648
1.5
50.2
40.3
3549
0.4
20.0
40.0
616
16
81
T8
0.6
316
2
BoX
-2140M
Hz
T1
0.1
836
15
Gre
ym
att
er
0.8
10.0
90.1
464
0.8
10.1
70.1
659
0.0
60.0
10.0
116
38
67
T2
0.4
037
3
Whit
em
att
er
0.4
00.0
50.0
722
0.4
00.0
90.0
820
0.0
40.0
10.0
115
39
612
T3
0.3
114
3
Gre
y+
Whit
em
att
er
0.7
30.0
80.1
286
0.7
30.1
40.1
479
0.0
60.0
10.0
114
38
69
T4
0.1
835
9
Thala
mus
0.0
49
0.0
19
0.0
14
0.2
60.0
49
0.0
29
0.0
13
0.2
00.0
13
0.0
09
0.0
05
45
60
10
11
T5
0.3
727
7
Bra
in(w
ithout
CSF
)0.7
30.0
70.1
294
0.7
30.1
30.1
487
0.0
60.0
10.0
114
37
67
T6
0.3
637
6
Bra
in(w
ith
CSF
)0.9
20.0
90.1
5139
0.9
20.1
60.1
9125
0.1
70.0
20.0
321
37
13
8T
70.2
637
9
Tota
lhead
2.6
60.1
20.3
0556
2.6
60.2
20.4
0512
0.2
40.0
20.0
410
26
44
T8
0.3
435
11
Exp
ose
d10g-p
sSA
R10g-p
sSA
R10g-p
sSA
R
Table
Expla
nati
on
Syst
em
Ante
nna
hem
isphere
whole
head
wit
hout
ear
effi
cie
ncy
a1g-p
sSA
Rb
avSA
RZ
uri
ch
Setu
p,
Ella
SP
A920/65/9/0/V
left
1W
/kg
1W
/kg
0.6
45
(W/kg)/
Wc
SD
of
avSA
RB
oX
-900M
Hz
SP
A860/65/9/0/V
left
1W
/kg
1W
/kg
0.5
03
(W/kg)/
Wd
tota
lp
ow
er
loss
es
BoX
-2140M
Hz
SP
A2000/80/8/0/V
left
1W
/kg
0.9
3W
/kg
0.3
91
(W/kg)/
W
Tab
le9.
1:S
AR
valu
esfo
rd
iffer
ent
bra
inti
ssu
esan
dse
lect
edT
ala
irach
are
as.

122 CHAPTER 9. HUMAN RF EXPOSURE
9.7 Study Configurations
A first hypothesis-driven study is to investigate if similar fields (am-plitude and modulation) induced in the cortex result in the sameeffects independent of the carrier frequency and exposure of subcor-tical structures [Schmid et. al, 2011b]. With the presented optimizedconfiguration, the average SAR in the thalamus is 8 times lower at2140 MHz than at 900 MHz, while maintaining similar cortex ex-posure. Figure 9.2 illustrates the SAR distribution for both carrierfrequencies in three orthogonal cuts. The system also enables thestudy of whether ELF and RF exposures have similar physiologicalresponses when the modulation envelope of the RF signal correspondsto the ELF signal, and the effects of the ELF exposures posed bythe mobile phones [65, 88]. All exposures were compliant with thesafety guidelines defined by the International Commission on Non-Ionizing Radiation Protection [1], i.e., maintaining the basic restric-tion of 2 W/kg psSAR10g for RF exposures and complying with thesummation of the multifrequency ELF field with the correspondingreference levels.
9.8 Uncertainty
The uncertainty and variability analysis for the dosimetric study wasperformed following the concept of the National Institute of Standardsand Technology (NIST) TN1297 [Taylor and Kuyatt, 1994]. The un-certainty analysis included: (a) ±10% variation of the tissues’ relativepermittivity and conductivity [17]; (b) discretization of the head, es-timated with half and double voxel sizes; and (c) segmentation ofthe head anatomy, based on the differences between left and righthemisphere. The variation analysis included: (a) changes in antennaposition relative to the head (±5 mm in x direction, ±10 mm in y,z direction); (b) different head size, assessed by scaling the referencehead model (’Ella’) by ±10%; and (c) usage of two additional headmodels, relevant for the representation of the inter-subject and age-related structural differences of the population. The European femalemodel ’HR-EF1’ made the most significant contribution to variabil-ity (see Tab. 9.1), demonstrating the need for enhanced imaging and

9.9. CONCLUSIONS 123
segmentation techniques.
9.9 Conclusions
In conclusion, a novel system for double-blind human EM provocationstudies has been developed and fully characterized. It satisfies the pre-cision, control of fields and potential artifacts, and provides the ex-posure flexibility necessary to investigate the response of hypotheses-driven electromagnetic field exposure schemes on brain function. Itallows the exposure of the CNS to ELF magnetic fields and RF fieldsof different carrier frequencies (900 MHz and 2140 MHz). Very similarinduced field distributions in the lateral cortex are provided at bothradio frequencies and uniform exposure at ELF. Furthermore, mod-ulation and the ELF signals are obtained by a freely programmablearbitrary signal generator allowing a wide range of worst-case exposurescenarios to be simulated with peak RF exposures of up to 60 W/kgand ELF exposures up to 800 A/m at 50 Hz. The system is thereforesuitable for testing a wide range of hypotheses of EMF interactionwith brain function.


Chapter 10
Evaluation of ElectrodeArtifacts and ThermalRipples of EEG RFExperiments
10.1 Abstract
1 The effects of radiofrequency (RF) exposure on waking and sleepelectroencephalography (EEG) have been in focus since mobile phoneusage became pervasive. It has been hypothesized that effects maybe explained by 1) enhanced induced fields due to RF coupling withthe electrode assembly, 2) the subsequent temperature increase aroundthe electrodes, or 3) RF/thermal pulsing caused by localized exposurein the head. We evaluate these three hypotheses by means of bothnumerical and experimental assessments made with appropriate phan-toms and anatomical human models. Typical and worst-case electrodeplacements were examined at 900 and 2140 MHz. Our results indicatethat hypothesis 1 can be rejected, as the induced fields cause < 20%increase in the 10g-averaged specific absorption rate (SAR). Simula-
1This Chapter has been published in [91].
125

126 CHAPTER 10. EEG ELECTRODES
tions with an anatomical model indicate that hypothesis 2 is also notsupported, as the realistic worst-case electrode placement results in amaximum skin temperature increase of 0.31 °C while brain temper-ature elevations remained < 0.1 °C. These local short-term temper-ature elevations are unlikely to change brain physiology during thetime period from minutes to several hours after exposure. The maxi-mum observed temperature ripple due to RF pulses is � 0.001 °C forGSM-like signals and < 0.004 °C for 20-fold higher pulse energy, andoffers no support for hypothesis 3. Thus, the mechanism of interac-tion between RF and changes in the EEG power spectrum remainsunknown.
10.2 Introduction
Research into the effects of pulsed radiofrequency (RF) electromag-netic field (EMF) exposure on brain physiology has been in focus sincethe usage of mobile phones became pervasive. The most consistentlyreported effects in various studies conducted by different laboratoriesare changes in the electroencephalogram (EEG) power spectrum, e.g.,[92, 79, 80, 81, 93, 94, 68, 82, 65, 66]. A recent summary can be foundin the publication of [95], in which the authors conclude that GlobalSystem for Mobile Communications (GSM)-type signals may result inminor effects on brain activity with no adverse health effects. Inter-esting findings regarding potential mechanisms include that unilateralRF exposure of the brain does not induce hemispheric asymmetry ofthe EEG power [80], that continuous wave (CW) non-pulsed RF doesnot enhance EEG power [81, 85], that a dose-response relationshipcan be demonstrated [82], and that pulse modulation schemes withfrequency components below 20 Hz seem to be sufficient to affectEEG power [66]. Further reported effects include changes in regionalcerebral blood flow [81, 85], brain glucose metabolism [69], and sleep-dependent performance improvement [76].
To minimize the time between RF EMF exposure, e.g., from a cellphone, and sleep onset, many but not all human provocation studieshave been performed with attached electroencephalography (EEG)electrodes, e.g., [79, 82, 65, 66], or the EEG has been recorded dur-ing RF exposure [79, 96, 97, 76]. These effects have usually been

10.2. INTRODUCTION 127
referred to as the “non-thermal biological response” of RF EMF ex-posure. Thermal interaction is not a plausible explanation for theobserved effects, as the resulting temperature increases are consid-ered biologically non-relevant. In the case of the cited experiments,the temperature increases remained below 0.5 °C in the whole headand below 0.25 °C in the brain, as the exposure levels did not exceedthe corresponding general public guideline limits of the InternationalCommission on Non-Ionizing Radiation Protection (ICNIRP) [1, 74].The limit is defined by the specific absorption rate (SAR), with amaximum peak spatial SAR averaged over 10 g of tissue (psSAR10g)of 2 W/kg.
On the other hand, three hypotheses have often been discussed,namely, that the observed effects are caused by 1) the locally increasedinduced fields in the brain due to the coupling of the incident fieldwith the assembly of the electrodes and electronics, 2) the subsequenttemperature increase induced by the locally enhanced fields aroundthe electrodes, or 3) the thermal pulses in the brain tissue due tothe absorption of the RF pulses of the mobile phone signal. In mostpublished studies, the RF pulsing has been derived from GSM signals.The objective of this paper is to thoroughly investigate the plausibilityof these three hypotheses. We do not introduce or discuss any new oralternative hypotheses for the observed biological responses.
In earlier experimental studies, shielding effects from field attenu-ation below the EEG leads of up to 10% for the psSAR1g/10g havebeen estimated for typical lead orientations [90]. The localized en-hancements around the electrode tip do not affect the psSAR10g(< 1%), but increase the psSAR1g by 35%. Recent numerical studiesshowed altered field levels caused by the EEG electrodes of < 20% inpsSAR1g/10g for typical lead orientations and up to 60% for worst-case alignments in psSAR1g [97, 98]. In another simulation study,an increase of ca.12% in psSAR10g due to the EEG electrodes wasreported [99]. Head average SAR remains unaffected by these local-ized field enhancements. However, it should also be noted that notall of the cited studies involved attachment of electrodes during ex-posure, e.g., [68] found similar effects with electrodes attached onlyafter the exposure period, providing evidence that the electrodes areat most a minor confounding factor. In this study, we investigatedthe configurations of lead and electrode placements typically used in

128 CHAPTER 10. EEG ELECTRODES
the cited studies. In general, all EEG recording electronics were ei-ther well-protected by means of appropriate RF filtering elements, orthe recording electronics were entirely disconnected, both of whichapproaches satisfy good laboratory practice (GLP) requirements (asdescribed in the Methods section). The 900 MHz and 2140 MHz car-rier frequencies represent the lower and upper limits of typical mobilephone frequency bands. For reasons of completeness, we also investi-gated the worst-case configurations for the maximum upper limit. Inaddition, we assessed the magnitude of the thermal pulses for GSM-like exposures and for a signal with a peak-to-average ratio (PAR)of 50 at 10Hz that is much larger than the PAR in any of the citedstudies.
10.3 Methods
The basic interactions between the incident field and the EEG record-ing system are induced currents on the leads and electrodes that mayhave the following effects [100]: (a) direct interaction by rectificationof the RF at the non-linear elements of the EEG recording system; (b)strongly enhanced fields at the electrode tip that may induce fields inthe brain that greatly exceed direct exposure to the source or result insignificant temperature increases below the electrode, which, in turn,modulate EEG via an unknown mechanism; and (c) RF shielding orenhancement, as the electrodes may act as reradiators of the incidentfields in close proximity to the tissue. The experiments are designedto test the three hypotheses introduced above; no new or alternativehypotheses are considered.
The electronics of all involved systems were appropriately shieldedby full metallic enclosure, and all electrodes and other cables were con-nected via effective feed-through filters (RF attenuation better than–70dB, factor > 3100 in field level) [97, 76]. Artifacts via interaction(a) could thus be excluded. The interactions (b) and (c) and theirimplications on our three hypotheses were investigated by means ofthe following four scenarios: Setup A, a flat homogeneous model, sim-ulation and measurement; Setup B, a flat tissue-layered head model,simulation only; Setup C, a homogeneous specific anthropomorphicmannequin (SAM) model, simulation and measurement; and Setup

10.3. METHODS 129
D, an anatomical model Ella [35], simulation only. Setups A and Dinclude thermal evaluations. An overview of the different configura-tions is shown in Figure 1.
The gold-plated silver EEG electrodes investigated have a diameterof 8 mm and a thickness of 1 mm (GRASS Technologies, West War-wick, RI, USA). In the simulation models, the electrodes were placedin direct contact with the skin, which results in sharp RF interfacesbetween metal and tissue. More-realistic modeling is challenging, asthe contact area may vary, depending on the contact paste used, in-terference from hair, etc., and result in different contact qualities.Smaller contact areas, e.g., a tilted electrode that touches only oneside, did not increase psSAR10mg/1g/10g in simulations and, there-fore, indicate that local temperature is not greatly affected by thecontact area. Furthermore, the small temperature changes are notbelieved to cause electrode contact impedance shift and have no effecton the recording system in the majority of the studies, where all EEGsampling has been performed after RF exposure.
The electrode leads were modeled as perfect conductors with asurrounding isolator and a length of > 120 mm (standard leads arelonger than 600 mm). The highest exposure at the tip was foundat the resonant length λ/4, i.e., 80 mm at 900 MHz, with the leadnormal to the surface and perfectly aligned with the incident E-field.Therefore, this single generic lead corresponds to the worst-case leadconfiguration with respect to the current induced below the electrode,i.e., realistic configurations of multiple EEG leads will generally resultin lower exposures. The RF field was generated with linearly polarizedplanar patch antennas (SPA860/65/9/0/V and SPA2000/80/8/0/V,Huber & Suhner, Herisau, Switzerland) at the investigated carrierfrequencies of 900 and 2140 MHz. The simulation models of the an-tennas were validated by comparing the broadband input impedance.All measurements were performed with CW with an output powerdrift less than 0.3 dB (7%). The effect of RF pulsing on temperaturewas investigated with the anatomical head, Setup D, as this representsthe most realistic scenario.

130 CHAPTER 10. EEG ELECTRODES
Patch antennas
E
H
k
Antenna
E
HkParallel
Orthogonal
Flathomogeneous phantom
non-realistic worst case
A
DC
BWhite Matter Grey Matter Dura Skull Muscle Fat Skin
EEGelectrode
Lead(with isolation)
E
Figure 10.1: Overview of simulation and measurement configura-tions. A: Flat homogenous phantom with one electrode-lead orthogo-nal to incident E-field and one parallel. B: Flat tissue-layered modelof the human head. C: EEG electrodes attached to SAM for measure-ments with DASY5/NEO (SPEAG). D: Ella from the Virtual Popu-lation with one EEG electrode attached above the psSAR10g hotspotlocation.

10.3. METHODS 131
10.3.1 Setup A: Flat homogeneous model
The worst case in terms of peak global head exposure is an EEG elec-trode attached at the location of the natural SAR hotspot of the head.This scenario was measured and simulated with a flat homogeneousphantom and two electrodes, one with parallel and the other with or-thogonal lead orientation relative to the E-field (see Figure 1A). Dosi-metric temperature probes (TV3LAB; SPEAG, Zurich, Switzerland)were placed at the estimated hotspot location and, as a reference, ata sufficient distance to the electrodes (T1 – T3, Fig. 2). To avoidthermally induced convection, a tissue simulating gel (ε900MHz = 56,σ900MHz = 0.96 S/m; ε2140MHz = 53, σ2140MHz = 1.83 S/m, thermalconductivity κ = 0.62 W/m/K, ρ = 993 kg/m3, c = 3200 J/kg/K) wasused. The numerical simulations were conducted with SEMCAD XV14.8 (SPEAG) and compared to the thermal measurements.
10.3.2 Setup B: Flat tissue layered head model
The configuration of Setup A was extended to a tissue-layered simu-lation model (Fig. 1B), where the human head is approximated withsubsequent planar layers of the different head tissues [101]. The small-est estimated thicknesses — 1 mm skin, 1 mm fat, 1 mm muscle,1.5 mm skull, 1 mm dura, no cerebrospinal fluid (CSF), 4 mm graymatter, > 20 mm white matter — have been used to mimic the worst-case scenario, where the brain is closest to the surface.
10.3.3 Setup C: Homogeneous SAM model
Figure 1C shows the measurements performed with a twin SAM phan-tom filled with a broadband liquid (SPEAG, Zurich, Switzerland,HSL-U10: ε900MHz = 42, σ900MHz = 0.97 S/m; ε2140MHz = 39.5,σ2140MHz = 1.58 S/m) to simulate brain tissue. The near-field scan-ner DASY5/NEO (SPEAG) was used with calibrated dosimetric SARprobes of type ET3DV6 and EX3DV4 (SPEAG). The antenna posi-tioning was identical to that used by [78], and a typical EEG electrodeconfiguration — derivation C3A2, electro-oculogram, electromyogram,with a total of 15 electrodes on the head — was mounted onto the SAMhead as described, e.g., in [65]. The RF absorption pattern without

132 CHAPTER 10. EEG ELECTRODES
electrodes/leads was compared to a set of ten different configurationsfor both RF frequencies, A1 – A5 & B1 – B5. The electrode-tissuecontact quality was configured with (A) electrical isolation of the elec-trodes outside the SAM shell and (B) electrical contact between theelectrodes and the tissue simulating liquid. Measurements were per-formed for (A) and (B) in combination with (1) ideal lead positioningorthogonal to the E-field, (2) realistic typical positions with < 15°angles between leads and E-field polarization, (3) realistic worst-caseplacement with up to 30° angles, (4) 10 mm head distance to mimicthick hair density, and (5) with electrical contact cream (EC2, GRASSTechnologies).
As good electrical contact of the electrodes is a prerequisite forEEG recording, the B2-configuration — electrical contact combinedwith realistic lead alignment — is the most realistic measurementscenario, and was simulated to confirm the exposure pattern of themeasurements. SAR values at a distance of 1 – 2 mm from the SAMsurface were extracted to match the actual measurement location ofthe EXDV4 probes.
10.3.4 Setup D: Anatomical model Ella
Finally, the EEG electrode attached above the normal SAR hotspotlocation to the head of Ella from the Virtual Population [35] was sim-ulated. The dielectric and thermal tissue parameters were assignedaccording to [16]. A temperature increase simulation, which assumesthermal equilibrium at the onset of heating, was performed. Ther-moregulated blood flow was not considered, as the estimated temper-ature increases are very low [21]. A convective thermal boundary con-dition (h = 6 W/m2/K) to the surrounding air was set. The electrodewas modeled as a perfect thermal isolator a conservative approach tothe unknown convection boundary. Setting a similar boundary asto air, however, had a marginal effect on the temperature increase(< 1%) due to the small dimensions of the electrode.
Voxel size was refined down to 0.3 mm within the estimated psSAR10gcube, yielding a time step according to the Courant–Friedrichs–Lewy(CFL) condition of 0.06 s for the subsequent thermal simulation. Theexposure level was normalized to a psSAR10g of 2 W/kg without theelectrode, which is the relevant guideline limit ICNIRP, 1998], and
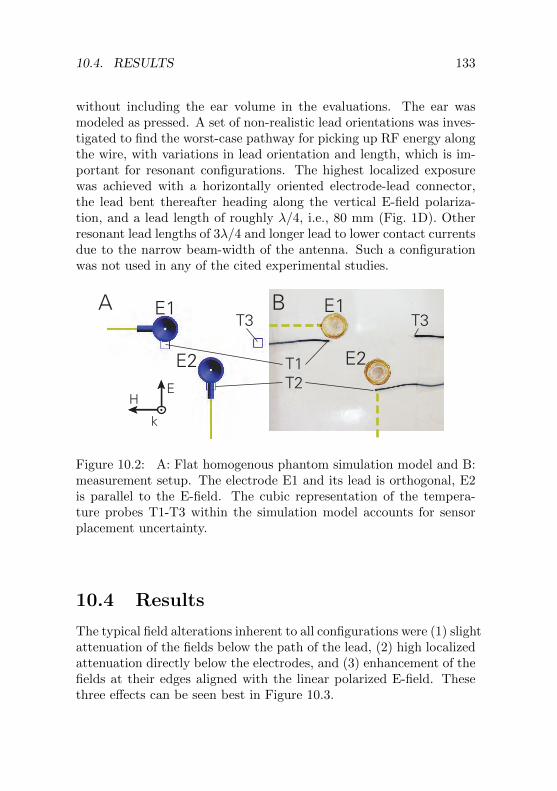
10.4. RESULTS 133
without including the ear volume in the evaluations. The ear wasmodeled as pressed. A set of non-realistic lead orientations was inves-tigated to find the worst-case pathway for picking up RF energy alongthe wire, with variations in lead orientation and length, which is im-portant for resonant configurations. The highest localized exposurewas achieved with a horizontally oriented electrode-lead connector,the lead bent thereafter heading along the vertical E-field polariza-tion, and a lead length of roughly λ/4, i.e., 80 mm (Fig. 1D). Otherresonant lead lengths of 3λ/4 and longer lead to lower contact currentsdue to the narrow beam-width of the antenna. Such a configurationwas not used in any of the cited experimental studies.
T1T2
T3T3A B
HE
k
E1
E2E2
E1
Figure 10.2: A: Flat homogenous phantom simulation model and B:measurement setup. The electrode E1 and its lead is orthogonal, E2is parallel to the E-field. The cubic representation of the tempera-ture probes T1-T3 within the simulation model accounts for sensorplacement uncertainty.
10.4 Results
The typical field alterations inherent to all configurations were (1) slightattenuation of the fields below the path of the lead, (2) high localizedattenuation directly below the electrodes, and (3) enhancement of thefields at their edges aligned with the linear polarized E-field. Thesethree effects can be seen best in Figure 10.3.

134 CHAPTER 10. EEG ELECTRODES
10.4.1 Setup A: Flat homogeneous model
Figure 3 shows the resulting SAR distribution around the EEG elec-trodes E1 and E2 in the flat homogeneous model (Setup A). Theshielding effect is most prominent when the leads are parallel to theE-field, while the effect vanishes in an orientation orthogonal to theE-field (E2 vs. E1 in Fig. 3). The resulting temperature distributionafter 300 s of heating (Fig. 3B) is much more equalized than the SARdistribution due to the thermally small distances. Although the local-ized SAR hotspots around the electrodes are of similar magnitude, theE1 induces higher temperatures due to the absence of lead-shieldingnear to the E2 electrode. This lead-shadow (Fig. 3AB) is thermallyvery close to the hotspot and prevents excessive heating. It is moredeveloped at 2140 MHz (not depicted), explaining the higher temper-ature drop in T2 (Fig. 3C).
A comparison between numerically estimated temperature increasesand the corresponding measurements T1 – T3 can be seen in Fig-ure 3C. T3 shows a linear increase corresponding to the local SAR of3.6 W/kg, as the probe is within the homogeneous non-perfused gel ata location without strong field-gradients. The measurements are allwithin one standard deviation (SD, k = 1) of the simulated transienttemperatures with respect to probe placement uncertainty within thecubic areas T1 – T3 (Fig. 3C).
10.4.2 Setup B: Flat tissue layered head model
In Figure 4, the effect of the EEG electrodes on the SAR in the hu-man head anatomy is estimated with the flat tissue-layered model(Setup B). The induced currents lead to localized superficial field en-hancements, but have very limited effect on brain exposure, with aSAR enhancement below 25%.
10.4.3 Setup C: Homogeneous SAM model
Figure 5 shows the SAM surface SAR distributions with and with-out attached electrodes (Setup C) for realistic lead placement andelectrodes electrically connected to the tissue simulating liquid (B2-configuration). The simulation results (Fig. 5A) correspond well to

10.4. RESULTS 135
ParallelOrthogonalSurface SAR, 900 MHz
kE
HE1
E1E2
HE
k
slic
e
slic
eTe
mpe
ratu
re In
crea
se (°
C)
0 50 100 150 200 250 300Time (s)
0.6
0.5
0.4
0.3
0.2
0.1
0
Tem
pera
ture
Incr
ease
(°C
)
Time (s)
A Surface temperatureB
C
kE
H
2140 MHz
leadlead
T1 (E1) orthogonalT2 (E2) parallelT3 no electrode (3.6 W/kg)
meas / sim, SD 900 MHz
T1
T1T2
lead-shadow
T2
T3
T1
T2
T3
0 50 100 150 200 250 300
0.6
0.5
0.4
0.3
0.2
0.1
0
-30 -24 -18 -12 -6 0dB
0.2 0.7 2.9 11.4 45 180W/kg°C
0 0.1 0.2 0.3 0.4 0.5
E2
lead-shadow
Figure 10.3: A: Simulated SAR distribution in the flat homogeneousphantom (only the 900 MHz distribution is depicted as the distribu-tion is similar at 2140 MHz). B: Simulated temperature distributionat 900 MHz after 300 s heating. C: Thermal validation measurementscompared to simulated temperature increases. The exposure level wasadjusted to 3.6 W/kg local SAR at the temperature probe T3. Meanand standard deviation is shown for the cubic areas T1 T3 in the sim-ulation. T2 (at 900 MHz) shows a large uncertainty because of thestrong temperature gradient in this region.

136 CHAPTER 10. EEG ELECTRODES
kE
Hk
E
H
900 MHz 2140 MHz
0
-6
-12
-18
-24
-30
200
50
13
3.2
0.8
0.2
dB W/kg
White Matter Grey Matter Dura Skull Muscle Fat Skin0dB = 200 W/kg
Brain (grey matter) boundary
SAR
pattern without electrode
pattern with electrode
pattern without electrode
pattern with electrode
Figure 10.4: SAR distribution in the tissue-layered model with theEEG electrode assembly orthogonal to the E-field. The figure illus-trates the localized effect on SAR as field enhancements generally re-main within the superficial layers. The 30 dB (factor 1000) dynamicrange corresponds to 2 dB (factor 1.6) per contour; linear values areprovided.

10.4. RESULTS 137
the measured absorption pattern (Fig. 5B). The magnitude of the ef-fect of the attached EEG electrodes can be seen in Figure 5C, whichshows the deviation of the measurement with and without electrodes.
Ten different lead configurations were investigated, from ideal toworst-case placement of the 15-EEG-electrode setup with and with-out electrical contact to the tissue simulating liquid; a maximum at-tenuation of the psSAR1g/10g of less than 14% at 900 MHz (max.in B3-configuration) and less than 17% at 2140 MHz (max. in B4-configuration) was observed, compared to the psSAR1g/10g at thesame location in the reference measurement without electrodes. Theorder of attenuation is well within the range of recent numerical esti-mations [97, 98] and measurement results [90].
The localized hotspot around the electrode positions increases thepsSAR1g by up to 90% in the B3-configuration with realistic worst-case lead alignment, but does not significantly affect the psSAR10g.These results are in agreement with the cited simulation studies. How-ever, none of the attached electrodes was located directly on the nat-ural hotspot of the SAM head (see Fig. 5).
10.4.4 Setup D: Anatomical model Ella
An overview on the simulation results with Ella (Setup D) can beseen in Figure 6 and is summarized in Table 1. The EEG electrodeaffects the psSAR10g of the whole head by less than 10% due tothe very localized field enhancement. The peak temperature increase(p∆T) is 0.22 – 0.24 °C without and 0.26 – 0.31 °C (+15%/+30%at 900/2140 MHz) with the electrode attached, with an applied an-tenna input power corresponding to 2 W/kg psSAR10g without theelectrode. Steady state is reached after about 20 min (Fig. 7A).
For the worst-case configuration, i.e., monopole configuration witha resonant lead length of λ/4 or 80 mm and normal orientation to thesurface (Fig. 1D), a temperature increase in the superficial skin layerof 3.5 °C and in the brain of 0.3 °C were estimated. This emphasizesthe need to align the leads carefully with respect to the incident fields.If optimal alignment is not possible, e.g., in circularly polarized fields[76], specific measures should be taken, e.g., addition of absorbingmaterial or selection of off-resonance lead lengths.

138 CHAPTER 10. EEG ELECTRODES
900
MH
z
DASY MeasurementsSimulationWith electrodes Without electrodes DeviationWith electrodes
electrode positions
2140
MH
z
-15 -12 -9 -6 -3 0dB
0.005 0.018 0.073 0.29 1.16 4.6W/kg
dB -6 -3 0 +3 +6factor
0.25 0.75 1 2 4
A B C
HE
k
Figure 10.5: SAR simulations and measurements on the specific an-thropomorphic mannequin (SAM) surface with and without attachedelectrodes at two RF frequencies (900 and 2140 MHz). Leads in typ-ical configuration and electrodes electrically connected to the tissuesimulating liquid (B2-configuration). The field is enhanced at theedges of the EEG electrodes, aligned with the incident E-field polar-ization. View from inside the SAM head, lateral exposure from left,eyes/nose on the right side of the graphs. A+B: 0 dB corresponds to4.6 W/kg. C: The local SAR deviation caused by the electrodes stayswithin ±6 dB (factor 4) in the DASY5/NEO (SPEAG) measurements.

10.4. RESULTS 139
psSAR10g psSAR1g psSAR10mg p∆T p∆Twhole head whole head whole head whole head brain
900 MHz [W/kg] [W/kg] [W/kg] [K] [K]w/o electrode 2 2.4 17.4 0.24 0.096with electrode 2.02 2.52 36.8 0.31 0.097
difference 1% 5% 111% 30% < 1%2140 MHz
w/o electrode 2 2.86 10.6 0.22 0.072with electrode 2.19 3.72 32.1 0.26 0.074
difference 9% 30% 202% 15% 2%
900 MHz NR1 [W/kg] [W/kg] [W/kg] [K] [K]with electrode 13.9 57.4 452 3.5 0.31
difference 595% 2390% 2490% 1460% 225%
1Non-realistic worst case lead alignment with resonant length
Table 10.1: SAR levels and maximum temperature increases in Ellawith and without an EEG electrode at the SAR hotspot location.Values evaluated without the ear.
0
-6
-12
-18
-24
-30
2
0.5
0.13
0.03
0.008
0.002
200
50
13
3.2
0.8
0.2
0.30
0.24
0.18
0.12
0.06
0.00
°C
sSAR10g SARSAR
2140 MHz0dB = 2 W/kg
900 MHz0dB = 2 W/kg
Electrode positions Brain (grey matter) boundary
0.24 °C
0.26 °C
0.31 °C
0.22 °C
900 MHz0dB = 200 W/kg
900 MHz0dB = 200 W/kg
2140 MHz0dB = 200 W/kg
2140 MHz0dB = 200 W/kg
dB W/kg
Temperature increase
Figure 10.6: SAR and thermal simulation of Ella with and withouta single electrode attached near the psSAR10g location for 900 and2140 MHz. Exposure level was normalized to psSAR10g of 2 W/kg(without ear, location indicated with red square), unilateral exposurewith planar patch antennas.

140 CHAPTER 10. EEG ELECTRODES
10.4.5 Translation of RF pulses to ∆T ripples
Many of the modern digital communication systems generate signalemissions with low frequency power variations and relative large peak-to-average ratios (PAR). The time-division multiple access system(TDMA) GSM emits signals with pulses of width 0.57 ms at a ba-sic repetition rate of 217 Hz and a PAR of 8.32. As CW exposuredoes not enhance EEG spectral power [81, 85], the obvious questionis whether the resulting thermal pulsing/expansion, i.e., hypothesis 3,could explain the differences.
The simulation results for the thermal ripples were estimated withthe human head model (Setup D) and are shown in Figure 7B. Theripple of GSM is much less than 0.001 °C. Even for pulses with aPAR of 50 and a slow repetition rate of 10 Hz (leading to 100 W/kgpsSAR10g pulses of 2 ms length), the temperature ripples would beless than 0.004 °C with attached EEG electrodes and 0.001 °C with-out electrodes. This is less than 2% of the steady-state temperatureincrease for both cases (Fig. 7B). In the most aggressive modulationfunction applied in the human provocation studies cited above, a PARof 32 with 14 Hz repetition rate (64 W/kg psSAR10g pulses for 2.2 ms)was used [65].
10.4.6 Uncertainty Analysis
The uncertainty analysis for the dosimetry study (Setup D) was eval-uated according to the concept elaborated by the National Institute ofStandards and Technology (NIST) TN1297 [41], and is summarizedin Table 2. The uncertainties for psSAR10g/1g remain below 10%(SD, k = 1). The RF-induced peak temperature increase is subjectedto the non-correlated uncertainties of (1) SAR, (2) simulation con-vergence, (3) thermal model discretization, (4) thermal conductivity,(5) boundary conditions, (6) blood heat capacity, and (7) volumetricblood perfusion. The tissue heat capacity has no influence on thep∆T values attained, and the metabolic heat generation in thermalincrease simulations is assumed to be in thermal equilibrium. Thetotal temperature increase uncertainty is less than 30% (SD, k = 1),in agreement with [39] (31%).

10.4. RESULTS 141
Exposure time (min)
Tran
sien
t p∆
T (°
C)
Tran
sien
t p∆
T (°
C)
0 5 10 15 20 25 30
with electrodewithout electrodenon-realisticworstcase electrode
Pulsemodulated exposureHead / Brain
with electrodewithout electrode
0.60
0.55
0.50
0.45
0.40
0.35
0.30
0.25
0.20
0.15
0.10
0.05
0.00
A
Exposure time (ms) 0 50 100 150 200
0.314
0.312
0.310
0.308
0.306
0.234
0.232
0.230
0.228
0.226
B
CW (PAR=1) PAR = 50 10 Hz 2 ms pulsewidth PAR = 8.3 217 Hz 0.57 ms pulsewidth
modulationenvelopes
Figure 10.7: A: Transient peak temperature increase in the wholehead and in the brain for exposure with psSAR10g = 2 W/kg at900 MHz. B: Temperature ripple of pulse-modulated RF exposurewith different peak-to-average ratios (PAR) and pulse repetition rates.Signal (2) represents a worst-case modulation envelope, signal (3) themain component of a typical GSM modulation.

142 CHAPTER 10. EEG ELECTRODES
A. EM Simulation Uncertainty
Parameter Range psSAR10g/1gConvergence Simulation length: + 100% 0.9%Model discretization Voxel size: 0.3 mm, 2 mm 1.9%Dielectric conductivity σ: ± 10% 3.9%Dielectric permittivity ε: ± 10% 1.9%Density r: ± 10%, in single tissue 5.8%RSS: Local SAR uncertainty 7.5%
B. Thermal Simulation Uncertainty
Parameter Range p∆TLocal SAR uncertainty from (A) 7.5%Convergence Simulation length and time step 1.2%Model discretization Voxel size: 0.3 mm, 2 mm 4.8%Thermal conductivity κ: ± 20% 5.7%Thermal boundary cond. h: ± 50% 3.1%Blood heat capacity %b · cb: ± 10% 3.7%Basal (constant) perfusion B0: ± 50% (all tissues) 26.6%RSS: Peak temperature increase uncertainty 29.1%
Table 10.2: Standard combined uncertainties for the numerical eval-uations in Ella (Setup D). Stated uncertainty values are standarddeviations (k = 1) in the assumed normal probability distribution.As they are uncorrelated, they can be combined by root-sum-square(RSS) procedures.

10.4. RESULTS 143
10.4.7 Discussion and Conclusion
We have shown that the fields induced in the brain are increasedby less than 20% for the psSAR10g, by less than 90% for psSAR1g,and by less than 210% for psSAR10mg when the recording system isattached to the numerical head model compared to the same exposureswithout the recording system. The subsequent temperature increasesin brain tissues remain below 0.1 °C (+2%). These simulation resultscontradict hypothesis 1, that the reported effects are a result of thefield enhancements caused by the presence of the electrodes and wouldnot be observed without the EEG recording system attached.
The maximum realistic temperature increase below the electrodewas 0.31 °C with electrodes, compared to 0.24 °C without electrodes,an increase of ca. 30%. It should also be noted that, in studies wherethe electrodes were attached only after exposure, effects comparableto those from studies with electrodes attached during exposure wereobserved [68]. Thus, the reported effects are unlikely to be caused bythe induced fields and subsequent heating at the tip of the electrodespredicted by hypothesis 2. The use of custom-made high-impedanceleads that are nearly RF transparent in place of the metal leads wouldfurther reduce the small induced fields effects and also give more free-dom regarding orientation of the leads with respect to the incidentfield polarization [100].
The thermal ripple caused by the GSM modulation is very small(�0.001 °C) and, therefore, offers no support for hypothesis 3, thatthe reported changes in the EEG spectral power are a result of thethermal pulsing in the brain.
Therefore, the interaction mechanism between pulse-modulatedRF and changes in the EEG power spectrum remains unknown, andfuture exploration of putative mechanism requires innovative basic re-search and new approaches. Potential mediators of RF interactionsproposed include oscillatory brain activity caused by sensory percep-tion of RF and non-synaptic or ephaptic coupling of cortical neurons[76].


Chapter 11
Stimulation of the brainwith radiofrequencyelectromagnetic fieldpulses affectssleep-dependentperformanceimprovement
11.1 Abstract
1Background: Sleep-dependent performance improvements seemto be closely related to sleep spindles (12–15 Hz) and sleep slow-waveactivity (SWA, 0.75–4.5 Hz). Pulse-modulated radiofrequency elec-tromagnetic fields (RF EMF, carrier frequency 900 MHz) are capable
1This Chapter has been published in [76].
145

146 CHAPTER 11. EMF BRAIN STIMULATION
to modulate these electroencephalographic (EEG) characteristics ofsleep.
Objective: The aim of our study was to explore possible mech-anisms how RF EMF affect cortical activity during sleep and to testwhether such effects on cortical activity during sleep interact withsleep- dependent performance changes. Methods: Sixteen male sub-jects underwent 2 experimental nights, one of them with all-night0.25–0.8 Hz pulsed RF EMF exposure. All-night EEG was recorded.To investigate RF EMF induced changes in overnight performanceimprovement, subjects were trained for both nights on a motor taskin the evening and the morning.
Results: We obtained good sleep quality in all subjects underboth conditions (mean sleep efficiency > 90%). After pulsed RFEMF we found increased SWA during exposure to pulse-modulatedRF EMF compared to sham exposure (P < 0.05) toward the end ofthe sleep period. Spindle activity was not affected. Moreover, sub-jects showed an increased RF EMF burst-related response in the SWArange, indicated by an increase in event-related EEG spectral powerand phase changes in the SWA range. Notably, during exposure, sleep-dependent performance improvement in the motor sequence task wasreduced compared to the sham condition (-20.1%, P = 0.03).
Conclusion: The changes in the time course of SWA during theexposure night may reflect an interaction of RF EMF with the renor-malization of cortical excitability during sleep, with a negative impacton sleep-dependent performance improvement.
11.2 Introduction
Large public and occupational populations are exposed to radiofre-quency electromagnetic fields (RF EMF) as those emitted by mo-bile phones. Since these fields are mainly absorbed by the head, nu-merous studies investigated the effect of RF EMF exposure on brainphysiology. Indeed, several studies consistently showed that RF EMFcan alter brain activity. For example, studies focusing on electroen-cephalographical (EEG) spectral power showed that pulse-modulatedRF EMF exposure increased power in the alpha and spindle frequencyrange (7.5–14.5 Hz) during non-rapid eye movement (NREM) sleep

11.2. INTRODUCTION 147
[79, 80, 68, 82, 66, 65]. Recently, also an increase of delta power(<4.5 Hz) was observed [66]. Similarly, exposure during wakeful-ness increased alpha power in the spontaneous waking EEG (8–12 Hz,[102, 81, 103]). The crucial factor for these effects is the extremelylow-frequency (<300 Hz) pulse modulation of the RF EMF, since ex-posure to the RF carrier frequency alone had no effect [102, 81]. Thus,RF EMF pulses affect brain activity but do they also have an impacton daily performance? Indeed, though not very consistently, studiesfound performance changes after or during pulsed RF EMF exposure[104]. All of these studies investigated the effects of RF EMF exposureduring wakefulness on performance. Since various studies support acrucial role of sleep in memory and learning processes (for a review seeRef. [105]) the question arises whether the RF EMF induced changesof brain activity during sleep may interact with these processes. In-terestingly, the beneficial effects of sleep on post-sleep performancein specific learning tasks are closely related to sleep spindles (e.g.,[106, 107]) and to sleep slow-wave activity (SWA, EEG power between0.75 and 4.5 Hz; (e.g., [108, 109, 110]).
Since we have profound knowledge about how sleep spindles andslow waves are generated and regulated, we took advantage of thisknowledge to study changes in brain activity during sleep. Slow wavesare the main characteristic of deep sleep and visible as high-amplitude,low-frequency oscillations in the EEG [111]. They have a corticalorigin and are closely related to the homeostatic regulation of sleep[112]. Thus, as sleep pressure dissipates in the course of a sleep periodalso SWA decreases [112]. Sleep spindles are generated by the tha-lamocortical system [113, 114] and can be observed across the scalp(i.e., in different surface EEG derivations placed all over the scalp).Both sleep rhythms are involved in learning and memory processesand may be manipulated by pulsed RF EMF. We took advantageof these observations and aimed at 1) exploring possible mechanismshow pulsed RF EMF may affect cortical activity during sleep and 2)whether these effects on cortical activity during sleep interact withsleep-dependent performance changes. To do so, in our experimenteach subject was exposed to RF EMF pulses during the sleep episodein one of 2 experimental nights. Our intermittent pulse modulationdesign of the RF EMF allowed us to investigate whether single RFEMF bursts directly evoke EEG responses during sleep. We further

148 CHAPTER 11. EMF BRAIN STIMULATION
investigated whether pulsemodulated RF EMF during sleep interactwith the reported sleep- dependent performance improvement in awell-characterized motor sequence learning task (e.g., [115]).
11.3 Materials and methods
11.3.1 Subjects
Sixteen healthy male subjects (18–21 years, 19.9 ± 0.2, mean ± SEM)participated and completed the study. The number of subjects waschosen based on previous studies that also investigated the effectsof pulsed RF EMF and showed significant changes in spectral powerin the sleep EEG (e.g., 1, 4, 8). Only male subjects were includedsince in female subjects spindle activity varied systematically acrossthe menstrual cycle [116]. Participants underwent a telephone andquestionnaire screening to exclude personal or family history of psy-chopathology, chronic diseases, sleep disorders, and current use ofpsychoactive agents or other medications. No subject traveled acrossmore than 1 time zone 2 months before the start of the study. Sub-jects were right handed, non-smokers, free of sleep complaints, drugs,medication and were moderate mobile phone user (use < 2 h/week,44.1 ± 9.0 min). They had to adhere to regular bedtimes (8 h time inbed, according to scheduled bedtime in the lab) 1 week before the ex-perimental nights and abstain from caffeine, naps, and alcohol 3 daysprior to the study nights. Compliance was controlled by breath al-cohol test, wrist-worn actometers and sleep logs. During the day ofthe study night, physical exercise and the use of mobile phones wereprohibited. The Cantonal Ethic Commission in Zurich (Switzerland)approved the study and written informed consent was obtained fromall participants.
11.3.2 Procedure
In a randomized, double-blind, crossover design, each subject had2 experimental nights with EEG recordings, one of them with all-night pulse-modulated RF EMF exposure (field study). An adapta-tion night was scheduled prior to each experimental night. Time in

11.3. MATERIALS AND METHODS 149
bed was 8 h for all subjects and all nights. Bedtimes were adjusted tothe subject’s preference and ranged from 22:00–24:00 to 06:00–08:00.For both experimental nights, subjects were trained on a motor se-quence tapping task in the evening right before they went to bed. Inthe morning they were retested on the task to assess sleep-dependentperformance improvement (e.g., [115]).
11.3.3 Exposure setup
540
415
55°35°
3dB beamwidth
3dB beam
width
Head positionvariation area
Absorber
Mattress
Absorber
Box
900 MHz antenna
IR camera
Figure 11.1: Schematic view of the exposure setup, with the Dukephantom in the reference position (lying on the back) and the circu-lar polarized patch antenna pointing towards his forehead. A metalshielding box is protecting the EEG amplifier against electromagneticinterference, and absorbers prevent undesired reflections. The infra-red camera was electrically shielded as well.
During the whole sleep episode, the subject’s head was exposedto RF EMF using a circular-polarized antenna facing down towardthe volunteer’s forehead (see Fig. 11.1 and in Chapter 11.6 for detailsabout the exposure setup). The 900 MHz RF signal was pulsed, with7 consecutive 7.1 ms pulses forming one 500 ms burst. These 500 ms

150 CHAPTER 11. EMF BRAIN STIMULATION
bursts were repeated every 4 s (Intermittent-1 phase, 0.25 Hz, cor-responding approximately to occurrence of sleep spindles), and every1.25 s (Intermittent-2 phase, 0.8 Hz, corresponding approximatelyto frequency of slow oscillations), respectively. Exposure of 5 minIntermittent-1 was followed by 1 min with no exposure (OFF phase),then 5 min Intermittent-2 was followed by a 7 min OFF phase. This18 min sequence was repeated throughout the night. The peak spa-tial specific absorption rate averaged over any 10 g tissue (psSAR10g) during the 7.1 ms pulses was set to 10 W/kg. This resulted in aburst average of 1.0 W/kg. The whole night psSAR10 g averaged to0.15 W/kg. A detailed description of the exposure setup and the dosi-metric exposure assessment is given in the Supplementary material.
11.3.4 EEG recordings
EEG channels (10–20-system, F3, F4, C3, C4, P3, P4, O1, O2, A1,A2, referenced to vertex Cz), submental electromyogram (EMG) andvertical electrooculogram (EOG) were continuously recorded duringthe 8-h nighttime sleep period. The signals were recorded with a poly-graphic amplifier Artisan (Micromed, Mogliano, Veneto, Italy), digi-tized at 1024 Hz (0.16–270 Hz) and transmitted via fiber- optic cablesto a computer, running the software REMbrandt DataLab (Version8.0; Embla Systems, Broomfield, CO, USA). The EEG signals werere-referenced to the mastoids (A1, A2) and filtered (0.5 Hz high-passfilter and 50 Hz low-pass filter). The sleep stages were scored for 20-sepochs according to standard criteria [117]. Artefacts were identi-fied on a 20-s basis by visual inspection and with a semi-automaticprocedure [80].
During sleep we undergo a characteristic sequence of NREM andrapid eye movement (REM) sleep with a period of approximately90e100 min. This cyclic alternation of NREM and REM sleep is abasic feature of sleep. NREM and REM sleep episodes were definedaccording to standard criteria and adapted when skipped REM sleepepisodes were observed (6 of 32 nights, 4 subjects). In this case, wesubdivided the first cycle manually. The first 4 NREM and REM sleepepisodes were analyzed. All participants had at least 4 NREM andREM sleep episodes. In each subject, the minimal common numberof 20-s epochs in the 2 conditions was analyzed in each NREM and
11.3. MATERIALS AND METHODS 151
REM sleep episode.
11.3.5 Spectral analysis
Spectral power of consecutive 20-s epochs was computed using a FastFourier routine (Hanning window, average of five 4 s epochs, fre-quency resolution 0.25 Hz). We used the C4A1 referential derivationfor spectral analysis and for event-related responses because previ-ous studies mainly found RF EMF induced effects in sleep EEG overcentral derivations (e.g., [79, 66, 65]). Frequencies between 0.75 and15 Hz were analyzed. SWA was calculated as the spectral EEG powerbetween 0.75 and 4.5 Hz. The initial REM sleep episode was only con-sidered for analysis, when at least 3 min REM sleep occurred (n = 10).The relative decrease of SWA across night was defined as the SWAdifference between the NREM episode expressing the maximal SWAand the NREM episode expressing the minimal SWA (episode numberaverage: sham, 3.68; field, 3.5; Wilcoxon signed rank P > 0.5) rela-tive to the episode with maximal SWA (sham, 1; field, 1.06; Wilcoxonsigned rank P > 0.5).
11.3.6 Event-related spectral power (ERSP) andinter-trial coherence (ITC)
ERSP and ITC are methods of time-frequency analysis classically usedto assess power (ERSP) and phase (ITC) changes across single trialstime-locked to experimental events [118]. Synchronization in specificfrequency bands indicates an induced activity due to an event (e.g.,[119]). To establish how our specific RF EMF bursts lead to changesin EEG spectral power we performed ERSP and ITC in the NREMepisode and frequency range that was significantly affected by expo-sure. We therefore compared ERSP and ITC of sham bursts and realIntermittent-1 phase bursts using the EEGLAB toolbox [118]. Fur-thermore, ERSP and ITC were calculated for the first and the secondhalf of bursts within the significantly affected NREM sleep episodeto assess the time course of the effect. Only the Intermittent-1 phasebursts provided enough data (4 s between bursts) to perform this anal-ysis. For both conditions, only bursts during artifact-free epochs of

152 CHAPTER 11. EMF BRAIN STIMULATION
the 4th NREM sleep episode were included in the analysis (referentialderivation C4A1).
ERSP is an analysis that calculates the EEG power spectrum(short-time Fourier transform using 185 Hanning windows of 1024data points (1 s)) time-locked to the RF EMF bursts. This timecourse of EEG power is next averaged across all RF EMF bursts[118, 120]. ITC, also termed “phase-locking factor” [121], quantifiesthe phase consistency of activity in a specific frequency range acrosssingle trials time-locked to a stimulus, i.e., the RF EMF bursts. Thus,the higher the ITC value the higher is the synchronization betweenEEG data and the time-locking RF EMF bursts (i.e., EEG phase re-producibility across trials at a given latency; [118, 122]). We used thesame window parameters as for the ERSP analysis.
The EEG signal was band pass-filtered (0.5e5 Hz). Thereafter,the ERSP and ITC were calculated for the first 3500 ms after thebursts for the frequency range between 1 and 4 Hz (1-Hz resolution).Only artifact-free trials were included. Since we could not use a pre-event baseline (baseline was affected by bursts itself), we comparedthe ERSP and ITC between RF EMF bursts and sham bursts (triggersignal at similar time points as RF EMF bursts during the sham night)to asses RF EMF induced power and phase-locking changes.
11.3.7 Motor performance
A finger sequence tapping task before and after sleep was performedto assess motor performance. This task was adapted from Walker etal. [115]. Parallel versions were used in a balanced and randomizedorder for the 2 experimental sessions. This task required subjectsto repeatedly complete, with their left hand, a five-element sequence(sequence 4–3–2–1–4 or 2–3–1–4–2; 1 is the digit finger) as fast andaccurately as possible on a keyboard.
The training before sleep consisted of twelve 30-s trials with 30-sbreaks between the trials. During retest they performed 3 30-s trialsinterspersed with 30-s breaks. The sequence was continuously pre-sented on the screen to prevent a working memory component and nofeedback on pressing keys or about their performance was given. Akeyboard (DirectIN keyboard, Empirisoft, New York) with a millisec-ond accuracy to measure response times (RT) between key-presses

11.3. MATERIALS AND METHODS 153
was used. Performance improvement in motor tasks are reflected inan increase of speed and a decrease of variability. Earlier studiesexclusively investigated speed (as assessed by number of correct key-presses per time or mean RT) to investigate the consolidating roleof sleep on performance (e.g., [115]). However, more recent stud-ies question this sleep-dependent improvement in speed because it isalso seen after 5 min wake and may depend on a decrease in fatigue[123, 124]. We therefore focused on the variability of the RT betweenkey-presses to assess sleep-dependent performance improvement sincethere is evidence that sleep might reduce variability in a motor task[110]. Moreover, such a decrease of variability due to sleep in a visuo-motor adaptation task seems to be closely related to sleep SWA [110].This study further showed that additional learning after a trainingsession did not improve variability, but a night of sleep did. We cal-culated the variance of RT to assess variability between the correctkey-presses for each trial. Post-training performance was defined asthe mean of the last 2 trials in the training session and retrieval per-formance as the mean of the first 2 trials during retest according toliterature (e.g., [115]). Sleep-dependent performance improvement ofvariability was specified by the relative difference between the eveningpost-training and morning retrieval performance (%, [(retrieval per-formance - post-training performance)/ post-training performance]).
To exclude possible confounding effects on performance we com-pared different subjective measures for both conditions. To do so,prior to each motor learning task subjects were asked about theiralertness and mood (assessed by a 6 item visual analog scale) andin the morning subjective sleep quality was assessed by a question-naire. Subjects’ answers did not differ between the conditions (all P> 0.15). Subjects did not perceive the field since their answers werebelow chance level.
11.3.8 Statistics
Spectral power changes were analyzed using 2-way repeated- mea-sures ANOVA with the 2 within subject factors ‘condition’ (field vs.sham) and ‘sleep episode’ (1st–4th NREM sleep episode). AbsoluteEEG spectral power data was log transformed prior to testing to ap-proximate normal distribution. To quantify differences in the SWA

154 CHAPTER 11. EMF BRAIN STIMULATION
time course between field and sham condition post hoc 2-tailed pairedt-test were applied.
The difference in the ERSP and ITC in the SWA range betweenthe field exposure and sham night was obtained using 2-tailed paired t-tests for each time point after the pulse. Sleep-dependent performanceimprovement difference between the 2 conditions was analyzed with arepeated-measures analysis of covariance (ANCOVA) with the factorcondition (field vs. sham) covarying for post-training performancedifference (baseline difference). Correlations of performance and SWAwere obtained using Pearson correlation.
11.4 Results
11.4.1 Minor effects of RF EMF exposure on sleeparchitecture
In a first step, we quantified the RF EMF effects on sleep architecture(see Table 11.1). Only minor changes were observed. Subjects duringexposure showed a 2.1% decrease of total sleep time (-9.23 ± 3.40 min,mean ± SEM; t = -2.31, P = 0.04) and, as a consequence, exhibitedreduced sleep efficiency (-1.92 ± 0.83%; t = -2.31, P = 0.04). Thisreduction was primarily due to an increase of wake after sleep onset(6.63 ± 2.60 min; t = 2.55, P = 0.03). NREM and REM sleep episodeduration did not differ between the 2 conditions (all P > 0.1).
11.4.2 RF EMF changed EEG spectral power dur-ing NREM sleep
Field exposure induced an NREM sleep episode specific increase inspectral power in the low-frequency range. Frequencies up to 10 Hzwere affected by exposure (Fig. 11.2). Looking at the relative change(% increase), the strongest effects were observed in the SWA frequencyrange. Thus, for further analysis we focused on SWA since it also re-flects the major characteristic of deep NREM sleep, which was shownto be related to sleep-dependent performance changes [109, 110, 125].Characteristically, SWA decreases in the course of sleep, reflectingthe recuperative function of sleep [112]. To assess changes in the

11.4. RESULTS 155
ConditionSleep variables Sham Field
Total Sleep Time (min) 448.4 ± 2.7 439.2 ± 4.9*Sleep latency (min) 9.0 ± 1.3 9.2 ± 1.5Wake after Sleep onset (min) 7.0 ± 1.1 13.6 ± 1.1*Sleep efficiency (%) 93.4 ± 0.6 91.5 ± 1.0*Stage 1 (min) 18.7 ± 2.2 21.0 ± 3.5Stage 2 (min) 170.2 ± 8.1 171.0 ± 7.8Stage 3 (min) 161.3 ± 9.0 154.9 ± 8.3REM sleep (min) 116.9 ± 4.0 113.0 ± 4.8
Table 11.1: Values in mean ±SEM. REM sleep: Rapid eye movementsleep. Total sleep time: total amount of NREM (Stage 2 and Stage 3)and REM sleep. Sleep latency: latency to the first occurrence of stage2 sleep. Sleep efficiency: Total sleep time expressed as a percentageof time in bed (8 h). Paired t-tests revealed significant differences asindicated by stars (p < 0.05). Field: exposure to intermittent burstsof RF EMF. Sham: no field applied.
time course of SWA, we calculated average SWA in each NREM sleepepisode. During both conditions SWA decreased in the course of thenight. However, we found higher SWA in the 4th NREM sleep episodecompared to the sham exposure (P < 0.05, Fig. 11.3) and thus, thedecrease of SWA from the 1st to the 4th NREM sleep episode tendedto be less pronounced during exposure (P = 0.07). No other NREMor REM sleep episodes revealed significant differences between theconditions (all P > 0.25).
11.4.3 Induction of SWA by pulsed RF EMF
Given this SWA enhancement toward the end of sleep, we further an-alyzed the EEG of the 4th NREM sleep episode during exposure totest whether single RF EMF bursts may lead to an event-related re-sponse in the SWA range. Thus, we investigated whether the increasein SWA is related to phase-locking, i.e., reflected in ITC, or amplitudechanges, i.e., reflected in ERSP. RF EMF bursts increased ERSP inthe SWA frequency range for several time points in the inter-burst in-

156 CHAPTER 11. EMF BRAIN STIMULATION
Frequency (Hz)
EE
G s
pect
ral p
ower
(fie
ld %
of
sham
)
0 1 2 3 4 5 6 7 8 9 10 11 12 13 14 15
180
160
140
120
100
80 eps x condcondeps
Episode 1Episode 2Episode 3Episode 4
AN
OVA
NREM sleep
Figure 11.2: EEG power density of the field night as a percentageof the sham night (100%, solid black horizontal line) for the first4 NREM sleep episodes (mean + SEM). Frequencies were analyzedbetween 0.75 and 15 Hz (0.25 Hz resolution). Lower panel of the figureshows results of the 2-way repeated-measures ANOVA (episode [eps]:1st–4th NREM episode; condition [cond]: field vs. sham and theirinteraction [eps × cond]). Filled black symbols in the lower panelindicate significance (P < 0.05) and open symbols trends (P < 0.1).Vertical gray dashed line delineates the end of the SWA range (0.75–4.5 Hz). Post hoc paired t-test revealed significant differences in theSWA range bins only for the 4th NREM sleep episode.

11.4. RESULTS 157
Time after lights off (min)
SW
A (f
ield
% o
f sh
am)
0 50 100 150 200 250 300 350
170
160
150
140
130
120
110
100
90
80
NREM episodeREM episode
Figure 11.3: Time course of slow-wave activity (SWA; 0.75–4.5 Hz)during RF EMF exposure as a percentage of the corresponding shamcondition for the first 4 NREM and REM sleep episodes (n = 16,mean ± SEM). Black and gray triangles indicate NREM and REMsleep episodes, respectively. Gray vertical lines delineate the averagebeginning and end of NREM and REM sleep episodes. The first REMsleep episode includes data of 10 subjects only. The star indicatesa significant difference between sham and field exposure (P < 0.05,paired t-test).

158 CHAPTER 11. EMF BRAIN STIMULATION
terval mainly for the first half of the bursts (Fig. 11.4A). In addition,we found that RF EMF bursts increased phase-locking of the EEGsignal in the SWA frequency range at around 2300–2500 ms after theburst both, in the first and second half of the bursts (Fig. 11.4B).These findings suggest an RF EMF burst-related increased phase-locking and synchronization in the SWA range in specific time win-dows after the RF EMF bursts and therefore indicate an induction ofSWA due to pulsed RF EMF exposure. SWA in NREM sleep episodes1–3 did not show a significant increase in ERSP and ITC after RFEMF bursts.
11.4.4 RF EMF exposure affected sleep-dependentmotor performance improvement
Subjects significantly improved their performance quality, as assessedby the reduced variance of the RT, from evening to morning duringsham (49.04± 6.40% reduction, P< 0.05) and exposure (28.97± 10.69%,P < 0.02). The baseline values in the evening did not differ betweenthe field and sham condition (field: 24,270.3 ms ± 7166.9 ms; sham:23,581.8 ms ± 6414.3 ms; P > 0.8). Thus, learning was comparablebetween the 2 conditions. However, sleep-dependent performance im-provement was reduced during exposure compared to the sham condi-tion (-20.08 ± 10.57%, Greenhouse–Geisser F = 5.76, P = 0.03). In anext step, we explored the relationship between the recuperative func-tion of sleep, as measured by the decrease of SWA across the night, andsleep-dependent performance improvement. We found a positive cor-relation between the sleep-dependent performance improvement (vari-ance of RT) and the decrease of SWA during the sham night (r = 0.63,P < 0.01). No significant correlation was present during the exposurenight (r = 0.27, P > 0.3). To test whether the increased SWA inthe 4th NREM sleep episode observed under field exposure might berelated to the reduced sleep-dependent performance improvement wecorrelated SWA in the 4th NREM sleep episode with post-sleep perfor-mance improvement. This analysis showed that indeed higher SWA inthe 4th NREM sleep episode was related to a reduced sleep-dependentperformance improvement in RT variance (r = -0.59, P = 0.02) in thesham condition. Again, no significant correlation was observed forthe active field condition (r = -0.21, P > 0.4). Moreover, we found

11.4. RESULTS 159
Time after event (ms)
ER
SP
(dB
)
p-va
lue
0 500 1000 1500 2000 2500 3000
Time after event (ms) 0 500 1000 1500 2000 2500 3000
8
6
4
2
0
-2
0.00
0.05
0.10
p-va
lue0.00
0.05
0.10
ITC
(arb
itrar
y un
it)
0.3
0.2
0.1
0.0
-0.1
-0.2
-0.3
RF
EM
F/S
HA
M B
UR
ST
RF
EM
F/S
HA
M B
UR
ST
A
B
Figure 11.4: Event-related responses (ERSP and ITC) in the SWA fre-quency range during exposure compared to sham in the 4th NREMsleep episode. ‘Event’ indicates RF EMF bursts (field) or a corre-sponding trigger burst during the sham condition. Horizontal linesindicate the mean event-related response differences between the fieldand sham condition in the SWA frequency range (1–4 Hz) for thefirst half (black line) and second half of the bursts (gray line). Errorbars indicate SEM of the first half of the bursts. Bars in the lower(statistic) panels illustrate P-values (≤0.1, black: first half of bursts,gray: second half of bursts). (A) Time course of the event-relatedspectral power (ERSP) after RF EMF bursts relative to sham bursts.(B) Time course of the inter-trial coherence (ITC, phase-locking) afterRF EMF bursts relative to sham bursts.

160 CHAPTER 11. EMF BRAIN STIMULATION
a trend that a larger increase of SWA from sham to field conditionin the 4th NREM sleep episode was reflected in a larger reduction ofsleep-dependent performance improvement from the sham to the fieldcondition (r = 0.47, P = 0.07).
11.5 Discussion
In this study, we showed that very-low-frequency pulse- modulated RFEMF exposure resulted in increased SWA towards the end of the sleepperiod and reduced sleep-dependent motor performance improvement.Furthermore, we provide first evidence that the increased SWA resultsfrom a direct induction of sleep slow waves by RF EMF pulses.
Our data support the notion that changes in EEG activity duringsleep due to RF EMF exposure are among the most robust effectsEMF have on biological systems [95]. RF EMF exposure resultedin increased SWA compared to the sham condition. However, mostprevious studies reported effects in the spindle frequency range [79,80, 68, 82, 66, 65]. A possible explanation comes from a dose responsestudy showing that pulsed RF EMF with average SAR levels equalor lower than 0.2 W/kg were not sufficient to significantly increasespindle activity in the sleep EEG [82], whereas exposure at SAR levelsequal or above 1 W/kg showed a significant increase (e.g., 1, 4). Ouraverage all-night SAR value was 0.15 W/kg, and the relevant 6 minaverage never exceeded 0.34 W/kg, and therefore, might be below theintensity that would lead to a significant increase in spindle activity.A recent study showing increased SWA during NREM sleep after 2-Hz pulse-modulated RF EMF exposure suggests that a prominent orprincipal pulse modulation in the delta range (<5 Hz) of the RF EMFmight be needed to induce an increase in SWA during sleep [66]. Ourbursts were presented in this low- frequency range (0.25/0.8 Hz).
We provide first evidence that single RF EMF bursts may affectsleep EEG activity by induction of SWA. However, potential mecha-nisms explaining how these fields may induce SWA are so far unknown.Using a special intermittent pulse modulation design of the RF EMFexposure we demonstrated that single RF EMF bursts may directlychange EEG activity in the SWA range. This was demonstrated bythe increased ERSP and by the increased phase coherence (ITC) in

11.5. DISCUSSION 161
the SWA range after the RF EMF bursts. The results show that theeffect in ERSP is most pronounced during the first half of the burstsand that significant effects in the ERSP and ITC are seen particularlyduring early time points during the inter-burst interval. We do seealso late ERSP and ITC changes for which we have no good explana-tion. Our results suggest that RF EMF may be capable to directlyinduce or entrain EEG activity during sleep.
The question arises why the SWA increase was only significanttoward the end of sleep. There is evidence that applied weak electricalfields can entrain spiking activity of neurons and synchronize them[126]. Thus our RF EMF may also entrain and synchronize neuronalactivity in the SWA range. We have good evidence that the level ofneuronal synchronization is a key feature determining the amplitudeof slow waves, i.e., the level of SWA [127]. Thus, an entrainment ofongoing activity by field expo- sure may rely on a similar mechanisticexplanation for the changes in SWA. At the beginning of the sleepperiod, neurons are almost perfectly synchronized, which is reflectedin high values of SWA [128]. Thus, it seems to be plausible that at thebeginning of sleep a weak RF EMF may not be able to further enhancesynchronization of neural activity. However, toward the end of thesleep period the level of synchronization decreases [128] allowing RFEMF to exert their capability to enhance synchronization. A similarexplanation may apply for our observation that increased ERSP in theSWA frequency range is most pronounced in the first half of the bursts.It is established that SWA shows a gradual build up during the initialphase of each NREM sleep episode [129] and as a result average SWAis at a lower level during the first half of the episode. Consideringthat the field may increase neuronal synchronization especially whenSWA is less pronounced, we would expect a stronger effect on ESRPduring this initial phase.
An ultimate cellular mechanism explaining this synchronizationstill remains elusive. Among others, we see 2 candidate mechanisms.First, inducing an event-related brain response may suggest that thereis a receptor or an unknown human sensor that perceives RF EMF andcauses oscillatory brain activity when exposed to such fields [130]. Thesecond candidate mechanism is based on recent findings of Anastassiouet al. [131]. They introduce the concept of non-synaptic or ephapticcoupling of cortical neurons. In other words, EMF develops outside

162 CHAPTER 11. EMF BRAIN STIMULATION
of neurons due to neuronal activity. These fields are not just a mereepiphenomenon of neuronal activity, but rather feedback onto neu-ronal activity. Even though these fields are very weak, they were ableto strongly entrain and synchronize the spike-timing of the neurons.Considering that small changes of these endogenous fields could affectneuronal functioning, further investigations should explore whetherpulse-modulated RF EMF interact with these endogenous fields.
Both candidate mechanisms might lead to changes in SWA as theyare not mutually exclusive. Additional studies are needed to exploresuch fundamental mechanisms for brain functioning. Our study showsthat RF EMF can be used to explore such mechanisms. An interestingexample for the usefulness of RF EMF expo- sure to study brain func-tion is provided by our observation that the induced SWA is relatedto reduced sleep-dependent performance improvement.
Increasing evidence shows that SWA during NREM sleep is crit-ically involved in the regulation of cortical excitability and synapticstrength across 24 h [128, 132]. Thus, during waking cortical ex-citability increases through synaptic potentiation. During sleep a re-duction of synaptic strength takes place, normalizing the increase inexcitability observed during the day [128, 132, 133]. This reductionof synaptic strength is mirrored in SWA [132]. Therefore, the changesin the time course of SWA during the field night may reflect an in-terference of RF EMF with the normalization of cortical excitabilityduring sleep. Consistent with previous research, low- frequency pulse-modulated RF EMF may affect cortical excitability [134]. Followingfield exposure Ferreri et al. [134] found increased intracortical facilita-tion measured with a paired pulse transcranial magnetic stimulationparadigm. This is up to now the most direct evidence that pulse-modulated RF EMF may directly affect cortical plasticity. There isevidence that slow waves might also causally affect and not just reflectsynaptic strength[135]. Thus, the altered time course of SWA mayresult in an imbalance in the regulation of synaptic strength. Therenormalization of synaptic strength during sleep showed beneficialeffects of motor performance [110]. Since sleep-dependent improve-ment of motor performance was reduced under RF EMF exposure,our behavioral data further support the suggestion of an imbalance inthe regulation of synaptic strength. We confirmed this finding sincethe decrease of SWA across the sham night correlated with sleep-

11.6. SUPPLEMENTARY MATERIALS 163
dependent performance improvement. Thus, the more SWA in the4th NREM sleep episode was increased during RF EMF exposurethe more tended sleep-dependent performance improvement to dete-riorate. Taken together, our findings suggest that the interaction ofpulsed RF EMF with the regulation of synaptic strength may explainour behavioral results. We performed a single exposure and thus can-not exclude adaptation effects. As a consequence we can- not stateanything about long-term effects. The large interindividual differ-ences within our well-defined subject population clearly showed thatour results cannot be generalized e other subpopulations may showopposite effects. Further studies are needed to investigate the causeof such large interindividual differences.
In summary, our study showed that RF EMF may directly affectongoing brain activity during sleep, and as a consequence alter sleep-dependent performance improvement. RF EMF may there- fore rep-resent a non-invasive stimulation tool that is not consciously perceivedfor the manipulation of brain activity to study basic mechanisms ofsleep and wake regulation, and performance behavior and may leadin the future to new therapeutic approaches.
11.6 Supplementary Materials
11.6.1 Exposure Setup
The exposure system was designed and optimized for best uniformityin exposing the volunteer’s head, while allowing different sleep pos-tures and positions. This was achieved using a circular polarized,directional antenna at 900 MHz with a 3 dB beam width of 70° (SPA-915/70/8/0/RCP, Huber+Suhner, Herisau, Switzerland), mounted onthe wall at a height of 490 mm above the mattress, facing down to-wards the volunteer’s head (55° angle from the wall, 415 mm nom-inal distance between antenna and head for the reference position,Fig. 11.1). The exposure system was fully computer controlled, en-abling a double-blind protocol and continuous measurement, monitor-ing and logging of the radiated power.
The conductive EEG leads reflect the RF EMF when the leads areparallel and are largely invisible when leads are normal to the incident

164 CHAPTER 11. EMF BRAIN STIMULATION
E-field. Hence, the variability of the head exposure caused by the leadorientation has been reduced by applying the circular-polarized field.Furthermore, electrode leads were braid into a net to keep them ina fixed position relative to the head. The EEG amplifier box wasshielded from electromagnetic interference with two layers of enclos-ing metal. EEG leads and other connecting cables were fed throughπ-filters. This resulted in a > 75 dB suppression of the 900 MHz cou-pling into the EEG signals, such that the RF signal was not visuallydetectable in the EEG.
11.6.2 Dosimetric Evaluation
The dosimetric exposure assessment was performed with SEMCAD XV14.4 (Speag, Zurich, Switzerland) using the anatomical human mod-els Ella, Duke, and Louis [35]. For the standard reference positionwith Duke (Fig. 11.1), 1 W forward power at the antenna feed pointcaused a peak spatial specific absorption rate averaged over any 10 gtissue (psSAR10g) of 0.051 W/kg in the whole head. Normalized to1 W/kg psSAR10g (19.6 W forward power), this results in psSAR1gand average-SAR (±SD) of 2.25 ± 0.19 W/kg (136%) for the wholehead, and 0.77 ± 0.18 W/kg (77%) for the brain without cerebrospinal fluid. The uncertainty (SD, k=1) for the evaluation withoutEEG electrodes stayed below 14% (psSAR1g) and 6% (average-SAR).The effect of the electrodes remains localized. Recent studies [97, 98]indicate no influence on whole head average SAR, a maximum changeof 20% in psSAR10g, and 46% uncertainty for psSAR1g in worst-casepositioning. This results in an overall psSAR1g uncertainty of 48%.
The variation analysis included: (a) three different anatomicalheads, (b) head sizes ±10%, (c) dielectric parameters ±10%, and (d)different sleep postures and positions of the volunteers, which havebeen evaluated based on whole night surveillance videos. The fol-lowing worst-case positions have been identified: (d1) head positionsof ± 90 mm in head-feet axis and ± 250 mm left-right shifting, (d2)45° head tilting, (d3) 90° head rotation, (d4) combinations of (d1-d3).The combined exposure variation is estimated to be 40% in psSAR1gand 15% in average-SAR (SD, k=1). Compared to the reference po-sition with Duke, worst-case variations came from sleep postures andpositions ranging from -54% to +34% in psSAR1g, and from -9% to

11.6. SUPPLEMENTARY MATERIALS 165
+19% in average-SAR.
11.6.3 Exposure Condition
The 900 MHz RF signal was pulsed, with seven consecutive 7.14 mspulses forming one 500 ms burst (64.3 ms pause after each pulse).These 500 ms bursts were repeated every 4 s (Intermittent-1 phase,0.25Hz), and every 1.25 s (Intermittent-2 phase, 0.8Hz), respectively.Exposure of 5 min Intermittent-1 was followed by 1 min without ex-posure (OFF phase), then 5 min Intermittent-2 was followed by a 7min OFF phase. This 18 min sequence was repeated throughout thenight. The psSAR10g during the 7.1 ms pulses was set to 10 W/kg(196 W peak forward power). This resulted in a 500-ms burst aver-age of 1.0 W/kg, an Intermittent-1 average of 0.125 W/kg, and anIntermittent-2 average of 0.4 W/kg. The whole night psSAR10g aver-aged to 0.15 W/kg, while the relevant 6 min average never exceeded0.34 W/kg, staying well below the exposure limit of 2 W/kg for thegeneral public [1], even when assuming a 20% increase due to theinfluence of EEG leads.

Chapter 12
Outlook
12.1 Current Status of EMF Sleep Research
There is an accumulating body of evidence that EMFs interact withbrain physiology [62, 63, 64, 65, 66, 67, 68, 69]. However, there aremany contradictions and inconsistancies. The effect on EEG powerdensity, e.g., occurs occasionally in different frequency-bands and indifferent sleep episodes. Effects on cognitive function render a ratherinconsistent overall picture [82]. Hence, final conclusion remain pre-mature, except for the effect-magnitude, which may be consideredrelatively small, e.g., below the effect of caffeine on EEG spectraldensity [136].
12.2 Interaction Mechanisms
Regarding the vast complexity of our central nervous system, thereare many potential interaction mechanisms between EMF and brainphysiology. Various measures have been taken to avoid confoundingfactors, such as the acoustic perception of RF transmission [103, 65]via battery currents or loudspeaker behavior of antennas, or the lo-calized RF-induced temperature ripples around EEG electrodes (seeChapter 10). And yet, a robust EMF effect still remains elusive.
167

168 CHAPTER 12. OUTLOOK
Proposed interaction mechanisms range from small-scale thermo-plastic expansions and ephaptic coupling of cortical neurons, i.e., non-synaptic neuron interaction [76], to some sort of obscure resonant sen-sory perception of EMF within the CNS.
The intrinsic problem in safety assessments of non-thermal EMFexposure levels persists: the field level cannot be increased withoutincreasing the thermal load. While the levels of chemical toxins canbe increased until a clear effect is established, higher EMF will ulti-mately cause higher temperatures and, thus, lead to a thermal effect.Carrier frequencies below 1 MHz clearly have non-thermal effects, e.g.,nerve stimulation in the kHz region. MRI and mobile phone RF fre-quency bands, however, exhibit the only established and sufficientlyexplained non-thermal effect of microwave hearing, which is due tothermoelastic expansion rather than temperature alone [137]. Otherreported effects such as pearl chaining [100] are non-thermal in sus-pended particles, but seem to require thermally relevant high levelsof EMF in biological tissues. One could, therefore, justifiably askwhether the observed effects on EEG spectral power could be elicitedby the small temperature changes in the range of < 0.6°C, potentiallyvia thermoplastic expansion through the pulsed RF fields.
12.3 Future Research
The challenge from a biomedical engineering perspective is to furtherreduce the overall exposure uncertainties, as well as to provide in-novative exposure modalities. A rigorous double-blind protocol thatincludes full RF shielding of the recording equipment (EEG amplifier,monitoring cameras, etc.) and inhibition of any conscious field percep-tion by the volunteer or operator (acoustic signals, heating, microwavehearing) must be maintained.
For future human provocation studies with EMF, I envision mainlythe following topics where improvements are desirable or necessary.
• Exposure Signal:
– frequency components of modulation envelope:there is increasing evidence that specific modulation fre-quency components may elicit observed effects [65, 138]

12.3. FUTURE RESEARCH 169
– high peak field levels (large PAR signals):the CNS may be more susceptible to peak fields levels,rather than average levels
• Sites of interaction
– penetration depth of RF can be varied by adjusting thecarrier frequency, as certain specific structures may be moreinvolved than others, e.g., thalamus vs. cortex
– antenna design and distance can define the area of maxi-mum exposure
• Further elimination potential confounders
– acoustic perceptions of RF components needs to be sup-pressed by a defined background noise level
– the effects of metallic objects at the head, e.g., EEG elec-trodes, need to be investigated for each study configuration
• Alternative assessment of brain physiology
– EEG and PET have been used in many studies
– MRI may not be ideal, as there already are very high levelsof EMF present
– a study in which magnetoencephalography (MEG) is usedmay reveal EMF effects in subcortical areas such as thethalamus

170 CHAPTER 12. OUTLOOK

Part III
Epilogue
171


Chapter 13
Conclusions
The objectives of this thesis were achieved: Various safety aspectsof human exposure to radio frequency (RF) electromagnetic fields(EMF) are addressed. Electrothermal investigations of high RF in-duced fields (MRI), as well as for low exposure levels (human provoca-tion studies) have significantly enhanced knowledge and state-of-the-art methodologies for safety assessment of EMF.
A profound insight into MRI-specific exposure schemes has beenelaborated by means of a large number of scan scenarios of variousanatomical human models in many imaging positions. The resultshelp us to understand MRI-specific RF absorption mechanisms interms of whole-body and localized energy deposition, and subsequentthermal loading. By including the human thermoregulatory responses,the key parameters for potentially dangerous scan scenarios could beidentified. Many MRI operators still attempt to solve temperatureissues by increasing ventilation during the scan (audience questionduring platform presentation at ISMRM 2012 in Melbourne, Aus-tralia, [139]). While ventilation and sweating play a major role inoverall heat dissipation, local internal hotspots in MR imaging almostentirely depend on local thermoregulation [21, 45].
As thermal dose — in combination with tissue-specific thresholds— appears to be the best proxy for actual tissue damage [24], thelinking of MR exposures to thermal dose evaluation may open a new
173

174 CHAPTER 13. CONCLUSIONS
era for safety standards in upcoming MR scanner generations.
Various issues in hypothesis-driven research on acute effects ofhuman mobile phone exposures have been addressed within this the-sis. Novel exposure systems that foster innovative research on EMFeffects, including different RF frequencies, ELF magnetic field expo-sures, and all–night exposure with circularly polarized fields, havebeen developed and presented. The impact of potential confoundershas been investigated, and appropriate measures were taken to avoidany perception of the EMF condition by the volunteer or operator.An actual sleep study in collaboration with the University Children’sHospital Zurich revealed changes in EEG slow-wave activity and ef-fects on sleep-dependent performance improvement after overnight RFEMF exposure.
As direct dosimetric measurements in humans are challenging ornot feasible, the usage of numerical electrothermal models — as de-scribed in this thesis — is particularly important to predict the com-plex interactions of EMF with biological tissues. Validations of sim-ulation results can be obtained 1) invasively, in case of medical in-dication, e.g., in hyperthermia cancer treatment; 2) indirectly vianon-invasive temperature measurements as described in this thesis;or 3) with an MRI thermometry approach. However, these validationmeasurements cannot replace numerical predictions. Subsequently,future advances in the research field of EMF safety are subjected tothe progress in the following areas (non-exhaustive collection):
• High quality anatomical human models for simulation studies
– representative for the entire population in terms of age,stature, ethnic group, and gender
– pregnant models in different periods of gestation
– improved resolution and anatomical details
• Electrothermal model input parameter
– further investigation of dielectric and thermal properties ofliving human tissues, including a high level of public avail-ability [17, 16]

175
– assessment of human local thermoregulation capabilities,including estimations of the lower bounds for pathologiccases (e.g., diabetics, the elderly)
– establishing better thermoregulation models
• Electromagnetic simulation and measurement tools
– hardware accelerated electrothermal simulation platformswith advanced parametrized evaluation tools
– time-domain RF probes for effective characterization of ex-posure patterns
• Laboratory research in vitro, in vivo, and in human
– innovative assessments of immediate responses to EMF
– establishing hypotheses on EMF interaction
• Epidemiological studies
– monitoring of potential correlations of EMF and adversehealth conditions
– exposure assessment and modeling for different populationgroups
• MRI techniques
– advances in MRI thermometry for future validation con-cepts or safety implementations
– indirect exposure assessment via B1+ mapping
Study results shall be made available to the maintenance consor-tiums of the according product or safety standards, e.g., ICNIRP,IEC, and IEEE [3, 1, 2]. Monitoring of new evidence-based data willallow updating of these guidelines wherever necessary. Currently, thestandards do not consider exposure time, or they only rudimentarilyinclude overall dosage. As tissue damage is associated with exposurelevel and time, i.e., with thermal dose, a revision is recommended.
Overall, the complex and to some extent counter-intuitive absorp-tion mechanisms of non-ionizing radiation form a very interesting field

176 CHAPTER 13. CONCLUSIONS
of research. The inclusion of biology fosters fascinating interdisci-plinary studies. Our project partners have a broad spectrum of scien-tific backgrounds: engineers and physicists; medical doctors, toxicol-ogists, biologists, epidemiologists and neuropsychologists; regulatoryoffices and standard building bodies. As the societal debate aboutadverse health effects from “electro-smog” is ongoing, the media andpolitics have a broad interest as well.
The work performed within this thesis was funded by two researchproject conglomerations: the international EURKA/CTI project “MRI+”,and the Swiss National Research Project “NFP57”. The sleep studywas generously supported by “Forschungsstiftung Mobilkommunika-tion”.
In summary, significant contributions regarding the safe applica-tion of EMF in both everyday life exposures as well as in the clinicalenvironment within MRI scanners are presented in this thesis. Mostresults presented here have been published in journals and confer-ence proceedings, ensuring broad dissemination to other researchers,standards building bodies, and regulatory offices.

Part IV
Appendix
177


Appendix A
List of Acronyms
BMI Body Mass IndexCAD Computer Aided DesignCW Continuous WaveDASY Dosimetric Assessment System (SPEAG)DAQ Data AcquisitionEASY Exposure Acquisition System (SPEAG)EM ElectromagneticEMF Electromagnetic FieldETHZ Eidgenossische Technische Hochschule ZurichFDTD Finite-Difference Time-DomainFSE Fast Spin EchoGSM Global System for Mobile CommunicationsICNIRP International Commission on Non-Ionizing Radiation Pro-
tectionIEC International Electrotechnical CommissionIEEE Institute of Electrical and Electronics EngineersIT’IS IT’IS Foundation for Information Technologies in SocietyMRI Magnetic Resonance ImagingRF Radio FrequencyRMS Root Mean SquareSAM Specific Anthropomorphic MannequinSAR Specific Absorption Rate
179

180 APPENDIX A. LIST OF ACRONYMS
SEMCAD Simulation Platform for Electromagnetic CompatibilityAntenna Design and Dosimetry (SPEAG)
SPEAG Schmid & Partner Engineering AGTSE Turbo Spin EchoUMTS Universal Mobile Telecommunications System

Appendix B
List of Symbols
Symbol Quantity UnitE Electric field V/mH Magnetic field A/mB Magnetic flux density T
∆T Temperature increase Kε Complex permittivity ε = ε0 · εr F/mσ Conductivity S/mc Specific heat capacity J/(kgK)ρ Mass density kg/m3
SAR Specific absorption rate W/kgpsSAR1g peak SAR spatially averaged over 1 g W/kgpsSAR10g peak SAR spatially averaged over 10 g W/kgwbSAR SAR spatially averaged over the whole body W/kg
181


Appendix C
List of Publications
C.1 Journal Publications Included in thisThesis
Within the framework of this thesis, the following scientific publica-tions have been written by the author.
(1) Murbach M, Cabot E, Neufeld E, Gosselin MC, Christ A, andKuster N. Local SAR enhancements in anatomically correct chil-dren and adult models as a function of position within 1.5 TMR body coil. Progress in Biophysics and Molecular Biology,107(3):428–433, 2011.
(2) Murbach M, Christopoulou M, Crespo-Valero P, Achermann P,and Kuster N. Exposure system to study hypotheses of ELF andRF electromagnetic field interactions of mobile phones with thecentral nervous system. Bioelectromagnetics, 33(6):527–533, 2012.
(3) Murbach M, Neufeld E, Kainz W, Pruessmann KP, and Kuster N.Whole-body and local RF absorption in human models as a func-tion of anatomy and position within 1.5T MR body coil. MagneticResonance in Medicine, (published online ahead of print), 2013.
(4) Murbach M, Neufeld E, Capstick M, Kainz W, Brunner DO,Samaras T, Pruessmann KP, and Kuster N. Thermal tissue
183

184 PUBLICATIONS
damage model analyzed for different hole-body SAR and scandurations for standard MR body coils. Magnetic Resonance inMedicine, (published online ahead of print), 2013.
(5) Murbach M, Neufeld E, Christopoulou M, Achermann P, andKuster N. Evaluation of electrode artifacts and thermal ripples ofEEG RF experiments. Bioelectromagnetics, submitted, 2013.
(6) Lustenberger C, Murbach M, Durr R, Schmid MR, Kuster N,Achermann P, and Huber R. Stimulation of the brain with ra-diofrequency electromagnetic field pulses affects sleep-dependentperformance improvement. Brain Stimulation, (published onlineahead of print), 2013.
C.2 Other Journal Publications
In addition, the author has co-authored the following journal publi-cations.
(1) Loughran S, Benz D, Schmid MR, Murbach M, Kuster N, andAchermann P. No increased sensitivity in brain activity of ado-lescents exposed to mobile phone-like emissions. Clinical Neuro-physiology, (published online ahead of print), 2013.
(2) Neufeld E, Gosselin MC, Murbach M, Christ A, Cabot E, andKuster N. Analysis of the local worst-case SAR exposure causedby an MRI multi-transmit body coil in anatomical models of thehuman body. Physics in Medicine and Biology, 56(15):4649–4659,2011.
(3) Schmid MR, Loughran SP, Regel SJ, Murbach M, BraticGrunauer A, Rusterholz T, Bersagliere A, Kuster N, and Acher-mann P. Sleep EEG alterations: effects of different pulse-modulated radio frequency electromagnetic fields. Journal ofSleep Research, 21(1):50–58, 2012.
(4) Schmid MR, Murbach M, Lustenberger C, Maire M, Kuster N,Achermann P, and Loughran SP. Sleep EEG alterations: effectsof pulsed magnetic fields versus pulse-modulated radio frequency

C.3. OTHER PUBLICATIONS 185
electromagnetic fields. Journal of Sleep Research, 21(6):620–629,2012.
(5) Waldmann P, Bohnenberger S, Greinert R, Hermann-Then B,Heselich A, Klug SJ, Koenig J, Kuhr K, Kuster N, Merker M,Murbach M, Pollet D, Schadenboeck W, Scheidemann-Wesp U,Schwab B, Volkmer B, Weyer V, and Blettner M. Influence ofGSM signals on human peripheral lymphocytes: study of geno-toxicity. Radiation Research, (published online ahead of print),2013.
(6) Xu S, Chen G, Chen C, Sun C, Zhang D, Murbach M, Kuster N,Zeng Q, and Xu Z. Cell type-dependent induction of DNA damageby 1800 MHz radiofrequency electromagnetic fields does not resultin significant cellular dysfunctions. PLoS ONE, 8(1):e54906, 2013.
C.3 Other Publications
The author has presented or co-authored various other publications.
(1) Murbach M, Neufeld E, Gosselin MC, Christ A, Cabot E, andKuster N. Local SAR vs. Whole Body SAR, and in vivo valida-tion in an MR environment. Presentation at the 2011 ThermalWorkshop on RF Hotspots, Zurich, Switzerland, March 21–22,2011, 2011. Presentation in Session 2: SAR and TemperatureModeling.
(2) Murbach M, Neufeld E, Gosselin MC, Christ A, Cabot E, andKuster N. Temperature, incident field and b1+ comparisonin MR simulation and measurement, using a detailed anatom-ical model. Presentation at the 10th International Conferenceof the European Bioelectromagnetics Association (EBEA 2011),Rome, Italy, February 21–24, 2011, 2011. Presentation in session:Dosimetry (February 23, mmu).
(3) Murbach M, Kuhn S, Christ A, and Kuster N. Effects of pulse-modulated radio frequency electromagnetic fields on the human

186 PUBLICATIONS
brain: Critical field parameters, site of interaction and sensi-tivity in early adolescence. Presentation at the NRP 57 (Non-Ionising Radiation – Health and Environment) Final Workshop,Zurich, Switzerland, September 20, 2010. Presentation in Ses-sion: Modul 1: Dosimetry and Exposure Assessment.
(4) Murbach M, Kuehn S, Christopoulou M, Christ A, Achermann P,and Kuster N. Evaluation of artifacts by EEG electrodes duringRF exposures. In Abstract Collection of BioEM 2009 Davos,the Joint Meeting of the Bioelectromagnetics Society and theEuropean BioElectromagnetics Association, June 14–19, Davos,Switzerland, 2009. Presentation 5-2 in Session 5: Dosimetry III(June 16).
(5) Murbach M, Kuehn S, Christopoulou M, Christ A, Achermann P,and Kuster N. Evaluation of artifacts by EEG electrodes duringRF exposures. Presentation at the Joint Meeting of the Bioelec-tromagnetics Society and the European BioElectromagnetics As-sociation (BioEM 2009 Davos), Davos, Switzerland, June 14–19,2009. Presentation 5-2 in Session 5: Dosimetry III (June 16).
(6) Murbach M, Mevissen M, and Kuster N. Dosimetric assessmentof C. elegans exposure in vivo to 900 MHz electromagnetic fields.In Abstract Collection of BioEM 2009 Davos, the Joint Meetingof the Bioelectromagnetics Society and the European BioElectro-magnetics Association, June 14–19, Davos, Switzerland, 2009.Poster presentation P-40 in Poster session 2: Dosimetry (June16).
(7) Murbach M, Mevissen M, and Kuster N. Dosimetric assessmentof C. elegans exposure in vivo to 900 MHz electromagnetic fields.Poster presentation at the Joint Meeting of the Bioelectromag-netics Society and the European BioElectromagnetics Associa-tion (BioEM 2009 Davos), Davos, Switzerland, June 14–19, 2009.Poster presentation P-40 in Poster session 2: Dosimetry (June16).
(8) Murbach M, Christopoulou M, Christ A, Crespo-Valero P, Zef-ferer M, Kuehn S, Achermann P, and Kuster N. System to studyCNS responses of ELF modulation and cortex versus subcortical

PUBLICATIONS 187
RF exposures. In Abstract Collection of BioEM 2009 Davos,the Joint Meeting of the Bioelectromagnetics Society and theEuropean BioElectromagnetics Association, June 14–19, Davos,Switzerland, 2009. Poster presentation P-41 in Poster session 1:Dosimetry (June 15).
(9) Gosselin MC, Neufeld E, Murbach M, Christ A, Cabot E, andKuster N. Analysis of the SAR enhancement from a multitrans-mit coil. In Proceedings of the 10th International Conferenceof the European Bioelectromagnetics Association (EBEA 2011),February 21–24, 2011, Rome, Italy, 2011. Presentation in ses-sion: Dosimetry (February 23, mcg).
(10) Kuster N, Christ A, Gosselin MC, Oberle M, and Murbach M.MT40: From quadrature feed to multi phase. Presentation at theIEC SC62B MT40 Meeting, Washington, DC, USA, September14–17, 2010. Presentation.
(11) Neufeld E, Murbach M, Gosselin MC, Christ A, and Kuster N.Human exposures of quadrature feed versus multiphase systemsas function of anatomy. Presentation at the IEC SC 62 / MT 40Meeting, Washington, DC, USA, September 14–17, 2010. Pre-sentation.
(12) Loughran S, Schmid M, Regel S, Bratic A, Maire M,Bersagliere A, Rusterholtz T, Durr R, Murbach M, Kuster N,and Achermann P. Effects of pulse-modulated RF-EMF on thehuman brain: Site of interaction. In Proceedings of the 32nd An-nual Meeting of the Bioelectromagnetics Society (BEMS2010),June 14–18, 2010, Seoul, Korea, 2010. Poster P-B-97 in PosterSession 2: Human Studies (June 17).
(13) Loughran S, Schmid M, Regel S, Bratic A, Maire M,Bersagliere A, Rusterholtz T, Durr R, Murbach M, Kuster N,and Achermann P. Effects of pulse-modulated RF-EMF on thehuman brain: Site of interaction. Presentation at the 32nd An-nual Meeting of the Bioelectromagnetics Society (BEMS2010),June 14–18, 2010, Seoul, Korea, 2010. Poster P-B-97 in PosterSession 2: Human Studies (June 17).

188 PUBLICATIONS
(14) Schmid M, Bratic A, Loughran S, Regel S, Murbach M,Kuster N, and Achermann P. Effects of pulse-modulated radiofrequency electromagnetic fields on the human brain: Criticalfield parameters. In Proceedings of the 32nd Annual Meeting ofthe Bioelectromagnetics Society (BEMS2010), June 14–18, 2010,Seoul, Korea, 2010. Presentation 12-1 in Session 12: HumanStudies & Medical Applications (June 17).
(15) Guionaud C, Alaeddine F, Murbach M, Kuster N, and Mevis-sen M. Effects of RF-EMF on stress response and alterna-tive splicing in rat and human cell lines. In Proceedings ofthe 32nd Annual Meeting of the Bioelectromagnetics Society(BEMS2010), June 14–18, 2010, Seoul, Korea, 2010. Presen-tation 14-3 in Session 14: In Vitro Studies (June 18).
(16) Gosselin MC, Murbach M, Kun S, and Kuster N. Multi bandmobile phone power control in real environments. In Programmeof the EMF Bordeaux Event (EBEA, COST & URSI 2010), May26–28, 2010, pages 53–54, Bordeaux, France, 2010. Presentationin COST Session: RF Strategy in Dosimetry and Exposure As-sessment (May 28).
(17) Gosselin MC, Zefferer M, Valero PC, Christ A, Murbach M,Kuhn S, and Kuster N. Novel estimation procedure to esti-mate brain specific SAR in anatomical heads from compliancemeasurements in SAM. In Proceedings and Programme of theEMF Bordeaux Event (EBEA, COST & URSI 2010), May 26–28, 2010, Bordeaux, France, 2010. Poster P3 in Poster Session:Strategies for Dosimetry and Exposure Assessment (May 27).
(18) Gosselin MC, Zefferer M, Valero PC, Christ A, Murbach M,Kuhn S, and Kuster N. Novel estimation procedure to estimatebrain specific SAR in anatomical heads from compliance mea-surements in SAM. Presentation at the EMF Bordeaux Event(EBEA, COST & URSI 2010), Bordeaux, France, May 26–28,2010, 2010. Poster P3 in Poster Session: Strategies for Dosime-try and Exposure Assessment (May 27, Manuel Murbach).
(19) Kyriacou A, Christ A, Neufeld E, Murbach M, Cabot E, Kuhn S,Douglas M, and Kuster N. Risk assessment of tissue heat-

PUBLICATIONS 189
ing for wearers of medical implants exposed to electromagneticfields. In Proceedings and Programme of the EMF BordeauxEvent (EBEA, COST & URSI 2010), May 26–28, 2010, Bor-deaux, France, 2010. Poster P1 in Poster Session: Strategies forDosimetry and Exposure Assessment (May 27, not presented).
(20) Alaeddine F, Guionaud C, Murbach M, Kuster N, and Mevis-sen M. RF-EMF and stress response: Effect of RF-EMF on al-ternative splicing of acetylcholinesterase. Poster presentation atthe Joint Meeting of the Bioelectromagnetics Society and the Eu-ropean BioElectromagnetics Association (BioEM 2009 Davos),Davos, Switzerland, June 14–19, 2009. Poster presentation P-141 in poster session 1: In Vitro Studies (June 15).
(21) Alaeddine F, Guionaud C, Kuster N, Murbach M, and Mevis-sen M. RF-EMF and stress response: Effect of RF-EMF on al-ternative splicing of acetylcholinestrase. In Abstracts of SatelliteSymposium BioEM 2009 Davos, NRP 57 Non-Ionising Radia-tion - Health and Environment, June 14, Davos, Switzerland,2009. Presentation 5 in Module 2: Cell Biology (June 14).
(22) Alaeddine F, Guionaud C, Kuster N, Murbach M, and Mevis-sen M. RF-EMF and stress response: Effect of RF-EMF onalternative splicing of acetylcholinestrase. Presentation at theSatellite Symposium BioEM 2009 Davos, NRP 57 Non-IonisingRadiation - Health and Environment, Davos, Switzerland, June14, 2009. Presentation 5 in Module 2: Cell Biology (June 14).
(23) Loughran S, Schmid M, Regel S, Bratic A, Murbach M,Kuster N, and Achermann P. Effects of pulse-modulated RF-EMF on the human brain: Critical field parameters, site of in-teraction and sensitivity in early adolescence. In Abstracts ofSatellite Symposium BioEM 2009 Davos, NRP 57 Non-IonisingRadiation - Health and Environment, June 14, Davos, Switzer-land, 2009. Presentation 7 in Module 3: Laboratory Studies andEpidemiology (June 14).
(24) Loughran S, Schmid M, Regel S, Bratic A, Murbach M,Kuster N, and Achermann P. Effects of pulse-modulated RF-EMF on the human brain: Critical field parameters, site of in-

190 PUBLICATIONS
teraction and sensitivity in early adolescence. Presentation at theSatellite Symposium BioEM 2009 Davos, NRP 57 Non-IonisingRadiation - Health and Environment, Davos, Switzerland, June14, 2009. Presentation 7 in Module 3: Laboratory Studies andEpidemiology (June 14).
(25) Gosselin MC, Christ A, Murbach M, Ryf S, Kuhn S,Christopoulou M, Neufeld E, Gabriel C, Peyman A, andKuster N. Influences of age dependent tissue parameters andanatomical structures on SAR and temperature increase in theheads of cellular phone users. Presentation at the XXIX GeneralAssembly of URSI 2008, Chicago, IL, USA, August 7–16, 2008.Presentation KAE.9 in Session KAE: Exposure Assessment andEmerging New Technologies (August 15).
(26) Gosselin MC, Christ A, Murbach M, Ryf S, Kuhn S,Christopoulou M, Neufeld E, Gabriel C, Peyman A, andKuster N. Influences of age dependent tissue parameters andanatomical structures on SAR and temperature increase in theheads of cellular phone users. In Proceedings of the XXIX Gen-eral Assembly of the International Union of Radio Science (UR-SIGA 2008), August 7–16, Chicago, IL, USA, 2008. Presenta-tion KAE.9 in Session KAE: Exposure Assessment and EmergingNew Technologies (August 15).
(27) Kuster N, Murbach M, Christopoulou M, Kuhn S, and Christ A.Experimental outcome of human provocation studies depend onthe design specifics of the exposure setup. Presentation at theXXIX General Assembly of URSI 2008, Chicago, IL, USA, Au-gust 7–16, 2008. Presentation K02c.2 in Session K02c: BiologicalEffects of EMF: Imaging the Human Response (August 15).
(28) Christopoulou M, Murbach M, Christ A, Crespo-Valero P, Zef-ferer M, Kuehn S, Achermann P, and Kuster N. Exposure sys-tems for testing hypotheses of site and mechanism of interactionin the human brain. In Abstracts of the 30th Annual Meeting ofthe Bioelectromagnetics Society (BEMS 2008), June 9–12, pages240–241, San Diego, CA, USA, 2008. Poster presentation P-21in Poster Session: Dosimetry (June 10).

PUBLICATIONS 191
(29) Kuster N, Murbach M, Christopoulou M, Kuhn S, and Christ A.Experimental outcome of human provocation studies depend onthe design specifics of the exposure setup. In Proceedings of theXXIX General Assembly of the International Union of RadioScience (URSIGA 2008), August 7–16, Chicago, IL, USA, 2008.Presentation K02c.2 in Session K02c: Biological Effects of EMF:Imaging the Human Response (August 15).
(30) Christ A, Gosselin MC, Murbach M, Ryf S, Christopoulou M,Neufeld E, Gabriel C, Peyman A, and Kuster N. Age dependentchanges in SAR and temperature distribution induced in theuser’s head by cellular phones. Presentation at the 30th AnnualMeeting of the Bioelectromagnetics Society (BEMS 2008), SanDiego, CA, USA, June 7–13, 2008. Presentation 7-8 in Session7: Dosimetry I (June 11).
(31) Christ A, Gosselin MC, Murbach M, Ryf S, Christopoulou M,Neufeld E, Gabriel C, Peyman A, and Kuster N. Age dependentchanges in SAR and temperature distribution induced in theuser’s head by cellular phones. In Abstracts of the 30th AnnualMeeting of the Bioelectromagnetics Society (BEMS 2008), June7–13, pages 131–132, San Diego, CA, USA, 2008. Presentation7-8 in Session 7: Dosimetry I (June 11).
(32) Christ A, Gosselin MC, Murbach M, Kuhn S, Zefferer M, Honeg-ger K, Negovetic S, and Kuster N. Age dependent effects of RFelectromagnetic fields on the base of relevant biological param-eters. Presentation at the DMF-Workshop ‘Long Term Effects’,Ismaning, Munich, Germany, October 12, 2007.
(33) Murbach M, Gosselin MC, Christ A, Neufeld E, and Kuster N.Report: Development of a methodology to investigate, monitorand control local SAR enhancements for parallel transmit RFcoils in MRI scanners: Project 0332. Techreport, IT’IS Founda-tion, Zeughausstrasse 43, 8004 Zurich, Switzerland, 2010.
(34) Christ A, Oberle M, Kuhn S, Murbach M, Capstick M, Cabot E,Kyriacou A, Neufeld E, and Kuster N. MR safety of pacemakerleads: Final report. Techreport, IT’IS Foundation, ETH Zurich,Zeughausstrasse 43, 8004 Zurich, Switzerland, 2009.

192 PUBLICATIONS
(35) Murbach M, Christopoulou M, Kuhn S, Neufeld E, Christ A,Achermann P, and Kuster N. System to study CNS responsesof ELF modulation and cortex versus subcortical RF expo-sures: Version 0.8. Techreport, IT’IS Foundation, ETH Zurich,Zeughausstrasse 43, 8004 Zurich, Switzerland, 2009. 25pp.
(36) Murbach M and Kuster N. Dosimetric report for the exposure ofreconstituted epidermis within the sXc900 system. Techreport,IT’IS Foundation, ETH Zurich, Zeughausstrasse 43, 8004 Zurich,Switzerland, 2009. 16pp.
(37) Murbach M and Kuster N. Dosimetric report for the exposure ofC. elegans within the sXc900 system. Techreport, IT’IS Founda-tion, ETH Zurich, Zeughausstrasse 43, 8004 Zurich, Switzerland,2009. 19pp.
(38) Christ A, Schmid G, Djafarzadeh R, Uberbacher R, Cecil S, Zef-ferer M, Neufeld E, Lichtsteiner M, Bouterfas M, and Kuster N.Numerische Bestimmung der Spezifischen Absorptionsrate beiGanzkorperexposition von Kindern: Projekt stsch4517 Ab-schlußbericht. Techreport, IT’IS Foundation, ETH Zurich,Zeughausstrasse 43, 8004 Zurich, Switzerland, 2009.
(39) Gosselin MC, Christ A, Ryf S, Murbach M, Kuhn S,Christopoulou M, Neufeld E, Cherubini E, Peyman A, Gabriel C,and Kuster N. Untersuchung zu altersabhangigen Wirkun-gen hochfrequenter elektromagnetischer Felder auf der Basisrelevanter biophysikalischer und biologischer Parameter: Ab-schlussbericht. Techreport, IT’IS Foundation, ETH Zurich,Zeughausstrasse 43, 8004 Zurich, 2009. BfS M8835.
(40) Christ A, Oberle M, Kuhn S, Murbach M, Capstick M, Cabot E,Kyriacou A, Neufeld E, and Kuster N. Draft - Final Re-port: Project 200D Extension: Project 227G - Amendment ofMarch 19th, 2009. Techreport, IT’IS Foundation, ETH Zurich,Zeughausstrasse 43, 8004 Zurich, 2009.
(41) Christ A, Gosselin MC, Ryf S, Murbach M, Kuhn S,Christopoulou M, Neufeld E, Cherubini E, Peyman A, Gabriel C,

PUBLICATIONS 193
and Kuster N. Untersuchung zu altersabhangigen Wirkun-gen hochfrequenter elektromagnetischer Felder auf der Basisrelevanter biophysikalischer und biologischer Parameter: Ab-schlussbericht. Techreport, IT’IS Foundation, ETH Zurich,Zeughausstrasse 43, 8004 Zurich, Switzerland, 2008.
(42) Murbach M, Oberle M, Christ A, Capstick M, and Kuster N.Assessment of the cumulative exposure of children the electro-magnetic fields. Presentation of progress report, The Hague,Netherlands, September 28 2009, 2009.
(43) Murbach M. IT’IS exposure systems: Overview. Presentationat visit to Telecommunication Metrology Center, Beijing, China,December 19, 2009, 2009.
(44) Murbach M. IT’IS sXcRF systems. Presentation at visit toTelecommunication Metrology Center, Beijing, China, December19, 2009, 2009.
(45) Murbach M. IT’IS exposure setups - overview. Presentationat the China Academy of Telecommunication Research visit,Zurich, Switzerland, January 14, 2009.
(46) Murbach M. IT’IS exposure systems: Overview. Presentationat visit to Zheijang University, Hangzhou, China, September 29,2009, 2009.


Bibliography
[1] ICNIRP. Guidelines for limiting exposure to time-varying elec-tric, magnetic, and electromagnetic fields (up to 300 GHz).Health Physics, 74(4):494–522, 1998.
[2] IEEE. IEEE standard for safety levels with respect to humanexposure to radio frequency electromagnetic fields, 3 KHz to 300GHz. IEEE Standard C95.1-2005, 2005.
[3] IEC. Medical electrical equipment - particular requirements forthe basic safety and essential performance of magnetic resonanceequipment for medical diagnosis, 3rd edition. IEC Standard60601-2-33, 2010.
[4] Maxwell J. A dynamical theory of the electromagnetic field.Philosophical Transactions of the Royal Society of London,155:459–512, 1865.
[5] Bloch F, Hansen W, and Packard M. The nuclear inductionexperiment. Physical Review, 70(7-8):474–485, 1946.
[6] Brunner DO, De Zanche N, Frohlich J, Paska J, and Pruess-mann KP. Travelling-wave nuclear magnetic resonance. Nature,457(7232):994–8, 2009.
[7] IEEE. IEEE recommended practice for measurements and com-putations of radio frequency electromagnetic fields with respectto human exposure to such fields, 100 kHz-300 GHz. IEEEStandard C95.3-2002 (R2008), 2008.
195

196 BIBLIOGRAPHY
[8] Bottomley PA and Andrew ER. RF magnetic field penetration,phase shift and power dissipation in biological tissue: impli-cations for NMR imaging. Physics in Medicine and Biology,23(4):630–43, 1978.
[9] Shellock FG and Bierman H. The safety of MRI. JAMA,261(23):3412, 1989.
[10] Shellock FG, Schaefer DJ, and Crues JV. Alterations in bodyand skin temperatures caused by magnetic resonance imaging:is the recommended exposure for radiofrequency radiation tooconservative? The British journal of radiology, 62(742):904–909, 1989.
[11] Watanabe S, Taki M, Tanaka T, and Watanabe Y. FDTD anal-ysis of microwave hearing effect. IEEE Transactions on Mi-crowave Theory and Techniques, 48(11):2126–2132, 2000.
[12] Price DL, De Wilde JP, Papadaki AM, Curran JS, and Kit-ney RI. Investigation of acoustic noise on 15 MRI scannersfrom 0.2 T to 3 T. Journal of Magnetic Resonance Imaging,13(2):288–293, 2001.
[13] Leifer MC. Resonant modes of the birdcage coil. Journal ofMagnetic Resonance, 124:51–60, 1997.
[14] Neufeld E, Gosselin MC, Murbach M, Christ A, Cabot E, andKuster N. Analysis of the local worst-case SAR exposure causedby an MRI multi-transmit body coil in anatomical models of thehuman body. Physics in Medicine and Biology, 56(15):4649–4659, 2011.
[15] Christ A, Kainz W, Hahn EG, Honegger K, Zefferer M,Neufeld E, Rascher W, Janka R, Bautz W, Chen J, Kiefer B,Schmitt P, Hollenbach HP, Shen J, Oberle M, Szczerba D,Kam A, Guag JW, and Kuster N. The Virtual Family - devel-opment of surface-based anatomical models of two adults andtwo children for dosimetric simulations. Physics in Medicineand Biology, 55(2):N23–N38, 2010.

BIBLIOGRAPHY 197
[16] Hasgall PA, Neufeld E, Gosselin MC, Klingenbock A, andKuster N. IT’IS database for thermal and electromagneticparameters of biological tissues. Last accessed July 2012.www.itis.ethz.ch/database, 2012.
[17] Gabriel S, Lau R, and Gabriel C. The dielectric properties ofbiological tissues : II . Measurements in the frequency range 10Hz to 20 GHz. Physics in Medicine and Biology, 41:2251–2269,1996.
[18] Wust P, Nadobny J, Szimtenings M, Stetter E, and Geller-mann J. Implications of clinical RF hyperthermia on protectionlimits in the RF range. Health Physics, 92(6):565–573, 2007.
[19] Graven-Nielsen T, Arendt-Nielsen L, and Mense S. Thermosen-sitivity of muscle: high-intensity thermal stimulation of muscletissue induces muscle pain in humans. The Journal of Physiol-ogy, 540(2):647–656, 2002.
[20] Taylor WF, Johnson JM, O’Leary D, and Park MK. Effect ofhigh local temperature on reflex cutaneous vasodilation Effectof high local temperature on reflex cutaneous vasodilation. J.Appl. Physiol.: Respirat. Environ. Exercise Physiol., 57(1):191–196, 1984.
[21] Laakso I and Hirata A. Dominant factors affecting tempera-ture rise in simulations of human thermoregulation during RFexposure. Physics in Medicine and Biology, 56(23):7449–7471,2011.
[22] Foster KR and Adair ER. Modeling thermal responses in humansubjects following extended exposure to radiofrequency energy.Biomedical Engineering Online, 3:4, 2004.
[23] Sapareto SA and Dewey WC. Thermal dose determination incancer therapy. International Journal of Radiation Oncology,Biology, Physics, 10(6):787–800, 1984.
[24] Dewhirst MW, Viglianti BL, Lora-Michiels M, Hanson M, andHoopes PJ. Basic principles of thermal dosimetry and thermal

198 BIBLIOGRAPHY
thresholds for tissue damage from hyperthermia. InternationalJournal of Hyperthermia, 19(3):267–94, 2003.
[25] Yarmolenko PS, Moon EJ, Landon C, Manzoor A,Hochman DW, Viglianti BL, and Dewhirst MW. Thresh-olds for thermal damage to normal tissues: an update.International Journal of Hyperthermia, 27(4):320–43, 2011.
[26] Neufeld E, Kuhn S, Szekely G, and Kuster N. Measurement,simulation and uncertainty assessment of implant heating dur-ing MRI. Physics in Medicine and Biology, 54(13):4151–69,2009.
[27] Shrivastava D, Hanson T, Schlentz R, Gallaghar W, Snyder C,Delabarre L, Prakash S, Iaizzo P, and Vaughan JT. Radiofre-quency heating at 9.4T: in vivo temperature measurement re-sults in swine. Magnetic Resonance in Medicine, 59(1):73–8,2008.
[28] Brunner DO and Pruessmann KP. B1(+) interferometry forthe calibration of RF transmitter arrays. Magnetic Resonancein Medicine, 61(6):1480–8, 2009.
[29] Ludemann L, Wlodarczyk W, Nadobny J, Weihrauch M, Geller-mann J, and Wust P. Non-invasive magnetic resonance ther-mography during regional hyperthermia. International Journalof Hyperthermia, 26(3):273–82, 2010.
[30] Marshall J, Martin T, Downie J, and Malisza K. A comprehen-sive analysis of MRI research risks : in support of full disclosure.Can. J. Neurol. Sci., 34:11–17, 2007.
[31] Personal-Communication. Siemens Medical Solutions. 2007.
[32] Capstick M, McRobbie D, Hand J, Christ A, Kuehn S,Hansson Mild K, Cabot E, Li Y, Melzer A, Papadaki A, Pruss-mann K, Quest R, Rea M, Ryf S, Oberle M, and Kuster N.An investigation into occupational exposure to electromag-netic fields for personnel working with and around medicalmagnetic resonance imaging equipment. available online

BIBLIOGRAPHY 199
www.myesr.org/html/img/pool/VT2007017FinalReportv04.pdf,2007.
[33] Murbach M, Cabot E, Neufeld E, Gosselin MC, Christ A, andKuster N. Local SAR enhancements in anatomically correctchildren and adult models as a function of position within 1.5T MR body coil. Progress in Biophysics and Molecular Biology,107(3):428–433, 2011.
[34] Nadobny J, Szimtenings M, Diehl D, Stetter E, Brinker G, andWust P. Evaluation of MR-induced hot spots for different tem-poral SAR modes using a time-dependent temperature gradi-ent treatment. IEEE Transactions on Biomedical Engineering,54(10):1837–1850, 2007.
[35] Christ A, Gosselin MC, Christopoulou M, Kuhn S, andKuster N. Age-dependent tissue-specific exposure of cell phoneusers. Physics in Medicine and Biology, 55(7):1767–83, 2010.
[36] Mosteller R. Simplified calculation of body-surface area. NewEngland Journal of Medicine, 317(17):1098, 1987.
[37] Hand JW, Li Y, Thomas EL, Rutherford Ma, and Hajnal JV.Prediction of specific absorption rate in mother and fetus as-sociated with MRI examinations during pregnancy. MagneticResonance in Medicine, 55(4):883–93, 2006.
[38] Peyman a, Gabriel C, Benedickter HR, and Frohlich J. Dielec-tric properties of human placenta, umbilical cord and amnioticfluid. Physics in Medicine and Biology, 56(7):N93–8, 2011.
[39] Bakker JF, Paulides MM, Christ A, Kuster N, and vanRhoon GC. Assessment of induced SAR in children exposedto electromagnetic plane waves between 10 MHz and 5.6 GHz.Physics in Medicine and Biology, 56(9):2883–2883, 2011.
[40] Benkler S, Chavannes N, and Kuster N. Novel FDTD Huygenssource enables highly complex simulation scenarios on ordinaryPCs. In Antennas and Propagation Society International Sym-posium, 2009. APSURSI’09. IEEE, number 1, pages 1–4. IEEE,2009.

200 BIBLIOGRAPHY
[41] Taylor BN and Kuyatt CE. Guidelines for evaluating and ex-pressing the uncertainty of NIST measurement results. NIST,Gaithersburg, MD, USA, Technical Note 1297, 1994.
[42] Hand JW, Li Y, and Hajnal JV. Numerical study of RF expo-sure and the resulting temperature rise in the foetus during amagnetic resonance procedure. Physics in Medicine and Biol-ogy, 55(4):913–30, 2010.
[43] Murbach M, Neufeld E, Kainz W, Pruessmann KP, andKuster N. Whole-body and local RF absorption in human mod-els as a function of anatomy and position within 1.5T MR bodycoil. Magnetic Resonance in Medicine, (published online aheadof print), 2013.
[44] Homann H, Bornert P, Eggers H, Nehrke K, Dossel O, andGraesslin I. Toward individualized SAR models and in vivo val-idation. Magnetic Resonance in Medicine, 66(6):1767–76, 2011.
[45] Murbach M, Neufeld E, Capstick M, Kainz W, Brunner DO,Samaras T, Pruessmann KP, and Kuster N. Thermal tissuedamage model analyzed for different hole-body SAR and scandurations for standard MR body coils. Magnetic Resonance inMedicine, (published online ahead of print), 2013.
[46] Wang Z, Lin JC, Mao W, Liu W, Smith MB, and Collins CM.SAR and temperature: simulations and comparison to regula-tory limits for MRI. Journal of Magnetic Resonance Imaging,26(2):437–441, 2007.
[47] Fiala D, Lomas K, and Stohrer M. A computer model of humanthermoregulation for a wide range of environmental conditions:the passive system. Journal of Applied Physiology, 87(5):1957,1999.
[48] Lang J, Erdmann B, and Seebass M. Impact of nonlinear heattransfer on temperature control in regional hyperthermia. IEEETransactions on Biomedical Engineering, 46(9):1129–38, 1999.
[49] ISO/TS. 10974:2012, Requirements for the safety of magneticresonance imaging for patients with an active implantable med-ical device.

BIBLIOGRAPHY 201
[50] Stolwijk JAJ. Mathematical models of thermal regulation. An-nals of the New York Academy of Sciences, 335:98–106, 1980.
[51] Barcroft H and Edholm O. The effect of temperature on bloodflow and deep temperature in the human forearm. J. Physiol.,102(1):5–20, 1943.
[52] Bernardi P, Cavagnaro M, Pisa S, and Piuzzi E. Specific ab-sorption rate and temperature elevation in a subject exposedin the far-field of radio-frequency sources operating in the 10-900-MHz range. IEEE Transactions on Biomedical Engineering,50(3):295–304, 2003.
[53] Fiala D, Lomas KJ, and Stohrer M. Computer prediction ofhuman thermoregulatory and temperature responses to a widerange of environmental conditions. International Journal ofBiometeorology, 45(3):143–59, 2001.
[54] Neufeld E, Chavannes N, Samaras T, and Kuster N. Novelconformal technique to reduce staircasing artifacts at materialboundaries for FDTD modeling of the bioheat equation. Physicsin Medicine and Biology, 52(15):4371–81, 2007.
[55] Wust P, Stahl H, Loffel J, Seebass M, Riess H, and Felix R.Clinical, physiological and anatomical determinants for radiofre-quency hyperthermia. International Journal of Hyperthermia,11(2):151–67, 2000.
[56] Paprottka FJ, Machens HG, and Lohmeyer JA. Third-degreeburn leading to partial foot amputation - Why a notebook is nolaptop. Journal of plastic, reconstructive & aesthetic surgery :JPRAS, pages 10–13, 2012.
[57] Shellock FG and Crues JV. Radiology MR procedures : biologiceffects, safety, and patient care. Radiology, 232:635–652, 2004.
[58] Kikuchi S, Saito K, Takahashi M, Ito K, and Ikehira H. SARcomputation inside fetus by RF coil during MR imaging employ-ing realistic numerical pregnant woman model. IEICE Trans-actions on Communications, E92-B(2):431–439, 2009.

202 BIBLIOGRAPHY
[59] Pediaditis M, Leitgeb N, and Cech R. RF-EMF exposure offetus and mother during magnetic resonance imaging. Physicsin Medicine and Biology, 53(24):7187–95, 2008.
[60] Voigt T, Homann H, Katscher U, and Doessel O. Patient-individual local SAR determination: In vivo measurements andnumerical validation. Magnetic Resonance in Medicine, 000,2011.
[61] van den Bergen B, van den Berg CaT, Klomp DWJ, and La-gendijk JJW. SAR and power implications of different RF shim-ming strategies in the pelvis for 7T MRI. Journal of MagneticResonance Imaging, 30(1):194–202, 2009.
[62] Borbely A, Huber R, Graf T, Fuchs B, Gallmann E, and Acher-mann P. Pulsed high-frequency electromagnetic field affects hu-man sleep and sleep electroencephalogram. Neuroscience Let-ters, 275:207–210, 1999.
[63] Huber R, Graf T, Cote KA, Wittmann L, Gallmann E, Mat-ter D, Schuderer J, Kuster N, Borbely AA, and Achermann P.Exposure to pulsed high-frequency electromagnetic field duringwaking affects human sleep EEG. NeuroReport, 11(15):3321–3325, 2000.
[64] Regel SJ, Tinguely G, Schuderer J, Adam M, Kuster N, Lan-dolt HP, and Achermann P. Pulsed radio-frequency electromag-netic fields: Dose-dependent effects on sleep, the sleep EEG andcognitive performance. Journal of Sleep Research, 16(3):253–258, 2007.
[65] Schmid MR, Loughran SP, Regel SJ, Murbach M, BraticGrunauer A, Rusterholz T, Bersagliere A, Kuster N, and Acher-mann P. Sleep EEG alterations: effects of different pulse-modulated radio frequency electromagnetic fields. Journal ofSleep Research, 21(1):50–58, 2012.
[66] Schmid MR, Murbach M, Lustenberger C, Maire M, Kuster N,Achermann P, and Loughran SP. Sleep EEG alterations: ef-fects of pulsed magnetic fields versus pulse-modulated radio

BIBLIOGRAPHY 203
frequency electromagnetic fields. Journal of Sleep Research,21(6):620–629, 2012.
[67] Loughran S, Benz D, Schmid MR, Murbach M, Kuster N, andAchermann P. No increased sensitivity in brain activity of ado-lescents exposed to mobile phone-like emissions. Clinical Neu-rophysiology, (published online ahead of print), 2013.
[68] Loughran SP, Wood AW, Barton JM, Croft RJ, Thompson B,and Stough C. The effect of electromagnetic fields emitted bymobile phones on human sleep. NeuroReport, 16(17):1973–1976,2005.
[69] Volkow ND, Vaska P, Fowler JS, Telang F, Alexoff D, Logan J,and Wong C. Effects of cell phone radiofrequency signal ex-posure on brain glucose metabolism. JAMA, 305(8):808–813,2011.
[70] Lehmann H, Pollara L, Spichtig S, Kuhn S, and Wolf M. Headexposure system for a human provocation study to assess thepossible influence of UMTS-like electromagnetic fields on cere-bral blood circulation using near-infrared imaging. Bioelectro-magnetics, (June), 2011.
[71] Regel SJ, Negovetic S, Roosli M, Berdinas V, Schuderer J,Huss A, Lott U, Kuster N, and Achermann P. UMTS basestation-like exposure, well-being, and cognitive performance.Environmental Health Perspectives, 114(8):1270–1275, 2006.
[72] Wood AW, Loughran SP, and Stough C. Does evening exposureto mobile phone radiation affect subsequent melatonin produc-tion? International Journal of Radiation Biology, 82(2):69–76,2006.
[73] Kuhn S and Kuster N. Field evaluation of the human exposurefrom multiband , multisystem mobile phones. IEEE Transac-tions on Electromagnetic Compatibility, 55(2):275–287, 2013.
[74] Hirata A and Shiozawa T. Correlation of maximum tempera-ture increase and peak SAR in the human head due to handset

204 BIBLIOGRAPHY
antennas. IEEE Transactions on Microwave Theory and Tech-niques, 51(7):1834–1841, 2003.
[75] Lin JC. Hearing microwaves : the microwave auditory phe-nomenon. IEEE Antennas ond Propagation Magazine, 43(6):6–8, 2001.
[76] Lustenberger C, Murbach M, Durr R, Schmid MR, Kuster N,Achermann P, and Huber R. Stimulation of the brainwith radiofrequency electromagnetic field pulses affects sleep-dependent performance improvement. Brain Stimulation,6(5):805–811, 2013.
[77] Loughran SP, McKenzie RJ, Jackson ML, Howard ME, andCroft RJ. Individual differences in the effects of mobile phoneexposure on human sleep: rethinking the problem. Bioelectro-magnetics, 33(1):86–93, 2012.
[78] Murbach M, Christopoulou M, Crespo-Valero P, Achermann P,and Kuster N. Exposure system to study hypotheses of ELFand RF electromagnetic field interactions of mobile phones withthe central nervous system. Bioelectromagnetics, 33(6):527–533,2012.
[79] Borbely A, Huber R, Graf T, Fuchs B, Gallmann E, and Acher-mann P. Pulsed high-frequency electromagnetic field affects hu-man sleep and sleep electroencephalogram. Neuroscience Let-ters, 275(3):207–210, 1999.
[80] Huber R, Graf T, Cote KA, Wittmann L, Gallmann E, Mat-ter D, Schuderer J, Kuster N, Borbely A, and Achermann P.Exposure to pulsed high-frequency electromagnetic field duringwaking affects human sleep EEG. NeuroReport, 11(15):3321–3325, 2000.
[81] Huber R, Treyer V, Borbely A, Schuderer J, Gottselig JM, Lan-dolt HP, Werth E, Berthold T, Kuster N, Buck A, and Acher-mann P. Electromagnetic fields, such as those from mobilephones, alter regional cerebral blood flow and sleep and wak-ing EEG. Journal of Sleep Research, 11(4):289–295, 2002.

BIBLIOGRAPHY 205
[82] Regel SJ, Tinguely G, Schuderer J, Adam M, Kuster N, Lan-dolt HP, and Achermann P. Pulsed radio-frequency electromag-netic fields: dose-dependent effects on sleep, the sleep EEG andcognitive performance. Journal of Sleep Research, 16(3):253–258, 2007.
[83] Bernardi P. Specific absorption rate and temperature increasesin the head of a cellular-phone user. IEEE Transactions onMicrowave Theory and Techniques, BME-31(2):120–1126, 2000.
[84] Samaras T, Kalampaliki E, and Sahalos JN. Influence of ther-mophysiological parameters on the calculations of temperaturerise in the head of mobile phone users. IEEE Transactions onElectromagnetic Compatibility, 49(4):936–939, 2007.
[85] Huber R, Treyer V, Schuderer J, Berthold T, Buck A, Kuster N,Landolt HP, and Achermann P. Exposure to pulse-modulatedradio frequency electromagnetic fields affects regional cerebralblood flow. European Journal of Neuroscience, 21(4):1000–1006,2005.
[86] Kuster N, Schuderer J, Christ A, Futter P, and Ebert S. Guid-ance for exposure design of human studies addressing health riskevaluations of mobile phones. Bioelectromagnetics, 25(7):524–9,2004.
[87] Boutry CM, Kuhn S, Achermann P, Romann A, Keshvari J, andKuster N. Dosimetric evaluation and comparison of different RFexposure apparatuses used in human volunteer studies. Bioelec-tromagnetics, 29(1):11–19, 2008. published online August 10,2007.
[88] Ebert S. EMF Risk Assessment: Exposure Systems for Large-Scale Laboratory and Experimental Provocation Studies. phdthe-sis, Swiss Federal Institute of Technology, Zurich, Switzerland,Hartung-Gorre Verlag Konstanz. Germany, 2009. ETHZ PhDThesis, Defense: 29 September 2009.
[89] Crespo-Valero P, Christopoulou M, Zefferer M, Christ A, Acher-mann P, Nikita KS, and Kuster N. Novel methodology to

206 BIBLIOGRAPHY
characterize electromagnetic exposure of the brain. Physics inMedicine and Biology, 56(2):383–396, 2010.
[90] Huber R, Schuderer J, Graf T, Jutz K, Borbely A, Kuster N, andAchermann P. Radio frequency electromagnetic field exposurein humans: Estimation of SAR distribution in the brain, effectson sleep and heart rate. Bioelectromagnetics, 24(4):262–276,2003.
[91] Murbach M, Neufeld E, Christopoulou M, Achermann P, andKuster N. Evaluation of electrode artifacts and thermal ripplesof EEG RF experiments. Bioelectromagnetics, submitted, 2013.
[92] Reiser H, Dimpfel W, and Schober F. The influence of electro-magnetic fields on human brain activity. European Journal ofMedical Research, 1(1):27–32, 1995.
[93] Croft RJ, Chandler JS, Burgess AP, Barry RJ, Williams JD,and Clarke AR. Acute mobile phone operation affects neuralfunction in humans. Clinical Neurophysiology, 113(10):1623–1632, 2002.
[94] Curcio G, Ferrara M, Moroni F, D’Inzeo G, Bertini M, and DeGennaro L. Is the brain influenced by a phone call? An EEGstudy of resting wakefulness. Neuroscience Research, 53(3):265–270, 2005.
[95] Van Rongen E, Croft R, Juutilainen J, Lagroye I, Miyakoshi J,Saunders R, De Seze R, Tenforde T, Verschaeve L, Veyret B,and Xu Z. Effects of radiofrequency electromagnetic fields onthe human nervous system. Journal of Toxicology and Environ-mental Health, Part B, 12(8):572–597, 2009.
[96] Krause CM, Bjornberg CH, Pesonen M, Hulten A, Liesivuori T,Koivisto M, Revonsuo A, Laine M, and Hamalainen H. Mobilephone effects on children’s event-related oscillatory EEG duringan auditory memory task. International Journal of RadiationBiology, 82(6):443–450, 2006.

BIBLIOGRAPHY 207
[97] Schmid G, Cecil S, Goger C, Trimmel M, Kuster N, and Molla-Djafari H. New head exposure system for use in human provoca-tion studies with EEG recording during GSM900- and UMTS-like exposure. Bioelectromagnetics, 28(8):636–647, 2007.
[98] Angelone LM, Bit-Babik G, and Chou CK. Computational elec-tromagnetic analysis in a human head model with EEG elec-trodes and leads exposed to RF-field sources at 915 MHz and1748 MHz. Radiation Research, 174(1):91–100, 2010.
[99] Christopoulou M, Kazasidis O, and Nikita KS. Numerical as-sessment of EEG electrode artifacts during EMF exposure inhuman provocation studies. Wireless Mobile Communicationand Healthcare, Lecture Notes of the Institute for Computer Sci-ences, Social Informatics and Telecommunications Engineering,83:408–415, 2012.
[100] Johnson C and Guy A. Nonionizing electromagnetic wave effectsin biological materials and systems. Proceedings of the IEEE,60(6):692–718, 1972.
[101] Drossos A, Santomaa V, and Kuster N. Absorption upon hu-man head tissue composition in the frequency range of 300-3000MHz. IEEE Transactions on Microwave Theory and Techniques,48(11):1988–1995, 2000.
[102] Regel SJ, Gottselig JM, Schuderer J, Tinguely G, Retey JV,Kuster N, Landolt HP, and Achermann P. Pulsed radio fre-quency radiation affects cognitive performance and the wakingelectroencephalogram. Technical Report 8, University of Zurich,Institute of Pharmacology and Toxicology, Zurich, Switzerland.,2007.
[103] Croft RJ, Hamblin DL, Spong J, Wood aW, McKenzie RJ, andStough C. The effect of mobile phone electromagnetic fields onthe alpha rhythm of human electroencephalogram. Bioelectro-magnetics, 29(1):1–10, 2008.
[104] Regel SJ and Achermann P. Cognitive performance measures inbioelectromagnetic research–critical evaluation and recommen-

208 BIBLIOGRAPHY
dations. Environmental health : a global access science source,10(1):10, 2011.
[105] Diekelmann S and Born J. The memory function of sleep. NatureReviews Neuroscience, 11(2):114–126, 2010.
[106] Gais S, Molle M, Helms K, and Born J. Learning-dependentincreases in sleep spindle density. Technical Report 15, De-partment of Neuroendocrinology, University of Lubeck, 23564Lubeck, Germany., 2002.
[107] Schabus M, Hodlmoser K, Gruber G, Sauter C, Anderer P,Klosch G, Parapatics S, Saletu B, Klimesch W, and Zeitlhofer J.Sleep spindle-related activity in the human EEG and its relationto general cognitive and learning abilities. European Journal ofNeuroscience, 23(7):1738–1746, 2006.
[108] Huber R, Ghilardi MF, Massimini M, Ferrarelli F, Riedner BA,Peterson MJ, and Tononi G. Arm immobilization causes corticalplastic changes and locally decreases sleep slow wave activity.Nature Neuroscience, 9(9):1169–1176, 2006.
[109] Huber R, Ghilardi MF, Massimini M, and Tononi G. Local sleepand learning. Nature, 430(6995):78–81, 2004.
[110] Hill S, Tononi G, and Ghilardi MF. Sleep improves the variabil-ity of motor performance. Brain Research Bulletin, 76(6):605–611, 2008.
[111] Steriade M, Nunez A, and Amzica F. A novel slow (¡ 1 Hz) oscil-lation of neocortical neurons in vivo: depolarizing and hyperpo-larizing components. Journal of Neuroscience, 13(8):3252–3265,1993.
[112] Borbely AA and Achermann P. Sleep homeostasis and models ofsleep regulation. Journal of Biological Rhythms, 14(6):557–568,1999.
[113] Steriade M. Grouping of brain rhythms in corticothalamic sys-tems. Neuroscience, 137(4):1087–1106, 2006.

BIBLIOGRAPHY 209
[114] De Gennaro L and Ferrara M. Sleep spindles : an overview.Sleep Medicine, 7(5):423–440, 2003.
[115] Walker MP, Brakefield T, Morgan A, Hobson JA, and Stick-gold R. ScienceDirect - Neuron : Practice with Sleep Makes Per-fect: Sleep-Dependent Motor Skill Learning. Neuron, 35:205–211, 2002.
[116] Driver HS, Dijk DJ, Werth E, Biedermann K, and Borbely AA.Sleep and the sleep electroencephalogram across the menstrualcycle in young healthy women. The Journal of Clinical En-docrinology & Metabolism, 81(2):728–735, 1996.
[117] Iber C, Ancoli-Israel S, Chesson A, and Quan SF. The AASMManual for the Scoring of Sleep and Associated Events: Rules,Terminology and Technical Specifications. American Academyof Sleep Medicine, 2007.
[118] Delorme A and Makeig S. EEGLAB: an open source tool-box for analysis of single-trial EEG dynamics including inde-pendent component analysis. Journal of Neuroscience Methods,134(1):9–21, 2004.
[119] Pfurtscheller G and Lopes Da Silva FH. Event-relatedEEG/MEG synchronization and desynchronization: basic prin-ciples. Clinical Neurophysiology, 110(11):1842–1857, 1999.
[120] Barrett G, Neshige R, and Shibasaki H. Auditory event-relateddynamics of the EEG spectrum and effects of exposure totones. Electroencephalography and Clinical Neurophysiology,66(4):409–419, 1987.
[121] Tallon-Baudry C, Bertrand O, Delpuech C, and Pernier J. Stim-ulus specificity of phase-locked and non-phase-locked 40 Hz vi-sual responses in human. Journal of Neuroscience, 16(13):4240–9, 1996.
[122] Makeig S, Debener S, Onton J, and Delorme A. Mining event-related brain dynamics. Trends in Cognitive Sciences, 8(5):204–210, 2004.

210 BIBLIOGRAPHY
[123] Brawn TP, Fenn KM, Nusbaum HC, and Margoliash D. Con-solidating the effects of waking and sleep on motor-sequencelearning. Journal of Neuroscience, 30(42):13977–13982, 2010.
[124] Rickard TC, Cai DJ, Rieth CA, Jones J, and Ard MC. Sleepdoes not enhance motor sequence learning. Journal of experi-mental psychology Learning memory and cognition, 34(4):834–842, 2008.
[125] Marshall L, Helgadottir H, Molle M, and Born J. Boosting slowoscillations during sleep potentiates memory. Technical Report7119, University of Lubeck, Department of Neuroendocrinol-ogy, Haus 23a, Ratzeburger Allee 160, 23538 Lubeck, [email protected], 2006.
[126] Ozen S, Sirota A, Belluscio MA, Anastassiou CA, Stark E,Koch C, and Buzsaki G. Transcranial electric stimulation en-trains cortical neuronal populations in rats. The Journal ofNeuroscience, 30(34):11476–11485, 2010.
[127] Vyazovskiy VV, Olcese U, Lazimy YM, Faraguna U, Esser SK,Williams JC, Cirelli C, and Tononi G. Cortical firing and sleephomeostasis. Neuron, 63(6):865–878, 2009.
[128] Vyazovskiy VV, Cirelli C, and Tononi G. Electrophysiologicalcorrelates of sleep homeostasis in freely behaving rats. Progressin Brain Research, 193(608):17–38, 2011.
[129] Aeschbach D and Borbely AA. All-night dynamics of the humansleep EEG. Journal of Sleep Research, 2(2):70–81, 1993.
[130] Carrubba S, Frilot C, Chesson AL, and Marino AA. Evidence ofa nonlinear human magnetic sense. Technical Report 1, Depart-ment of Orthopedic Surgery, Louisiana State University HealthSciences Center, P.O. Box 33932, 1501 Kings Highway, Shreve-port, LA 71130-3932, USA., 2007.
[131] Anastassiou CA, Perin R, Markram H, and Koch C. Ephapticcoupling of cortical neurons. Nature Neuroscience, 14(2):217–223, 2011.

BIBLIOGRAPHY 211
[132] Tononi G and Cirelli C. Sleep function and synaptic homeosta-sis. Sleep Medicine Reviews, 10(1):49–62, 2006.
[133] Vyazovskiy VV, Cirelli C, Pfister-Genskow M, Faraguna U, andTononi G. Molecular and electrophysiological evidence for netsynaptic potentiation in wake and depression in sleep. NatureNeuroscience, 11(2):200–208, 2008.
[134] Ferreri F, Curcio G, Pasqualetti P, De Gennaro L, Fini R, andRossini PM. Mobile phone emissions and human brain excitabil-ity. Annals of Neurology, 60(2):188–196, 2006.
[135] Czarnecki A, Birtoli B, and Ulrich D. Cellular mechanismsof burst firing-mediated long-term depression in rat neocorticalpyramidal cells. The Journal of Physiology, 578(Pt 2):471–479,2007.
[136] Landolt HP, Dijk DJ, Gaus SE, and Borbely AA. Caffeine re-duces low-frequency delta activity in the human sleep EEG.Neuropsychopharmacology, 12(3):229–238, 1995.
[137] Lin J. The microwave auditory phenomenon. Proceedings of theIEEE, 68(1):67–73, 1980.
[138] Costa FP, de Oliveira aC, Meirelles R, Machado MCC,Zanesco T, Surjan R, Chammas MC, de Souza Rocha M, Mor-gan D, Cantor a, Zimmerman J, Brezovich I, Kuster N, Bar-bault a, and Pasche B. Treatment of advanced hepatocellularcarcinoma with very low levels of amplitude-modulated electro-magnetic fields. British Journal of Cancer, pages 1 – 9, 2011.
[139] Murbach M, Neufeld E, Pruessmann KP, and Kuster N. SafeMR scan times based on CEM43 tissue damage thresholds, us-ing electromagnetic and thermal simulations with anatomicallycorrect human models and considering local thermoregulation.In Proceedings ISMRM, page 2140, 2012.


Curriculum Vitae
Personal Information
• Date of birth July 26th, 1979
• Place of birth Zurich, Switzerland
• Citizenship Swiss
• Parents Lea and Herbert Murbach
Education
• Kantonsschule am Burggraben, St. Gallen, Schweiz1993 - 1998
• Department of Information Technology and ElectricalEngineering, ETH Zurich, Switzerland1999 - 2004
• Master of Advanced Studies in Secondary and HigherEducation (MAS SHE, ”Hoheres Lehramt”) , ETH Zurich,Switzerland2004 - 2005
213

214 CURRICULUM VITAE
• Foundation for Research on Information Technologiesin Society, Zurich, SwitzerlandScientific Assistant2007 - 2008
• Foundation for Research on Information Technologiesin Society, Zurich, SwitzerlandPhD Studies2008 - 2013
Awards
• Best Student Platform Presentation Award of the Bio-electromagnetics Society,BioEM 2009, Davos, Switzerland2009
• Best Poster Award of the Bioelectromagnetics Society,BioEM 2009, Davos, Switzerland2009
• Best Student Platform Presentation Award at the 4thInternational Workshop on Computational Phantoms,CP 2013, Zurich, Switzerland2013
Theses & Internships
• Industrial Internship, Benninger AGUzwil, SwitzerlandFebruary - May 2004
• Temporary R&D Assisstant, Leica Geosystems AGHeerbrugg, SwitzerlandMay - September 2005

215
• Semester Thesis: Hivoltage LabETH Zurich, SwitzerlandSupervisor: Wolfgang Hribernik2003
• Semester Thesis: NIRSETH Zurich, SwitzerlandSupervisor: Dr. Martin Wolf2004
• Master Thesis: Electromagnetic Compatibility (EMC):Cerebral Hemodynamic Effects of Cellular Phone UseSupervisor: Dr. Martin Wolf2004