emerging trends and challenges for geospatial · pdf filegeospatialresearch efforts at both...
TRANSCRIPT

1
Emerging Trends and Challenges for
Geospatial Technology Development in India
K S RajanLab for Spatial Informatics,
International Institute of Information [email protected]
Presented at ICGTA -12, Apr 12-13, 2012. at IITB, Mumbai
IIIT-H
• Established in 1998
– a new star in the Indian Technical Education scenario
• Ranked 7th among Tech-Schools in India (DataQuest, 2008; among Tech Universities in South Asia, 2009)
• A research university
– ICT (CSE, ECE)
– Application Domains
• Research Centers and NO Departments
2
Why Lab for Spatial Informatics?
• to combine strengths/progress in CSE/IT related
to Spatio-Temporal domains with application areas,
ranging from natural to social sciences.
• a nodal point for networking and joint research
works in inter-disciplinary areas (related to resource
use and management), by building on the data
generation, handling and monitoring capability to
analysis and modelling.
• ONLY centre/group of its kind in India promoting
GeoSpatial Research efforts at both system and
applied levels.
Lab for Spatial Informatics
• Started in late 2006
– Still in its infancy
• Faculty : 2 (currently)
• Researchers / Students:
– PhD: 4
– MS by Research: 6
• Graduated: 5+8
– Dual Degree/UG Students: 9+
3
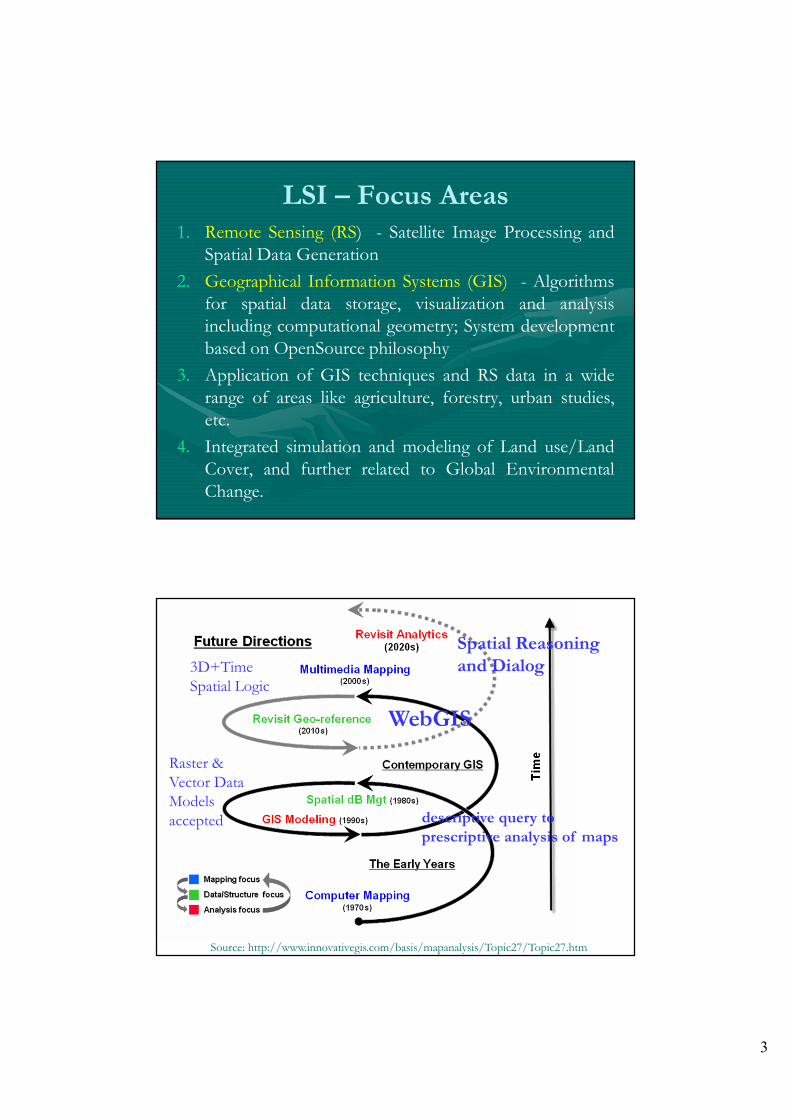
LSI – Focus Areas1. Remote Sensing (RS) - Satellite Image Processing andSpatial Data Generation
2. Geographical Information Systems (GIS) - Algorithmsfor spatial data storage, visualization and analysisincluding computational geometry; System developmentbased on OpenSource philosophy
3. Application of GIS techniques and RS data in a widerange of areas like agriculture, forestry, urban studies,etc.
4. Integrated simulation and modeling of Land use/LandCover, and further related to Global EnvironmentalChange.
• 1970s ~ Computer Mapping
• 1980s ~ Spatial Data Management
– Raster & Vector Data Models accepted
• 1990s ~ Map Analysis and Modelling
– descriptive query to prescriptive analysis of maps
• 2000s ~ WebGIS
– Largely follows the same chain of development
• 2010s~ Multimedia Mapping
– 3D+Time
– Spatial Logic
• Future: Spatial Reasoning and Dialog
Source: http://www.innovativegis.com/basis/mapanalysis/Topic27/Topic27.htm
Raster &
Vector Data
Models
accepted descriptive query to
prescriptive analysis of maps
WebGIS
3D+Time
Spatial Logic
Spatial Reasoning
and Dialog

4
India – GIS Scenario• More than 2 decades old
– Internationally, 4 decades old
• Initial Use driven by – need to store and handle RS
data
– Image/RASTER driven data models
• But, GIS development borrows heavily from
Cartography – focus: Representation/Visualisation
– Vector Models
• Application based Analysis – BUT, limited to tools
• Statistics to (and?) Spatial Analysis
Domain related Challenges
• Use of Tools in GIS Application areas
– Convenience of use
– BUT, Limitations to Scientific Discovery
– NEED, more and better parameterisation
– Cadastral Mapping
• Mismatch between satellite derived data vs Land Records

5
• Land Records
– Paper to digital form
– Remote Sensing / Aerial Photogrammetry
– Re-survey
– Ownership issues
– Re-adjustment of parcels
• Research - Topology driven approach can be
tried
Source: GeoWorld December, 2006 http://www.innovativegis.com/basis/mapanalysis/Topic27/Topic27.htm
6
• Primarily, a Modelling guy – LULC
– GIS based models
– Process oriented Models is more the focus
• Analytics – pre-requisite for Modelling
– Need tools
– Modify the tools, if they are unable to extract what we want
• Analysis is based on Data
– Where is the data?
-- move to FOSS4G
How did I get into Spatial
Sciences
Analytics
• Is it tool-centric or idea-centric ?
• Are there enough tools to do Analysis?
– both effectively and efficiently
– are we back to our scribbling ways
– OR are we part of the innovation, process discovery chain…
• So, Science/Research needs to create new
methods
– Developers are part of this!!

7
Computation – as a way of life!!
• Early stages of Computer Science
– Data storage and handling
– Mathematical process
• Mathematical theory – a main stay of Computing theory
• Applications – Large data handling • Sector-based approaches BFSI, Census
• Age of Internet – Information handling
Need to move from Data to Information
Broad Focus areas
• Computing Paradigm - in all domains
• Interactions between Computing and the
domains
– A One-way street?
– Or Bi-directional?
• Disciplinary and Multi-disciplinary interests –Opening up new paradigms of Computing
• The Indian Context

8
Computer Science – GeoICT
• Waking up to the exciting world of
– Algorithm development – Graph theory, etc
– Multi-dimensional Data
• Data structures and Data bases
– Graphics and Visualization
• 3D – GRID-TIN from either/or to Hybrid
– Parallel Computing
– Information Extraction and Retrieval
– Software Engineering
GIS: Another Application Area to a Frontier in CS/IT
Geospatial Technologies
– Location is it a variable or a constant?
– Geospatial Information Systems – Modifying Computer Science
• Simple Map Visualization to Web-based Map mashups
• DB to Geo/Spatial DB; Spatial Data Mining
• Analysis
– Statistical to evolving field of Spatio-Statistical tools
– BI to Geo-BI
• Modelling and Simulation
– Eg., Complex Climate-Social-Economic Integrated Modelling
– Remote Sensing - again, Volumes of Data to
Information – a still struggling journey

9
Mapping & Visualization: CG, Visual data manipulation,
Presentation, Automated Mapping
GIS Spatial Analysis: Rule and Relation based Analysis,
Simulations, Agent based modelling
Spatial Data Base: Data Collection & Generation, Retrieval,
Editing, Updating, Build Spatio-Temporal
data relation (data quality), Inventory
Main functions of GIS
Source: Longley, Goodchild, Maguire, Rhind [2001]
GI Science
GI Systems GI Services
???
- Primary focus on tools
Data & More Data

10
Applications
Remote Sensing Geo-Spatial Information
Systems
Theory
Environment / Policy / System Building
Classification techniques
- time-series
- Spatial Data Mining
Cropping SeasonIrrigation Mapping
Land Use Modeling
Locating News
& Geo-context
Auto Geo-registration
Algorithms for
Airline Industry
CANSAT
Competition
OBIA, Fusion, Change Detection
FOSS4G
Spatial Statistics
& Spatial Data Mining
Moving Objects –
Data & Analysis
Spatial Information
Extraction Eg.Roads
Tessellations and
Mobile
Network PlanningDrought Monitoring
Parallel Computing
& Mobility
VRGeo – Collab Mapping
Online Shapefile Viewer
GM
L an
d
Geo
-Web
Constrained
Networks
Challenges
• Technology (IT) – enabler ? – More data (single info layers to mash-ups)
– More accessibility
– Evolution of Intelligent Decision Support Systems
• Rapid changes in IT infra– Are our data models good enough?
– How Location aware technologies can seamlessly talk to say, Spatial Data Infrastructure • World of Sensing, Data collation, and Separating the chaff

11
What is the Success of an SDI
If SDInfrastructure is like a Road being laid
• Conformance to Standards
• Interoperability and Data flow/download
– With/without toll collection
• What if this Road connects to not-so-interacting
centers/cities/towns
– Hence, low usage – less clicks on GeoPortal
• Enabler of Services
– A good road also brings in More Shops
– Infra leads to Service
Disruptive Technologies
• Internet – Web 2.0; HTML 5 canvas
• Mobile-based incld Tablets
• Improvements in low-powered and better
accuracy GPS receivers
• One-way to Interactive approaches

12
LSI@IIIT-H’s Work in the
Context of SDI• SDI Standards related
– Mostly GML based
• Cumbersome and heavy
• Needs large bandwidth
• SADAK – Project Freeway
• VRGeo – Village Resource GeoSpatial Platform
– Crowd sourcing the data,
– so also pronounced “WE-ARE GEO”
GML Data Handling
• With increase in the amount of data, the
number of users of the data has also
increased considerably overloading the
servers with the geo requests.
• One of the possible solutions is the use of
distributed databases and distributed
networks including mirror sites.
• The other solution is reduction in the size
of the data, i.e., GML data compression.

13
Proposed methodology
• The proposed methodology comprises of mainly two steps :-
– Common boundaries extraction and edge indexing
– Coordinate data management using a tree structure.
• The first step mainly focuses on the occurrence of common
boundaries based on the feature’s topological relationships.
• The second step introduces a tree structure for eliminating the
repetition of digits in the coordinates.
• Here, the work focuses on the polygon data, since they exhibit the
adjacency property
Flow chart of the algorithm

14
GTrees Compression Algorithm
�Exploits the Topology of the Data to eliminate redundancies in coordinate data
�A tree-based data structure is employed for data storage, thus making recovery of compressed data in a LOSSLESS way
�Interestingly, this Compressed Tree-based data structure helps handling efficiently Spatial Queries
Data files • To evaluate the performance of the proposed method, it was applied on
a range of GML data file sizes. These GML data files were created from
the district boundary dataset of India covering various geographies.GML File name No. of polygons No .of
vertices
GML file size (in
kilobytes)
Coordinate data
size(in
kilobytes)
% of the
coordinate data
in file
D1 17 5460 244 236 96.72
D2 13 9457 416 392 94.23
D3 24 17163 768 740 96.35
D4 29 26578 1200 1124 93.67
D5 72 52217 2300 2152 93.57
D6 117 84999 3600 3464 96.22
D7 145 113833 4900 4689 95.69
D8 185 152421 6500 6150 94.61
D9 267 204000 8600 8205 95.40
D10 351 263678 12000 11568 96.4
D11 468 357103 16000 15450 96.56

15
• Fig.5. Sample view of some of the data files
Results and DiscussionGML file name % of
compression
using common
boundaries
approach
% of
compression
using
coordinate data
tree approach
% of
compression
when both are
applied
D1 31.2 32.1 57.3
D2 30.1 32.3 54.1
D3 31.3 34.7 58.6
D4 31 35.9 60.5
D5 33.6 36.2 61.5
D6 35.6 36.8 62.1
D7 36.4 37.3 63.4
D8 36.7 37.9 63.9
D9 37.3 38.3 66.3
D10 37.1 38.8 66.7
D11 41.1 40.5 68.4

16
GTapp
• A Desktop user interface application is
developed to test all the operations including:-
– Compression
– Decompression
– Rendering of GML data in svg format.
• This app allows the user to use the Compressed
GML
GML data rendered
• Plain GML is converted to SVG format
and rendered
17
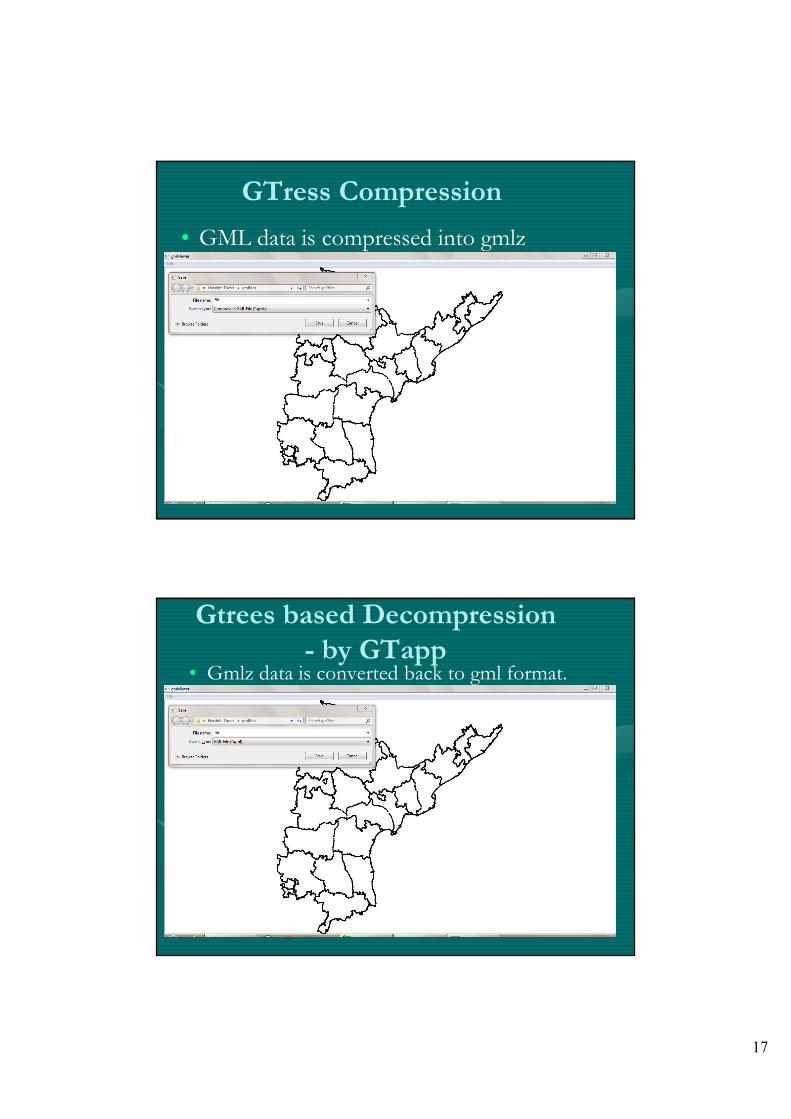
GTress Compression
• GML data is compressed into gmlz
format.
Gtrees based Decompression
- by GTapp• Gmlz data is converted back to gml format.
18
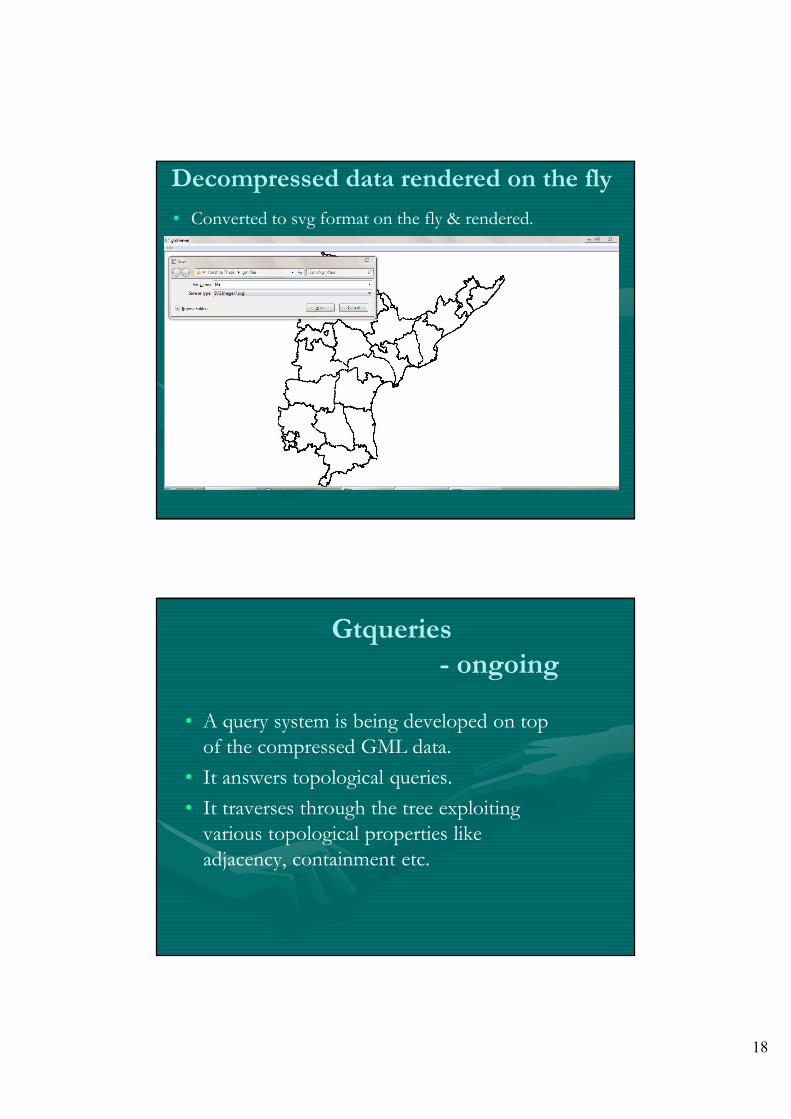
Decompressed data rendered on the fly
• Converted to svg format on the fly & rendered.
Gtqueries
- ongoing
• A query system is being developed on top
of the compressed GML data.
• It answers topological queries.
• It traverses through the tree exploiting
various topological properties like
adjacency, containment etc.

19
GIS computation timeline
High performance computing
• Current scenario
– Natural progression of current computing
– Accepted by Computing community
– Corresponding wide spread haste
• Practical issues
– Non Trivial
– Highly dependent on architecture
– Research community trying to bridge the gap

20
GIS and High Performance Computing
• Traditional computation model -> Centralized computing
• High performance computing-> Clusters
• Massive transition in HPC– Custom Hardware - GPU and Cell BE–Massive performance to cost ratio – Very good performance to power ratio
• Bottlenecks – Legacy software and practices
Mobility for GIS$.
• Practical features
– Capabilities
– Price
– Size
–Weight
– Battery Life
21
Advantages of amalgamation of HPC and
mobility
• Real time computation
• On-field analysis of data
• Reduction of response time
• Suitable for disaster prevention and management
– Communication not a bottleneck
– Efficient and fast response
– Real time updates possible
• Can nurse expansion of role of GIS
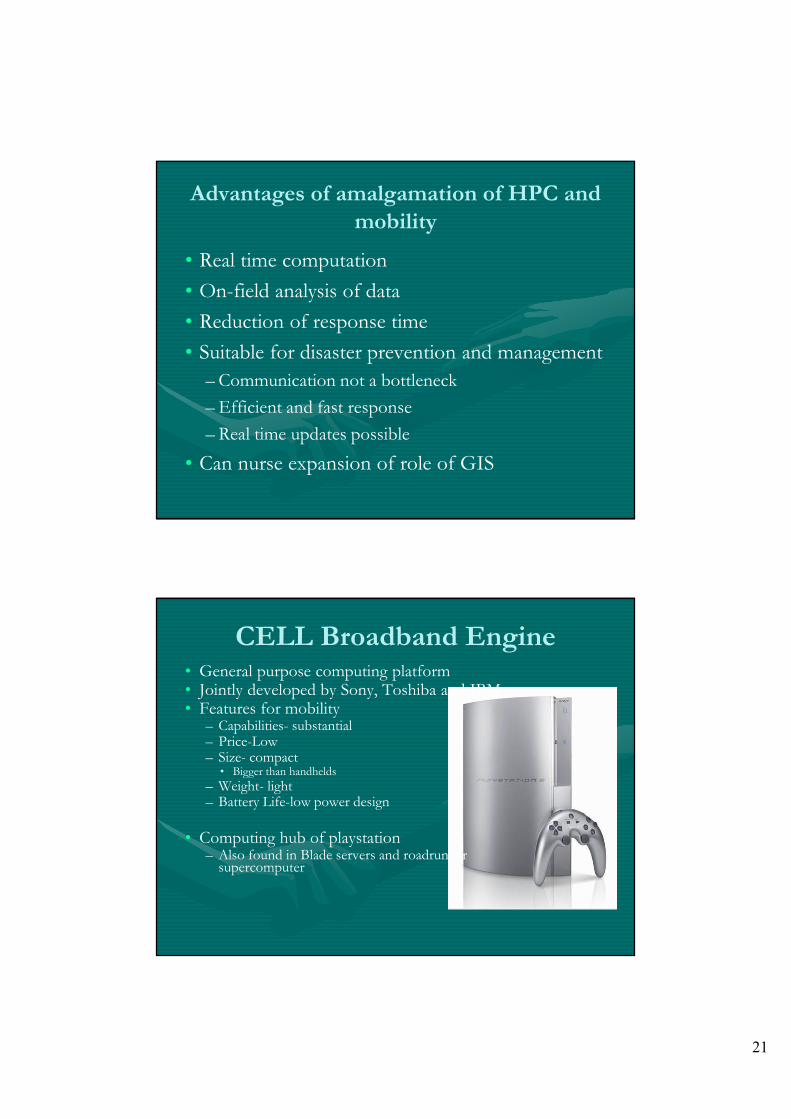
CELL Broadband Engine• General purpose computing platform• Jointly developed by Sony, Toshiba and IBM• Features for mobility– Capabilities- substantial– Price-Low– Size- compact• Bigger than handhelds
– Weight- light– Battery Life-low power design
• Computing hub of playstation– Also found in Blade servers and roadrunner supercomputer

22
Open Source and GIS
• GRASS GIS favoured open source distribution
• Well documented sequential code
• Large body of applications
• Stable performance across sequential platforms
• Starting point for our work
What Parallelization achieved
GRASS GIS Applications – flood
modeling• Mapcalc– Fundamental set of application
– Building block for multiple applications
– Embarrassingly parallel application
– Speedup of 5-6X over a sequential implementation
• Terracost– Direct application of algorithm by Hazel, T., Toma, L., Vahrenhold, J., and Wickremesinghe, R. Terracost: Computing least-cost-path surfaces for massive grid terrains. J. Exp. Algorithmics 12 (Jun. 2008),1-31.
– Speedup gained 6X over sequential.
23
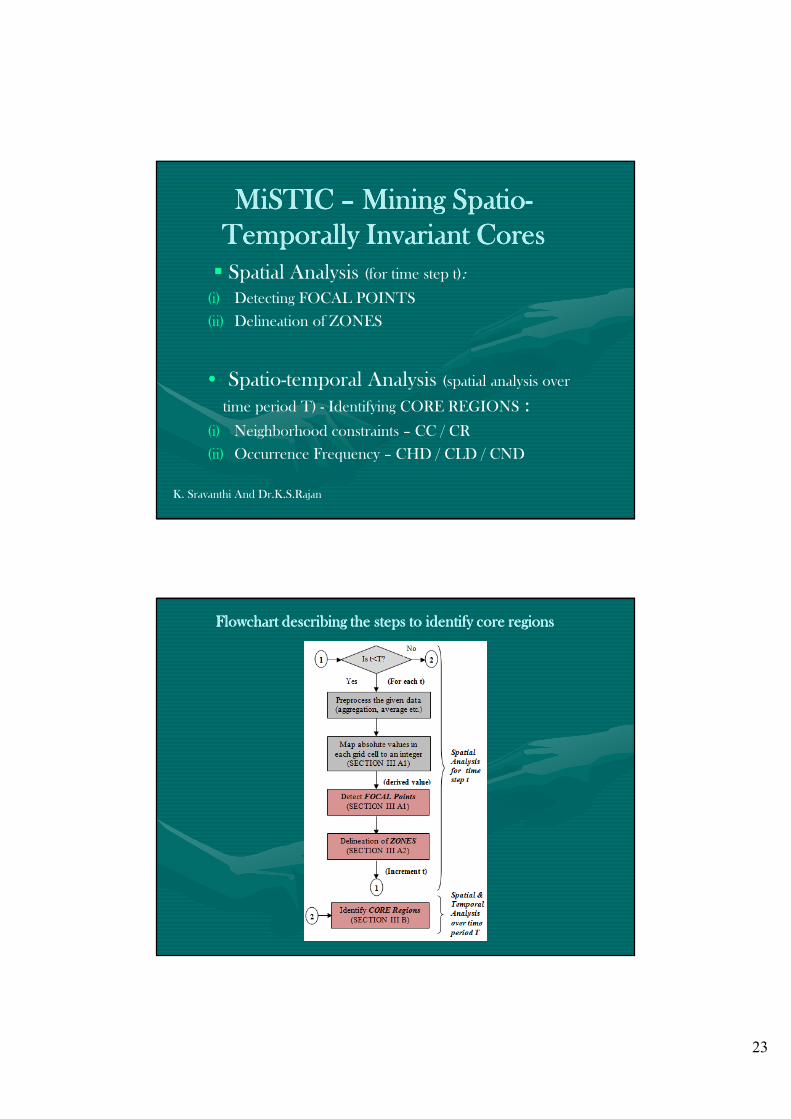
MiSTICMiSTICMiSTICMiSTIC –––– Mining Mining Mining Mining SpatioSpatioSpatioSpatio----
Temporally Invariant CoresTemporally Invariant CoresTemporally Invariant CoresTemporally Invariant Cores
� Spatial Analysis (for time step t):
(i) Detecting FOCAL POINTS
(ii) Delineation of ZONES
• Spatio-temporal Analysis (spatial analysis over
time period T) - Identifying CORE REGIONS :
(i) Neighborhood constraints – CC / CR
(ii) Occurrence Frequency – CHD / CLD / CND
K. Sravanthi And Dr.K.S.Rajan
Flowchart describing the steps to identify core regionsFlowchart describing the steps to identify core regionsFlowchart describing the steps to identify core regionsFlowchart describing the steps to identify core regions
24
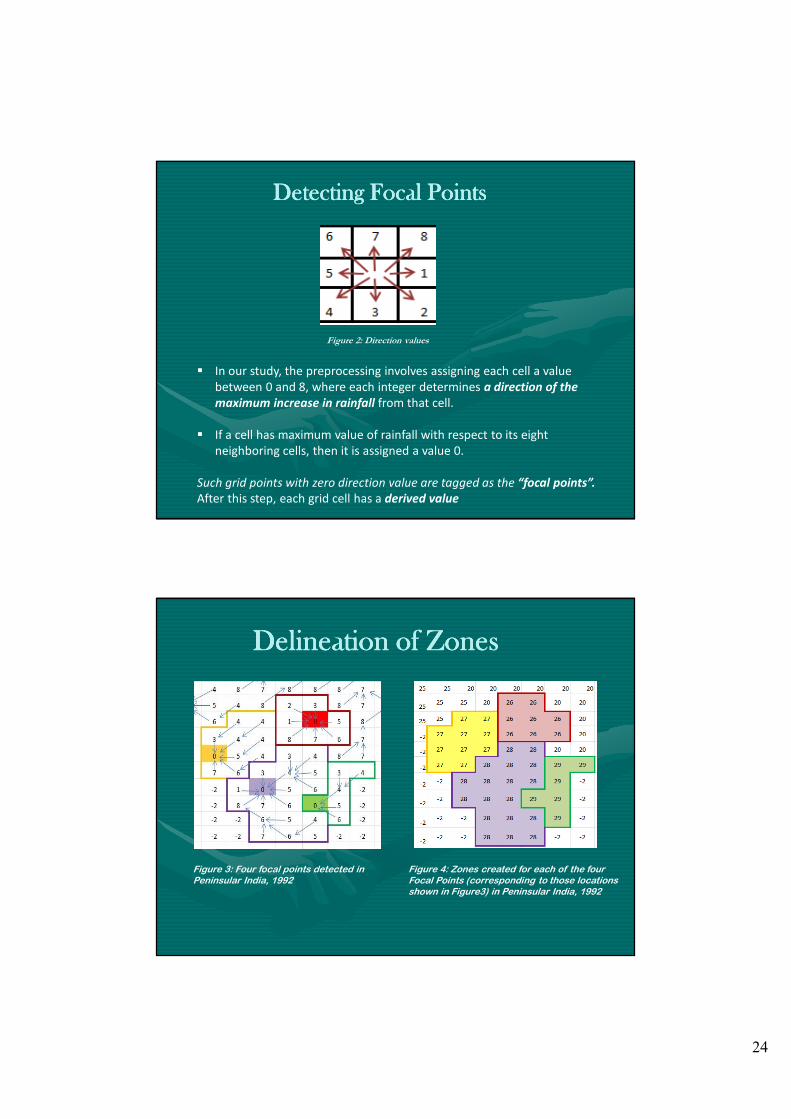
Detecting Focal PointsDetecting Focal PointsDetecting Focal PointsDetecting Focal Points
Figure 2: Direction values
� In our study, the preprocessing involves assigning each cell a value
between 0 and 8, where each integer determines a direction of the
maximum increase in rainfall from that cell.
� If a cell has maximum value of rainfall with respect to its eight
neighboring cells, then it is assigned a value 0.
Such grid points with zero direction value are tagged as the “focal points”.
After this step, each grid cell has a derived value
Delineation of ZonesDelineation of ZonesDelineation of ZonesDelineation of Zones
Figure 4: Zones created for each of the four Focal Points (corresponding to those locations shown in Figure3) in Peninsular India, 1992
Figure 3: Four focal points detected in Peninsular India, 1992
25
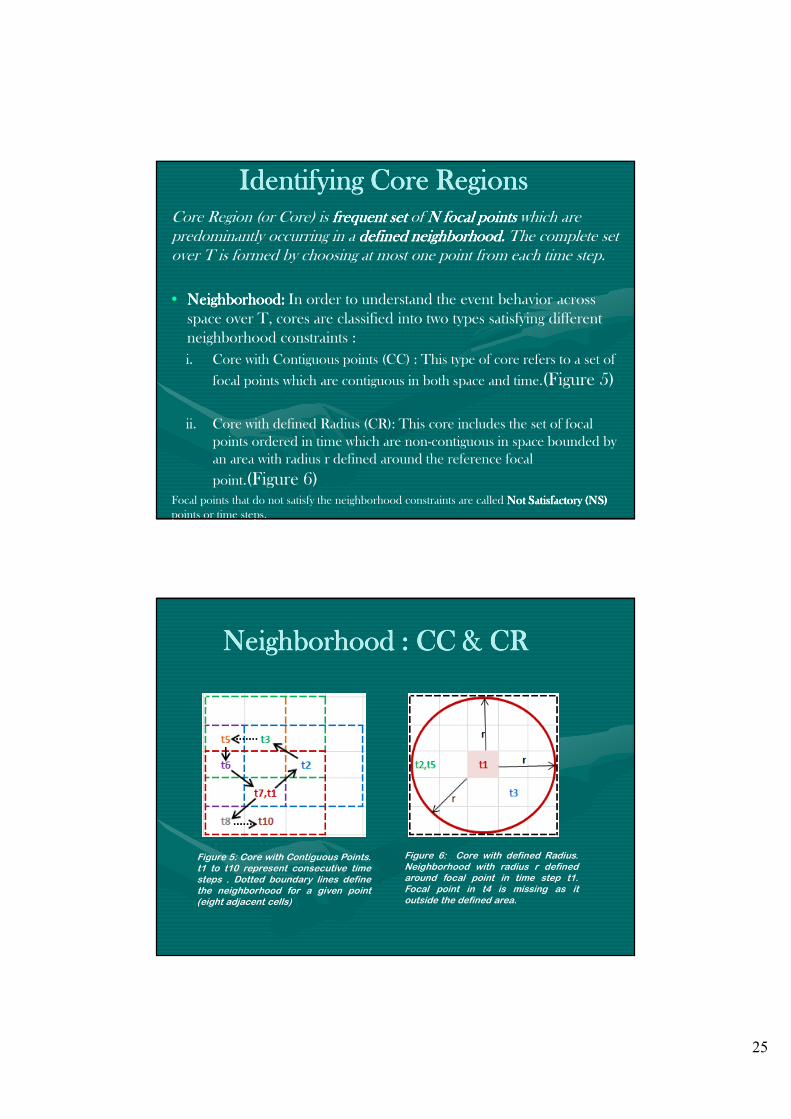
Identifying Core RegionsIdentifying Core RegionsIdentifying Core RegionsIdentifying Core Regions
Core Region (or Core) is frequent set frequent set frequent set frequent set of N N N N focal points focal points focal points focal points which are
predominantly occurring in a defined neighborhooddefined neighborhooddefined neighborhooddefined neighborhood. . . . The complete set
over T is formed by choosing at most one point from each time step.
• Neighborhood:Neighborhood:Neighborhood:Neighborhood: In order to understand the event behavior across
space over T, cores are classified into two types satisfying different
neighborhood constraints :
i. Core with Contiguous points (CC) : This type of core refers to a set of
focal points which are contiguous in both space and time.(Figure 5)
ii. Core with defined Radius (CR): This core includes the set of focal
points ordered in time which are non-contiguous in space bounded by
an area with radius r defined around the reference focal
point.(Figure 6)Focal points that do not satisfy the neighborhood constraints are called Not Satisfactory (NS)Not Satisfactory (NS)Not Satisfactory (NS)Not Satisfactory (NS)
points or time steps.
Neighborhood : CC & CRNeighborhood : CC & CRNeighborhood : CC & CRNeighborhood : CC & CR
Figure 6: Core with defined Radius.Neighborhood with radius r definedaround focal point in time step t1.Focal point in t4 is missing as itoutside the defined area.
Figure 5: Core with Contiguous Points.t1 to t10 represent consecutive timesteps . Dotted boundary lines definethe neighborhood for a given point(eight adjacent cells)
26
• Occurrence Frequency:Occurrence Frequency:Occurrence Frequency:Occurrence Frequency: A focal point is considered
frequent if its frequency of occurrence at a given location is
more than a user-specified minimum support (min_sup).
Based on the different percentages of highest frequency
(frequency higher than min_freq) and number of time steps
not considered for analysis (max_pruneTS - number of time
steps pruned from the analysis), cores are classified as :
i. Core with Highly Dominating point (CHD)
ii. Core with Less Dominating points (CLD)
iii. Core with No Dominating point (CND)
Study of Rainfall Patterns in
Monsoonal India
27
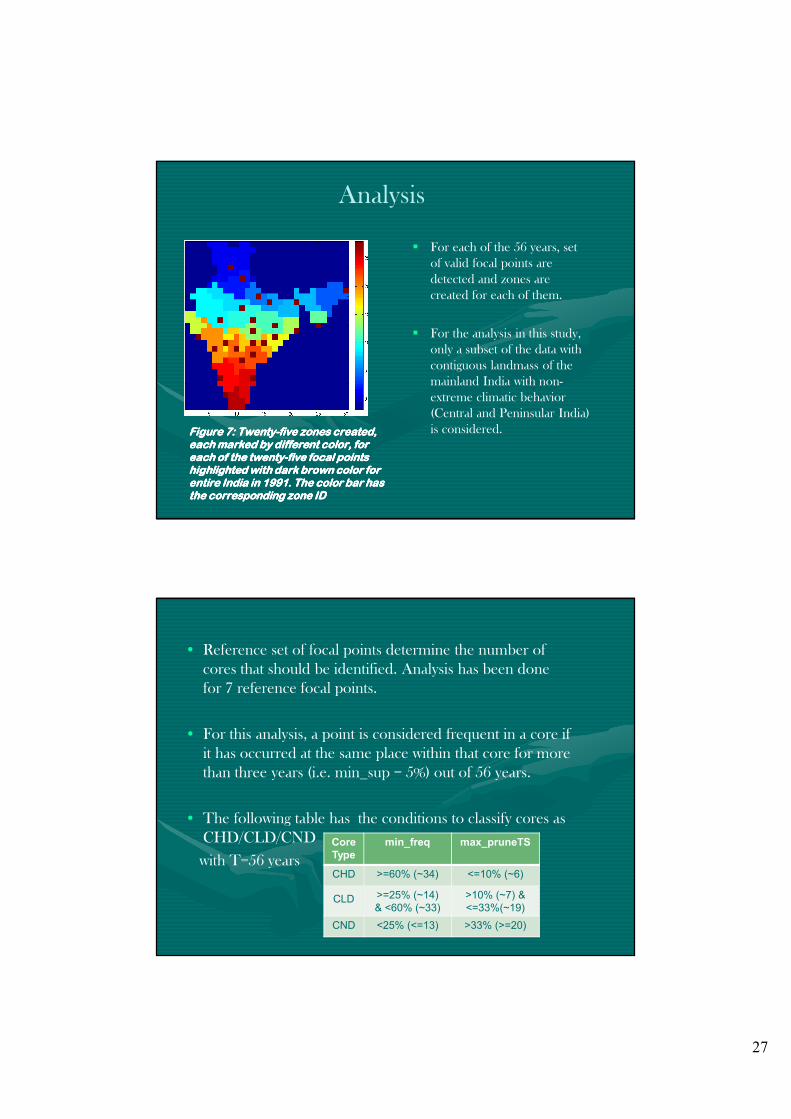
Figure Figure Figure Figure 7777: : : : TwentyTwentyTwentyTwenty----five zones created, five zones created, five zones created, five zones created, each each each each marked marked marked marked by different by different by different by different color, for color, for color, for color, for each of the twentyeach of the twentyeach of the twentyeach of the twenty----five focal five focal five focal five focal points points points points highlighted highlighted highlighted highlighted with dark brown color for with dark brown color for with dark brown color for with dark brown color for entire India entire India entire India entire India in in in in 1991199119911991. The color bar has . The color bar has . The color bar has . The color bar has the corresponding zone IDthe corresponding zone IDthe corresponding zone IDthe corresponding zone ID
� For each of the 56 years, set
of valid focal points are
detected and zones are
created for each of them.
� For the analysis in this study,
only a subset of the data with
contiguous landmass of the
mainland India with non-
extreme climatic behavior
(Central and Peninsular India)
is considered.
Analysis
• Reference set of focal points determine the number of
cores that should be identified. Analysis has been done
for 7 reference focal points.
• For this analysis, a point is considered frequent in a core if
it has occurred at the same place within that core for more
than three years (i.e. min_sup = 5%) out of 56 years.
• The following table has the conditions to classify cores as
CHD/CLD/CND
with T=56 years
Core
Type
min_freq max_pruneTS
CHD >=60% (~34) <=10% (~6)
CLD >=25% (~14)
& <60% (~33)
>10% (~7) &
<=33%(~19)
CND <25% (<=13) >33% (>=20)
28
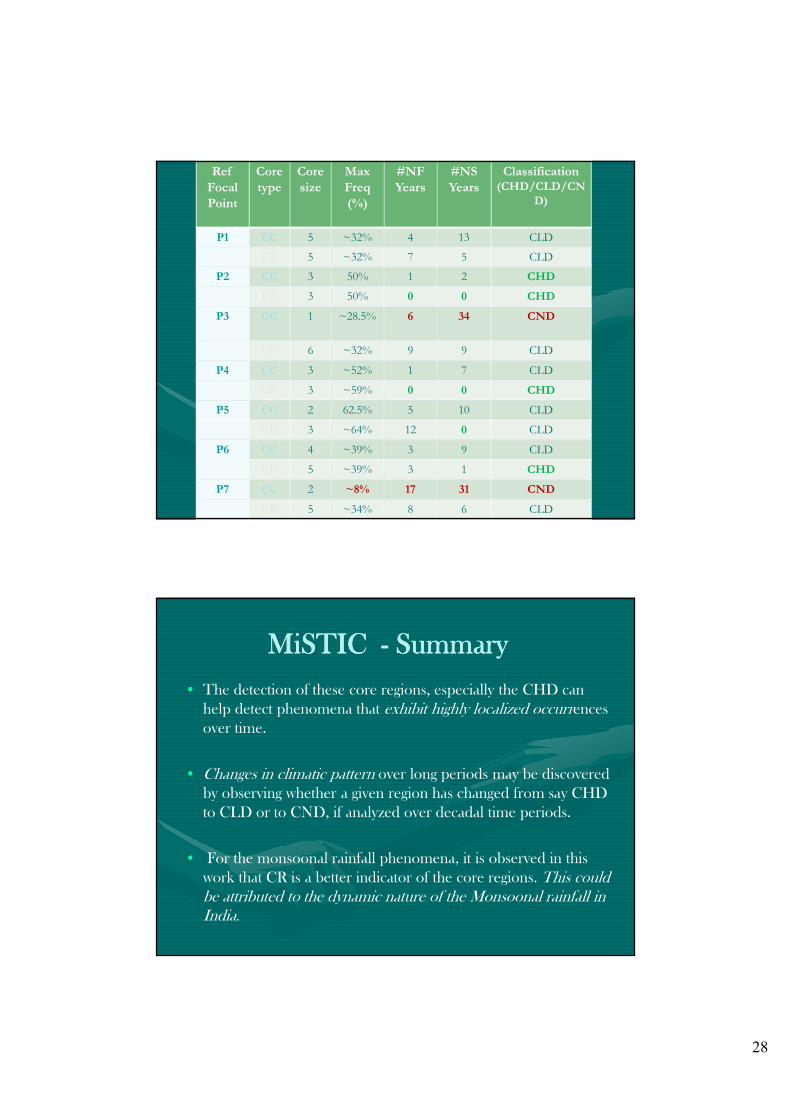
Ref
Focal
Point
Core
type
Core
size
Max
Freq
(%)
#NF
Years
#NS
Years
Classification (CHD/CLD/CN
D)
P1 CC 5 ~32% 4 13 CLD
CR 5 ~32% 7 5 CLD
P2 CC 3 50% 1 2 CHD
CR 3 50% 0 0 CHD
P3 CC 1 ~28.5% 6 34 CND
CR 6 ~32% 9 9 CLD
P4 CC 3 ~52% 1 7 CLD
CR 3 ~59% 0 0 CHD
P5 CC 2 62.5% 5 10 CLD
CR 3 ~64% 12 0 CLD
P6 CC 4 ~39% 3 9 CLD
CR 5 ~39% 3 1 CHD
P7 CC 2 ~8% 17 31 CND
CR 5 ~34% 8 6 CLD
MiSTICMiSTICMiSTICMiSTIC ---- SummarySummarySummarySummary
• The detection of these core regions, especially the CHD can
help detect phenomena that exhibit highly localized occurrences
over time.
• Changes in climatic pattern over long periods may be discovered
by observing whether a given region has changed from say CHD
to CLD or to CND, if analyzed over decadal time periods.
• For the monsoonal rainfall phenomena, it is observed in this
work that CR is a better indicator of the core regions. This could
be attributed to the dynamic nature of the Monsoonal rainfall in
India.

29
Besides the nature of the event, the following reasons could also have an impact
on the results :
i. Scale Issues – With changing resolutions, the neighborhood regions of
interaction change and subsequently the core points change.
ii. Dominance definition – There could be more classifications
iii. CR vs CC – Both handle different events
In this paper, the work demonstrates a method which
detects the core regions of largely spatio-temporal
dynamic phenomena, the data of which when analyzed
over only space or time may not provide enough insights
into its processes
Such localized behavior exhibited in space and over time
can provide important clues for further analysis of
controlling and/or regulating characteristics for the
phenomena at study.
Challenges in the Indian Context
• Has to provide for Incremental Design– Can’t get agencies to share data till they see value in it
• Language Localization – Data Collection to Manipulation to GeoDBmanagement
• Data Interoperability– Application driven Formats and Parameters –unification of Data Model will take time
• Data Ownership + Security– Though largely Govt., Distributed Authorities
– Map Policy & RS Policy of India

30
Innovation/Creativeness
at the Level of Education
• Tool based teaching– Undermines conceptual learning
– Limited by what is offered and not what one can do
– Students/employees complain when asked to ”think”
• Need to look beyond tools– Gaps in tool vs. what one needs to do
– Solutions approach vs. technique based
– Solutions needs Creativity and Innovation
My views - where we should go• Technology focus is needed
– Need Roadmap to generate new technologies actively and not just a passive user of these (known s/w tools)
– Recognizing INDIA’s needs - given language, literacy and other barriers. Eg., like GeoVisualization may be a big need here even for Decision makers over and above (scenario based) Modelling
• SKILL-imparting vs GIS Conceptual understanding
and GIScience R&Dev.
• An Explicit focus on RESEARCH
– Innovation comes from Research
– Maybe, an explicit Goal-oriented Fund

31
Thank You !!
Can Routing Algorithms
become more Intelligent?
- GIS based approach at Multiple
Thematic integration and its
handling in Routing Algorithms
32
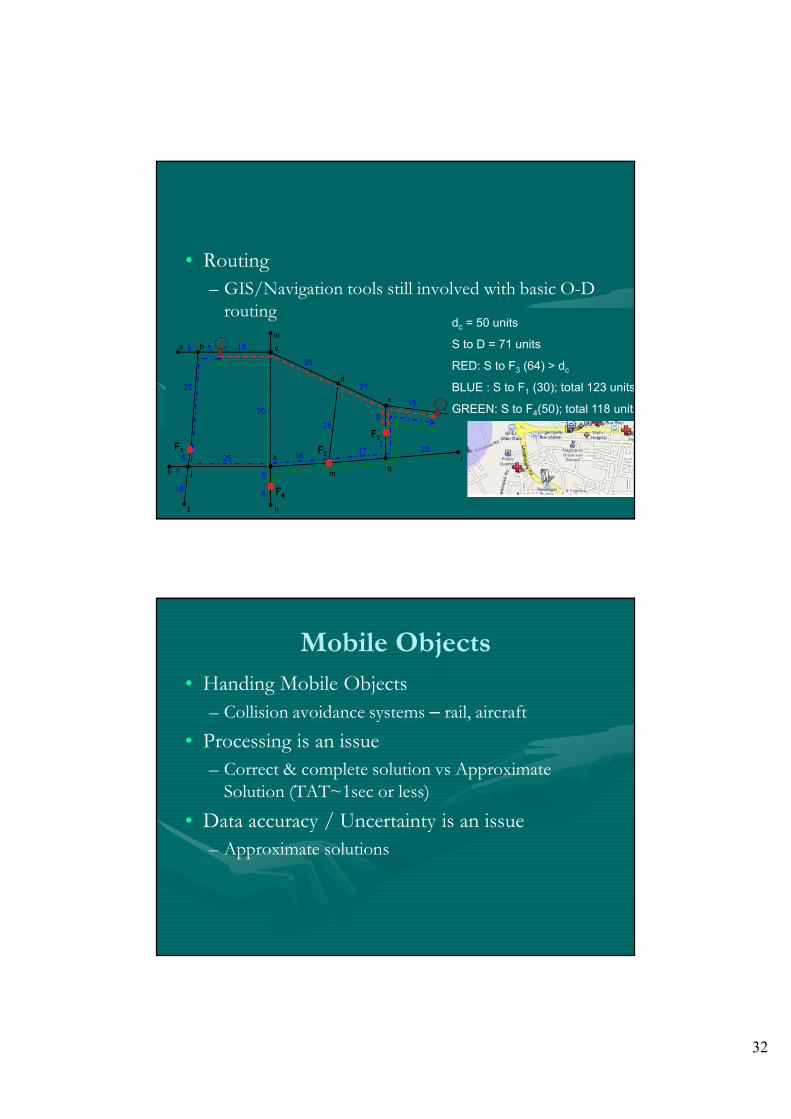
• Routing
– GIS/Navigation tools still involved with basic O-D routing
– What about constraints?
• Network (internal)
• External – feature driven or user driven
– AI based User friendly techniques needed
dc = 50 units
S to D = 71 units
RED: S to F3 (64) > dc
BLUE : S to F1 (30); total 123 units
GREEN: S to F4(50); total 118 units
• Handing Mobile Objects
– Collision avoidance systems – rail, aircraft
• Processing is an issue
– Correct & complete solution vs Approximate Solution (TAT~1sec or less)
• Data accuracy / Uncertainty is an issue
– Approximate solutions
Mobile Objects
33
Complex systems & Spatial Scales
• Data collection – AVHRR (8Km) to few cms spatial resolution
– Sensors
• Data handling– Multi-scale spatial data access models
• Data Processing– Mostly at a given scale of the phenomenon
– Affects MODELLING
• Multi-level data input vs Spatial Map generation– Eg. Forest survey data to hierarchical forest class maps
FOSS4G
• Paradigm Shift? Or Natural Progression?
• Conviction vs Compulsion
• Top-down vs Home-grown
• Capacity Building and Training
– Spread in Awareness

34
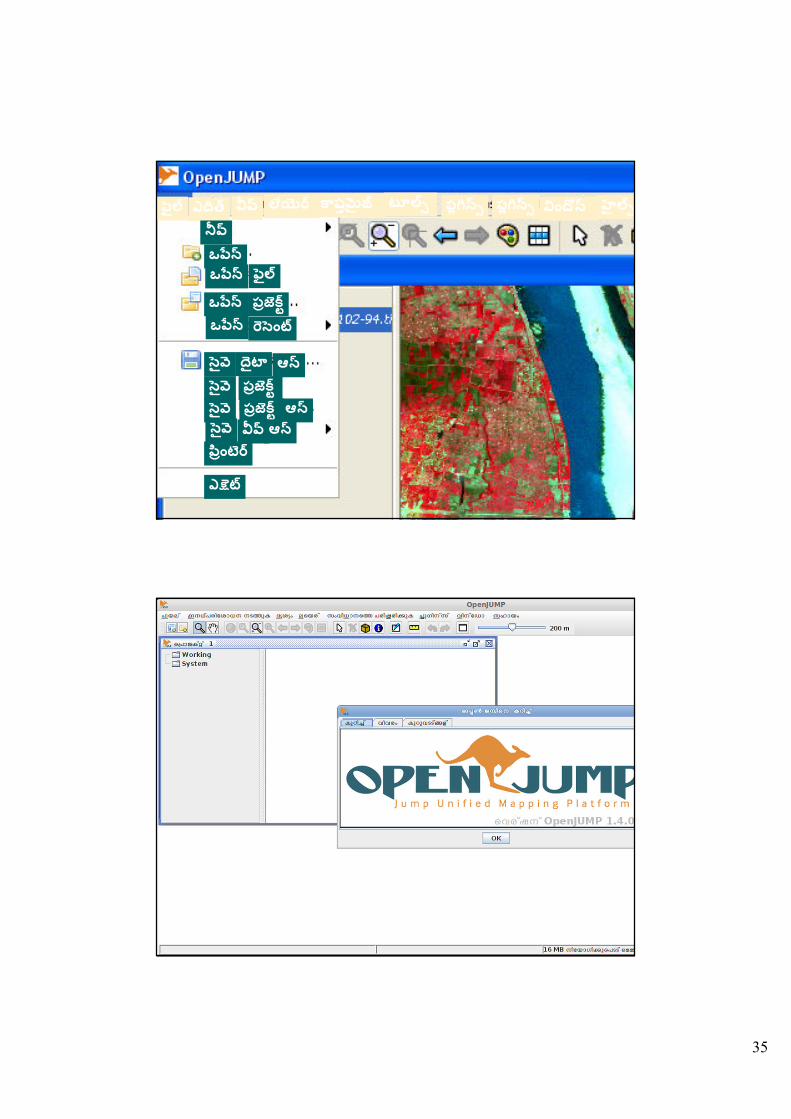
FOSS4G Contributions from LSI• Indian Language versions of OpenJUMP – a vector GIS tool – in Telugu, Malayalam, Hindi
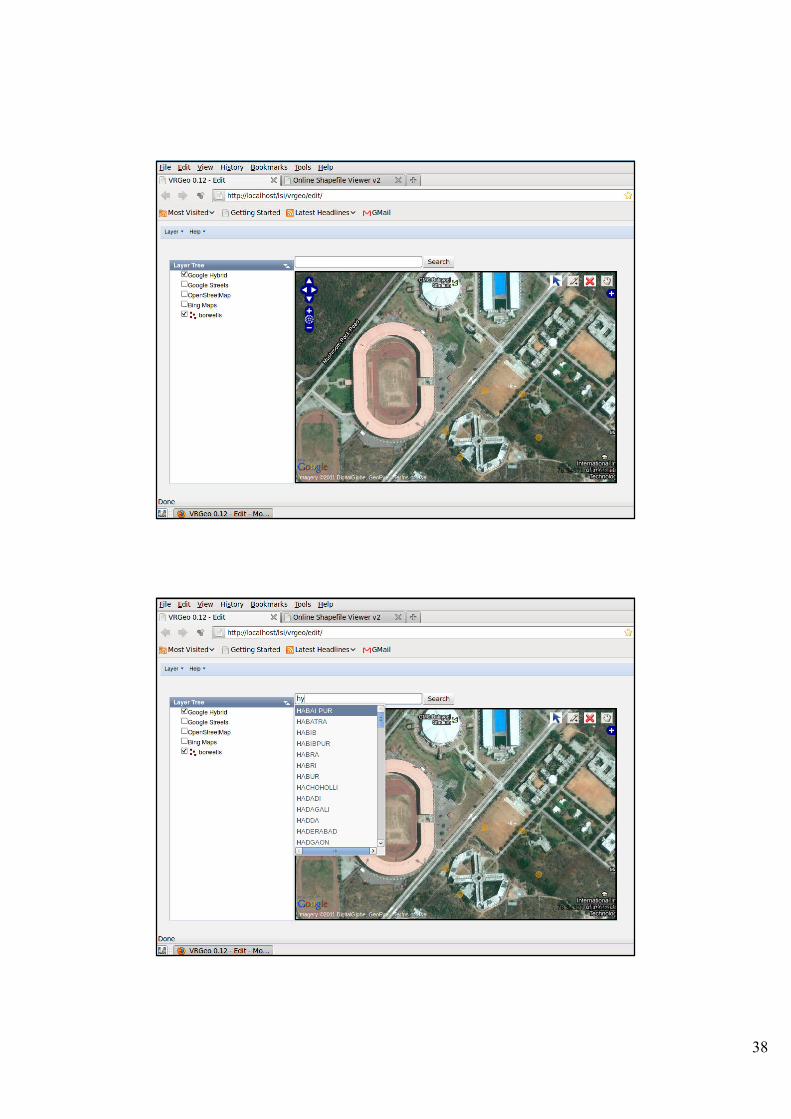
• VR-Geo (http://lsi.iiit.ac.in/lsi./vrgeo )
– pronounced “we-are-geo”; and also Village Resources
GeoMapping Platform
– A Collaborative Mapping Platform
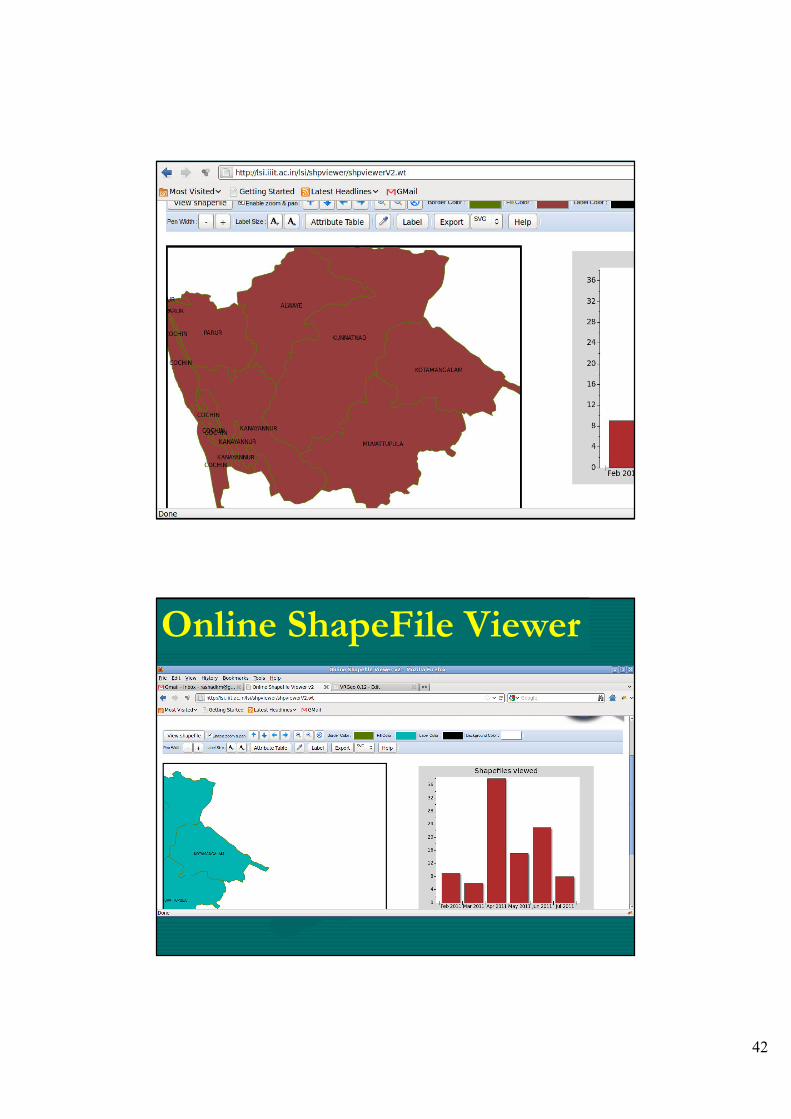
• Online ShapeFile Viewer
– Launched Feb 2011 - Has 32 users in less than a month
• Actively involved in giving talks and training program (EDUSAT, State Depts., Univs., etc)
���� ���� �� �� �������� ���� �� ���� !"�#�� ���� $%�&'
Sample Screenshot
in Telugu
35
���� ���� �� �� �������� ���� �� ���� !"�#�� ���� $%�&'
()*�+
()*� ����
()*� �,-./0()*� 1.2�%3
2��45 �6��7 8'2��45 �,-./02��45 �,-./0 8'2��45 8')9,%�:�
�;.3
Sample Screenshot
in Malayalam
36
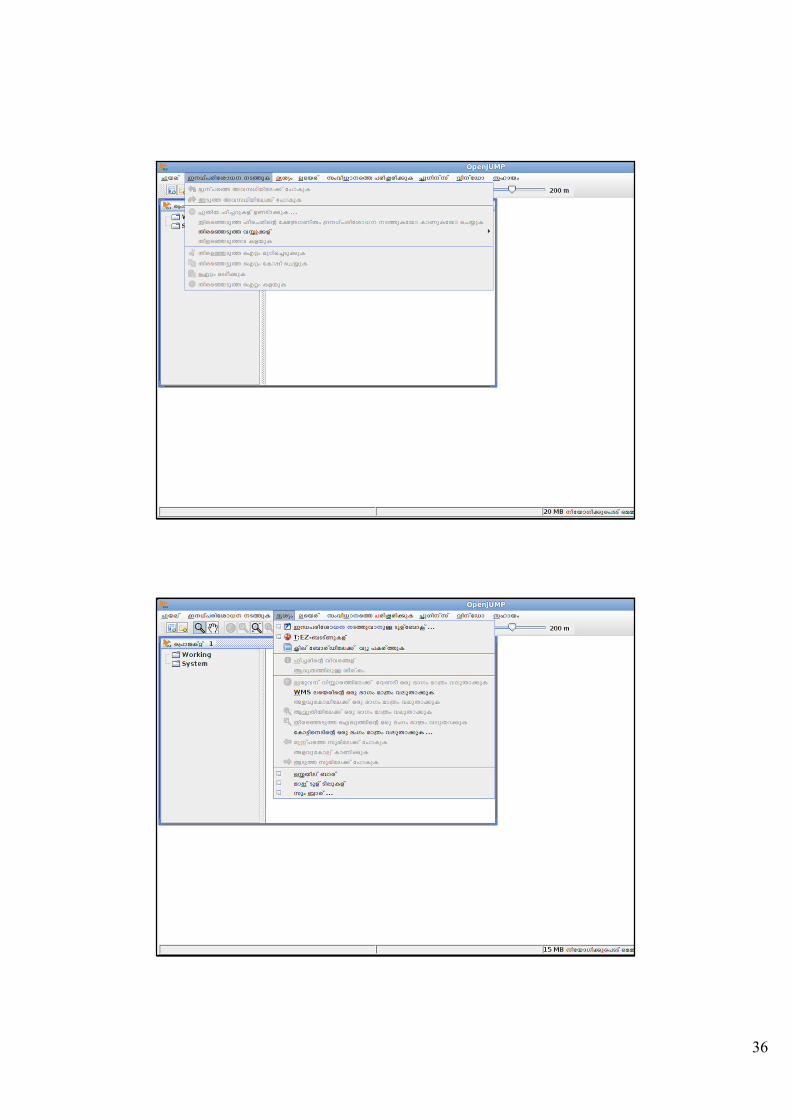
Sample Screenshot
in Malayalam
Sample Screenshot
in Malayalam
37
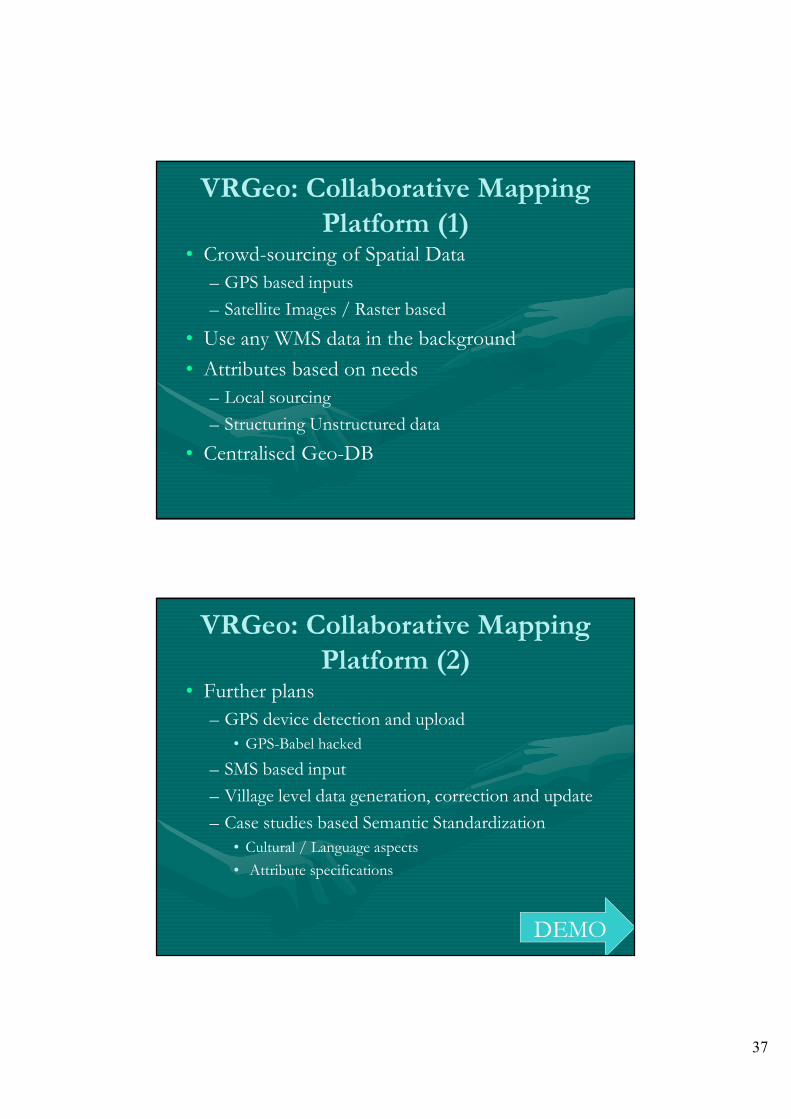
VRGeo: Collaborative Mapping
Platform (1)• Crowd-sourcing of Spatial Data
– GPS based inputs
– Satellite Images / Raster based
• Use any WMS data in the background
• Attributes based on needs
– Local sourcing
– Structuring Unstructured data
• Centralised Geo-DB
VRGeo: Collaborative Mapping
Platform (2)• Further plans
– GPS device detection and upload
• GPS-Babel hacked
– SMS based input
– Village level data generation, correction and update
– Case studies based Semantic Standardization
• Cultural / Language aspects
• Attribute specifications
DEMO
38

39

40
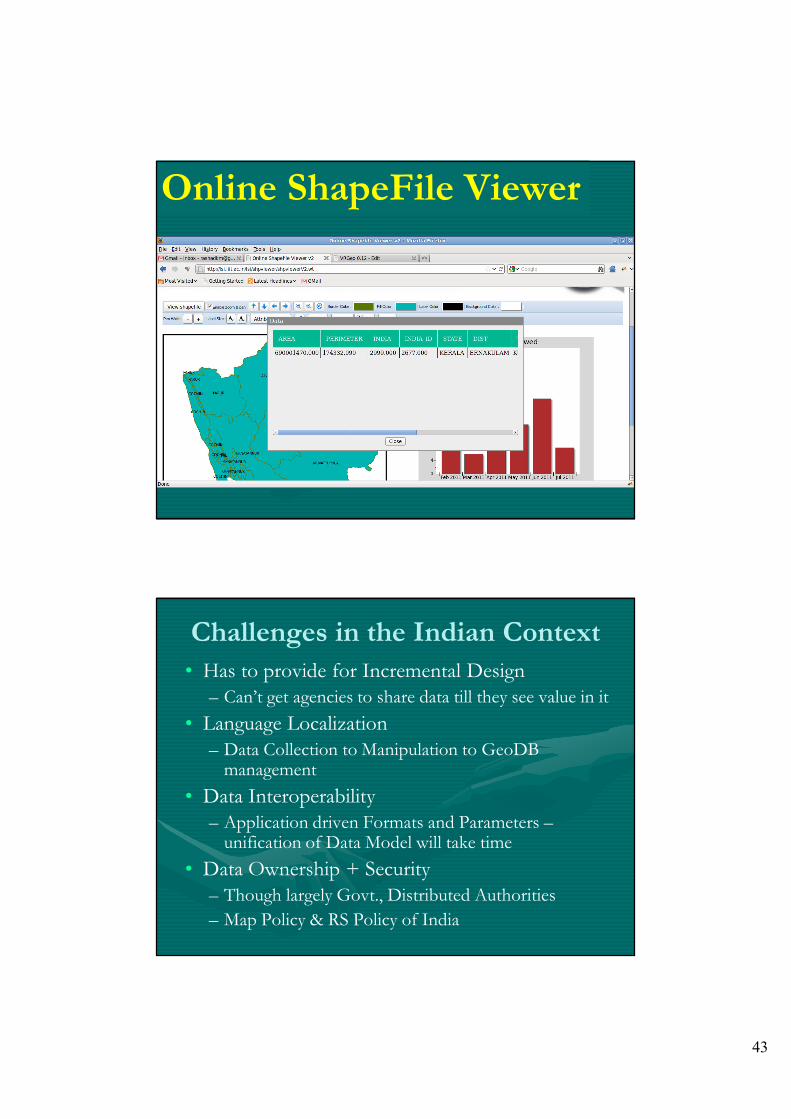
Online ShapeFile Viewer

41
42
Online ShapeFile Viewer
43
Online ShapeFile Viewer
Challenges in the Indian Context
• Has to provide for Incremental Design– Can’t get agencies to share data till they see value in it
• Language Localization – Data Collection to Manipulation to GeoDBmanagement
• Data Interoperability– Application driven Formats and Parameters –unification of Data Model will take time
• Data Ownership + Security– Though largely Govt., Distributed Authorities
– Map Policy & RS Policy of India
44
Innovation/Creativeness
at the Level of Education
• Tool based teaching– Undermines conceptual learning
– Limited by what is offered and not what one can do
– Students/employees complain when asked to ”think”
• Need to look beyond tools– Gaps in tool vs. what one needs to do
– Solutions approach vs. technique based
– Solutions needs Creativity and Innovation
My views - where we should go• Technology focus is needed
– Need Roadmap to generate new technologies actively and not just a passive user of these (known s/w tools)
– Recognizing INDIA’s needs - given language, literacy and other barriers. Eg., like GeoVisualization may be a big need here even for Decision makers over and above (scenario based) Modelling
• SKILL-imparting vs GIS Conceptual understanding
and GIScience R&Dev.
• An Explicit focus on RESEARCH
– Innovation comes from Research
– Maybe, an explicit Goal-oriented Fund

45
Thank You !!