emerging tools for continuous nutrient ... › view › noaa › 13797 › noaa...reduction plans to...
TRANSCRIPT

EMERGING TOOLS FOR CONTINUOUS NUTRIENT MONITORING NETWORKS:
SENSORS ADVANCING SCIENCE AND WATER RESOURCES PROTECTION1
Brian A. Pellerin, Beth A. Stauffer, Dwane A. Young, Daniel J. Sullivan, Suzanne B. Bricker,
Mark R. Walbridge, Gerard A. Clyde, Jr., and Denice M. Shaw2
ABSTRACT: Sensors and enabling technologies are becoming increasingly important tools for water qualitymonitoring and associated water resource management decisions. In particular, nutrient sensors are of interestbecause of the well-known adverse effects of nutrient enrichment on coastal hypoxia, harmful algal blooms, andimpacts to human health. Accurate and timely information on nutrient concentrations and loads is integral tostrategies designed to minimize risk to humans and manage the underlying drivers of water quality impair-ment. Using nitrate sensors as the primary example, we highlight the types of applications in freshwater andcoastal environments that are likely to benefit from continuous, real-time nutrient data. The concurrent emer-gence of new tools to integrate, manage, and share large datasets is critical to the successful use of nutrientsensors and has made it possible for the field of continuous monitoring to rapidly move forward. We highlightseveral near-term opportunities for federal agencies, as well as the broader scientific and management commu-nity, that will help accelerate sensor development, build and leverage sites within a national network, anddevelop open data standards and data management protocols that are key to realizing the benefits of a large-scale, integrated monitoring network. Investing in these opportunities will provide new information to guidemanagement and policies designed to protect and restore our nation’s water resources.
(KEY TERMS: sensors; nutrients; water quality; information management.)
Pellerin, Brian A., Beth A. Stauffer, Dwane A. Young, Daniel J. Sullivan, Suzanne B. Bricker, Mark R. Wal-bridge, Gerard A. Clyde, Jr., and Denice M. Shaw, 2016. Emerging Tools for Continuous Nutrient MonitoringNetworks: Sensors Advancing Science and Water Resources Protection. Journal of the American WaterResources Association (JAWRA) 52(4): 993-1008. DOI: 10.1111/1752-1688.12386
1Paper No. JAWRA-15-0091-P of the Journal of the American Water Resources Association (JAWRA). Received June 9, 2015; acceptedNovember 14, 2015. Published 2016. This article is a U.S. Government work and is in the public domain in the USA. Journal of theAmerican Water Resources Association published by Wiley Periodicals, Inc. on behalf of American Water Resources Association. This is anopen access article under the terms of the Creative Commons Attribution-NonCommercial-NoDerivs License, which permits use and distribu-tion in any medium, provided the original work is properly cited, the use is non-commercial and no modifications or adaptations are made.Discussions are open until six months from issue publication.
2Research Scientist (Pellerin), California Water Science Center, U.S. Geological Survey, 6000 J Street, Placer Hall, Sacramento, California95819; Assistant Professor (Stauffer), Department of Biology, University of Louisiana at Lafayette, Lafayette, Louisiana 70504; Senior DataAdvisor (Young), Office of Water, U.S. Environmental Protection Agency, Washington, D.C. 20460; Hydrologist (Sullivan), Wisconsin WaterScience Center, U.S. Geological Survey, Middleton, Wisconsin 53562; Physical Scientist (Bricker), National Centers for Coastal OceanScience, National Oceanic and Atmospheric Administration, Silver Spring, Maryland 20910; Ecologist (Walbridge), Agricultural ResearchService, U.S. Department of Agriculture, Beltsville, Maryland 20705; Limnologist (Clyde), Tulsa District, U.S. Army Corp of Engineers,Tulsa, Oklahoma 74128; and Senior Scientist (Shaw), Office of Research and Development, U.S. Environmental Protection Agency, Washing-ton, D.C. 20460 (E-Mail/Pellerin: [email protected]).
JOURNAL OF THE AMERICAN WATER RESOURCES ASSOCIATION JAWRA993
JOURNAL OF THE AMERICAN WATER RESOURCES ASSOCIATION
Vol. 52, No. 4 AMERICAN WATER RESOURCES ASSOCIATION August 2016

INTRODUCTION
Protecting the quality of water in the nation’sstreams, rivers, lakes, and estuaries is of criticalimportance to sustaining both human and ecosystemhealth. Nutrient enrichment is a particular concern asit can lead to harmful algal blooms (HABs) andhypoxia in freshwater and coastal environments (e.g.,Smith et al., 2006), as well as human health effects(Bryan and Loscalzo, 2011; Brender et al., 2013). Accu-rate and timely information on nutrient concentrationsand loads is integral to efforts designed to minimizewater quality impairment by managing nutrientsources and transport. This is particularly true, giventhe costs of developing and implementing nutrientreduction plans to restore or maintain water quality.For example, the cost of implementing best manage-ment practices (BMPs) developed by states in the Che-sapeake Bay watershed to comply with total maximumdaily loads is estimated at about US$900 million peryear for full implementation (Kaufman et al., 2014).
Much of our current understanding of the patternsand trends in nutrient concentrations and loads (aswell as other water-quality constituents) is based ontraditional monitoring approaches, e.g., discretesamples collected manually at weekly to monthlyintervals followed by days to weeks for laboratoryanalyses to be completed. While this low temporalfrequency approach — coupled with modeling andstatistical techniques — has yielded critical informa-tion, more timely and accurate indications of waterquality impairment could help resource managersand policy makers identify specific causes, assess theeffects of remedial actions, and develop more effectiveresponses. This is particularly important for episodicevents such as floods that are difficult to anticipatebut can have significant and long-term ecological, eco-nomic, and human health effects.
Sensors and associated physical and cyberinfra-structure — the telecommunications, collection plat-forms, data standards, and data management toolsrequired to transform data into information in atimely manner — are becoming increasingly impor-tant for water quality monitoring and associatedwater resource management decisions (Horsburghet al., 2011; Murdoch et al., 2014). Water quality sen-sors allow for nearly continuous (e.g., seconds to min-utes) measurements, thereby reducing the likelihoodthat changes in water quality are missed or obscuredas often happens with infrequent discrete samplingalone (Cassidy and Jordan, 2011). Furthermore, thetransmission and analysis of continuous data in realtime ensures that water management decisions canbe made immediately. The combined temporal and
spatial richness of water quality data from sensorsalso allows for dynamic queries and interactive timedisplays to identify the initiation and termination ofwater quality events that may be transient in timeand/or spatially distinct.
Despite these benefits, the broad adoption and useof water quality sensors remains limited by a varietyof factors including instrument acquisition andmaintenance cost, ease-of-use, and data managementchallenges. Focusing on nitrate sensors as the mostmature of the in situ nutrient sensor technologies, wedescribe the types of applications in freshwater andcoastal environments that are likely to benefit fromcontinuous, real-time water quality data, as well as aframework to accelerate and support their broaderuse. While the authority to manage water resourcesin the United States (U.S.) is largely delegated tostates, tribes, and local municipalities, the consor-tium of federal agencies represented by the authors,and others, have an important role to play in thescience and management of water quality rangingfrom drinking water protection to coastal fisheriesand associated economic sustainability. Integration ofleveraged investments by these and other nationaland international agencies and organizations throughimproved data standards, common methodologies,and guidance and support for deployment and datamanagement activities can both accelerate the adop-tion of promising technologies and ultimately improvethe science and management of our water resources.
CONTINUOUS NUTRIENT MONITORING:WHY NOW?
Nutrients — primarily nitrogen and phosphorus —are fundamental components of living organisms andcritical to the global production of food and fiber. How-ever, excessive nutrient levels that are largely theresult of the production and use of inorganic fertiliz-ers, animal manure, and discharge of human wastew-ater have dramatically altered and continue to shapeaquatic environments (Richardson and Jørgensen,2013). The effects of excess nutrients in waterwaysrange from human health impacts caused by drinkingwater contamination, to HABs and hypoxia in fresh-water and coastal ecosystems (Heisler et al., 2008;Erisman et al., 2013), all with substantial economicand ecological implications. For example, a recentstudy (Sobota et al., 2015) estimated the potentialhealth and environmental impacts of reactive nitro-gen release to aquatic systems totaled US$210 billionper year in the U.S. in the early 2000s, with estimates
JAWRA JOURNAL OF THE AMERICAN WATER RESOURCES ASSOCIATION994
PELLERIN, STAUFFER, YOUNG, SULLIVAN, BRICKER, WALBRIDGE, CLYDE, AND SHAW
ranging from $19 billion annually due to drinkingwater impacts to $78 billion related to impacts onfreshwater ecosystems.
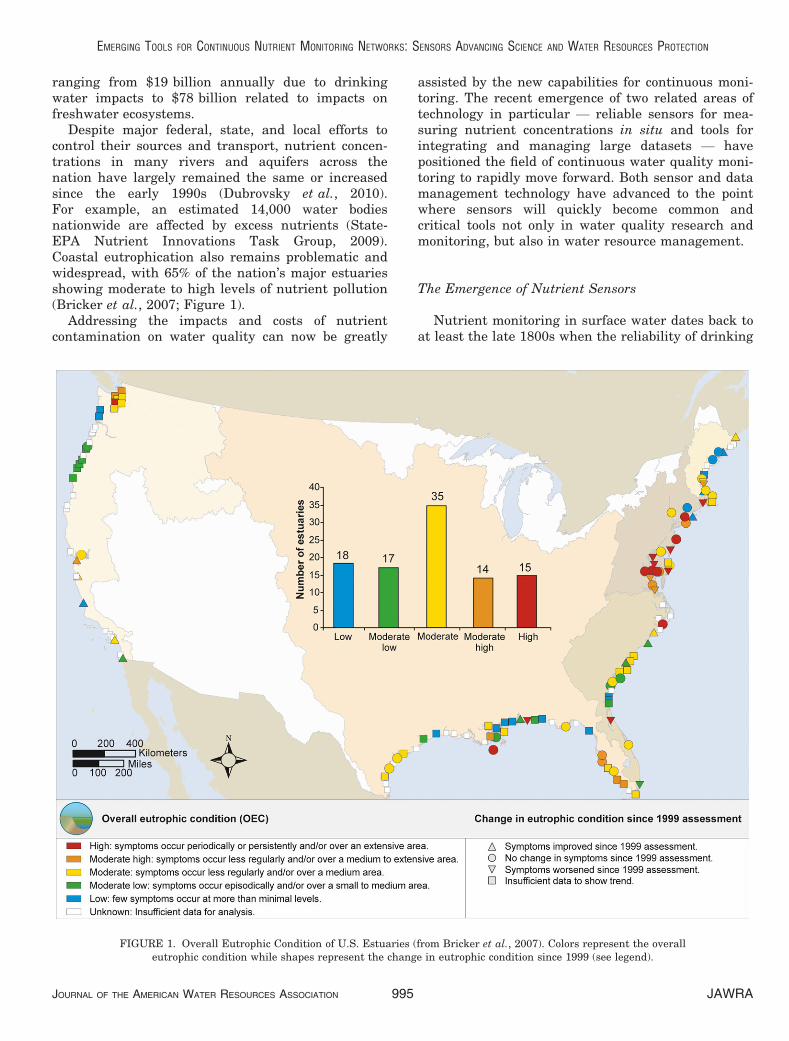
Despite major federal, state, and local efforts tocontrol their sources and transport, nutrient concen-trations in many rivers and aquifers across thenation have largely remained the same or increasedsince the early 1990s (Dubrovsky et al., 2010).For example, an estimated 14,000 water bodiesnationwide are affected by excess nutrients (State-EPA Nutrient Innovations Task Group, 2009).Coastal eutrophication also remains problematic andwidespread, with 65% of the nation’s major estuariesshowing moderate to high levels of nutrient pollution(Bricker et al., 2007; Figure 1).
Addressing the impacts and costs of nutrientcontamination on water quality can now be greatly
assisted by the new capabilities for continuous moni-toring. The recent emergence of two related areas oftechnology in particular — reliable sensors for mea-suring nutrient concentrations in situ and tools forintegrating and managing large datasets — havepositioned the field of continuous water quality moni-toring to rapidly move forward. Both sensor and datamanagement technology have advanced to the pointwhere sensors will quickly become common andcritical tools not only in water quality research andmonitoring, but also in water resource management.
The Emergence of Nutrient Sensors
Nutrient monitoring in surface water dates back toat least the late 1800s when the reliability of drinking
FIGURE 1. Overall Eutrophic Condition of U.S. Estuaries (from Bricker et al., 2007). Colors represent the overalleutrophic condition while shapes represent the change in eutrophic condition since 1999 (see legend).
JOURNAL OF THE AMERICAN WATER RESOURCES ASSOCIATION JAWRA995
EMERGING TOOLS FOR CONTINUOUS NUTRIENT MONITORING NETWORKS: SENSORS ADVANCING SCIENCE AND WATER RESOURCES PROTECTION

water sources for population centers became a con-cern (Myers, 2015). Then, as now, the primary moni-toring approach has been infrequent discrete samplecollection followed by wet chemical analysis in a labo-ratory. The ability to measure nutrientconcentrations in situ using field sensors developedrelatively recently with the application of ion-selec-tive electrodes (ISE) in the 1970s (Langmuir andJacobson, 1970) and the emergence in the last20 years of wet chemical analyzers and nonchemicaloptical sensors that could be deployed in the environ-ment (Jannasch et al., 1994; Finch et al., 1998; John-son and Coletti, 2002). Much of the focus of sensorsdevelopment has been on nitrate, given that it is bothproblematic for water quality and amenable to in situmeasurements by different technologies. However,ISE and wet-chemical sensors for ammonium andorthophosphate also have a history of use for in situmonitoring and research. Wet chemical orthophos-phate sensors, in particular, show promise for quanti-fying high frequency changes in water quality inresponse to hydrologic and biological forcings (Cohenet al., 2013; Gilbert et al., 2013; Outram et al., 2014;Bowes et al., 2015; Sherson et al., 2015).
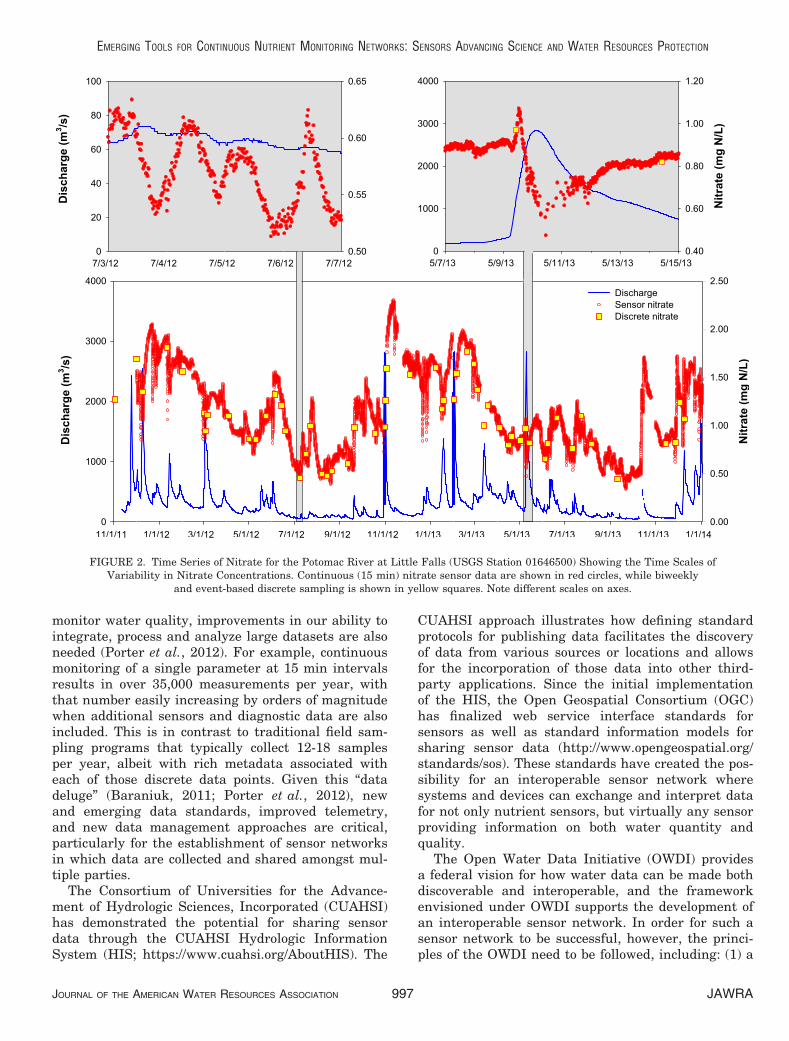
Different nutrient sensor technologies have advan-tages and disadvantages in terms of accuracy, cost,reliability, and ease-of-use (Table 1). For example,ISEs for nitrate are relatively inexpensive and easy touse, but have much lower accuracy and higher driftthan wet chemical or UV nitrate sensors. However, theprimary benefit from all three is the high temporal fre-quency of the data collection (e.g., seconds to minutes)which captures changes in water quality that occur atshort time scales (Cassidy and Jordan, 2011; Joneset al., 2012). For example, data from the PotomacRiver illustrate the daily, event, seasonal, and annualvariability in nitrate concentrations that can be mea-sured with continuous monitoring but would likely be
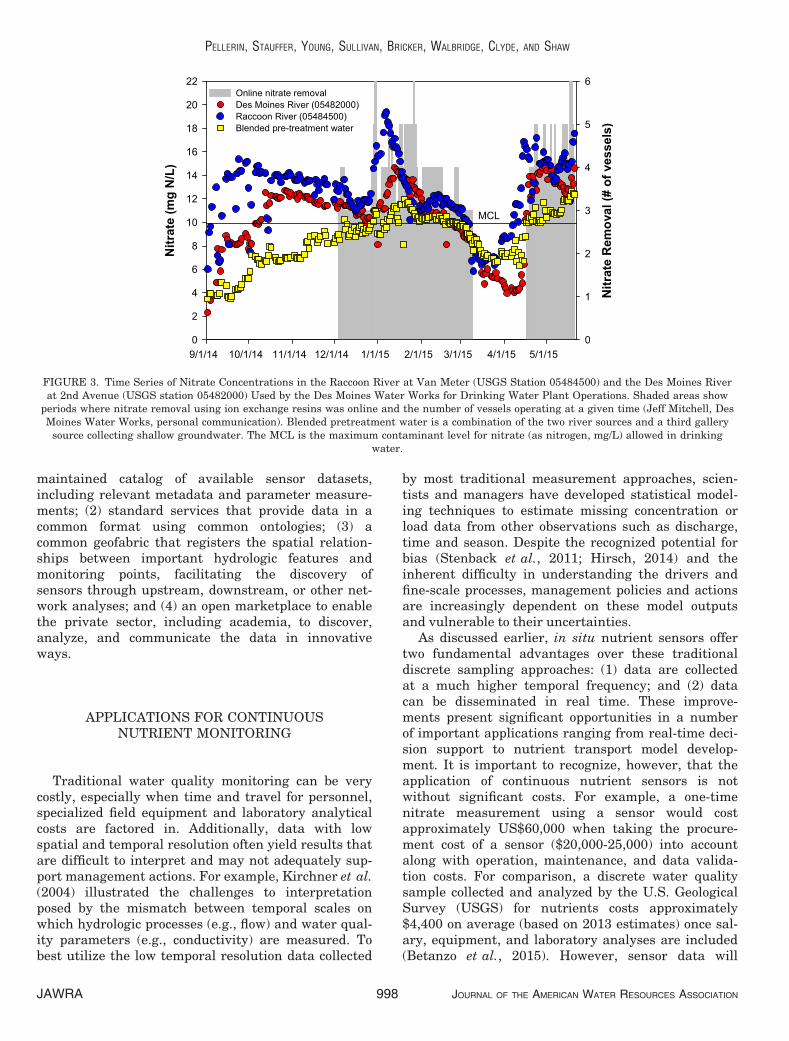
missed with traditional monthly discrete sampling(Figure 2). The other primary benefit is in the real-time delivery of data rather than delays of days toweeks common for laboratory analyses and communi-cation of results. This allows for water managementdecisions to be made in real time as is demonstrated bythe use of nitrate sensor data by the Des Moines WaterWorks to determine and anticipate the need for operat-ing costly nitrate removal systems for drinking water(Figure 3).
The current generation of nutrient sensors beingused for water quality monitoring was originally devel-oped for use in specific applications that influencedinstrument design and specifications (Pellerin et al.,2013). For example, UV nitrate sensors were primarilydeveloped for use in either wastewater treatment facili-ties or in the coastal ocean, both of which have specificand unique needs in terms of the sensitivity, linearmeasurement range and anti-fouling components. Sim-ilarly, early versions of wet chemical orthophosphatesensors were primarily developed for applications incoastal settings with reduced fouling and lower sus-pended sediment concentrations than measured inmany rivers and streams. While many of these instru-ments have since been adapted for use in rivers, lakes,and estuaries, the next generation of nutrient sensorswill likely be optimized for freshwater systems byrecent efforts to accelerate the development, produc-tion and use of affordable, reliable and accurate sen-sors in a range of environments (e.g., Nutrient SensorChallenge; www.nutrients-challenge.org/).
Tools for Integrating and Managing the“Data Deluge”
While the continuous monitoring of nutrients is asignificant advance in attempts to understand and
TABLE 1. Advantages and Disadvantages of Commercially Available Nutrient Sensor Technologies.
Type Principle Advantages Disadvantages
Optical (UV)sensors
Spectral absorption by a photometer High resolution, accuracy, and precisionChemical-free
Fast response timeAdditional optical information in spectra
Expensive (>$15,000)High power requirement andmaintenance costs
Only available for nitrate
Wet-chemicalsensors
Wet chemical colorimetric reactionwith detection by photometry
High resolution, accuracy, and precisionPotential for in situ calibrationsRelatively fast response timeAvailable for ammonium, nitrate,and phosphate
Expensive (>$10,000)High power requirement andmaintenance costs
High potential for foulingRequires reagents (generates waste)
Ion-selectiveelectrodes (ISE)
Direct potentiometry between a sensingelectrode and a reference electrode
Inexpensive (<$1,000) and easy to useFast response timeNot influenced by color or turbidityAvailable for ammonium and nitrate
Low resolution, accuracy, andprecision
Subject to ionic interferencesHigh instrument driftLimited shelf life
JAWRA JOURNAL OF THE AMERICAN WATER RESOURCES ASSOCIATION996
PELLERIN, STAUFFER, YOUNG, SULLIVAN, BRICKER, WALBRIDGE, CLYDE, AND SHAW
monitor water quality, improvements in our ability tointegrate, process and analyze large datasets are alsoneeded (Porter et al., 2012). For example, continuousmonitoring of a single parameter at 15 min intervalsresults in over 35,000 measurements per year, withthat number easily increasing by orders of magnitudewhen additional sensors and diagnostic data are alsoincluded. This is in contrast to traditional field sam-pling programs that typically collect 12-18 samplesper year, albeit with rich metadata associated witheach of those discrete data points. Given this “datadeluge” (Baraniuk, 2011; Porter et al., 2012), newand emerging data standards, improved telemetry,and new data management approaches are critical,particularly for the establishment of sensor networksin which data are collected and shared amongst mul-tiple parties.
The Consortium of Universities for the Advance-ment of Hydrologic Sciences, Incorporated (CUAHSI)has demonstrated the potential for sharing sensordata through the CUAHSI Hydrologic InformationSystem (HIS; https://www.cuahsi.org/AboutHIS). The
CUAHSI approach illustrates how defining standardprotocols for publishing data facilitates the discoveryof data from various sources or locations and allowsfor the incorporation of those data into other third-party applications. Since the initial implementationof the HIS, the Open Geospatial Consortium (OGC)has finalized web service interface standards forsensors as well as standard information models forsharing sensor data (http://www.opengeospatial.org/standards/sos). These standards have created the pos-sibility for an interoperable sensor network wheresystems and devices can exchange and interpret datafor not only nutrient sensors, but virtually any sensorproviding information on both water quantity andquality.
The Open Water Data Initiative (OWDI) providesa federal vision for how water data can be made bothdiscoverable and interoperable, and the frameworkenvisioned under OWDI supports the development ofan interoperable sensor network. In order for such asensor network to be successful, however, the princi-ples of the OWDI need to be followed, including: (1) a
FIGURE 2. Time Series of Nitrate for the Potomac River at Little Falls (USGS Station 01646500) Showing the Time Scales ofVariability in Nitrate Concentrations. Continuous (15 min) nitrate sensor data are shown in red circles, while biweekly
and event-based discrete sampling is shown in yellow squares. Note different scales on axes.
JOURNAL OF THE AMERICAN WATER RESOURCES ASSOCIATION JAWRA997
EMERGING TOOLS FOR CONTINUOUS NUTRIENT MONITORING NETWORKS: SENSORS ADVANCING SCIENCE AND WATER RESOURCES PROTECTION
maintained catalog of available sensor datasets,including relevant metadata and parameter measure-ments; (2) standard services that provide data in acommon format using common ontologies; (3) acommon geofabric that registers the spatial relation-ships between important hydrologic features andmonitoring points, facilitating the discovery ofsensors through upstream, downstream, or other net-work analyses; and (4) an open marketplace to enablethe private sector, including academia, to discover,analyze, and communicate the data in innovativeways.
APPLICATIONS FOR CONTINUOUSNUTRIENT MONITORING
Traditional water quality monitoring can be verycostly, especially when time and travel for personnel,specialized field equipment and laboratory analyticalcosts are factored in. Additionally, data with lowspatial and temporal resolution often yield results thatare difficult to interpret and may not adequately sup-port management actions. For example, Kirchner et al.(2004) illustrated the challenges to interpretationposed by the mismatch between temporal scales onwhich hydrologic processes (e.g., flow) and water qual-ity parameters (e.g., conductivity) are measured. Tobest utilize the low temporal resolution data collected
by most traditional measurement approaches, scien-tists and managers have developed statistical model-ing techniques to estimate missing concentration orload data from other observations such as discharge,time and season. Despite the recognized potential forbias (Stenback et al., 2011; Hirsch, 2014) and theinherent difficulty in understanding the drivers andfine-scale processes, management policies and actionsare increasingly dependent on these model outputsand vulnerable to their uncertainties.
As discussed earlier, in situ nutrient sensors offertwo fundamental advantages over these traditionaldiscrete sampling approaches: (1) data are collectedat a much higher temporal frequency; and (2) datacan be disseminated in real time. These improve-ments present significant opportunities in a numberof important applications ranging from real-time deci-sion support to nutrient transport model develop-ment. It is important to recognize, however, that theapplication of continuous nutrient sensors is notwithout significant costs. For example, a one-timenitrate measurement using a sensor would costapproximately US$60,000 when taking the procure-ment cost of a sensor ($20,000-25,000) into accountalong with operation, maintenance, and data valida-tion costs. For comparison, a discrete water qualitysample collected and analyzed by the U.S. GeologicalSurvey (USGS) for nutrients costs approximately$4,400 on average (based on 2013 estimates) once sal-ary, equipment, and laboratory analyses are included(Betanzo et al., 2015). However, sensor data will
FIGURE 3. Time Series of Nitrate Concentrations in the Raccoon River at Van Meter (USGS Station 05484500) and the Des Moines Riverat 2nd Avenue (USGS station 05482000) Used by the Des Moines Water Works for Drinking Water Plant Operations. Shaded areas show
periods where nitrate removal using ion exchange resins was online and the number of vessels operating at a given time (Jeff Mitchell, DesMoines Water Works, personal communication). Blended pretreatment water is a combination of the two river sources and a third gallerysource collecting shallow groundwater. The MCL is the maximum contaminant level for nitrate (as nitrogen, mg/L) allowed in drinking
water.
JAWRA JOURNAL OF THE AMERICAN WATER RESOURCES ASSOCIATION998
PELLERIN, STAUFFER, YOUNG, SULLIVAN, BRICKER, WALBRIDGE, CLYDE, AND SHAW

ultimately be less expensive per data point whenhigher frequency data are needed to quantify stormevent responses (Pellerin et al., 2012; Carey et al.,2014), understand stream metabolism (Heffernan andCohen, 2010; Cohen et al., 2013), and improve theaccuracy of nutrient load calculations (Cassidy andJordan, 2011; Duan et al., 2014; Pellerin et al., 2014;Terrio and Straub, 2015). Cost-benefit analysesshould therefore consider the number and temporaldensity of nutrient measurements needed to describethe process of interest with acceptable accuracy anduncertainty, as well as the added value of data deliv-ery in real time for water management, to determinewhether an investment into continuous monitoring iswarranted. However, other factors such as the rangeof parameters to be measured (many of which cannotyet be measured in situ) and alternative strategiesfor intermittent high frequency sampling such asautosamplers should also be considered.
Advancing Our Understanding of Watershed Processes
Watersheds consist of dynamic aquatic environ-ments and the surrounding land from which waterdrains to a common outlet, and there are many exam-ples of how high frequency data collection benefitsthe understanding of watershed processes andwatershed management. Continuous and real-timestreamflow measurements, for example, are criticalfor supporting flood forecasting and water-resourceplanning, as well as better understanding hydrologyas a driver of water quality (e.g., Hirsch and Costa,2004). At the watershed-scale, continuous nitratemonitoring is proving useful for both calculatingnutrient loading to downstream waters (Pellerinet al., 2014), as well as understanding the drivers ofchanges in water quality (Hensley et al., 2014). Highfrequency measurements are also critical to ade-quately characterize the variability in surface waternitrate and orthophosphate concentrations at somesites, especially during hydrologic events (Pellerinet al., 2012; Bende-Michl et al., 2013; Ferrant et al.,2013; Carey et al., 2014; Outram et al., 2014; Boweset al., 2015; Sherson et al., 2015) and during periodswhen instream biological processing or other factorsproduce, consume, or alter nutrients prior to down-stream export (Pellerin et al., 2009; Heffernan andCohen, 2010; Cohen et al., 2013; Hensley et al., 2014;Snyder and Bowden, 2014). For example, diurnalnitrate patterns similar to those observed in the Poto-mac River (Figure 2) have been used to estimaterates and drivers of primary productivity in bothfreshwater (Heffernan and Cohen, 2010; Cohen et al.,2013) and coastal environments (Johnson et al., 2006;Collins et al., 2013). Recent studies have also
demonstrated the value of high frequency nitratesensors for mapping the spatial variability in riversand lakes (Crawford et al., 2015).
Continuous nutrient monitoring may prove partic-ularly important for assessing and managing nutrientloads delivered across the land-water interface (e.g.,edge-of-field). This is particularly true, given the highcost of implementing BMPs to improve or maintainwater quality (Sharpley et al., 2006). The high tempo-ral frequency of sensor data provides an opportunityto improve the accuracy and reduce the uncertaintyof nutrient load estimates from the edge-of-field. Inaddition, high frequency data — coupled withweather data and information on land management —may help guide the implementation and evaluation ofBMPs at both the field and watershed scales. Finally,high frequency measurements maintained over longperiods of time (e.g., years) may also find broadapplicability in the development and performance val-idation of practices that are implemented as part ofmarket-based water quality trading programs (Wood-ward and Kaiser, 2002; Selman et al., 2009).
Applications of Nutrient Sensors forCoastal Monitoring
Given the importance of nitrogen and phosphorusas drivers of coastal eutrophication (Bricker et al.,2007), hypoxia (Turner et al., 2006), and HABs (Heis-ler et al., 2008), accurately quantifying the loads ofnutrients delivered to coastal environments is critical.Calculating riverine loads to estuaries using continu-ous sensors offers several advantages over traditionalregression-based modeling techniques that rely oninfrequent (typically monthly) discrete nitrate data.The higher rate of sampling ensures that dynamicsoperating across different time scales are captured,thereby largely eliminating bias (Stenback et al.,2011; Hirsch, 2014) and resulting in greater accuracyin concentration and load estimates (Pellerin et al.,2014; Duan et al., 2014; Wild-Allen and Rayner,2014). This is particularly important when discretesampling does not fully capture the concentration-dis-charge (C-Q) range or where the C-Q relationshipvaries significantly over time. For example, C-Q vari-ability in the Mississippi River basin during yearsthat included a drought (2012) and flood (2013)contributed to differences in nitrate loads usingcontinuous sensor data versus regression-based loadestimation models (Figure 4; Pellerin et al., 2014),particularly during spring months critical to the sum-mer formation of Gulf hypoxia. Similarly, calculatingloads from high frequency data results in improvedprecision (Jiang et al., 2014), which enables for moresensitive detection of changes related to basin
JOURNAL OF THE AMERICAN WATER RESOURCES ASSOCIATION JAWRA999
EMERGING TOOLS FOR CONTINUOUS NUTRIENT MONITORING NETWORKS: SENSORS ADVANCING SCIENCE AND WATER RESOURCES PROTECTION

management and/or climate variability than what iscurrently possible from models with significantlylarger errors or errors that are not quantified.
Improved nutrient load estimates and enhancedcoastal monitoring are also needed to better under-stand the relationship between eutrophication andHABs in coastal waters. Studies suggest the relation-ships between natural and anthropogenic nutrientloading and the development of HABs in coastalwaters are not universal, but rather that site-specificdifferences in hydrodynamics and environmental andbiological controls on phytoplankton growth play animportant role in determining where and when HABswill develop (Davidson et al. 2014, Anderson et al.2008). However, some of the lack of clear relationshipmay also be due to methodological limitations andcontinued reliance on infrequent nutrient concentra-tion measurements to develop these relationships.For example, measured nutrient concentrations andphytoplankton biomass may be negatively correlatedat a given point in space and time due to recentincorporation of the nutrient into biomass. As aresult, higher frequency estimates of nutrient loadsand/or fluxes may instead be better predictors of phy-toplankton growth and HAB development (Andersonet al. 2008) than infrequently-measured discrete con-centrations.
In coastal systems, sensors have also been used tocharacterize the upwelling of water with high nitrateconcentrations and with significant linkages to phyto-plankton blooms and HABs. For example, a number ofstudies have used continuous nitrate sensors in
estuaries and coastal waters to better characterize thevertical (Alkire et al., 2010; Johnson et al., 2010) andlateral (Lucas et al., 2011) distribution and transportof nitrate, as well as the impact of nitrate availabilityon daily changes in primary production (Johnsonet al., 2006). Additionally, sensors have been used toestimate nitrate fluxes at high temporal resolutionfrom seafloor sediment (Johnson et al., 2011), to betterunderstand nitrate and orthophosphate transforma-tions at the river-estuarine interface (Gilbert et al.,2013), and to test complex estuarine biogeochemicalmodels (Wild-Allen and Rayner, 2014).
Wastewater and Drinking Water Management
Excess nitrate in drinking water is one of the mostacutely harmful effects of nutrient pollution tohumans. High nitrate concentrations in drinkingwater have been linked to a variety of human healtheffects including birth defects (Brender et al., 2013),methemoglobinemia in infants (Fan and Steinberg,1996), and cancers (Townsend et al., 2003; Bryan andLoscalzo, 2011). An inventory of all types of publicwater systems by the U.S. Environmental ProtectionAgency (USEPA) showed nitrate to be the contami-nant that most frequently exceeded a federal drink-ing water standard among organic and inorganiccontaminants (U.S. Environmental ProtectionAgency, 2005). As a result, nitrate is a regulatedcontaminant under the Safe Drinking Water Act witha maximum contaminant level (MCL) of 10 mg/L.
0.0
0.5
1.0
1.5
2.0
2.5
3.0
3.5
0 5000 10000 15000 20000 25000 30000
Mea
n D
aily
Nitr
ate
(mg
N/L
)
Mean Daily Discharge (m3/s)
May 2012
May 2013
May 2014
May 2015
% D
iffer
ence
-20
-10
0
10
20LOADESTComposite Method WRTDS
May 2012 May 2013May 2014
Regression Model vs. Sensor Nitrate Load Comparison
FIGURE 4. Concentration-Discharge (C-Q) Relationships Based on Daily Mean Values for the Mississippi River at Baton Rouge (USGSstation 07374000) from November 2011 to May 2015. Daily values for the entire record are shown as grey circles, while daily values during
the month of May are colored. Inset shows the percent difference in May nitrate loads during different years from regression-basedloads based on the C-Q relationship versus continuous nitrate sensor data (modified from Pellerin et al., 2014).
JAWRA JOURNAL OF THE AMERICAN WATER RESOURCES ASSOCIATION1000
PELLERIN, STAUFFER, YOUNG, SULLIVAN, BRICKER, WALBRIDGE, CLYDE, AND SHAW

The ability to rapidly measure nitrate concentra-tions near drinking water intakes and transmit thesedata in real time is beneficial for taking managementactions, particularly in locations where concentra-tions approach regulatory limits. For example, nitratesensor data used by the Des Moines Water Worksprovides real-time decision support for online nitrateremoval (Figure 3), which costs over $7,000 per dayto operate (http://www.dmww.com/). Continuousnutrient monitoring also has a history of use in thewastewater industry, allowing for real-time control ofprocesses in treatment plants (Bonastre et al., 2005;Capelo et al., 2007; Drolc and Vrtov�sek, 2010). Theuse of continuous nutrient sensors for monitoringwater quality in groundwater is also an area ofpromising application given that some wells showchemical variability at time scales much shorter thanthe typical annual cycles for monitoring (Kelly, 1997;Mahler et al., 2011).
THE FUTURE OF NUTRIENT MONITORING
The future of water quality monitoring relies onboth traditional discrete sampling approaches andevolving technologies such as remote sensing, wire-less applications and in situ continuous sensors toanswer complex environmental questions. While allof these approaches are important, we have identifiedthree opportunities that will encourage the adoptionof affordable, accurate and reliable nutrient sensors.These opportunities address needs for better instru-mentation as well as the continued integration ofsensor data into sensor networks.
While the focus of this article is on nutrients (andspecifically nitrate), opportunities to improve thescience and management of water resources withcontinuous water quality measurements are muchbroader in scope. For example, regional and nationalnetworks of continuous water temperature measure-ments are being used to assess the implications of cli-mate change on salmonid fish (Isaak et al., 2012) andto aid in stream remediation efforts (Hill et al.,2013). The relative contributions of base flow to sur-face runoff over large regions have been evaluatedusing continuous specific conductance data (Sanfordet al., 2012; Miller et al., 2014). The analysis of con-tinuous dissolved oxygen, fluorescent dissolvedorganic matter, turbidity and other parametersacross regional and national networks will likely con-tinue to yield new insights into ecosystem processes,watershed hydrology, and constituent transport thatare not possible with traditional monitoringapproaches.
Opportunity 1: Guiding the Evolution ofSensor Technology
Technological advancements and innovation areleading to rapidly improving sensors and data manage-ment tools for environmental monitoring. In the caseof nutrient sensors, the increase in freshwater applica-tions has been a primary driver of innovations thatensure high quality data in a variety of challengingmatrix conditions (Alliance for Coastal Technologies,2015). For example, the need to reduce biological foul-ing of sensors in rivers and streams has spawned amarket for chemical and mechanical solutions rangingfrom copper components to integrated or externalwipers. We have identified the following needs as mostcritical for guiding the evolution of nutrient sensorsthat are affordable, accurate, and reliable.
Define Instrument Performance Needs. Defin-ing instrument specifications and data quality needsfor environmental monitoring from a range of poten-tial users is critical to the evolution of the technology.This is particularly true for nutrient sensors becausethe varying needs of the intended market result indesign tradeoffs that affect the data specifications.For example, UV nitrate sensors developed forwastewater often have lower precision and accuracythan those developed for coastal applications, butthey can measure nitrate over a wider concentrationrange and have greater tolerance for interferencesdue to shorter path lengths (Pellerin et al., 2013).Defining and communicating instrument performanceneeds — including those that minimize the lifetimecosts of owning and operating the sensors — is criti-cal for future environmental monitoring applications.Open innovation competitions such as the NutrientSensor Challenge (www.nutrients-challenge.org) areone mechanism available to help guide sensor devel-opment. Indeed, initial activities in the developmentof the Nutrient Sensor Challenge involved capturingfederal and state agency needs for nutrient sensorsand these data were used to further inform marketresearch, identify instrument performance targetsand design third-party verification testing (Alliancefor Coastal Technologies, 2015).
Partnering with Sensor Manufacturers to De-velop, Test, and Bring Sensors to Market. Part-nerships between federal agencies, states, the researchcommunity, and the sensor manufacturers will be criti-cal to bringing sensors, data collection platforms, com-munications tools and software to market more quicklyand at lower cost. This includes providing incentivesand support for innovation (e.g., the Nutrient SensorChallenge) and direct collaboration through formalresearch and development partnerships between
JOURNAL OF THE AMERICAN WATER RESOURCES ASSOCIATION JAWRA1001
EMERGING TOOLS FOR CONTINUOUS NUTRIENT MONITORING NETWORKS: SENSORS ADVANCING SCIENCE AND WATER RESOURCES PROTECTION

industry and federal, nonfederal, and nongovernmen-tal partners. These partnerships will be critical toaddressing future water quality monitoring needs. Forexample, target reductions in nutrient loading to estu-aries such as Chesapeake Bay are often based on total(e.g., particulate plus dissolved) nitrogen and phospho-rus (Boesch et al., 2001), yet the current generation ofoptical and wet chemical nutrient sensors can onlydirectly measure dissolved fractions (nitrate, ammo-nium, and orthophosphate). To accurately estimateparticulate nutrient loads requires turbidity sensors orother in situ technology as a proxy for suspended sedi-ment concentrations, coupled with discrete samplingto measure total nutrient concentrations in the sus-pended sediment. Similarly, “plug-and-play” platformsfor sensor integration and mobile software tools forsensor management and data display will continue tobe critical to improve the efficiency of deploying andmaintaining sensors. Other opportunities exist to workwith sensor, data logger, and data management sys-tem developers to adopt open standards to facilitatedata compatibility.
Opportunities such as the National Oceanic andAtmospheric Administration (NOAA) Ocean Technol-ogy Transition Project (http://www.ioos.noaa.gov/marine_sensors/ocean_tech.html) and the USGS Inno-vation Center for Earth Sciences (http://geogra-phy.wr.usgs.gov/ICES/) are fostering the developmentand application of new sensor technologies to addressenvironmental problems in water. However, there is aneed to consider supplemental funding mechanismsthat will help to support investments in sensors andwater monitoring infrastructure, as well as mecha-nisms that would enable organizations to collectivelypurchase, maintain, and utilize information fromsensor networks.
Opportunity 2: Develop and Support MonitoringNetworks
Environmental monitoring networks are made upof sampling sites that produce comparable dataacross specific scales of space and time, and have longbeen recognized as critical to understanding complexenvironmental processes (Leopold, 1962; Ficke andHawkinson, 1975). A 2004 report from a presidentialcommission stated that “The nation needs a coordi-nated, comprehensive monitoring network that canprovide the information necessary for managers tomake informed decisions, adapt their actions asneeded, and assure effective stewardship of oceanand coastal resources” (U.S. Commission on OceanPolicy, 2004). The report, however, also recognizedthat no single monitoring design can begin to addressor answer all of the nation’s water resource issues or
questions. Combined with ongoing monitoring net-works, a national network of discrete monitoring andcontinuous nutrient sensors could form a backboneand provide efficiencies in metadata, quality assur-ance procedures, comparable methodology, and datamanagement that allows readily accessible datastorage and retrieval.
There are currently a number of national-scale net-works supported by federal agencies and partners,spanning the continuum from satellite monitoring ofcoastal waters (NOAA CoastWatch, http://coast-watch.noaa.gov/cwn/index.html) to groundwater levels(National Ground-Water Monitoring Network,http://cida.usgs.gov/ngwmn/), all with the goal of pro-viding practical information for policy makers, man-agers, and the public. National networks for river andstream water quality such as the USGS NationalStream Quality Accounting Network (NASQAN,water.usgs.gov/nasqan) were developed to monitor thetransport of nutrients and other constituents fromlarge rivers to coastal waters through time (Ficke andHawkinson, 1975). The NASQAN network relies onrelatively low frequency discrete sampling (12-18 sam-ples per year) and modeling techniques for load esti-mation such as LOADEST (Runkel et al., 2004) toaccomplish this goal. The need for continuous waterquality monitoring sites in an integrated national net-work to assess inland and coastal water quality, evalu-ate changes in nutrient cycling, and protect waterresources has been highlighted in several scientificreviews (National Science and Technology CouncilCommittee on Environment and Natural Resources(Subcommittee on Water Availability and Quality),2007; National Research Council Committee on RiverScience at the U.S. Geological Survey, 2007).
Building a Core Continuous MonitoringNetwork. A core continuous nutrient monitoringnetwork should include stable, long-term monitoringsites with a rigorous program of data collection, qualityassurance, management, archiving, and synthesis sim-ilar to the National Streamflow Information Program(http://water.usgs.gov/nsip/). Such a network wouldnot be independent of a national network of discretewater quality monitoring sites or stream gages, butwould instead enhance our ability to answer funda-mental questions about the sources, timing, and mag-nitude of nutrient transport at key locations throughthe addition of high frequency data. Another importantancillary benefit of such a network is the developmentof common protocols and data standards by technicalexperts from federal and state agencies, academia, andindustry to support the broader collection of continu-ous data. For example, the U.S. Integrated OceanObserving Systems program develops guidance forthe Quality Assurance of Real Time Ocean Data
JAWRA JOURNAL OF THE AMERICAN WATER RESOURCES ASSOCIATION1002
PELLERIN, STAUFFER, YOUNG, SULLIVAN, BRICKER, WALBRIDGE, CLYDE, AND SHAW
(QARTOD, www.ioos.noaa.gov/qartod/) that are avail-able to the broader community.
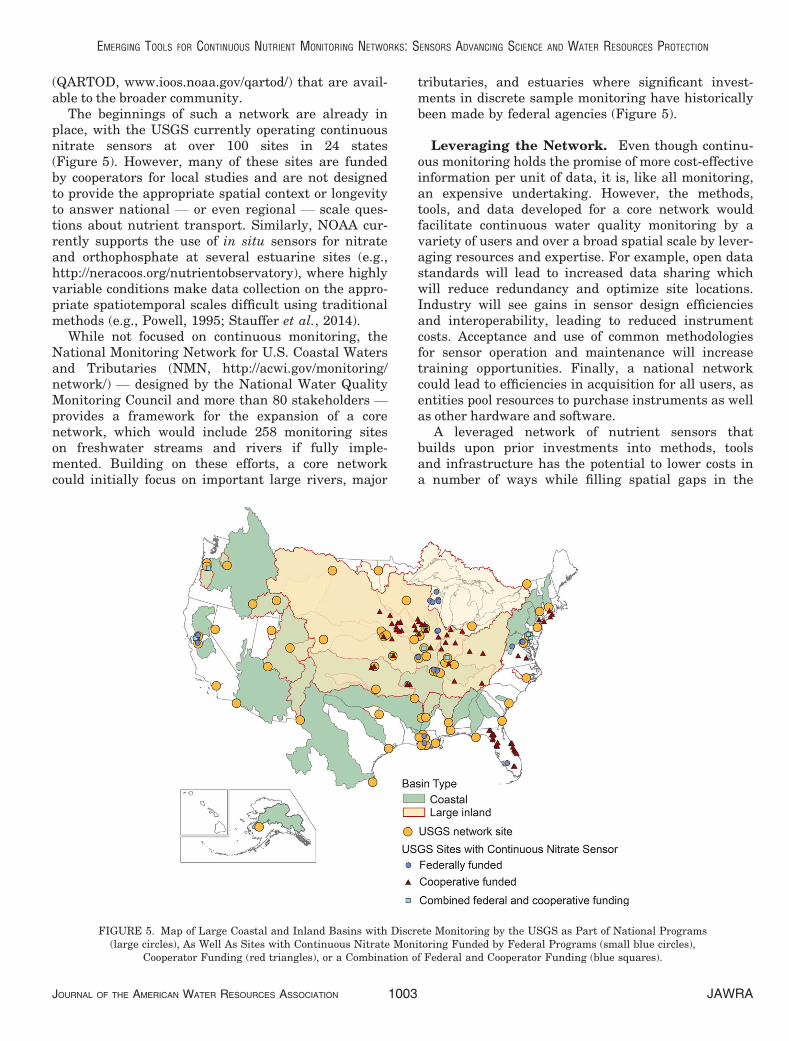
The beginnings of such a network are already inplace, with the USGS currently operating continuousnitrate sensors at over 100 sites in 24 states(Figure 5). However, many of these sites are fundedby cooperators for local studies and are not designedto provide the appropriate spatial context or longevityto answer national — or even regional — scale ques-tions about nutrient transport. Similarly, NOAA cur-rently supports the use of in situ sensors for nitrateand orthophosphate at several estuarine sites (e.g.,http://neracoos.org/nutrientobservatory), where highlyvariable conditions make data collection on the appro-priate spatiotemporal scales difficult using traditionalmethods (e.g., Powell, 1995; Stauffer et al., 2014).
While not focused on continuous monitoring, theNational Monitoring Network for U.S. Coastal Watersand Tributaries (NMN, http://acwi.gov/monitoring/network/) — designed by the National Water QualityMonitoring Council and more than 80 stakeholders —provides a framework for the expansion of a corenetwork, which would include 258 monitoring siteson freshwater streams and rivers if fully imple-mented. Building on these efforts, a core networkcould initially focus on important large rivers, major
tributaries, and estuaries where significant invest-ments in discrete sample monitoring have historicallybeen made by federal agencies (Figure 5).
Leveraging the Network. Even though continu-ous monitoring holds the promise of more cost-effectiveinformation per unit of data, it is, like all monitoring,an expensive undertaking. However, the methods,tools, and data developed for a core network wouldfacilitate continuous water quality monitoring by avariety of users and over a broad spatial scale by lever-aging resources and expertise. For example, open datastandards will lead to increased data sharing whichwill reduce redundancy and optimize site locations.Industry will see gains in sensor design efficienciesand interoperability, leading to reduced instrumentcosts. Acceptance and use of common methodologiesfor sensor operation and maintenance will increasetraining opportunities. Finally, a national networkcould lead to efficiencies in acquisition for all users, asentities pool resources to purchase instruments as wellas other hardware and software.
A leveraged network of nutrient sensors thatbuilds upon prior investments into methods, toolsand infrastructure has the potential to lower costs ina number of ways while filling spatial gaps in the
FIGURE 5. Map of Large Coastal and Inland Basins with Discrete Monitoring by the USGS as Part of National Programs(large circles), As Well As Sites with Continuous Nitrate Monitoring Funded by Federal Programs (small blue circles),
Cooperator Funding (red triangles), or a Combination of Federal and Cooperator Funding (blue squares).
JOURNAL OF THE AMERICAN WATER RESOURCES ASSOCIATION JAWRA1003
EMERGING TOOLS FOR CONTINUOUS NUTRIENT MONITORING NETWORKS: SENSORS ADVANCING SCIENCE AND WATER RESOURCES PROTECTION
national landscape. For example, the range of sites ina national network could include drinking waterintakes in both surface and groundwater, wastewaterdischarge monitoring, edge-of-field monitoring, andsmaller tributary and stream sites. Organizationsthat operate and manage these sites might includenongovernmental watershed groups, state agencies,academic researchers, other federal partners, andindustry. These new sites, depending on their pur-pose, could provide information at finer scales, orincrease the spatial coverage across the nation.
A number of models for national environmentalmonitoring networks exist that combine long-term corenetworks with leveraged sites operated in comparableways by a variety of entities. One such example is theNational Atmospheric Deposition Program (NADP),which is a cooperative effort between various federal,state, tribal, and local agencies, as well as academia,industry, and nongovernmental organizations, tomonitor and make available atmospheric chemicaldeposition data (http://nadp.sws.uiuc.edu/). The NADPincludes several smaller networks that follow similarmethodologies for the collection and quality assuranceof data. A national network of continuous nutrientsensors could operate in a similarly leveraged way toprovide broad spatial coverage of comparable data thatcan be translated into practical information fordecision makers and the public.
Opportunity 3: Advancing Integration across Spaceand Time
An integrated network of nutrient sensors acrossthe country presents a number of new and importantopportunities. The information provided by such anetwork would help assess long-term trends, providean early warning system to environmental and waterquality managers, and enhance evaluations of theeffects of management and mitigation actions acrossmultiple scales. To fully realize this potential, how-ever, standardized sensor measurement protocols,data collection strategies, and common quality assur-ance/quality control (QA/QC) approaches thatincludes periodic discrete sampling and laboratoryanalyses of samples will be necessary to develop aninter-calibrated network of in situ nutrients sensorswith diverse end users. Key to this will be opendata standards, incorporated into the sensors andassociated hardware by manufacturers, accepted bythe water-quality community, and built into datastorage hardware and data processing software.
Develop Common Data Standards andMethodologies. In addition to shared methods forthe operation and maintenance of sensors, a key need
is the identification of data and metadata standardsto more effectively manage and share sensor data.Standards should be developed that can work acrossboth water quality and water quantity data types.Another critical need is to provide an index, or cata-log, for the registration of datasets by various dataproducers, and to make those data queryable viacommon portals. Data management products wouldconform to the standards identified by the monitoringcommunity, and enable data providers to easily pub-lish their data via an integrated network. Followingthe concepts outlined in the OWDI, this standards-based catalog and services approach would also tiethe sensor locations to a common geofabric (e.g., theNational Hydrography Dataset) to allow for queriesbased on the watershed network (i.e., upstream ordownstream). This approach would also allow forthese services and catalogs to be accessible by third-party developers who wish to build applications tomeet specific use cases and needs.
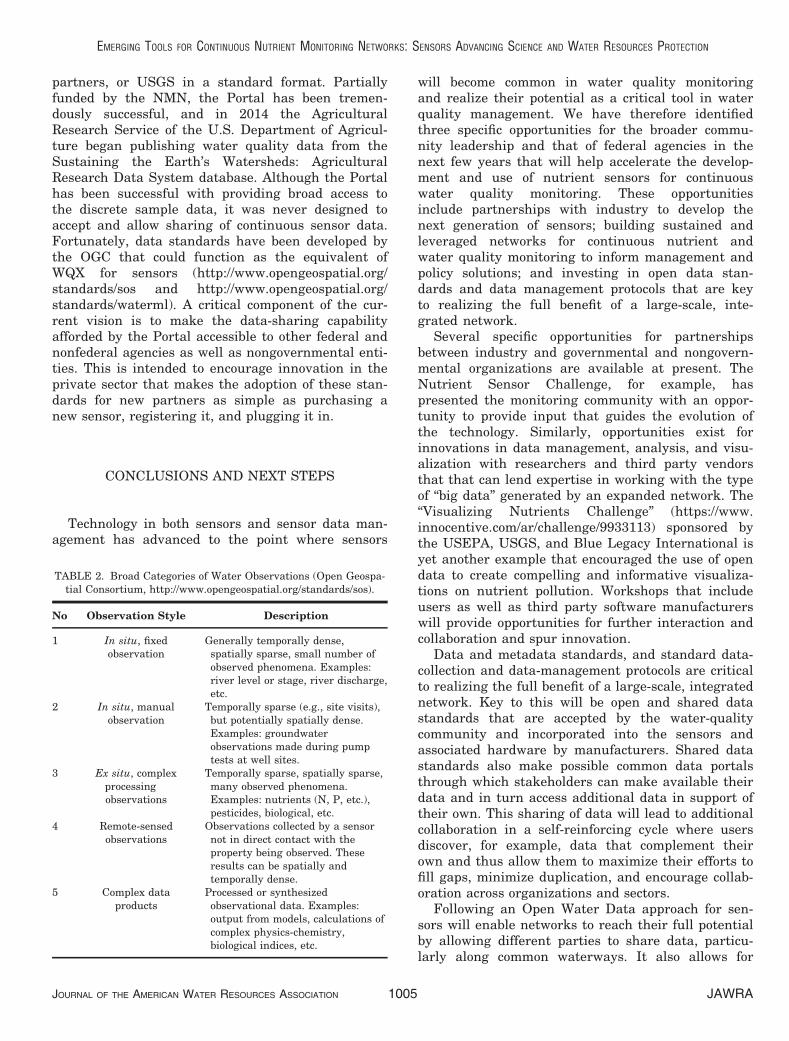
Improve Data Management and Access. Manag-ing and sharing the data collected from monitoringefforts is critical to preserving the value of thosedata. The methods used to collect water monitoringdata can impact what approaches are taken to store,manage, and publish those data. As part of the datastandards development process, the OGC has devel-oped a categorization of water monitoring data types(Table 2). Metadata requirements for each of thesedifferent categories of data may differ significantly.For example, the metadata required for a discretesample (Table 2, data types 1 and 3; i.e., sample col-lection method, laboratory analytical method, etc.)will differ from the metadata required for a sensor(data types 2 and 4; i.e., deployment period, date lastcalibrated, etc.). Additionally, the relationshipbetween metadata and reported data can differgreatly for these two types of data: discrete sampledata contains a wealth of metadata that describe oneor a few results while continuous sensor datarequires metadata to describe a sensor that may beassociated with multiple results. Because of this dif-ference, the approaches needed to store, manage, andshare metadata may be quite different for discreteversus continuous data.
The Water Quality Exchange (WQX) (http://www.epa.gov/storet/wqx) was developed to provide a meansfor partners to share the monitoring data that theyare collecting in a standard format that also allowsthe data to be documented and understandable byothers who are accessing it. Additionally, the WQXstandard has enabled USEPA to collaborate with theUSGS to develop the Water Quality Portal (Portal;http://waterqualitydata.us), which enables easy accessto any water monitoring data collected by USEPA, its
JAWRA JOURNAL OF THE AMERICAN WATER RESOURCES ASSOCIATION1004
PELLERIN, STAUFFER, YOUNG, SULLIVAN, BRICKER, WALBRIDGE, CLYDE, AND SHAW
partners, or USGS in a standard format. Partiallyfunded by the NMN, the Portal has been tremen-dously successful, and in 2014 the AgriculturalResearch Service of the U.S. Department of Agricul-ture began publishing water quality data from theSustaining the Earth’s Watersheds: AgriculturalResearch Data System database. Although the Portalhas been successful with providing broad access tothe discrete sample data, it was never designed toaccept and allow sharing of continuous sensor data.Fortunately, data standards have been developed bythe OGC that could function as the equivalent ofWQX for sensors (http://www.opengeospatial.org/standards/sos and http://www.opengeospatial.org/standards/waterml). A critical component of the cur-rent vision is to make the data-sharing capabilityafforded by the Portal accessible to other federal andnonfederal agencies as well as nongovernmental enti-ties. This is intended to encourage innovation in theprivate sector that makes the adoption of these stan-dards for new partners as simple as purchasing anew sensor, registering it, and plugging it in.
CONCLUSIONS AND NEXT STEPS
Technology in both sensors and sensor data man-agement has advanced to the point where sensors
will become common in water quality monitoringand realize their potential as a critical tool in waterquality management. We have therefore identifiedthree specific opportunities for the broader commu-nity leadership and that of federal agencies in thenext few years that will help accelerate the develop-ment and use of nutrient sensors for continuouswater quality monitoring. These opportunitiesinclude partnerships with industry to develop thenext generation of sensors; building sustained andleveraged networks for continuous nutrient andwater quality monitoring to inform management andpolicy solutions; and investing in open data stan-dards and data management protocols that are keyto realizing the full benefit of a large-scale, inte-grated network.
Several specific opportunities for partnershipsbetween industry and governmental and nongovern-mental organizations are available at present. TheNutrient Sensor Challenge, for example, haspresented the monitoring community with an oppor-tunity to provide input that guides the evolution ofthe technology. Similarly, opportunities exist forinnovations in data management, analysis, and visu-alization with researchers and third party vendorsthat that can lend expertise in working with the typeof “big data” generated by an expanded network. The“Visualizing Nutrients Challenge” (https://www.innocentive.com/ar/challenge/9933113) sponsored bythe USEPA, USGS, and Blue Legacy International isyet another example that encouraged the use of opendata to create compelling and informative visualiza-tions on nutrient pollution. Workshops that includeusers as well as third party software manufacturerswill provide opportunities for further interaction andcollaboration and spur innovation.
Data and metadata standards, and standard data-collection and data-management protocols are criticalto realizing the full benefit of a large-scale, integratednetwork. Key to this will be open and shared datastandards that are accepted by the water-qualitycommunity and incorporated into the sensors andassociated hardware by manufacturers. Shared datastandards also make possible common data portalsthrough which stakeholders can make available theirdata and in turn access additional data in support oftheir own. This sharing of data will lead to additionalcollaboration in a self-reinforcing cycle where usersdiscover, for example, data that complement theirown and thus allow them to maximize their efforts tofill gaps, minimize duplication, and encourage collab-oration across organizations and sectors.
Following an Open Water Data approach for sen-sors will enable networks to reach their full potentialby allowing different parties to share data, particu-larly along common waterways. It also allows for
TABLE 2. Broad Categories of Water Observations (Open Geospa-tial Consortium, http://www.opengeospatial.org/standards/sos).
No Observation Style Description
1 In situ, fixedobservation
Generally temporally dense,spatially sparse, small number ofobserved phenomena. Examples:river level or stage, river discharge,etc.
2 In situ, manualobservation
Temporally sparse (e.g., site visits),but potentially spatially dense.Examples: groundwaterobservations made during pumptests at well sites.
3 Ex situ, complexprocessingobservations
Temporally sparse, spatially sparse,many observed phenomena.Examples: nutrients (N, P, etc.),pesticides, biological, etc.
4 Remote-sensedobservations
Observations collected by a sensornot in direct contact with theproperty being observed. Theseresults can be spatially andtemporally dense.
5 Complex dataproducts
Processed or synthesizedobservational data. Examples:output from models, calculations ofcomplex physics-chemistry,biological indices, etc.
JOURNAL OF THE AMERICAN WATER RESOURCES ASSOCIATION JAWRA1005
EMERGING TOOLS FOR CONTINUOUS NUTRIENT MONITORING NETWORKS: SENSORS ADVANCING SCIENCE AND WATER RESOURCES PROTECTION

those data to be integrated with other types of data(i.e., discrete water quality samples, water use data,precipitation data, etc.). As part of OWDI, all of thesedatasets would also be related to the same streamnetwork, which will allow for other types of queries,such as “Find any sensors downstream of this dis-charge point”, or “Find any sensors, and their corre-sponding data that are upstream of this drinkingwater intake.” Developing the interoperable sensornetworks described here would be a critical compo-nent of the OWDI, and also would provide substantialbenefit for the water management community andthe public.
Because the science of using water quality sensorsis still relatively young and many organizations arejust beginning to explore the possibilities for monitor-ing programs, the time is right for innovations thatcan be utilized and shared. Investments in sensortechnologies and data management tools will increaseour understanding of the environmental issues aswell as the costs/benefits and tradeoffs associatedwith continuous monitoring. Partnerships betweenfederal and state agencies, nongovernmental organi-zations, and academic researchers have the ability toeffectively leverage investments to build a nationalnetwork for continuous nutrient and water qualitymonitoring which will inform management and policysolutions to continue to protect and restore ournation’s water resources.
ACKNOWLEDGMENTS
The authors benefited from insights and comments from RobertGilliom, Charles Crawford, Donna Myers, Bill Wilber, Gary Rowe,Pixie Hamilton, Mark Nilles, Andy Ziegler, Jeff Lape, and RichardMitchell. We thank Pete Penoyer (National Park Service) and twoanonymous reviewers for helpful comments on the manuscript.This article was supported by the USGS Office of Water Quality,the USGS National Water Quality Assessment Program, and theNational Water Quality Monitoring Council.
LITERATURE CITED
Alkire, M.B., K.K. Falkner, J. Morison, R.W. Collier, C.K. Guay,R.A. Desiderio, I.G. Rigor, and M. McPhee, 2010. Sensor-BasedProfiles of the NO Parameter in the Central Arctic and South-ern Canada Basin: New Insights Regarding the Cold Halocline.Deep Sea Research Part I: Oceanographic Research Papers57(11):1432-1443.
Alliance for Coastal Technologies, 2015. Proceedings of the NutrientSensor Challenge Workshop. http://www.act-us.info/nutrients-challenge/Download/ACT_Workshop_Report_12-3.pdf, accessedJune 2015.
Anderson, D.M., J.M. Burkholder, W.P. Cochlan, P.M. Glibert, C.J.Gobler, C.A. Heil, R.M. Kudela, M.L. Parsons, J.E.J. Rensel,D.W. Townsend, V.L. Trainer, and G.A. Vargo, 2008. HarmfulAlgal Blooms and Eutrhophication: Examining Linkages from
Selected Coastal Regions of the United States. Harmful Algae 8(1):39-53.
Baraniuk, R.G., 2011. More Is Less: Signal Process and the DataDeluge. Science 331:717-719.
Bende-Michl, U., K. Verburg, and H.P. Cresswell, 2013. High-Fre-quency Nutrient Monitoring to Infer Seasonal Patterns inCatchment Source Availability, Mobilisation and Delivery. Envi-ronmental Monitoring and Assessment 185:9191-9219.
Betanzo, E.A., A.F. Choquette, K.H. Reckhow, L. Hayes, E.R.Hagen, D.M. Argue, and A.A. Cangelosi, 2015. Water Data toAnswer Urgent Water Policy Questions: Monitoring Design,Available Data and Filling Data Gaps for Determining theEffectiveness of Agricultural Management Practices for Redu-cing Tributary Nutrient Loads to Lake Erie. Northeast-MidwestInstitute Report, 169 p., http://www.nemw.org/, accessed Sep-tember 2015.
Boesch, D.F., R.B. Brinsfield, and R.E. Magnien, 2001. ChesapeakeBay Eutrophication: Scientific Understanding, EcosystemRestoration, and Challenges for Agriculture. Journal of Environ-mental Quality 30:303-320.
Bonastre, A., R. Ors, J.V. Capella, M.J. Fabra, and M. Peris, 2005.In-line Chemical Analysis of Wastewater: Present and FutureTrends. Trends in Analytical Chemistry 24:128-137.
Bowes, M.J., H.P. Jarvie, S.J. Halliday, R.A. Skeffington, A.J.Wade, M. Loewenthal, E. Gozzard, J.R. Newman, and E.J.Palmer-Felgate, 2015. Characterising Phosphorus and NitrateInputs to a Rural River Using High-Frequency Concentration-Flow Relationships. The Science of the Total Environment511:608-620.
Brender, J.D., P.J. Weyer, P.A. Romitti, B.P. Mohanty, M.U.Shinde, A.M. Vuong, J.R. Sharkey, D. Dwivedi, S.A. Horel, J.Kantamneni, J.C. Huber, Jr., Q. Zheng, M.M. Werler, K.E.Kelley, J.S. Griesenbeck, F.B. Zhan, P.H. Langlois, L. Suarez,and M.A. Canfield; The Nation Birth Defects Prevention Study,2013. Prenatal Nitrate Intake from Drinking Water andSelected Birth Defects in Offspring of Participants in theNational Birth Defects Prevention Study. Environmental HealthPerspectives 121(9): 1083-1089.
Bricker, S., B. Longstaff, W. Dennison, A. Jones, K. Boicourt, C.Wicks, and J. Woerner, 2007. Effects of Nutrient Enrichment inthe Nation’s Estuaries: A Decade of Change. NOAA CoastalOcean Program Decision Analysis Series No. 26. National Cen-ters for Coastal Ocean Science, Silver Spring, Maryland, 328 pp.http://ian.umces.edu/neea/, accessed June 2015.
Bryan, N.S. and J. Loscalzo (Editors), 2011. Nitrate and Nitrite inHuman Health and Disease. Springer, Humana Press, NewYork City, New York, 306 pp.
Capelo, S., F. Mira, and A.M. de Bettencourt, 2007. In Situ Contin-uous Monitoring of Chloride, Nitrate and Ammonium in Tempo-rary Stream—Comparison with Standard Methods. Talanta71:1166-1171.
Carey, R.O., W.M. Wollheim, G.K. Mulukutla, and M. Mineau,2014. Characterizing Storm-Event Nitrate Fluxes in a FifthOrder Suburbanizing Watershed Using In Situ Sensors. Envi-ronmental Science and Technology 48:7756-7765.
Cassidy, R. and P. Jordan, 2011. Limitations of InstantaneousWater Quality Sampling in Surface-Water Catchments: Compar-ison with Near-Continuous Phosphorus Time-Series Data. Jour-nal of Hydrology 405:182-193.
Cohen, M.J., M.J. Kurz, J.B. Heffernan, J.B. Martin, R.L. Dou-glass, C.R. Foster, and R.G. Thomas, 2013. Diel PhosphorusVariation and the Stoichiometry of Ecosystem Metabolism in aLarge Spring-Fed River. Ecological Monographs 83(2):155-176.
Collins, J.R., P.A. Raymond, W.F. Bohlen, and M.M. Howard-Stro-bel, 2013. Estimates of New and Total Primary Productivity inCentral Long Island Sound from In Situ Measurements ofNitrate and Dissolved Oxygen. Estuaries and Coasts 36:74-97.
JAWRA JOURNAL OF THE AMERICAN WATER RESOURCES ASSOCIATION1006
PELLERIN, STAUFFER, YOUNG, SULLIVAN, BRICKER, WALBRIDGE, CLYDE, AND SHAW

Crawford, J.T., L.C. Loken, N.J. Casson, C. Smith, A.G. Stone, andL.A. Winslow, 2015. High Speed limnology: Using AdvancedSensors to Investigate Spatial Variability in Biogeochemistryand Hydrology. Environmental Science and Technology 49:442-450.
Davidson, K., R.J. Gowen, P.J. Harrison, L.E. Fleming, P. Hoag-land, and G. Moschonas, 2014. Anthropogenic Nutrients andHarmful Algae in Coastal Waters. Journal of EnvironmentalManagement 146:206-216.
Drolc, A. and J. Vrtov�sek, 2010. Nitrate and Nitrite NitrogenDetermination in Waste Water Using On-Line SpectrometricMethod. Bioresource Technology 101:4228-4233.
Duan, S., R.T. Powell, and T.S. Bianchi, 2014. High FrequencyMeasurement of Nitrate Concentration in the Lower MississippiRiver, USA. Journal of Hydrology 519:376-386.
Dubrovsky, N.M., K.R. Burow, G.M. Clark, J.M. Gronberg, P.A.Hamilton, K.J. Hitt, D.K. Mueller, M.D. Munn, B.T. Nolan, L.J.Puckett, M.G. Rupert, T.M. Short, N.E. Spahr, L.A. Sprague,and W.G. Wilber, 2010. The Quality of Our Nation’s Waters—Nutrients in the Nation’s Streams and Groundwater, 1992-2004:U.S. Geological Survey Circular 1350, 174 pp.
Erisman, J.W., J.W. Galloway, S. Seitzinger, A. Bleeker, N.B.Dise, A.M.R. Petrescu, A.M. Leach, and W. de Vries, 2013.Consequences of Human Modification of the Global NitrogenCycle. Philosophical Transactions of the Royal Society B368:20130116.
Fan, A.M. and V.E. Steinberg, 1996. Health Implications of Nitrateand Nitrite in Drinking Water: An Update on Methemoglobine-mia Occurrence and Reproductive and Developmental Toxicity.Regulatory Toxicology and Pharmacology 23:35-43.
Ferrant, S., C. Laplanche, G. Durbe, A. Probst, P. Dugast, P. Dur-and, J.M. Sanchez-Perez, and J.L. Probst, 2013. Continuous Mea-surement of Nitrate Concentration in a Highly Event-ResponsiveAgricultural Catchment in South-West of France: Is the Gain ofInformation Useful? Hydrological Processes 27:1751-1763.
Ficke, J.F. and R.O. Hawkinson, 1975. The National Stream Qual-ity Accounting Network (NASQAN): Some Questions andAnswers. US Geological Survey Circular 719, 23 pp.
Finch, M.S., D.J. Hydes, C.H. Clayson, B. Weigl, J. Dakin, and P.Gwillam, 1998. A Low Power Ultra Violet Spectrophotometer forMeasurement of Nitrate in Seawater: Introduction, Calibrationand Initial Sea Trials. Analytica Chimica Acta 377:167-177.
Gilbert, M., J. Needoba, C. Koch, A. Barnard, and A. Baptista,2013. Nutrient Loading and Transformations in the ColumbiaRiver Estuary Determined by High-Resolution In Situ Sensors.Estuaries and Coasts 36:708-727.
Heffernan, J.B. and M.J. Cohen, 2010. Direct and Indirect Cou-pling of Primary Production and Diel Nitrate Dynamics in aSubtropical Spring-Fed River. Limnology and Oceanography 55(2):677-688.
Heisler, J., P.M. Gilbert, J.M. Burkholder, D.M. Anderson, W.Cochlan, W.C. Dennison, Q. Dortch, C.J. Gobler, C.A. Heil, E.Humphries, A. Lewitus, R. Magnien, H.G. Marshall, K. Sellner,D.A. Stockwell, D.K. Stoecker, and M. Suddleson, 2008.Eutrophication and Harmful Algal Blooms: A Scientific Consen-sus. Harmful Algae 8(1):3-13.
Hensley, R.T., M.J. Cohen, and L.V. Korhnak, 2014. InferringNitrogen Removal in Large Rivers from High-Resolution Longi-tudinal Profiling. Limnology and Oceanography 59(4):1152-1170.
Hill, R.A., C.P. Hawkins, and D.M. Carlisle, 2013. Predicting Ther-mal Reference Conditions for USA Streams and Rivers. Fresh-water Science 32(1):39-55.
Hirsch, R.M., 2014. Large Biases in Regression-Based ConstituentFlux Estimates: Causes and Diagnostic Tools. Journal of theAmerican Water Resources Association 50(6):1401-1424.
Hirsch, R.M. and J.E. Costa, 2004. U.S. Stream Flow Measurementand Data Dissemination Improve. Eos Transactions 85:197-203.
Horsburgh, J.S., D.G. Tarboton, D.R. Maidment, and I. Zaslavsky,2011. Components of an Environmental Observatory Informa-tion System. Computers & Geosciences 37:207-218.
Isaak, D.J., S. Wollrab, D. Horan, and G. Chandler, 2012. ClimateChange Effects on Stream and River Temperatures across theNorthwest U.S. from 1980-2009 and Implications for SalmonidFishes. Climate Change 113:499-524.
Jannasch, H.W., K.S. Johnson, and C.M. Sakamoto, 1994. Sub-mersible Osmotically Pumped Colorimetric Analyzers for theContinuous Determination of Nitrate In Situ. Analytical Chem-istry 66:3352-3361.
Jiang, Y., J.R. Frankenberger, L.C. Bowling, and Z. Sun, 2014.Quantification of Uncertainty in Estimated Nitrate-NLoads in Agricultural Watersheds. Journal of Hydrology 519:106-116.
Johnson, K.S., J.P. Barry, L.J. Coletti, S.E. Fitzwater, H.W. Jan-nasch, and C.F. Lovera, 2011. Nitrate and Oxygen Flux acrossthe Sediment-Water Interface Observed by Eddy CorrelationMeasurements on the Open Continental Shelf. Limnology andOceanography: Methods 9(11):543-553.
Johnson, K.S. and L.J. Coletti, 2002. In Situ Ultraviolet Spec-trophotometry for High Resolution and Long-Term Monitoringof Nitrate, Bromide and Bisulfide in the Ocean. Deep-SeaResearch Part I 49:1291-1305.
Johnson, K.S., L.J. Coletti, and F.P. Chavez, 2006. Diel NitrateCycles Observed with In Situ Sensors Predict Monthly andAnnual New Production. Deep-Sea Research I 53:561-573.
Johnson, K.S., S.C. Riser, and D.M. Karl, 2010. Nitrate Supplyfrom Deep to Near-Surface Waters of the North Pacific Subtrop-ical Gyre. Nature 465:1062-1065.
Jones, A.S., J.S. Horsburgh, N.O. Mesner, R.J. Ryel, and D.K. Ste-vens, 2012. Influence of Sampling Frequency on Estimation ofAnnual Total Phosphorus and Total Suspended Solids Loads.Journal of the American Water Resources Association 48(6):1258-1275.
Kaufman, Z., D. Abler, J. Shortle, J. Harper, H. Hamlett, and P.Feather, 2014. Agricultural Costs of the Chesapeake Bay TotalMaximum Daily Load. Environmental Science and Technology48:14131-14138.
Kelly, W.R., 1997. Heterogeneities in Ground-Water Geochemistryin a Sand Aquifer Beneath an Irrigated Field. Journal ofHydrology 198:154-176.
Kirchner, J.W., X. Feng, C. Neal, and A.J. Robson, 2004. TheFine Structure of Water-Quality Dynamics: The (High-Fre-quency) Wave of the Future. Hydrological Processes 18:1353-1359.
Langmuir, D. and R.L. Jacobson, 1970. Specific-Ion ElectrodeDetermination of Nitrate in Some Freshwaters and SewageEffluents. Environmental Science and Technology 4(10):834-838.
Leopold, L.B., 1962. The Vigil Network. Bulletin of the IASH7(2):5-9.
Lucas, A.J., P.J.S. Franks, and C.L. Dupont, 2011. HorizontalInternal-Tide Fluxes Support Elevated Phytoplankton Produc-tivity over the Inner Continental Shelf. Limnology and Oceanog-raphy: Fluids and Environments 1:56-74.
Mahler, B.J., M. Musgrove, C. Herrington, and T.L. Sample, 2011.Recent (2008-2010) Concentrations and Isotopic Compositions ofNitrate and Concentrations of Wastewater Compounds in theBarton Springs Zone, South-Central Texas, and Their PotentialRelation to Urban Development in the Contributing Zone. U.S.Geological Survey Scientific Investigations Report 2011-5018, 39pp.
Miller, M.P., D. Susong, C.L. Shope, V.M. Heilweil, and B.J. Stolp,2014. Continuous Estimation of Baseflow in Snowmelt-Domi-nated Streams and Rivers in the Upper Colorado River Basin: AChemical Hydrograph Separation Approach. Water ResourcesResearch 50:6986-6999.
JOURNAL OF THE AMERICAN WATER RESOURCES ASSOCIATION JAWRA1007
EMERGING TOOLS FOR CONTINUOUS NUTRIENT MONITORING NETWORKS: SENSORS ADVANCING SCIENCE AND WATER RESOURCES PROTECTION

Murdoch, P., M. McHale, and J. Baron, 2014. Reflections on aVision for Integrated Research and Monitoring after 15 Years.Aquatic Geochemistry 20(2-3):363-380.
Myers, D.N., 2015. Foundations of Water Quality Monitoring andAssessment in the United States. In: Food Energy, and Water:The Chemistry Connection, S. Ahuja (Editor). Elsevier, SanFrancisco, California, pp. 21-92.
National Research Council Committee on River Science at the U.S.Geological Survey, 2007. River Science at the U.S. Geological Sur-vey. The National Academies Press, Washington, D.C., 206 pp.
National Science and Technology Council Committee on Environ-ment and Natural Resources (Subcommittee on Water Availabil-ity and Quality), 2007. A Strategy for Federal Science andTechnology to Support Water Availability and Quality in theUnited States. http://www.acs.org/content/dam/acsorg/policy/ac-sonthehill/briefings/energywaternexus/nstc-09-07-fed-st-for-water-quality.pdf, accessedMay 2015.
Outram, F.N., C.E.M. Lloyd, J. Jonczyk, C.H.M. Benskin, G. Grant,M.T. Perks, C. Deasy, S.P. Burke, A.L. Collins, J. Freer, P.M.Haygarth, K.M. Hiscock, P.J. Johnes, and A.L. Lovett, 2014.High-Frequency Monitoring of Nitrogen and PhosphorusResponse in Three Rural Catchments to the End of the 2011-2012 Drought in England. Hydrology and Earth SystemSciences 18:3429-3448.
Pellerin, B.A., B.A. Bergamaschi, R.J. Gilliom, C.G. Crawford, J.Saraceno, C.P. Frederick, B.D. Downing, and J.C. Murphy,2014. Mississippi River Nitrate Loads from High FrequencySensor Measurements and Regression-Based Load Estimation.Environmental Science and Techology 48(21):12612-12619, DOI:10.1021/es504029c.
Pellerin, B.A., B.D. Bergamaschi, J.F. Downing, and J.A. Saraceno,2013. Optical Techniques for the Determination of Nitrate inEnvironmental Waters: Guidelines for Instrument Selection,Operation, Deployment, Maintenance, Quality Assurance, andData Reporting: U.S. Geological Survey Techniques and Meth-ods 1-D5, 37 pp.
Pellerin, B.A., B.D. Downing, C. Kendall, R.A. Dahlgren, T.E.C.Kraus, R.G. Spencer, and B.A. Bergamaschi, 2009. Assessing theSources and Magnitude of Diurnal Nitrate Variability in the SanJoaquin River (California) with an In-Situ Optical Nitrate Sen-sor and Dual Nitrate Isotopes. Freshwater Biology 54:376-387.
Pellerin, B.A., J. Saraceno, J.B. Shanley, S.D. Sebestyn, G.R. Aiken,W.M. Wollheim, and B.A. Bergamaschi, 2012. Taking the Pulseof Snowmelt: In Situ Sensors Reveal Seasonal, Event and Diur-nal Patterns of Nitrate and Dissolved Organic Matter Variabilityin an Upland Forest Stream. Biogeochemistry 108:183-198.
Porter, J.H., P.C. Hanson, and C.-C. Lin, 2012. Staying Afloat inthe Sensor Data Deluge. Trends in Ecology and Evolution 27(2):121-129.
Powell, T.M., 1995. Physical and Biological Scales of Variability inLakes, Estuaries, and the Coastal Ocean. In: Ecological TimeSeries, T. Powell and J. Steele (Editors). Springer, Dordrecht,The Netherlands, pp. 119-138.
Richardson, K. and B.B. Jørgensen, 2013. Eutrophication: Defini-tion, History and Effects. In: Eutrophication in Coastal MarineEcosystems, B.B. Jørgensen and K. Richardson (Editors). Ameri-can Geophysical Union, Washington, D.C., DOI: 10.1029/CE052p0001.
Runkel, R.L., C.G. Crawford, and T.A. Cohn, 2004. Load Estimator(LOADEST): A FORTRAN Program for Estimating ConstituentLoads in Streams and Rivers. US Geological Survey Techniquesand Methods Report 4-A5.
Sanford, W.E., D.L. Nelms, J.P. Pope, and D.L. Selnick, 2012.Quantifying Components of the Hydrologic Cycle in VirginiaUsing Chemical Hydrograph Separation and Multiple Regres-sion Analysis. U.S. Geological Survey Scientific InvestigationsReport 2011-5198, 152 pp.
Selman, M., S. Greenhalgh, E. Branosky, C. Jones, and J. Guiling,2009. Water Quality Trading Programs: An International Over-view. WRI Issue Brief, Vol. 1. World Resources Institute, Wash-ington, D.C., pp. 1-16.
Sharpley, A.N., T. Daniel, G. Gibson, L. Bundy, M. Cabrera, T.Sims, R. Stevens, J. Lemunyon, P. Kleinman, and R. Parry,2006. Best Management Practices to Minimize AgriculturalPhosphorus Impacts on Water Quality. U.S. Department ofAgriculture, Agricultural Research Service, ARS-163, 50 pp.
Sherson, L.R., D.J. Van Horn, J.D. Gomez-Velez, L.J. Crossey, andC.N. Dahm, 2015. Nutrient Dynamics in an Alpine HeadwaterStream: Use of Continuous Water Quality Sensors to ExamineResponses to Wildfire and Precipitation Events. HydrologicalProcesses 29:3193-3207, DOI: 10.1002/hyp.10426.
Smith, V.H., S.B. Joye, and R.W. Howarth, 2006. Eutrophication ofFreshwater and Marine Ecosystems. Limnology and Oceanogra-phy 51(1, part 2):351-355.
Snyder, L. and W.B. Bowden, 2014. Nutrient Dynamics in an Olig-otrophic Arctic Stream Monitored In Situ by Wet ChemistryMethods. Water Resources Research 50(3):2039-2049.
Sobota, D.J., J.E. Compton, M.L. McCrackin, and S. Singh, 2015.Cost of Reactive Nitrogen Release from Human Activities to theEnvironment in the United States. Environmental ResearchLetters 10:025006, DOI: 10.1088/1748-9326/10/2/025006.
State-EPA Nutrient Innovations Task Group, 2009. An UrgentCall to Action: Report of the State-EPA Nutrient InnovationsTask Group. http://water.epa.gov/scitech/swguidance/standards/criteria/nutrients/upload/2009_08_27_criteria_nutrient_nitgreport.pdf, accessed May 2015.
Stauffer, B.A., C.J. Patrick, K.L. Robinson, and H. Peter, 2014. Tem-poral Scales of Drivers of Community Dynamics: FromMicrobes toMacrofauna across the Salinity Gradient. In: Eco-DAS X Sympo-siumProceedings, P.F. Kemp (Editor). Association for the Sciencesof Limnology andOceanography,Waco, Texas, pp. 14-24.
Stenback, G.A., W.G. Crumpton, K.E. Schilling, and M.J. Helmers,2011. Rating Curve Estimation of Nutrient Loads in Iowa River.Journal of Hydrology 396:158-169.
Terrio, P.J. and M.M. Straub, 2015. Continuous Monitoring of Sedi-ment and Nutrients in the Illinois River at Florence, Illinois,2012-2013. U.S. Geological Survey Scientific InvestigationsReport 2015-5040, 61 pp.
Townsend, A.R., R.W. Howarth, F.A. Bazzaz, M.S. Booth, C.C.Cleveland, S.K. Collinge, A.P. Dobson, P.R. Epstein, E.A. Hol-land, D.R. Keeney, M.A. Mallin, C.A. Rogers, P. Wayne, and A.H.Wolfe, 2003. Human Health Effects of a Changing Global Nitro-gen Cycle: Frontiers. Ecology and Environment 1(5):240-246.
Turner, R.E., N.N. Rabalais, and D. Justic, 2006. Predicting Sum-mer Hypoxia in the Northern Gulf of Mexico: Riverine N, P andSi Loading. Marine Pollution Bulletin 52:139-148.
U.S. Commission on Ocean Policy, 2004. An Ocean Blueprint forthe 21st Century. Final Report. Washington, D.C., ISBN 0-9759462-0-X.
U.S. Environmental Protection Agency, 2005. Factoids: DrinkingWater and Ground Water Statistics for 2004, EPA 816-K-05-001.U.S. Environmental Protection Agency, Washington, D.C., 15 pp.
Wild-Allen, K. and M. Rayner, 2014. Continuous Nutrient Observa-tions Capture Fine-Scale Estuarine Variability Simulated by a3D Biogeochemical Model. Marine Chemistry 167:135-149.
Woodward, R.T. and R.A. Kaiser, 2002. Market Structures for U.S.Water Quality Trading. Review of Agricultural Economics24(2):366-383.
JAWRA JOURNAL OF THE AMERICAN WATER RESOURCES ASSOCIATION1008
PELLERIN, STAUFFER, YOUNG, SULLIVAN, BRICKER, WALBRIDGE, CLYDE, AND SHAW