emerging strategies in optimizing nutrition therapy … · emerging strategies in optimizing...
TRANSCRIPT
Emerging Strategies in
Optimizing Nutrition Therapy
Delivery
Rupinder Dhaliwal, RD
Executive Director
Nutrition & Rehabilitation Investigators
Consortium
Clinical Evaluation Research Unit
Queen’s University, Kingston, Canada

Disclosures
I have received speaker honoraria and/or I have been
paid from grants from the following companies:
– Nestlé (including this session)
– Fresenius Kabi
– Baxter
– Abbott
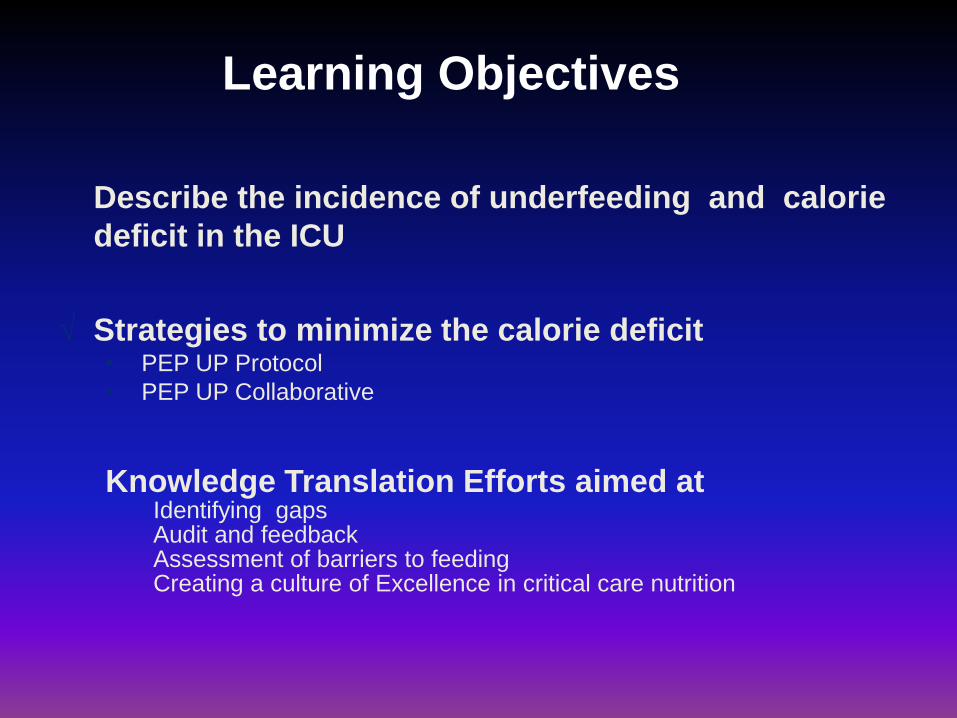
Learning Objectives
Describe the incidence of underfeeding and calorie
deficit in the ICU
√ Strategies to minimize the calorie deficit • PEP UP Protocol
• PEP UP Collaborative
Knowledge Translation Efforts aimed at
Identifying gaps Audit and feedback Assessment of barriers to feeding Creating a culture of Excellence in critical care nutrition
0
20
40
60
80
100
120
1 2 3 4 5 6 7 8 9 10 11 12
% r
eceiv
ed
/pre
scri
bed
ICU Day
Mean of All Sites Best Performing Site Worst Performing Site
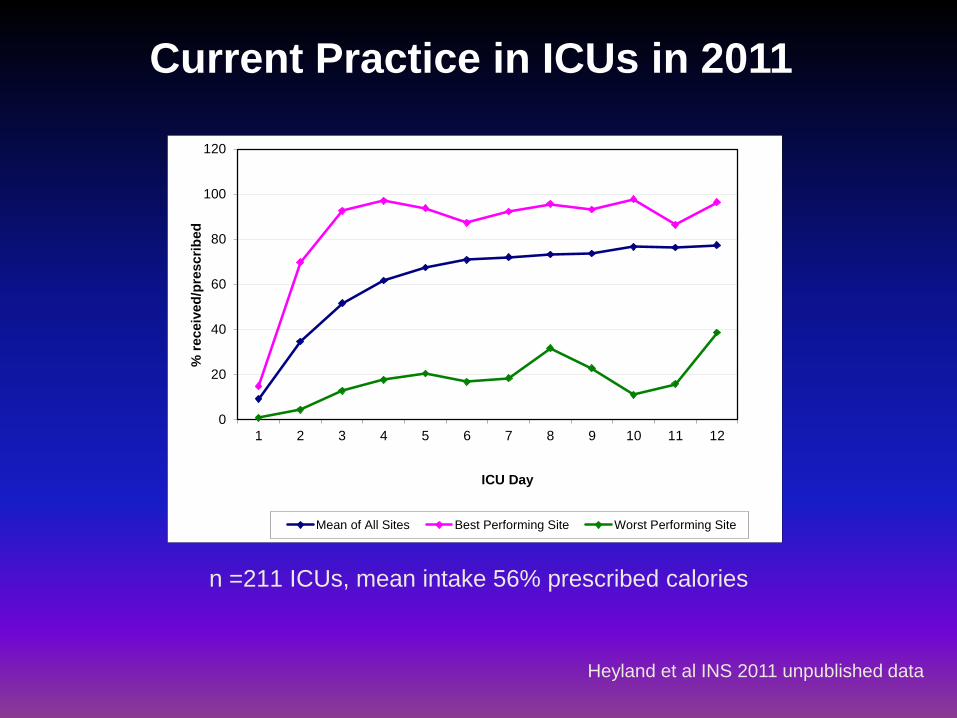
Current Practice in ICUs in 2011
n =211 ICUs, mean intake 56% prescribed calories
Heyland et al INS 2011 unpublished data

Optimal Amount of Calories for Critically Ill Patients: Depends on how you slice the cake!
Heyland DK, et al. Crit Care Med. 2011;39(12):2619-26.
Optimal
amount =
80-85%
Association Between 12-day Caloric Adequacy
and 60-day Hospital Mortality

Failure Rate
Heyland et al Unpublished observations
Results of 2011 International Nutrition Survey (INS)
% high risk patients who failed to meet minimal
quality targets (80% overall energy adequacy)
75.6 78.1
91.2
75.1
87.0
69.8
79.9

In patients with high gastric residual volumes:
use of motility agents 58.7% (site average range: 0-100%)
use of small bowel feeding 14.7% (range: 0-100%)
CCM 2010

A shift in the feeding paradigm is needed!
Can we do better?
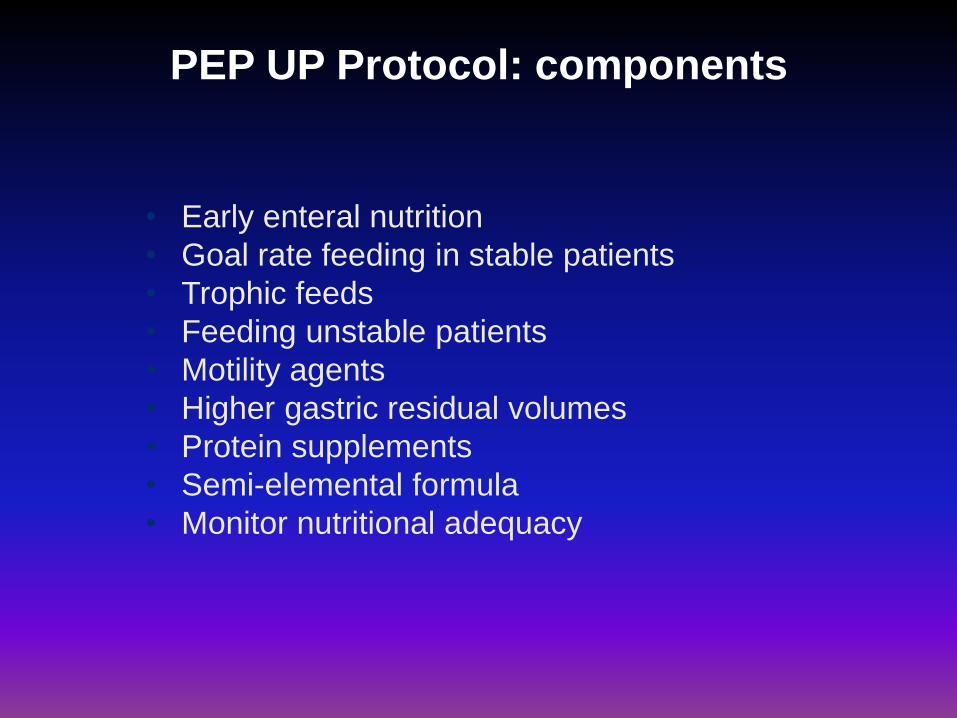
PEP UP Protocol: components
• Early enteral nutrition
• Goal rate feeding in stable patients
• Trophic feeds
• Feeding unstable patients
• Motility agents
• Higher gastric residual volumes
• Protein supplements
• Semi-elemental formula
• Monitor nutritional adequacy
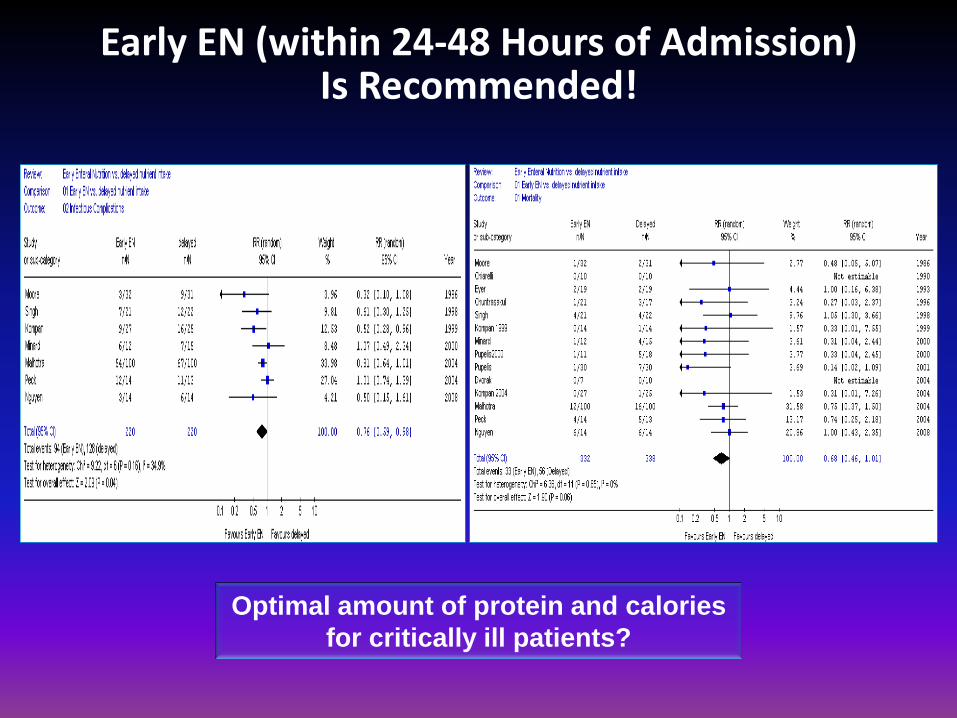
Early EN (within 24-48 Hours of Admission) Is Recommended!
Optimal amount of protein and calories
for critically ill patients?

Initial Efficacy and Tolerability of Early EN with Immediate or Gradual Introduction in Intubated Patients
Desachy A, et al. Intensive Care Med. 2008;34(6):1054-9.
N = 100 pts
mechanically ventilated pts
(not in shock) to immediate
goal rate vs gradual ramp up

“Trophic Feeds”
Progressive atrophy of villous height
and crypt depth in absence of EN
Leads to increased permeability
and decreased IgA** secretion
Can be preserved by a minimum
of 10-15% of goal calories
Observational study of 66 critically
ill patients suggests TPN† + trophic
feeds associated with reduced
infection and mortality compared
to TPN alone1
A = No EN; B = 100% EN
1Marik. Crit Care & Shock. 2002;5:1-10;
Ohta K, et al. Am J Surg. 2003;185(1):79-85.

Rice TW, et al. JAMA. 2012;307(8):795-803.
Initial Tropic vs. Full EN in Patients with Acute Lung Injury
The EDEN randomized trial

Trophic vs. Full EN in Critically Ill Patients with Acute Respiratory Failure
Despite no differences in
clinical outcomes……….
“Survivors who received initial
full-energy EN were more likely
to be discharged home with or
without help as compared to a
rehabilitation facility (68.3% for
the full-energy group vs. 51.3%
for the trophic group; p = .04).”
Rice TW, et al. Crit Care Med. 2011;39(5):967-74.
The EDEN randomized trial

What about feeding the hypotensive patient?
Resuscitation is the priority
No sense in feeding someone dying of
progressive circulatory failure
However, if resuscitated yet remaining
on vasopressors:
Safety and efficacy of EN??

Feeding the hypotensive patient?
Khalid I, et al. Am J Crit Care. 2010;19(3):261-8.
Prospectively collected multi-institutional ICU database of 1,174 patients who required mechanical
ventilation for more than two days and were on vasopressor agents to support blood pressure.
The beneficial
effect of early
feeding is more
evident in
the sickest
patients, i.e., those
on multiple
vasopressor
agents

Pro-motility Agents
“Based on 1 level 1 study and 5 level 2 studies,
in critically ill patients who experience feed
intolerance (high gastric residuals, emesis),
we recommend the use of a pro-motility agent”.
Conclusion:
1) Motility agents have no effect on mortality or
infectious complications in critically ill patients
2) Motility agents may be associated with an increase
in gastric emptying, a reduction in feeding intolerance
and a greater caloric intake in critically ill patients
2013 Canadian CPGs
www.criticalcarenutrition.com

It’s Not Just About Calories...
So in order to minimize this, we order: Protein supplement Beneprotein® 14 grams mixed
in 120 mls sterile water administered BID via NG
Loss of lean muscle mass
Inadequate protein intake
Immune dysfunction
Weak prolonged
mechanical ventilation
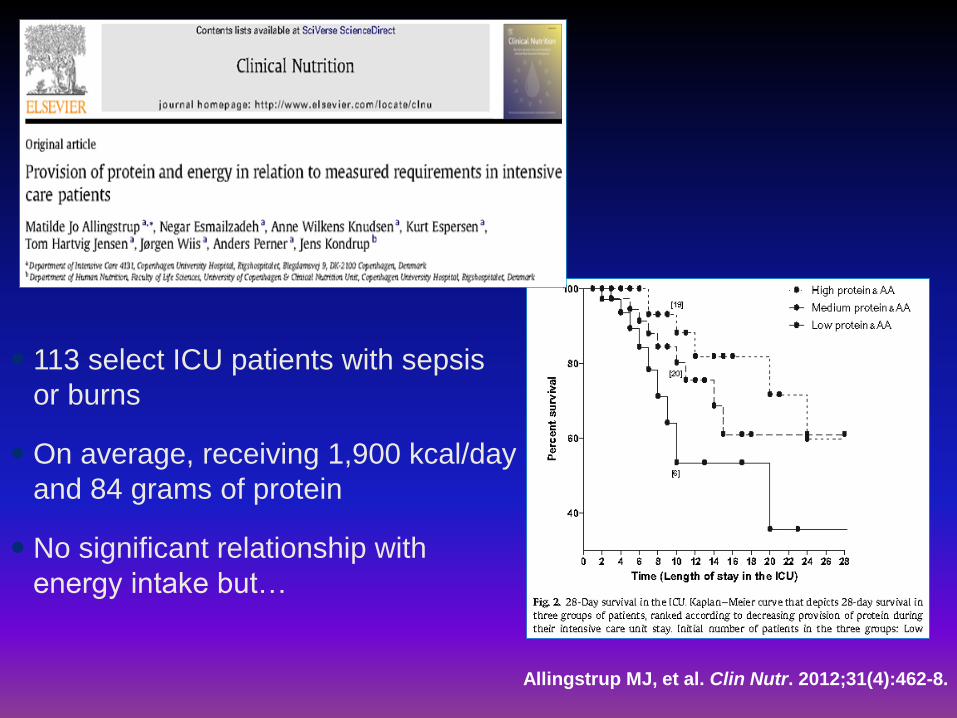
113 select ICU patients with sepsis
or burns
On average, receiving 1,900 kcal/day
and 84 grams of protein
No significant relationship with
energy intake but…
Allingstrup MJ, et al. Clin Nutr. 2012;31(4):462-8.

Begin 24 hour volume-based feeds. After initial tube placement confirmed, start Peptamen® 1.5.
Total volume to receive in 24 hours =<write in 24 target volume>. Determine initial rate as per
Volume Based Feeding Schedule. Monitor gastric residual volumes as per Adult Gastric Flow Chart
and Volume Based Feeding Schedule.
OR
Begin Peptamen® 1.5 at 10 ml/h after initial tube placement confirmed. Reassess ability to
transition to 24 hour volume-based feeds next day. {Intended for patient who is hemodynamically
unstable (on high dose or escalating doses of vasopressors, or inadequately resuscitated) or
not suitable for high volume EN (ruptured AAA, upper intestinal anastomosis, or impending
intubation)}
OR
NPO. Please write in reason: __________________ ______. (only if contraindication to EN
present: bowel perforation, bowel obstruction, proximal high output fistula. Recent operation and
high NG* output not a contraindication to EN.) Reassess ability to transition to 24 hour volume-
based feeds next day.
Stable patients should be
able to tolerate goal rate We use a concentrated
solution to maximize
calories per ml
Doctors need to justify
why they are keeping
patients NPO
If unstable or unsuitable,
just use trophic feeds
We want to minimize the use
of NPO but if selected, need
to reassess next day
The PEP uP Protocol
Note, there are only
a few absolute
contraindications to EN
Note indications
for trophic feeds
Single centre pilot study Heyland DK, et al. Crit Care 2010. 2010;14(2):R78
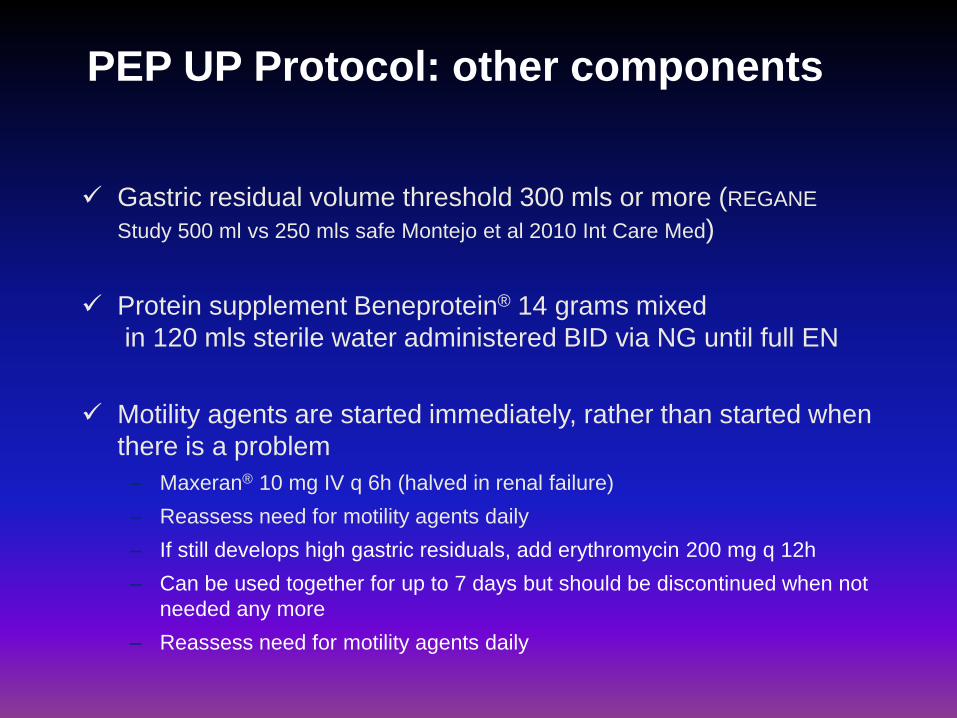
PEP UP Protocol: other components
Gastric residual volume threshold 300 mls or more (REGANE
Study 500 ml vs 250 mls safe Montejo et al 2010 Int Care Med)
Protein supplement Beneprotein® 14 grams mixed
in 120 mls sterile water administered BID via NG until full EN
Motility agents are started immediately, rather than started when
there is a problem
– Maxeran® 10 mg IV q 6h (halved in renal failure)
– Reassess need for motility agents daily
– If still develops high gastric residuals, add erythromycin 200 mg q 12h
– Can be used together for up to 7 days but should be discontinued when not
needed any more
– Reassess need for motility agents daily
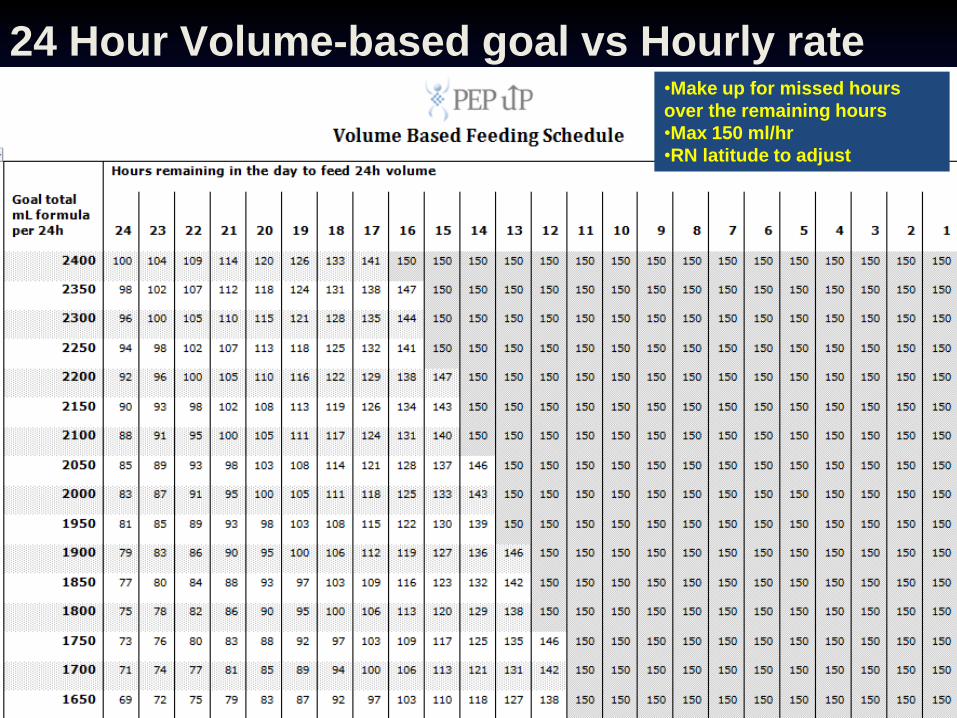
24 Hour Volume-based goal vs Hourly rate •Make up for missed hours
over the remaining hours
•Max 150 ml/hr
•RN latitude to adjust

A Change to Nursing Report
Adequacy of nutrition support
=
24 hour volume of EN received
Volume prescribed to meet caloric
requirements in 24 hours
Please report
this % on
rounds as part
of the GI
systems report

Efficacy of Enhanced Protein-Energy Provision via the Enteral Route in
Critically Ill Patients: The PEP uP Protocol
A multi-center cluster randomized trial
Heyland et al 2013 CCMed (in press)

Research Questions
What is the effect of the new innovative feeding protocol, (PEP
uP protocol), combined with a nursing educational intervention
on EN intake compared to usual care?
What is the safety, feasibility and acceptability of the new PEP
uP protocol?
Hypothesis: this aggressive feeding protocol combined
with a nurse-directed nutrition educational intervention will be
safe, acceptable, and effectively increase protein and energy
delivery to critically ill patients.
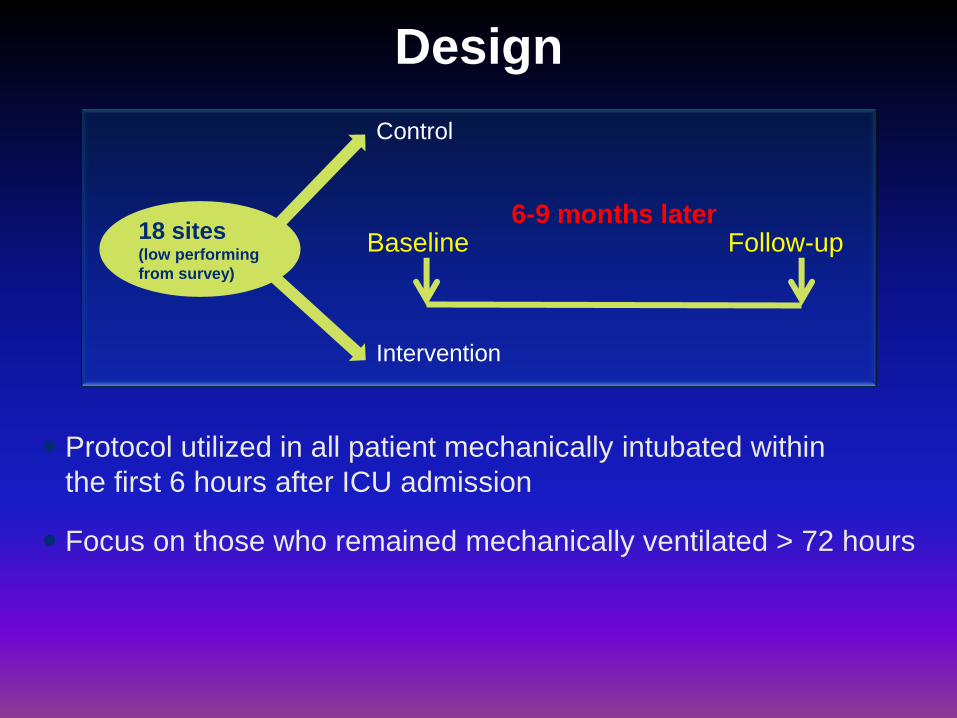
Design
Protocol utilized in all patient mechanically intubated within
the first 6 hours after ICU admission
Focus on those who remained mechanically ventilated > 72 hours
18 sites (low performing
from survey)
Control
Intervention
Baseline Follow-up 6-9 months later

Bedside Written Materials Description
EN initiation orders Physician standardized order sheet for starting EN.
Gastric feeding flow chart Flow diagram illustrating the procedure for management of gastric
residual volumes.
Volume-based feeding schedule Table for determining goal rates of EN based on the 24 hour goal
volume.
Daily monitoring checklist Excel spreadsheet used to monitor the progress of EN.
Materials to Increase Knowledge and Awareness
Study information sheets
Information about the study rationale and guidelines for implementation
of the PEP uP protocol. Three versions of the sheets were developed
targeted at nurses, physicians, and patients’ family, respectively.
PowerPoint presentations
Information about the study rationale and how to implement the PEP
uP protocol. A long (30-40 minute) and short (10-15 minute) version
were available.
Self-learning module Information about the PEP uP protocol and case example to work
through independently.
Posters A variety of posters were available to hang in the ICU during the study.
Frequently Asked Questions (FAQ) document Document addresses common questions about the PEP uP Protocol.
Electronic reminder messages Animated reminder messages about key elements of the PEP uP
protocol to be displayed on a monitor in the ICU.
Monthly newsletters Monthly circular with updates about the study.
Tools to Operationalize the PEP uP Protocol
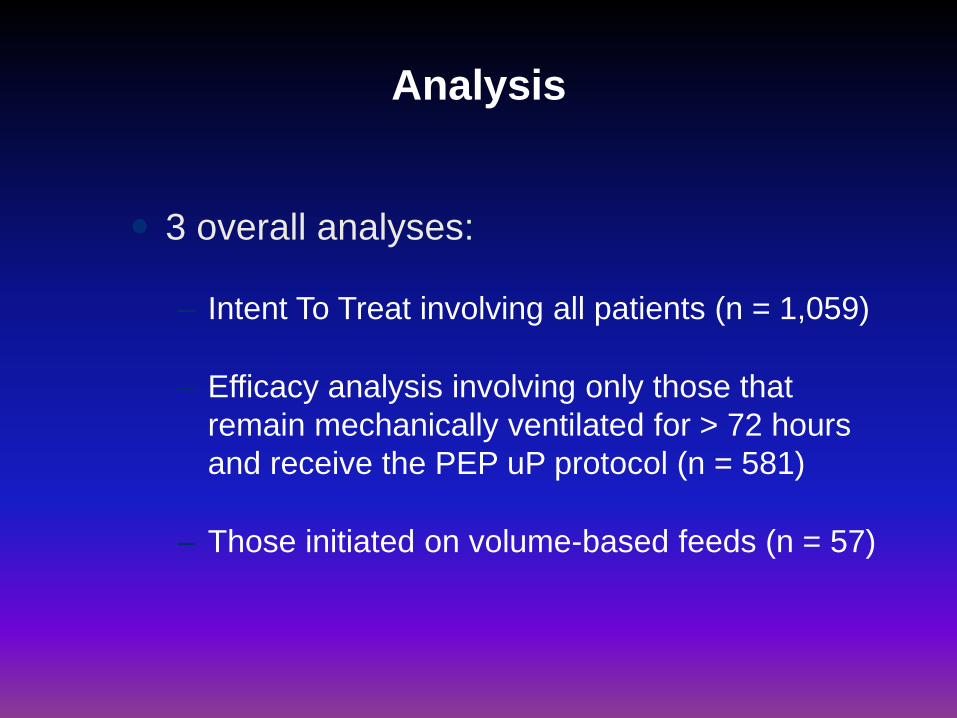
Analysis
3 overall analyses:
– Intent To Treat involving all patients (n = 1,059)
– Efficacy analysis involving only those that
remain mechanically ventilated for > 72 hours
and receive the PEP uP protocol (n = 581)
– Those initiated on volume-based feeds (n = 57)
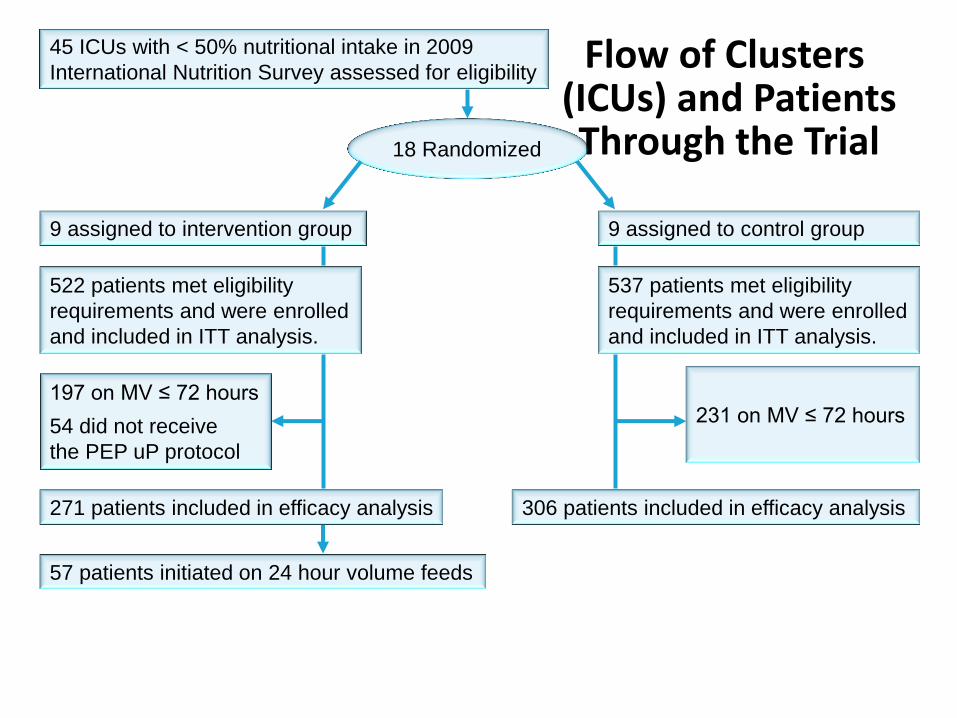
Flow of Clusters (ICUs) and Patients Through the Trial
45 ICUs with < 50% nutritional intake in 2009
International Nutrition Survey assessed for eligibility
18 Randomized
9 assigned to intervention group 9 assigned to control group
522 patients met eligibility
requirements and were enrolled
and included in ITT analysis.
537 patients met eligibility
requirements and were enrolled
and included in ITT analysis.
306 patients included in efficacy analysis
231 on MV ≤ 72 hours 197 on MV ≤ 72 hours
54 did not receive
the PEP uP protocol
271 patients included in efficacy analysis
57 patients initiated on 24 hour volume feeds

Participating Sites
Intervention (n = 9) Control (n = 9) p-values
Hospital type
Teaching
Non-teaching
4 (44.4%)
5 (55.6%)
4 (44.4%)
5 (55.6%)
1.00
Size of hospital (beds)
Mean (range)
396.9 (139.0, 720.0)
448.7 (99.0, 1000.0)
0.97
ICU structure
Open
Closed
3 (33.3%)
6 (66.7%)
4 (44.4%)
5 (55.6%)
1.00
Case type
Medical
Neurological
Surgical
Neurosurgical
Trauma
Cardiac surgery
Burns
Other
9 (40.9%)
3 (13.6%)
5 (22.7%)
2 (9.1%)
1 (4.5%)
0 (0.0%)
1 (4.5%)
1 (4.5%)
9 (36.0%)
2 (8.0%)
8 (32.0%)
2 (8.0%)
2 (8.0%)
1 (4.0%)
1 (4.0%)
0 (0.0%)
0.97
Size of ICU (beds)
Mean (range)
12.6 (7.0, 20.0)
16.3 (8.0,25.0)
0.12
Full time equivalent dietician (per 10 beds)
Mean (range)
0.5 (0.3, 0.9)
0.4 (0.0, 0.6)
0.76
Regions
Canada
USA
4 (44.4%)
5 (55.6%)
5 (55.6%)
4 (44.4%)
1.00

Intervention Control
Baseline Follow-up Baseline Follow-up p-value
n 270 252 270 267
Age Mean ± SD
65.1 ± 15.5
64.1 ± 16.7
63.4 ± 15.1
61.4 ± 16.2
0.45
Sex Male (%)
157 (58.1%)
137 (54.4%)
170 (63.0%)
173 (64.8%)
0.56
Admission category Medical
Elective surgery Emergent surgery
230 (85.2%)
14 (5.2%) 26 (9.6%)
222 (88.1%) 12 (4.8%) 18 (7.1%)
213 (78.9%) 23 (8.5%)
34 (12.6%)
212 (79.4%) 23 (8.6%) 30 (11.2%)
0.24
Admission diagnosis Cardiovascular/vascular
Respiratory Gastrointestinal
Neurologic Sepsis
Trauma Metabolic
Hematologic Other non-operative conditions
Renal-operative Gynecologic-operative
Orthopedic-operative Other operative conditions
40 (14.8%) 110 (40.7%) 35 (13.0%) 19 (7.0%)
37 (13.7%) 0 (0.0%) 11 (4.1%) 1 (0.4%) 7 (2.6%) 2 (0.7%) 1 (0.4%) 1 (0.4%) 6 (2.2%)
43 (17.1%) 112 (44.4%) 19 (7.5%) 19 (7.5%) 20 (7.9%) 2 (0.8%)
15 (6.0%) 0 (0.0%)
15 (6.0%) 0 (0.0%) 0 (0.0%) 1 (0.4%) 6 (2.4%)
31 (11.5%) 78 (28.9%) 29 (10.7%) 30 (11.1%) 57 (21.1%) 17 (6.3%) 13 (4.8%) 0 (0.0%) 5 (1.9%) 0 (0.0%) 0 (0.0%) 1 (0.4%) 9 (3.3%)
51 (19.1%) 81 (30.3%) 29 (10.9%) 28 (10.5%) 25 (9.4%) 18 (6.7%) 6 ( 2.2%) 1 (0.4%) 7 (2.6%) 3 (1.1%) 1 (0.4%) 3 (1.1%)
12 (4.5%)
un defined
APACHE II score Mean ± SD
23.0 ± 7.2
23.5 ± 7.1
21.1 ± 7.3
21.1 ± 7.3
0.53
Patient Characteristics (n = 1,059)
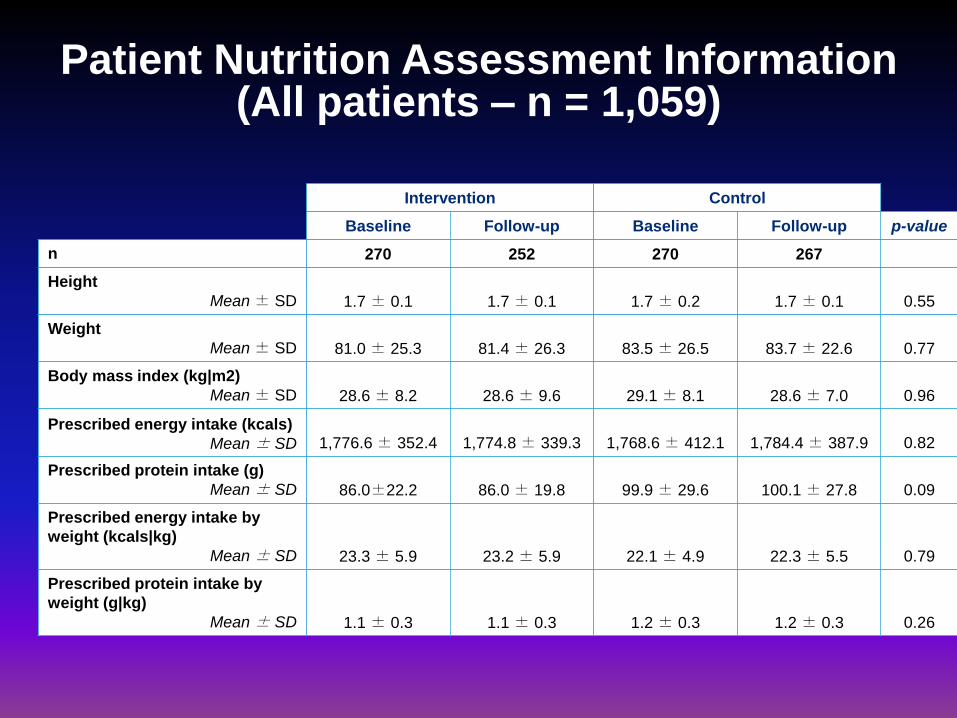
Patient Nutrition Assessment Information (All patients – n = 1,059)
Intervention Control
Baseline Follow-up Baseline Follow-up p-value
n 270 252 270 267
Height
Mean ± SD
1.7 ± 0.1
1.7 ± 0.1
1.7 ± 0.2
1.7 ± 0.1
0.55
Weight
Mean ± SD
81.0 ± 25.3
81.4 ± 26.3
83.5 ± 26.5
83.7 ± 22.6
0.77
Body mass index (kg|m2)
Mean ± SD
28.6 ± 8.2
28.6 ± 9.6
29.1 ± 8.1
28.6 ± 7.0
0.96
Prescribed energy intake (kcals)
Mean ± SD
1,776.6 ± 352.4
1,774.8 ± 339.3
1,768.6 ± 412.1
1,784.4 ± 387.9
0.82
Prescribed protein intake (g)
Mean ± SD
86.0±22.2
86.0 ± 19.8
99.9 ± 29.6
100.1 ± 27.8
0.09
Prescribed energy intake by
weight (kcals|kg)
Mean ± SD
23.3 ± 5.9
23.2 ± 5.9
22.1 ± 4.9
22.3 ± 5.5
0.79
Prescribed protein intake by
weight (g|kg)
Mean ± SD
1.1 ± 0.3
1.1 ± 0.3
1.2 ± 0.3
1.2 ± 0.3
0.26

Clinical Outcomes (All patients – n = 1,059)
Intervention Control p-value
Baseline Follow-up Baseline Follow-up
Length of ICU stay
(days)*
Median
(IQR†)
6.1
(3.4,11.1)
7.2
(3.4,11.1)
6.4
(3.3,12.6)
5.7
(2.8,11.8) 0.35
Length of hospital
stay (days)*
Median
(IQR)
14.2
(8.1,29.8)
13.5
(8.1,28.4)
16.7
(7.5,27.7)
13.8
(7.1,26.6) 0.73
Length of
mechanical
ventilation (days)*
Median
(IQR)
3.7
(1.6,9.1)
4.3
(1.3,9.9)
3.1
(1.4,8.4)
3
(1.4,7.3) 0.57
Patient died within
60 days of
ICU admission
Yes 70
(25.9%)
68
(27.0%)
65
(24.1%)
63
(23.6%) 0.53
* Based on 60-day survivors only. Time before ICU admission is not counted.
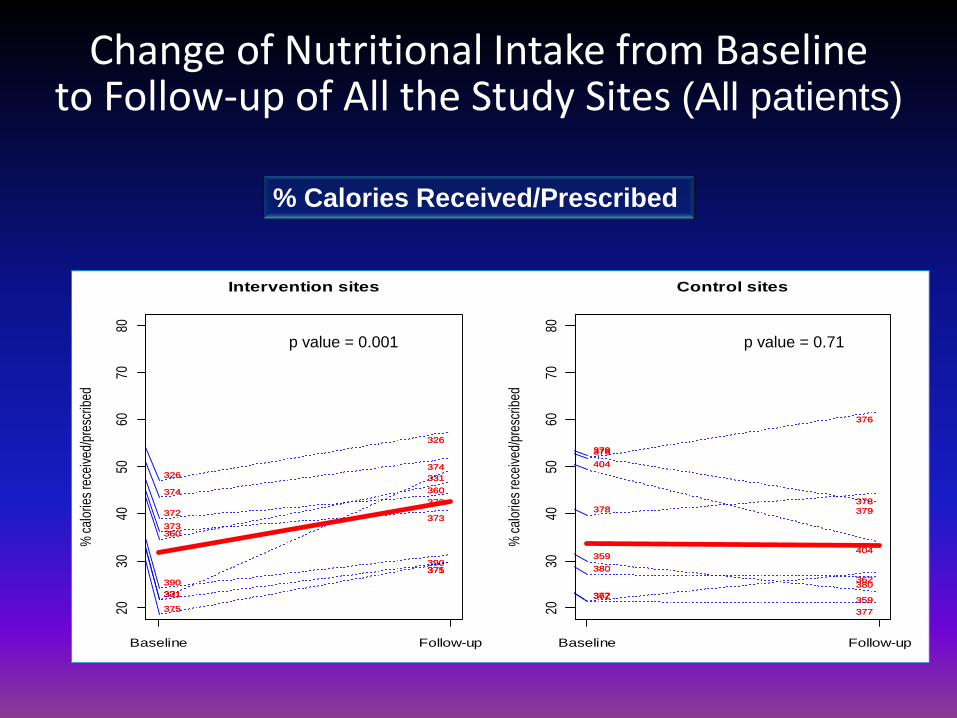
Change of Nutritional Intake from Baseline to Follow-up of All the Study Sites (All patients)
% Calories Received/Prescribed
% c
alor
ies
rece
ived
/pre
scrib
ed
326326
326326
331331
331331
360360
360360
371371
371371
372372
372372
373373373373
374374
374374
375375
375375
390390
390390
Baseline Follow-up
2030
4050
6070
80
p value <0.0001
Intervention sites
% c
alor
ies
rece
ived
/pre
scrib
ed
p value=0.65
327327 327327
p value=0.65p value=0.65
359359
359359
p value=0.65p value=0.65
362362
362362
p value=0.65p value=0.65p value=0.65p value=0.65p value=0.65p value=0.65
376376
376376
p value=0.65
377377
377377
p value=0.65
378378378378
p value=0.65
379379
379379
p value=0.65
380380
380380
p value=0.65p value=0.65
404404
404404
p value=0.65p value=0.65
Baseline Follow-up
2030
4050
6070
80
Control sites
p value = 0.001 p value = 0.71

% p
rote
in re
ceiv
ed/p
resc
ribed
326326
326326
331331
331331
360360
360360
371371
371371
372372
372372
373373 373373
374374
374374
375375
375375390390
390390
Baseline Follow-up
2030
4050
6070
80
p value <0.0001
Intervention sites
% p
rote
in re
ceiv
ed/p
resc
ribed
p value=0.78
327327327327
p value=0.78p value=0.78
359359
359359
p value=0.78p value=0.78
362362362362
p value=0.78p value=0.78p value=0.78p value=0.78p value=0.78p value=0.78
376376
376376
p value=0.78
377377
377377
p value=0.78
378378
378378
p value=0.78
379379
379379
p value=0.78
380380
380380
p value=0.78p value=0.78
404404
404404
p value=0.78p value=0.78
Baseline Follow-up
2030
4050
6070
80
Control sites
% Protein Received/Prescribed
Change of Nutritional Intake from Baseline to Follow-up of All the Study Sites (All patients)
p value = 0.005 p value = 0.81
ICU Day
% c
alor
ies
rece
ived
/pre
scrib
ed
1 2 3 4 5 6 7 8 9 10 12
010
2030
4050
6070
8090
100
n ITT
n Efficacy
n FVF
243
11357
219
11357
194
11357
171
10854
153
10552
138
9646
118
8340
107
7535
83
5926
76
5223
59
4017
52
3514
ITT
Efficacy
Full volume feeds
ICU Day
% p
rote
in re
ceiv
ed/p
resc
ribed
1 2 3 4 5 6 7 8 9 10 12
010
2030
4050
6070
8090
100
n ITT
n Efficacy
n FVF
243
11357
219
11357
194
11357
171
10854
153
10552
138
9646
118
8340
107
7535
83
5926
76
5223
59
4017
52
3514
ITT
Efficacy
Full volume feeds
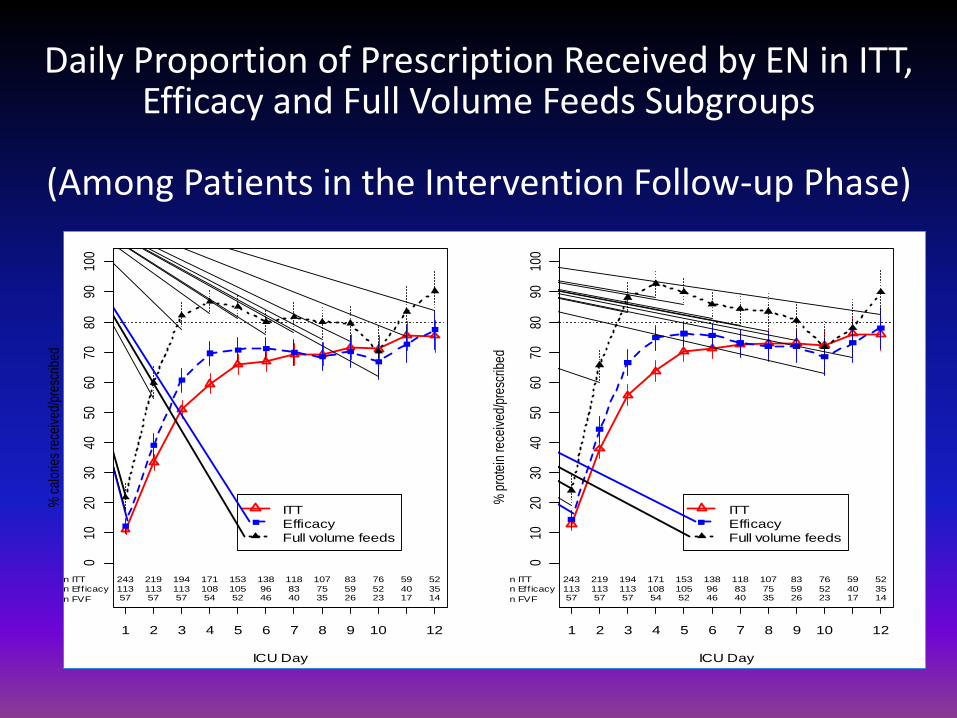
Daily Proportion of Prescription Received by EN in ITT, Efficacy and Full Volume Feeds Subgroups
(Among Patients in the Intervention Follow-up Phase)

Compliance with PEP uP Protocol Components (All patients n = 1,059)
0
10
20
30
40
50
60
70
80
90
100
SupplementalProtein (ever)
SupplementalProtein
(first 48hrs)
Motility Agents(ever)
Motility Agents(first 48hrs)
Peptamen 1.5
Intervention - Baseline Intervention - Follow-up
Control - Baseline Control - Follow-up
Perc
en
t
Difference in Intervention baseline vs. follow up and vs. control all <0.05

-1
1
3
5
7
9
11
13
15
Vomiting Regurgitation Macro Aspiration Pneumonia
Intervention - Baseline Intervention - Follow-up
Control - Baseline Control - Follow-up
Complications (All patients – n = 1,059)
p > 0.05
Perc
en
t
Vomiting Regurgitation Macro Aspiration Pneumonia
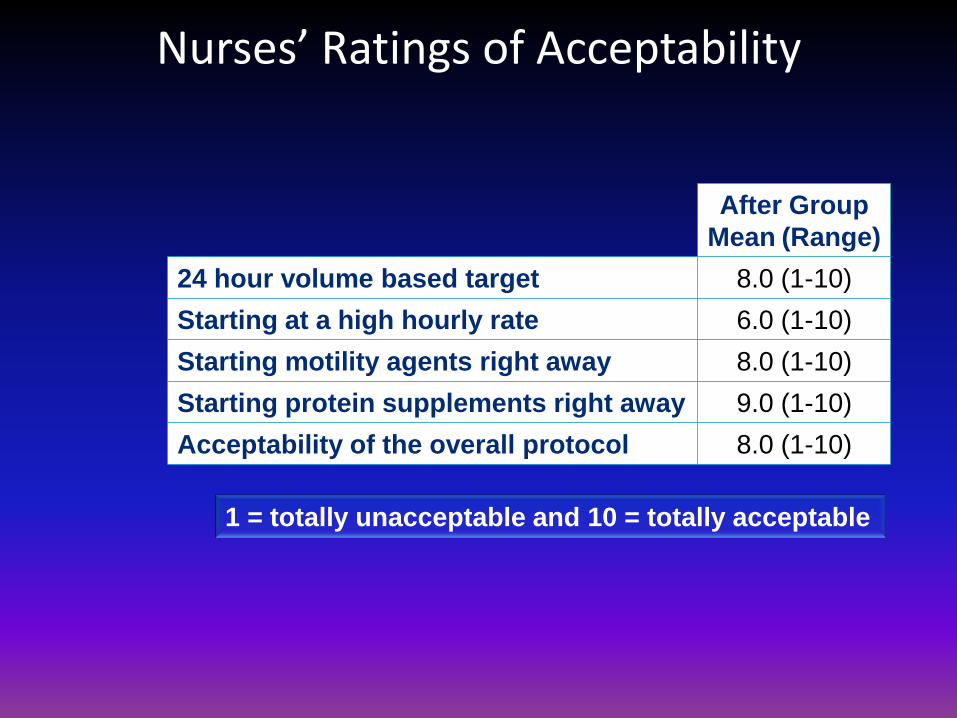
Nurses’ Ratings of Acceptability
After Group
Mean (Range)
24 hour volume based target 8.0 (1-10)
Starting at a high hourly rate 6.0 (1-10)
Starting motility agents right away 8.0 (1-10)
Starting protein supplements right away 9.0 (1-10)
Acceptability of the overall protocol 8.0 (1-10)
1 = totally unacceptable and 10 = totally acceptable

Overall, how acceptable is this new PEP uP feeding protocol to you?
Need more instructions to include all staff members
Too much confusion over what protocol was
supposed to be
May need a few adjustments however I think its
overall acceptable
Good if everyone knows how to do it
Initial starting dose is too high
Maybe we needed more awareness by the MDs

Barriers to Implementation
Difficulties embed into Electronic record
Non-comprehensive dissemination
of educational tools
Involvement of nurse educator
(nurses owned it)
Ongoing bedside encouragement
and coaching by site dietitian
Facilitators to Implementation
PEP uP Trial Conclusion
Statistically significant improvements in
nutritional intake
– Suboptimal effect related to suboptimal implementation
Safe
Acceptable
Merits further use
Can successfully be implemented in a broad
range of ICUs in North America

Learning from the Trial : Next Steps Change PEP uP protocol first day
order to simplify (25 ml/hr for day 1)
Improve documentation of protein
supplements (add to MAR!)
Develop PEP uP collaborative
(community of practice) • PEP uP demonstration sites
• Revise and disseminate tools
Audit practice again in May 2015
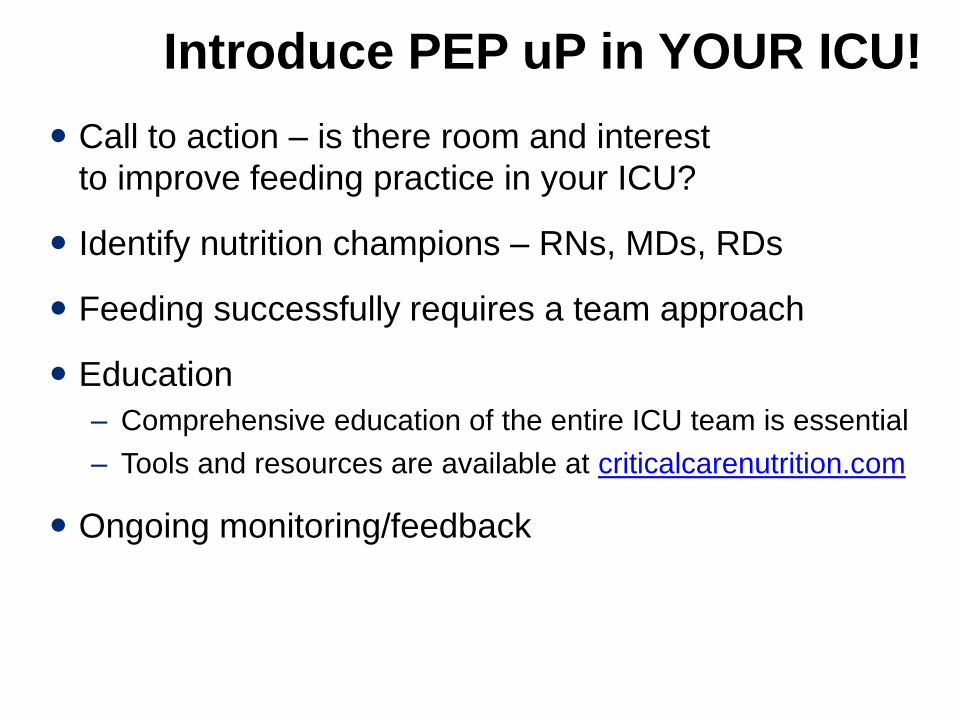
Call to action – is there room and interest
to improve feeding practice in your ICU?
Identify nutrition champions – RNs, MDs, RDs
Feeding successfully requires a team approach
Education
– Comprehensive education of the entire ICU team is essential
– Tools and resources are available at criticalcarenutrition.com
Ongoing monitoring/feedback
Introduce PEP uP in YOUR ICU!

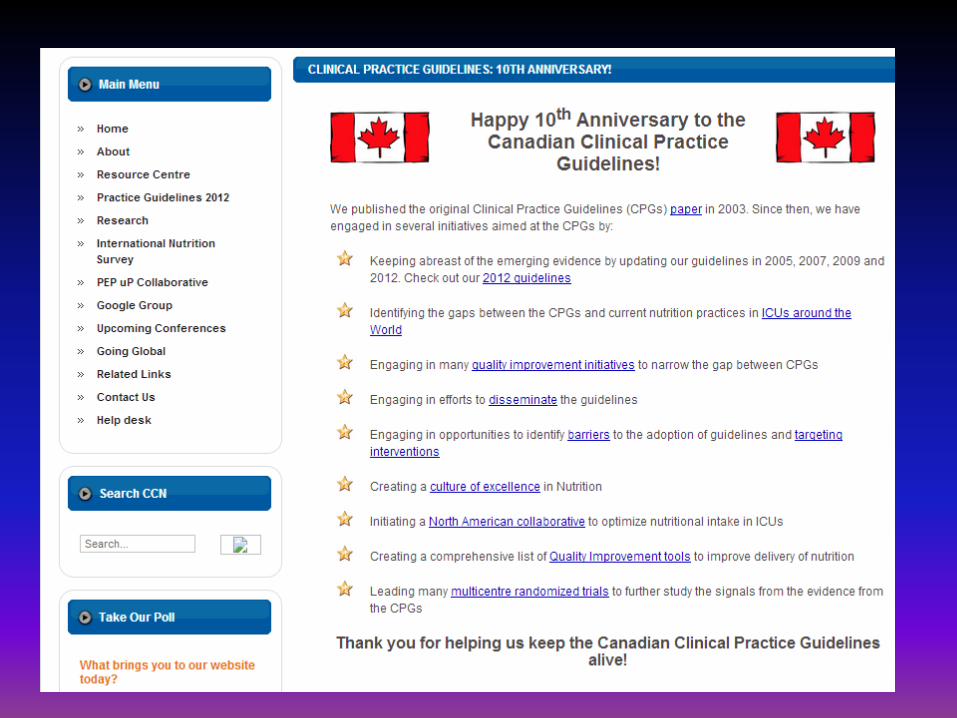
www.criticalcarenutrition.com

Education and Awareness Tools
PEP uP Pocket Guide PEP uP Poster

Protocol to Manage Interruptions to EN Due to Non-GI Reasons
Can be downloaded from www.criticalcarenutrition.com

PEP uP Monitoring Tool
Prompts for
high risk patients
improving calorie and protein intakes (≥ 80%
prescribed)
starting motility agents, small bowel feeding,
supplemental PN

Lost in (Knowledge) Translation!
Heyland DK, Cahill N, Dhaliwal R JPEN 2010
Knowledge to Action Model by Graham: a priori assessment of barriers

Canada: 24
USA: 47
Australia &
New
Zealand: 41
Europe and
Africa: 26
Latin
America:
31
Asia: 52
Argentina: 5 Chile: 3
El Salvador:1 Mexico: 2 Brazil:4 Colombia:9 Peru:1 Venezuela:2
Uruguay:4
Italy: 2 UK: 8
Ireland: 6 Norway: 5
Switzerland: 1 France: 1 Spain: 2
South Africa: 1
China: 19 Taiwan: 9 India: 9 Iran : 1
Japan: 9 Singapore: 3
Philippines:1 Thailand: 1
Participation: Nutrition Survey 2011
355 distinct ICUs over 3 years
12,000 patients
Adequacy of Calories from EN Only
20
30
40
50
60
70
80
Year
2007 2008
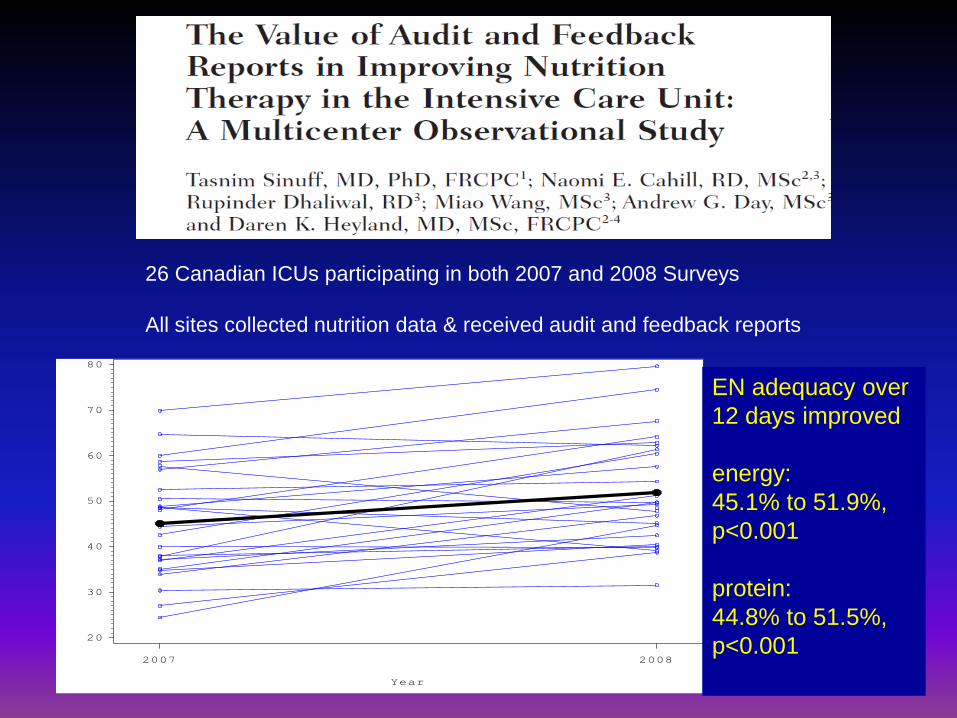
26 Canadian ICUs participating in both 2007 and 2008 Surveys
All sites collected nutrition data & received audit and feedback reports
EN adequacy over
12 days improved
energy:
45.1% to 51.9%,
p<0.001
protein:
44.8% to 51.5%,
p<0.001
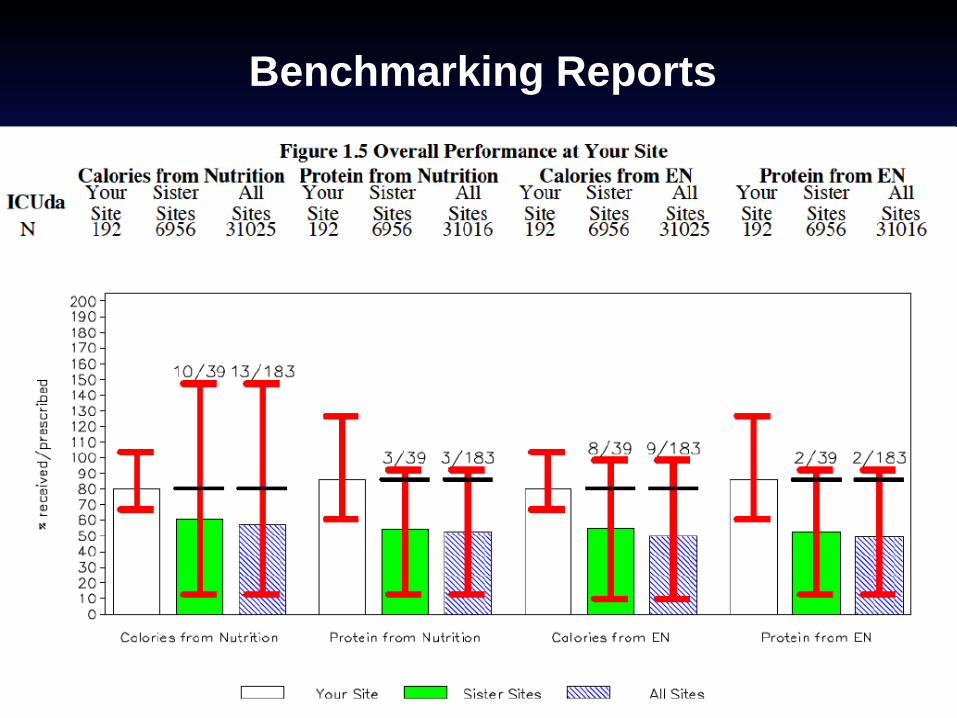
Benchmarking Reports

Barriers are inversely related to nutrition performance
and tailoring change strategies to overcome
barriers to change will reduce the presence of
these barriers and lead to improvements in
nutrition practice
Hypothesis
PERFormance Enhancement of the
Canadian nutrition guidelines through a
Tailored Implementation Strategy

Nutrition Practice
Audit
- 20 patients
Barriers
Assessment
- ICU staff
12 months
Baseline
Tailored
Action Plan
Identify strengths and weaknesses
Identify barriers to change
Small group problem solving
3 months
Evaluation
Nutrition Practice
Audit
Barriers
Assessment
Pre-test Post Test Feasibility Study in 7 ICUs in US and Canada

Top 5 Ranked Barriers
1. In resuscitated, hemodynamically stable patients, other aspects of
patient care still take priority over nutrition
2. No or not enough feeding pumps on the unit
3. Enteral formula not available on the unit
4. Delays and difficulties in obtaining small bowel access in patients
not tolerating enteral nutrition (i.e. high gastric residual volumes)
5. Delay in physicians ordering the initiation of EN
Assess Organizational Culture
• “The way things are around here”
• Defines how decisions regarding feeding are made
• Major influence on CPG adherence
• Define, measure and change
• Recognition: “Culture of Excellence”
Creating a Culture of Excellence
• Eligible sites:
Data on 20 critically ill patients
Complete baseline nutrition assessment
Presence of feeding protocol
No missing data or outstanding queries
Permit source verification by CCN
• Awarded to ICU that demonstrate:
Highest ranking nutritional performance
Adherence to the Canadian guidelines
Recognition Plaques for 2007, 2009 and 2001

Best of the Best 2011
The Team at the Alfred Hospital ICU, Melbourne, Australia

Determinants of Top Performance
What site and hospital characteristics are associated with top BOB ranking?
Hospital/ICU characteristics** p values
Region
Australia and New Zealand vs.
Canada 0.61
China vs. Canada 0.008
Europe and South Africa vs. Canada 0.22
India vs. Canada 0.08
Latin America vs. Canada 0.98
USA vs. Canada <0.0001
Hospital size (per 100 beds) 0.78
ICU structure
Closed vs. open or other 0.89
Presence of Dietitian(s)
Yes vs. No 0.005
Heyland JPEN 2010

Summary
Caloric and protein debt occurs in ICUs
Strategies aimed at minimizing this debt ought to be undertaken √ Pre-printed orders, RN involvement: PEP UP Protocol
√ PEP UP Collaborative
Knowledge to Action Model can be applied to optimize nutrition
therapy √ Identify gaps √ Provide audit and feedback √ Assess barriers to feeding
Creating a culture of Excellence in critical care nutrition helps √ Improve nutrition delivery √ Position the dietitian as a key opinion leader!