emerging markets: from niche to necessity - blackrock · emerging markets: from niche to necessity....
TRANSCRIPT

Executive summary
Antoine Van Agtmael first coined the term “emerging markets” 36 years ago – a
catch-all concept that pooled together a diverse and heterogeneous group of
countries. The term is still used today as shorthand to group countries that have
varied levels of economic development, growth drivers and political risk. Such simple
categorization may be leading some investors to think about emerging markets (EM)
in a way that does not necessarily reflect the dynamic nature of EM assets.
To help investors navigate the shifting role of EM assets – from a niche exposure to a
core portfolio holding – we have authored this guide, which covers:
• Becoming mainstream
Return and yield potential, diversification benefits, improving fundamentals, and
greater accessibility have all played a role in making EM debt and equity core
allocations – particularly for cross border institutional investors.
• Revisiting long-held beliefs
Despite the growth of EM investing, many investors carry some assumptions about
EM assets that may no longer hold: EM risk is singular and static, currency makes EM
investing too risky, EM indexes are heavily-tilted to commodities and EM no longer
offers diversification. We revisit these assumptions in the paper.
• Benchmark evolution
EM bond and equity indexes have evolved significantly over the years, but changes
set for the future have the potential to dwarf anything seen over the last decade: the
potential inclusion of China A-shares, Saudi Arabia and China local debt entering
major EM indexes, the potential reclassification of South Korea from EM to developed
market (DM), and Saudi Arabia’s privatization program. New ways of accessing EM
are under way as well: GDP-weighted indexes and factor indexes offer innovative
approaches for EM index investors; China may become a standalone asset class in
both equities and fixed income.
Contents
Becoming mainstream……....2
• A growing market and
investor base…...................2
• The growing appeal of EM
bonds and equities…………2
Revisiting long-held beliefs...4
• Challenging common
assumptions………………..5
Benchmark evolution…....….9
• Market composition………..9
• The rise of new asset
classes………………….….10
• Beyond market caps……...10
Conclusion………..………….11
JUNE 2017
1
Emerging markets:
From niche to necessity

Becoming mainstream
A growing market and investor base
EM assets have been growing at a remarkable pace (see
Emerging exponentially). Over the last few decades,
investing in EM debt and equity indexes has been
increasingly embraced by investors as evidenced in the
growth of Exchange Traded Products (ETPs) and other
investment vehicles giving exposure to EM assets. Initially,
allocations came from institutions and were later joined by
retail – although the flows from the latter have largely gone
hand in hand with market performance, with strategic retail
allocations to EM remaining relatively small. More recently,
we have also seen a rise in the domestic investor base1.
and trading turnover are lower, asset characteristics are
less standardized, and the number of trading venues is
fewer.
In addition to potential higher returns, our analysis indicates
EM assets generally have a positive historical correlation to
risk sentiment, as evidenced by the positive correlation
between EM assets and BlackRock’s proprietary Risk
Tolerance Index (RTI), which measures the overall appetite
for risk in markets. EM equities show a strong positive
correlation to this index, while EM bonds show a moderately
positive correlation (see Capturing the upside).
Capturing the upside
Risk appetite and EM assets correlation, 2001 to present
Source: BlackRock, Risk and Quantitative Analysis (RQA), as at 7 April 2017.
*RTI: BlackRock’s Risk Tolerance Index. RTI measures the overall appetite for risk
in the markets by ranking correlation between risk and return for 14 different asset
classes. If the risky asset classes are outperforming low risk asset classes, the RTI
will be high, and vice versa. By construction, the index can take values between -1
and 1. The period covered by the calculation is from 01/12/2001 to 03/31/2017.
EM FX is represented by the JP Morgan Emerging Market Currency Index (EMCI),
EM hard currency total return is represented by the total return of the EMBI GD
Index, EM equities are represented by the MSCI EM index
Diversification: a matter of time. The potential
diversification benefits of EM assets underscore the
investment case for including them as a core, strategic
allocation for an investor with longer time horizons. The
globalization of the EM investor base and greater integration
of EM into global financial markets – also a product of DM-
listed firms having a higher exposure to EM sales – has led
to higher short term correlations between EM and DM
assets at times. Nevertheless, over the long term, both EM
equity and debt have displayed diversification benefits: Our
analysis shows that the correlation between EM assets and
DM assets decreases over longer time periods (more than
12 months).
Stronger fundamentals. On a macro level, balance sheet
management has improved in many EM countries.
Following the Tequila and Asian crises of the 1990s,
governments and central banks took steps to become more
economically secure and build greater buffers – as
evidenced by the increase in FX reserves (see More
reserved). Increased fiscal responsibility has also resulted in
lower public debt-to-GDP ratios, relative to DM countries.
2
-
1
2
3
4
5
-
1
2
3
199
2
199
4
199
6
199
8
200
0
200
2
200
4
200
6
200
8
201
0
201
2
201
4
201
6
US
$ t
rn
US
$ t
rn
EM equities (RHS)LC inflation
HC sovereign
HC corporates
LC corporates
LC sovereign
-0.2
0.0
0.2
0.4
0.6
0.8
1.0
2001 2004 2007 2010 2013 2016
Corr
ela
tio
n to
RT
I*
1 Source: CrossBorder Capital, as at 2017
EM
equities
EM FX
EM hard currency
total return
Emerging exponentially
Growth of EM index market capitalization, 1992–2016
Sources: JP Morgan, BofA Merrill Lynch, MSCI, as at December 2016. HC refers
to “hard currency” – which refers to government debt issued in USD, represented
by JP Morgan Emerging Markets Bond Index Global Diversified (EMBI GD). HC
corporates refers to corporate debt issued in USD, represented by JP Morgan
Corporate Emerging Markets Bond Index Broad Diversified (CEMBI Broad). LC
sovereign refers to government debt issued in each country’s local currency,
represented by JP Morgan Government Bond Index-Emerging Markets Global
Diversified (GBI-EM GD). LC corporates refers to corporate debt issued in the
local currency of the entity, represented by BAML Diversified Local Emerging
Markets Non-Sovereign Index (LOCL). LC inflation refers Barclays EM inflation
linked government bond index. EM equities are represented by MSCI Emerging
Markets Index.
The growing appeal of EM bonds and
equities
Potential for higher return and yield. Developed market
(DM) government bond yields at historically low levels have
pushed fixed income investors to look beyond DM bonds for
sources of yield. In equities, we believe that stronger
earnings and GDP growth in emerging markets suggests
the potential for outperformance of EM stocks in the near
term.
Investors tend to assign a higher risk premia to EM assets
compared to DM assets for a number of reasons. The
amount and types of assets are relatively scarce, liquidity

The transition from fixed to floating currencies in most EM
countries over the past two decades has helped during
periods of stress. Currency moves have been able to
absorb the effect of a challenging global environment – a
more favorable outcome versus an immediate devaluation
often seen with fixed currency arrangements that can lead
to greater market shocks.
Growth in domestic ‘onshore’ funded EM assets has been
helped by increased maturity, transparency, and breadth of
local capital markets and can also help minimize volatility.
Contractual savings institutions, which sprang up in Latin
America and Asia in response to previous crises, along with
the savings needs of aging populations, create domestic
demand for assets, which can smooth fluctuations from
more volatile cross border flows.
More reservedForeign exchange reserves, 1997 to present
Source: BlackRock, Bloomberg, data as at March 2017. The period covered by the
calculation is from March 1997 to March 2017
Source: BlackRock, Bloomberg, data as at March 2017. The period
covered by the calculation is from March 1997 to March 2017
Improving governance. On a micro level, the external
financing needs of EM countries, globalization and even
geopolitical events have contributed to improved corporate
governance. According the IMF, internationalism of funding
typically leads to higher standards of governance, as
emerging market equities that trade on U.S. stock
exchanges through ADRs tend to have higher firm-level
governance scores2.
The adoption of more liberal economic policies in China and
India also appears to have contributed to the development
of freer markets and the emergence of companies with
sound businesses3.
Better corporate governance typically shows up on multiple
fronts. Balance sheets improve, debt can be issued over
longer maturities at lower rates, resilience in periods of
shock increases, valuations rise and equity prices become
more reflective of fundamentals.
There remains room for improvement in EM corporate
governance. Many EM corporates are family and state
owned (see Who is in charge here?).
As a result, minority investors still rank lower in the
corporate structure than in DM companies.
Who is in charge here?EM and DM corporate ownership breakdown, at April 2017
Source: Ecstrat, as at April 2017. EM calculation implies MSCI EM universe, while
DM calculation implies MSCI World universe. ‘Dispersed’ stands for companies
not having a controlling shareholder.
Higher credit ratings mean that the credibility of EM entities
has increased. A material proportion of EM bonds are now
available to institutional investors who are restricted from
holding bonds below investment grade. 50% of EM hard
currency debt is issued by borrowers who are rated
investment grade, a marked improvement from almost 0%
in 1993 (see Let me upgrade you).
Let me upgrade youCredit rating breakdown of dollar denominated emerging
market debt (EMD) 1993 to present
Source: J.P. Morgan, as at 28 April 2017. The index is the JP Morgan Emerging
Market Bond Index (EMBI). Legend is credit ratings. Unrated securities (NR) do
not necessarily indicate low quality. Below investment-grade is represented by a
rating of BB and below. A rating above BB is considered investment grade (IG).
Residual represents bonds where data was not available. The period covered by
the calculation is from December 1993 to April 2017.
Easier access. Changes in regulation vary significantly
from country to country, but the trend has been towards
higher international participation. Relaxation of
3
0
1000
2000
3000
4000
5000
6000
1997 2001 2005 2009 2013 2017
US
$ b
n
Indonesia
Russia
Brazil
South Korea
South Africa
India
China
13%
20%
4%
4%
26%
1%
1%
1%
26%
4%
72%
7%
1%
2%
7%
4%
2%
2%
2%
Dispersed
Entrepreneur
Foreign
Financial Investor
Family
Hybrid
Network - Japan Only
Local state - China Only
Miscellaneous Private
State
Other
EM
DM
0%
20%
40%
60%
80%
100%
1993 1996 1999 2002 2005 2008 2011 2014 2017
Cre
dit r
atin
g w
eig
ht
IG BB B C NR Residual
2 Source: IMF, Global Financial Stability Report, as at October 20163 Source: MSCI, as at 2016

borrowing market rules in some EM countries could also
contribute to increased liquidity in local equity markets.
The introduction and rapid growth of a number of readily
available efficient financial instruments and vehicles has
also contributed to the democratization of EM investing,
thus enabling investors to more efficiently express their
views.
Revisiting long-held beliefs
From an index perspective, EM can be difficult to quantify
and define. As economies advance or deteriorate they’re
often reclassified or new standalone country indexes are
launched (see The times they are a-changing). To add to
further confusion, the market classification and criteria for
inclusion varies from one index provider to another, with
some favoring economic developments over things like
liquidity or accessibility, which is critical in the
implementation phase.
Challenging common assumptions
In equities, from 1988 to the present day, there have been
33 country changes in the MSCI EM Index. By contrast, the
MSCI World Index, representing developed markets as
defined by MSCI, has had only seven country changes over
the same period5.
The growth of China is perhaps the best example of
significant country change: 20 years ago it was barely
featured in the MSCI EM Index; today it is the largest single
country exposure (see China emerges).
4
The times they are a-changingEM index investing milestones, 1980 to present6
5Source: BlackRock, MSCI, as at May 2017. 6 Source: BlackRock, Bloomberg, FTSE, JP Morgan and MSCI, as of May 2017. Note: $EMD represents dollar hard currency EM debt.
*As classified by MSCI.
China emerges
Country decomposition of MSCI Emerging Markets Index,
1997 to present
Source: BlackRock, MSCI, as at 31 March 2017. Category “Other” includes:
Argentina, Chile, Colombia, Czech Republic, Egypt, Greece, Hungary, Indonesia,
Israel, Israel - Non Domestic, Jordan, Malaysia, Morocco, Pakistan, Peru,
Philippines, Poland, Portugal, Qatar, Sri Lanka, Thailand, Turkey, United Arab
Emirates, Venezuela. The period covered by the data is from March 1997 to March
2017
0%
20%
40%
60%
80%
100%
1997 2001 2005 2009 2013 2017
Co
un
try w
eig
ht
Brazil China India
Korea Mexico Russia
South Africa Taiwan Other
DEBT
EQUITY

In fixed income, investors are buying an increasingly diverse
basket of bonds in hard and local currency EMD indexes
(see Losing count and Localised changes). The number of
sovereign hard currency issuers has gone from 38 in 2006
to 72 today. Fifteen years ago South Africa and Poland
were the two largest local debtors, today they are Brazil and
Mexico7.
Localized changesCountry decomposition of JP Morgan Local GBI-EM Global,
2002 to present
Source: BlackRock, JP Morgan, as at 28 April 2017. Category “Other” includes:
Czech Republic, Slovakia, Nigeria, Argentina, Indonesia, Peru, Romania, Chile,
Russia, Colombia, Philippines. The period covered by the data is from January
2002 to April 2017.
the MSCI World has remained relatively high: At the time of
writing, the top 10 MSCI EM Index holdings represent 23%
of the index’s market capitalization versus only 11% for the
MSCI World Index10. Finally, the return dispersion among
index constituents (the difference between a maximum and
a minimum monthly return between individual MSCI country
indices) has decreased in the MSCI EM Index (see Not so
different after all).
More than a little bit countryFactor contribution breakdown of MSCI Emerging
Markets index, 1999 to present
Source: BlackRock, MSCI, Bloomberg, as at February 2017. The period
covered by the data is from February 1999 to February 2017.9
Fixed income: Historically, across both hard currency and
local currency debt classes, the duration of EM debt indexes
has typically been lower than DM equivalents. The growing
ability of EM countries to issue in longer maturities has
helped average duration rise steadily to levels comparable
to the DM indexes (see Movin’ on up).
5
0
100
0%
100%
1993 1998 2003 2007 2012 2017N
um
be
r o
f co
un
trie
s
Re
gio
n w
eig
ht
Mideast Latin
Europe Asia
Africa Country count (RHS)
0%
20%
40%
60%
80%
100%
2002 2005 2008 2011 2014 2017
Co
un
try w
eig
ht
Poland Mexico BrazilSouth Africa Malaysia ThailandTurkey Hungary Other
7 Source: JP Morgan , as at April 20178 Source: BlackRock, Global ETP Landscape, as at April 20179 Notes: Style refers to investment approach or objective. The index selects
securities and industries under a classification of common companies. 10Source: BlackRock, MSCI, as at May 2017
Losing countRegional decomposition of JP Morgan Emerging Market
Bond Index (EMBI), 1994–2016
Source: JP Morgan, as at 28 April 2017. The period covered by the data is
from December 1994 to April 2017
These changes reflect the fluid nature of EM indexes. Some
commonly held assumptions may no longer hold and should
be revisited.
Assumption 1: EM risk is singular and
static
Investors often refer to the growth and risks within EMs
more broadly even though the level of economic
development may vary significantly in some cases. Flow
data shows that most asset flows in recent years have been
into broad EM equity exposures8.
While a common set of factors may affect the broad-based
EM universe, we believe it is crucial to look under the hood
to understand the drivers of returns.
Equities: Country risk has come down in recent years, but
remains the highest contributor to cross sectional volatility,
relative to industries and styles (see More than a little bit
country). This contrasts with DM where industry risk is
dominant. The dominance of country risk in EM equities
may persist in the future partly due to the inherent
heterogeneity of the countries within EM universe.
Concentration risk is also a factor in EM equity investing.
Despite a fall since the 1990s, the concentration of top
company holdings within the MSCI EM Index compared to
0%
10%
20%
30%
40%
50%
60%
70%
80%
1999 2002 2005 2008 2011 2014 2017
% o
f to
tal fa
cto
r co
ntr
ibu
tio
n
Styles
Countries
Industries

Not so different after allDifference between a maximum and a minimum monthly
return for individual MSCI EM country indexes and MSCI
EM Index, 1988 to 2016
Source: BlackRock, Thomson Reuters DataStream, MSCI as at December 2016.
The period covered by the calculation is from December 1988 to December 2016
When investing in hard currency EMD, investors get credit
spread exposure versus the hard currency yield curve (e.g.
US, EUR, GBP). When investing in a local currency EMD
equivalent, investors get interest rate exposure in local EM
currencies.
Over the past 10 years, with the exception of a handful of
countries such as Argentina, the majority of EM local
government debt has had lower yield volatility versus DM
counterparts. From January 2007 to April 2017, the JP
Morgan GBI-EM Global Diversified Index yield averaged
6.5% with a monthly volatility of 0.5%, compared to the GBI-
DM Global Diversified index yield of 2.4% and monthly
volatility of 0.9%10.
Contrary to conventional wisdom, local EM yield movements
are the least volatile within the EM universe –most of the
volatility is driven by currency exposure. From the credit
quality perspective, local currency EMD scores higher
versus its hard currency equivalent.
Assumption 2: Currency makes EM
investing too risky
Smaller financial systems, greater exposure to cross border
flow and limited liquidity in some currencies – which leads to
increased hedging costs – remain realities of EM investing.
EM currencies in general are subject to higher volatility than
DM currencies. Both EM equities and local denominated
debt have currency as a major risk contribution11.
Investors have been harmed by EM currency crises in the
past, from the Mexican peso in December 1994 to worries
about China ‘devaluing’ the RMB in August 2015. Yet many
of the structural reforms that have supported EM investing
date from the aftermath of these crises. Analysis by the
London Business School shows the highest returns for EM
equity and local currency debt investors have come from
Movin’ on upAverage debt duration of fixed income indexes
2001 to present
Source: JP Morgan, as at 31 March 2017. JP Morgan Government Bond Index –
Emerging Markets (GBI-EM) for EM Loc Tsy, JP Morgan Emerging Market Bond
Index (EMBI) Global Diversified for EM Ext Debt, BBG Barclays US Agg Credit
Index for US Credit, BBG Barclays Euro Agg Credit Index for euro credit. The
period covered by the calculation is from December 2001 to March 2017
depressed currency levels12 – as seen in Brazil over the last
18 months. Depressed currency valuations are associated
with capital flight, which, in turn, lowers valuations.
Depreciations can boost trade balances albeit with a time
lag and thus reduce dependence on imported capital, the
substitute effect.
Cheap currencies and assets provide an attractive
investment backdrop as such currency sell-offs have tended
to be associated with dips in the economic cycle and profits.
Buying distressed assets at economic troughs in depressed
Expect the unexpected
Annualized returns of markets sorted by currency levels and
GDP growth, 1976–2013
Source: Elroy Dimson, Paul Marsh, and Mike Staunton using data
from the DMS database, the IMF, Mitchell, Maddison, and
Thomson Reuters DataStream. Rotation strategies within
developing markets 1976 – 2013; ranking countries in quintiles by
factor (GDP or FX) the study followed a market-rotation strategy
over a period of typically a year. 6
-40
-20
0
20
40
60
80
100
120
140
1988 1992 1996 2000 2004 2008 2012 2016
Pe
rce
nt
MSCI EM
Dispersion between
max and min return
10 Source: BlackRock and Bloomberg, as at May 201711 Source: JP Morgan, as at April 201712 Source: BlackRock, RQA, as at April 2017
3.0
4.0
5.0
6.0
7.0
8.0
2001 2004 2007 2010 2013 2016
Du
ratio
n
US credit
EM ext debt
Euro credit
EM loc tsy
35
21
11 11
17
0
10
20
30
40
Retu
rn %
(Weakest) FX Performance (Strongest)
27 26
1416
14
0
10
20
30
Retu
rn %
(Lowest) GDP Growth (Highest)
currencies has historically been a good investment strategy:
The best returns in EM have been in the years after years
when yields were the highest, currencies were weakest and
GDP growth was lowest (see Expect the unexpected).
There is some evidence that investors are catching on to
this point on currency sell-offs, for instance the rapid
rebound in the Mexican peso from lows seen around the
November 2016 US presidential election.
Assumption 3: EM indexes are heavily-
tilted to commodities
Single country EM equity indexes often do not resemble the
economic structure of the respective country. State
ownership of assets – often in the natural resources space –
skews EM indexes away from GDP contributions. A similar
pattern is observable in fixed income indexes, particularly
when comparing EM corporate debt with DM corporate
debt. Many businesses never make it to public markets and
remain in government or private hands. Thus, financial
market opportunities often fail to match or reflect either GDP
structures or growth rates, leading to the confusion between
economic exposure and market exposure.
In the case of equities, evolution of index composition may
also be a driver of the mismatch between investor
expectations and the reality of a sector breakdown of the
MSCI EM Index. In the late 2000s, energy and materials
made up almost 31% of the MSCI EM Index14.
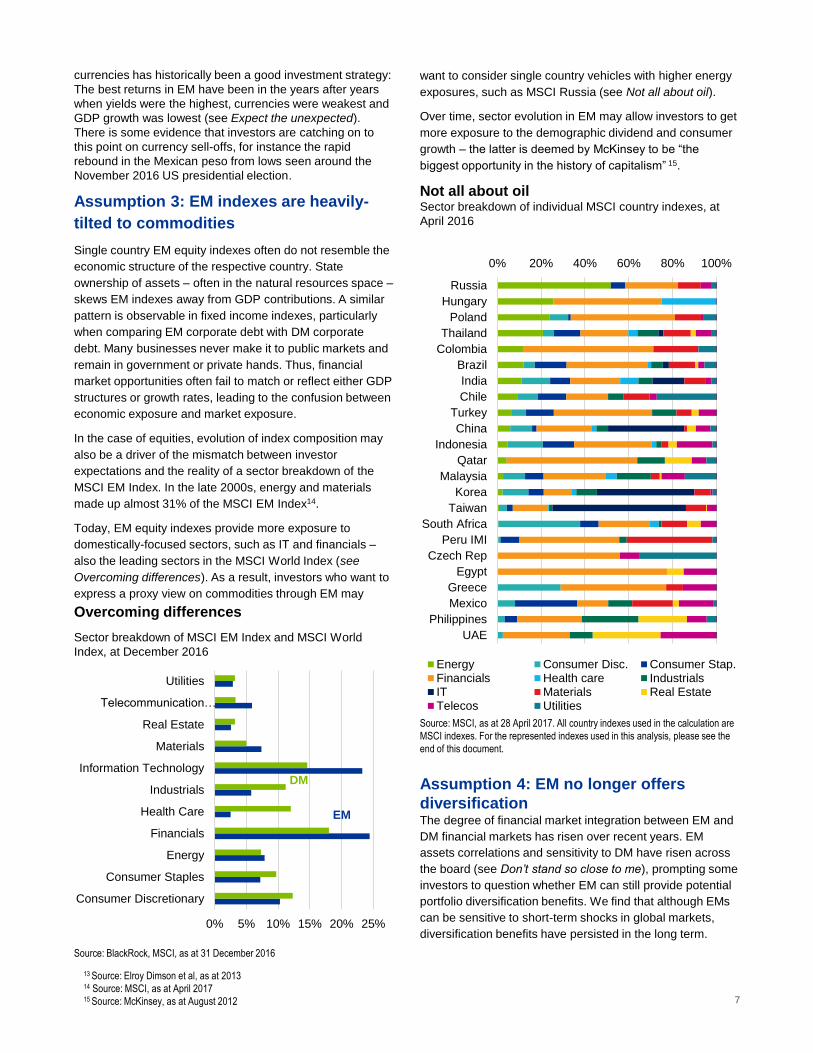
Today, EM equity indexes provide more exposure to
domestically-focused sectors, such as IT and financials –
also the leading sectors in the MSCI World Index (see
Overcoming differences). As a result, investors who want to
express a proxy view on commodities through EM may
Overcoming differences
Sector breakdown of MSCI EM Index and MSCI World
Index, at December 2016
Source: BlackRock, MSCI, as at 31 December 2016
want to consider single country vehicles with higher energy
exposures, such as MSCI Russia (see Not all about oil).
Over time, sector evolution in EM may allow investors to get
more exposure to the demographic dividend and consumer
growth – the latter is deemed by McKinsey to be “the
biggest opportunity in the history of capitalism” 15.
Not all about oilSector breakdown of individual MSCI country indexes, at
April 2016
Source: MSCI, as at 28 April 2017. All country indexes used in the calculation are
MSCI indexes. For the represented indexes used in this analysis, please see the
end of this document.
Assumption 4: EM no longer offers
diversificationThe degree of financial market integration between EM and
DM financial markets has risen over recent years. EM
assets correlations and sensitivity to DM have risen across
the board (see Don’t stand so close to me), prompting some
investors to question whether EM can still provide potential
portfolio diversification benefits. We find that although EMs
can be sensitive to short-term shocks in global markets,
diversification benefits have persisted in the long term.
7
13 Source: Elroy Dimson et al, as at 201314 Source: MSCI, as at April 201715 Source: McKinsey, as at August 2012
0% 5% 10% 15% 20% 25%
Consumer Discretionary
Consumer Staples
Energy
Financials
Health Care
Industrials
Information Technology
Materials
Real Estate
Telecommunication…
Utilities
EM
DM
0% 20% 40% 60% 80% 100%
Russia
Hungary
Poland
Thailand
Colombia
Brazil
India
Chile
Turkey
China
Indonesia
Qatar
Malaysia
Korea
Taiwan
South Africa
Peru IMI
Czech Rep
Egypt
Greece
Mexico
Philippines
UAE
Energy Consumer Disc. Consumer Stap.Financials Health care IndustrialsIT Materials Real EstateTelecos Utilities

Don’t stand so close to meSensitivity of the MSCI EM Index to the MSCI World Index,
1997–2017
Source: BlackRock, RQA, MSCI as at 29 March 2017. The period covered by the
calculation is from March 1997 to March 2017. Beta is a measure of the volatility
of a security or group of securities in relation to the market as a whole.
While short term correlations were high, they declined
materially over a longer holding period and at 3-5 years a
strategic allocation to EM assets – across equities and
bonds – appears to have been an effective diversifier of DM
risk (see You can’t hurry diversification).
Benchmark evolution
Material evolution has taken place in EM over the past 30
years. We believe the next 10 may also bring radical shifts
that have the potential to change the way investors
approach EM.
Market composition
From a country composition perspective, we believe the
changes that lie ahead have the potential to overshadow
changes seen in the past.
Some countries stand out in the near term, such as China,
India and Saudi Arabia. China is already the third largest
government bond market in the world at $7 trillion, and India
follows closely at $3 trillion16. Both giants run persistent,
largely domestically financed, fiscal deficits and seek to
provide long term savings vehicles for their citizens, which
suggests these markets could continue to grow.
International investors have been largely excluded so far
from accessing the onshore market in both China and India.
However, authorities have expressed commitment to
opening the doors to global finance over the long term.
Saudi Arabia made its debut in international debt markets
last year with the government raising $17.5bn in a sovereign
bond sale17 – a record for an EM. A low oil price and
squeezed domestic issuers suggest further offshore
issuance is likely.
We have remodelled the JPM Government Bond Index-
Emerging Markets Global benchmark to include China
You can’t hurry diversificationCorrelation of EM and DM equity returns, 1988–2017
Source: BlackRock, Thomson Reuters DataStream, MSCI as at 31 March 2017.
EM equity returns are based on MSCI Emerging Markets index; DM equity returns
are based on MSCI World index. The period covered by the calculation is from
May 1988 to May 2017
Correlations of EMD indexes and DM bonds,
2014–2017
Source: JP Morgan, BBG Barclays as at 28 April 2017. HC sovereign is
represented by the JP Morgan Emerging Markets Bond Index Global Diversified
(EMBI GD). LC sovereign is represented by the JP Morgan Government Bond
Index-Emerging Markets Global Diversified (GBI-EM GD). HC corporates is
represented by the JP Morgan Corporate Emerging Markets Bond Index Broad
Diversified (CEMBI Broad). DM is represented by the BBG Barclays Global
Aggregate ex EM Index. The period covered by the chart is from April 2014 to April
2017
and India local government debt at their full market caps
(see Waiting on the world to change). In practice, investors
follow a country capped (10%) version – the JP Morgan
GBI-EM Global Diversified Index – which has estimated
assets of $191bn benchmarked against it18. This tells us
that approximately $19bn of assets could rebalance upon
official China or India inclusion.
In equities, the index weight of China – the second largest
equity market in the world – could increase, in particular
given the potential gradual addition of China A-shares to
indexes.
Other potential upcoming country changes include the
inclusion of Argentina and Saudi Arabia to MSCI EM Index.
South Korea, the second largest country weight in the MSCI
EM Index, may be ultimately reclassified as DM.
8
0
0.5
1
1.5
2
2.5
1997 2001 2005 2009 2013 2017
Be
ta
Beta of EM to DM
equities
0
0.1
0.2
0.3
0.4
0.5
0.6
0.7
1 12 24 36 48 60
Corr
ela
tio
n
Holding period (number of months)
HC
sovereignLC
sovereign
HC
corporates
0.0
0.1
0.2
0.3
0.4
0.5
0.6
0.7
1 12 24 36
Co
rre
latio
n
Holding period (number of months)
16 Source: JP Morgan, as at April 201717 Source: FT, as at October 201618 Source: JP Morgan, as at December 2014

Waiting on the world to changeModel JPM GBI-EM Global (uncapped), at April 2017
Source: BlackRock, JP Morgan, as at 28 April 2017. The chart uses hypothetical
data for the ‘+China’ and ‘+China+India’ model benchmarks. The model
benchmarks assign 30% weight to China and 20% weight to India representative
of their market value outstanding
The model MSCI EM Index we have constructed excludes
South Korea and includes the MSCI China A Index19, the
MSCI Saudi Arabia Domestic Index, the MSCI Pakistan
Index, the MSCI Argentina Index, and the IPO of Saudi
Aramco, with a floating factor of 5% (see Modelling the
future).
The rise of new “asset classes”
We believe that new inclusions have the potential to alter
how investors approach EM index investing, driving new
investment behaviours and the development of new index
vehicles used to access EM.
A dramatic increase in the weight of a country like China
may spur investors to take a ‘building block’ approach to EM
equity by utilizing single country or regional exposures
alongside broader EM vehicles. In this sense EM could
follow a DM path where investors often make allocations to
countries or regions – as opposed to broad benchmarks
such as the MSCI World Index – to be able to express a
positive, neutral or negative view on this particular
geography.
One important driver could be the potential full opening up
of China, which could represent around 50% of MSCI EM
Index just as the weight of the U.S. in the MSCI World Index
is over 50%20. Based on some estimates, around $1.6trn of
Modelling the futureModel of MSCI EM index assuming changes to the country
composition, at April 2017
Source: BlackRock, RQA, MSCI, as at 28 April 2017. The chart uses hypothetical
data for the ‘Aramco at 1tr’ and ‘Aramco at 2tr’ model benchmarks. The model
benchmarks exclude Korea and include MSCI China A, MSCI Saudi Arabia
Domestic, MSCI Pakistan, MSCI Argentina, and the IPO of Saudi Aramco with a
floating factor of 5%. MSCI assumptions used in the analysis are as at April 2017
assets is benchmarked against the MSCI EM Index21, so the
full opening up of China – which currently represents around
a quarter of the index – could trigger a significant
reallocation of assets. China could well become a
standalone asset class.
In fixed income, China’s local debt could be introduced into
the Bloomberg Barclays Global Aggregate Index and
Citigroup World Government Bond Index (WGBI), which are
investment grade indexes that can include DM and EM
currencies as long as the markets meet investment and
liquidity criteria. Both index providers estimate a 5-6%
weight assigned to China upon inclusion and $2trn of assets
benchmarked against both indices respectively22.
We believe these are conservative estimates that tell us at
least $200bn of assets may be forced into motion. This
could strengthen the potential for China as a standalone
investable asset class in terms of portfolio construction.
Local currency corporate index vehicles. Within the
universe of tradable public EM assets, local corporate debt
and loans are undoubtedly the least mature or liquid. It was
not until 2013 that an index representing this asset class
(BofA Merrill Lynch Local Markets Non Sovereign Index)
was launched. Although the amount of outstanding local
non-sovereign debt is estimated to be over $4trn, the
market cap of the index, which aims to track parts of the
market regarded as investable, stands at $99bn23. Such
9
0%
10%
20%
30%
40%
50%
60%
70%
80%
90%
100%
GBI-EMEnd April
+China +China+India
Ind
ex w
eig
htin
g
IndiaChinaTurkeyThailandSouth AfricaSlovakiaRussiaRomaniaPolandPhilippinesPeruNigeriaMexicoMalaysiaIndonesiaHungaryCzech RepublicColombiaChileBrazilArgentina
19 Note: based on MSCI assumptions as at April 201720 Source: MSCI, as at April 201721 Source: MSCI, as at December 201622 Source: Bloomberg Barclays and Citigroup as at April 201723 Source: BAML, as at April 2017
0%
10%
20%
30%
40%
50%
60%
70%
80%
90%
100%
MSCI EMEnd March
Aramco at1tr
Aramco at2tr
Brazil
China
India
Korea
Mexico
Russia
South Africa
Taiwan
Others
Saudi Arabia
Argentina
Pakistan

assets are still largely held by domestic banks at issue and
hardly trade. In times of stress, correlation between liquidity
premiums and strength of currency of local corporate debt
may compound risk for investors.
Local currency corporate debt is the fastest growing
segment within EM24. Demand for this segment is driven by
the global search for yield. Even if global yields increase
over the next five years, they may remain low relative to
long-term history and investors may continue to seek out
new yield opportunities wherever they arise.
On the supply front, regulatory efforts such as Chinese and
Indian relaxation of capital controls, local issuer efforts on
reporting, increasing issuance sizes and making bonds
‘Euro-clearable’ are encouraging. Specific segments in EM,
such as Islamic finance in the form of Sukuk bonds, have
been issued steadily in the recent years. We believe the
eventual overcoming of liquidity constraints will encourage
the eventual birth of the index vehicles tracking local
currency corporate debt benchmarks.
Beyond market caps
GDP/debt weighting. We also believe the demand for non-
market cap weighted indexes is growing as we have seen
EM market cap weighted indexes do not always reflect
economic reality.
These could include GDP-weighted equity indexes that
could offer higher exposure to countries with stronger
growth as opposed to the largest market cap.
In fixed income, market cap weighted indexes give investors
exposure weighted according to the amount of debt issued
by each country or company. This could potentially increase
issuer concentration risk, and consequently default risk
exposure to the issuer with the highest weight. An
alternative methodology, such as debt-to-GDP weighting for
sovereign debt, tilts index weights relatively more towards
countries with high GDP levels rather than absolute amount
of debt. Other similar measures could be used. For
example, the Blackrock Sovereign Risk Index (see Gauging
risk), goes one step further, quantifying each country’s
credibility using fiscal, financial and institutional metrics –
which has been highly correlated with the riskiness of
sovereign CDS spreads.
Factor indexes. Factor investing could gain traction in EM
as it has done in DM.25 Many EM factor indexes have
historically outperformed their parent indexes over the long-
term on both an absolute and risk-adjusted basis27. The
return differential between factor exposures and parent
indexes has been persistently higher than equivalent DM
exposures (with the exception of size).
Some of the higher factor premium versus DM could be
explained by higher cross sectional dispersion of returns
Gauging riskBlackRock Sovereign Risk Index, Q2 2017
Source: BlackRock, as at 28 April 2017
versus DM. Some of this, however, could also have been
driven by stronger relevance of country bets within EM
factor indexes versus DM factor indexes. Indeed country
risk has a higher contribution to the cross sectional volatility
in EM versus DM. For instance, EM momentum is currently
overweight Brazil, quality is overweight India and China, and
value is overweight Korea.
10
24 Source: MSCI, as at April 201725 Source: BlackRock, MSCI, as at March 17, as measured by MSCI factor and parent indexes. Note: Factor investing is an investment strategy where securities are
selected based on specific attributes. For the full description of the respective factors see the end of this document. There can be no assurance that performance will be
enhanced or risk will be reduced by implementing a factor strategy.
-2 -1.5 -1 -0.5 0 0.5 1
Czech Republic
South Korea
Chile
Israel
Thailand
Poland
Malaysia
Kazakhstan
Philippines
Russia
Peru
Indonesia
Uruguay
Colombia
China
India
Turkey
South Africa
Romania
Hungary
Mexico
Brazil
Panama
Slovenia
Croatia
Argentina
Portugal
Serbia
Egypt
Ukraine
Greece
Venezuela
Lebanon
Index

ETPs investors are only just beginning to invest in EM factor
exposures: Smart beta EM funds represent only 7% of total
EM equity assets26. The majority of indexed EM factor
assets today are concentrated in multifactor, dividend and
low volatility exposures (see Tapping into EM factors),
suggesting that there is room for investors to become more
selective and specific about the factor exposures they
include in portfolios.
Tapping into EM factorsBreakdown of global ETP AUM invested in EM smart beta
funds, in US$ millions, at March 2017
Source: BlackRock, Global ETP landscape, as at March 2017
Conclusion
After falling out of favor among many investors after the
taper tantrum of 2013, emerging markets have come back.
They are not the same as they were 10 or 15 years ago.
Some countries are ‘graduating’ to developed status (or
from frontier to emerging), sector composition is constantly
evolving, and new investment approaches (like factor
investing) are appearing. The role of EM is evolving.
Yet, we believe that both the diversification benefits and
potential for return are still valid reasons to consider EM
assets. Most importantly, in the coming years, EMs could
play an increasingly important role both in the global
economy – and in investors’ portfolios (see A glimpse into
the future).
A glimpse into the future The composition of global capital markets: 2014 (US$
153tn) and a 2030 projection (US$ 515tn)
Source: Manulife, Thomson Reuters, World Federation of Exchanges, BIS, Credit
Suisse Research Institute: Emerging Capital Markets The road to 2030, as at July
2014
11
5,788
5,477
4,726
2,035 309
Multi-Factor Dividend Low Volatility
Single Exposure Equal Weight
26 Source: BlackRock, Global ETP landscape, as at March 2017
9%
32%
4%27%
4%
24%
EM Equities DM Equities
EM Corporate Bonds DM Corporate Bonds
EM Sovereign Bonds DM Sovereign Bonds
2014 2030

Authors and contributors
12
Karim
Chedid
Varia Pechurina
Wei Li
Hugh
Arnold
Ewen
Cameron Watt
Senior Advisor
to BlackRock
Leland
ClemonsJane Sloan
Matthew
Fowles
Special thanks to
contributors
Kate Moore
Richard Turnill
Pablo Goldberg
Gerardo Rodriguez
Marina Evtimova
Richard Steel
James Gnanamithran
Joshua Richardson
Flora Fang
H.T. Kim
Antoniya Smilkova
Eve Velikova
Garth FlanneryMaria Eugenia
Heyaca
Hui Sien Koay
Editor:
Christopher
Thomson
Editor:
David KurapkaLucia Feyles

This material is provided for educational purposes only and is not intended to be relied upon as a
forecast, research or investment advice, and is not a recommendation, offer or solicitation to buy or sell
any securities or to adopt any investment strategy. You are solely responsible for evaluating and acting
upon the education and information contained in this material. BlackRock will not be liable for direct or
incidental loss resulting from applying any of the information obtained from these materials or from any
other source mentioned. BlackRock does not render any legal, tax or accounting advice and the education
and information contained in this material should not be construed as such. Please consult with a
qualified professional for these types of advice.
Index performance is for illustrative purposes only. Index performance does not reflect any management
fees, transaction costs or expenses. Indexes are unmanaged and one cannot invest directly in an index.
Past performance does not guarantee future results.
This document contains general information only and does not take into account an individual's financial
circumstances. This information should not be relied upon as a primary basis for an investment decision. Rather,
an assessment should be made as to whether the information is appropriate in individual circumstances and
consideration should be given to talking to a financial advisor before making an investment decision.
The information included in this material has been taken from trade and other sources considered to be reliable.
We do not represent that this information is accurate and complete, and it should not be relied upon as such. Any
opinions expressed in this material reflect our analysis at this date and are subject to change. The information and
opinions contained in this material are derived from proprietary and non-proprietary sources deemed by
BlackRock to be reliable, but are not guaranteed as to accuracy. Such information may include, among other
things, projections and forecasts. There is no guarantee that any of these views will come to pass. Reliance upon
information in this post is at the sole discretion of the reader.
The information presented does not take into consideration commissions, tax implications, or other transactions
costs, which may significantly affect the economic consequences of a given strategy or investment decision.
International investing involves risks, including risks related to foreign currency, limited liquidity, less government
regulation and the possibility of substantial volatility due to adverse political, economic or other developments.
These risks often are heightened for investments in emerging/developing markets and in concentrations of single
countries. Frontier markets involve heightened risks related to the same factors and may be subject to a greater
risk of loss than investments in more developed and emerging markets.
Fixed income risks include interest-rate and credit risk. Typically, when interest rates rise, there is a corresponding
decline in bond values. Credit risk refers to the possibility that the bond issuer will not be able to make principal
and interest payments. Non-investment-grade debt securities (high-yield/junk bonds) may be subject to greater
market fluctuations, risk of default or loss of income and principal than higher-rated securities.
Important notes for page 7: Unless otherwise noted, relevant country indexes include MSCI Russia, MSCI
Hungary, MSCI Poland, MSCI Thailand, MSCI Colombia, MSCI Brazil, MSCI India, MSCI Chile, MSCI Turkey,
MSCI China, MSCI Indonesia, MSCI Qatar, MSCI Malaysia, MSCI Korea, MSCI Taiwan, MSCI South Africa, MSCI
Peru IMI, MSCI Czech Republic, MSCI Egypt, MSCI Greece, MSCI Mexico, MSCI Philippines and MSCI UAE.
Important notes for page 10: The Minimum Volatility factor selects lower risk stocks relative to the broader
market. The Momentum factor selects stocks that exhibits upward price trends. The Value factor selects stocks
that are priced at a discount relative to fundamentals. The Quality factor selects financially healthy companies. The
Size factor selects stocks with smaller capitalizations relative to larger counterparts. Multifactor strategies combine
momentum, size, value and quality factors.
Prepared by BlackRock Investments, LLC (together with its affiliates, “BlackRock”).
©2017 BlackRock, Inc. All rights reserved. BLACKROCK is a registered trademark of BlackRock, Inc. in the
United States and elsewhere. All other marks are the property of their respective owners. 164918