emerging impact of chinese commodity futures market … · emerging impact of chinese commodity...
TRANSCRIPT
79China & World Economy / 79–99, Vol. 21, No. 6, 2013
©2013 Institute of World Economics and Politics, Chinese Academy of Social Sciences
Emerging Impact of Chinese Commodity FuturesMarket on Domestic and Global Economy
Zhiyong Tu, Min Song, Liang Zhang*
Abstract
In this paper we construct a set of indices that capture the special features of the Chinesecommodity futures market for the period from January 2000 to December 2011 to analyzethe general properties of China’s commodity futures market. Using these indices weinvestigate the risk premiums of Chinese commodity futures and verify that the commodityfutures can act as an effective diversification tool for Chinese asset management. It is foundthat the commodity futures can hedge both expected and unexpected inflation in China, andagricultural commodity futures are found to signal inflation 2 months beforehand. Finally,we explore the relationship between Chinese and US commodity futures markets in the years2000 and 2010, and find that their interactions strengthen over time. Our research revealsan increasingly important role of the Chinese commodity futures market in both the domesticand the global economy. Some policy changes are suggested in response to this trend.
Key words: Chinese commodity futures, property
JEL codes: G10, G11
I. Introduction
The global commodity markets have undergone profound changes over the past decade.Commodities prices have been increasing, particularly those of crude oil and metals. Growingnumbers of institutional investors are including commodity futures in their portfolios aspart of the asset allocation, and the fast growth of the Chinese commodity market has
*Zhiyong Tu (corresponding author), Associate Professor, HSBC Business School, Peking University, Shenzhen,China. Email: [email protected]; Min Song, Professor, School of Economics and Finance, Hong KongUniversity, Hong Kong, China. Email: [email protected]; Liang Zhang, HSBC Business School, PekingUniversity, Shenzhen, China. Email: [email protected]. We thank two anonymous referees for helpfulcomments. This project was supported by the HSBC Financial Research Institute at Peking University.
80 Zhiyong Tu et al. / 79–99, Vol. 21, No. 6, 2013
©2013 Institute of World Economics and Politics, Chinese Academy of Social Sciences
attracted global investors’ attention.China is a traditional investment-driven economy, and is well known for its huge
commodity demand (see Lu et al., 2009). The first commodity exchange in China, theShenzhen Metal Exchange, was established in 1991. In the following 4 years, more than 50commodity exchanges were set up. Because of the immature market structure and regulationsin place, market speculation and manipulation were rampant, and, consequently, triggeredstrict rectification by the government. After 1995, most commodity exchanges were shutdown and only three remained: the Shanghai, Dalian and Zhengzhou Exchanges. By 2004,the market had been reshaped with more complete laws and regulations. After that,government policy shifted from consolidating commodity exchanges to promoting commodityfutures markets.1
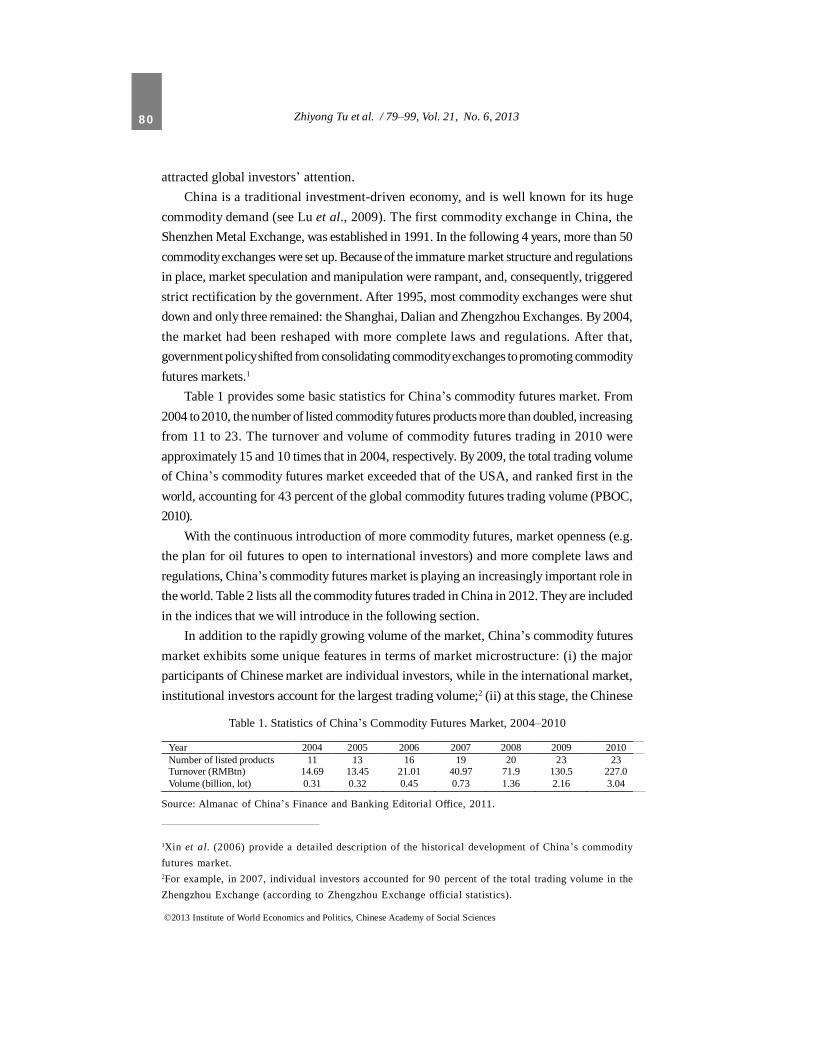
Table 1 provides some basic statistics for China’s commodity futures market. From2004 to 2010, the number of listed commodity futures products more than doubled, increasingfrom 11 to 23. The turnover and volume of commodity futures trading in 2010 wereapproximately 15 and 10 times that in 2004, respectively. By 2009, the total trading volumeof China’s commodity futures market exceeded that of the USA, and ranked first in theworld, accounting for 43 percent of the global commodity futures trading volume (PBOC,2010).
With the continuous introduction of more commodity futures, market openness (e.g.the plan for oil futures to open to international investors) and more complete laws andregulations, China’s commodity futures market is playing an increasingly important role inthe world. Table 2 lists all the commodity futures traded in China in 2012. They are includedin the indices that we will introduce in the following section.
In addition to the rapidly growing volume of the market, China’s commodity futuresmarket exhibits some unique features in terms of market microstructure: (i) the majorparticipants of Chinese market are individual investors, while in the international market,institutional investors account for the largest trading volume;2 (ii) at this stage, the Chinese
1Xin et al. (2006) provide a detailed description of the historical development of China’s commodityfutures market.2For example, in 2007, individual investors accounted for 90 percent of the total trading volume in theZhengzhou Exchange (according to Zhengzhou Exchange official statistics).
Table 1. Statistics of China’s Commodity Futures Market, 2004–2010
Source: Almanac of China’s Finance and Banking Editorial Office, 2011.
Year 2004 2005 2006 2007 2008 2009 2010 Number of listed products 11 13 16 19 20 23 23 Turnover (RMBtn) 14.69 13.45 21.01 40.97 71.9 130.5 227.0 Volume (billion, lot) 0.31 0.32 0.45 0.73 1.36 2.16 3.04

81Impact of Chinese Commodity Futures Market
©2013 Institute of World Economics and Politics, Chinese Academy of Social Sciences
market is open to domestic investors only; (iii) investors are not able to earn interest on thefutures margin; (iv) futures contracts with different expiration dates have different transactionfees and position limits; and (v) the active trading contracts are normally not thoseapproaching expiration. All these features are worthy of further study. More importantly,they may affect the performance of the market. Therefore, it is crucial to obtain a solidunderstanding of the general properties of the Chinese commodity futures market. This willprovide a useful backdrop for various policy assessments.
Most published literature on commodity futures focuses on international markets, andon the US market in particular (e.g. Erb and Harvey, 2006; Gorton and Rouwenhorst, 2006).There is limited research on the institutional characteristics of the Chinese commodityfutures markets (e.g. Williams et al., 1998; Xin et al., 2006) and on specific commodityproducts and phenomena (e.g. Shyy and Butcher, 1994; Fung et al., 2010). As the Chinesecommodity futures market has undergone continuous changes, very few papers focus on
Table 2. Commodity Futures Traded in China, 2012Sector Commodity Exchange Time of listing
Soybean 1 DCE March 2002 Soybean 2 DCE December 2004 Yellow maize DCE September 2004 Soybean pulp DCE July 2000 Palm oil DCE October 2007 Soybean oil DCE January 2006 Cotton CZCE June 2004 Early rice CZCE April 2009 Colza oil CZCE June 2007 Sugar CZCE January 2006 High quality wheat CZCE March 2003
Agriculture
Hard white wheat CZCE March 2008 Metallurgical coke DCE April 2011 LLDPE DCE July 2007 PVC DCE May 2009 PTA CZCE December 2006 Methanol CZCE October 2011 Fuel oil SHFE August 2004 Natural rubber SHFE November 1993
Chemical
Glass CZCE December 2012 Silver SHFE May 2012 Aluminum SHFE October 1992 Gold SHFE January 2008 Copper SHFE March 1993 Lead SHFE March 2011 Deformed steel bars SHFE March 2009 Wire rod SHFE March 2009
Metal
Zinc SHFE March 2007 Sources: Official websites of DCE, CZCE and SHFE.Notes: CZCE, Zhengzhou Commodity Exchange; DCE, Dalian Commodity Exchange; LLDPE, linear
low-density polyethylene; PTA, purified terephthalic acid; PVC, polyvinyl chloride; SHFE, ShanghaiFutures Exchange.

82 Zhiyong Tu et al. / 79–99, Vol. 21, No. 6, 2013
©2013 Institute of World Economics and Politics, Chinese Academy of Social Sciences
the general properties of Chinese commodity futures. Therefore, we will conduct thisresearch using the long-term accumulated data.
In the present paper, we analyze the overall market properties by constructing a set ofindices that incorporate the special features of the Chinese futures market. Constructingindices to study commodity futures at the portfolio level is an approach used extensively inthe analysis of futures’ general properties (e.g. Bodie and Rosansky, 1980; Fama andFrench, 1987; Gorton and Rouwenhorst, 2006). The advantage of this approach is thatindex diversification among a set of commodity futures can reduce the noise inherent inindividual commodity futures data. Therefore, the obtained result can better reflect theproperties of the whole commodity futures market. The present paper contributes to theliterature on emerging markets in the following way: we first modify the traditional indexmethodology and incorporate the special features of Chinese commodity futures, whichenables us to measure Chinese futures market properties more accurately; we also analyzethose properties, such as the return distribution, the risk premium, the diversificationfunction, inflation hedges and international linkages, revealing an increasingly moreimportant role of the Chinese futures market in both the domestic and the global economy.
The remainder of the present paper is structured as follows. Section II introduces themethodology of the construction of Chinese commodity futures indices. In Section III, weoutline the historical performance of China’s commodity futures market. Section IV measuresChinese commodity futures’ risk premiums. Section V analyzes the commodities’ assetdiversification function in China. In Section VI, the connection between the commodityfutures market and the macroeconomic variables is explored. Section VII studies the lead–lag relationship between China’s commodity futures market and the world market. Finally,Section VIII concludes, and some policy implications are provided.
II. Methodology and Data
The commodity futures indices have been widely adopted in the published literature, andthey mostly share two common features: the index is equally weighted and the price of thenearest contract is used for the index construction. An equally-weighted index generallyreflects the performance of “average” commodity futures. The nearest contract price foreach commodity is used because the most active contract is usually the nearest, and,therefore, will provide the most typical price information for that commodity.
When constructing the Chinese commodity futures indices in the present paper, wefollow the equal-weight method typically applied in the published literature. However, wewill not follow the traditional method that uses the nearest contract price in index construction

83Impact of Chinese Commodity Futures Market
©2013 Institute of World Economics and Politics, Chinese Academy of Social Sciences
because in China the nearest contracts of most commodities are very illiquid due to thestrict position control policy for contracts approaching expiration (Jiang and Wu, 2007).Therefore, the prices of the nearest contracts are not typical, and they do not accuratelyreflect the corresponding commodities’ performance. To tackle this problem, we constructour indices using the prices of the two most active contracts instead of those approachingexpiration. We define a commodity’s contract to be the most active one in a particulartrading day, if the average of its daily volume and open interest is the largest among allcontracts of the commodity in that day. Note that the most active contract month variesacross the commodities. Figure 1 provides such an example of several commodities on 30December 2011.
We construct five total return indices in the present paper to study the general propertiesof Chinese commodity futures: two composite indices representing the whole commodityfutures market, and three sub-indices representing three sub-sectors (agriculture, chemicaland metal). First, for each commodity, we compute its daily total return as the average of the
Figure 1. Trading Volume (a) and Open Interest (b) of Copper, Sugarand Purified Terephthalic Acid (PTA), 30 December 2011
(a) (b)
Source: WIND database.Notes: This figure depicts the trading volume and open interest of all contracts for copper, sugar and PTA
on 30 December 2011. The spike of the line in each graph represents the increase of volume or open interest fora particular contract relative to other contracts. This figure shows that the active contracts are not thoseapproaching expiration, and for different commodities, the active contract months are also different. Forexample, the most active contract month for sugar is much later than that for copper.
01/2012 02/2012 03/2012 04/2012 05/2012 06/20120
5
Trad
ing
volu
me Copper
01/2012 02/2012 03/2012 04/2012 05/2012 06/20120
2
4
Ope
n in
tere
st
Copper
01/2012 03/2012 05/2012 07/2012 09/2012 11/20120
1
2
Trad
ing
volu
me Sugar
01/2012 03/2012 05/2012 07/2012 09/2012 11/20120
5
10
Ope
n in
tere
st
Sugar
01/2012 02/2012 03/2012 04/2012 05/2012 06/20120
5
10
Expiration
Trad
ing
volu
me PTA
01/2012 02/2012 03/2012 04/2012 05/2012 06/20120
2
4
Expiration
Ope
n in
tere
st
PTA
x106
x105
x105
x105
x105
x105

84 Zhiyong Tu et al. / 79–99, Vol. 21, No. 6, 2013
©2013 Institute of World Economics and Politics, Chinese Academy of Social Sciences
total returns of its first two most active contracts in a given trading day.3 The two returnsare averaged to reduce the trading noise embedded in the most active contracts (Hong andYogo, 2012). Second, we use an equally-weighted portfolio of all commodities in eachsector to construct the sub-sector index. It is an equal average of the daily total return ofeach commodity within the given sector. Third, we construct the composite index using anequally-weighted portfolio across all three sub-sectors. It averages the total returns of thethree sector indices (Hong and Yogo, 2012). As a robustness check, we further construct analternative composite index by equally weighting across all individual commodities in themarket (Gorton and Rouwenhorst, 2006). It averages the total returns of all commodities.Our results show no qualitative differences between these two composite indices whenexamining the Chinese market properties. The formula of the sector index is provided asfollows. The composite index is just the equal average of three sector indices:
1
1 ( 1 2 ) / 2N
t i t i ti
I n d e x R A R AN =
= +∑ , (1)
where N is the number of commodities included in the sector, RA1it is the daily total returnof the first most active contract of commodity i and RA2it is the daily total return of thesecond most active contract of commodity i.
The reason we present our analysis using the composite index with equal weight acrosssectors is that the number of agricultural products is nearly half that of the total number ofproducts traded in China’s commodity futures market, while their turnover is much lower. Theequal-weighting across commodities might overestimate the influence of the agricultural sector.
To better reflect the short-term characteristics of the commodity futures returns, we usedaily data (Kat and Oomen, 2006a,b) to construct all indices, which means that we need tocarry out daily rebalancing for all the indices. All trading data of the Chinese commodityfutures market are from the WIND database.4 The timeframe of our analysis is from January2000 to December 2011. Chinese futures data become more reliable after 2000 because theTemporary Decree on Futures Transactions was promulgated by the State Council in thisyear, which symbolized the establishment of a unified, consistent and complete tradingstandard in the Chinese commodity futures market. Therefore, we adopt 12-year data (2000–2011) to conduct our research, which is long enough to measure the risk premiums of thecommodity futures market.
3The daily total return of each contract is computed as the arithmetic return plus the current accountinterest rate.4WIND is a major financial data provider in China.

85Impact of Chinese Commodity Futures Market
©2013 Institute of World Economics and Politics, Chinese Academy of Social Sciences
III. Performance of Chinese Commodity Futures Market
To obtain a general picture of the Chinese commodity futures market over the past 12 years,we first look at the trends of five total return futures indices, depicted in Figure 2.
From January 2000 to December 2011, the development of the whole Chinese commodityfutures market shows an upward trend, with the chemical and the agricultural sectorsdisplaying the highest and the lowest rises, respectively. In terms of volatility, both thechemical and the metal sectors are much more volatile than the agricultural sector. Twocomposite indices perform closely before year 2004, and then the equally-weighting-sectorindex moves above the equally-weighting-commodity index consistently thereafter becauseof the relatively weaker performance of agricultural commodities after 2004.
How do the commodity futures perform in comparison to the other assets in China?Table 3 provides descriptive statistics for three major assets in China: commodity futures,stocks and bonds. Note that Chinese stocks and bonds are relatively more independentfrom the world market than the commodity futures; it is interesting to examine whether therelations among these assets have common features of the world market.
As reported in Table 3, the composite commodity index, with a daily return of 0.000161,earns a higher return than the composite bond index (0.000106), but a smaller return thanthe composite stock index (0.000394). Higher return corresponds to higher risk. Notsurprisingly, its volatility (standard deviation) also falls between them. Within thecommodities, the chemical and agricultural indices generate the highest and the lowestreturn, and also the highest and the lowest volatility, respectively. Among the three asset
Figure 2. Trends of Five Total Return Commodity Futures Indices of Chinese Market,January 2000–December 2011
2 000 20 00 2001 20 02 200 3 2004 200 4 2 005 200 6 2 007 20 08 200 9 20 09 201 0 2 0110
5 0
10 0
15 0
20 0
25 0
30 0
Year
Inde
x
Agricultu reCh emicalM eta lCo mpo siteCo mpo site al t
Source: All indices are calculated by the authors based on the methodology in Section II.Notes: In Figure 2, “composite” is the composite index obtained by equally weighting each sector, and“composite 2” is the composite index obtained by equally weighting each commodity.
2

86 Zhiyong Tu et al. / 79–99, Vol. 21, No. 6, 2013
©2013 Institute of World Economics and Politics, Chinese Academy of Social Sciences
classes, the commodity futures’ return is the most left-skewed, and the least peaked. Thisfeature contrasts sharply with overseas counterparts. For example, Gorton and Rouwenhorst(2006) find that the commodity futures’ returns are the most right-skewed, and the mostpeaked compared with stocks and bonds in the US market. It is the small individual investorswho dominate the Chinese futures market, and this may be caused by the different behaviorof traders between two countries. In terms of asset correlation, the commodity index weaklycorrelates with the stock index and negatively correlates with the bond index. This findingconcurs with the published literature (e.g. Gorton and Rouwenhorst, 2006; Kat and Oomen,2006a,b), although the correlations of commodity futures with stocks and bonds appear tobe relatively larger in China. The futures market microstructure may explain thoseperformance differences across countries. In the next section, we will measure the riskpremiums of commodity futures in China.
IV. Risk Premium
Commodity futures are zero cost securities; namely, they do not require an initial investment.Returns on commodity futures are related to the risk premiums and the performance ofbuyers and sellers. The theory of normal backwardation states that the risk premium will, on
Table 3. Descriptive Statistics of Daily Returns of Futures, Bonds and Stocks in China, 2011
Source: Calculated by authors.Notes: Table 3 reports the mean, the standard deviation, the correlation and other statistical attributes
for the three major asset classes (stock, bond and commodity futures) in China. The data used forgenerating daily returns start at different dates for different assets, but all end in December 2011. Thefirst observation of each index is reported in the first column of the table. Except for those commodityindices, all other indices are from the S&P/CITIC index series from the WIND database.
First observation
Index Arithmetic mean
Standard deviation
Skew Kurt Signed rank test (p-value)
1 June 2000 Commodity composite 0.000161 0.007932 –0.506810 6.427558 0.007863 1 June 2000 Agriculture 0.000088 0.007233 –0.351445 6.557868 0.066225 1 May 2000 Chemical 0.000220 0.011457 –0.446026 5.794071 0.007263 1 April 2000 Metal 0.000176 0.010459 –0.309023 5.295558 0.022887 1 April 2000 Stock composite 0.000394 0.017545 –0.137062 6.553704 0.004424 1 March 2004 Small cap stock 0.000582 0.021224 –0.518748 5.341132 0.000191 1 March 2004 Large cap stock 0.000463 0.018772 –0.120401 5.709015 0.083359 5 August 2002 Bond composite 0.000106 0.000855 –0.436966 18.026664 0.000000 1 June 2000 Government bond 0.000146 0.001320 –0.773613 46.980564 0.000000 1 April 2000 Corporate bond 0.000189 0.001615 –0.477051 26.688348 0.000000 27 March 2002 Interbank bond 0.000115 0.001196 0.134408 34.697038 0.000000 2 April 2003 Convertible bond 0.000487 0.010722 –0.669246 12.382199 0.000392
Correlation matrix Commodity composite Agriculture Chemical Metal Total stock Composite bond
1.000000 0.733325 0.857849 0.827731 0.205518 –0.024534 0.000000 1.000000 0.481926 0.448550 0.158779 –0.044510 0.000000 0.000000 1.000000 0.522597 0.144599 –0.026466 0.000000 0.000000 0.000000 1.000000 0.199260 0.002200 0.000000 0.000000 0.000000 0.000000 1.000000 0.023106 0.000000 0.000000 0.000000 0.000000 0.000000 1.000000
87Impact of Chinese Commodity Futures Market
©2013 Institute of World Economics and Politics, Chinese Academy of Social Sciences
average, accrue to buyers (e.g. Keynes, 1930; Hicks, 1939). In the backward market,commodity hedgers would offer a positive risk premium to speculators for bearing the pricefluctuation risk.
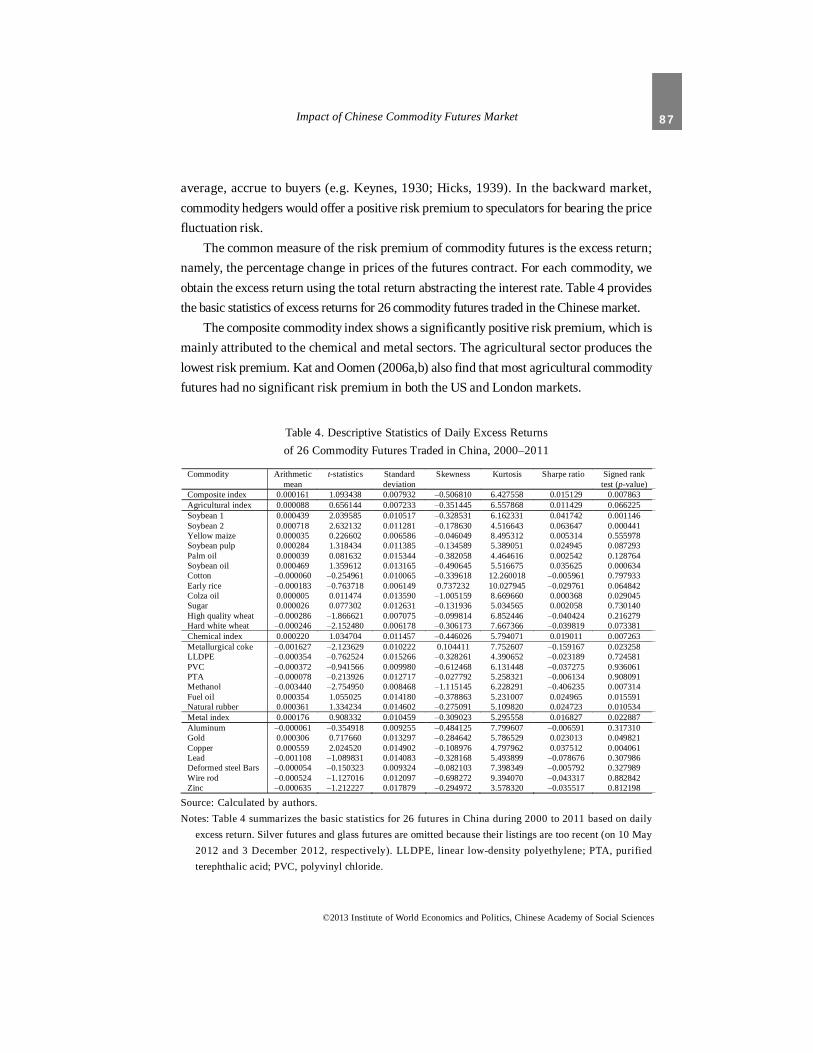
The common measure of the risk premium of commodity futures is the excess return;namely, the percentage change in prices of the futures contract. For each commodity, weobtain the excess return using the total return abstracting the interest rate. Table 4 providesthe basic statistics of excess returns for 26 commodity futures traded in the Chinese market.
The composite commodity index shows a significantly positive risk premium, which ismainly attributed to the chemical and metal sectors. The agricultural sector produces thelowest risk premium. Kat and Oomen (2006a,b) also find that most agricultural commodityfutures had no significant risk premium in both the US and London markets.
Table 4. Descriptive Statistics of Daily Excess Returnsof 26 Commodity Futures Traded in China, 2000–2011
Source: Calculated by authors.Notes: Table 4 summarizes the basic statistics for 26 futures in China during 2000 to 2011 based on daily
excess return. Silver futures and glass futures are omitted because their listings are too recent (on 10 May2012 and 3 December 2012, respectively). LLDPE, linear low-density polyethylene; PTA, purifiedterephthalic acid; PVC, polyvinyl chloride.
Commodity Arithmetic mean
t-statistics Standard deviation
Skewness Kurtosis Sharpe ratio Signed rank test (p-value)
Composite index 0.000161 1.093438 0.007932 –0.506810 6.427558 0.015129 0.007863 Agricultural index 0.000088 0.656144 0.007233 –0.351445 6.557868 0.011429 0.066225 Soybean 1 0.000439 2.039585 0.010517 –0.328531 6.162331 0.041742 0.001146 Soybean 2 0.000718 2.632132 0.011281 –0.178630 4.516643 0.063647 0.000441 Yellow maize 0.000035 0.226602 0.006586 –0.046049 8.495312 0.005314 0.555978 Soybean pulp 0.000284 1.318434 0.011385 –0.134589 5.389051 0.024945 0.087293 Palm oil 0.000039 0.081632 0.015344 –0.382058 4.464616 0.002542 0.128764 Soybean oil 0.000469 1.359612 0.013165 –0.490645 5.516675 0.035625 0.000634 Cotton –0.000060 –0.254961 0.010065 –0.339618 12.260018 –0.005961 0.797933 Early rice –0.000183 –0.763718 0.006149 0.737232 10.027945 –0.029761 0.064842 Colza oil 0.000005 0.011474 0.013590 –1.005159 8.669660 0.000368 0.029045 Sugar 0.000026 0.077302 0.012631 –0.131936 5.034565 0.002058 0.730140 High quality wheat –0.000286 –1.866621 0.007075 –0.099814 6.852446 –0.040424 0.216279 Hard white wheat –0.000246 –2.152480 0.006178 –0.306173 7.667366 –0.039819 0.073381 Chemical index 0.000220 1.034704 0.011457 –0.446026 5.794071 0.019011 0.007263 Metallurgical coke –0.001627 –2.123629 0.010222 0.104411 7.752607 –0.159167 0.023258 LLDPE –0.000354 –0.762524 0.015266 –0.328261 4.390652 –0.023189 0.724581 PVC –0.000372 –0.941566 0.009980 –0.612468 6.131448 –0.037275 0.936061 PTA –0.000078 –0.213926 0.012717 –0.027792 5.258321 –0.006134 0.908091 Methanol –0.003440 –2.754950 0.008468 –1.115145 6.228291 –0.406235 0.007314 Fuel oil 0.000354 1.055025 0.014180 –0.378863 5.231007 0.024965 0.015591 Natural rubber 0.000361 1.334234 0.014602 –0.275091 5.109820 0.024723 0.010534 Metal index 0.000176 0.908332 0.010459 –0.309023 5.295558 0.016827 0.022887 Aluminum –0.000061 –0.354918 0.009255 –0.484125 7.799607 –0.006591 0.317310 Gold 0.000306 0.717660 0.013297 –0.284642 5.786529 0.023013 0.049821 Copper 0.000559 2.024520 0.014902 –0.108976 4.797962 0.037512 0.004061 Lead –0.001108 –1.089831 0.014083 –0.328168 5.493899 –0.078676 0.307986 Deformed steel Bars –0.000054 –0.150323 0.009324 –0.082103 7.398349 –0.005792 0.327989 Wire rod –0.000524 –1.127016 0.012097 –0.698272 9.394070 –0.043317 0.882842 Zinc –0.000635 –1.212227 0.017879 –0.294972 3.578320 –0.035517 0.812198

88 Zhiyong Tu et al. / 79–99, Vol. 21, No. 6, 2013
©2013 Institute of World Economics and Politics, Chinese Academy of Social Sciences
If we look at the specific commodities, among 26 commodities listed in Table 4, there are13 that display significant excess returns. Among 13, 9 have positive excess returns, and 4report negative excess returns. Within each sector, those commodities that produce thelargest risk premiums (daily excess returns) are: soybean 2 in the agricultural sector (0.000718),copper in the metal sector (0.000559) and rubber in the chemical sector (0.000361). Soybeanpulp is highly correlated with soybean 2, while much more liquid than it. It has a dailyexcess return of 0.000284. Soybean pulp, copper and rubber are the three most heavilytraded products in the Chinese commodity futures market, taking 57.7 percent of the totalmarket turnover in the first half of 2012. In contrast, four commodities with significantlynegative excess returns (early rice, hard wheat, metallurgical coke and methanol) take only0.22 percent of the total market turnover during the same period.5 Obviously, the Chinesecommodity futures market displays a strong feature of normal backwardation. A long positionof a commodity futures portfolio in China will generally yield a positive risk premium.
V. Asset Allocation
Commodity futures have long been considered an effective diversification tool for traditionalasset portfolios. In the related published literature, Lintner (1983) finds that portfolios ofstocks and bonds diversified with managed commodity futures show substantially lessrisk in terms of expected return. The underlying reason is that commodity futures fundsusually have low correlations with other traditional assets. In China, the managed futuresfunds are few in number because they are not explicitly allowed under the current regulatoryframework. In 2012, the China Securities Regulatory Commission issued asset managementlicenses to qualified futures companies, which may lead to a quick boom of commoditytrading advisor funds in China in the near future.
The traditional assets in China, such as stocks and bonds, show substantially weakerinternational correlation than commodities futures. It is not clear whether the widely accepteddiversification function of commodity futures is also applied in the Chinese market, whichis what we focus on in this section. Because there are no managed futures data currentlyavailable for the Chinese market, we use our total return index to carry out the asset allocationanalysis for both the active and the passive traditional assets portfolios.
The total return index represents a passive long-position-only strategy. Because thetotal return index is composed of liquid active contracts, it can be replicated easily in theform of a real portfolio. We will first test whether this commodity index can diversify those
5These figures are calculated by the authors using data from the WIND database.

89Impact of Chinese Commodity Futures Market
©2013 Institute of World Economics and Politics, Chinese Academy of Social Sciences
mutual funds of stocks that follow active strategies. Elton et al. (1987) show that an assetshould be added into the optimal portfolio as long as:
pc
c pc p
R rR rρ
σ σ
−−≥
, (2)
where Rc represents the expected return of the commodity index, r is the risk-free rate, cσ
denotes the standard deviation of the commodity index, Rp stands for the expected return
of the mutual fund portfolio, pσ is the standard deviation of the portfolio, and cpρ represents
the correlation coefficient between the commodity index and the portfolio.We choose 10 best-performed mutual funds over 2009 to 2010, and investigate the
possibility of enhancing the mutual funds’ performance by incorporating commodity futures.From Table 5, we can find that the 10 best-performing mutual funds can be further improvedby incorporating the commodity index.
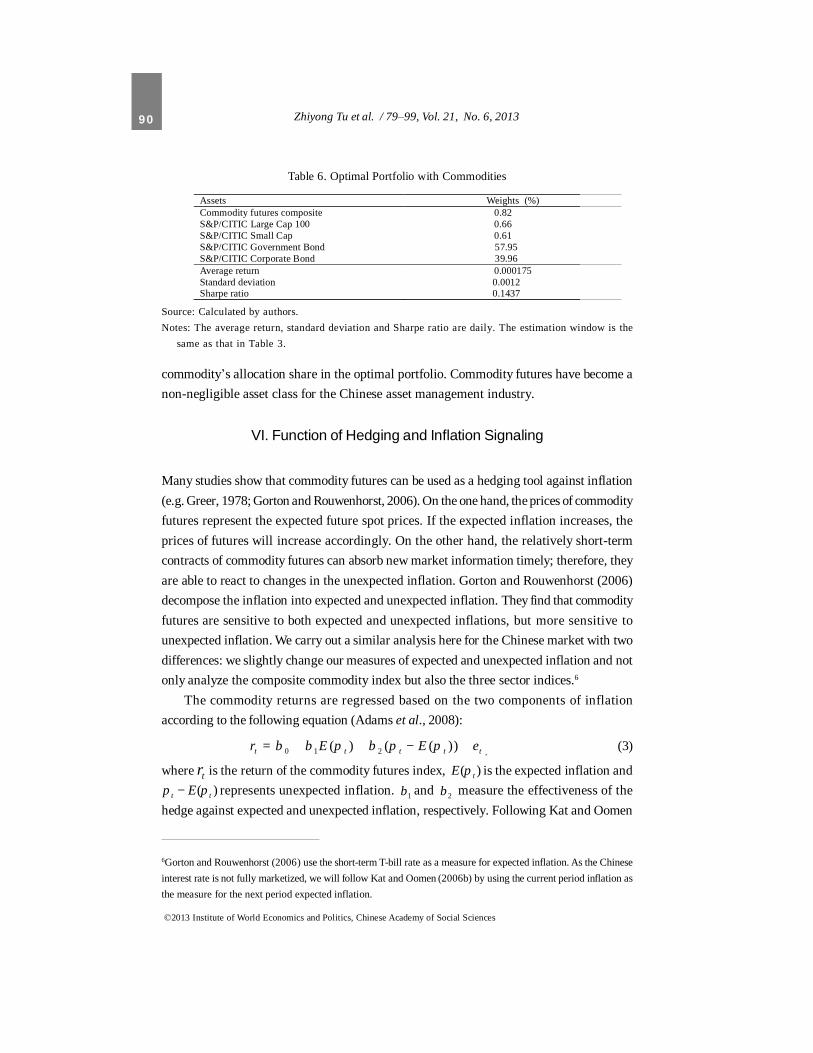
Then we consider a virtual portfolio that includes all kinds of market indices in China.The role of the commodity futures in the optimal portfolio is further investigated, whichmay be of interest to institutional investors in terms of optimizing their asset allocation. Weuse the S&P/CITIC Large Cap 100, the S&P/CITIC Small Cap, the S&P/CITIC GovernmentBond Index, the S&P/CITIC Corporate Bond Index and the total return commodity index torepresent different asset classes. The optimal portfolios are calculated with and without theshort-sale constraint, both of which turn out to produce the same result. Table 6 presentsthe optimal allocation of different asset classes holding the portfolio standard deviation at0.0012. Compared to Table 3, the optimal portfolio improves the Sharpe ratio for everysingle asset. The bonds take the largest percentage of the portfolio, and the commodityfutures index takes 0.82 percent only (see Table 6), leading to a daily portfolio return of0.000175. Setting a higher portfolio return target, using a managed futures index or utilizingthe commodity index with other weighting standards may substantially increase the
Table 5. Diversification Function of Commodity Index to Mutual Funds of Stocks, 2009–2010
Exchange codes of mutual funds
Annualized daily return of net value (%)
p
p
R rσ
− c pρ pc
cpc p
R rR rρ
σ σ−−
≥
150001.SZ 79.0299 0.1364 0.3783 Yes 000011.OF 45.4510 0.1902 0.4164 Yes 519087.OF 44.0715 0.1880 0.3846 Yes 519001.OF 43.5578 0.1835 0.4033 Yes 519696.OF 42.3537 0.1637 0.4056 Yes 180013.OF 41.8785 0.1620 0.3712 Yes 320006.OF 40.8372 0.1726 0.3517 Yes 002031.OF 40.3690 0.1775 0.3767 Yes 260109.OF 39.8206 0.1581 0.3852 Yes 400003.OF 39.5395 0.1672 0.4364 Yes 150001.SZ 79.0299 0.1364 0.3783 Yes
Source: Calculated by authors.
90 Zhiyong Tu et al. / 79–99, Vol. 21, No. 6, 2013
©2013 Institute of World Economics and Politics, Chinese Academy of Social Sciences
commodity’s allocation share in the optimal portfolio. Commodity futures have become anon-negligible asset class for the Chinese asset management industry.
VI. Function of Hedging and Inflation Signaling
Many studies show that commodity futures can be used as a hedging tool against inflation(e.g. Greer, 1978; Gorton and Rouwenhorst, 2006). On the one hand, the prices of commodityfutures represent the expected future spot prices. If the expected inflation increases, theprices of futures will increase accordingly. On the other hand, the relatively short-termcontracts of commodity futures can absorb new market information timely; therefore, theyare able to react to changes in the unexpected inflation. Gorton and Rouwenhorst (2006)decompose the inflation into expected and unexpected inflation. They find that commodityfutures are sensitive to both expected and unexpected inflations, but more sensitive tounexpected inflation. We carry out a similar analysis here for the Chinese market with twodifferences: we slightly change our measures of expected and unexpected inflation and notonly analyze the composite commodity index but also the three sector indices.6
The commodity returns are regressed based on the two components of inflationaccording to the following equation (Adams et al., 2008):
0 1 2( ) ( ( ))t t t t tr E E eβ β π β π π= + + − + , (3)
where tr is the return of the commodity futures index, )( tE π is the expected inflation and)( tt E ππ − represents unexpected inflation. 1β and 2β measure the effectiveness of the
hedge against expected and unexpected inflation, respectively. Following Kat and Oomen
6Gorton and Rouwenhorst (2006) use the short-term T-bill rate as a measure for expected inflation. As the Chineseinterest rate is not fully marketized, we will follow Kat and Oomen (2006b) by using the current period inflation asthe measure for the next period expected inflation.
Table 6. Optimal Portfolio with Commodities
Source: Calculated by authors.Notes: The average return, standard deviation and Sharpe ratio are daily. The estimation window is the
same as that in Table 3.
Assets Weights (%) Commodity futures composite 0.82 S&P/CITIC Large Cap 100 0.66 S&P/CITIC Small Cap 0.61 S&P/CITIC Government Bond 57.95 S&P/CITIC Corporate Bond 39.96 Average return 0.000175 Standard deviation 0.0012 Sharpe ratio 0.1437

91Impact of Chinese Commodity Futures Market
©2013 Institute of World Economics and Politics, Chinese Academy of Social Sciences
(2006b), we use the current period inflation as the best expectation for the next period
inflation assuming a naïve projection. Hence, 1( )t tE π π −= , and )( tt E ππ − equals 1−− tt ππ .
The composite index and three sector indices are regressed separately according to Equation (2).We use monthly data instead of daily data from January 2000 to December 2011 because theinflation rate is only reported monthly. Table 7 shows the results.
It is evident that the composite index provides significant hedging against both expectedand unexpected inflation, and the hedging effect is even larger for unexpected inflationwith a significant coefficient (1.4364) in Table 7. The agricultural sub-index has a similarresult to the composite, but it better hedges against the expected inflation than unexpectedinflation. This is because food and beverage takes the largest weight in China’s CPIcomposition.7 In contrast, metal and chemical sub-indices only offer significant hedgingagainst unexpected inflation, but not against expected inflation.
We also test whether stocks or bonds in China have the inflation hedging property.The results in Table 8 show that neither stocks nor bonds are significantly related to eitherexpected or unexpected inflation. This is quite different from the results in the US market.Gorton and Rouwenhorst (2006) find that stocks and bonds are negatively influenced byinflation in a relatively short holding period, while Bekaert and Engstrom (2010) point outthat the equity yields are positively affected by inflation in a longer horizon.
The insensitiveness of stocks and bonds to inflation in China is the result of lessefficient Chinese stock and bond markets.8 Therefore, the information concerning theaggregate price level cannot be effectively transformed into the asset returns. In contrast,commodities are more directly linked to the aggregate price level. In particular, the weight offood and beverage in the CPI composition in China reached 33 percent in 2010 (see footnote 7),
7According to the National Bureau of Statistics of China, in 2010, CPI in China consisted of housing (16 percent),food and beverage (33 percent), transport (10 percent), medical care (8 percent), apparel (9 percent), entertainment(6 percent), home appliances (4 percent) and other (12 percent).8For example, the Chinese stock market is plagued with various institutional and corporate problems, and theChinese bond market does not have a fully marketized interest rate yet.
Table 7. Estimation Results of Inflation Hedge Property of Commodity Futures
Source: Calculated by authors.Note: ***, ** and * denote that the estimated coefficients are significant at the 1, 5 and 10-percent level, respectively.
Constant Expected inflation Unexpected inflation Composite index 0.0014 1.4197** 1.4364*** Metal sector 0.0041 0.8404 1.3171* Chemical sector 0.0046 1.6238 1.8465* Agricultural sector 0.0009 1.3367** 1.1150**

92 Zhiyong Tu et al. / 79–99, Vol. 21, No. 6, 2013
©2013 Institute of World Economics and Politics, Chinese Academy of Social Sciences
more than two times the weight in the USA.9 This makes the agricultural commodity futuresthe most effective asset to hedge the inflation in China.
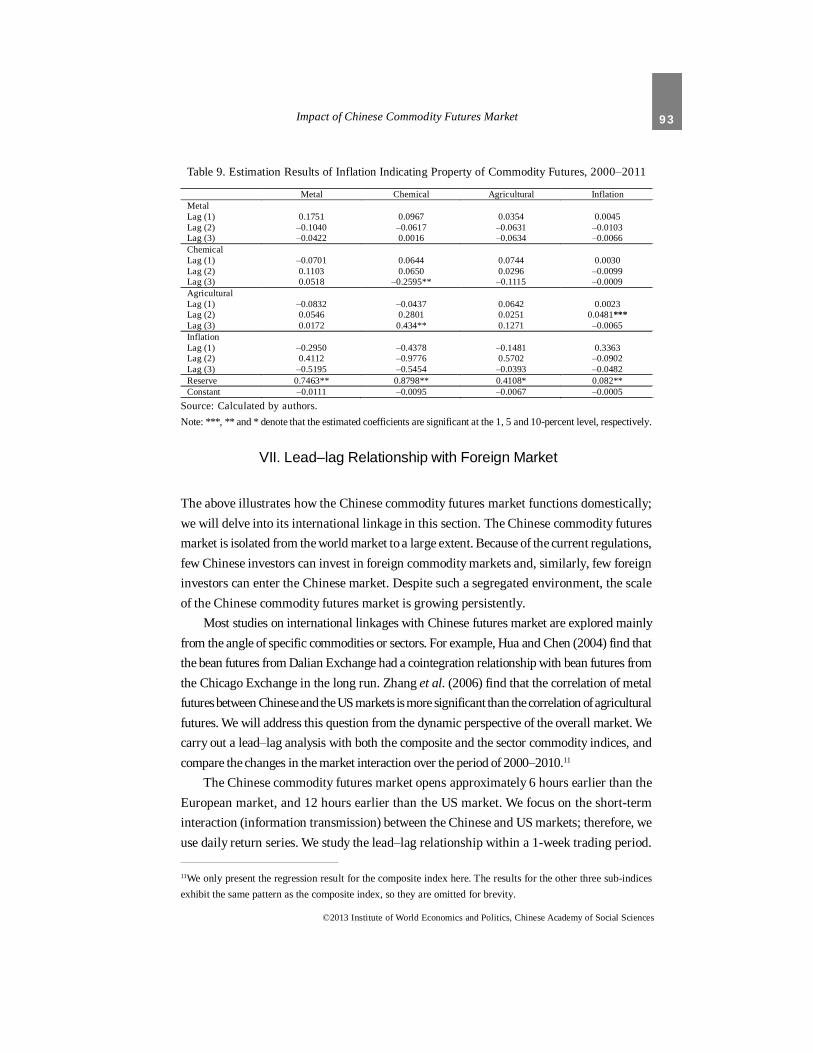
Besides the instant correlation with inflation, commodity futures also indicate futureinflation (e.g. Bordo, 1980; Garner, 1995).10 We use a VARX model to investigate thecommodity futures’ inflation forecasting ability. We regress the vector of excess returns ofmetal, chemical and agricultural sectors, and the inflation rate, using foreign exchangereserves as the exogenous control variable, because foreign exchange reserves can reflectthe effect of so called “imported inflation” via China’s current or capital account. All returnsare calculated monthly based on the daily excess returns, and the inflation rate is calculatedfrom monthly CPI over the period of January 2000 to December 2011. All variables pass theaugmented Dickey–Fuller unit-root test for stationarity. Furthermore, by using the Akaikeinformation criterion and analyzing the estimated residuals to avoid significantautocorrelation, a VARX (3, 0) model is specified. Let '( , , , )m c a
t t t t tY r r r i= , where theelements in the vector are the excess returns of metal, chemical and agricultural sectors, andthe inflation rate, respectively. Then the regression is:
0 1 1 2 2 3 3 4 Ret t t t t tY Y Y Y eα α α α α− − −= + + + + + , (4)
where Ret is the vector of foreign exchange reserves. Table 9 shows the regression results.From Table 9, we find that there exists a one-way relationship between the inflation rate
and the agricultural futures return. The coefficient of the second lagged agricultural futuresreturn is very significant, implying that the agricultural futures return can indicate the inflation2 months ahead. In contrast, the lagged inflation rate does not affect the agricultural futuresreturn. Neither metal nor chemical returns can significantly influence the inflation rate.
Table 8. Estimation Results of Inflation Hedge Property of Stock and Bond
Constant Expected inflation Unexpected inflation Stock 0.0006* 1.5167 0.2213 Bond 0.0031*** –0.1255 0.1255
Source: Calculated by authors.Notes: Regression results are obtained using the same methodology and time window as inTable 7. ***, **and *
denote that the estimated coefficients are significant at 1, 5 and 10-percent level, respectively.
9The US CPI composition for 2010 can be found from the Bureau of Labor Statistics, US Department of Labor.Available from: www.bls.gov.10Some explanations include: commodity futures trade in highly efficient auction markets, so commodity futuresprices can move more quickly in response to actual or expected changes in supply or demand than other indicators.By contrast, prices of most final goods and services are restrained by contractual arrangements and other transactionfrictions, so they respond more slowly to supply and demand pressures (Garner, 1995).
93Impact of Chinese Commodity Futures Market
©2013 Institute of World Economics and Politics, Chinese Academy of Social Sciences
VII. Lead–lag Relationship with Foreign Market
The above illustrates how the Chinese commodity futures market functions domestically;we will delve into its international linkage in this section. The Chinese commodity futuresmarket is isolated from the world market to a large extent. Because of the current regulations,few Chinese investors can invest in foreign commodity markets and, similarly, few foreigninvestors can enter the Chinese market. Despite such a segregated environment, the scaleof the Chinese commodity futures market is growing persistently.
Most studies on international linkages with Chinese futures market are explored mainlyfrom the angle of specific commodities or sectors. For example, Hua and Chen (2004) find thatthe bean futures from Dalian Exchange had a cointegration relationship with bean futures fromthe Chicago Exchange in the long run. Zhang et al. (2006) find that the correlation of metalfutures between Chinese and the US markets is more significant than the correlation of agriculturalfutures. We will address this question from the dynamic perspective of the overall market. Wecarry out a lead–lag analysis with both the composite and the sector commodity indices, andcompare the changes in the market interaction over the period of 2000–2010.11
The Chinese commodity futures market opens approximately 6 hours earlier than theEuropean market, and 12 hours earlier than the US market. We focus on the short-terminteraction (information transmission) between the Chinese and US markets; therefore, weuse daily return series. We study the lead–lag relationship within a 1-week trading period.
11We only present the regression result for the composite index here. The results for the other three sub-indicesexhibit the same pattern as the composite index, so they are omitted for brevity.
Table 9. Estimation Results of Inflation Indicating Property of Commodity Futures, 2000–2011
Source: Calculated by authors.Note: ***, ** and * denote that the estimated coefficients are significant at the 1, 5 and 10-percent level, respectively.
Metal Chemical Agricultural Inflation Metal Lag (1) 0.1751 0.0967 0.0354 0.0045 Lag (2) –0.1040 –0.0617 –0.0631 –0.0103 Lag (3) –0.0422 0.0016 –0.0634 –0.0066 Chemical Lag (1) –0.0701 0.0644 0.0744 0.0030 Lag (2) 0.1103 0.0650 0.0296 –0.0099 Lag (3) 0.0518 –0.2595** –0.1115 –0.0009 Agricultural Lag (1) –0.0832 –0.0437 0.0642 0.0023 Lag (2) 0.0546 0.2801 0.0251 0.0481*** Lag (3) 0.0172 0.434** 0.1271 –0.0065 Inflation Lag (1) –0.2950 –0.4378 –0.1481 0.3363 Lag (2) 0.4112 –0.9776 0.5702 –0.0902 Lag (3) –0.5195 –0.5454 –0.0393 –0.0482 Reserve 0.7463** 0.8798** 0.4108* 0.082** Constant –0.0111 –0.0095 –0.0067 –0.0005
94 Zhiyong Tu et al. / 79–99, Vol. 21, No. 6, 2013
©2013 Institute of World Economics and Politics, Chinese Academy of Social Sciences
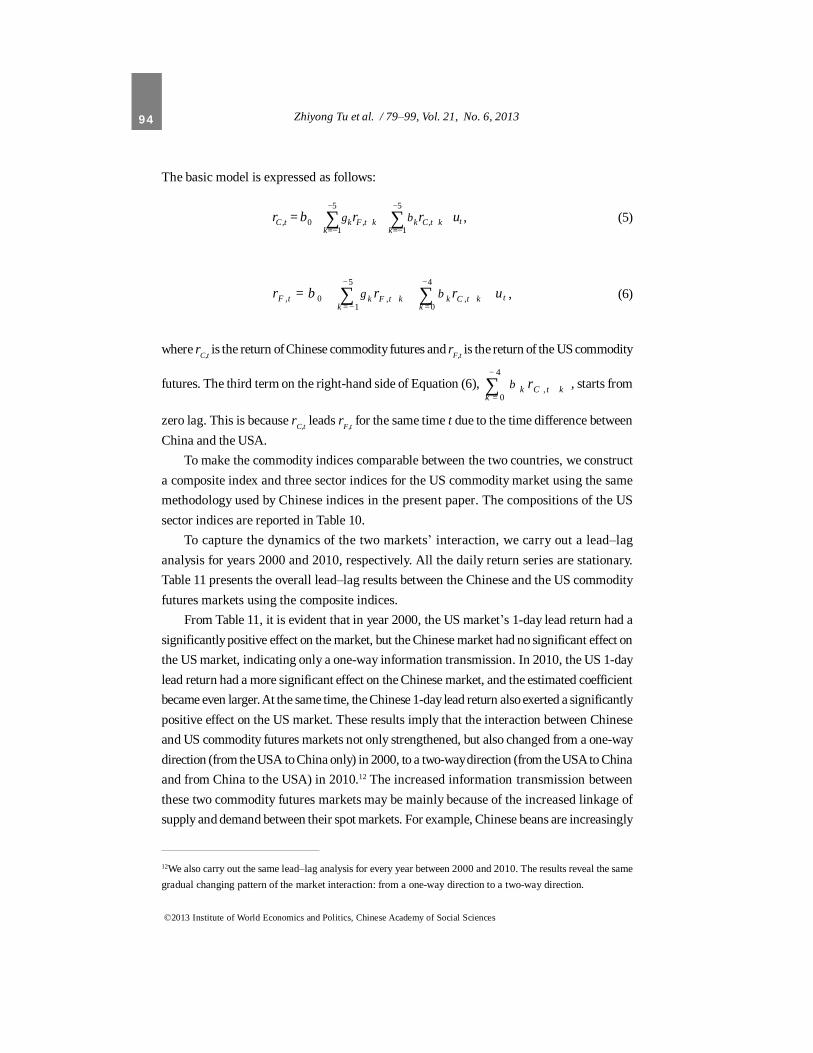
The basic model is expressed as follows:
5 5
, 0 , ,1 1
tC t k F t k k C t kk k
r r r uγ ββ− −
+ +=− =−
+= + +∑ ∑ , (5)
5 4
, 0 , ,1 0
tF t k F t k k C t kk k
r r r uγ ββ− −
+ += − =
+= + +∑ ∑ , (6)
where rC,t is the return of Chinese commodity futures and rF,t is the return of the US commodity
futures. The third term on the right-hand side of Equation (6), 4
,0
k C t kk
rβ−
+=
∑ , starts from
zero lag. This is because rC,t leads rF,t for the same time t due to the time difference betweenChina and the USA.
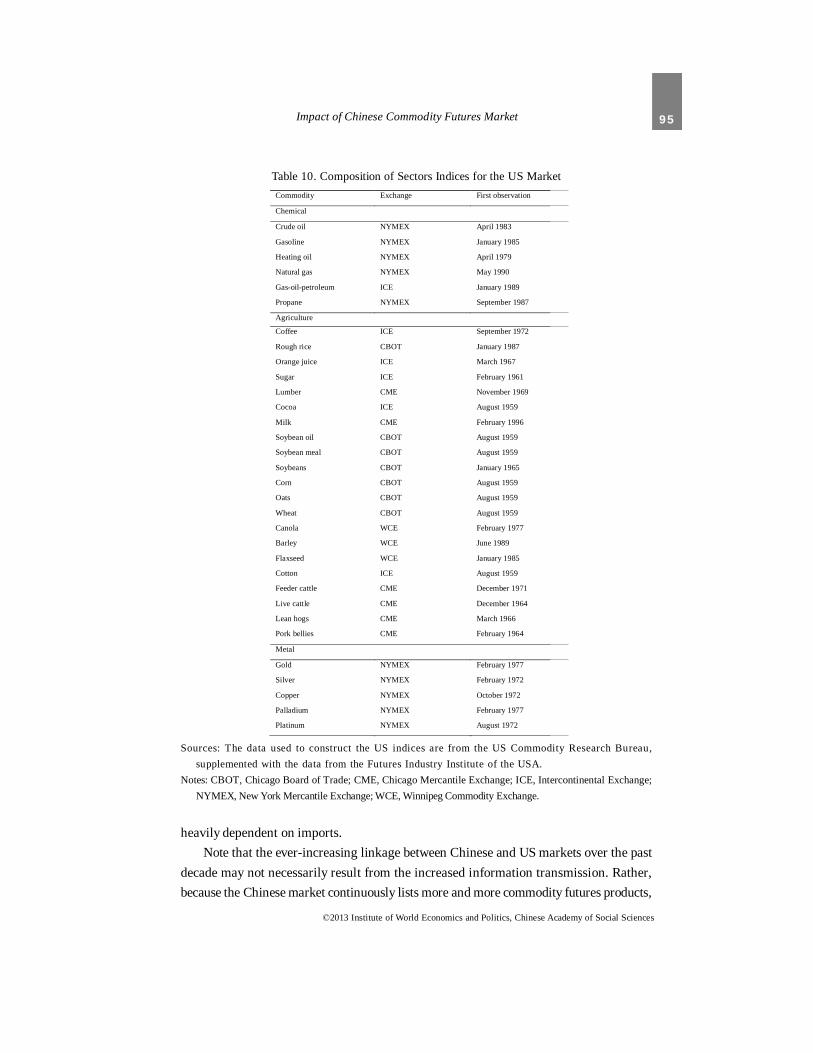
To make the commodity indices comparable between the two countries, we constructa composite index and three sector indices for the US commodity market using the samemethodology used by Chinese indices in the present paper. The compositions of the USsector indices are reported in Table 10.
To capture the dynamics of the two markets’ interaction, we carry out a lead–laganalysis for years 2000 and 2010, respectively. All the daily return series are stationary.Table 11 presents the overall lead–lag results between the Chinese and the US commodityfutures markets using the composite indices.
From Table 11, it is evident that in year 2000, the US market’s 1-day lead return had asignificantly positive effect on the market, but the Chinese market had no significant effect onthe US market, indicating only a one-way information transmission. In 2010, the US 1-daylead return had a more significant effect on the Chinese market, and the estimated coefficientbecame even larger. At the same time, the Chinese 1-day lead return also exerted a significantlypositive effect on the US market. These results imply that the interaction between Chineseand US commodity futures markets not only strengthened, but also changed from a one-waydirection (from the USA to China only) in 2000, to a two-way direction (from the USA to Chinaand from China to the USA) in 2010.12 The increased information transmission betweenthese two commodity futures markets may be mainly because of the increased linkage ofsupply and demand between their spot markets. For example, Chinese beans are increasingly
12We also carry out the same lead–lag analysis for every year between 2000 and 2010. The results reveal the samegradual changing pattern of the market interaction: from a one-way direction to a two-way direction.
95Impact of Chinese Commodity Futures Market
©2013 Institute of World Economics and Politics, Chinese Academy of Social Sciences
heavily dependent on imports.Note that the ever-increasing linkage between Chinese and US markets over the past
decade may not necessarily result from the increased information transmission. Rather,because the Chinese market continuously lists more and more commodity futures products,
Table 10. Composition of Sectors Indices for the US MarketCommodity Exchange First observation
Chemical
Crude oil NYMEX April 1983
Gasoline NYMEX January 1985
Heating oil NYMEX April 1979
Natural gas NYMEX May 1990
Gas-oil-petroleum ICE January 1989
Propane NYMEX September 1987
Agriculture
Coffee ICE September 1972
Rough rice CBOT January 1987
Orange juice ICE March 1967
Sugar ICE February 1961
Lumber CME November 1969
Cocoa ICE August 1959
Milk CME February 1996
Soybean oil CBOT August 1959
Soybean meal CBOT August 1959
Soybeans CBOT January 1965
Corn CBOT August 1959
Oats CBOT August 1959
Wheat CBOT August 1959
Canola WCE February 1977
Barley WCE June 1989
Flaxseed WCE January 1985
Cotton ICE August 1959
Feeder cattle CME December 1971
Live cattle CME December 1964
Lean hogs CME March 1966
Pork bellies CME February 1964
Metal
Gold NYMEX February 1977
Silver NYMEX February 1972
Copper NYMEX October 1972
Palladium NYMEX February 1977
Platinum NYMEX August 1972
Sources: The data used to construct the US indices are from the US Commodity Research Bureau,supplemented with the data from the Futures Industry Institute of the USA.
Notes: CBOT, Chicago Board of Trade; CME, Chicago Mercantile Exchange; ICE, Intercontinental Exchange;NYMEX, New York Mercantile Exchange; WCE, Winnipeg Commodity Exchange.

96 Zhiyong Tu et al. / 79–99, Vol. 21, No. 6, 2013
©2013 Institute of World Economics and Politics, Chinese Academy of Social Sciences
it may make the Chinese market increasingly resemble the US market. Indeed, over the pastdecade, the Chinese commodity futures market listed many commodities that are alreadytraded in the US market, and are mainly in the agricultural sector. However, through a closercomparison of Tables 2 and 10, we find that the Chinese futures market also listed manyproducts that were not traded in the USA. Take the chemical sector, for example: in year2000, the Chinese market only listed rubber. By 2010 an additional four commodities werelisted: fuel oil, LLPPE, PVC and PTA. Only fuel oil resembles heating oil in the US market,and the other three are not listed in the US market.
Because our indices adopt the equal-weight methodology, the Chinese chemical indexis more different from that in the USA in terms of its composition in year 2010 than year2000. However, from the lead–lag analysis using the chemical indices, we find that thechemical indices between the two countries displayed the same pattern as the compositeindices: one-way influence in year 2000 and two-way influence in 2010. This pattern alsoapplies to the other sector indices. These results strongly suggest that over the pastdecade, the information linkage between the Chinese commodity futures market and theworld market has strengthened considerably. The Chinese market now becomes a non-negligible factor in global commodity price formation.
Table 11. Lead–lag Analysis of Chinese and US Commodity Futures Markets:Composite Indices, 2000 and 2010
Source: Calculated by authors.
2000 2010 Ch-composite Coefficient Standard error p-value Coefficient Standard. error p-value
Ch-lag(1) 0.1483 0.0648 0.023 –0.0253 0.0679 0.710 Ch-lag(2) 0.0622 0.0657 0.344 0.1153 0.0678 0.090 Ch-lag(3) 0.0887 0.0656 0.178 –0.0103 0.0686 0.881 Ch-lag(4) –0.1035 0.0655 0.115 –0.0300 0.0683 0.660 Ch-lag (5) –0.0914 0.0645 0.158 –0.1094 0.0566 0.054 US-lag(1) 0.0767 0.0366 0.037 0.6085 0.0622 0.000 US-lag(2) 0.0462 0.0369 0.212 –0.0595 0.0742 0.423 US-lag(3) 0.0458 0.0370 0.217 –0.2078 0.0741 0.779 US-lag(4) 0.0019 0.0368 0.957 –0.0022 0.0737 0.976 US-lag(5) 0.0125 0.0367 0.734 0.0222 0.0731 0.761 Constant –0.0005 0.0002 0.030 –0.0002 0.0004 0.730 US-composite Coefficient Standard error p-value Coefficient Standard error p-value Ch-lag(0) 0.0588 0.1155 0.611 0.3608 0.0680 0.000 Ch-lag(1) 0.1155 0.1162 0.321 –0.0889 0.0714 0.214 Ch-lag(2) 0.1258 0.1168 0.282 0.1245 0.0717 0.084 Ch-lag(3) –0.0392 0.1171 0.738 –0.0097 0.0719 0.893 Ch-lag (4) 0.0178 0.1159 0.878 –0.0222 0.0718 0.757 US-lag(1) –0.0040 0.0657 0.950 –0.9115 0.0775 0.241 US-lag(2) –0.0574 0.0660 0.384 0.0488 0.0780 0.532 US-lag(3) 0.0071 0.0660 0.914 –0.0803 0.0776 0.301 US-lag(4) –0.0105 0.0655 0.873 –0.0149 0.0771 0.846 US-lag(5) 0.0417 0.0655 0.525 –0.0524 0.0734 0.476 Constant 0.0010 0.0004 0.016 0.0009 0.0005 0.058

97Impact of Chinese Commodity Futures Market
©2013 Institute of World Economics and Politics, Chinese Academy of Social Sciences
VIII. Conclusions and Some Policy Implications
The present paper constructs a set of indices that capture the special features of theChinese commodity futures market, and carry out a rigorous analysis for the properties ofcommodity futures during the period of January 2000 to December 2011.
We first present the general trend of the Chinese commodity futures market, and compareits performance relative to the other traditional assets. Then, we investigate the risk premiumsfor the commodity futures and find that although the risk premiums vary across individualcommodities, overall Chinese commodity futures produce a significantly positive riskpremium, indicating that the commodity futures market is generally backwardated. Weverify that the commodity futures can act as an effective diversification tool in the Chineseasset management industry. We also show that the commodity futures can hedge bothexpected and unexpected inflation in China. Agricultural futures are found to be a signal forinflation 2 months earlier. We finally explore the relationship between Chinese and UScommodity futures markets for the years 2000 and 2010. The results reveal an increasinglyinteractive pattern between these two markets, indicating enhanced information transmission.Our analysis may not only be useful for scholars working on more narrow questionsconcerning Chinese commodity markets, but also valuable for practitioners interested ininvesting in the Chinese market, as well as policy-markers. The following are some policysuggestions based on our analysis.
First, the empirical evidence shows that the Chinese commodity futures market canaffect the US market, but with less influence from the US market. Therefore, the greatestpolicy concern is improving the Chinese commodity market’s pricing power. Two problemscurtailing the market’s pricing power should be paid more attention: the low open interestof the Chinese market and that international investors are not allowed access to the Chinesefutures market.
Low open interest with a high trading volume implies that the Chinese futures marketis too speculative. Some measures can be adopted to solve this problem, including raisingthe contract size and providing preference to hedgers (e.g. lowering their margin requirementsand introducing more institutional investors).
Not permitting international investors to enter the Chinese futures market not onlyprevents international information transmission, but also reduces the potential capitalinvested in the Chinese market, which consequently weakens the Chinese market’s pricingpower. Therefore, we should open the Chinese commodity futures market to the internationalinvestors gradually. The design of the oil futures in the Shanghai Futures Exchange, whichis open to international investors, is a promising first step.

98 Zhiyong Tu et al. / 79–99, Vol. 21, No. 6, 2013
©2013 Institute of World Economics and Politics, Chinese Academy of Social Sciences
Second, Chinese commodity futures could both hedge and indicate inflation, while thestocks and bonds do not have this function. As inflation is one of the most importantmonetary policy targets, incorporating the information from Chinese commodity futuresmarket could help the central bank to improve the efficacy of monetary policy.
Third, establishing the passive commodity futures index portfolio could diversify theportfolios of traditional assets in China. However, the percentage of commodity futures inthe optimal portfolio is still as low as 0.82 percent (see Table 6). To provide more choices forChinese commodity investors, the active commodity trading advisor should be introducedto the Chinese market.
References
Adams, Zeno, Roland Fuss and Dieter G. Kaiser, 2008, “Macroeconomic determinants of commodityfutures returns,” in Handbook of Commodity Investing, USA: John Wiley & Sons.
Almanac of China’s Finance and Banking Editorial Office, 2011, Almanac of China’s Finance andBanking 2011, Beijing: Almanac of China’s Finance and Banking Magazine.
Bekaert, Geert and Eric Engstrom, 2010, “Inflation and the stock market: Understanding the ‘FedModel’,” Journal of Monetary Economics, Vol. 57, No. 3, pp. 278–94.
Bodie, Zvi and Victor I. Rosansky, 1980, “Risk and return in commodity futures,” Financial AnalystsJournal, Vol. 36, No. 3, pp. 27–39.
Bordo, Michael David, 1980, “The effects of monetary change on relative commodity prices and therule of long-term contracts,” Journal of Political Economy, Vol. 88, No. 6, pp. 1088–109.
Elton, Edwin J., Martin J. Gruber and Joel C. Rentzler, 1987, “Professionally managed, publiclytraded commodity funds,” Journal of Business, Vol. 60, No. 2, pp. 175–99.
Erb, Claude B. and Campbell R. Harvey, 2006, “The strategic and tactical value of commodityfutures,” Financial Analysts Journal, Vol. 62, No. 2, pp. 69–97.
Fama, Eugene F. and Kenneth R. French, 1987, “Commodity futures prices: Some evidence onforecast power, premiums, and the theory of storage,” The Journal of Business, Vol. 60, No. 1,pp. 55–73.
Fung, Hung-Gay, Qingfeng Liu and Yiuman Tse, 2010, “The information flow and market efficiencybetween the US and Chinese aluminum and copper futures markets,” Journal of FuturesMarkets, Vol. 30, No. 12, pp. 1192–209.
Garner, Alan C., 1995, “How useful are leading indicators of inflation?” Federal Reserve Bank ofKansas City Economic Review, Vol. 80, No. 2, pp. 5–18.
Gorton, Gary and Geert K. Rouwenhorst, 2006, “Facts and fantasies about commodity futures,”Financial Analysts Journal, Vol. 62, No. 2, pp. 47–68.
Greer, Robert. J., 1978, “Conservative commodities: A key inflation hedge,” Journal of PortfolioManagement, Vol. 4, No. 4, pp. 26–9.
Hicks, John R., 1939, Value and Capital, Oxford: Oxford University Press.

99Impact of Chinese Commodity Futures Market
©2013 Institute of World Economics and Politics, Chinese Academy of Social Sciences
Hong, Harrison and Motohiro Yogo, 2012, “What does futures market interest tell us about themacroeconomy and asset prices?” Journal of Financial Economics, Vol. 105, No. 3, pp. 473–90.
Hua, Renhai and Baizhu Chen, 2004, “International linkages of the Chinese futures market,” JingjixueJikan (Quarterly Journal of Economics), Vol. 3, No. 3, pp. 727–42.
Jiang, Shu and Chongfeng Wu, 2007, “The efficiency of China’s futures market: A study based onoverreaction and domestic and international market linkage,” Jinrong Yanjiu (FinancialResearch), Vol. 320, No. 2, pp. 49–62.
Kat, Harry M. and Roel C. A. Oomen, 2006a, “What every investor needs to know about commoditiesI: Univariate return analysis,” Working Paper, City University, London, UK.
Kat, Harry M. and Roel C. A. Oomen, 2006b, “What every investor needs to know about commoditiesII: Multivariate return analysis,” Working Paper, City University, London, UK.
Keynes, John Maynard, 1930, A Treaties on Money, London: Macmillan.Lintner, John, 1983, “The potential role of managed commodity-financial futures accounts in portfolios
of stocks and bonds,” paper present at the Annual Conference of the Financial AnalystsFederation, Toronto, Canada, 16 May 1983.
Lu, Feng, Yuanfang Li and Liu Liu, 2009, “International commodity prices fluctuations and Chinafactor – The new problems faced by the growth of Chinese open economy,” Jinrong Yanjiu(Financial Research), Vol. 352, No. 10, pp. 38–56.
PBOC (People’s Bank of China), 2010, Operation Report of Regional Finance in China in 2009[online; cited 9 June 2010]. Available from: http://www.pbc.gov.cn.
Shyy, Gang and Bob Butcher, 1994, “Price equilibrium and transmission in a controlled economy: Acase study of the metal exchange in China,” Journal of Futures Markets, Vol. 14, No. 8,pp. 877–90.
Williams, Jeffery, Anne Peck, Albert Park and Scott Rozelle, 1998, “The emergence of a futuresmarket: Mungbeans on the China Zhengzhou Commodity Exchange,” Journal of FuturesMarkets, Vol. 18, No. 4, pp. 427–48.
Xin, Yu, Gongmeng Chen and Firth Michael, 2006, “The efficiency of the Chinese commodityfutures markets: Development and empirical evidence,” China & World Economy, Vol. 14,No. 2, pp. 79–92.
Zhang, Qishan, Yi Fang and Kun Huang, 2006, “An empirical study on the function and internationalinfluence of Chinese futures market,” Guanli Shijie (Management World), Vol. 151, No. 4,pp. 28–34.
(Edited by Zhinan Zhang)