emerging geothermometers for estimating slab surface temperatures
TRANSCRIPT
nature geoscience | VOL 2 | SEPTEMBER 2009 | www.nature.com/naturegeoscience 611
progress articlePublished online: 16 august 2009 | doi: 10.1038/ngeo614
A great variety of volatile-rich material is fed into subduction zones, including all sorts of marine sediment, altered oceanic crust and some serpentinized mantle lithosphere1.
Subduction delivers these materials to depth, but their subsequent history depends on how pressure and temperature increase together. In the cool shallow subduction zone, fluids are liberated at subsolidus temperatures, whereas at higher temperatures some volatile components can be entrained directly into slab-derived melts. These fluids and melts percolate into the overlying mantle, ultimately causing it to melt, thereby generating the magma that forms arc volcanoes. Water is by far the dominant volatile species evolved during subduction of everything but calcium carbonate sediments and veins, and so in most subduction zones the first fluids are dilute aqueous solutions (for example, >90% water)2. Such fluids may drive melting in portions of the subducting plate that exceed 700–800 °C (refs 3, 4). At higher pressures, solute-rich fluids and water-rich melts may become miscible above a second critical endpoint, generating ‘supercritical liquids’ of intermediate composition5. This much is known about the potential variety of fluids in subduction zones, but little is yet known about the actual pressure and temperature of fluid generation or delivery to the arc mantle source.
Most constraints on the pressure and temperature of slab fluids come from two complementary approaches used for active subduction zones: the trace element signatures in arc magmas and numerical simulations on the thermal structure of subducting plates. (A third important approach involves pressure–temperature estimates from exhumed metamorphic rocks from past subduc-tion zones. The focus here is instead on products and processes that can be related to known subduction conditions.) The magmas that erupt from arc volcanoes carry within them vestiges of the slab fluids responsible for their genesis. The problem is that magmas degas almost all of their H2O before and during eruption, so most methods of inferring magmatic H2O content have been indirect. For over 40 years, it has been recognized that arc magmas have unique trace element signatures that must originate from the slab.
emerging geothermometers for estimating slab surface temperaturesterry Plank1*, lauren b. cooper1 and craig e. Manning2
Soon after its creation, the upper part of the oceanic lithosphere becomes hydrated owing to prolonged interaction with sea water. As oceanic slabs sink into the mantle at subduction zones and experience increasing temperatures and pressures, they dehydrate and release fluids. Such slab fluids drive mantle melting and return ocean water to the Earth’s surface through arc volcanism. The efficiency of this process, as well as the chemical make-up of slab fluids, depends on the pressure and tem-perature conditions experienced by the slabs as they subduct. A growing body of experimental data provides the basis for new geothermometers (for example the ratio of water to cerium) that, when combined with data from melt inclusions in volcanic crystals, predict that slab-fluid temperatures vary from 750 to 950 °C for different subduction zones. Such high values indicate that fluids that exit the slab when it is below the arc are likely to be like melts or solute-rich fluids. Slab surface temperatures inferred from these geothermometers are at the upper end of those predicted by thermal models, implying that fluids could be released at relatively shallow depths and efficiently returned to the surface.
These signatures have left a lasting mark on the composition of the continental crust. The interpretation of these signatures, however, has been guided more by intuition than data. This has led over the years to descriptions that are colourful (‘IRS’ fluids: rich in incompatible elements, radiogenic strontium and silica)6, nebulous (‘slab components’) or prescriptive (‘fluid-mobile’ or ‘conservative’ elements; see refs. 7 and 8 for reviews). Recent slab-fluid estimates are derived by inverting the composition of magmas9–12, but they are chameleon-like in their chemical composition, almost as varied as arc magmas themselves (that is, spanning more than an order of magnitude in the concentration of key tracers such as Ce and Sr). Arc magmas are our ultimate observational constraint on subduc-tion zone fluids; we just need to know how to interpret them.
If arc magmas provide the geochemical constraints, geodynamic models provide the self-consistent physics needed to predict how plates descend and heat up in the subduction zone. Models are also necessary to assess the impact of subduction on the long-term thermochemical evolution of the planet. Traditionally, there have been too many unknowns — such as the rheology of the mantle wedge and the stress state of the slab — to accurately predict slab pressure–temperature paths. Early models yielded cool subarc temperatures (<600 °C at ~100 km) for all but the highest shear stresses or youngest slabs13. Recent developments in non-Newtonian wedge rheologies, variable coupling of the plate interface, higher resolution numerical grids and analogue experiments have led to the prediction of temperatures on the slab surface (defined here at the top of the subducting sedimentary layer) as high as 800 °C at >70-km depth, and large thermal gradients within the top 5 km of the slab (>50 °C km−1)14–17. Another view18 is that slab material detaches, rises into the mantle, and follows complex pressure–temperature paths that diverge from those in the subducting plate. Nonetheless, there is yet a very large difference — hundreds of degrees — among different thermal models. This uncertainty is the difference between minor and major slab-dehydration beneath volcanic arcs19,20.
Thus, this field stands ready for new constraints, potentially provided by the very precise geochemical information recorded in
1Lamont-Doherty Earth Observatory of Columbia University, 61 Route 9W, Palisades, New York 10964, USA, 2Department of Earth and Space Sciences, University of California, Los Angeles, California 90095–1567, USA. *e-mail: [email protected]
ngeo_614_SEP09.indd 611 20/8/09 11:30:14
© 2009 Macmillan Publishers Limited. All rights reserved

612 nature geoscience | VOL 2 | SEPTEMBER 2009 | www.nature.com/naturegeoscience
progress article NATurE gEoSCiENCE doi: 10.1038/ngeo614
arc magmas. Progress has come from the laboratory, where subduc-tion pressure and temperature can be reproduced, and fluids can be captured and analysed geochemically.
laboratory experiments on mineral solubilitiesThe traditional approach to calculating trace element compositions of fluids or melts is to first determine, in the laboratory, the partition coefficient for each mineral (the ratio of an element’s concentra-tion in the mineral and the liquid), and then use the equations of mass balance, with estimates of the bulk composition and modes of individual minerals, to calculate concentrations at different mass fractions of fluid. In subducting assemblages, this approach may not be tractable given the multitude of mineral phases for which partitioning relationships must be known, and the variety of bulk compositions entering subduction zones. Recent work21–24 has emphasized a different approach, one that focuses instead on the solubility of individual minerals in slab fluids with a particular emphasis on accessory minerals such as allanite, monazite, zir-con and rutile. The advantage is that such solubilities may be
independent of bulk composition and other minerals present, while varying by orders of magnitude as a function of temperature. If true, this provides the basis for slab-fluid geothermometers.
Accessory minerals are minor in abundance, but may contain trace elements as major structural components (for example, Zr in zircon and Ce in monazite). Provided these minerals are part of the solid assemblage, their solubility will govern the abundance of key trace elements in co-existing fluids, including Ti, Nb, Ta, Th, Zr, Hf and the light rare-earth elements (LREE). Similarly, the mica mineral phengite mediates the concentration of K in the fluid/melt in sedimentary or mafic lithologies3,25. Although fluid composition also has a marked effect on solubilities, all of these minerals show that their solubility has a very strong positive temperature depend-ence. For example, the LREE concentration of fluids or melts in equilibrium with allanite or monazite increases by more than two orders of magnitude from 600 to 1,100 °C (ref. 21), with a small pressure dependence (Fig. 1a). Such variation can be exploited as a slab-fluid thermometer, with the caveats that the accessory phase remains saturated in the relevant system and that erupted magma compositions may be used to infer slab-fluid compositions (see Supplementary Discussion 1).
1,000
100
10
600 700 800 900 1,000 1,100
600 700 800 900 1,000 1,100
Allanite-saturated (from ref. 21)Allanite-saturated (from ref. 37)Allanite-saturated (from ref. 22)Monazite-saturated (from ref. 22)Monazite-H2O (from ref. 36)
LREE
(ppm
)
LREE in high–pressure fluids/melts
100
80
60
40
20
0
H2O in high–pressure fluids/melts
H2O
(wt%
) in
fluid
/mel
t
Temperature (°C)
Temperature (°C)
a
b
3.5 GPa (from ref. 25)4.0 GPa (from ref. 5)
Figure 1 | The effect of temperature on LrEE and H2o content of slab fluids. a, Temperature versus LREE concentrations in synthetic fluids and melts saturated in monazite (grey circles and white square) and allanite (black symbols), from various experimental studies21,22,36,37, and calculated solubility curves for allanite21 (thin and dashed black lines) and monazite38 (grey line). b, Temperature versus H2O content of fluids and melts at 3.5 and 4.0 GPa (refs 5, 25). Grey band is H2O-saturated sediment solidus25. Thick black line with error bars on both panels is used to calculate the model H2O/Ce ratios in Fig. 2. See Supplementary Notes for more details on experimental studies, solubility calculations and model uncertainties.
1,000,000
100,000
10,000
1,000
10010
1
0.1
0.01
0.001
0.0001
MORB-OIB
MORB-OIB
H2O
/Ce
K 2O/H
2O
500 600 700 800 900 1,000
Tonga melt inclusions
Mexico melt inclusions
H2O/Ce = 2 × 10⁷e–0.0109T
K2O/H2O = 6 × 10⁻⁵e–0.0098T
–200 –100 Tsol +100 +200 +300
Temperature (°C)
Temperature (°C)
a
b
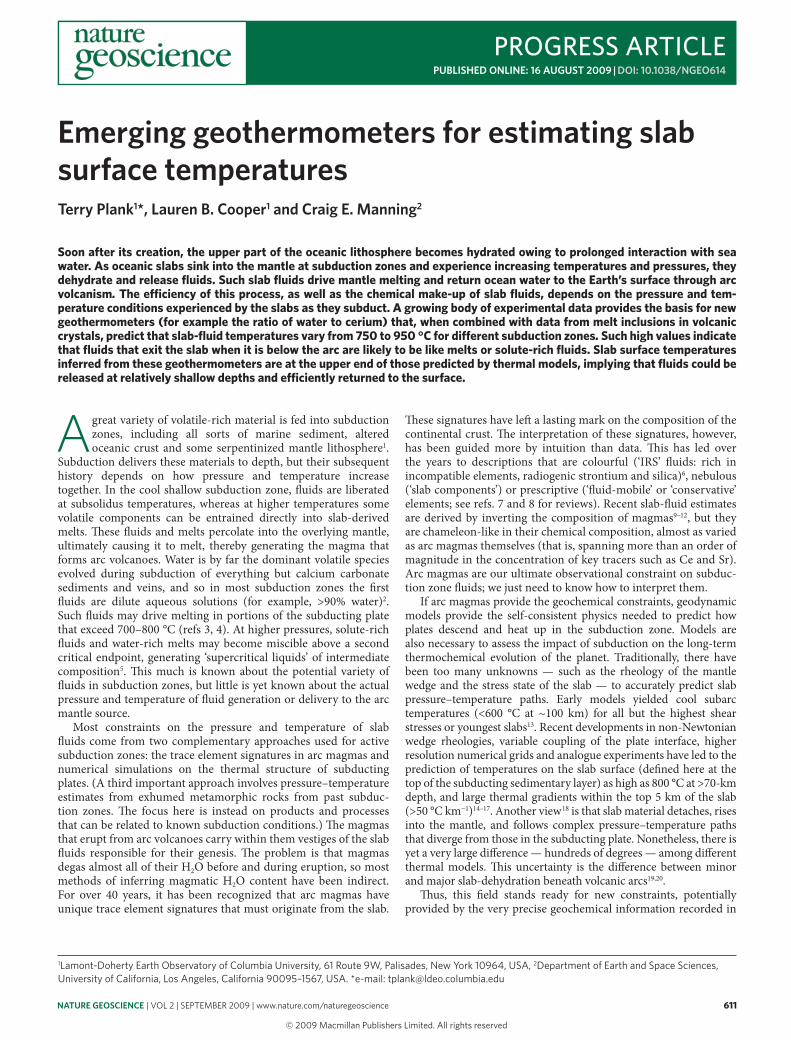
Figure 2 | Slab-fluid thermometers. a, Provisional H2O/Ce slab-fluid thermometer, based on line regressed through experimentally derived sediment melts at 2.5–4.5 GPa (small black circles; ref. 22). Thick line with error bars is the generic model from LREE and H2O content in Fig. 1. Vertical grey bar is solidus at ~3 GPa, and horizontal grey bar is H2O/Ce in mid-ocean-ridge basalts (MORB) and ocean-island basalts (OIB)27. Black squares are H2O/Ce ratios in least-degassed Tonga melt inclusions34,39, plotted at their calculated temperatures. White squares are H2O/Ce ratios in least-degassed Mexico melt inclusions40,41. b, K2O/H2O slab-fluid thermometer (after ref. 25). Black circles are experimental liquids at 3.5–4.5 GPa with phengite3,25. The horizontal axis shows temperature relative to H2O-saturated solidus at 3.5–4.5 GPa (Tsol). Other symbols as in a; see Supplementary Notes for further information.
ngeo_614_SEP09.indd 612 20/8/09 11:30:15
© 2009 Macmillan Publishers Limited. All rights reserved

nature geoscience | VOL 2 | SEPTEMBER 2009 | www.nature.com/naturegeoscience 613
progress articleNATurE gEoSCiENCE doi: 10.1038/ngeo614
Another development in experimental petrology is the improved ability to measure and predict the solute content of fluids and melts. This was a particular challenge in early experiments, where melts often reacted with containers, or fluids were lost after the container was opened. New work2,5,25 has demonstrated very low solute contents (<10 wt%) in most high pressure aqueous fluids (Fig. 1b). Only as the temperature approaches the H2O-saturated solidus (>700 °C at >2 GPa for slab sediments or basalt3,25) do solute contents begin to increase; the ‘solutes’ become predomi-nant on melting, increasing rapidly to >70% beyond the solidus, or in high-temperature supercritical fluids (Fig. 1b). As H2O is the dominant solvent, the H2O content of fluids and melts decreases dramatically from >90% to <10% from 600 to 1,000 °C. This variation may be largely independent of starting composition, because an eclogite-facies assemblage (garnet + omphacite + coes-ite ± mica) characterizes a wide range of basaltic and sedimen-tary bulk compositions, and the solute content of the subsolidus fluid that coexists with this assemblage, even at high pressures (2–3 GPa), is low26. Furthermore, the H2O concentration in satu-rated melts in the subcritical region does not vary strongly with bulk composition. Thus the strong variation in H2O concentrations with temperature in subduction-zone fluids at subarc depths can serve as a simple geothermometer.
There are thousands of high-quality measurements of REE in arc magmas that could potentially be combined with allanite/monazite solubility relationships to predict the temperature of slab fluids. The catch is that the absolute concentrations in magma are affected by several intervening processes, such as melting and melt-rock reactions in the mantle, and crystallization in the crust. A common strategy in geochemistry is to consider ratios of elements that are not fractionated by melting or crystallization. For example, the LREE/Ti ratio has been proposed as a potential thermometer for fluids saturated in both allanite and rutile21. This thermometer presents challenges in its application, however, because the mantle contribution to Ti in arc magmas is large. Another strategic ratio is H2O/Ce, which has a limited range in magmas far from subduction zones (200 ± 100)27. Because H2O and Ce have similar partition coefficients during mantle melting28, this limited range may also characterize the background mantle. Thus, it is an ideal ratio to record the addition of subduction zone fluids to the mantle source of arc magmas, and indeed arc magmas possess H2O/Ce ratios
that are distinctly higher (up to 20,000) than the canonical mantle ratio of 200. Following the experimental predictions from above, H2O and Ce should both obey strong, but opposite temperature dependencies. Thus, the H2O/Ce ratios in subduction fluids will decrease by orders of magnitude, from >1,000,000 to <1,000 as temperature increases from 600 to 1,000 °C (Fig. 2a). We use the term ‘fluid’ here generally, to encompass aqueous fluid, melts and supercritical fluids, as the thermometer applies potentially to all of these types (see Supplementary Discussion 2). A similar pre-diction exists for the K2O/H2O ratio in melts in equilibrium with a phengite-bearing residue25, with K2O/H2O ratios increasing strongly with temperature (Fig. 2b). The interpretation of K2O/H2O ratios is complicated by an order of magnitude range in the background mantle (0.2 –2.0), which overlaps that found in arcs, and so requires further knowledge of the degree of mantle melting to be fully deconvolved. Nonetheless, the combination of H2O/Ce and K2O/H2O ratios as slab-fluid thermometers is potentially more powerful than either alone.
testing slab-fluid geothermometersTesting the slab-fluid geothermometers proposed above requires measurements of the H2O content of arc magmas. This has been another long-standing challenge, as most magmas lose virtually all of their original dissolved H2O as they degas during ascent and eruption. The only parts of a magma that may retain original volatile contents are small inclusions trapped inside minerals under pressure (Fig. 3). Such inclusions may escape the degassing driven by depressurization of the surrounding magma, provided that the inclusion does not leak, the mineral ascends and cools quickly, and there has been minimal pre-entrapment degassing. Melt inclusions from mafic arc magmas have a high H2O content (2–8 wt%)29, and the past few years have seen an explosion in the quantity of such data for different volcanic deposits (Fig. 3). These data have allowed new discoveries in the understanding of fundamental processes, such as wet melting in the mantle11, and magma ascent, crystalliza-tion and eruption30. We propose that arc melt inclusions may also record, in their H2O/Ce and H2O/K2O ratios, the temperature of equilibration of fluids in the subduction zone.
Existing data support this hypothesis. Data can be examined for two subduction zones that contrast greatly in their expected thermal state — Tonga and central Mexico31. The Tonga slab is
2,000
1,000
00 2 4 6
Popocateptl, Mexico
Volcano A, Tonga
H2O (wt%)
Sulp
hur (
ppm
)
70-μm melt inclusion
Olivine
Figure 3 | Volatile concentrations in olivine-hosted melt inclusions. Examples of volatile concentration data from melt inclusions used to calculate H2O/Ce ratios in magmas from the submarine, arc boninite Volcano A in Tonga (black squares; ref. 39) and the 1997 eruption of Popocatepetl in Mexico (white squares; ref. 41). Black line is the degassing curve (from ref. 39). Each data point is a melt inclusion analysis; each population shows distinctive degassing of H2O and sulphur. Only maximum H2O concentrations (~5 wt% H2O for both volcanic suites shown here) are used to calculate the H2O/Ce ratio, representing least-degassed concentrations. Highest H2O contents are found in melt inclusions with olivine hosts that are near primary (>89% forsterite) for both volcanic suites. Photograph shows a naturally glassy crystal-free fully enclosed basaltic melt inclusion trapped in olivine, of the kind used to obtain the data shown here. See Supplementary Notes for more on interpretation of melt inclusion data.
ngeo_614_SEP09.indd 613 20/8/09 11:30:16
© 2009 Macmillan Publishers Limited. All rights reserved
614 nature geoscience | VOL 2 | SEPTEMBER 2009 | www.nature.com/naturegeoscience
progress article NATurE gEoSCiENCE doi: 10.1038/ngeo614
one of the oldest and fastest subducting plates on the planet. In contrast, the Mexico slab is relatively young. At a given depth, these contrasts in plate age and convergence rate should yield cooler temperatures in the Tonga slab than in the Mexican slab, all else being equal. We observe that melt inclusions from the Tonga arc have very high H2O/Ce ratios (5,000–20,000), consistent with cool subduction-zone-fluid equilibration temperatures (<800 °C; Fig. 2). On the other hand, melt inclusions from Mexico have very low H2O/Ce ratios (200 –1,500), consistent with high subduction-zone-fluid equilibration temperatures (>850 °C; Fig. 2). It is noteworthy that the depth of the slab beneath these two volcanic arcs is similar (90–110 km; refs 32–33), despite clear differences in inferred slab-fluid temperatures, and so the position of these volcanic arcs seems to be independent of slab surface temperature.
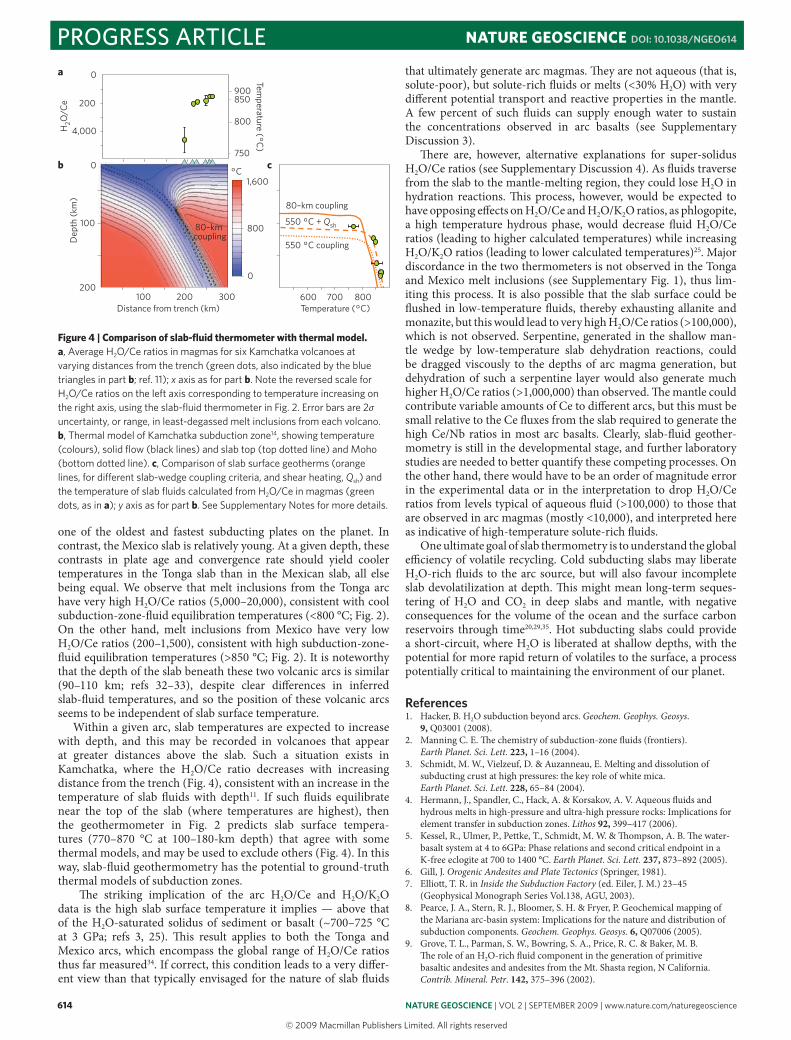
Within a given arc, slab temperatures are expected to increase with depth, and this may be recorded in volcanoes that appear at greater distances above the slab. Such a situation exists in Kamchatka, where the H2O/Ce ratio decreases with increasing distance from the trench (Fig. 4), consistent with an increase in the temperature of slab fluids with depth11. If such fluids equilibrate near the top of the slab (where temperatures are highest), then the geothermometer in Fig. 2 predicts slab surface tempera-tures (770–870 °C at 100–180-km depth) that agree with some thermal models, and may be used to exclude others (Fig. 4). In this way, slab-fluid geothermometry has the potential to ground-truth thermal models of subduction zones.
The striking implication of the arc H2O/Ce and H2O/K2O data is the high slab surface temperature it implies — above that of the H2O-saturated solidus of sediment or basalt (~700–725 °C at 3 GPa; refs 3, 25). This result applies to both the Tonga and Mexico arcs, which encompass the global range of H2O/Ce ratios thus far measured34. If correct, this condition leads to a very differ-ent view than that typically envisaged for the nature of slab fluids
that ultimately generate arc magmas. They are not aqueous (that is, solute-poor), but solute-rich fluids or melts (<30% H2O) with very different potential transport and reactive properties in the mantle. A few percent of such fluids can supply enough water to sustain the concentrations observed in arc basalts (see Supplementary Discussion 3).
There are, however, alternative explanations for super-solidus H2O/Ce ratios (see Supplementary Discussion 4). As fluids traverse from the slab to the mantle-melting region, they could lose H2O in hydration reactions. This process, however, would be expected to have opposing effects on H2O/Ce and H2O/K2O ratios, as phlogopite, a high temperature hydrous phase, would decrease fluid H2O/Ce ratios (leading to higher calculated temperatures) while increasing H2O/K2O ratios (leading to lower calculated temperatures)25. Major discordance in the two thermometers is not observed in the Tonga and Mexico melt inclusions (see Supplementary Fig. 1), thus lim-iting this process. It is also possible that the slab surface could be flushed in low-temperature fluids, thereby exhausting allanite and monazite, but this would lead to very high H2O/Ce ratios (>100,000), which is not observed. Serpentine, generated in the shallow man-tle wedge by low-temperature slab dehydration reactions, could be dragged viscously to the depths of arc magma generation, but dehydration of such a serpentine layer would also generate much higher H2O/Ce ratios (>1,000,000) than observed. The mantle could contribute variable amounts of Ce to different arcs, but this must be small relative to the Ce fluxes from the slab required to generate the high Ce/Nb ratios in most arc basalts. Clearly, slab-fluid geother-mometry is still in the developmental stage, and further laboratory studies are needed to better quantify these competing processes. On the other hand, there would have to be an order of magnitude error in the experimental data or in the interpretation to drop H2O/Ce ratios from levels typical of aqueous fluid (>100,000) to those that are observed in arc magmas (mostly <10,000), and interpreted here as indicative of high-temperature solute-rich fluids.
One ultimate goal of slab thermometry is to understand the global efficiency of volatile recycling. Cold subducting slabs may liberate H2O-rich fluids to the arc source, but will also favour incomplete slab devolatilization at depth. This might mean long-term seques-tering of H2O and CO2 in deep slabs and mantle, with negative consequences for the volume of the ocean and the surface carbon reservoirs through time20,29,35. Hot subducting slabs could provide a short-circuit, where H2O is liberated at shallow depths, with the potential for more rapid return of volatiles to the surface, a process potentially critical to maintaining the environment of our planet.
references1. Hacker, B. H2O subduction beyond arcs. Geochem. Geophys. Geosys.
9, Q03001 (2008).2. Manning C. E. The chemistry of subduction-zone fluids (frontiers).
Earth Planet. Sci. Lett. 223, 1–16 (2004). 3. Schmidt, M. W., Vielzeuf, D. & Auzanneau, E. Melting and dissolution of
subducting crust at high pressures: the key role of white mica. Earth Planet. Sci. Lett. 228, 65–84 (2004).
4. Hermann, J., Spandler, C., Hack, A. & Korsakov, A. V. Aqueous fluids and hydrous melts in high-pressure and ultra-high pressure rocks: Implications for element transfer in subduction zones. Lithos 92, 399–417 (2006).
5. Kessel, R., Ulmer, P., Pettke, T., Schmidt, M. W. & Thompson, A. B. The water-basalt system at 4 to 6GPa: Phase relations and second critical endpoint in a K-free eclogite at 700 to 1400 °C. Earth Planet. Sci. Lett. 237, 873–892 (2005).
6. Gill, J. Orogenic Andesites and Plate Tectonics (Springer, 1981).7. Elliott, T. R. in Inside the Subduction Factory (ed. Eiler, J. M.) 23–45
(Geophysical Monograph Series Vol.138, AGU, 2003).8. Pearce, J. A., Stern, R. J., Bloomer, S. H. & Fryer, P. Geochemical mapping of
the Mariana arc-basin system: Implications for the nature and distribution of subduction components. Geochem. Geophys. Geosys. 6, Q07006 (2005).
9. Grove, T. L., Parman, S. W., Bowring, S. A., Price, R. C. & Baker, M. B. The role of an H2O-rich fluid component in the generation of primitive basaltic andesites and andesites from the Mt. Shasta region, N California. Contrib. Mineral. Petr. 142, 375–396 (2002).
600 700 800
100
0
200
Dep
th (k
m)
80–km coupling
80–km coupling
550 °C + Qsh
550 °C coupling
Temperature (°C)
°C
0
200
4,000H2O
/Ce
Temperature (°C
)
900850
800
750
100 200 300Distance from trench (km)
0
1,600
800
a
b c
Figure 4 | Comparison of slab-fluid thermometer with thermal model. a, Average H2O/Ce ratios in magmas for six Kamchatka volcanoes at varying distances from the trench (green dots, also indicated by the blue triangles in part b; ref. 11); x axis as for part b. Note the reversed scale for H2O/Ce ratios on the left axis corresponding to temperature increasing on the right axis, using the slab-fluid thermometer in Fig. 2. Error bars are 2σ uncertainty, or range, in least-degassed melt inclusions from each volcano. b, Thermal model of Kamchatka subduction zone14, showing temperature (colours), solid flow (black lines) and slab top (top dotted line) and Moho (bottom dotted line). c, Comparison of slab surface geotherms (orange lines, for different slab-wedge coupling criteria, and shear heating, Qsh) and the temperature of slab fluids calculated from H2O/Ce in magmas (green dots, as in a); y axis as for part b. See Supplementary Notes for more details.
ngeo_614_SEP09.indd 614 20/8/09 11:30:17
© 2009 Macmillan Publishers Limited. All rights reserved

nature geoscience | VOL 2 | SEPTEMBER 2009 | www.nature.com/naturegeoscience 615
progress articleNATurE gEoSCiENCE doi: 10.1038/ngeo614
10. Eiler, J. M., Carr, M. J., Reagan, M. & Stolper, E. Oxygen isotope constraints on the sources of Central American arc lavas. Geochem. Geophys. Geosys. 6, Q07007 (2005).
11. Portnyagin, M., Hoernle, K., Plechov, P., Mironov, N. & Khubunaya S. Constraints on mantle melting and composition and nature of slab components in volcanic arcs from volatiles (H2O, S, Cl, F) and trace elements in melt inclusions from the Kamchatka Arc. Earth Planet. Sci. Lett. 255, 53–69 (2007).
12. McDade, P., Blundy, J. D. & Wood, B. J. Trace element partitioning between mantle wedge peridotite and hydrous MgO-rich melt. Am. Mineral. 88, 1825–1831 (2003).
13. Peacock, S. M., Rushmer, T. & Thompson, A. B. Partial melting of subducted oceanic crust. Earth Planet. Sci. Lett. 121, 227–244 (1994).
14. van Keken, P. E., Kiefer, B. & Peacock, S. M. High-resolution models of subduction zones: Implications for mineral dehydration reactions and the transport of water into the deep mantle. Geochem. Geophys. Geosys. 3, 1056 (2002).
15. Kelemen, P. B., Rilling, J. L., Parmentier, E. M., Mehl, L. & Hacker, B. R. in Inside the Subduction Factory (ed. Eiler, J. M.) 293–311 (Geophysical Monograph Series Vol.138, AGU, 2003).
16. Arcay, D., Tric, E. & Doin, M.-P. Slab surface temperature in subduction zones: Influence of the interplate decoupling depth and upper plate thinning processes. Earth Planet. Sci. Lett. 255, 324–338 (2007).
17. Kincaid, C. & Griffiths, R. W. Variability in flow and temperature within mantle subduction zones. Geochem. Geophys. Geosys 5, Q06002 (2004).
18. Castro, A. & Gerya, T. V. Magmatic implications of mantle wedge plumes: Experimental study. Lithos 103, 138–148 (2008).
19. Peacock, S. M. in Inside the Subduction Factory (ed. Eiler, J. M.) 7–22 (Geophysical Monograph Series Vol.138, AGU, 2003).
20. Rupke, L. H., Phillps Morgan, J., Hort, M. & Connolly, J. A. C. Serpentine and the subduction zone water cycle. Earth Planet. Sci. Lett. 223, 17–34 (2004).
21. Klimm, K., Blundy, J. D. & Green, T. H. Trace element partitioning and accessory phase saturation during H2O-saturated melting of basalt with implications for subduction zone chemical fluxes. J. Petrol. 49, 523–553 (2008).
22. Hermann, J. & Rubatto, D. Accessory phase control on the trace element signature of sediment melts in subduction zones. Chem. Geol. 265, 512–526 (2009).
23. Antignano, A. & Manning, C. E. Rutile solubility in H2O, H2O-SiO2, and H2O NaAlSi3O8 fluids at 0.7–20 GPa and 700–1000 °C: Implications for mobility of nominally insoluble elements. Chem. Geol. 255, 283–293 (2008).
24. Schmidt, M. W., Dardon, A., Chazot, G. & Vannucci, R. The dependence of Nb and Ta rutile-melt partitioning on melt composition and Nb/Ta fractionation during subduction processes. Earth Planet. Sci. Lett. 226, 415–432 (2004).
25. Hermann, J. & Spandler, C. J. Sediment melts at sub-arc depths: an experimental study. J. Petrol. 49, 717–740 (2008).
26. Manning, C. E. Fluid composition at the blueschist-eclogite transition in the model system Na2O-MgO-Al2O3-SiO2-H2O-HCl. Schweiz. Miner. Petrog. 78, 225–242 (1998).
27. Dixon, J. E., Leist, L., Langmuir, C. & Schilling, J.-G. Recycled dehydratrated lithosphere observed in plume-influenced mid-ocean-ridge basalt. Nature 420, 385–389 (2002).
28. Hauri, E. H., Gaetani, G. A. & Green, T. H. Partitioning of water during melting of the Earth’s upper mantle at H2O-undersaturated conditions. Earth Planet. Sci. Lett. 248, 715 – 734 (2006).
29. Wallace, P. J. Volatiles in subduction zone magmas: concentrations and fluxes based on melt inclusion and volcanic gas data. J. Volcanol. Geotherm. Res. 140, 217–240 (2005).
30. Blundy, J., Cashman, K. & Humphreys, M. Magma heating by decompression-driven crystallization beneath andesite volcanoes. Nature 443, 76–80 (2006).
31. Gorbatov, A. & Kostoglodov, V. Maximum depth of seismicity and thermal parameter of the subducting slab: General empirical relation and its application. Tectonophysics 277, 165–187 (1997).
32. Syracuse, E. & Abers, G. Global compilation of variations in slab depth beneath arc volcanoes and implications. Geochem. Geophys. Geosys. 7, Q05017 (2006).
33. Pardo, M. & Suarez, G. Shape of the subducted Rivera and Cocos plates in southern Mexico: Seismic and tectonic implications. J. Geophys. Res. 100, 12357–12373 (1995).
34. Cooper, L. Volatiles in Tonga Arc Magmas and Their Role in Unraveling Subduction Zone Processes. PhD thesis, Boston Univ. (2009).
35. Hirschmann, M. M. & Dasgupta, R. The H/C ratios of Earth’s near-surface and deep reservoirs, and consequences for deep Earth volatile cycles. Chem. Geol. 262, 4–16 (2009).
36. Tropper, P., Manning, C. E. & Harlov, D. E. Solubility of CePO4 and YPO4 in H2O, H2O-NaCl, H2O-NaF and H2O-Albite Fluids at 800 °C and 1 GPa: Implications for REE transport during subduction-zone metasomatism. AGU Fall Meet. abstr.V31D-2184 (2008).
37. Kessel, R., Schmidt, M. W., Ulmer, P. & Pettke, T. Trace element signature of subduction-zone fluids, melts and supercritical liquids at 120–180 km depth. Nature 437, 724–727 (2005).
38. Montel, J.-M. A model for monazite/melt equilibrium and application to the generation of granitic magmas. Chem. Geol. 110, 127–146 (1993).
39. Cooper, L. et al. Boninites from the modern Tonga arc. J. Geophys. Res. (in the press).
40. Cervantes, P. & Wallace, P. J. Role of H2O in subduction-zone magmatism: new insights from melt inclusions in high-Mg basalts from central Mexico. Geology 31, 235–238 (2003).
41. Roberge, J., Delgado-Granados, H. & Wallace, P. J. Mafic magma recharge supplies high CO2 and SO2 gas fluxes from Popocatepetl volcano, Mexico. Geology 37, 107–110 (2009).
acknowledgementsWe are grateful to J. Hermann, P. Wallace and J. Roberge for unpublished data, and E. Syracuse for providing the thermal model in Fig. 4. We thank J. Hermann, M. Schmidt, P. Kelemen and E. Stolper for illuminating conversations, and J. Blundy, C. Spandler and D. Arcay for constructive reviews. This work is supported by the US National Science Foundation grants OCE-0526450 (T.P.) and EAR-0337170 (C.E.M.).
author contributionsT.P and C.E.M. developed the discussion of experimental data and slab fluid geothermometry models; L.B.C. assessed the arc melt inclusion data; T.P. took the lead in writing the paper, with substantial contributions from C.E.M. and L.B.C.
additional informationSupplementary information accompanies this paper on www.nature.com/nature-geoscience. Correspondence and requests for materials should be addressed to T.P.
ngeo_614_SEP09.indd 615 20/8/09 11:30:17
© 2009 Macmillan Publishers Limited. All rights reserved