e(mergiiao high-frequency (hf) 1 roles in a … 5551t-5 n e(mergiiao high-frequency (hf) and m...
TRANSCRIPT
DNA 5551T-5
n E(MERGIIAO HIGH-FREQUENCY (HF) ANDm RELATED RADIO COMMUNICATIONS CONCEPTSM FOR ENDURING C31 ROLES IN A NUCLEARN ~5l RENVIR0NMENT
Critical Issues in Nuclear Weapons Effects on
Propagation9
C. B. Gabbard
R. E. LeLevier ---e lt w."R&D Associates
P.O. Box 9695 TMarina del Rey, California 90291 ECTE
JUN 1 6 1989
1 June 1980
Topical Report for Period 5 January 1980-1 June 1980-
CONTRACT No. DNA 001-80-C-0069
THIS WORK SPONSORED BY THE DEFENSE NUCLEAR AGENCYUNDER RDT&E RMSS CODE B310080464 P99OAXDBOO157 H2590D.
DIATMSUTON STATMET__ -
Prepared for Approved for public relea se
Director . Diatzibution Uf lZitd ,
DEFENSE NUCLEAR AGENCY
.. 'z-,uington, D. C. 20305_
S 154
SE CURITY' CLASSIFICATION OfTI AEfBSon Date Entered)
REPOR DOCMENTTIONPAGEREAD WNSrRUCTIONSREPOR DOCMENTTIONPAGEBEFORE COMPLET11M FORMiREPORT NUMBER 2 GOVT ACCESSION NO. -RECIPIENTS$ CATALOG NUMBER
'.D14A 5551T
4 TITLE (asd S.IIlf.) F~4RGN IH-FREQUENCY (HF) AND S. TYPE OF REPORT & PERIOD COVERED
RELATED RADIO COMMUNICATIONS CONCEPTS F'OR ENDURING ~P 'al Report for PeriodC 3
1 ROLES IN A NUCLEAR WAR ENVIRONMENT o MaJn 80-1 Jun 80; itical Issues in Nuclear Weapons Effects &rPROMN ORG. REPRT NUMBEon Propagation _____P __A-TR __113212 __001
7 A£.OF WN1 CONTRACT ORGRtANT NUMBEIV.)
' B. GabbardR. E. LeLevier DNA 001-80-C-0069 -
9PEReORMiNG ORGANIZATION NAME AND ADDRESS 10 PROGRAM ELEMENT. PROJECT, TASKARE A II RORK U NIT NUMBERSR & D Associates
P. 0. Box 9695 Subtask P99OAXDBOOI-57marina del Rey, California 90291 ______________
'CONTRO.L.ING OFFICE NAME AND ADDRESS Q2 REPORT DATE
Dire.tor 1_June_1980__________
Defense Nuclear Agency 1 UBRO AEWashington, D. C. 2030515 '24 MONTORINC, AGENCY NAME A ADDRESS(,i dfierent from, Corttrolind 0ffica) I1. SECURITY CLASS (.1 1111. a.,C
IA DISTRiB.,TION STATEMENT (of this Report)
7 DISTRIBUTION STATEMENT (of the abstract emitted in Biooit 20. It djffonIt from1 Report)
10 SUPPLEMENTARY NOTES
- 7' ,ork sponsored by the Defense Nuclear Agency under RDT&E
RMSS Code B310080464 P990AXDBOO157 H2590D.
--High,,frequency communicationsRadio communications), !Groaindwave communicationsCommand, control and communications, +~g34
A STRACT fCoIIn... on-. id. if necessary -d id.IIIy by blockA .- b,)
This document summarizes the nuclear weapons effects on propagationissues that must be considered in judging the overall nuclear effects vul-nerability of selected strategic C3 concepts envisioned to provide enduringC31 support in nuclear war. This document focuses on the propagation effectsin bands ranging from MF to UHF, with emphasis on HF skywave propagationduring and after periods of nuclear conflict. The report is composed ofshort contributions from selected experts in the field of nuclear propagation-f '
DD 'JA" 1473 EDITION OF INOV GS is OBSOLETE
SECURITY CLASSIFICATION OF THIS-PAGE (** Eire Entere) /

SECURITY CLASSIFICATION OF THIS PAGE WTh, 0ata B. .d)
20. ABSTRACT~ (Continued)
effects (from RDA, SRI and Rand) and is intended to provide a guide forthose asked to make system procurement decisions, in a complex andspecialized but critical area.
SEURT CLSIICTO OFTISPGEW.-Dt-.td
~~ACE
This document presents a brief summary of the key
points concerning the sensitivities of selected strategic
C3 concepts to nuclear weapon effects on propagation. This
document is intended to assist DoD decisionmakers in under-
standing and evaluating the potential endurance and perform-
ance of selected, emerging, ground and airborne strategic
communication systems that would operate in the medium- to
ultra-high-frequency radio bands in a general nuclear war.
W This effort was sponsored by the Defense Nuclear Agency
under Contract DNA001-80-C-0069 in response to numerous
requests from DoD offices and the services on simple guide-
lines that (1) reflect the state-of-the-art understanding
of nuclear weapon effects and (2) are useful in making system
acquisition judgments.
Page 2 was deleted. (81 AAk I
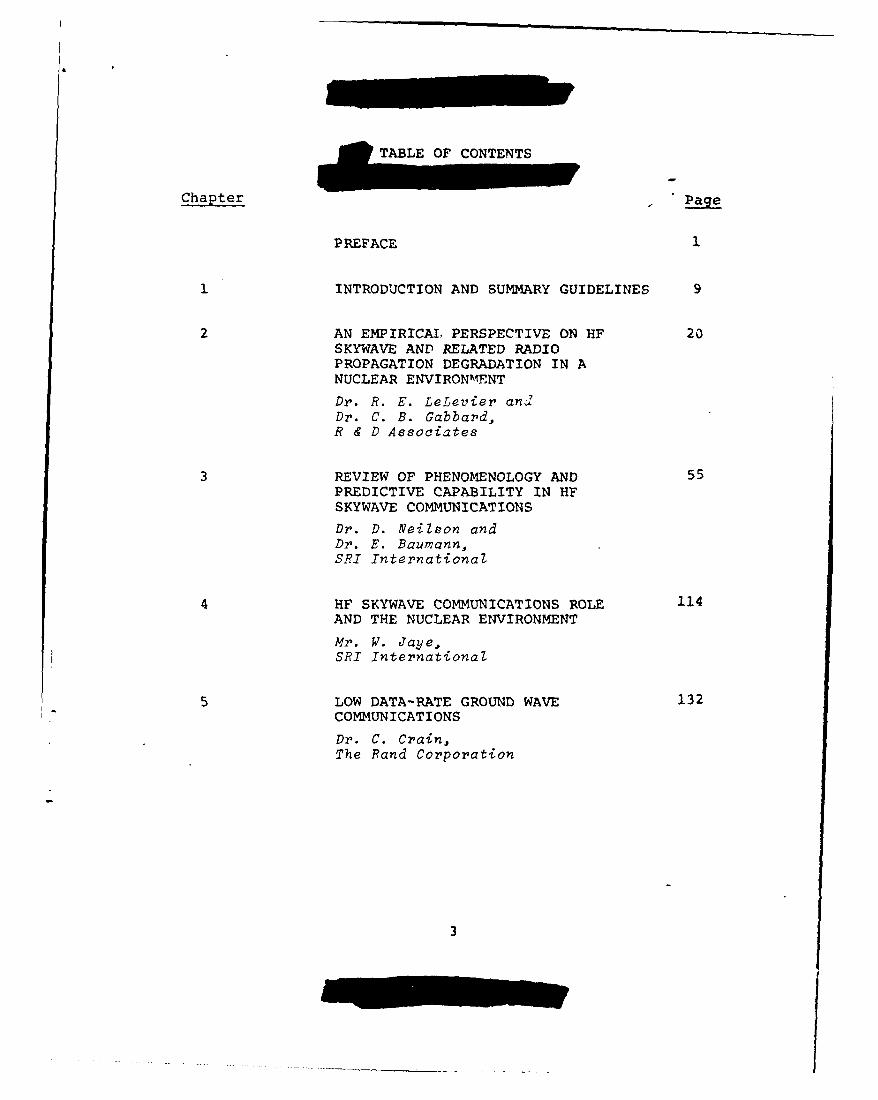
EOF CONTENTS
Chapter
P REFACE
1 INTRODUCTION AND SUMMARY GUIDELINES 9
2 AN EMPIRICAL PERSPECTIVE ON HF 20SKYWAVE AND RELATED RADIOPROPAGATION DEGRADATION IN ANUCLEAR ENVIRONMENT
Dr. R. E. LeLevier andDr. C. B. Gabbard,R & D Associates
3 REVIEW OF PHENOMENOLOGY AND 55PREDICTIVE CAPABILITY IN HFSKYWAVE COMMUNICATIONS
Dr. D. Neilson andDr. E. Baumann,SRI International
4 HF SKYWAVE COMMUNICATIONS ROLE 114AND THE NUCLEAR ENVIRONMENT
Mr. W. Jaye,SRI International
5 LOW DATA-RATE GROUND WAVE 132COMMUNICATIONS
Dr. C. Crain,The Rand Corporation
3

LIST OF ILLUSTRATIONS
Figure Page
2-1 Riometer data following TEAK and ORANGEevents ------------------ 28
2-2 Riometer record for ALMA - 30 MHz - - 31
2-3 Riometer record for BIGHORN - 30MHz ----- 31
2-4 - Slant path attenuation versus time fromdaytime x-ray flash on the Soviet 22 and28 October 1962 events ------------ 34
2-5 TEAK ionosonde data - Maui, H + 0 to H + 19minutes ----------------- 36
2-6 TEAK ionosonde data - Maui, H + 19 to H + 43Minutes ------------------- 37
2-7 TEAK ionosonde data - Midway Island, H + 0to H + 19 minutes -------------- 38
2-8 TEAK ionosonde data - Midway Island, H + 19to H + 43 minutes -------------- 39
2-9 - Map of vertical ionosonde stations ------ 40
2-10 Critical frequency contours 0 minutesafter KINGFISH ---------------- 41
2-11 Critical frequency contours 3 minutesafter KINGFISH ---------------- 42
2-12 Critical frequency contours 10 minutesafter KINGFISH ---------------- 43
2-13 Critical frequency contours 32 minutesafter KINGFISH ---------------- 44
2-14 Critical frequency contours 60 minutesafter KINGFISH ---------------- 45
2-15 Critical frequency contours, 0 minutesafter STARFISH ---------------- 46
2-16 Critical frequency contours, 1 minuteafter STARFISH ---------------- 47
2-17 Critical frequency contours, 10 minutesafter STARFISH ------------- ---- 48
2-18 Critical frequency contours, 32 minutesafter STARFISH ---------------- 49

LIST OF ILLUSTRATIONS (Continued)
Figure Page
2-19 Critical frequency contours, 60 minutes-after STARFISH ------------ ----- 50
3-1 Oblique-incidence inograms showing (a)identification of raypaths and (b) oblique-vertical correspondence ----------- 63
3-2 Measured equinoctial propagation spectrumFt. Monmouth to Palo Alto (1963-64) ----- 65
3-3 Predicted and measured values of maximumobserved frequency for Okinawa to Oahupath ---------------- 66
3-4 Calculated and measured ionogram forOkinawa to Saigon path ------------ 67
3-5 - Predicted and measured signal strengthfor 1300-km path --------------- 68
3-6 Geometry of raypath attenuation on a1200-km path resulting from a near surfacedetonation ------------------ 73
3-7 Ionospheric sounder paths for 1962 nucleartest series ----------------- 77
3-8 - Categories of bursts that cause HFabsorption ------------------ 79
3-9 Categories of bursts that may cause F-regionchanges --------------------- 80
3-10 Distances at which prompt radiations causeblackout for various burst altitude/yieldcombinations ----------------- 82
3-11 - Prompt radiation effects-observed andcomputed-Canton to Hawaii path ------- 83
3-12 Comparison of observed and predicted valuesof lowest observed frequency --------- 86
3-13 Height/yield combinations required tomaintain outage at distances within line-of-sight of the "ebris for the first 30minutes --------------- ----- 87

LIST OF ILLUSTRATIONS (Continued)
Figure Page
3-14 Comparison of observed and computed gamma,--
ray induced absorption - -------- 88
3-15 a One-way-vertical excess absorption at 15
MHz resulting from Beta, Gamma, andPrompt radiations-H + 15 min -- 89
3-16 fmin Behavior at Midway and Mauifollowing TEAK ---------------- 92
3-17 ofmin Behavior at Midway and Maui followingORANGE -------------------- 93
3-18 Riometer measurements at Midway and Mauifollowing TEAK ---------------- 94
3-19 f Riometer measurements at Midway and Mauifollowing ORANGE --------------- 95
3-20 fmin Behavior at Tomsk following October1962 event ---------------- 96
3-21 a Virtual height and critical frequencies atMidway and Maui following TEAK -------- 98
3-22 Transition from initial to acoustic-wave velocity -I--------------- 100
3-23 Geomagnetic field dependence ofacoustic-gravity wave ------------ 101
3-24 Ionospheric wave position vs. timefollowing check mate ------------- 102
3-25 Computed and-measured propagation spectrum-Canton to Rarotonga path ----------- 103
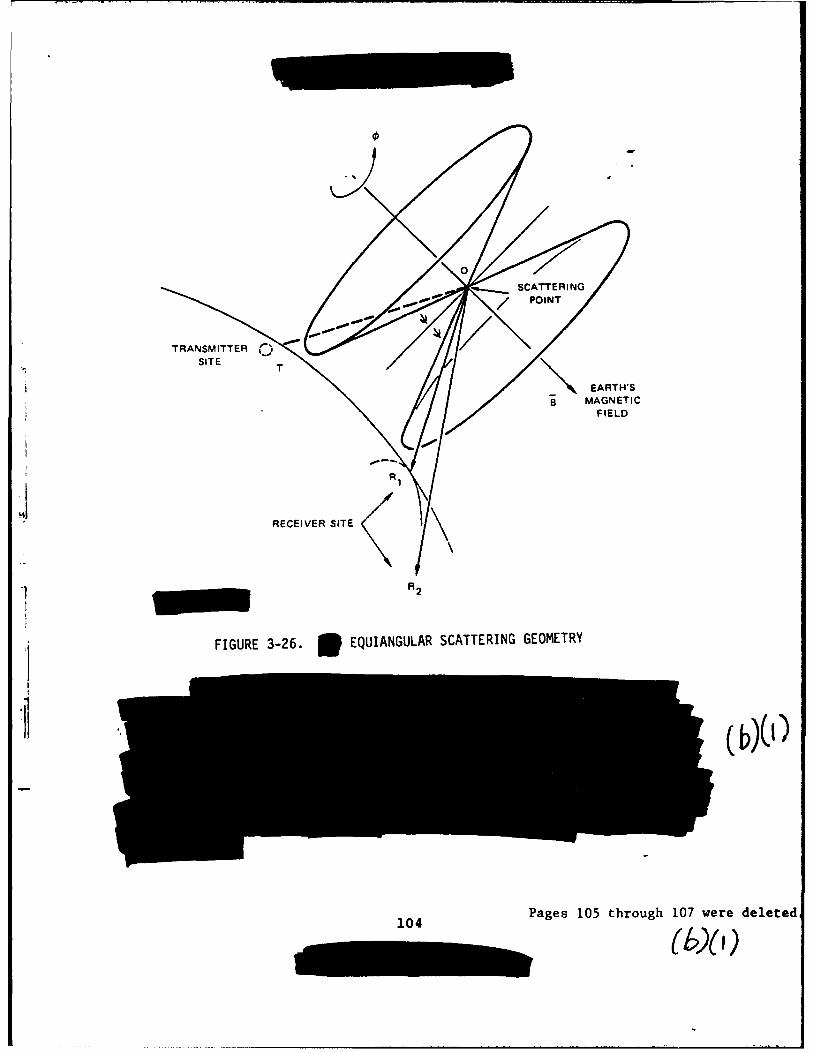
3-26w Equiangular scattering geometry ------- 104
3-27 Paths and time durations of off-path modesresulting from high altitude ionization - - - 105
3-28 Geomagnetic relationship on Canton toHawaii and Midway paths and measuredpropagation spectrum ------------- 107
4-1 NMCS C 3 facilities--pre-hostilities - - - - 116
4-2 NMCS C 3 facilities-H + 33 min -------- 117
LIST OF ILLUSTRATIONS (Continued)
Figure Page
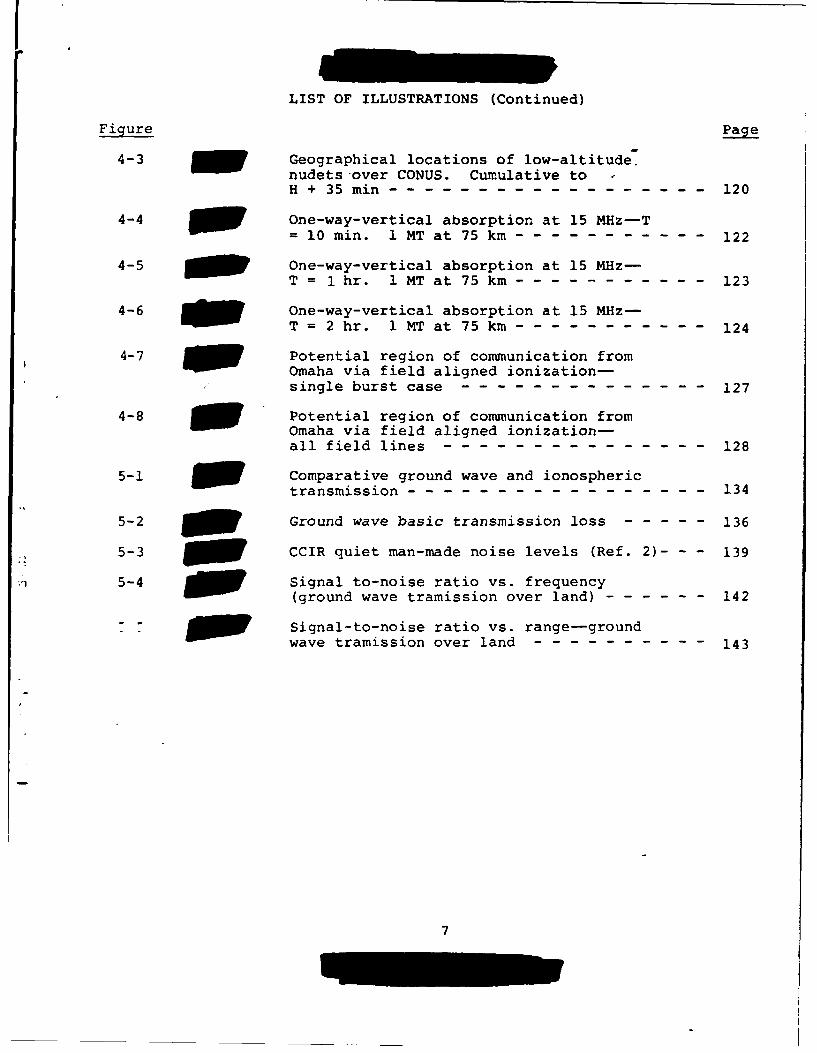
4-3 Geographical locations of low-altitude.nudets over CONUS. Cumulative toH + 35 min ------------------ 120
4-4 One-way-vertical absorption at 15 MHz-T= 10 min. 1 MT at 75 km ----------- 122
4-5 m One-way-vertical absorption at 15 MHz-T = 1 hr. 1 MT at 75 km ----------- 123
4-6 One-way-vertical absorption at 15 MHz-T = 2 hr. 1 MT at 75 km ----------- 124
4-7 Potential region of communication fromOmaha via field aligned ionization-single burst case -------------- 127
4-8 Potential region of communication fromOmaha via field aligned ionization-all field lines --------------- 128
5-1 Comparative ground wave and ionospheric
transmission ----------------- 134
5-2 Ground wave basic transmission loss ----- 136
5-3 CCIR quiet man-made noise levels (Ref. 2)- - - 139
5-4 Signal to-noise ratio vs. frequency(ground wave tramission over land) ------ 142
Signal-to-noise ratio vs. range-groundwave tramission over land ---------- 143
7

OF TABLES
Table 4jj ijjj Page
2-1 Data Base ------------------- 25
2-2 a One-way vertical absorption, BIGHORN - - - 32
2-3 - One-way vertical absorption, ALMA ----- 32
3-1 Perceptions of the survivability ofHF communications systems ---------- 58
3-2 Major HF Nuclear effects codes ------- 74
3-3 Predictability of the effects ofvarious nuclear phenomena ---------- 81
4-1 Physical damage by blast summary ------ 118
4-2 Duration of blackout-absorption only - - - - 126
8 Pages 9 and 10 were deleted.
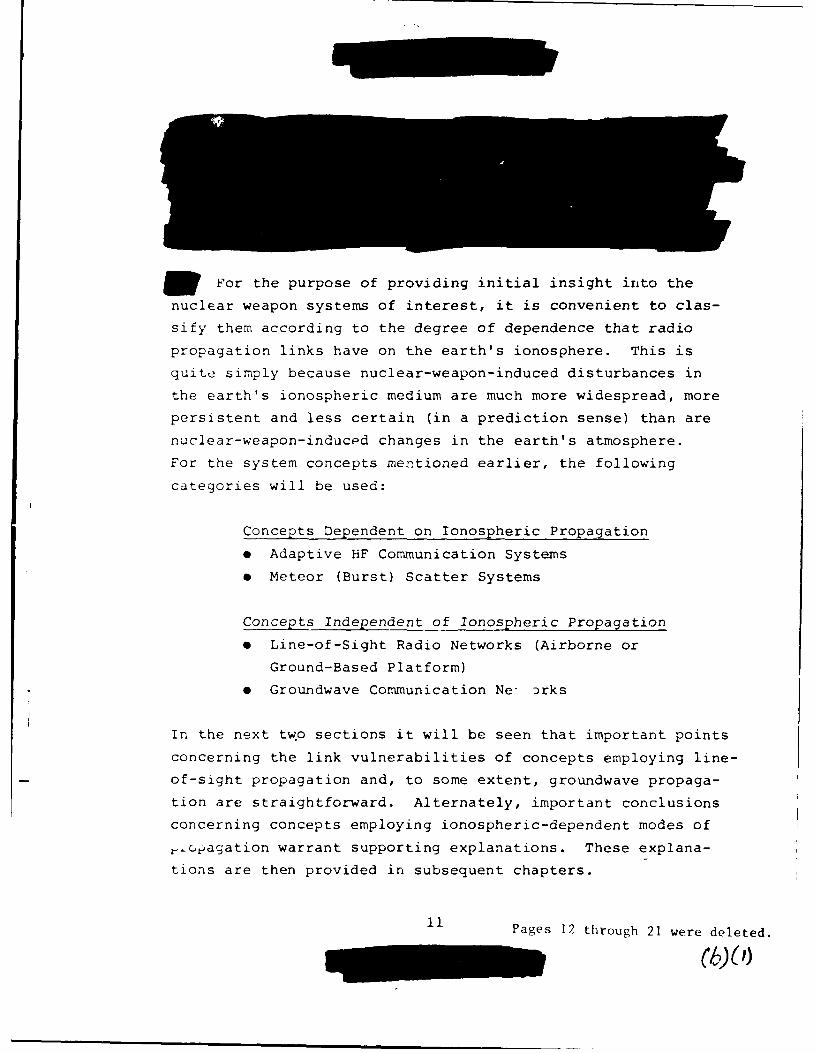
For the purpose of providing initial insight into the
nuclear weapon systems of interest, it is convenient to clas-
sify them according to the degree of dependence that radio
propagation links have on the earth's ionosphere. This is
quite simply because nuclear-weapon-induced disturbances in
the earth's ionospheric medium are much more widespread, more
persistent and less certain (in a prediction sense) than are
nuclear-weapon-inducpd changes in the earth's atmosphere.
For the system concepts mentioned earlier, the following
categories will be used:
Concepts Dependent on Ionospheric Propagation
* Adaptive HF Communication Systems
* Meteor (Burst) Scatter Systems
Concepts Independent of Ionospheric Propagation
e Line-of-Sight Radio Networks (Airborne or
Ground-Based Platform)
e Groundwave Communication Ne Drks
In the next two sections it will be seen that important points
concerning the link vulnerabilities of concepts employing line-
of-sight propagation and, to some extent, groundwave propaga-
tion are straightforward. Alternately, important conclusions
concerning concepts employing ionospheric-dependent modes of
ecagation warrant supporting explanations. These explana-
tions are then provided in subsequent chapters.
11 Pages 12 through 21 were deleted.

SECTION 2. NHF PROPAGATION IN A NUCLEARENVIRONMEMF- A TECHNICAL ASSESSMENT
2.1 THE U.S. EXPERIENCE - A DATA BASE OVERVIEW .
W HF skywave propagation in a nuclear environment is byno means a clear-cut matter of poor performance. The viability
of HF skywave in a nuclear environment has been and will con-
tinue to be a controversial issue in the C3 community. Although
no compelling reason exists for providing herein an historical
and detailed description of the many intercommunity quarrels
and misconceptions that have emerged over the years, some per-
spective on tLe issue concerning the reliability of skywave
communications is warranted. One of the more reasonable avenues
toward understanding skywave problems in a nuclear environment
is to examine the test data base itself. The following discus-
sion [1] provides a succinct review of the U.S. experimental
experience.
2.1.1 U.S. Data Base
22 Pages 23 through 32 were deleted.

WPrompt radiation from a high-altitude detoncation (x-rays,
neutrons and gamma-rays) can produce a level of ionization in the
lower ionosphere that is sufficiently high that, after a cer-
tain amount of time, additional radiation will neither add
appreciably to the ionization level nor lengthen its decay.
The ionospheric electron density at a postburst time, t, is
N (o)Ne~t I + aN e(o~t '
e
where N (o) is the initial electron density produced by thee
radiation pulse and a is the electron-ion recombination coef-
ficient, which is of 0(10- 7 cm-/sec). If the condition
aN (o)t >> 1 is met, then Ne (t) becomes independent of Ne (o)
after a time t (e.g., if Ne (O) ' 108 e-/cm , then Ne (t) is
saturated after 1 sec).
2.2.2 F-Layer Depletion Effects
33 Pages 34 thrQugh 52 were deleted.( I,
REFER -CS
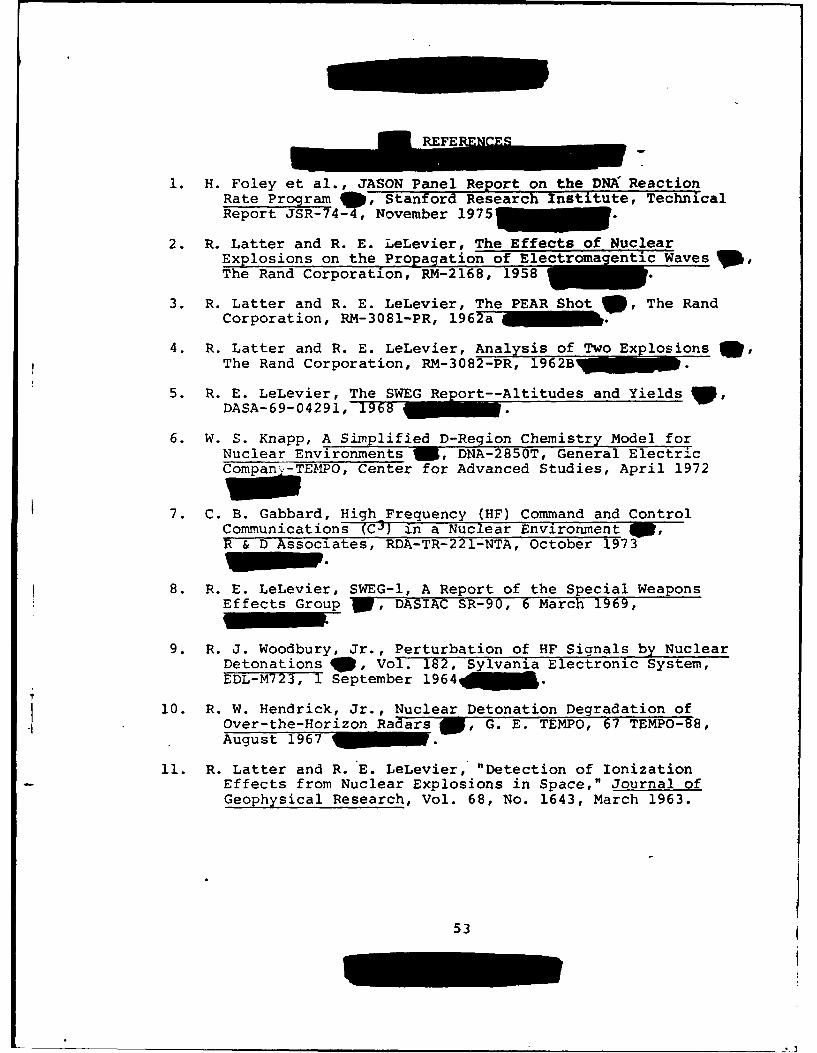
1. H. Foley et al., JASON Panel Report on the DNA ReactionRate Program *, Stanford Research Institute, TechnicalReport JSR-74-4, November 1975.
2. R. Latter and R. E. LeLevier, The Effects of NuclearExplosions on the Propagation of Electromagenti- WavesWThe Rand Corporation, RM-2168, 1958 "
3. R. Latter and R. E. LeLevier, The PEAR Shot , The RandCorporation, RM-3081-PR, 1962.in
4. R. Latter and R. E. LeLevier, Analysis of Two Explosions *,The Rand Corporation, RM-3082-PR, 196ZB.
5. R. E. LeLevier, The SWEG Report--Altitudes and YieldsDASA-69-04291, 6
6. W. S. Knapp, A Simplified D-Region Chemistry Model forNuclear Environments W, DNA-2850T, General ElectricCompany-TEMPO, Center for Advanced Studies, April 1972
7. C. B. Gabbard, High Frequency (HF) Command and ControlCommunications C) in a Nuclear Environment ,R & D Associates, RDA-TR-221-NTA, October 1973
8. R. E. LeLevier, SWEG-I, A Report of the Special WeaponsEffects Group , DASIAC SR-90, 6 March 1969,
9. R. J. Woodbury, Jr., Perturbation of HF Signals by NuclearDetonations ", Vol. 182, Sylvania Electronic System,EDL-M723, 1 September 1964.
10. R. W. Hendrick, Jr., Nuclear Detonation Degradation ofOver-the-Horizon Radars G. E. TEMPO, 67 TEMPO- 8,August 19W.
11. R. Latter and R. E. LeLevier, "Detection of IonizationEffects from Nuclear Explosions in Space," Journal ofGeophysical Research, Vol. 68, No. 1643, March 1963.
53

3 REFERENCES (CONCLUDED)
12. W. S. Knapp, private communication.
13. J. B. Lomax, D. L. Nielson and R. A. Nelson, ContourMaps of Critical Frequency Illustrating Effects on theIonosphere of High-Altitude Nuclear Tests , DNAReport 1657, Stanford Research Institute, rovember 1965
I
L5
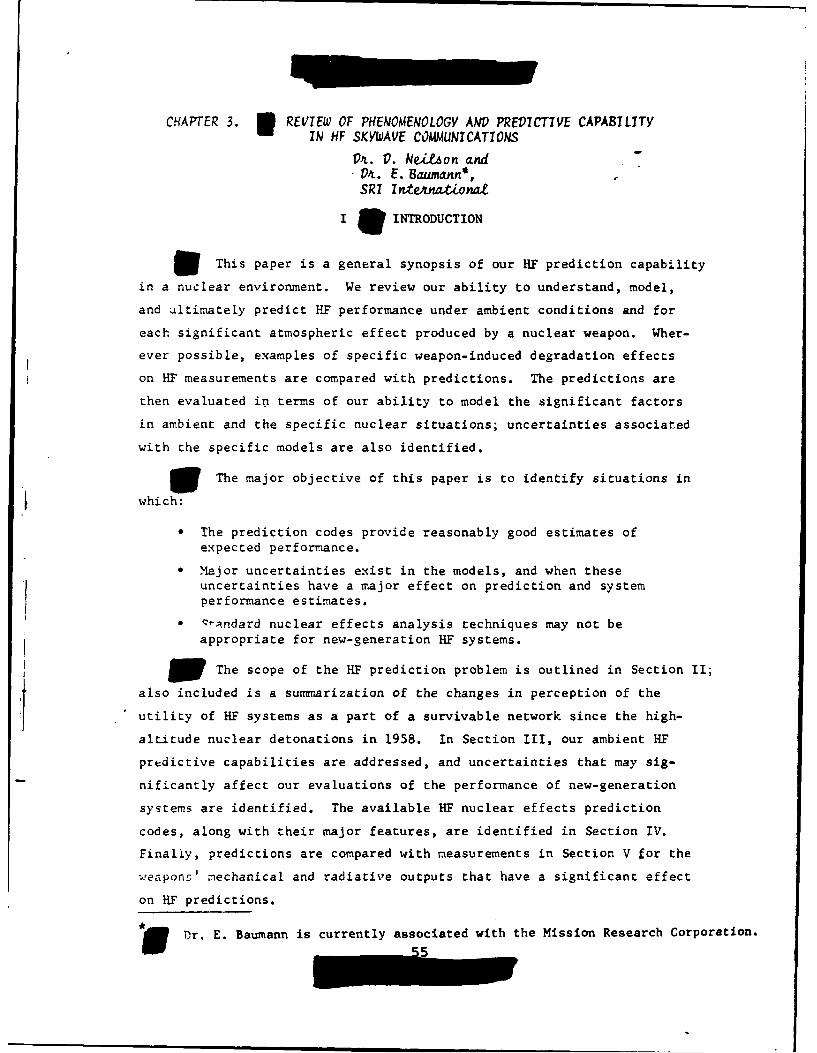
CHAPTER 3. 3 REVIEW OF PHENOMENOLOGY AND PREDICTIVE CAPABILITYIN HF SKYWAVE COMMUNICATIONS
D&. V. Ne.zon andDr. E. Baumann*,SRI Intmationat
I i INTRODUCTION
SThis paper is a general synopsis of our HF prediction capabilityin a nuclear environment. We review our ability to understand, model,
and ultimately predict F performance under ambient conditions and for
each significant atmospheric effect produced by a nuclear weapon. Wher-
ever possible, examples of specific weapon-induced degradation effects
on HF measurements are compared with predictions. The predictions are
then evaluated in terms of our ability to model the significant factors
in ambient and the specific nuclear situations; uncertainties associated
with the specific models are also identified.
W The major objective of this paper is to identify situations in
which:
* The prediction codes provide reasonably good estimates ofexpected performance.
" Major uncertainties exist in the models, and when theseuncertainties have a major effect on prediction and systemperformance estimates.
0 1,Andard nuclear effects analysis techniques may not be
appropriate for new-generation HF systems.
W The scope of the HF prediction problem is outlined in Section 11;
also included is a summarization of the changes in perception of the
utility of HF systems as a part of a survivable network since the high-
altitude nuclear detonations in 1958. In Section LII, our ambient HF
predictive capabilities are addressed, and uncertainties that may sig-
nificantly affect our evaluations of the performance of new-generation
systems are identified. The available HF nuclear effects prediction
codes, along with their major features, are identified in Section IV.
Finally, predictions are compared with measurements in Section V for the
,!eapon' mechanical and radiative outputs that have a significant effect
on HF predictions.
U Dr. E. Baumann is currently associated with the Mission Research Corporation.
Ii. HISTORY OF HF PERFORMANCE IN A NUCLEAR ENVIRON4%1T
Evaluation of the'ability to predict HF performance in a nu-
clear environment requires (1) assessment of the prediction capabilities
in a natural environment and (2) review and assessment of our understand-
ing of the interactions of a nuclear detonation with the propagation
-rii'l-. Prediction of ambient propagation conditions is in itself a
formidable task: at least eight basic factors must be accounted for to
adequately represent electron density profiles along a path. The ambient
electron density exists in a delicate balance of electron and ion produc-
tion mechanisms that is susceptible to day-to-day changes and differs
greatly as a function of: (1) time of day, (2) season, (3) latitude,
anj (4) solar activity. The HF system performance predictions must also
account for other factors relating to the specific propagation path:
(5) length, (6) orientation, (7) location, and finally (8) the system
characteristics.
W A.-ecuate representation of propagation conditions in the natu-
ral environment is very important to nuclear predictions because:
0 The nuclear effects are superimposed on the background
electron density profile.
* The background electron density profile provides the base-
line for computing the ionospheric recovery from the radia-tive and mechanical effects of a nuclear detonation.
W System performance predictions in the nuclear environment must
account for the eight factors that control the ambient conditions and
six additional factors concerning the burst: (1) altitude, (2) yield,
(3) location with respect to the propagation path, (4) single or multiple
burst, (5) type of weapon, and (6) time after burst. Thus, accounting
for and modeling these 14 factors makes predicting HF performance in a
nuclear environment a truly m:ultidimensional problem.
56 Pages 57 through 59 were deleted.
III PREDICTION OF TIE AMBIENT IONOSHERE AND OF THE PROPAGATIONCONDITIONS
A. I Ionospheric Predictions
Wf The veracity of HF propagation and system performance predic-
tions depends critically on the validity of the ionospheric model that
depicts the ambient electron density profile along a path.
M Available ionospheric models range in complexity from those de-
picting a single electron density profile to those using a multiple param-
eter representation that is variable in time and space. Here, we attempt
to focus on our prediction capabilities--ionospheric and propagation--
and our ability to relate them to emerging problems of evaluating the
potential performance of new-generation HF systems. A significant number
of these problems center on our ability to model and predict the often
rapidly changing ionospheric conditions in the auroral and polar regions.
W One of the more comprehensive available ionospheric models has
been developed by the ITS. The ITS model contains worldwide maps of
foF2' M(3000)F2 , foE, and fEs, which are provided as functions of local
time, month, latitude, and sunspot activity. Scaled vertical-incidence
...... , recorded at hourly intervals at many stations throughout the
world over extended periods of time, constitute the data base for this
model. The model provides a good statistical representation of the
monthly median E- and F-layer parameters and the median and decile values
of fEs. Factors are available for adjusting the median F-region param-
eters to those at the upper decile value. A model describing the iono-
spheric conditions in the auroral and polar regions has been developed
recently.- This model has a somewhat larger high-latitude data base
and provides greater detail of the fine-scale structured ionosphere that
exists in those regions. Again, however, it largely represents monthly
median conditions. The auroral model has recently been integrated into
60
the ITS model by SRI, and the combination probably provides the most
comprehensive worldwide ionospheric model now available.1-
W Since the available ionospheric models represent median iono-
spheric conditions, predictions of the maximum propagating frequencies
are lower than actual 50 percent of the time. Variations between the
decile values and the monthly median values of ionospheric parameters are
on the order of 20 to 30 percent, even for magnetically quiet midlatitude
conditions; they are thought to be even greater in the auroral, polar, and
equatorial regions.
W A number of physical phenomena produce the ionospheric varia-
tions chat are translated into comparable changes in the 1IF propagation
spectrum. The physical phenomena that produce upper decile ionospheric
values are the result of enhanced solar flux, movements of ionization--
e.g., traveling disturbances, ionospheric storms, and magnetic disturb-
ances--and sporadic E. Unfortunately, the various phenomena produce
ioncspheric changes with significantly different temporal behavior and
spatial extents. Changes resulting from increased solar flux are wide-
spread, persistent, and correlated in time and space, while changes re-
sulting from traveling ionospheric disturbances or sporadic E are expected
to be somewhat local and decorrelated in time and space.
W Estimating the degree of spatial correlation of the F-region
variations is extremely important in the evaluation of network connec-
tivity for the new-generation HF systems, because the network encompasses
a large geographic area and separated links are relied on for redundancy.
For example, the usefulness of the abnormally high frequencies for the
advanced system may depend on the degree of spatial correlation of the
upper decile frequencies. Carefui treatment of the occurrence of higher
frequencies is important in a network analysis because, particularly in
nuclear situations, the higher frequencies are expected to provide the
bes:, and in many situations the only, available communication channels
for network connectivity.
61
B. Propagation Predictions
WAll general-purpose models for predicting nuclear effects on HF
propagation and the resulting system performance represent a series of
tradeoffs. One of the major tradeoffs in the propagation model is be-
tween computational costs and the need to preserve the detail provided
by the ionospheric and nuclear effects models. Some propagation programs
that match the detail of, say, the WEPH code require ray tracing to ac-
curately portray the impact. If a large number of links and weapons are
involved in the analysis, the computational costs become unaffordable.
On the other hand, programs that can cope with the large number of links
economically must simplify their approach to propagation and link analysis.
U Historically, H' propagation predictions have centered on pre-
dicting the upper frequency of the propagation spectrum over a given path
and, through estimating the signal-to-noise ratio at the receiver, the
lowest frequency. Occasionally the predictions account grossly for the
effects of multipath--a measure of the received signal's time dispersion--
b" predicting all successfully received rays and their corresponding sig-
nal strength.
WMost HF propagation models associated with nuclear effects pre-diction use a parabolic representation of the electron density profile;
this parabolic representation represents a compromise between computa-
-r speed, derived from ray equations having a closed form solution,
and ray path accuracy. However, since the ionospheric models represent
only median conditions anyway, results obtained with the parabolic repre-
sentation appear adequate for most systems applications.
3 Much, if not most, of our present modeling of the ionosphere
came from sweep-frequency pulse measurements, called ionograms, taken
around the world. Usually taken at vertical incidence, these records
have been translated into electron density profiles over time and space.
Bistatic, or oblique, ionograms are similar and relatable, with some as-
sumptions, to those taken at vertical incidence (Figure 1). Both verti-
cal and oblique records were taken as diagnostic data during a number of
nuclear tests. The oblique record principally shows the propagating
62

2FM
i
3FE
2F
IF lit
"'iB
3E !" -, Ii' "
2 E ' g o t 11,
4 5 67810 12 14 16 20 24 2832 40 48 56 64
FREQUENCY - MHz
fv " fOB "iiFIGURE 3-1 O OBLIQUE-INCIDENCE IONOGRAMS SHOWING (a) IDENTIFICATION
OF RAYPATHS AND (b) OBLIQUE-VERTICAL CORRESPONDENCE
spectrum between two points. Incidentally, it may indicate some aspects
'f the nuclear detonation itself. For example, absorption resulting from
pror-pt or delayed radiation will affect the lower frequencies, while
F-region waves or ionization will affect the higher frequencies. We will
63
refer to records of this type below. First, let us examine our ability
to predict ionospheric behavior as it affects communication parameters.
C. 3 Comparisons of Measurements with Predictions
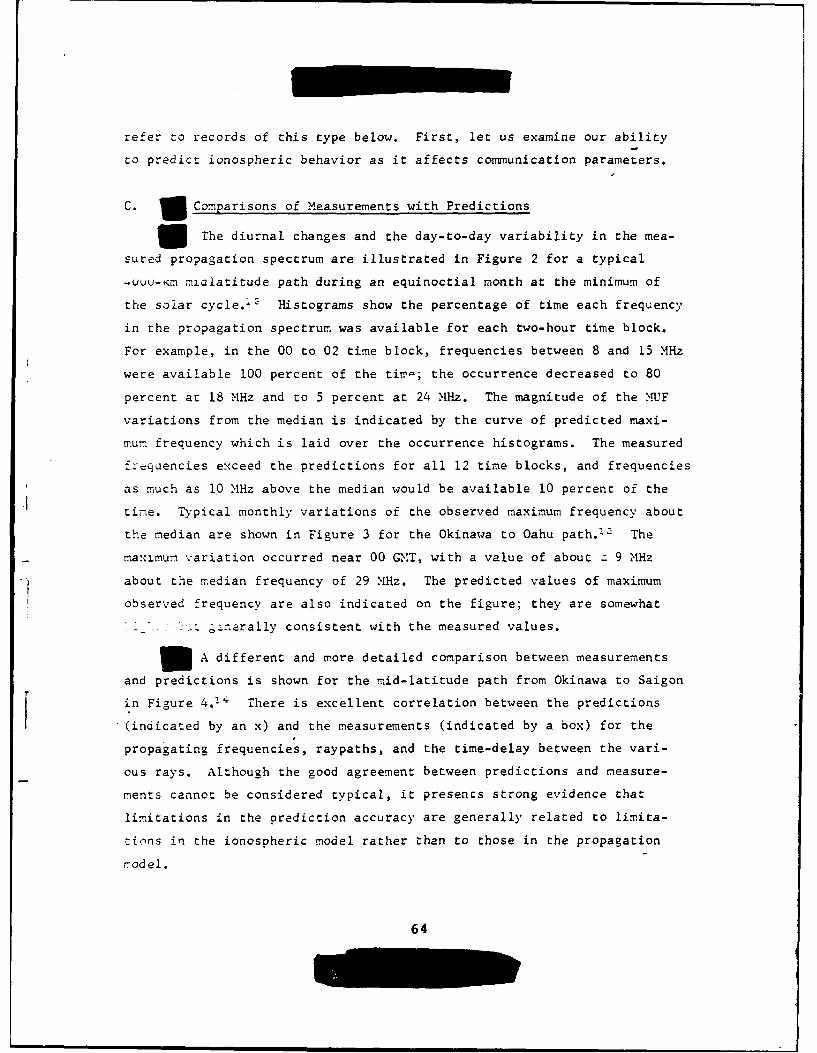
The diurnal changes and the day-to-day variability in the mea-
sured propagation spectrum are illustrated in Figure 2 for a typical
-uuu-tm m1olatitude path during an equinoctial month at the minimum of
the solar cycle."2 Histograms show the percentage of time each frequency
in the propagation spectrum was available for each two-hour time block.
For example, in the 00 to 02 time block, frequencies between 8 and 15 MHz
were available 100 percent of the timp; the occurrence decreased to 80
percent at 18 MHz and to 5 percent at 24 MHz. The magnitude of the MUF
variations from the median is indicated by the curve of predicted maxi-
mum frequency which is laid over the occurrence histograms. The measured
frequencies exceed the predictions for all 12 time blocks, and frequencies
as much as 10 MHz above the median would be available 10 percent of the
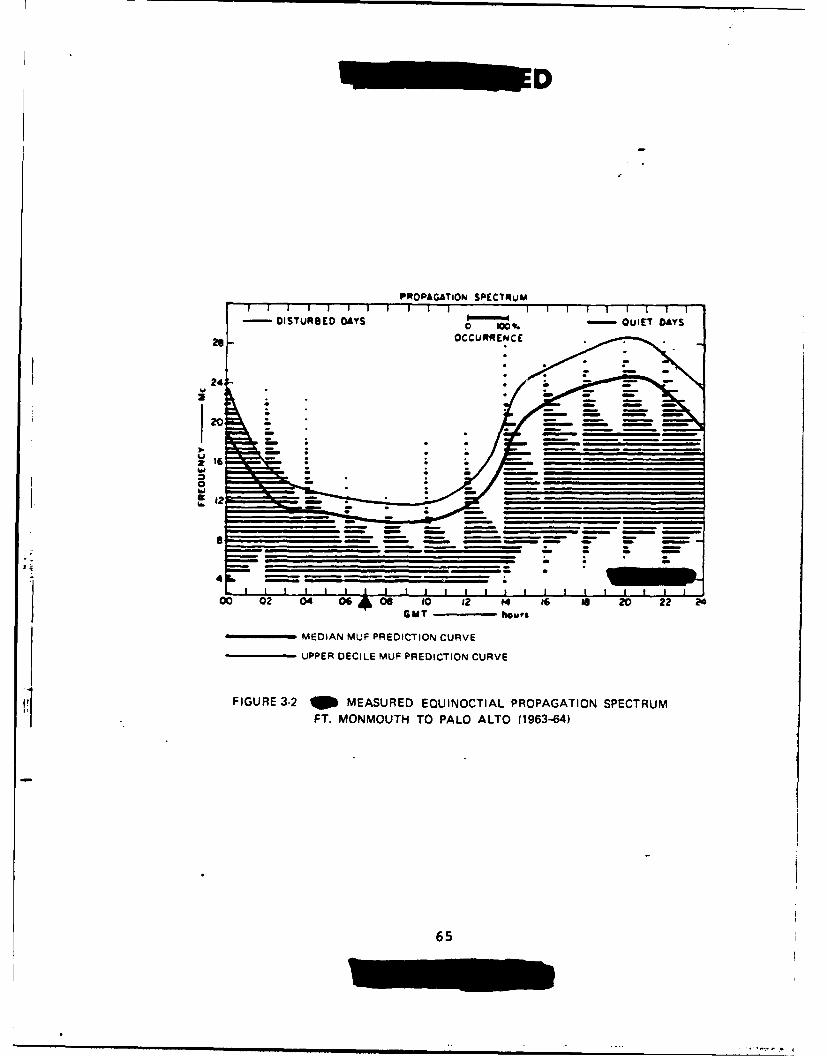
time. Typical monthly variations of the observed maximum frequency about
the median are shown in Figure 3 for the Okinawa to Oahu path.': The
maximum variation occurred near 00 GMT, with a value of about z 9 MHz
about the median frequency of 29 MHz. The predicted values of maximum
observed frequency are also indicated on the figure; they are somewhat
-l ;_narally consistent with the measured values.
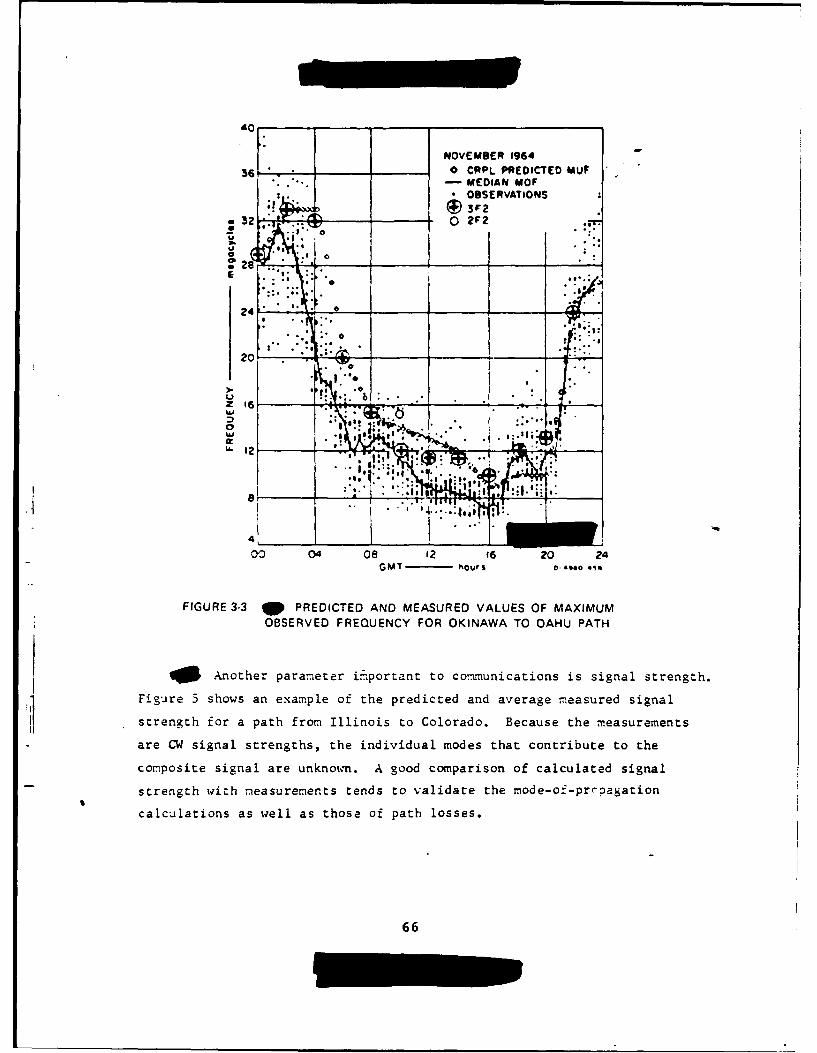
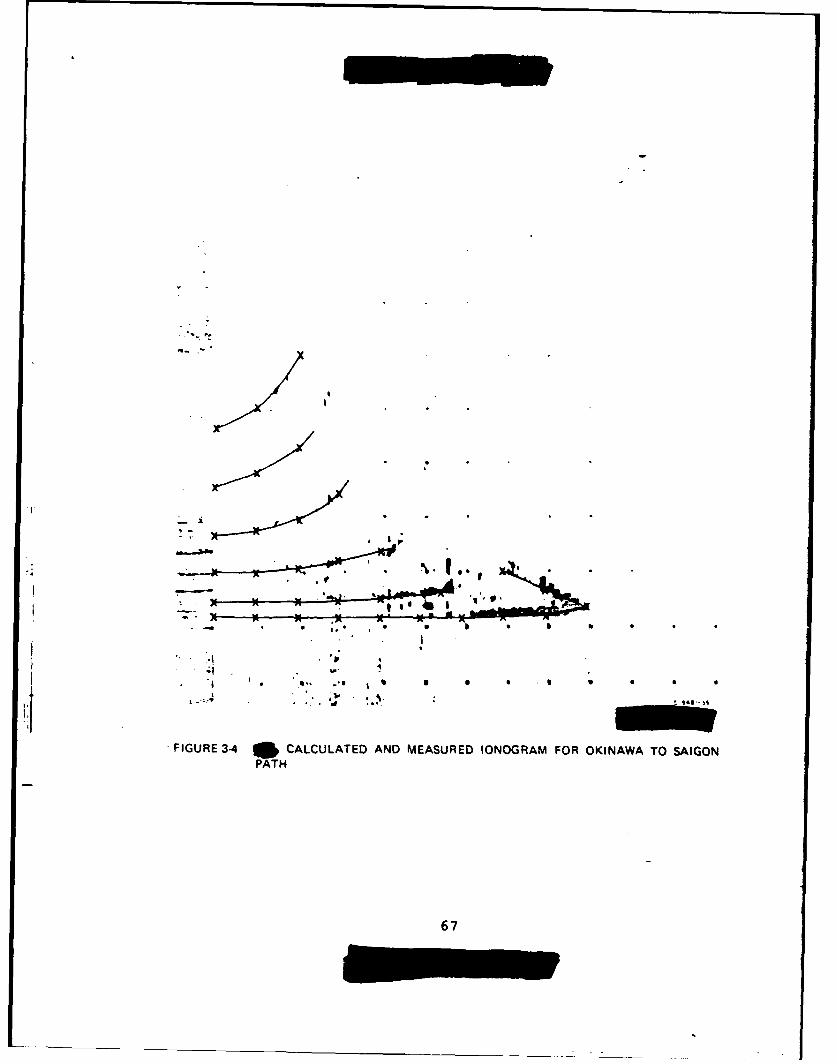
rn A different and more detailed comparison between measurementsand predictions is shown for the mid-latitude path from Okinawa to Saigon
in Figure 4.1' There is excellent correlation between the predictions
(indicated by an x) and the measurements (indicated by a box) for the
propagating frequencies, raypaths, and the time-delay between the vari-
ous rays. Although the good agreement between predictions and measure-
ments cannot be considered typical, it presents strong evidence that
limitations in the prediction accuracy are generally related to limita-
tions in the ionospheric model rather than to those in the propagation
rod el.
64
PROPAGATION SPECTRUM
29- OCCURENC
24-
Nj __ ____ ____ ____7___
00 02 04 064 06 10 12 14 16 56 20 22 ?4
MEDIAN MUjF PREDICTION CURVE
UPPER DECILE MUF PREDICTION CURVE
FIGURE 3-2 06 MEASURED EQUINOCTIAL PROPAGATION SPECTRUMFT. MONMOUTH TO PALO ALTO (1963-64)
65
do
6"NOVEMBER 19643 _ _0 CRPL PREDICTED MUF
• .- MEDIAN MOFOBSERVATIONS
32 0___ O 2F2
: • .1 O2
28 __ _ _ ___ _E: "
, .. .. ;
I, _ _ ,, -
20
* 0- .:.. :..:2NC
.. . • . , : .. ; i
00 04 08 12 f6 20 24
G MT- '%outs 0 .': *o4-51
FIGURE 3-3 W PREDICTED AND MEASURED VALUES OF MAXIMUMOBSERVED FREQUENCY FOR OKINAWA TO OAHU PATH
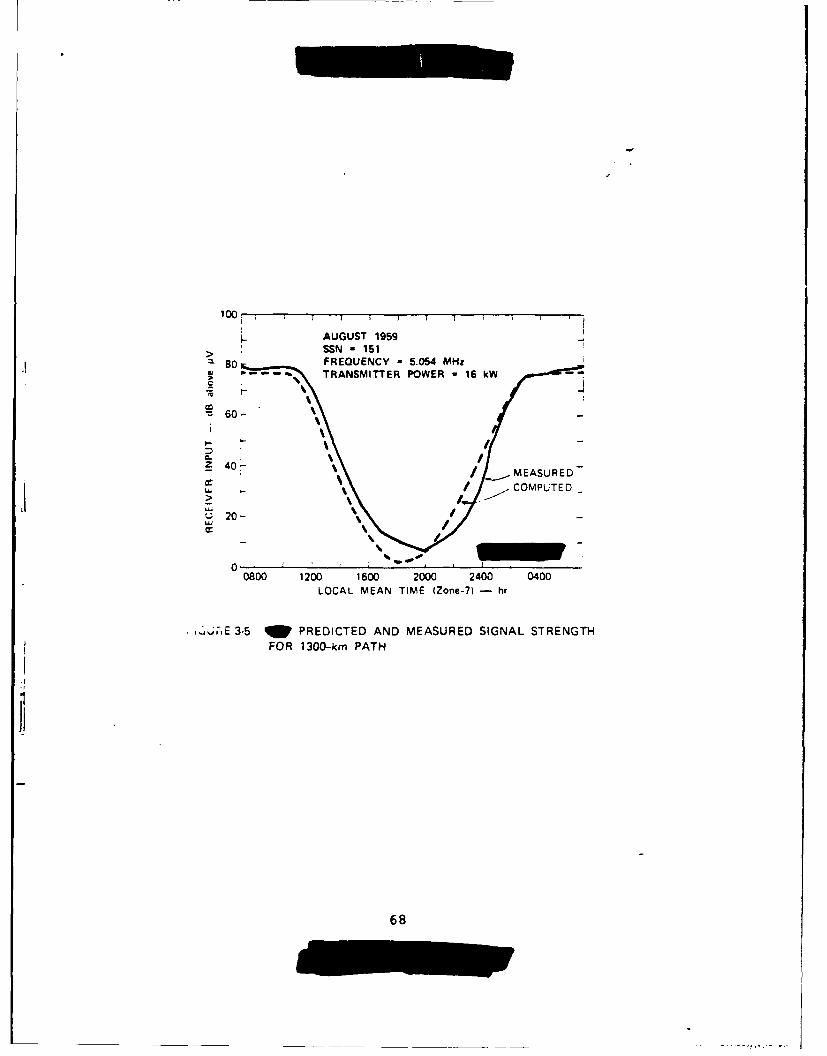
go Another parameter iportant to communications is signal strength.
Figure 5 shows an example of the predicted and average measured signal
strength for a path from Illinois to Colorado. Because the measurements
are CW signal strengths, the individual modes that contribute to the
composite signal are unknoun. A good comparison of calculated signal
strength with measurements tends to validate the mode-of-prcoagation
calculations as well as those of path losses.
66
ai. ,.,.
-*t• .o I q * b *
FIGURE 3-4 CALCULATED AND MEASURED IONOGRAM FOR OKINAWA TO SAIGONPATH
67
100,
AUGUST 1959> SSN - 151
80 FREQUENCY = 5.054 MHzTRANSMITTER POWER " 16 kW
60-
C-40 \jMEASURED-
- COMPUTED
20-
0 *
0800 1200 1600 2000 2400 0400LOCAL MEAN TIME (Zone-7) - hr
.,3J,-E 3-5 4W PREDICTED AND MEASURED SIGNAL STRENGTH
FOR 1300-km PATH
ii
68

IV W NUCLEAR HF PREDICTION TECHNIQUES
A. 1 General
o Most of the energy (about 95 percent) of a nuclear explosion
is released as prompt radiation at the instant of detonation. Prompt
radiation consists of X-rays (about 70 percent), debris kinetic energy
(about 25 percent), and neutrons (about 1 percent). The remaining 5
percent of the energy--called delayed radiation--is divided equally be-
tween gamma rays and beta particles and is released gradually as the
decaying fission debris rises and expands.
M Four major potential sources of degradation must be considered
in analyzing HF performance in a nuclear environment:
" The early-time D-region signal absorption, resulting fromprompt plus delayed radiation sources.
" The late-time D-region signal absorption, resulting fromdelayed g-=a ray and beta particle ionization.
" Changes in the propagating spectrum produced by travelingdisturbances in the F-region.
* Increased scintillations and multipath from high-altitude
ionization.
W Although there is no clear-cut demarcation between "early times"
and "late times," we loosely define the former as the time frame in which
absorption owing to X-rays and gamma rays dominates.
l B Although the delayed radiation is only a small fraction of the
total energy released by a nuclear detonation, it is the source of per-
sistent HF signal absorption. Whereas the prompt radiations deposit
their energy in a single impulse, the delayed radiation is emitted con-
tinuously as the fission debris undergoes radioactive decay. Its initial
intensity depends on the fission yield, rather than the total yield, of-1.2
the weapon, and it decreases as t , or slightly faster than- inversely
ich tine. As the debris rises and expands, the spatial extent of
69
ionization produced by delayed radiations increases. After the debris
reaches its stabilization altitude, its distribution depends largely on
atmospheric winds.
.11
B. Nuclear Effects Prediction Codes
W HF nuclear effects predictions generally entail the use of five
co-.plex physical models to account for the significant ionospheric, propa-
gation and system parameters. There are a number of prediction programs
available, and the five models have varying degrees of sophistication.
So-.e of the various models and their available options are:
(1) Ionospheric models
(a) Constant electron density profiles along a propaga-tion path
(b) Varvina crofiles in time and space that representonthly median profiles
ic) Specified (analytical) profiles
70

(d) One or multiple parameters depicting major at-tributes of a profile
(2) Propagation models
(a) Virtual geometry ray calculations for specified modestructures
(b) Raytracing techniques without limiting the modestructure
(3) Noise model
(a) Worldwide noise maps
(b) Calculated noise values based on virtual noise sources
(4) System model
(a) Path loss calculations
(b) Signal-to-noise ratios
(c) Signal characteristics, including estimates of signaldistortions
(5) Nuclear effects models
(a) Prompt radiation
(b) Delayed radiation
(c) Fireball/debris phenomenology
(d) Debris location
(i) Early times
(ii) Late times
(e) Ionospheric wave motions
WIt is useful at this point to discuss a few aspects of the de-
velopment and evolution of the nuclear effects prediction models. The
first comprehensive prediction model, termed WEPH, was developed in the
early 1960s on the basis of empirical data collected during the 1958 and
1962 nuclear test series in the Pacific. As understanding of the inter-
actions of a nuclear detonation with the surrounding medium has increased,
WEPH has been routinely updated to reflect the current understanding.,"
The updates reflect the work of many study groups that address specific
phenomena relating to a nuclear detonation--i.e., fireball and debris
phInoenology, atmospheric chemistry, heave, winds, striations, and
clutter. The model' developed by the special studies generally entail
Lhe use of complex multispecies codes that model the physical processes
71
L - - - m m m m m m m m mmm

appropriate to a specific study. Such codes are extremely expensive to
run and, accordingly, are not appropriate for typical systems analysis
problems. To provide a useful systems analysis predictioa code, the cur-
rent version of WEPH uses analytic approximations with accuracies that
are consistent with the current state of knowledge for each physical
phenomenon.
W Given that the nuclear effects model that one may use for a
specific study represents the current state of knowledge, an HF prediction
code must adequately represent the propagation conditions along a path to
provide meaningful results. In contrast with predictions of systems that
operate at frequencies that only propagate via line-of-sight, predictions
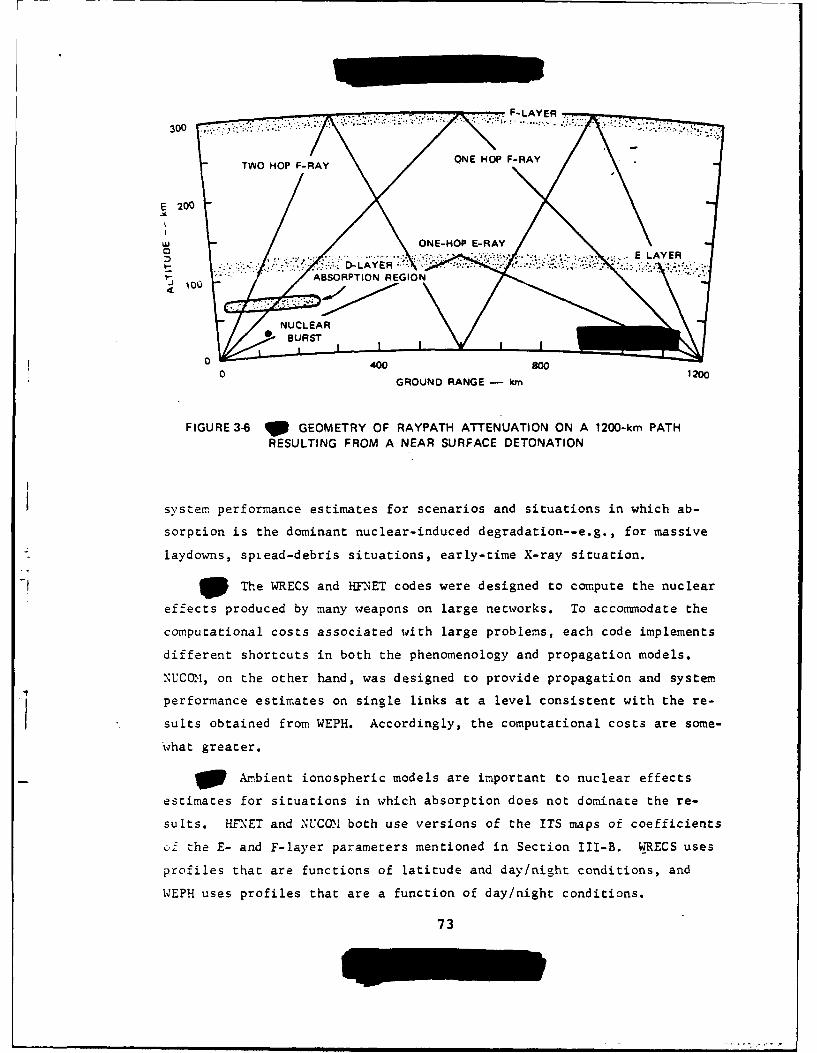
of the HF raypath ciLaracteristics in a nuclear environment must consider
the multiray property of HF propagation. This is particularly important
when the burst-produced absorption region is small compared to the inter-
ray spacing, as illustrated in Figure 6. Three raypaths are shown con-
necting the transmitter to the receiver, but only two--the IF and 2F--
intersect the nuclear-induced absorption region. Consequently, signals
propagating via the 1E ray will be successfully received; no significant
change in received signal strength is expected for the nuclear case, since
under am ,bient conditions the signal strength is approximately comparable
on the IE and IF raypath and only slightly lower on the 2F raypath.
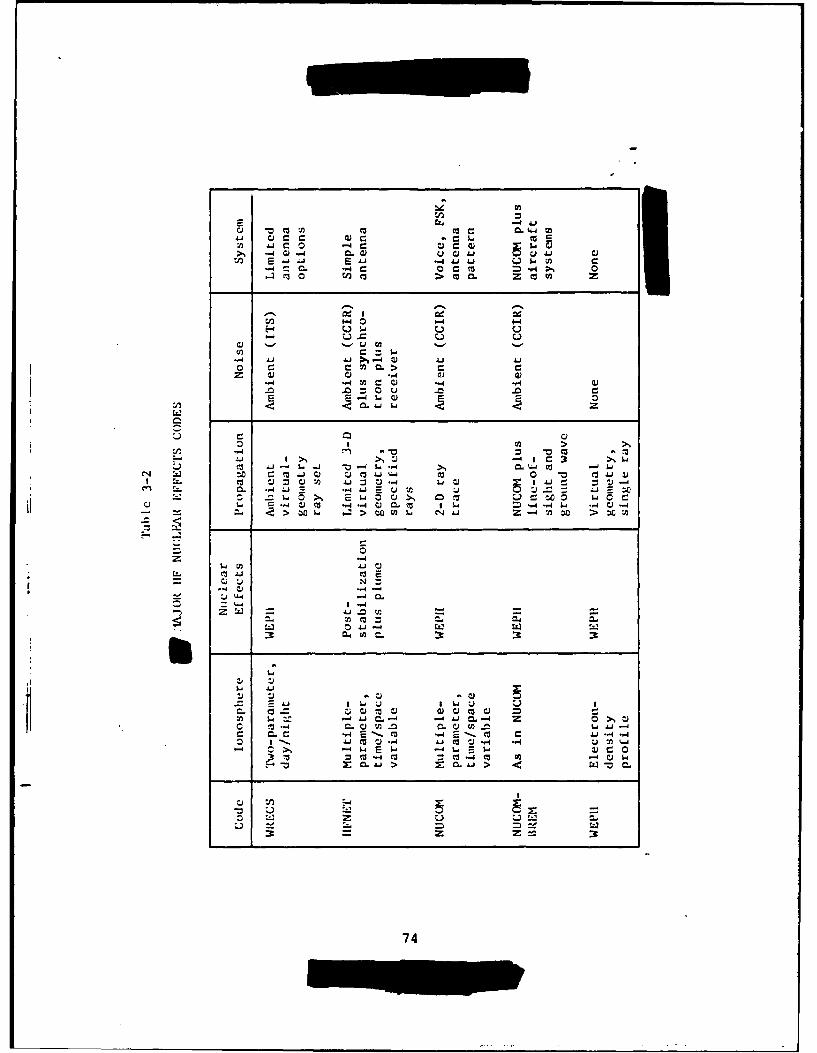
WThe major HF nuclear effects prediction codes that are avail-able through the DNA are listed in Table 2.1511 Each code's design and
complexity varies considerably and reflects the wide range of problems
of HF predictions. Because of the wide range of HF problems, no attempts
are made in this review to evaluate the merits of the various codes; in-
stead, factors are identified that may affect the prediction results for
certain classes of problems.
W The primary purpose of the WEPH code is to model the interac-
tions of single or multiple weapons with the surrounding medium. It is
an integral part of the NUCOM, NUCOM-BREM and WRECS codes. WEPH provides
one-way absorption estimates along a straight line. Thus, although-WEPH
does no: have an HF propagation model, the code can provide first-order
72
F ~~~~~~~LAYER ' ; "'""" ""-
300
TWO HOP F-RAYY NE HOP F-RAY
E 200
)=,o _ ,.:.,ONE-HOP E-RAY
: ." ; .':: D-LAYER; -'. . E LAYERSlot)ABSORPTION REGION
NUCLEAR
~BURST
0 1200GROUND RANGE -km
FIGURE 3-6 * GEOMETRY OF RAYPATH ATTENUATION ON A 1200-km PATHRESULTING FROM A NEAR SURFACE DETONATION
system performance estimates for scenarios and situations in which ab-
sorption is the dominant nuclear-induced degradation--e.g., for massive
laydowns, spiead-debris situations, early-time X-ray situation.
The WRECS and UFNET codes were designed to compute the nuclear
effects produced by many weapons on large networks. To accommodate the
computational costs associated with large problems, each code implements
different shortcuts in both the phenomenology and propagation models.
NUCOM, on the other hand, was designed to provide propagation and system
performance estimates on single links at a level consistent with the re-
suits obtained from WEPH. Accordingly, the computational costs are some-
what greater.
o Ambient ionospheric models are important to nuclear effects
estimates for situations in which absorption does not dominate the re-
sults. HnET and NUCON both use versions of the ITS maps of coefficients
vf the E- and F-layer parameters mentioned in Section III-B. WRECS uses
profiles that are functions of latitude and day/night conditions, and
WEPH uses profiles that are a function of day/night conditions.
73
7) m~J :nI.t"Uw
>S~~.- -4()- .Q - 4
m 0 nr o L zc
1-4 0
C))
-4 .6 > -. J-
0N c af %n~C =.> 0r_
Eo C~)
en -4 4j -.4 4J~ >.)
z4 -4 U-4I
C*j 41 E
-,4
-4 Q
0J -J..C) 'C
0~ C- '~iO ~ Z0>C
LC coa- 0 -4 V 4 4 m%-
:- W__E__ wE__ w_ _a)__ c_ 0

W Even if all current models of nuclear phenomena are assumed to
be an integral part of the HF nuclear effects prediction codes listed in
Table 2, the uncertainties in those models plus the different 4pproaches
to modeling the ambient ionosphere and propagation will und6ubtedly lead
to different results. Differences due to the nuclear models can be at-
tributed to the following factors:
" Limited quantitative data are available to verify the pre-dictive capability of the nuclear effects models.
" Models of nuclear effects are based on the available em-pirical data or are even calibrated to that limited data.The data base is sufficiently small to make extrapolation ofresults to different nuclear environments precarious.
* The data base is not large enough to allow statisticaltreatment of the results.
" WEPH has announced limitations, including uncertainties of2 to 3 in electron density. These uncertainties have anenormous effect in cases in which marginal system performanceis predicted.
* F-region uncertainties relate to the location and concentra-tion of high-altitude ionization and to the effect of me-chanical waves generated by a burst.
* The weakest aspect of all HF nuclear effects predictions isthe modeling of late-time effects.
75 Pages 76 through 80 were deleted.
(& )
Table 3-3
SPREDICTABILITY OF THE EFFECTSOF VARIOUS NUCLEAR PHENOMENA
B. Prompt Radiation
WX-radiation from high-altitude bursts can produce blackout con-ditions for paths where rays intersect the D region within optical line-
of-sight of the burst. The extent of the blackout effects is not a strong
function of yield but depends mainly on the burst altitude, as indicated
in Figure 10. For example, a 10-MT detonation at 100 km would produce
nighttime blackout conditions over an area defined by a radius of about
1000 km; a lO-kT detonation would produce comparable effects over an area
2 cfid by a 700-km radius. The duration of blackout from prompt radia-
tion strongly depends on available frequencies and path-burst configuration,
but will generally be on the order of a minute at night and 10 to 15
minutes during the day.
81 Pages 82 through 84 were deleted.
~(6)(,)
UThe impact of prompt radiation on the lowest observed frequency
(LOF) can be seen from data shown in Figure 12. Predicted an4 measured
values of LOF are given for three paths--Canton to Hawaii, Cahton to Mid-
way, and Roi Namur to Hawaii--following three events--CHECK MATE, KING
FISH, and STAR FISH. The sharp decreases in LOF during the first few
minutes are due to X-radiation. Isolation of this single effect from
other causes of absorption requires either substantial displacement of
the path from the burst or a small yield such as CHECK MATE. As can be
seen from Figure 12, X-rays do not appear as important as other radiation
sources in this set of examples. Errors in estimating the LOF are frequent
and occasionally significant. Difficulty is likely due to uncertainties in
debris location (the source of delayed gamma radiation) and the fact that
the LOF is in part a function of system sensitivity, which may be impre-
cisely known in a step-frequency sounder such as those employed.
C. 5 Delayed Gamma Rays
W The HF signal absorption resulting from delayed gamma rays is
reasonably well understood and predictable. The predictability of onset
time, radial extent, and magnitude of the effects largely depends on the
models of fireball/debris dynamics. The maximum extent of garna ray in-
duced absorption includes all regions where the gamma radiation sources
are above 20 km and within line-of-sight of the D region. The magnitude
and duration of the effects are estimated as functions of altitude/yield
in Figure 13 for day and night conditions. "Outage" on these figures is
4loosely defined as a condition in which 15-MHz signals would incur 40-dBexcess attenuation on two D-region traversals. Clearly, only relatively
high-yield, high-altitude bursts are capable of producing extended HF
blackout conditions as a result of gamma radiation. However, the ion-
production rates from multiple bursts are additive, and the resultant
absorption following multiple bursts would be significantly greater than
shown on Figure 13, which assumes single-burst conditions. (b)
Page 86 was deleted,
~(bX,)
bp
FIGURE 3-13 HEIGHT/YIELD COMBINATIONS REQUIRED TO MAINTAINOUTAGE AT DISTANCES WITHIN LINE-OF-SIGHT OF THEDEBRIS FOR THE FIRST 30 MINUTES
D. 3 Delayed Beta Particles
Beta-produced ionization resulting from debris decay is the
dominant but perhaps the least predictable nuclear effect on HF propaga-
tion. The beta-particle-induced ionization from single high-altitude
dezonations has been observed to produce severe D-region absorption and
87
FIGURE 3-14 COMPARISON OF OBSERVED AND COMPUTEDGAMMA-RAY INDUCED ABSORPTION
blackout for many hours over extended regions. In fact, computations
suggest that in the presence of both gamma rays and beta-induced ioniza-
tion, the HF signal absorption due to gamma rays is almost insignificant
tFigure 15).
88
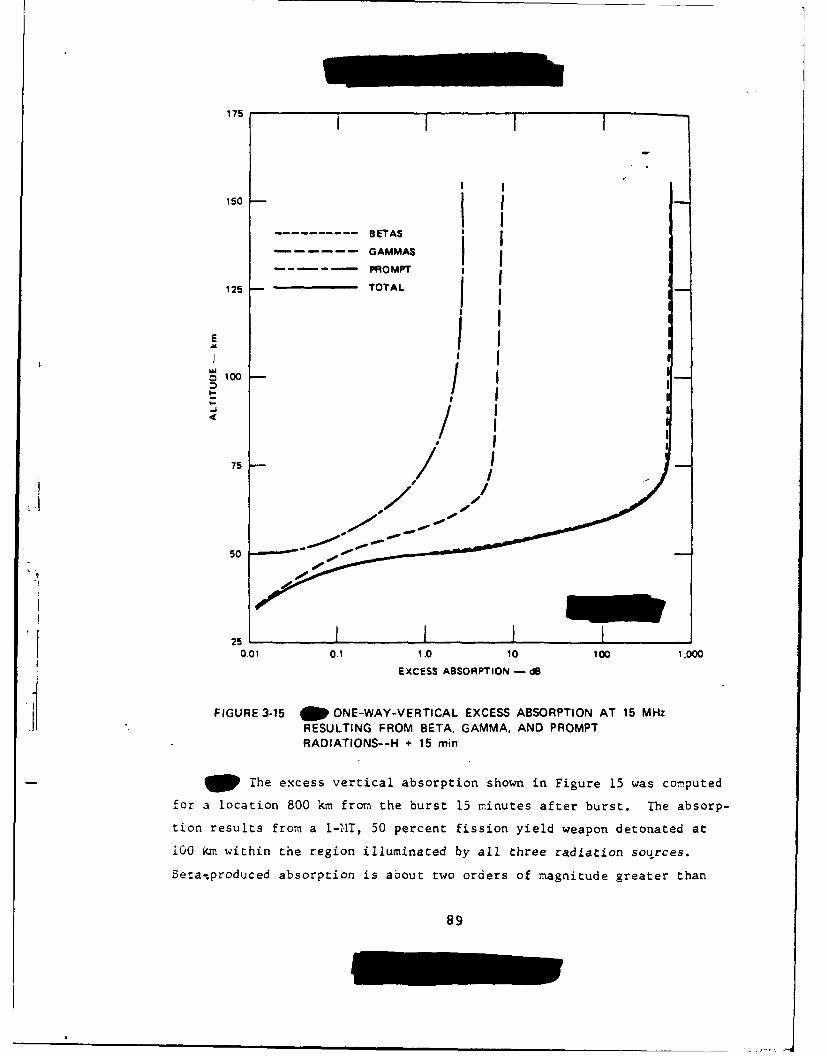
175
150
---------- BETASGAMMAS IPROMPT f I
125 TOTALI
EI
wIi010 I I
S/ ISII
O.O /.11.oO Io .
75
50
250.01 0.1 1.0 10 100 1,000
EXCESS ABSORPTION - dB
FIGURE 3-15 a ONE-WAY-VERTICAL EXCESS ABSORPTION AT 15 MHz
RESULTING FROM BETA. GAMMA, AND PROMPTRADIATIONS--H + 15 min
The excess vertical absorption shown in Figure 15 was computed
for a location 800 km from the burst 15 minutes after burst. The absorp-
tion results from a I-IT, 50 percent fission yield weapon detonated at
i0O km within the region illuminated by all three radiation sources.
Se:anproduced absorption is about two orders of magnitude greater than
89
absorption due to gamma rays. Since both radiations decrease in intensity
approximately inversely with time, the absorption in regions illuminated
by beta particles will persist long after gamma ray effects have become
inconsequential. Not all nuclear detonations cause beta-induced D-region
absorption; to do so a burst must have an altitude/yield combination suf-
ficiently high for the debris to stabilize at altitudes above 60 km, the
beta containment altitude.
a Unfortunately, the most predictable aspect of beta ionization
is whether a given yield/altitude combination will create it. Prediction
of the location, magnitude, and duration of the HF degradation can, at
best, be termed difficult because of two unrelated sets of problems:
(1) Problems associated with modeling of the fireball-debrisdynamics, since they establish the post-stabilizationconditions of the debris volume--altitude, radius, anddistribution. The results of any computations are ex-tremely sensitive to the debris models, which preciselydefine the predicted region of intense beta-produced D-region absorption. Furthermore, in most situations,predictions of the presence or absence of beta-inducedD-region absorption is the dominant factor in determiningthe status of an HF circuit.
(2) Problems associated with prediction of the post-stabilization debris dispersion and motions resulting fromhigh-altitude winds. Wind models developed from meteoro-logic data are expected to provide a statistical representa-tion of the prevailing wind patterns and their effects onthe debris motions. However--and this is the crux 3f muchof the controversy regarding the status of HF in a nuclearenvironment--it is impossible for a statistical representa-tion of the winds tb provide results that are appropriatefor a specific day. Accordingly, predictions of late-timeD-region absorption effects cannot be expected to comparewith specific measured propagation data; they can only beexpected to portray conditions that might have existed onan average day.
W Some of the problems associated with the models of late-time
debris location are due to the few high-altitude detonations with yield
sufficient to produce measurable beta ionization over wide geographic
L'fr long durations. This lack of data on which to base a model can
be explained by the geography in the Pacific Basin. French Frigate Shoals--
about bOO km north of Johnston Island--Hawaii, and Midway--about 1400 km
90
from Johnston Island--were the nearest land masses from which measurements
could be taken. The long-term requirement for inferring debrIs location
from HF measurement data exists because the U.S. high-altitude detonations
occurred at night, when the absorption effects recover on the order of 20
times faster than they do during the daytime. Thus, in the case of low-
yield high-altitude detonations, beta ionization cannot be detected at
night over large areas due to the rapid recovery rates, or during the
following day because of dispersion over still greater areas and the radio-
active decay that occurs during the additional time.
W Only four detonations were of sufficient yield to satisfy the
above criteria. They were the TEAK and ORANGE events in the 1958 nuclear
test series and two of the Soviet shots of 1962.
1
91 Page 92 was deleted. (b)(i)

FIGURE 3-17 frm BEHAVtOR AT MIDWAY AND MAUI FOLLOWING ORANGE
New-generation HF syStems with
adaptive frequency concepts can
ifid paths of oppor:unity through such potential holes. However, we are
id aare of any 0 chniques that can be used to describe analytically
their spatial and tenporal characteristics.
The existence and utility Of
such holes, if they e-:ist, is likely to dir.inish in a multiburst envir°r ent,
93 Pages 94 and 95 were delt. (b)(1)
FIGURE 3-20 fmin BEHAVIOR AT TOMSK FOLLOWING OCTOBER 1962 EVENT
where the debris from other bursts should tend to fill the gaps and leave
a more uniform debris distribution.
E. N Nuclear-Induced F-Region Changes
1. * Ionospheric Wave Motion
96
It is not known whether the interactions of the shock wave
tl-e ionosphere are primarily chemical, mechanical, or both. Cherri-
c&Leffc~sare certainly important out to some distance, but the data
-scl se abo.e suzzest that a wave motion may be at least partially
rS P n SI e
,a-' F rezion due to shock and acoustic waves
ica a c th eory has not been developed to modjel
ss wa:es as functions of burst altitude and
So r the F region are modeled empirically
97 Page 98 was deleted. ()i
and are based on the small amount of data obtained during the 1958 and
1962 nuclear test series.1 8 -
i It is not the mechanical waves but the effeci of the waves
that is modeled. Changes to layer critical frequency and height are made
directly without intermediate wave equations. The technique is to imple-
ment empirical data by using a correction factor that has a form and
velocity characteristic of the wave. The correction factor itself is
partly theoretical and is modulated by two half-cycles of a sunusoid.
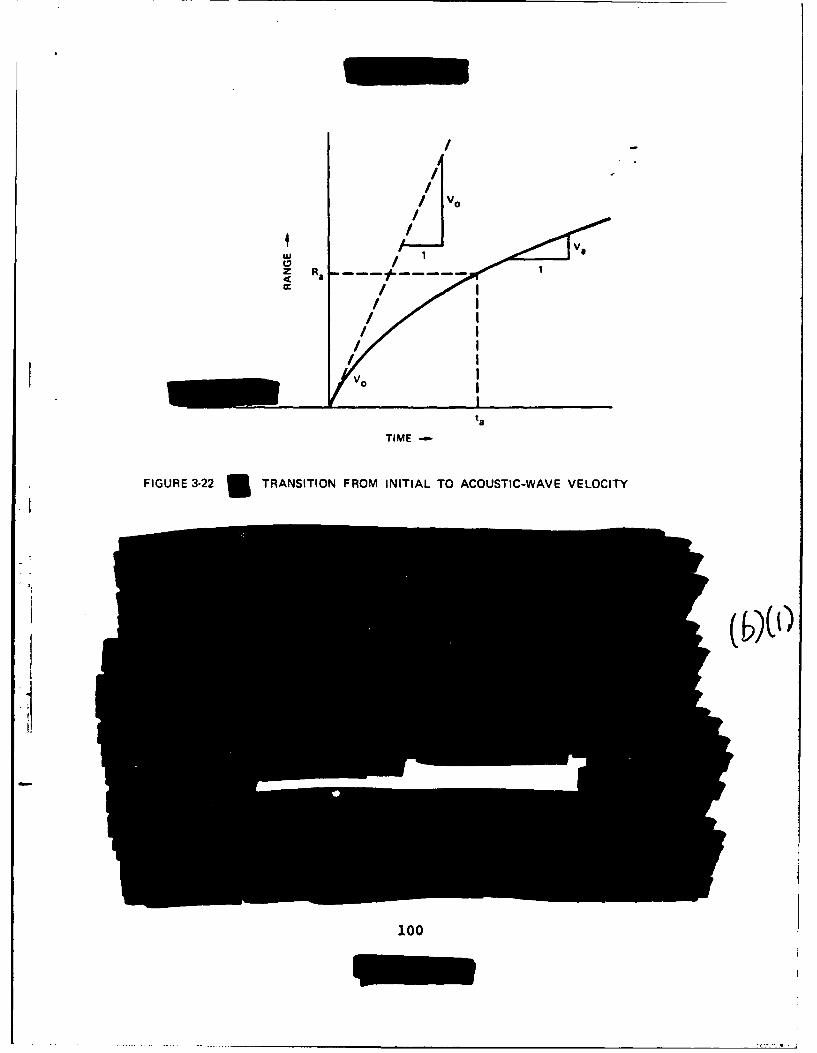
* In keeping with the effects following TEAK, the shock wave
is modeled simply as a step depletion in f F2 to 2 MHz that begins at the
burst point and travels at a supersonic velocity to a specified distance,
after which it is assumed to travel at an acoustic velocity. The shock-
wave velocity is then decayed exponentially to an acoustic velocity at a
range of RA. The assumed manner in which the transition from a shock
wave to an acoustic gravity wave is made is shown in Figure 22. The ex-
ponential is defined by the initial slope of the range-versus-time curve
(mach number) and the constraint that the slope at t must be the acoustica
velocity of the peak of the first half-cycle of the wave.
S Once the shock wave has degenerated into an acoustic
gravity wave (by some mechanism not yet fully understood), the changes
are believed to be caused entirely by the mechanical effects of moving
air, including the consequent turbulence and heating. As the wave passes
an observation point, the F-region critical frequency increases and then
decreases, or vice versa.
When a nuclear explosion occurs in the northern geomag-
initial increase in F-region critical frequency, the region between the
burst and the geomagnetic equator will experience an initial decrease,
and the region south of the magnetic equator will experience an initial
increase. Figure 23 shows the regions of critical-frequency increase and
decrease during the first half-cycle of the wave for nuclear detonations
at Johnston Island. During the second half-cycle of the wave, the changes
in critical frequency will be in the opposite direction.
99
Z R -
ta
TIME -
FIGURE 3-22 3TRANSITION FROM INITIAL TO ACOUSTIC-WAVE VELOCITY
100

JOHNSTON ISLAND
fcJ\
MAGNETIC EQUATOR
FIGURE 3-23 3 GEOMAGNETIC FIELD DEPENDENCE OFACOUSTIC-GRAVITY WAVE
2. High Altitude Ionization
., W One of the rrost spectacular results of the HF propagation
experiments during the 1962 high-altitude nuclear test series was the ob-
servation of anomalous modes on many of the paths. These modes were
created by scattering from high-altitude ionization that had been pro-
duced by the burst and spread preferentially along the earth's magnetic
field; the scatterers extended from the vicinity of the burst to both
conjugate regions. The off-path modes were observed in the upper HF and
101
FIGURE 3-24 dFIONOSPHERIC WAVE POSITION vs. TIME FOLLOWINGCHECK MATE
Sand had durations on the order of minutes to hours. Their
'I existence on specific paths depended primarily on the geometric relation-
j ship between the path and rnagnetic field. Figure 26 illustrates the
equiangular geometry required to produce off-path modes, providing the
elongation along the field is long compared to the wavelength. For a
maximum reflecti.on coeffi.cient, the receive- must lie along the inter-
section of the illustrated cones and the earth's surface.
The particular angle of the magnetic field in the vicinity
of the 1962 Johnston Island tests favored this type of reflection mecha-
nism. From that experience came the idea that such modes were a natural
adjunct to communications in a nuclear environment, but this concept is
not accurate. Certain paths in the 1962 tests can be used to illustrate
this.
102 Page 103 was deleted.)
I:H !(b)C')
104 Pages 105 through 107 were deleted0b
POINT
VI I CONCLUSIONS
The role, or potential role, of HF systems as part of a sur-
vivable communication network has been a subject of debate and contro-
.,ers, within the DoD since the first high-altitude nuclear detonation.
As with many other systems operating in other frequency bands, the per-
formance of HF systems in a nuclear environment is extremely sensitive
to scenario conditions. In fact, slight variations in any of a number
of important parameters can often have a profound effect on the predic-
tion results for a specific situation. Accordingly, this sensitivity of
predictions or measurements to slight changes in parameters makes any
evaluation of our prediction capability a formidable task.
I In the process of assessing our overall predictive ability, we
have discussed the characteristics of the necessary models and have given
some examples of predictions and measurements. In particular, we have
briefly described the status of modeling and predicting:
* Ambient ionospheric conditions
* Ambient propagation conditions
• Nuclear effects on the propagation medium, including:
- Prompt radiation
- Delayed gamma radiation
- Delayed beta particle radiation
- High-altitude ionization
- Traveling disturbances.
We have tried to identify situations and phenomena in which high confi-
dence predictions are attainable and those in which major uncertainties
exist.
* Analysis of measurements and predictions suggests that the best
ambient ionospheric and propagation models adequately portray median iono-
spheric and propagation conditions. On the other hand, ionospheric models
do not usually portray the naturally occurring variations about -he median
108
values of, for example, the maximum frequency. Since upper decile MOF
values may typically translate into frequency support on the order of 30
percent higher than at the median, such models might present a somewhat
more favorable estimate of survivability for systems that employ adaptive
frequency concepts. Unfortunately, there are a number of uncertainties
in determining the appropriate spatial and temporal correlations of these
naturally occurring ionospheric variations. Any analysis of systems using
adaptive frequency concepts must somehow account for not only the naturally
occurring but also the nuclear-induced variations before realistic esti-
mates of the potentially available frequencies can be made.
Comparing measurements with predictions for the specific weapon-
induced degradations suggests that the prompt and gamma radiation effects
are well understood and quite predictable, as are the major features of
ionospheric wave effects from a single detonation at long ranges. The
occurrence of intense burst-induced ionization aligned with the magnetic
field and creating off-path (VHF) propagation modes is predictable. The
utility of such modes is generally confined to lower latitudes; it is
marginal at higher latitudes. Even at lower latitudes, predictions of
the duration and cross-sections for such modes are inadequate. Because
of the difficulty in predicting debris distribution at late times, the
corresponding absorption effects of beta-produced ionization are also
difficult to predict. Since the cause of the F-region depletion is not
understood, its extent and magnitude are also difficult to predl'¢t.
W These variations in predictability produce striking contrasts
- in the believability of prediction results, the contrasts extending into
different space and time regimes and scenario conditions. This fact,
coupled with the sensitivity of prediction results to the other critical
parameters in predicting HF performance, strongly suggests that prediction
results are only indicative of conditions that could exist. Results must
be interpreted in terms of uncertainties associated with both the scenario
and the prediction models. In spite of their shortcomings the prediction
coces remain the best available tool for estimating either HF system or
network perforrance in a nuclear environment. Othermnise HF performance
estimates cannct be generalized beyond these broad statements:
109 Page 110 was deleted. (6)(1)
REFERENCES
1. W. J. Russell, Jr., S. Perlman, and S. E. Probst, "Effects of HighAltitude Detonations on High Frequency Communications I " U.S.Army Signal Radio Propagation Agency, Fort Monmouth, NJ (August1959),l
2. H. L. Kitts, J. B. Lomax, et al., "Project Officer's Interim Re-port--Project 6.11, HF Communications Experiment a," ProjectOfficer's Interim Report Operation Dominic, Fish ]Fwl Series(December 1962),
3. H. L. Kitts and J. B. Lomax, "Project Officer's Report, Volume 1,Project 6.11, HF Communications Experiment W," (April 1964),POR-2030,_
4. D. L. Nielson, ',ommunications Related to the Soviet High-Altitude Bursts ," Contract No. DNAO01-73-C-0180, Published inProceedings of rDNA 1973 Atmospheric Effects Symposium aVol. VI, DNA 3131 P-6, Stanford Research Institute, Menlo Park,California (June 1973), *.
5. W. S. Knapp, "A Simplified D-Region Chemistry Model for NuclearEnvironments 0," DNA 2850T, Contract DASA01-69-C-0132, GE TEMPO,Santa Barbara, California (April 1972),
6. D. L. Nielson, "Anomalous HF/VHF Propagation Modes During FishBowl 0 " DASA 1599, AD-359 8746, Contract DA 36-039 SC-87197,Stanford Research Institute, Menlo Park, California (January 1965),
7. J. N. Freedman, "Reassessment of HF Propagation in a Nuclear En-vironment o," Mitre Technical Report 2646, Vol. II, ESD ContractF19 (628)-73-C-001, The Mitre Corporation, Bedford, MA (September1973),
8. "Advanced MEECN High Frequency Communication System Concept Formu-lation W," Technical Publication TP 11-76, Defense CommunicationAgency, Arlington, VA (May 1976),
9. D. L. Lucas, G. Haydon, et al., "Predicting Statistical PerformanceIndexes of High-Frequency Ionospheric Telecommunication Systems,"Technical Report ITSA-l, Institute for Telecommunication Sciencesana Aeronomy, Boulder, Colorado (1966).
ill

10. T. Elkins and C. Rush, "A Statistical Predictive Model of the Polar
Ionosphere," in T. Elkins, ed., An Empirical Model of the Polar
Ionosphere, AFCRL-TR-73-0331, Air Force Cambridge Research Labora-
tories, L. G. Hanscom Field, Bedford, NA, 1973.
ii. R. R. Vondrak, G. Smith, V. E. Hatfield, R. T. Tsunoda, V. R. Frank,
and P. D. Perrault, "Chatanika Model of the High-Latitude Ionosphere
for Application to HF Propagation Prediction," RADC-TR-78-7, FinalReport, Contract F19628-77-C-0102, SRI International, Menlo Park,
CA 94025 (January 1978),
7. I. Dayharsh, "HF Conmmunications Effects: Ionospheric and Modeof Propagation Measurements," DASA 1701, Final Report, ContractDA 36-039 SC-87197, Stanford-Research Institute, Menlo Park, CA94025 (August 1965),
13. D. L. Nielson, J. B. Lomax, and H. A. Turner, "The Prediction ofNuclear Effects on HF Comunications," DASA 2035, Final Report,Contract DA-49-XZ-436, Stanford Research Institute, Menlo Park,
CA 94025 (November 1967).
14. R. A. Demarest and T. I. Dayharsh, "Propagation Plots Derived fromOblique-Incidence lonograms--Okinawa to Saigon," Final Report, SRIProject 5663, Contract CST-7681, Stanford Research Institute, MenloPark, CA (November 1965).
15. W. S. Knapp and K. Schwarz, "WEPH VI: A FORTRAN Code for the Cal-culation of Ionization and Electromagnetic Propagation Effects Due
to Nuclear Detonations: Volume 1, User's Manual F," DNA 3766T-1,
Topical Report, Contract DNA001-75-C-0096, General Electric Company-TEIPO, Santa Barbara, CA (September 1975),
16. E. J. Feniger, "WRECS VI Code: A FORTRAN Code for the Computationof Weapon Radiation Effects on Communication Systems s)" DCA 100-7--Z-0021, DCA 100-75-C-0010 General Electric Company-TDPO, SantaBarbara, CA (June 1975),5
17. D. H. Sowle, "An Ambient HF Radio Mode Model (U)," DNA 4420T, Topi-cal Report, Contract DNA 001-76-C-0349, Mission Research Corpora-
tion, Santa Barbara, CA (September 1977),i
18. E. J. Baumann,.V. E. Hatfield, and J. Owen, "Documentation of NUCOM
II--An Updated HF Nuclear Effects Code 1," DNA3108Fl, Final Re-port, Contract DASA01-71-C-0138, Stanford Research Institute, Menlo
Park, CA (April 1973),
19. G. P. Nelson, "NUCO4/BR-M: An Improved HF Propagation Code forAmbient and Nuclear Stressed Environments *," DNA 4248T, Final=R--rt, Contract DNA 001-76-C-0261. GTE Sylvania, 189 "B" Street,Needham Heights, MA (October 1976),
112

20. E. J. Baumann, G. H. Smith, D. L. Nielson, and W. E. Jaye, "AnOverview of HF Communications in a Nuclear Environment 9," DNA3301T, Special Report i, Contract DNA001-73-C-0180, Stanford Re-search Institute, Menlo Park, CA (March 1974),
21. G. H. Smith, "An Introduction to OTH Radar Performance in a NuclearEnvironment P," DNA 3736T, Topical Report 3, Contract DNAO01-73-C-0180, Stanford Research Institute, Menlo Park, CA (May 1975),
22. H. F. Busch and A. Kavka, "Some Effects of High Altitude NuclearDetonations on the Ionosphere During Project Newsreel, OperationHard Tack 0," Project 678 Interim Report, U.S. Army Signal RadioPropagation Agency, Fort Monmouth, NJ (March 1959),
23. W. F. Utlaut, "Ionospheric Effects Due to Nuclear Explosions,"
NBS Report 6050, Project 8520-12-8510, NBS Boulder Laboratories,Boulder, CO (April 30, 1959).
24. L. T. Dolphin and R. B. Dyce, "Operation Hardtack/Newsreel RadioAttenuation and Reflection Phenomena f," Contract SRI Project2445, Stanford Research Institute, Menlo Park, CA (February 1960),
25. H. F. Busch, "A Preliminary Review of Russian lonosonde ObservationsW," External Tech. Mem. 79, ITT Electro-Physics Labs., Inc.,Columbia, MD (April 1968),
26. J. B. Lomax and D. L. Nielson, "Observation of Acoustic-GravityWave Effects Showing Geomagnetic Field Dependence," J. Atnos. Terr.Phys., Vol. 30, pp. 1033-1050 (1968),
113

CHAPTER 4. 3 HF SKYWAVE COMMUNICATIONS ROLE AND THE NUCLEAR ENVIRONMENT
1At. W. Jauje,SRI Inteln atonat
I 3 INTRODUCTION
P SRI International has been studying and analyzing the effects
of high altitude nuclear detonations for DNA for more than 15 years. In
the course of the latest effort, under Contract DNA001-77-C-0063, SRI
was asked by DNA to evaluate proposed low-data-rate "broadcast" systems
that are intended to operate in a severe nuclear environment and that
utilize frequencies between 3 MHz and nearly 100 MHz. Previously, as
part of the same contract, SRI had analyzed the performance of rapid
two-way comunication systems in a recovering nuclear environment.
W Under separate contracts, SRI had the opportunity to study
the performance of the World Wide Military Command and Control System
(WWMCCS) in a severe nuclear environment. These studies covered the
time periods of the attack, the immediate trans-attack period, and the
time frame when restoration of communications and reconstitution of
forces are of prime importance--namely, two to seven days after a severe
nuclear laydown.
ff The basic conclusions that we have reached as the result of
these studies are: that HF communications systems are needed in the
... .......of the WWMCCS in order to provide the necessary post-attack
commnunications capability, and that new system concepts and operational
doctrines are required to make HF communications as efficient and timely
as possible. In particular, it is necessary to provide these HF
* conmunications systems with frequency versatility and agility, and toextend their operating range to the high MF and low VHF range.
QpW. A. Edson and G. H. Smith, "HF Systems for MEECN Applications and_during Communications a ," DNA 4646, Topical Report 1, Contract DNA001-77-C-0063, SRI International, Menlo Park, CA (June 1978),
V T. W. Washburn and G. H. Smith, "Adaptable Comunication Systems foruse in a Nuclear Environment 0" DNA 3796T, Topical Report, ContractDNA001-73-C-0180, SRI International, Menlo Park, CA (September 1975),f G. R. Underhill et al., "WWMCCS Performance in a Severe Nuclear
Environment W" DNA 3659F, Technical Report 1, Contract DNA001-74-C-0271,SRI International, Menlo Park, CA (March 1975),
__ 114 'Pages 115 through 130 were Oeteteo,
V 3 RECOMMENDATIONS
A A Directed Program to Develop HF Propagation ManagementTechnology Should be Initiated.
A Methods to Restore Communications and Reestablish ConnectivityShould be Evaluated.
A Procedures, Operational Protocol, Required Flexibility,Redundancy, etc., Should be Defined.
A Gaps in Knowledge of Propagation Phenomenology in aTrans-and Post-Nuclear Environment Should be Assessed andSteps Taken to Reduce Uncertainties.
131
CHAPTER 5. LOW DATA-RATE GROUNDWAVE COMMUNICATIONS*
D&. C. Qu€in,The Rand Cortportion
I. INTRODUCTION
The purpose of this report is to present a general indication of
the communication capabilities which can be achieved at frequencies in
the high frequency band (3-30 MHz) and below, if signal propagation is
only by the ground wave mode. Signal propagation for the ranges to be
considered (i.e., less than 1000 miles) is normally influenced, if not
controlled, by ionospheric reflection. Practical experience with only
ground wave communications at large distances is generally lacking.
One can use the results of this note to partially answer questions such
as "what communication capability would exist if there were no iono-
sphere of if radio signal transmission via the ionosphere were com-
pletely absorbed?" In this report emphasis is placed on propagation
and noise considerations. Such terminal factors as antenna types,
transmitter power levels achievable at a given frequency, and overall
transmitter costs for a prescribed effective radiated power are not
considered. Assessment of these factors coupled with the material pre-
sented will provide a basis for determining the practicality of achiev-
ing a suggested dual system capability and for optimum design of the
system.
II. GENERAL PROPAGATION CONSIDERATIONS
°"1 At frequencies in the high frequency band and below, the transmis-
sion of radio signals between a transmitter and beyond-the-horizon re-
ceivers occurs principally by ground wave propagation, ionospheric
The work was done under a program supported by the Defense NuclearAgency under NWED Subtask Code S99QAXHEO, Work Unit Code 23.
i.e., one that gives reliable very low data rate transmissionduring conditions of very poor or negligible ionospheric transmissionsand also provides reliable voice communications during normal conditions.
132
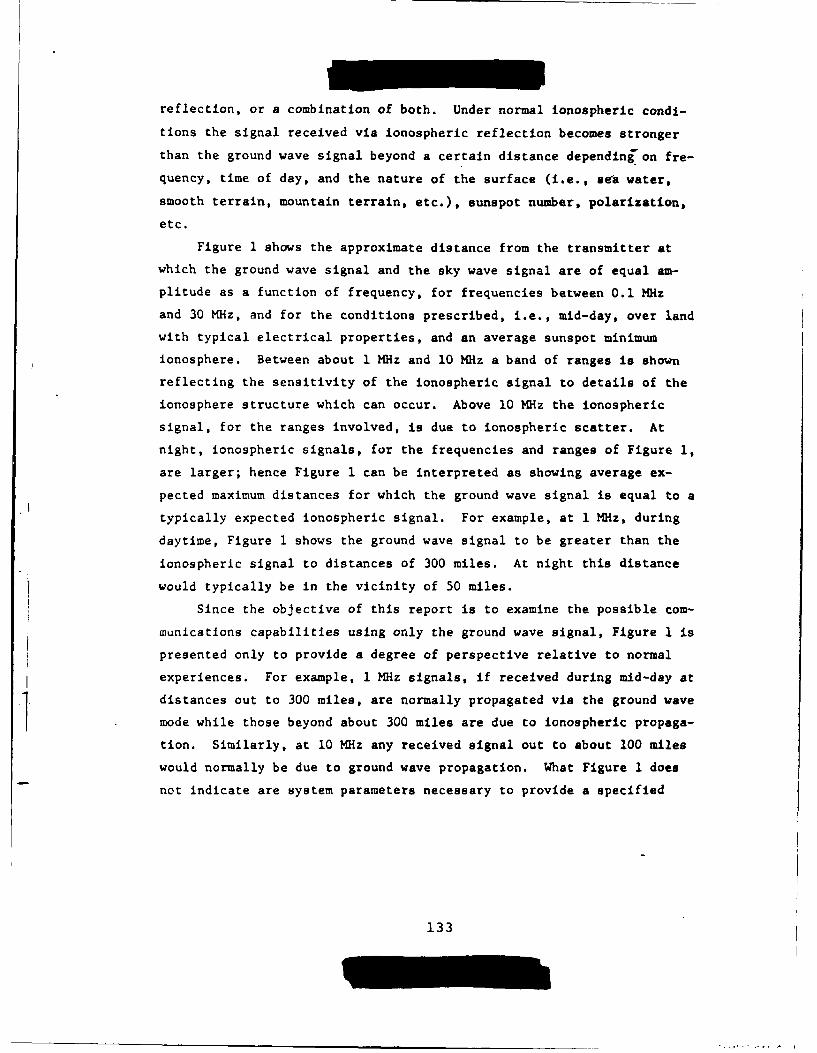
reflection, or a combination of both. Under normal ionospheric condi-
tions the signal received via ionospheric reflection becomes stronger
than the ground wave signal beyond a certain distance dependinj on fre-
quency, time of day, and the nature of the surface (i.e., sea water,
smooth terrain, mountain terrain, etc.), sunspot number, polarization,
etc.
Figure 1 shows the approximate distance from the transmitter at
which the ground wave signal and the sky wave signal are of equal am-
plitude as a function of frequency, for frequencies between 0.1 MIz
and 30 MHz, and for the conditions prescribed, i.e., mid-day, over land
with typical electrical properties, and an average sunspot minimum
ionosphere. Between about 1 MHz and 10 MHz a band of ranges is shown
reflecting the sensitivity of the ionospheric signal to details of the
ionosphere structure which can occur. Above 10 MHz the ionospheric
signal, for the ranges involved, is due to ionospheric scatter. At
night, ionospheric signals, for the frequencies and ranges of Figure 1,
are larger; hence Figure 1 can be interpreted as showing average ex-
pected maximum distances for which the ground wave signal is equal to a
typically expected ionospheric signal. For example, at 1 MHz, during
daytime, Figure 1 shows the ground wave signal to be greater than the
ionospheric signal to distances of 300 miles. At night this distance
would typically be in the vicinity of 50 miles.
Since the objective of this report is to examine the possible com-
munications capabilities using only the ground wave signal, Figure I is
presented only to provide a degree of perspective relative to normal
experiences. For example, 1 MHz signals, if received during mid-day at
distances out to 300 miles, are normally propagated via the ground wave
mode while those beyond about 300 miles are due to ionospheric propaga-
tion. Similarly, at 10 MHz any received signal out to about 100 miles
would normally be due to ground wave propagation. What Figure 1 does
not indicate are system parameters necessary to provide a specified
133

1000
800 Winter noon over land values
700 based on Ref. 1 curves
600
500 - Ionosphere transmission dominates
. 400-
300"Ground wave
4domi ntes h:6/g200-
"I-
100 -
134
communication capability at any frequency or distance. This we will
next discuss.
III. GROUND WAVE PROPAGATION OVER LAND
The decrease in ground wave signal intensity with distance from a
transmitter is well established, theoretically and experimentally, for
an ideal spherical earth of specified electrical properties. Certain
practical aspects such as variability of the electrical constants of
the earth along the path or with depth, terrain of varying degrees of
roughness, forests, etc. cause some departure from ideal calculated
characteristics; however, for present purposes these effects will be
ignored and deductions will be based on the use of standard published
basic transmission loss curves such as ..re given in any radio propaga-
tion textbook or handbook. The particular loss curves used in this
note were taken from Ref. 1. Basic transmission loss as defined in
Ref. 1 and used in this note is simply
Lb = 10 log1 0 (p tC/P )
where Pt is defined as power radiated by an isotropic antenna and pr
is the power delivered by a loss-free isotropic receiving antenna.
For real antennas having gain in the transmission path direction
Eq. (1) becomes
L - Lb - G (2)
where G is the summed transmitting and receiving antenna gain, in deci-
bels, along the transmission path. it should be noted that L is de-
fined as a positive number of decibels. For real antennas with loss,
Eq. (2) can be modified directly to account for such loss.
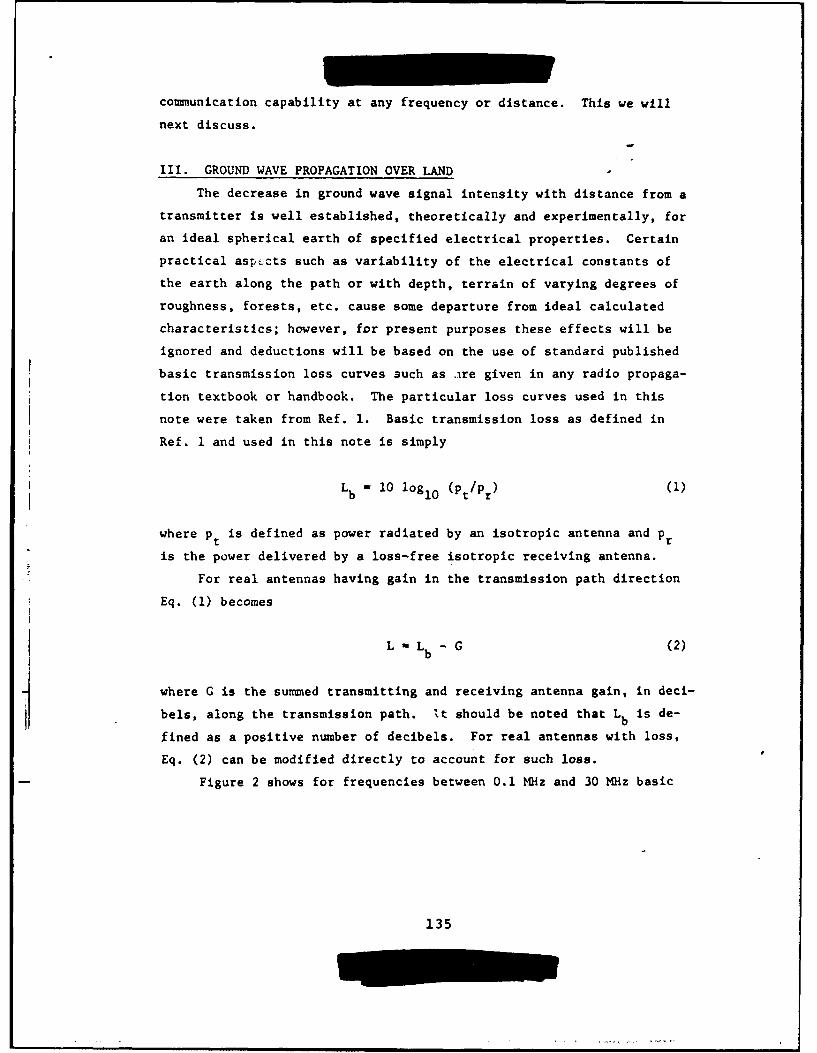
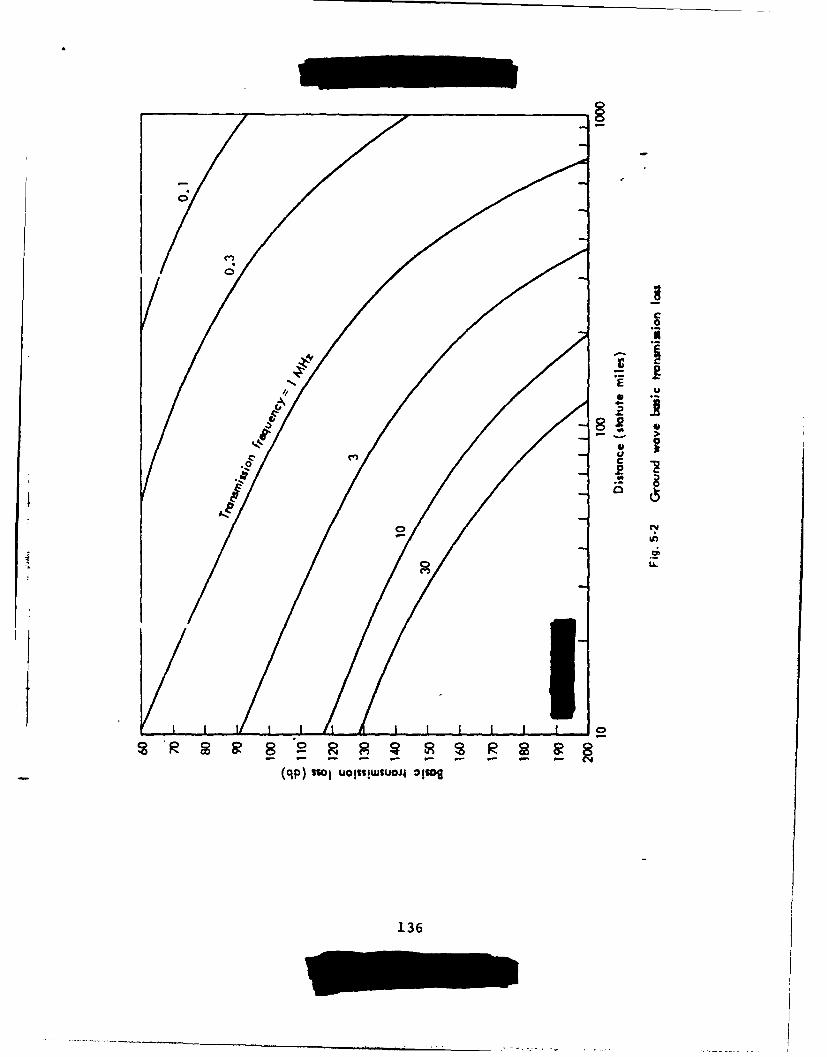
Figure 2 shows for frequencies between 0.1 MHz and 30 MHz basic
135
0.
0u
C.1 7
Ia
(9p)sto UO~slwuOJ4*pa
136

transmission loss for a smooth spherical earth (conductivity 0.005 mio/
meter and dielectric constant - 15) as a function of distance in stat-
ute miles.
As an example, let us use Figure 2 to determine the signal-power
delivered by an isotropic receiving antenna at a distance of 100 miles
from an isotropic transmitting antenna which radiates i watt at a fre-
quency of 1 MHz. Figure 2 shows the basic transmission loss to be 105
dB, thus for pt M 1 watt
1 1 010 0-11
log L- - 10.5 or- - 3.16 x 10 or pr - 3.16 x 10 watts (3)
The result (3) can be modified directly to account for receiving
antenna loss and total (transmitting and receiving) antenna path gain.
In this note neither of these factors is included in the results pre-
sented. The results can be quite simply adjusted to incorporate any
specific antenna parameters.
IV. NOISE
The desired signal level necessary for satisfactory reception is
determined by the level of competing undesired signals in the receiver
pass band and internal receiver noise. Undesired signals at the re-
ceiving antenna are normally considered to be due to four sources as
follows:
(1) Galactic or cosmic radio noise.
(2) Noise produced by lightning and propagated via the ionosphere
1or ground wave to the antenna.
(3) Other intentionally generated radio transmissions in the re-
- ceiver band.
(4) All other noise produced by man-made devices such as automo-
biles, transmission lines, industrial equipment, etc.
137
Under normal conditions of ionospheric propagation, noise of a
given frequency is propagated the same as signal at that frequency.
Since this note is concerned with the ultimate capability of a'ground
wave only communications system under conditions of unusually severe
absorption of the ionospheric signal, noise considerations are differ-
ent from those normally used. If no desired signal is transmitted via
the ionosphere, we will assume also that no noise reaches the receivers
via ionospheric transmissions. Thus source (1) noise is eliminated and
source (2) noise is only that reaching the antenna via ground wave
propagation. Source (3) noise is restricted, in general, to transmit-
ters within ground wave range of the receiver. Source (4) noise is un-
affected, in general, since this noise normally arises from man-made
sources near the receiver.
Despite elimination of consideration of noise propagated via the
ionosphere, specifying noise levels appropriate for system capability
assessments can at best be only approximate and for the most part arbi-
trary. Man-made noise varies widely with location and even at a given
location there is often wide variability with time. Atmospheric noise
from lightning propagated by ground wave will reach the receiver. The
level and occurrence of such noise, in general, will vary widely and
can only be described statistically (time of day, season, etc.) much
the same as is done for the case of normal ionospheric propagation in
Ref. 2. In order to provide first order quantitative values we have
arbitrarily chosen for expected noise the values presented in Ref. 2
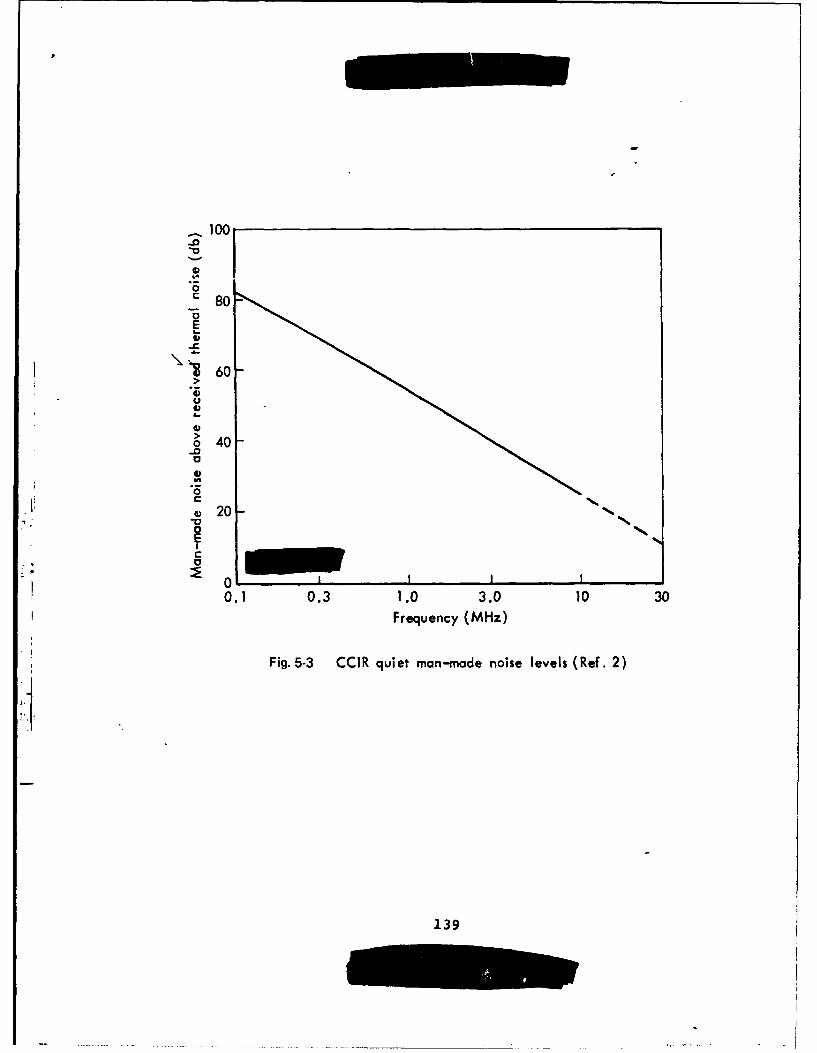
for expected man-made noise at a "quiet" receiving location. Figure 3
shows this noise level, expressed in dB above thermal noise for the
frequency range we are considering; if one has receiver locations which
are "very quiet" the true system noise could be much less than Figure 3
and deductions based on Figure 3 would need appropriate modification.
Also, if noise-suppression techniques can be applied to man-made noise,
138
0
E
U
o 40
0
-. 0
01031.0 3.0 10 30Frequency (MHz)
Fig. 5-3 CCIR quiet man-made noise levels (Ref. 2)
8j39
additional communication capability is attainable with the limit being
determined ideally by receiver thermal noise.
V. GROUND WAVE SYSTEM CAPABILITY ASSESSMENT
Using the ground rules discussed in Sections III and IV, i.e.,
only ground wave signal propagation and noise levels appropriate for
so-called "quiet" man-made noise as shown in Figure 3, one can readily
provide results expressed as signal-to-noise ratio useful for estimat-
ing attainable system capability.
The signal-to-noise ratio (expressed in dB) is given by
S/Nb = Pt - Lb - Nb (4)
where Nb is the noise in the receiver signal bandwidth (Figure 3)
P is the effective radiated power of the transmittert
Lb is the basic transmission loss (Figure 2)
For numerical values we will use an effective radiated power of
1 kW (30 dB) and a signal bandwidth of I Hertz. Using these fixed pa-
rameters for illustration, we will calculate the signal-to-noise ex-
pected at a distance of 500 miles for a transmitter frequency of 1 MHz.
From Figure 2, L = 169 dB. From Figure 3, the noise level is 54 dBb
above thermal noise (KTB). Assuming a temperature of 288*K (as used
in Ref. 2) and a bandwidth of 1 Hertz
KTB - 1.38 x 1023 x 288 x 1 - 3.97 x 1 -204 dB (5)
where K is Boltzmann's constant1T is temperature in degrees Kelvin
B is bandwidth in Hertz
Use of the above values and Eq. (4) gives
140
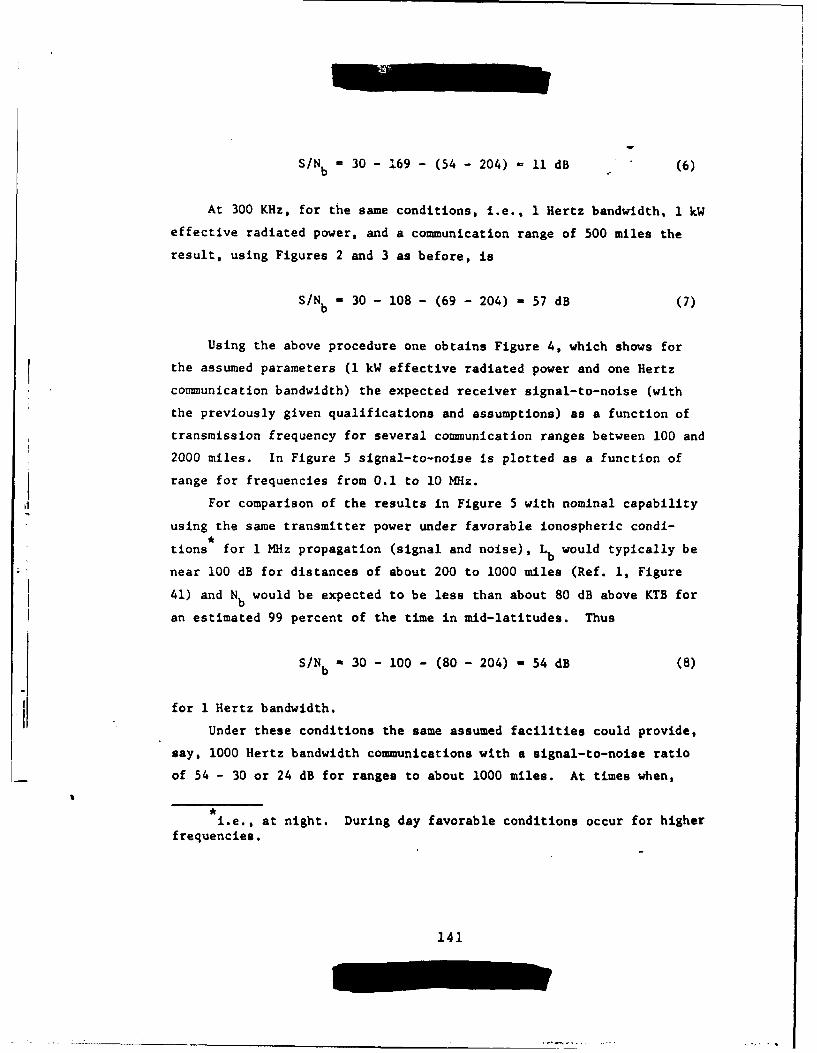
S/Nb = 30 - 169 - (54 - 204) - 11 dB (6)
At 300 KHz, for the same conditions, i.e., 1 Hertz bandwidth, 1 kW
effective radiated power, and a communication range of 500 miles the
result, using Figures 2 and 3 as before, is
S/Nb = 30 - 108 - (69 - 204) - 57 dB (7)
Using the above procedure one obtains Figure 4, which shows for
the assumed parameters (1 kW effective radiated power and one Hertz
communication bandwidth) the expected receiver signal-to-noise (with
the previously given qualifications and assumptions) as a function of
transmission frequency for several communication ranges between 100 and
2000 miles. In Figure 5 signal-to-noise is plotted as a function of
range for frequencies from 0.1 to 10 MHz.1For comparison of the results in Figure 5 with nominal capability
using the same transmitter power under favorable ionospheric condi-,
tions for 1 MHz propagation (signal and noise), Lb would typically be
near 100 dB for distances of about 200 to 1000 miles (Ref. 1, Figure
41) and N would be expected to be less than about 80 dB above KTB forb
an estimated 99 percent of the time in mid-latitudes. Thus
S/Nb a 30 - 100 - (80 - 204) - 54 dB (8)
for 1 Hertz bandwidth.
Under these conditions the same assumed facilities could provide,
say, 1000 Hertz bandwidth communications with a signal-to-noise ratio
of 54 - 30 or 24 dB for ranges to about 1000 miles. At times when,
,i.e., at night. During day favorable conditions occur for higher
frequencies.
141
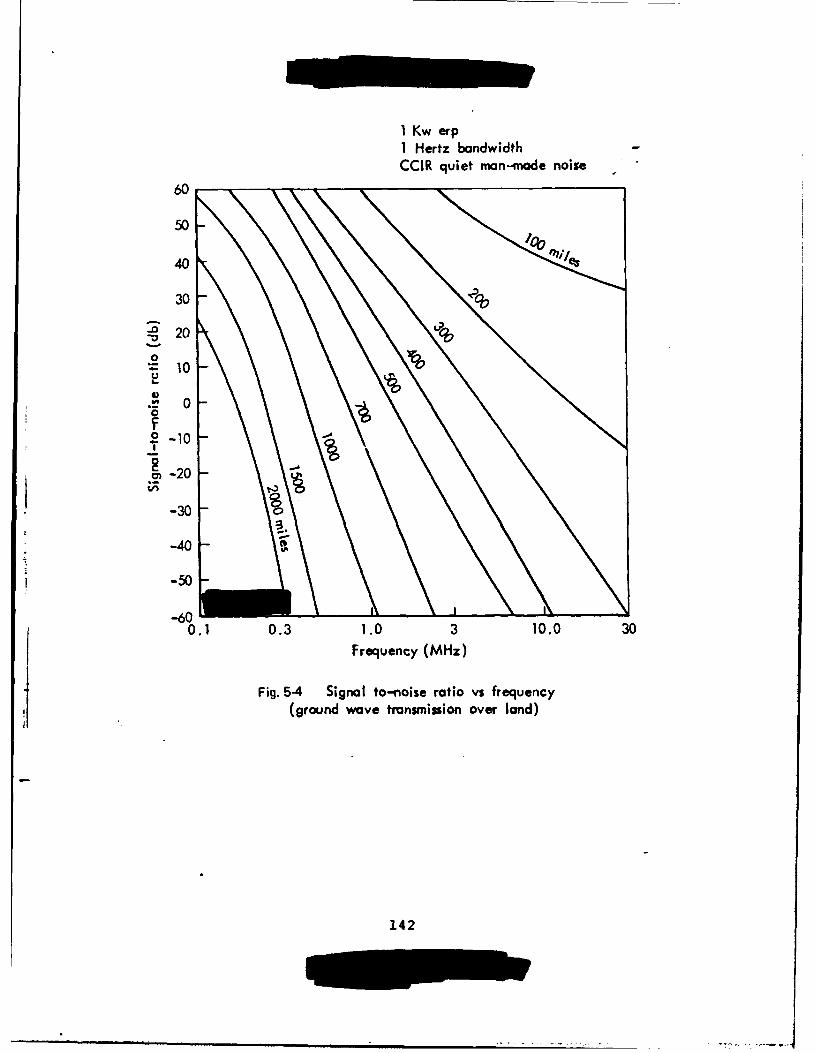
I Kw erpI Hertz bandwidthCCIR quiet man-made noise
60
50
40
30
0 20
.2 1
0
2 -10
t ,--20 -
-:30-
iU.- 40
S-50-30
0.1 0.3 1.0 3 10.0 30
Frequency (MHz)
Fig. 5-4 Signal to-noise ratio vs frequency(ground wave transmission over land)
142
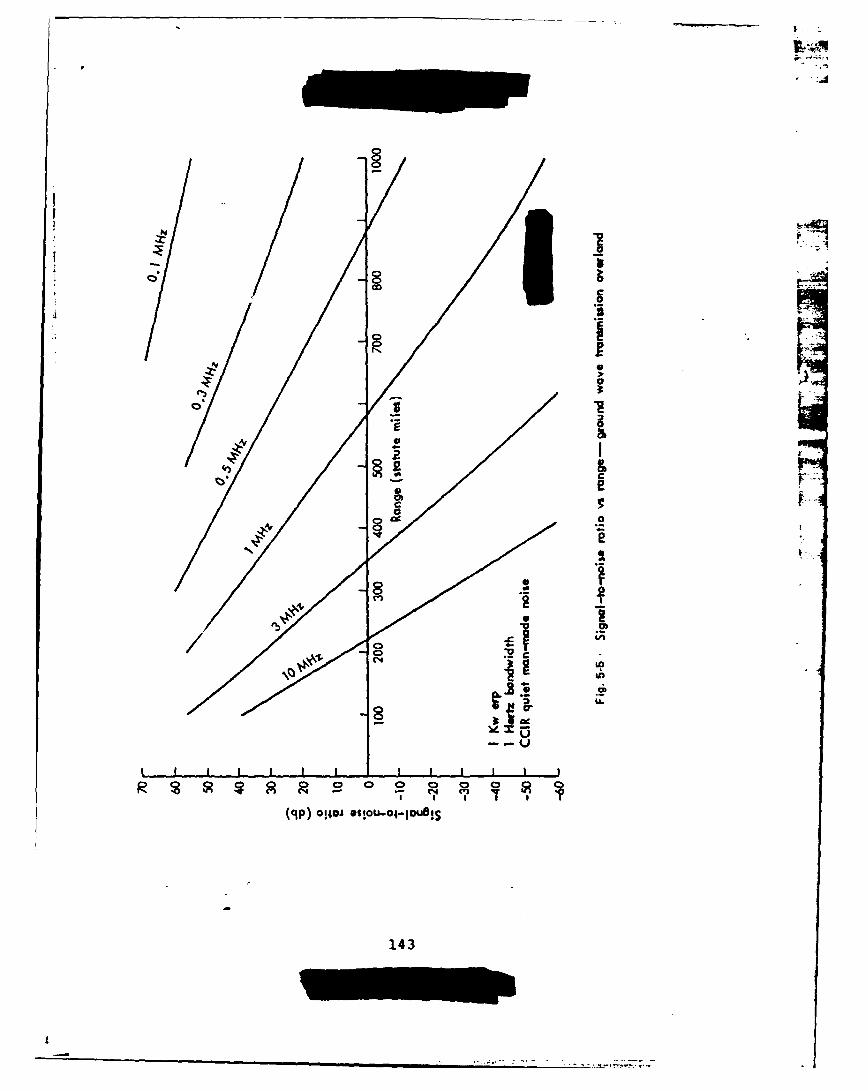
040
0 )
14
say, 10 MHz is the optimum transmission frequency to a distance of,
say, 1000 miles, about the same capability exists for the same assumed
terminal parameters. One can verify by study of typical normal iono-
sphere transmission loss curves such as given in Ref. 1 that-the ter-
minal parameters assumed would provide reliable voice communications to
1000 mile range by the appropriate choice of frequency (day or night)
and a useful capability (about 10 dB less) at ranges to 2000 miles.
Under conditions of no ionospheric transmission, Figures 4 and 5
indicate that, if one requires communication via ground wave transmis-
sion, the achievable range is very sensitive to frequency and that, for
a given effective radiated power, frequencies below, say, 1 MHz are
much more attractive than frequencies above 1 MHz. Consider, for ex-
ample, a desired range of 500 miles. From Figure 5 one sees that
ground wave transmission at 0.5 MHz is 75 dB better than transmission
at 3.0 MHz. As discussed earlier, one needs to know the relative dif-
ficulty of obtaining a given level of effective radiated power as a
function of frequency before full assessment of the beet frequency
choice for a desired capability can be made; however, clearly the 75 dB
transmission advantage at 0.5 MHz relative to 3.0 MHz will swamp any
antenna considerations. For ranges greater than 500 miles the lower
frequencies are even more attractive relative to the higher frequen-
cies.
VI. CONCLUSIONS
It is feasible using practical terminal parameters and ground wave
transmissions to obtain very low data rate communications over land
between terminals spaced up to distances of 1000 miles or more (over
water is more favorable) at frequencies which normally depend on the
ionosphere for signal transmission--if signals normally transmitted via
_: the ionosphere ire assumed to be completely absorbed. For obtaining a
reliable over land capability at the longer ranges, say 500 to 1000
144
7A
miles, it Is necessary assuming modest transmitter power (as illus-
trated Ly Figure 5) to use transmission frequencies below about I MHz.
At frequencies of 0.1 to 1 Miz, a good capability appears attainable
if one provides an effective radiated power from the transmitting an-
tenna of the order of 10 to 1000 watts depending on frequency and de-
sired range.
The same general facilities which can provide a useful low data
rate capability, say 1 bit per second, to distances of 500 to 1000
miles under the condition of complete loss of ionospheric transmission
should provide reliable voice communications for normal ionospheric
propagation conditions to receivers at this range. For normal condi-
tions, the 3round wave communications capability expected for condi-
tions of loss of ionospher.c transmission is greatly reduced, in gen-
eral, by the increased noise levels.
More effort is required to define optimum antenna and other ter-
minal characteristics for providing the suggested dual capability
system, i.e., one that gives reliable low data rate transmission during
conditions of very poor or negligible ionospheric transmission and also
provides reliable voice communications during normal conditions.
REFERENCES
1. Norton, K. A., Transmission Lose in Radio Propagation II, U.S.Department of Commerce, National Bureau of Standards, NBS Report#5U92, 1957.
2. World Distribution and Cnaracteristics of Atmospheric Radio Noise,International Radio Consultative Committee, Report #322, Inter-national Telecommunications Union, Geneva, 1964.
145