emergency room use
DESCRIPTION
TRANSCRIPT
Released 5/2012
Emergency Room Use Among Adults: Early Release of Estimates From the National Health Interview Survey 1
Emergency Room Use Among Adults Aged 18–64: Early Release of Estimates From the National Health Interview
Survey, January–June 2011 by Renee M. Gindi, Ph.D.; Robin A. Cohen, Ph.D.; and Whitney K. Kirzinger, M.P.H.,
Division of Health Interview Statistics, National Center for Health Statistics
Highlights From January through June 2011, among adults aged 18–64 whose last hospital visit in the past 12 months did not result in hospital admission: • About 79.7% of adults visited the
emergency room due to lack of access to other providers, significantly more than the 66.0% who visited due to seriousness of the medical problem.
• The most common reasons for the last emergency room visit were: only a hospital could help (54.5%), the doctor's office was not open (48.0%), or there was no other place to go (46.3%).
• Adults with public health plan
coverage were twice as likely as those with no health insurance to visit the emergency room because their doctor’s office was not open.
• Uninsured adults were more likely
than those with private health insurance or a public health plan to visit the emergency room due to having no other place to go.
• Adults living outside a
metropolitan statistical area (MSA) were more likely than those living in an MSA to visit the emergency room because their doctor’s office was not open.
• Adults with unmet medical need
were less likely than adults without unmet need to visit the emergency room because their doctor’s office was not open, and more likely to visit because they had no other place to go.
Introduction Rising health care costs make it important to understand the reasons that people seek emergency room care rather than less expensive outpatient or office-based care (1). Surveys in 2007 and 2010 showed that about 20% of U.S. adults had used the emergency room in the past 12 months, with usage most common for those with public health insurance and living outside a metropolitan statistical area (MSA) (2,3). Questions on reasons for emergency room use were added to the 2011 National Health Interview Survey (NHIS). NHIS data collected January– June 2011 show that 19.5% of adults aged 18–64 visited an emergency room in the past 12 months, 26.7% of whom were admitted at their last visit. This report provides preliminary estimates of reasons for emergency room use among U.S adults aged 18–64 whose last visit in the past 12 months did not result in a hospital admission, by health insurance status, area of residence (within or outside an MSA), and other selected variables. This report is produced by the NHIS Early Release Program, which releases updated selected estimates available from the NHIS website: http://www.cdc.gov/nchs/nhis.htm; see “Technical Notes” and “Additional Early Release Program Products.”
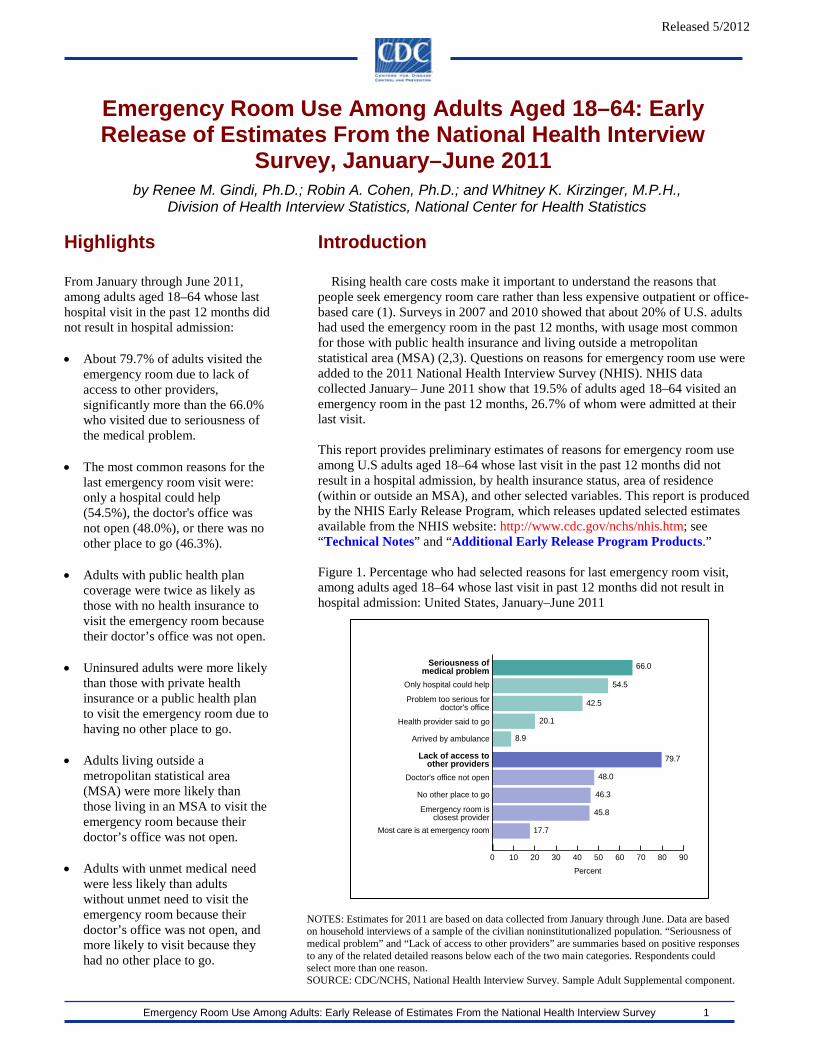
Figure 1. Percentage who had selected reasons for last emergency room visit, among adults aged 18–64 whose last visit in past 12 months did not result in hospital admission: United States, January–June 2011
Percent0 10 20 30 40 50 60 70 80 90
Most care is at emergency room
Emergency room isclosest provider
No other place to go
Doctor's office not open
Lack of access toother providers
Arrived by ambulance
Health provider said to go
Problem too serious fordoctor's office
Only hospital could help
Seriousness ofmedical problem 66.0
54.5
42.5
20.1
8.9
79.7
48.0
46.3
45.8
17.7
NOTES: Estimates for 2011 are based on data collected from January through June. Data are based on household interviews of a sample of the civilian noninstitutionalized population. “Seriousness of medical problem” and “Lack of access to other providers” are summaries based on positive responses to any of the related detailed reasons below each of the two main categories. Respondents could select more than one reason. SOURCE: CDC/NCHS, National Health Interview Survey. Sample Adult Supplemental component.

Released 5/2012
Emergency Room Use Among Adults: Early Release of Estimates From the National Health Interview Survey 2
1Significantly differs from private insurance, p < 0.05. 2Significantly differs from public coverage, p < 0.05. NOTES: Estimates for 2011 are based on data collected from January through June. Data are based on household interviews of a sample of the civilian noninstitutionalized population. SOURCE: CDC/NCHS, National Health Interview Survey, Family Core and Sample Adult Supplemental components.
From January through June 2011, among adults aged 18–64 whose last hospital visit in the past 12 months did not result in hospital admission: • An estimated 79.7% of adults visited the emergency room for reasons reflecting lack of access to other providers,
significantly more than the 66.0% of adults who visited because of seriousness of the medical problem (Figure 1).
• The most common individual reasons for the last emergency room visit were: only a hospital could help (54.5%), the doctor’s office was not open (48.0%), or there was no other place to go (46.3%). These reasons are explored further in this report.
Figure 2. Percentage who had selected reasons for last emergency room visit, among adults aged 18–64 whose last visit in past 12 months did not result in hospital admission, by insurance coverage status at time of interview: United States, January–June 2011
During January–June 2011, among adults whose last emergency room visit in the past 12 months did not result in hospital admission: • Uninsured adults were more likely to visit the emergency room because they had no other place to go at the time of the last
visit (61.6%), compared with adults having private insurance (38.9%) or those with public health plan coverage (48.5%) (Figure 2).
• Uninsured adults were significantly less likely to visit the emergency room because the doctor’s office was not open at the time of their last visit (30.9%) than adults with private insurance (49.9%) or those with public health plan coverage (59.7%). Among adults who also had a usual place of care, those who were uninsured were significantly less likely to visit the emergency room because the doctor’s office was not open at the time of their last visit (42.3%) than adults with private insurance (51.4%) or adults with public health plan coverage (62.9%) (data not shown).
• Approximately one-half of uninsured, privately insured, and public health plan-covered adults visited the emergency room because, at the last visit, only a hospital could help them.
0
10
20
30
40
50
60
70
Only hospitalcould help
Doctor's officeor clinic was
not open
No otherplace to go
53.455.651.8
59.7
249.9
1,230.9
48.5
238.9
1,261.6
Uninsured Private insurance Public coveragePercent
Released 5/2012
Emergency Room Use Among Adults: Early Release of Estimates From the National Health Interview Survey 3
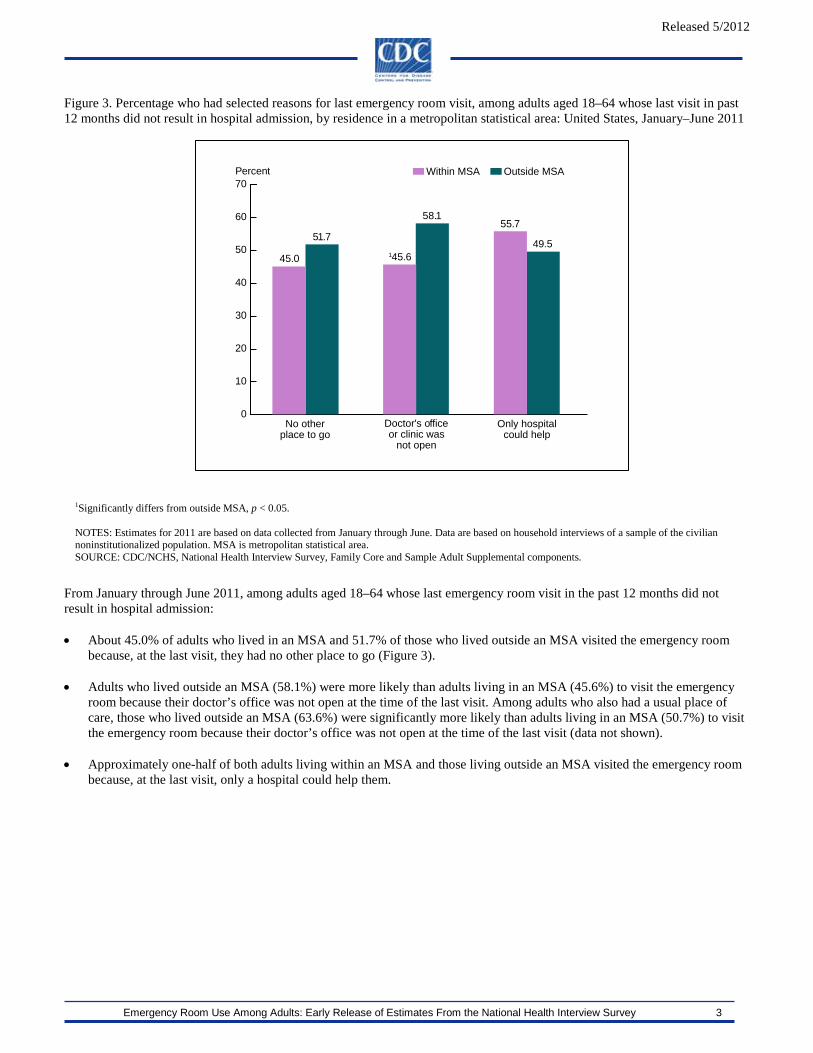
1Significantly differs from outside MSA, p < 0.05. NOTES: Estimates for 2011 are based on data collected from January through June. Data are based on household interviews of a sample of the civilian noninstitutionalized population. MSA is metropolitan statistical area. SOURCE: CDC/NCHS, National Health Interview Survey, Family Core and Sample Adult Supplemental components.
Figure 3. Percentage who had selected reasons for last emergency room visit, among adults aged 18–64 whose last visit in past 12 months did not result in hospital admission, by residence in a metropolitan statistical area: United States, January–June 2011
From January through June 2011, among adults aged 18–64 whose last emergency room visit in the past 12 months did not result in hospital admission: • About 45.0% of adults who lived in an MSA and 51.7% of those who lived outside an MSA visited the emergency room
because, at the last visit, they had no other place to go (Figure 3).
• Adults who lived outside an MSA (58.1%) were more likely than adults living in an MSA (45.6%) to visit the emergency room because their doctor’s office was not open at the time of the last visit. Among adults who also had a usual place of care, those who lived outside an MSA (63.6%) were significantly more likely than adults living in an MSA (50.7%) to visit the emergency room because their doctor’s office was not open at the time of the last visit (data not shown).
• Approximately one-half of both adults living within an MSA and those living outside an MSA visited the emergency room
because, at the last visit, only a hospital could help them.
145.6
58.155.7
49.551.7
45.0
Within MSA Outside MSAPercent
0
10
20
30
40
50
60
70
Only hospitalcould help
Doctor's officeor clinic was
not open
No otherplace to go

Released 5/2012
Emergency Room Use Among Adults: Early Release of Estimates From the National Health Interview Survey 4
Figure 4. Percentage who had selected reasons for last visit, among adults aged 18–64 whose last emergency room visit in the past 12 months did not result in hospital admission, by unmet medical need: United States, January–June 2011
During January–June 2011, among adults aged 18–64 whose last emergency room visit in the past 12 months did not result in hospital admission: • An estimated 57.3% of adults with unmet medical need visited the emergency room because they had no other place to go,
significantly more than the 43.0% of adults without unmet medical need.
• Adults with unmet medical need were less likely to visit the emergency room because their doctor’s office was not open (39.8%) than adults without unmet medical need (50.6%). However, among adults who also had a usual place of care, those with unmet medical need were just as likely to visit the emergency room because their doctor’s office was not open (52.6%) as adults without unmet medical need (53.5%) (data not shown).
• Slightly more than one-half of adults visited the emergency room because only the hospital could help, regardless of unmet
medical need.
No unmet medical needPercent
157.3
139.8
50.6
56.3 54.249.5
43.045.0
0
10
20
30
40
50
60
70
Only hospitalcould help
Doctor's officeor clinic was
not open
No otherplace to go
Unmet medical need
1Significantly differs from no unmet medical need, p < 0.05. NOTES: Estimates for 2011 are based on data collected from January through June. Data are based on household interviews of a sample of the civilian noninstitutionalized population. SOURCE: CDC/NCHS, National Health Interview Survey, Family Core and Sample Adult Supplemental components.

(Released 5/2012)
Emergency Room Use Among Adults: Early Release of Estimates From the National Health Interview Survey 5
Table 1. Percentage who had selected reasons for last visit, among adults aged 18–64 whose last emergency room visit in the past 12 months did not result in hospital admission, by selected characteristics: United States, January–June 2011
Selected characteristic
Selected reason for last emergency room visit1
No other place to go Doctor’s office or clinic
was not open Only a hospital could help
Percent (standard error) Total 46.3 (1.46) 48.0 (1.46) 54.5 (1.41)
Sex Male 46.0 (2.26) 44.6 (2.45) 57.8 (2.17) Female 46.5 (1.74) 50.4 (1.77) 52.1 (1.84)
Age 18–24 years 45.7 (3.43) 46.9 (3.58) 48.1 (3.21) 25–34 years 48.8 (2.86) 46.0 (3.14) 57.2 (2.95) 35–44 years 48.6 (2.87) 52.6 (2.87) 53.5 (3.09) 45–64 years 43.6 (2.19) 47.1 (2.37) 57.1 (2.07)
Race/ethnicity Hispanic 50.6 (3.17) 44.3 (3.43) 59.2 (3.50) Non-Hispanic white only 44.9 (1.91) 48.8 (2.09) 54.1 (1.87) Non-Hispanic black only 43.6 (2.91) 43.8 (2.64) 51.0 (3.19) Non-Hispanic Asian only 40.1 (6.66) 53.5 (8.11) 51.8 (6.99) Non-Hispanic other races 66.3 (5.84) 64.4 (6.47) 60.5 (6.51)
Residence2 In MSA 45.0 (1.60) 45.6 (1.63) 55.7 (1.58) Not in MSA 51.7 (3.80) 58.1 (3.22) 49.5 (3.21)
Poverty status3 Poor 55.4 (3.00) 48.6 (3.07) 49.7 (2.84) Near poor 50.7 (2.80) 49.4 (2.97) 59.3 (2.67) Not poor 41.0 (1.96) 48.3 (2.18) 54.0 (2.09)
Insurance coverage status at time of interview
Uninsured4 61.6 (3.34) 30.9 (2.85) 51.8 (3.16) Private5 38.9 (1.92) 49.9 (1.97) 55.6 (2.11) Public6 48.5 (2.75) 59.7 (2.58) 53.4 (2.36)
Health status7 Excellent/Very good 43.4 (1.88) 44.9 (2.00) 54.8 (1.87) Good 45.3 (2.77) 48.9 (2.78) 53.6 (2.73) Fair/Poor 55.1 (3.30) 54.6 (2.80) 55.0 (2.87)
Usual place of care8 Yes 41.5 (1.67) 53.2 (1.61) 55.7 (1.51) No 65.9 (3.02) 26.1 (3.14) 49.3 (3.43)
Unmet medical need9 Yes 57.3 (3.05) 39.8 (2.85) 56.3 (2.93) No 43.0 (1.65) 50.6 (1.68) 54.2 (1.58)
Frequency of emergency room use10
One visit 42.7 (1.77) 45.1 (1.72) 54.3 (1.67) Two or more visits 53.0 (2.58) 53.4 (2.41) 54.9 (2.45)
1Based on positive responses to questions in the Sample Adult component: “Tell me which of these apply to your last emergency room visit? You didn’t have another place to go. Your doctor’s office or clinic was not open. Only a hospital could help you.” These questions were asked only of those with a positive response to the question, “DURING THE PAST 12 MONTHS, HOW MANY TIMES have you gone to a HOSPITAL EMERGENCY ROOM about your own health (This includes emergency room visits that resulted in a hospital admission.)?” and a negative response to the question, “Did this emergency room visit result in a hospital admission?” 2Within or outside a metropolitan statistical area (MSA), as defined by the Office of Management and Budget. 3Based on family income and family size, using the U.S. Census Bureau’s poverty thresholds. “Poor” persons are defined as those below the poverty threshold; “near poor” persons have incomes of 100% to less than 200% of the poverty threshold; and “not poor” persons have incomes of 200% of the poverty threshold or greater. The percentage of respondents with unknown poverty status was 11.6% in the first two quarters of 2011. Estimates for persons with unknown poverty status
(Released 5/2012)
Emergency Room Use Among Adults: Early Release of Estimates From the National Health Interview Survey 6
are included in the total but are not shown separately. For more information on the unknown income and poverty status categories, see “NHIS Survey Description” for 2010, available from: http://www.cdc.gov/nchs/nhis.htm. Estimates may differ from estimates based on both reported and imputed income. 4Defined as not having any private health insurance, Medicare, Medicaid, Children’s Health Insurance Program (CHIP), state-sponsored or other government-sponsored health plan, or military plan. A person was also defined as uninsured if he or she had only Indian Health Service coverage or had only a private plan that paid for one type of service, such as accidents or dental care. 5Excludes plans that paid for only one type of service, such as accidents or dental care. A small number of persons were covered by both public and private plans and were included in both categories. 6Includes Medicaid, Children’s Health Insurance Program (CHIP), state-sponsored or other government-sponsored health plan, Medicare (disability), and military plans. A small number of persons were covered by both public and private plans and were included in both categories. 7Obtained from a question in the Family Core component that asked, “Would you say your health in general was excellent, very good, good, fair, or poor?” 8Based on a question in the Sample Adult Core component that asked, “Is there a place that you USUALLY go to when you are sick or need advice about your health?” If there was at least one such place, then a follow-up question was asked: “What kind of place [is it/do you go to most often]—a clinic, doctor’s office, emergency room, or some other place?” Choices for the second question were: “clinic or health center,” “doctor’s office or HMO,” “hospital emergency room,” “hospital outpatient department,” “some other place,” or “doesn’t go to one place most often.” Adults who indicated that the emergency room was their usual place for care were considered not to have a usual place of health care. 9Based on a positive response to either of the following two questions in the Family Core component: “DURING THE PAST 12 MONTHS, [have you delayed seeking medical care/has medical care been delayed for anyone in the family] because of worry about the cost?” and “DURING THE PAST 12 MONTHS, was there any time when [you/someone in the family] needed medical care, but did not get it because [you/the family] couldn’t afford it?” Dental care is excluded. 10Based on a question in the Sample Adult Core component that asked, “During the past 12 months, how many times have you gone to a hospital emergency room about your own health (This includes emergency room visits that resulted in a hospital admission.)?” NOTES: Estimates for 2011 are based on data collected from January through June. Data are based on household interviews of a sample of the civilian noninstitutionalized population. SOURCE: CDC/NCHS, National Health Interview Survey, Family Core and Sample Adult Core and Supplemental components, 2011.

(Released 5/2012)
Emergency Room Use Among Adults: Early Release of Estimates From the National Health Interview Survey 7
Table 2. Percentage who had summary reasons for last visit, among adults aged 18–64 whose last emergency room visit in the past 12 months did not result in hospital admission, by selected characteristics: United States, January–June 2011
Selected characteristic
Summary reason for last emergency room visit
Seriousness of medical problem1
Lack of access to other providers2
Percent (standard error) Total 66.0 (1.39) 79.7 (1.16)
Sex Male 68.0 (2.08) 80.9 (1.95) Female 64.5 (1.77) 78.9 (1.46)
Age 18–24 years 60.3 (3.01) 85.2 (2.50) 25–34 years 65.7 (2.88) 77.9 (2.44) 35–44 years 65.1 (3.03) 76.9 (2.63) 45–64 years 70.0 (1.93) 79.4 (2.02)
Race/ethnicity Hispanic 67.9 (3.41) 80.8 (2.97) Non-Hispanic white only 65.8 (1.80) 77.9 (1.55) Non-Hispanic black only 63.7 (2.95) 83.2 (2.39) Non-Hispanic Asian only 70.5 (5.79) 77.9 (6.84) Non-Hispanic other races 69.7 (5.79) 92.0 (3.10)
Residence3 In MSA 67.2 (1.54) 78.9 (1.34) Not in MSA 61.1 (3.17) 83.2 (2.29)
Poverty status4 Poor 61.8 (2.68) 85.5 (1.85) Near poor 69.9 (2.57) 82.6 (2.56) Not poor 65.3 (2.12) 76.3 (1.73) Insurance coverage status at time
of interview Uninsured5 61.5 (3.08) 82.3 (2.50) Private6 66.7 (2.15) 76.6 (1.67) Public7 67.4 (2.18) 84.4 (1.85)
Health status8 Excellent/Very good 65.3 (1.88) 77.6 (1.53) Good 65.7 (2.56) 80.5 (2.45) Fair/Poor 68.1 (2.69) 84.0 (2.06)
Usual place of care9 Yes 67.1 (1.51) 78.2 (1.35) No 61.2 (3.30) 86.1 (2.33)
Unmet medical need10 Yes 67.6 (2.69) 79.7 (2.85) No 65.8 (1.59) 79.7 (1.23)
Frequency of emergency room use11
One visit 64.6 (1.67) 77.0 (1.50) Two or more visits 68.6 (2.21) 84.9 (1.86)
1Based on a positive response to any one of these questions in the Sample Adult component: “Tell me which of these apply to your last emergency room visit? Your health provider advised you to go. The problem was too serious for the doctor’s office or clinic. Only a hospital could help you. You arrived by ambulance or other emergency vehicle.” Respondents could select more than one reason. 2Based on a positive response to any one of these questions in the Sample Adult component: “Tell me which of these apply to your last emergency room visit? You didn’t have another place to go. Your doctor’s office or clinic was not open. The emergency room is your closest provider. You get most of your care at the emergency room.” Respondents could select more than one reason. 3Within or outside a metropolitan statistical area (MSA), as defined by the Office of Management and Budget. 4Based on family income and family size, using the U.S. Census Bureau’s poverty thresholds. “Poor” persons are defined as those below the poverty threshold; “near poor” persons have incomes of 100% to less than 200% of the poverty threshold; and “not poor” persons have incomes of 200% of the poverty threshold or greater. The percentage of respondents with unknown poverty status was 11.6% in the first two quarters of 2011. Estimates for persons with unknown poverty status
(Released 5/2012)
Emergency Room Use Among Adults: Early Release of Estimates From the National Health Interview Survey 8
are included in the total but are not shown separately. For more information on the unknown income and poverty status categories, see “NHIS Survey Description” for 2010, available from: http://www.cdc.gov/nchs/nhis.htm. Estimates may differ from estimates based on both reported and imputed income. 5Defined as not having any private health insurance, Medicare, Medicaid, Children’s Health Insurance Program (CHIP), state-sponsored or other government-sponsored health plan, or military plan. A person was also defined as uninsured if he or she had only Indian Health Service coverage or had only a private plan that paid for one type of service, such as accidents or dental care. 6Excludes plans that paid for only one type of service, such as accidents or dental care. A small number of persons were covered by both public and private plans and were included in both categories. 7Includes Medicaid, Children’s Health Insurance Program (CHIP), state-sponsored or other government-sponsored health plan, Medicare (disability), and military plans. A small number of persons were covered by both public and private plans and were included in both categories. 8Obtained from a question in the Family Core component that asked: “Would you say your health in general was excellent, very good, good, fair, or poor?” 9Based on a question in the Sample Adult Core component that asked, “Is there a place that you USUALLY go to when you are sick or need advice about your health?” If there was at least one such place, then a follow-up question was asked: “What kind of place [is it/do you go to most often]—a clinic, doctor’s office, emergency room, or some other place?” Choices for the second question were: “clinic or health center,” “doctor’s office or HMO,” “hospital emergency room,” “hospital outpatient department,” “some other place,” and “doesn’t go to one place most often.” Adults who indicated that the emergency room was their usual place for care were considered not to have a usual place of health care. 10Based on a positive response to either of the following two questions in the Family Core component: “DURING THE PAST 12 MONTHS, [have you delayed seeking medical care/has medical care been delayed for anyone in the family] because of worry about the cost?” and “DURING THE PAST 12 MONTHS, was there any time when [you/someone in the family] needed medical care, but did not get it because [you/the family] couldn’t afford it?” Dental care is excluded. 11Based on a question in the Sample Adult Core component that asked, “During the past 12 months, how many times have you gone to a hospital emergency room about your own health (This includes emergency room visits that resulted in a hospital admission.)?” NOTES: Estimates for 2011 are based on data collected from January through June. Data are based on household interviews of a sample of the civilian noninstitutionalized population. SOURCE: CDC/NCHS, National Health Interview Survey, Family Core and Sample Adult Core and Supplemental components, 2011.

(Released 5/2012)
Emergency Room Use Among Adults: Early Release of Estimates From the National Health Interview Survey 9
Technical Notes The National Health Interview Survey (NHIS) is the principal source of health information for the civilian noninstitutionalized population of the United States and is conducted by the Centers for Disease Control and Prevention’s (CDC) National Center for Health Statistics (NCHS). NCHS is releasing selected estimates of emergency room use for adults aged 18–64 in the civilian noninstitutionalized U.S. population based on data from the 2011 NHIS. The estimates are being released prior to final data editing and final weighting, to provide access to the most recent information from NHIS. The resulting estimates for persons without health insurance are generally 0.1–0.3 percentage points lower than those based on the editing procedures used for the final data files. Occasionally, because of decisions made for the final data editing and weighting, estimates based on preliminary editing procedures may differ by more than 0.3 percentage points from estimates based on final files. Estimates are stratified by sex, age, race/ethnicity, area of residence, poverty status, health insurance coverage status, self-reported health status, usual place of care, unmet medical need, and frequency of emergency room use in the past 12 months. Tables are shown only for adults aged 18–64. Data source Data used to produce this Early Release report are derived from the Family Core, Sample Adult Core, and Sample Adult Supplemental components of the NHIS from January through June 2011. These components collect information on all family members in each household. Data analyses for the January–June 2011 NHIS were based on 52,043 persons in the Family Core and 17,040 adults in the Sample Adult Core and Supplemental components. Visit the NHIS website at http://www.cdc.gov/nchs/nhis.htm for more information about the design, content, and use of NHIS. Estimation procedures NCHS creates survey weights for each calendar quarter of the NHIS sample. The NHIS data weighting procedure is described in more detail at: http://www.cdc.gov/nchs/data/series/sr_02/sr02_130.pdf. Estimates were calculated using the NHIS survey weights, which are calibrated to census totals for sex, age, and race/ethnicity of the U.S. civilian noninstitutionalized population. Weights for the 2011 NHIS data were derived from 2000 census-based population estimates. Point estimates, and estimates of their variances, were calculated using SUDAAN software to account for the complex sample design of NHIS. The Taylor series linearization method was chosen for variance estimation. Unless otherwise noted, all estimates shown meet the NCHS standard of relative standard error less than or equal to 30%. Differences between percentages or rates were evaluated using two-sided significance tests at the 0.05 level. Terms such as “greater than,” “less than,” and “compared with” indicate a statistically significant difference. Terms such as “similar” and “no difference” indicate that the estimates being compared were not significantly different. Lack of comment regarding the difference between any two estimates does not necessarily mean that the difference was tested and found to be not significant.
Definitions of selected terms Emergency room visit—Based on a positive response to the question in the Sample Adult Core component that asked, “During the past 12 months, how many times have you gone to a hospital emergency room about your own health (This includes emergency room visits that resulted in a hospital admission.)?” Reasons for last emergency room visit—Respondents who indicated that they had visited the emergency room one or more times in the past 12 months in answering the question in the Sample Adult Core component that asked, “During the past 12 months, how many times have you gone to a hospital emergency room about your own health (This includes emergency room visits that resulted in a hospital admission.)?” were then asked, “Did this emergency room visit result in a hospital admission?” Those who indicated that the emergency room visit did not result in a hospital admission were asked additional questions about the reason for the visit and could respond positively to more than one reason in the question that asked, “Tell me which of these apply to your last emergency room visit? You didn’t have another place to go. Your doctor’s office or clinic was not open. Your health provider advised you to go. The problem was too serious for the doctor’s office or clinic. Only a hospital could help you. The emergency room is your closest provider. You get most of your care at the emergency room. You arrived

(Released 5/2012)
Emergency Room Use Among Adults: Early Release of Estimates From the National Health Interview Survey 10
by ambulance or other emergency vehicle.” Of the eight reasons asked about, the three most common (only a hospital could help, doctor’s office or clinic was not open, and no other place to go) are explored in further detail in this report. Hospital admission at last emergency room visit—Respondents who indicated that they had visited the emergency room one or more times in the past 12 months in answering the question in the Sample Adult Core component that asked, “During the past 12 months, how many times have you gone to a hospital emergency room about your own health (This includes emergency room visits that resulted in a hospital admission.)?” were then asked, “Did this emergency room visit result in a hospital admission?” According to NHIS data collected during January–June 2011, 26.7% of adults aged 18–64 who visited an emergency room in the past 12 months were admitted to the hospital at the last emergency room visit. This is higher than the estimate from the 2007 National Hospital Ambulatory Medical Care Survey that 12.5% of all emergency room visits result in hospital admission, using emergency room visits made by patients of all ages (4). This discrepancy may be due in part to the self-report of hospital admission by NHIS respondents, and respondents’ inability to distinguish between hospital admission and admission into an emergency department observation unit, which is not considered to be a hospital admission. Health insurance coverage at interview—Health insurance coverage status at interview may not be the same as coverage status at the time of the last emergency room visit. The “Private health insurance coverage” category excludes plans that pay for only one type of service such as accidents or dental care. The “Public health plan coverage” category includes Medicaid, Children’s Health Insurance Program (CHIP), state-sponsored or other government-sponsored health plans, Medicare, and military plans. A small number of persons were covered by both public and private plans and were included in both categories. A person was defined as uninsured if he or she did not have any private health insurance, Medicare, Medicaid, CHIP, state-sponsored or other government-sponsored health plan, or military plan at the time of interview. A person was also defined as uninsured if he or she had only Indian Health Service coverage or had only a private plan that paid for one type of service such as accidents or dental care. The analyses excluded persons with unknown health insurance status (about 1% of respondents each year). Hispanic or Latino origin and race—Refers to two separate and distinct categories. Persons of Hispanic or Latino origin may be of any race. Hispanic or Latino origin includes persons of Mexican, Puerto Rican, Cuban, Central and South American, or Spanish origin. Race is based on the family respondent’s description of his or her own race background, as well as the race background of other family members. For conciseness, the text, tables, and figures in this report use shorter versions of the 1997 Office of Management and Budget terms for race and Hispanic or Latino origin. For example, the category “Not Hispanic or Latino, black or African American, single race” is referred to as “Non-Hispanic black only” in the text, tables, and figures. Estimates for non-Hispanic persons of races other than white only, black only, and Asian only, or of multiple races, are combined into the “Non-Hispanic other races” category. Poverty status—Based on the ratio of the family’s income in the previous calendar year to the appropriate poverty threshold (given the family’s size and number of children) defined by the U.S. Census Bureau for that year (5). Persons categorized as “Poor” have a ratio less than 1.0 (i.e., their family income was below the poverty threshold); “Near poor” persons have incomes of 100% to less than 200% of the poverty threshold; and “Not poor” persons have incomes that are 200% of the poverty threshold or greater. The percentage of respondents with unknown poverty status in the first two quarters of 2011 was 11.6%. For more information on unknown income and unknown poverty status, see “NHIS Survey Description” for 2010 (available from: http://www.cdc.gov/nchs/nhis.htm). NCHS imputes exact income for approximately 30% of NHIS records. The imputed income files are released a few months after the annual release of NHIS microdata and are not available for the Early Release reports. Therefore, Early Release estimates stratified by poverty status are based on reported income only and may differ from estimates produced later that are based on both reported and imputed income. Unmet medical need—Based on a positive response to either of the following two questions in the Family Core component: “DURING THE PAST 12 MONTHS, [have you delayed seeking medical care/has medical care been delayed for anyone in the family] because of worry about the cost?” and “DURING THE PAST 12 MONTHS, was there any time when [you/someone in the family] needed medical care, but did not get it because [you/the family] couldn’t afford it?” Dental care is excluded. Usual place of care—Based on responses to the survey question that asked, “Is there a place that you USUALLY go to when you are sick or need advice about your health?” If there was at least one such place, then a follow-up question was asked: “What kind of place [is it/do you go to most often]—a clinic, doctor’s office, emergency room, or some other place?” Choices for the second question were: “clinic or health center,” “doctor’s office or HMO,” “hospital emergency room,” “hospital

(Released 5/2012)
Emergency Room Use Among Adults: Early Release of Estimates From the National Health Interview Survey 11
outpatient department,” “some other place,” or “doesn’t go to one place most often.” Adults who indicated that the emergency room was their usual place for care were considered not to have a usual place of health care. Additional Early Release Program Products Additional reports are published through the Early Release Program. “Early Release of Selected Estimates Based on Data From the National Health Interview Survey” is published quarterly in about March, June, September, and December and provides estimates of 15 selected measures of health, including insurance coverage. Other measures of health include estimates of having a usual place to go for medical care, obtaining needed medical care, influenza vaccination, pneumococcal vaccination, obesity, leisure-time physical activity, current smoking, alcohol consumption, HIV testing, general health status, personal care needs, serious psychological distress, diagnosed diabetes, and asthma episodes and current asthma. “Health Insurance Coverage: Early Release of Estimates From the National Health Interview Survey” is published quarterly in about March, June, September, and December and provides detailed estimates of health insurance coverage. “Wireless Substitution: Early Release of Estimates From the National Health Interview Survey” is published in May and December and provides selected estimates of telephone coverage in the United States. Preliminary microdata files containing selected NHIS variables are produced quarterly by the NHIS Early Release Program. For each data collection year, these files are made available three times: in about September (with data from the first quarter), in about December (with data from the first two quarters), and in about March of the next year (with data from the first three quarters). Analysts may access these files through the NCHS Research Data Center. New Early Release Program measures or products may be added as work continues and in response to changing data needs. Feedback on these releases is welcome ([email protected]). Announcements about Early Releases, other new data releases, publications, or corrections related to NHIS will be sent to members of the HISUSERS listserv. To join, visit the CDC website at: http://www.cdc.gov/subscribe.html. References 1. Machlin S R. Expenses for a Hospital Emergency Room Visit, 2003. Statistical Brief #111. Rockville, MD: Agency for Healthcare Research and Quality. 2006. 2. Garcia TC, Bernstein AB, Bush MA. Emergency department visitors and visits: Who used the emergency room in 2007? NCHS data brief, no 38. Hyattsville, MD: National Center for Health Statistics. 2010. 3. National Center for Health Statistics. Health, United States, 2010, with special feature on death and dying. Hyattsville, MD. 2011. 4. Niska R, Bhuiya F, Xu J. National Hospital Ambulatory Medical Care Survey: 2007 Emergency Department Summary. National health statistics reports; no 26. Hyattsville, MD: National Center for Health Statistics. 2010. 5. DeNavas-Walt C, Proctor BD, Smith JC. Income, poverty, and health insurance coverage in the United States: 2010. U.S. Census Bureau. Current population reports, P60–239. Washington, DC: U.S. Government Printing Office. 2011. Suggested citation Gindi RM, Cohen RA, Kirzinger WK. Emergency room use among adults aged 18–64: Early release of estimates from the National Health Interview Survey, January–June 2011. National Center for Health Statistics. May 2012. Available from: http://www.cdc.gov/nchs/nhis/releases.htm.