emergency - bureau of health information - homepage than half a million patients attended public...
TRANSCRIPT

More than half a million patients attended
public hospital emergency departments (EDs)
during January to March 2011, 4% more than
during the same quarter last year and 8% more
than two years ago. Attendances were slightly
lower than the previous quarter, when more
patients attended NSW EDs than at the peak
of the 2009 swine flu pandemic.
Despite this small drop, attendances were still
8,000 higher than the swine flu peak, suggesting
a six-month trend of higher patient numbers
compared with the past two years.
Hospital ED performance varies across NSW.
State-wide, however, patients were seen
within recommended time frames for all triage
From January to March 2011... Same period last year... The difference...
There were 526,005 visits to NSW emergency departments 508,174 visits 17,831 (+4%)
124,729 people travelled to the emergency department by ambulance 122,268 people 2,461 (+2%)
66% of people arriving by ambulance were transferred into the care of ED staff within the 30-minute target
71%5 percentage point decrease
There were 117,071 admissions to hospital from emergency departments 106,323 admissions 10,748 (+10%)
64% of people admitted from the emergency department arrived on the ward within the target of eight hours of being triaged
68%4 percentage point decrease
71% of patients with potentially life-threatening conditions were seen within the recommended 30 minutes compared with the 75% target
73%2 percentage point decrease
Emergency DepartmentsHospital Quarterly: Performance of NSW public hospitals
January to March 2011
categories, except those with potentially
life-threatening conditions (triage 3), where 71%,
rather than the target 75%, were seen within
30 minutes. This is unchanged from last quarter
and compares with 73% a year ago. This Hospital
Quarterly report shows 66% of patients were
transferred from an ambulance into ED care
within 30 minutes of arriving at hospital (66% last
quarter and 71% last year). The target is 90%.
A total of 64% of patients were admitted to
hospital from the ED within the recommended
eight hours, compared with 65% last quarter
and 68% last year. The target is 80%.
This is one of three Hospital Quarterly modules.
For the Elective Surgery and Admitted Patients
modules visit www.bhi.nsw.gov.au
HOSPITAL QUARTERLY: Emergency Departments January to March 2011 www.bhi.nsw.gov.au 1

Figure 1 summarises patient journeys through
NSW EDs during the January to March 2011
quarter and Figure 2 examines attendances
and patient journeys by triage category.
There were more than half a million attendances
at NSW public hospital EDs during the quarter.
The majority of these were considered
‘emergency attendances’ and the remaining
14,510 patients arrived for planned or
prearranged visits. Among this latter group,
1,671 were admitted to hospital via the ED.
When a person needs care in a public hospital
emergency department (ED) they begin what is
called a ‘patient journey’. These journeys can
involve many different pathways, but most follow
a similar pattern, regardless of whether or not
the patient arrives in an ambulance.
First, patients are triaged.* Next, they are given
a more detailed assessment and then they are
treated. After treatment they leave the ED or are
admitted to hospital.
Hospital staff record the times when each of
these events occur and these times are used
to measure how long it takes to complete care.
Emergency department journeys
Triage 1Triage 2
Triage 5
All
atte
ndan
ces
Em
erge
ncy
atte
ndan
ces
Triage 4
Triage 3
Emergency treatment completed and admitted to hospitalTransferred to another facility
and transferred to another facility
Emergency treatment completed
Emergency treatment completed and left for home
Patient left without, or before completing, treatment
Dead on arrival
Died in emergency dept.
The thickness of each arrow is approximately proportional to the number of NSW emergency department patients in each category. The arrows are coloured by triage level.
Non-emergency
Triage 2 Imminently life threatening
Triage 1 Immediately life threatening
Triage 4 Potentially serious
Triage 3 Potentially life threatening
Triage 5 Less urgent
Figure 1: Summary of patient journeys through NSW emergency departments
* A registered nurse assigns people to a ‘triage category’ when they arrive in the emergency department depending on how urgently they require care. Triage is a five-point scale where category 1 is most urgent and category 5 is least urgent.
2 HOSPITAL QUARTERLY: Emergency Departments January to March 2011 www.bhi.nsw.gov.au

A breakdown of emergency attendance
figures shows that almost half of all emergency
attendances (46%) were categorised as potentially
serious (triage 4), 29% were categorised as
potentially life threatening (triage 3), 16% were
in the lowest urgency category (triage 5) and
8% were imminently life threatening (triage 2).
Immediately life threatening (triage 1), the most
urgent category, represents less than 1% of all
people triaged in emergency departments.
The three main ED journeys
Almost seven in 10 patients (67%) who were
triaged during the quarter received treatment
in the ED but were not subsequently admitted
to hospital. They were most likely to come from
the potentially serious category (triage 4).
More than two in 10 (23%) were treated in ED and
admitted to the same hospital, and were most
likely to have a potentially life-threatening condition
(triage 3). Nearly one in 10 (9%) left the ED without,
or before completing, treatment and these
Figure 2: Attendances at NSW emergency departments, January to March 2011
Treated and admittedto hospital (117,071)
Treated and dischargedor transferred (341,872)
Patient left without,or before completing,treatment (44,935)
All attendances:1 526,005 patients
Emergency attendances2 by triage category: 511,495 patients
2,921 (1%) 2,790
42,305 (8%) 41,092
150,797 (29%) 146,411
233,646 (46%) 224,675
Immediately life threatening1
Imminently life threatening 2
Potentially life threatening3
Potentially serious4
81,826 (16%) 81,061Less urgent5
Emergency attendances by triage category and mode of separation:3 501,878 patients
1,894 (2%)
22,628 (19%)
53,784 (46%)
35,010 (30%)
Immediately life threatening1
Imminently life threatening 2
Potentially life threatening3
Potentially serious4
3,755 (3%)
17 (0%)
658 (2%)
6,808 (16%)
23,643 (55%)
11,809 (28%)
698 (0%)
18,416 (5%)
88,715 (26%)
171,252 (50%)
62,791 (18%) Less urgent5
last yearSame period
1. All attendances at the emergency department including emergency and non-emergency.2. All emergency attendances (emergency presentation and pre-arranged admissions) with a recorded triage category.3. All emergency attendances with a recorded triage category, excluding attendances with a mode of separation
of ‘transferred prior to treatment’, ‘dead on arrival’ or ‘died in ED’. Note: All percentages rounded to whole numbers and therefore percentages may not add to 100%. Note: Emergency department activity includes 87 facilities for which electronic data is reported. This covers approximately
85% of NSW emergency department activity. Source: Health Information Exchange, NSW Health. Data extracted on 18 April 2011.
HOSPITAL QUARTERLY: Emergency Departments January to March 2011 www.bhi.nsw.gov.au 3

people were most likely to come from the least
urgent categories (triage 4 and 5). Patients have a
number of reasons for leaving before completing
treatment, including being dissatisfied with the
care they received or their reason for visiting
resolved without treatment from staff.
Arrivals by ambulance
When a patient arrives at the ED by ambulance,
the ambulance crew waits with them until
ED staff can accept that patient into their care.
The time taken for this to occur is called transfer
time or off-stretcher time. Transfer time targets
in NSW require 90% of patients arriving by
ambulance to be accepted by the ED within
30 minutes of arrival.
In the January to March 2011 quarter,
124,729 patients (24% of all attendances) arrived
at hospital by ambulance and 66% of these
patients were transferred within the 30-minute
target time (Figure 3). This compares with
66% last quarter and 71% a year ago.
From triage to treatment
Targets have also been set for the time interval
between when a patient is triaged and when
they are treated by ED staff.
In 1993, the Australasian College for Emergency
Medicine recommended a series of triage to
start-of-treatment times for each triage category.
These waiting times were endorsed nationally
for public hospitals in 1999. Each triage category
has a maximum recommended time in which the
patient should wait to be seen by a healthcare
professional and treatment should begin.
The guidelines are as follows:
In the January to March 2011 quarter, electronic
patient records showed almost all patients
across NSW in triage 1 (rounding to 100%) were
seen within the recommended two minutes.
When data were extracted on 18 April 2011,
electronic patient records showed that
Port Macquarie Base Hospital did not achieve
the triage 1 target, with two patients recorded
as waiting longer than two minutes.
On 24 April 2011, the Bureau contacted the
NSW Department of Health* about this result.
On 14 May 2011, the Department notified the
Bureau that its investigation concluded these
records contained data entry errors and all
patients received treatment within the target.
Emergency department guidelines
Category 1 Immediately life threatening: 100% seen in 2 minutes
Category 2 Imminently life threatening: 80% seen in 10 minutes
Category 3 Potentially life threatening: 75% seen in 30 minutes
Category 4 Potentially serious: 70% seen in 60 minutes
Category 5 Less urgent: 70% seen in 120 minutes
* On any occasions where Triage 1 performance is less than 100%, the NSW Department of Health initiates an investigation.
4 HOSPITAL QUARTERLY: Emergency Departments January to March 2011 www.bhi.nsw.gov.au

Figure 3: Ambulance attendances and on-time performance, by triage category, in NSW emergency departments, January to March 2011
1. Transfer time refers to the time between arrival and transfer to the care of the emergency department. 2. All emergency attendances excluding those without a recorded triage category, triage time, treatment time or with
a mode of separation of ‘transferred prior to treatment’, ‘dead on arrival’ or ‘did not wait for treatment’.3. Targets for triage levels are recommended by the Australasian College for Emergency Medicine.Source: Health Information Exchange, NSW Health. Data extracted on 18 April 2011. Ambulance patient numbers
and off-stretcher time data provided by the NSW Ambulance Service on 15 April 2011.
Percentage of patients who received treatment2 by target3 time, by triage category
100%
84%
71%
73%
Immediately life threatening1
Imminently life threatening 2
Potentially life threatening3
Potentially serious4
88% Less urgent5
Immediately life threatening1
Imminently life threatening 2
Potentially life threatening3
Potentially serious4
Less urgent5
Percentage of patients who received treatment2 by time and triage category
Target: 100% seen in 2 min.
Attendances arriving by ambulance: 124,729 patients
66% Transfer time (off stretcher)1 Target: 90% transferred in 30 min.
Target: 80% seen in 10 min.
Target: 75% seen in 30 min.
Target: 70% seen in 60 min.
Target: 70% seen in 120 min.
Pat
ient
s w
ho r
ecei
ved
trea
tmen
t (%
)
0
20
40
60
80
100
Minutes from triage until treatment
0 20 40 60 80 100 120 140 160 170 180
71%
last yearSame period
100%
84%
73%
75%
89%
The percentage of patients seen within the
recommended time for triage 2, 4 and 5
exceeded targets during the quarter. Specifically,
84% of patients in triage 2, 73% of patients in
triage 4 and 88% of patients in triage 5 were
seen on time. In triage 3, 71% of patients were
seen on time, which is below the target of 75%.
Figure 3 shows the percentage of patients in each
triage category seen in different time intervals.
Compared with the same time last year, 100%
of patients in triage 1, 84% of patients in triage 2,
73% of patients in triage 3, 75% of patients in
triage 4 and 89% of patients in triage 5 were
seen within the maximum recommended time.
This represents a decline in performance of
1-2 percentage points for categories 3, 4 and 5
compared with the same period one year ago.
Triage categories 1 and 2 are unchanged.
HOSPITAL QUARTERLY: Emergency Departments January to March 2011 www.bhi.nsw.gov.au 5

Leaving the emergency department
When doctors decide an emergency patient
requires admission to hospital, they work
to a recommended time frame. Emergency
Admission Performance (EAP) is the percentage
of patients who leave the ED to go to a ward
within eight hours from the time the hospital
recorded the patient as being triaged (or their time
of arrival in the ED, if triage time is missing).
The EAP target requires 80% of emergency
patients who require admission to that hospital
to leave the ED within eight hours of arrival.
In the January to March 2011 quarter, EAP was
64% across NSW. That is, almost two-thirds of
patients were treated in an ED and admitted to a
public hospital within eight hours of being triaged
(Figure 4, Table 1). This level of performance is
similar to last quarter (65%) and down from the
same quarter in 2010 (68%).
Across NSW, EAP varied by triage category
during the January to March quarter. For example,
patients from the most urgent (triage 1) and the
least urgent (triage 5) categories were admitted
more quickly than patients from the other three
groups (Figure 4, Table 1).
Figure 4: Timeliness in NSW emergency departments, by triage category, January to March 2011
Immediately life threatening
1 Imminently life threatening
2 Potentially life threatening
3 Potentially serious4 Less urgent5
Percentage of patients who were treated and admitted Percentage of patients who were treated and by time and triage category1 discharged or transferred by time and triage category1
Emergency admission performance (EAP): Percentage of patients who were treated and admitted
Arrival to admission Target: 80% admitted in 8 hours 64% 68%
Hours from arrival until admission
0 2 4 6 8 10 12
Pat
ient
s w
ho w
ere
adm
itted
(%)
0
20
40
60
80
100
Hours from arrival until discharge or transfer
0 2 4 6 8 10 12
Pat
ient
s w
ho w
ere
not
adm
itted
(%)
0
20
40
60
80
100
last yearSame period
1. All emergency attendances excluding those without a recorded triage category, treatment time, departure time, left without, or before completing, treatment, were transferred prior to treatment, or were certified dead in the ED.
Source: Health Information Exchange, NSW Health. Data extracted on 18 April 2011.
6 HOSPITAL QUARTERLY: Emergency Departments January to March 2011 www.bhi.nsw.gov.au

Table 1 looks at treatment-to-admission
times for patients in each triage group in
two-hour intervals from the time they were
triaged until the time they were admitted
to the same hospital. During the quarter,
these patients made up nearly a quarter
(23%) of all emergency attendances.
Table 2 shows the time taken from being
triaged to leaving the ED for those patients
who completed treatment but were not
admitted to hospital. During the quarter,
these patients made up two-thirds (67%)
of all emergency attendances.
For this group of patients, the time taken to
leave the ED varied according to triage category
during the January to March quarter. More than
one-third of these patients (38%) left hospital
within two hours of being triaged.
Patients with less urgent triage status tended
to leave the emergency department soonest.
By eight hours, 94% of all patients who were
not admitted had left the ED (Table 2).
Table 1: Percentage of patients admitted to hospital from NSW emergency departments, by triage level and time interval1, January to March 2011
2 hours 4 hours 6 hours8 hours
(EAP)10 hours 12 hours 14 hours
Triage 1: Immediately life threatening 16% 42% 66% 79% 85% 89% 92%
Triage 2: Imminently life threatening 6% 24% 48% 69% 79% 85% 89%
Triage 3: Potentially life threatening 4% 19% 41% 63% 74% 82% 87%
Triage 4: Potentially serious 6% 20% 41% 63% 75% 83% 88%
Triage 5: Less urgent 15% 36% 56% 73% 83% 88% 92%
All triage categories 6% 21% 43% 64% 76% 83% 88%
1. Time from triage (or arrival in the emergency department if triage time missing) until arrival on the ward for those admitted from the emergency department.
Source: Health Information Exchange, NSW Health. Data extracted on 18 April 2011.
“By examining the numbers presented
in our regular reports, we see a story
begin to unfold about how the state’s
hospitals are dealing with demand,
how they compare with each other,
where they excel, and where there
might be opportunities to improve.”
Dr Diane Watson
Chief ExecutiveBureau of Health Information
HOSPITAL QUARTERLY: Emergency Departments January to March 2011 www.bhi.nsw.gov.au 7
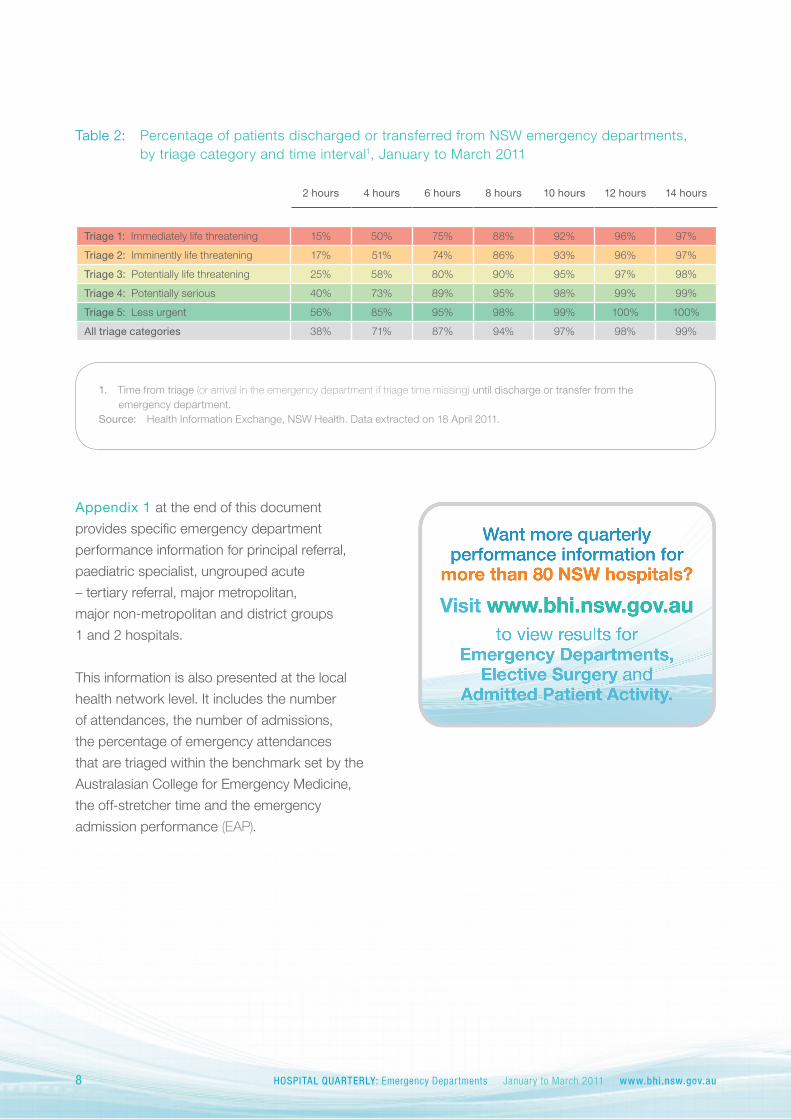
Table 2: Percentage of patients discharged or transferred from NSW emergency departments, by triage category and time interval1, January to March 2011
2 hours 4 hours 6 hours 8 hours 10 hours 12 hours 14 hours
Triage 1: Immediately life threatening 15% 50% 75% 88% 92% 96% 97%
Triage 2: Imminently life threatening 17% 51% 74% 86% 93% 96% 97%
Triage 3: Potentially life threatening 25% 58% 80% 90% 95% 97% 98%
Triage 4: Potentially serious 40% 73% 89% 95% 98% 99% 99%
Triage 5: Less urgent 56% 85% 95% 98% 99% 100% 100%
All triage categories 38% 71% 87% 94% 97% 98% 99%
1. Time from triage (or arrival in the emergency department if triage time missing) until discharge or transfer from the emergency department.
Source: Health Information Exchange, NSW Health. Data extracted on 18 April 2011.
Appendix 1 at the end of this document
provides specific emergency department
performance information for principal referral,
paediatric specialist, ungrouped acute
– tertiary referral, major metropolitan,
major non-metropolitan and district groups
1 and 2 hospitals.
This information is also presented at the local
health network level. It includes the number
of attendances, the number of admissions,
the percentage of emergency attendances
that are triaged within the benchmark set by the
Australasian College for Emergency Medicine,
the off-stretcher time and the emergency
admission performance (EAP).
8 HOSPITAL QUARTERLY: Emergency Departments January to March 2011 www.bhi.nsw.gov.au

Figure 5: Attendances at, and admissions from, NSW emergency departments, January 2009 to March 2011
(*) Admissions refers to all admissions through the emergency department. Emergency admissions refers only to those patients attending for an emergency or unplanned presentation, and who have a recorded triage category.
Note: Emergency department activity includes 87 facilities for which electronic data are reported. This covers approximately 85% of NSW emergency department activity.
Note: Numbers might differ slightly from those previously reported by the NSW Department of Health’s Quarterly Hospital Performance Report due to differences in when data were extracted from the emergency department information system.
Source: Health Information Exchange, NSW Health. Data extracted on 18 April 2011.
0
200,000
100,000
300,000
400,000
500,000
600,000
Attendances Admissions
Jan-Mar2009
Apr-Jun2009
Jul-Sep2009
Oct-Dec2009
Jan-Mar2010
Apr-Jun2010
Jul-Sep2010
Oct-Dec2010
Jan-Mar2011
Attendances 486,625 501,932 517,811 515,159 508,174 496,195 507,851 535,799 526,005
Admissions* 106,643 111,170 115,951 112,310 107,780 113,565 118,763 120,164 118,742
Emergency Admissions*
104,803 109,500 114,327 110,538 106,323 111,975 117,073 118,417 117,071
Emergency attendances
The Bureau’s previous Hospital Quarterly report
showed that at the end of 2010, the traditionally
busy Christmas holiday period in NSW public
hospital EDs was intense, with the number
of patients seen eclipsing the historic high set
during the 2009 swine flu pandemic.
ED attendance numbers decreased by almost
10,000 from the previous quarter to 526,005
attendances in January to March 2011.
Decreases in ED attendances typically occur
during January to March compared with the
intensity of the October to December peak
(Figure 5, Figure 6).
However, attendances for this quarter were
4% higher than the same quarter one year
ago (508,174) and 8% higher than the same
period two years ago (486,625). This indicates
that some of the increased activity seen in
NSW public hospital EDs at the end of 2010
has been sustained.
Arrivals by ambulance
The overall number of ambulance arrivals has
increased each January to March quarter but
has remained in proportion to the increase in
emergency department attendances and the
percentage arriving by ambulance is unchanged.
Nearly a quarter (24%) of all people who attended
Trends over time
HOSPITAL QUARTERLY: Emergency Departments January to March 2011 www.bhi.nsw.gov.au 9

Figure 6: Attendances at NSW emergency departments by week, January 2008 to March 2011
0
10,000
20,000
30,000
50,000
60,000
40,000
2008 2009 2010 2011
Jan Feb Mar Apr May Jun AugJul Sep Oct DecNov
Source: Health Information Exchange, NSW Health. Data extracted on 18 April 2011.
NSW EDs during January to March 2011 were
transported there by ambulance (Figure 3),
a total of 124,729 patients.
In the January to March 2010 quarter,
24% of patients (122,268) arrived by ambulance
and during the same period in 2009,
24% (118,247 patients) arrived this way.
During January to March 2011, NSW did not
achieve the state target for ambulance
off-stretcher time (also referred to as “transfer time”).
The target requires 90% of patients arriving at
hospital by ambulance to be transferred into
the care of ED staff within 30 minutes. During
the quarter the state-wide figure was 66%.
By comparison, 71% of patients met the transfer
time target during January to March 2010
and 75% of patients met the target during the
same quarter in 2009.
This off-stretcher ambulance target has not
been met at a state-wide level for the past
two years (Table 3).
Source: Data provided by NSW Ambulance Service on 15 April 2011.
Jan-Mar2009
Apr-Jun2009
Jul-Sep2009
Oct-Dec2009
Jan-Mar2010
Apr-Jun2010
Jul-Sep2010
Oct-Dec2010
Jan-Mar2011
75% 71% 68% 72% 71% 68% 64% 66% 66%
Target: 90% transferred within 30 min. Not meeting target
Table 3: Percentage of patients accepted into the care of NSW emergency departments from an ambulance within 30 minutes of arrival, January 2009 to March 2011
10 HOSPITAL QUARTERLY: Emergency Departments January to March 2011 www.bhi.nsw.gov.au

Emergency care targets
NSW met or exceeded national targets for
the percentage of patients seen within the
recommended time for all triage categories
(except triage 3) during the January to March
quarter (see page 4 for a full explanation
of these triage targets). During the quarter,
71% of triage 3 patients were seen in the
recommended 30 minutes compared with
the 75% target.
NSW has not met the triage 3 target at a state
level in the past two years (Figure 7). The triage 3
performance figures for January to March 2010
and 2009 were 73% and 69% respectively.
These targets for triage to start-of-treatment
times were first recommended by the
Australasian College for Emergency Medicine in
1993. They were adopted for use nationally in
1999 and are now used in all public hospital EDs
throughout Australia.
Figure 7: Arrival to treatment targets in NSW emergency departments, January 2009 to March 2011
(*) Emergency department electronic records show these periods as having below 100% triage 1 performance (i.e. started to receive treatment within two minutes of being triaged). An investigation by the NSW Department of Health concluded that these electronic patient records contained data entry errors and all patients received treatment within two minutes of being triaged. The Bureau has reported the performance using electronic data available in the NSW Health Information Exchange on 18 April 2011.
Note: Percentages might differ slightly from those in previous Hospital Quarterly reports and in the NSW Department of Health’s Quarterly Hospital Performance Report due to differences in when data were extracted from emergency department information systems and because of changes in the calculation of these measures.
Source: Health Information Exchange, NSW Health. Data extracted on 18 April 2011.
Target Meeting target Not meeting target
Triage 1100% in 2 min.
Triage 280% in 10 min.
Triage 375% in 30 min.
Triage 470% in 60 min.
Triage 570% in 120 min.
2009 20102009 2010 2009 20102009 20102009 2010 20112011 2011201120110%
20%
40%
60%
80%
100%
Jan-Mar2009
Apr-Jun2009
Jul-Sep2009
Oct-Dec2009
Jan-Mar2010
Apr-Jun2010
Jul-Sep2010
Oct-Dec2010
Jan-Mar2011
Triage 1 97%* 100% 99%* 100% 100% 100% 100% 100% 100%
Triage 2 81% 79% 79% 84% 84% 84% 82% 83% 84%
Triage 3 69% 68% 66% 73% 73% 74% 69% 71% 71%
Triage 4 74% 72% 70% 75% 75% 76% 72% 73% 73%
Triage 5 90% 89% 87% 90% 89% 89% 87% 87% 88%
Meeting target Not meeting target
HOSPITAL QUARTERLY: Emergency Departments January to March 2011 www.bhi.nsw.gov.au 11

Information systems in emergency departments
The Bureau examined the quality of electronic information for hospitals transitioning to a new
electronic information system for patients in their ED. We concluded that, other than attendance
numbers, information from hospitals transitioning to new electronic information systems are not
reliable enough to report in the quarter of transition. Caution is advised when considering results
for the subsequent quarter.
From January to March 2011, no hospitals changed to a new electronic information system
for patients in their ED.
From September to December 2010, Dubbo Base Hospital, Griffith Base Hospital and Wagga
Wagga Base Hospital transitioned to the new electronic information system. Caution is advised
when considering results from these hospitals.
NSW did not achieve the emergency admission
performance (EAP) target during the January
to March 2011 quarter nor in any quarter
during the previous two years. This target
recommends that 80% of patients admitted from
the emergency department should leave the ED
for a hospital ward, intensive care unit or
operating theatre within eight hours from the time
the patient was first triaged.
During the quarter, EAP was 64%. This level of
performance is similar to the previous quarter (65%),
down from one year ago (68%) and from
two years ago (70%), as shown in Table 4.
Note: Percentages might differ slightly from those in previous Hospital Quarterly reports and in the NSW Department of Health’s Quarterly Hospital Performance Report due to differences in when data were extracted from the emergency department information systems and because of changes in the calculation of the measure.
Source: Health Information Exchange, NSW Health. Data extracted on 18 April 2011.
Table 4: Emergency admission performance (EAP) in NSW emergency departments, January 2009 to March 2011
Jan-Mar2009
Apr-Jun2009
Jul-Sep2009
Oct-Dec2009
Jan-Mar2010
Apr-Jun2010
Jul-Sep2010
Oct-Dec2010
Jan-Mar2011
70% 68% 65% 70% 68% 67% 61% 65% 64%
Target: 80% transferred within 8 hours Not meeting target
12 HOSPITAL QUARTERLY: Emergency Departments January to March 2011 www.bhi.nsw.gov.au

Appendix 1: Activity and select performance measures for NSW emergency departments, January to March 2011
Activity Performance
Atten-dances
Admis-sions
Triage 1 Triage 2 Triage 3 Triage 4 Triage 5Off
stretcher90%
in 30 min.
EAP80%
in 8 hours100%
in 2 min.80%
in 10 min.75%
in 30 min.70%
in 60 min.70%
in 120 min.
New South WalesTotal New South Wales 526,005 118,742 100% 84% 71% 73% 88% 66% 64%
Central Coast Local Health Network (CCLHN)Gosford Hospital 13,867 3,957 100% 67% 60% 54% 79% 64% 57%
Wyong Hospital 13,744 2,260 100% 72% 74% 75% 84% 73% 57%
Total CCLHN 27,611 6,217 100% 70% 66% 63% 83% 68% 57%
Far West Local Health Network (FWLHN)Broken Hill Base Hospital 6,381 470 * 96% 82% 82% 96% 93% 79%
Total FWLHN 6,381 470 * 96% 82% 82% 96% 93% 79%
Hunter New England Local Health Network (HNELHN)Armidale and New England Hospital 3,985 691 * 85% 81% 87% 97% 93% 97%
Belmont Hospital 6,066 851 100% 88% 81% 77% 91% 75% 80%
Calvary Mater Newcastle 7,972 2,376 100% 90% 81% 77% 87% 61% 69%
Cessnock District Hospital 4,434 379 100% 89% 80% 84% 97% 92% 78%
Gunnedah District Hospital 2,476 199 * 64% 69% 70% 89% 98% 99%
Inverell District Hospital 2,392 338 * 78% 54% 66% 93% 92% 98%
John Hunter Hospital 16,377 5,237 100% 87% 79% 72% 84% 58% 72%
Kurri Kurri District Hospital 2,021 80 n/a§ 89% 93% 87% 99% 92% 100%
Maitland Hospital 10,480 1,866 100% 76% 65% 65% 85% 54% 79%
Manning Base Hospital 5,985 1,289 100% 72% 54% 58% 82% 69% 63%
Moree District Hospital 2,411 260 * 88% 79% 88% 98% 96% 97%
Muswellbrook District Hospital 2,018 221 * 81% 69% 76% 96% 85% 95%
Narrabri District Hospital 1,262 191 n/a§ 100% 92% 96% 99% 97% 99%
Singleton District Hospital 3,097 294 * 81% 74% 80% 96% 97% 98%
Tamworth Base Hospital 10,497 1,759 100% 79% 70% 62% 78% 83% 69%
Other HNELHN 13,041 1,300 100% 72% 82% 90% 98% 92% 94%
Total HNELHN 94,514 17,331 100% 82% 75% 75% 89% 71% 77%
Illawarra Shoalhaven Local Health Network (ISLHN)Bulli District Hospital 2,036 0 n/a§ 100% 97% 97% 98% 100% n/aΩ
Milton and Ulladulla Hospital 4,039 314 100% 98% 91% 87% 93% 81% 89%
Shellharbour Hospital 6,970 756 100% 90% 73% 69% 93% 69% 61%
Shoalhaven and District Memorial Hospital
8,864 1,319 100% 96% 78% 71% 88% 74% 70%
Wollongong Hospital 13,781 4,598 100% 91% 68% 66% 81% 57% 59%
Total ISLHN 35,690 6,987 100% 93% 74% 72% 90% 64% 63%
Mid North Coast Local Health Network (MNCLHN)Coffs Harbour Base Hospital 8,317 2,012 100% 65% 59% 64% 82% 70% 42%
Kempsey Hospital 5,350 585 100% 74% 68% 77% 95% 85% 85%
Port Macquarie Base Hospital 7,978 1,842 95%‡ 74% 63% 71% 92% 58% 53%
Total MNCLHN 21,645 4,439 98% 71% 63% 70% 86% 67% 56%
Meeting target
Not meeting target
HOSPITAL QUARTERLY: Emergency Departments January to March 2011 www.bhi.nsw.gov.au 13

Activity Performance
Atten-dances
Admis-sions
Triage 1 Triage 2 Triage 3 Triage 4 Triage 5Off
stretcher90%
in 30 min.
EAP80%
in 8 hours100%
in 2 min.80%
in 10 min.75%
in 30 min.70%
in 60 min.70%
in 120 min.
Murrumbidgee Local Health Network (MLHN)Griffith Base Hospital† 5,040 673 100% 83% 78% 77% 89% 90% 96%
Wagga Wagga Base Hospital† 8,202 2,032 100% 80% 74% 70% 86% 64% 60%
Total MLHN 13,242 2,705 100% 81% 76% 73% 87% 70% 66%
Nepean Blue Mountains Local Health Network (NBMLHN)Blue Mountains District Anzac Memorial Hospital
4,354 452 100% 83% 72% 74% 94% 92% 95%
Hawkesbury District Health Service 5,136 1,168 100% 89% 91% 91% 97% 47% 83%
Lithgow Health Service 3,550 287 100% 81% 77% 86% 97% 90% 91%
Nepean Hospital 13,279 4,481 100% 77% 44% 59% 84% 50% 51%
Total NBMLHN 26,319 6,388 100% 79% 67% 72% 90% 58% 61%
Northern NSW Local Health Network (NNSWLHN)Grafton Base Hospital 5,815 936 100% 68% 49% 56% 81% 84% 75%
Lismore Base Hospital 7,310 2,103 100% 83% 61% 61% 87% 68% 44%
Murwillumbah District Hospital 3,842 425 * 96% 82% 84% 96% 90% 94%
The Tweed Hospital 10,465 3,239 100% 73% 62% 69% 90% 69% 55%
Total NNSWLHN 27,432 6,703 100% 77% 61% 68% 89% 72% 56%
Northern Sydney Local Health Network (NSLHN)Hornsby and Ku-Ring-Gai Hospital 7,804 1,774 100% 98% 86% 82% 92% 79% 75%
Manly District Hospital 5,767 1,422 100% 95% 93% 85% 90% 93% 76%
Mona Vale and District Hospital 6,912 1,578 100% 97% 86% 85% 94% 95% 72%
Royal North Shore Hospital 14,953 5,477 100% 91% 77% 83% 94% 67% 68%
Ryde Hospital 6,147 1,494 100% 97% 87% 79% 87% 93% 74%
Total NSLHN 41,583 11,745 100% 94% 84% 83% 93% 81% 72%
Sydney Children’s Hospitals Network (SCHN)Sydney Children's Hospital 8,904 1,309 100% 84% 79% 74% 94% 94% 76%
The Children's Hospital at Westmead
11,411 2,779 100% 100% 68% 68% 79% 90% 67%
Total SCHN 20,315 4,088 100% 92% 72% 72% 81% 91% 71%
South Eastern Sydney Local Health Network (SESLHN)Prince of Wales Hospital 11,703 3,491 100% 68% 50% 65% 78% 50% 62%
St George Hospital 16,441 5,181 100% 85% 69% 72% 88% 61% 66%
Sutherland Hospital 11,399 2,661 100% 89% 77% 85% 96% 66% 64%
Sydney Eye Hospital 4,705 163 n/a§ * 96% 99% 100% 80% 99%
Sydney Hospital 5,054 373 * 92% 86% 83% 91% 88% 93%
Total SESLHN 49,302 11,869 100% 83% 66% 77% 93% 62% 66%
South Western Sydney Local Health Network (SWSLHN)Bankstown / Lidcombe Hospital 11,318 3,238 100% 90% 78% 86% 96% 74% 68%
Bowral and District Hospital 4,477 713 100% 80% 73% 79% 95% 82% 78%
Camden Hospital 3,079 0 * 93% 88% 88% 97% 91% n/aΩ
Campbelltown Hospital 13,711 3,550 100% 89% 76% 75% 95% 71% 65%
Meeting target
Not meeting target
14 HOSPITAL QUARTERLY: Emergency Departments January to March 2011 www.bhi.nsw.gov.au

(*) Values suppressed due to small numbers and to protect privacy. (†) Due to the implementation of a new electronic information system in this emergency department in the previous quarter
(October to December 2010), caution is advised when considering this hospital’s results (see page 12 for more information).(§) This hospital had no patients classified as triage 1 during January to March 2011.(‡) Data in the HIE at the time of extraction for this report, and therefore reported here, recorded that this hospital had below
100% triage 1 performance. The NSW Department of Health has advised that these records contained data entry errors and all patients received treatment within two minutes of being triaged.
(Ω) This hospital had no patients admitted to hospital from the emergency department during January to March 2011 and therefore there is no EAP value.
Note: Emergency department activity includes 87 facilities for which electronic data are reported. These facilities account for approximately 85% of NSW emergency department activity.
Note: Admissions refers to all admissions through the emergency department, not just emergency patient admissions. Source: Health Information Exchange, NSW Health. Data extracted on 18 April 2011. Ambulance off-stretcher time data
provided by the NSW Ambulance Service on 15 April 2011.
Activity Performance
Atten-dances
Admis-sions
Triage 1 Triage 2 Triage 3 Triage 4 Triage 5Off
stretcher90%
in 30 min.
EAP80%
in 8 hours100%
in 2 min.80%
in 10 min.75%
in 30 min.70%
in 60 min.70%
in 120 min.
Fairfield Hospital 8,074 1,537 100% 78% 74% 69% 89% 76% 67%
Liverpool Hospital 15,667 5,793 100% 86% 75% 70% 87% 50% 53%
Total SWSLHN 56,326 14,831 100% 87% 76% 77% 94% 66% 62%
Southern NSW Local Health Network (SNSWLHN)Goulburn Base Hospital 4,646 846 100% 56% 67% 77% 93% 80% 86%
Total SNSWLHN 4,646 846 100% 56% 67% 77% 93% 80% 86%
St Vincent’s Health Network (SVHN)St Vincent's Hospital, Darlinghurst 11,013 3,072 100% 100% 71% 74% 89% 51% 57%
Total SVHN 11,013 3,072 100% 100% 71% 74% 89% 51% 57%
Sydney Local Health Network (SYDLHN)Canterbury Hospital 8,756 1,585 100% 86% 70% 69% 91% 72% 61%
Concord Hospital 8,756 2,295 100% 94% 75% 72% 90% 74% 71%
Royal Prince Alfred Hospital 16,450 4,781 100% 83% 59% 62% 85% 56% 58%
Total SYDLHN 33,962 8,661 100% 86% 65% 67% 86% 64% 63%
Western NSW Local Health Network (WNSWLHN)Bathurst Base Hospital 5,906 882 100% 75% 68% 71% 90% 71% 67%
Dubbo Base Hospital† 6,920 1,603 100% 80% 66% 73% 91% 77% 59%
Orange Base Hospital 6,831 1,479 100% 77% 68% 71% 86% 77% 59%
Total WNSWLHN 19,657 3,964 100% 77% 67% 72% 88% 76% 60%
Western Sydney Local Health Network (WSLHN)Auburn Hospital 5,986 904 100% 69% 68% 54% 77% 57% 80%
Blacktown Hospital 8,699 2,154 100% 86% 65% 70% 85% 44% 38%
Mount Druitt Hospital 7,774 720 100% 85% 78% 72% 86% 61% 69%
Westmead Hospital (all units) 13,908 4,648 100% 89% 57% 58% 72% 45% 52%
Total WSLHN 36,367 8,426 100% 86% 66% 64% 81% 49% 56%
Meeting target
Not meeting target
HOSPITAL QUARTERLY: Emergency Departments January to March 2011 www.bhi.nsw.gov.au 15

Download our reports About the Bureau
The report, Hospital Quarterly: Performance
of NSW public hospitals, January to March 2011
and related reports are available at
www.bhi.nsw.gov.au
The suite of products includes:
• Three core modules on
Admitted Patients, Elective Surgery
and Emergency Departments
• Performance Profiles: Elective surgery
(performance and activity reports for more
than 80 hospitals and NSW as a whole)
• Performance Profiles: Emergency
department care (performance and
activity reports for EDs in more than
60 hospitals and NSW as a whole)
• Data Quality Assessments
• Technical Supplements
The Bureau of Health Information provides
the community, healthcare professionals and
the NSW Parliament with timely, accurate and
comparable information on the performance
of the NSW public health system in ways that
enhance the system’s accountability and inform
efforts to increase its beneficial impact on the
health and wellbeing of the people of NSW.
The Bureau is an independent, board-governed
statutory health corporation. The conclusions in
this report are those of the Bureau and no official
endorsement by the NSW Minister for Health,
the NSW Department of Health or any other
NSW statutory health corporation is intended
or should be inferred.
Copyright Bureau of Health Information 2011
State Health Publication Number: (BHI) 110115ISSN 1838-3238
Suggested citation: Bureau of Health Information. Hospital Quarterly: Performance of NSW public hospitals,
January to March 2011. Emergency Departments. 2(1). Sydney (NSW); 2011.
Published June 2011
Please note that there is the potential for minor revisions of data in this report. Please check the online version
at www.bhi.nsw.gov.au for any amendments.
To contact the Bureau
Telephone: +61 2 8644 2100
Fax: +61 2 8644 2119
Email: [email protected]
Postal address:
PO Box 1770
Chatswood
New South Wales 2057
Australia
Web: www.bhi.nsw.gov.au
16 HOSPITAL QUARTERLY: Emergency Departments January to March 2011 www.bhi.nsw.gov.au