emergence, control, and remergence of triatoma infestans...
TRANSCRIPT
Emergence, Control, and Reemergence ofTriatoma infestans and Trypanosoma cruzi Across
the Urban-Rural Interface in Arequipa, Peru
Item Type text; Electronic Dissertation
Authors Delgado, Stephen
Publisher The University of Arizona.
Rights Copyright © is held by the author. Digital access to this materialis made possible by the University Libraries, University of Arizona.Further transmission, reproduction or presentation (such aspublic display or performance) of protected items is prohibitedexcept with permission of the author.
Download date 14/05/2018 21:47:28
Link to Item http://hdl.handle.net/10150/312767

1
EMERGENCE, CONTROL, AND REMERGENCE OF TRIATOMA INFESTANS
AND TRYPANOSOMA CRUZI ACROSS THE URBAN-RURAL INTERFACE
IN AREQUIPA, PERU
by
Stephen Delgado
____________________________
A Dissertation Submitted to the Faculty of the
SCHOOL OF GEOGRAPHY AND DEVELOPMENT
In Partial Fulfillment of the Requirements
For the Degree of
DOCTOR OF PHILOSOPHY
MAJOR IN GEOGRAPHY
In the Graduate College
THE UNIVERSITY OF ARIZONA
2013

2
THE UNIVERSITY OF ARIZONA
GRADUATE COLLEGE
As members of the Dissertation Committee, we certify that we have read the
dissertation prepared by Stephen Delgado, titled Emergence, Control, and Reemergence
of Triatoma infestans and Trypanosoma cruzi Across the Urban-Rural Interface in
Arequipa, Peru, and recommend that it be accepted as fulfilling the dissertation
requirement for the Degree of Doctor of Philosophy.
___________________________________________________________ Date: (04/26/2013)
Andrew C. Comrie
___________________________________________________________ Date: (04/26/2013)
Gary Christopherson
___________________________________________________________ Date: (04/26/2013)
Stephen R. Yool
___________________________________________________________ Date: (04/26/2013)
Kacey C. Ernst
___________________________________________________________ Date: (04/26/2013)
Charles R. Sterling
Final approval and acceptance of this dissertation is contingent upon the candidate’s
submission of the final copies of the dissertation to the Graduate College.
I hereby certify that I have read this dissertation prepared under my direction and
recommend that it be accepted as fulfilling the dissertation requirement.
___________________________________________________________ Date: (04/26/2013)
Dissertation Director: Andrew C. Comrie

3
STATEMENT BY AUTHOR
This dissertation has been submitted in partial fulfillment of the requirements for an
advanced degree at the University of Arizona and is deposited in the University Library
to be made available to borrowers under rules of the Library.
Brief quotations from this dissertation are allowable without special permission,
provided that an accurate acknowledgement of the source is made. Requests for
permission for extended quotation from or reproduction of this manuscript in whole or
in part may be granted by the head of the major department or the Dean of the
Graduate College when in his or her judgment the proposed use of the material is in the
interests of scholarship. In all other instances, however, permission must be obtained
from the author.
SIGNED: Stephen Delgado

4
ACKNOWLEDGEMENTS
I am immensely indebted to numerous individuals and institutions, whose help made
this work possible. To Dr. Andrew Comrie, my principal advisor, and all of my
committee members, Drs. Stephen Yool, Gary Christopherson, Kacey Ernst, and Charles
Sterling, thank you for sharing your knowledge, wisdom, and patience. Thank you to
The University of Arizona Biomedical Research Abroad: Vistas Open! (BRAVO!)
Program for funding this work. To Dr. Michael Levy, Dr. Robert Gilman, and Dr. Cesar
Náquira, thank you for welcoming me into your research project, your universities, and
your homes. Thank you to the Gerencia Regional de Salud de Arequipa, especially Dr.
Juan Geny Cornejo del Carpio and Fernando Málaga for sharing your data, knowledge,
and time. Finally, to my many colleagues and friends in Peru, I am eternally and
immeasurably grateful for your kindness, humor, and hard work.
5
TABLE OF CONTENTS
LIST OF FIGURES……………………………………………………………………………….6
ABSTRACT…………………………………………………………………………………....…7
CHAPTER 1: INTRODUCTION……………………………………………………………….9
1.1 Explanation of the Problem and Its Context……...………………………………………9
1.2 Selected Review of the Literature…………………………...……………...…………….10
1.3 Explanation of the Dissertation Format…………………………………………………13
CHAPTER 2: PRESENT STUDY…………………………………………………...…………16
2.1 A History of Chagas Disease Transmission, Control, and Re-Emergence in Peri-Rural La
Joya, Peru………………………………………………………………………………….…16
2.2 A Country Bug Moves to the City: Urban Infestation by the Chagas Disease Vector
Triatoma infestans in Arequipa, Peru……………………………………………………….17
2.3 Passive Surveillance of Triatoma infestans Reemergence in Urban and Peri-Urban
Arequipa, Peru……………………………………………………………………………….18
2.4 Conclusions………………………………………………………………………………19
REFERENCES………………………………………………………………………………..…20
APPENDIX A: A HISTORY OF CHAGAS DISEASE TRANSMISSION, CONTROL,
AND RE-EMERGENCE IN PERI-RURAL LA JOYA, PERU………………………………23
APPENDIX B: A COUNTRY BUG MOVES TO THE CITY: URBAN INFESTATION BY
THE CHAGAS DISEASE VECTOR TRIATOMA INFESTANS IN AREQUIPA, PERU..35
APPENDIX C: PASSIVE SURVEILLANCE OF TRIATOMA INFESTANS
REEMERGENCE IN URBAN AND PERI-URBAN AREQUIPA, PERU…………………77

6
LIST OF FIGURES
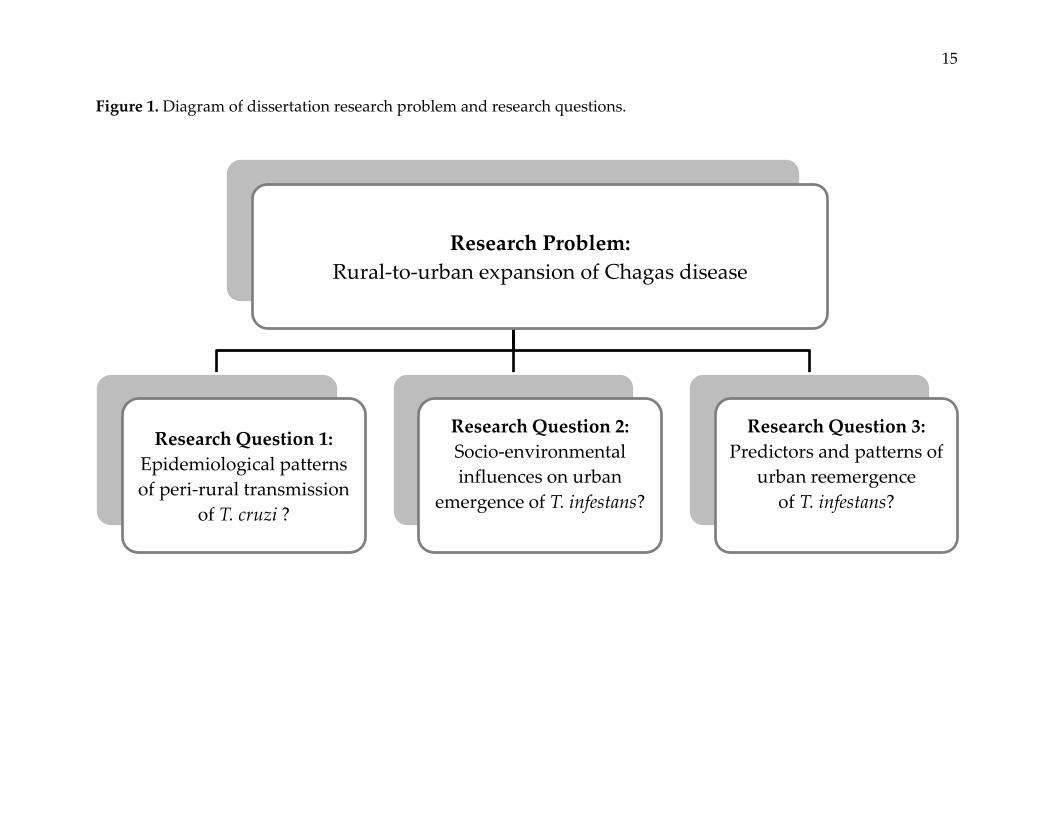
Figure 1: Diagram of dissertation research problem and research questions……………15

7
ABSTRACT
In recent decades, transmission of Trypanosoma cruzi, the causative agent of Chagas
disease, by Triatoma infestans and other vector insects has expanded from historically
rural areas to urban centers across Latin America. The urbanization of the T. cruzi
transmission cycle necessitates new understanding of Chagas disease ecology and
epidemiology, as well as new approaches to the surveillance, control, and prevention of
vector infestation and parasite transmission.
In rural La Joya, Peru, analyses highlight how the complexities of human migration
and intermittent intervention influence the prevalence and incidence of Chagas disease.
Substantial prevalence of T. cruzi infection was found in the adult population as a result
of relatively higher incidence of infection among long-term inhabitants and relatively
lower incidence of infection among short-term in-migrants. While an insecticide
intervention in 1995 effectively eliminated incidence of infection among children, T.
infestans and T. cruzi were rapidly reemerging in the absence of continuing vector
control.
In Arequipa, Peru, T. infestans had extensively and intensively infested an urban and
peri-urban landscape prior to vector control. Environmental and social factors, which
may directly or indirectly influence insect biology and behavior, were associated with
infestation. Large clusters of infestation and spatial dependence among infested
households at short and long distances suggest that T. infestans can disperse by walking
8
or flying in an urban environment, which may challenge ongoing vector surveillance
and control.
Reemergence of vector insects, including T. infestans, complicates continuing control
of Chagas disease. While relatively rare, reemergence of T. infestans is a present and
possibly persistent problem in urban and peri-urban Arequipa. The probability of a
reemergence event varied spatially. Events were both clustered and non-clustered, and
were spatially dependent at distances up to 1,600 meters. Event-to-event spatial
proximity occurred at shorter distances in higher risk areas and longer distances in
lower risk areas. Identifiable predictors and patterns of risk offer opportunities for more
effective and efficient strategies for vector surveillance and control.
9
CHAPTER 1: INTRODUCTION
1.1 Explanation of the Problem and Its Context
Chagas disease, also known as American trypanosomiasis, is caused by the
protozoan parasite Trypanosoma cruzi and is endemic in Latin America. Typically, T.
cruzi is transmitted to humans via the infected excretions of various blood-feeding
triatomine insect species, including Triatoma infestans. Chagas disease is characterized
by an acute phase, which lasts 6 – 8 weeks, and a chronic phase, which persists for life.
In most cases, both the acute and chronic phases of infection are asymptomatic.
However, 10 – 40% of cases, depending on the geographic region, progress over a
period of years to chronic disease, including potentially fatal cardiac and
gastrointestinal disorders [WHO, 2002]. Globally, eight million persons are infected
with T. cruzi, resulting in 11,000 deaths and the loss of 430,000 disability-adjusted life
years (DALYs) annually [WHO, 2008; WHO, 2010].
Currently, Chagas disease diagnostic and therapeutic options are limited in both
availability and efficacy [Tarleton, 2007; Reithinger, 2009]. Vector control via large-scale
insecticide application initiatives is the primary intervention for prevention and control
of Chagas disease [WHO, 2012]. Triatoma infestans, which lives nearly exclusively in and
around human households, is a principal target for vector control [WHO, 2002]. While
the Southern Cone Initiative has succeeded in interrupting T. cruzi transmission by T.
infestans in Brazil, Chile, and Uruguay [Pinto Dias, 2007; WHO, 2007], T. infestans-

10
mediated T. cruzi transmission persists in parts of Argentina, Bolivia, Paraguay, and
Peru [Tarleton, 2007; Moncayo, 2009]. Moreover, the natural history of T. cruzi
transmission by T. infestans is evolving and has important implications for the
prevention and control of Chagas disease.
Vector-borne transmission of T. cruzi to humans has been ongoing for millennia and
has been principally a rural problem [Aufderheide, 2004]. Over recent decades,
however, rural-to-urban migration has been altering the ecology, epidemiology, and
geography of Chagas disease. Human migration has been accompanied by the
incidental introduction of vector insects and the T. cruzi parasite into urban and peri-
urban areas in Latin America, including Arequipa, Peru [Mott, 1990; Levy, 2006]. The
transposition of the T. cruzi transmission cycle from sparsely populated rural areas to
densely populated urban areas complicates prevention and control, and challenges our
understanding of the ecology and epidemiology of Chagas disease.
1.2 Selected Review of the Literature
Conceptually and methodologically, this work lies within the sub-discipline of
medical geography, a field of study concerned with understanding disease and
improving health. In the geographic tradition, medical geography integrates concepts
and methods from the biological, environmental, and social sciences, with particular
interest in human-environmental interactions [Meade, 2010].

11
In the United States, Jacques M. May elaborated the concepts of medical geography
in seminal works in the 1950s [May, 1950; May 1958]. May observed that disease and
health are multifactorial phenomena, which depend on the coincidence of various
factors in both space and time. Further, May affirmed that medical geography is the
study of the interrelationships among “pathological factors” and “geographical
factors.” Pathological factors include causative agents (e.g., T. cruzi), vectors (e.g., T.
infestans), intermediate hosts, reservoirs (e.g., non-human mammals), and humans.
Geographical factors include physical (e.g., climate), social (e.g., population density,
poverty, migration), and biological elements [May, 1950].
In the intervening decades since May’s seminal work, medical geography has grown
conceptually as well as methodologically. Conceptually, the field has expanded in scope
to include concerns such as social justice, health philosophy, and social theory—all of
which implicitly involve the important geographic concept of place (e.g., urban, peri-
urban, and rural places) [Kearns, 1993]. Methodologically, as well as conceptually,
medical geography has benefitted from the birth and growth of geographic information
systems (GIS) and related technologies, the rebirth of landscape epidemiology, and the
evolution of spatial analysis, among many other developments [Meade, 2010].
In recent decades, the evolution of GIS and related technologies such as global
positioning systems (GPS) and remote sensing (RS) has enabled geographers,
epidemiologists, and other public health scientists to evaluate spatial and temporal
12
perspectives on public health problems in unprecedented ways [Clarke, 1996; Cromley,
2003; Sui, 2007]. In the case of vector-borne disease, data collection and risk assessment
have been facilitated and advanced by GIS, GPS, and RS technologies [Bergquist, 2001].
New cost-free technologies such as Google Earth™ offer solutions for improved
prevention and control of vector-borne and other diseases in resource constrained
contexts [Lozano-Fuentes, 2008].
Landscape epidemiology, which was described by the Russian parasitologist
Pavlovsky in the 1930s, has experienced a renaissance among geographers and
epidemiologists [Meade, 1977]. Three basic ideas comprise landscape epidemiology: (1)
the distribution of disease tends to be geographically distinct; (2) geographic variation
in disease is determined by biotic and abiotic factors that influence pathogens, vectors,
and reservoirs; and (3) if biotic and abiotic determinants of disease can be mapped, then
current and future risk can be predicted [Ostfeld, 2005]. Landscape epidemiology is a
useful conceptual framework for vector-borne disease research, surveillance,
prevention, and control. Importantly, GIS, GPS, and remote sensing have become
enabling technologies for landscape epidemiology and spatial analysis [Kitron, 1998].
Spatial analysis in medical geography has a long history, exemplified by Dr. John
Snow’s famous study of London’s cholera epidemic in 1854 [Snow, 1855]. Today, spatial
analysis encompasses an extensive array of methods and data types. In the case of
point-level data (e.g., household locations), an evaluation of first-order effects (i.e.,
13
degree of spatial intensity) and second-order effects (i.e., degree of spatial
independence) provides distinct but complementary insights into the patterns and
processes of health outcomes [Waller, 2004]. Spatial analytical methods that explicitly
consider spatial variation in a population (e.g., K-function difference, kernel density
estimate ratio) are required for valid inference when evaluating first- and second-order
effects, and simulation methods may be used to evaluate statistical significance of
results [Gatrell, 1996]. Additionally, place-based effects may be incorporated into
evaluation of point-level data using techniques such as multilevel modeling
[Auchincloss, 2012].
1.3 Explanation of the Dissertation Format
This dissertation offers new knowledge pertaining to the problem of rural-to-urban
expansion of Chagas disease. Three papers present important and interrelated insights
into this problem (Figure 1).
The first study comprises a cross-sectional serological and entomological evaluation
of the temporal and spatial patterns of T. cruzi transmission in rural localities in La Joya,
Peru, near the city of Arequipa. Multivariate catalytic models and Bayesian methods
were utilized to elucidate a complex history of T. cruzi transmission, interruption, and
re-initiation. This paper was published in the journal PLoS Neglected Tropical Diseases.

14
The second study involves a retrospective analysis of data from a large-scale, multi-
year insecticide intervention initiative for the elimination of infestation by T. infestans in
Arequipa, Peru. Multi-level logistic regression was used to elucidate the effects of
environmental and social factors on the spatial distribution of T. infestans infestation
across an expansive urban environment. This paper was prepared to submit to the
International Journal of Health Geographics.
The third study evaluates incidence of T. infestans reemergence subsequent to
insecticide intervention in Arequipa, Peru. Multivariate logistic regression, receiver
operating characteristic (ROC) analysis, and spatial statistics were employed to
elucidate patterns and predictors of T. infestans reemergence in an urban environment.
This paper was prepared to submit to the American Journal of Tropical Medicine and
Hygiene.
The studies comprising this dissertation are part of a National Institutes of Health
(NIH) funded study of Chagas disease in Peru. While data collection involved multiple
collaborators from Johns Hopkins University, the University of Pennsylvania, the
Universidad Peruana Cayetano Heredia, and the Gerencia Regional de Salud de
Arequipa (GRSA), among others, I was principally responsible for formulating research
questions, conducting data analysis, and writing manuscripts. This dissertation
represents my original and individual efforts, and I am lead author on the publications
arising from this work.
15
Figure 1. Diagram of dissertation research problem and research questions.
Research Problem:
Rural-to-urban expansion of Chagas disease
Research Question 1:
Epidemiological patterns
of peri-rural transmission
of T. cruzi ?
Research Question 2:
Socio-environmental
influences on urban
emergence of T. infestans?
Research Question 3:
Predictors and patterns of
urban reemergence
of T. infestans?
16
CHAPTER 2: PRESENT STUDY
The methods, results, and conclusions of the present study are detailed in three
manuscripts appended to this dissertation. A brief summary of key features and
findings follows.
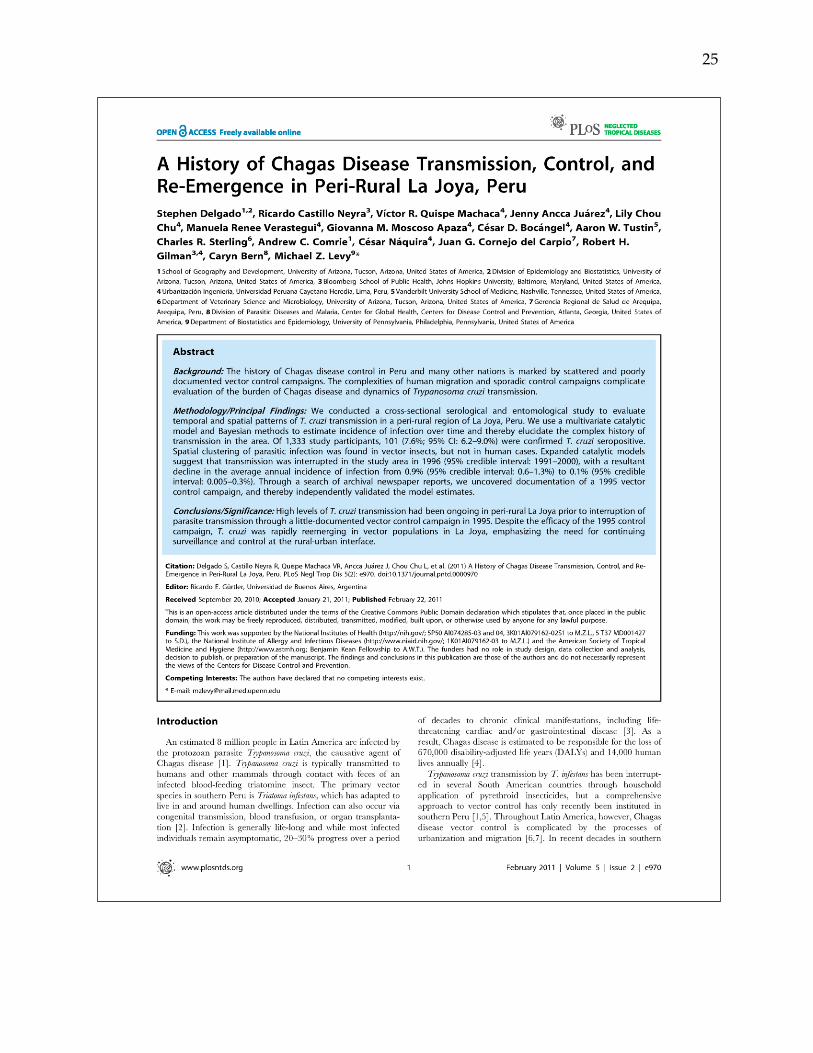
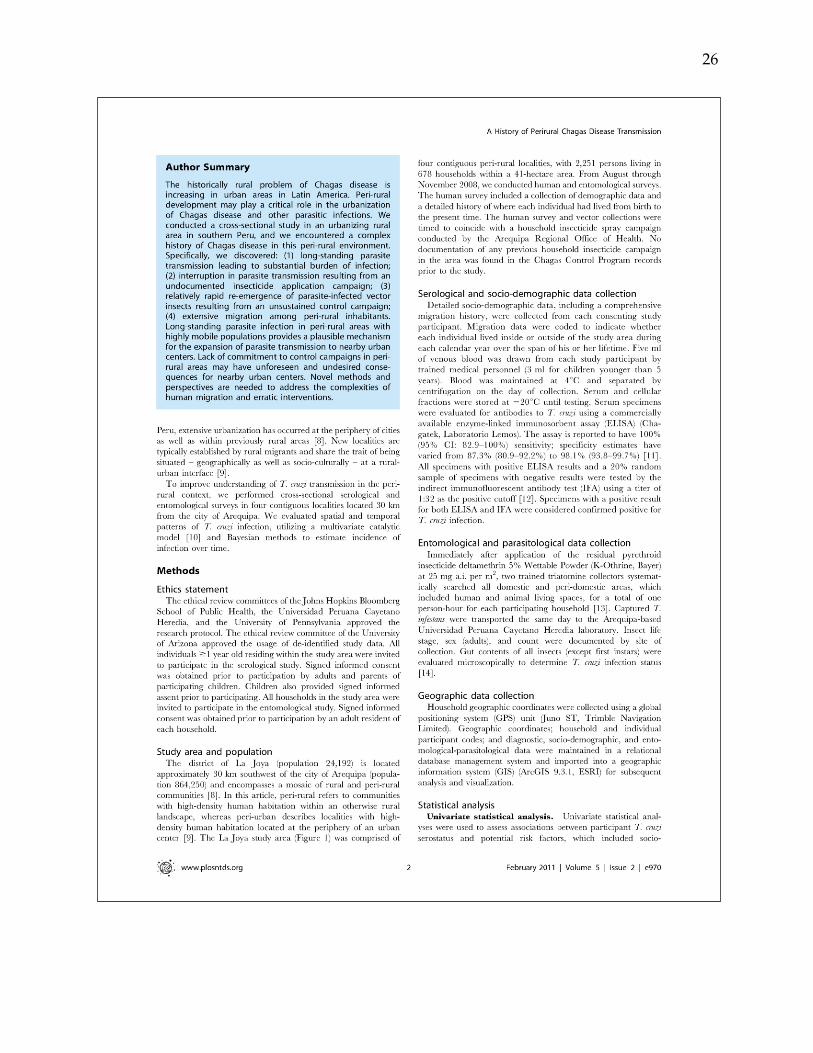
2.1 A History of Chagas Disease Transmission, Control, and Re-Emergence in Peri-Rural La
Joya, Peru
A cross-sectional serological and entomological study was conducted to evaluate
temporal and spatial patterns of T. cruzi transmission in a peri-rural region of La Joya,
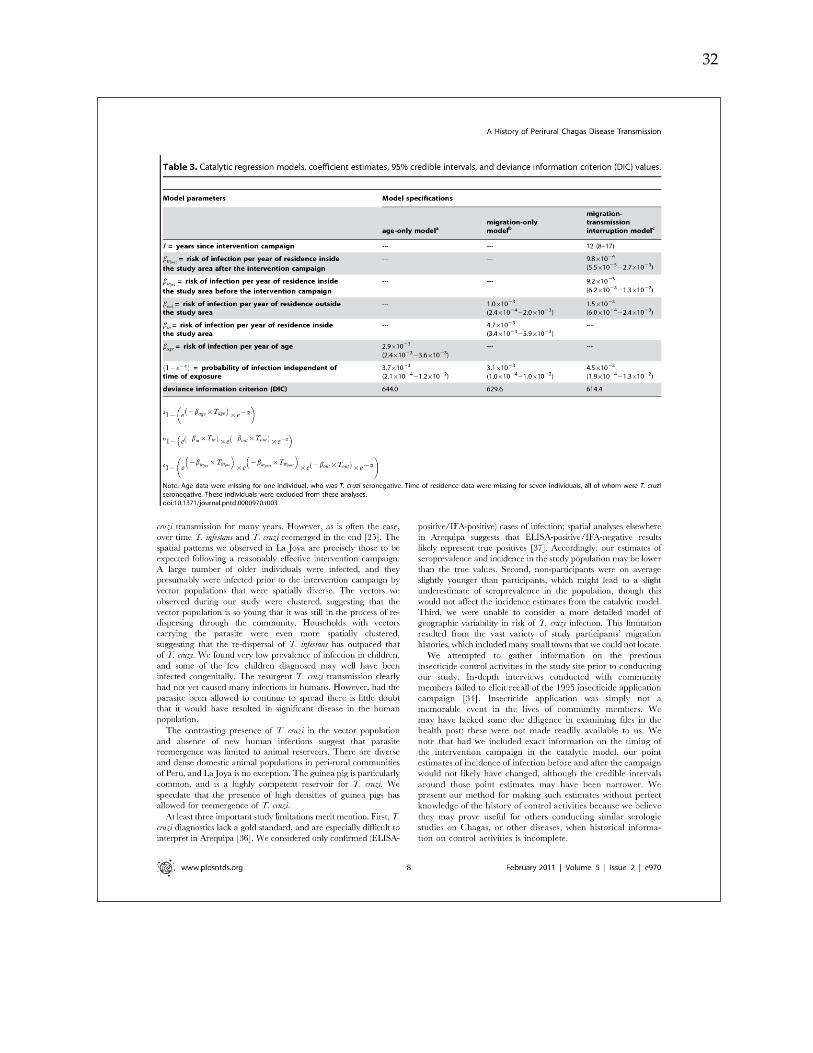
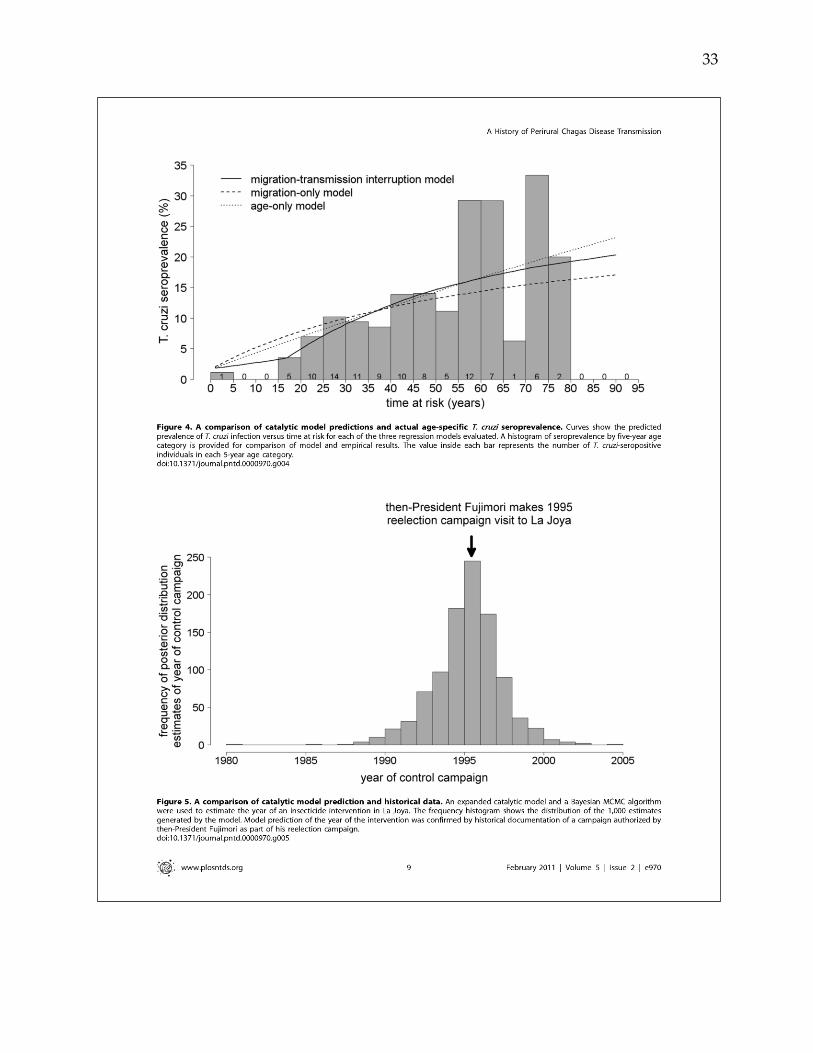
Peru. Multivariate catalytic model and Bayesian methods were used to estimate
incidence of infection over time and thereby elucidate the complex history of
transmission in the area. Of 1,333 study participants, 101 (7.6%; 95% CI: 6.2-9.0%) were
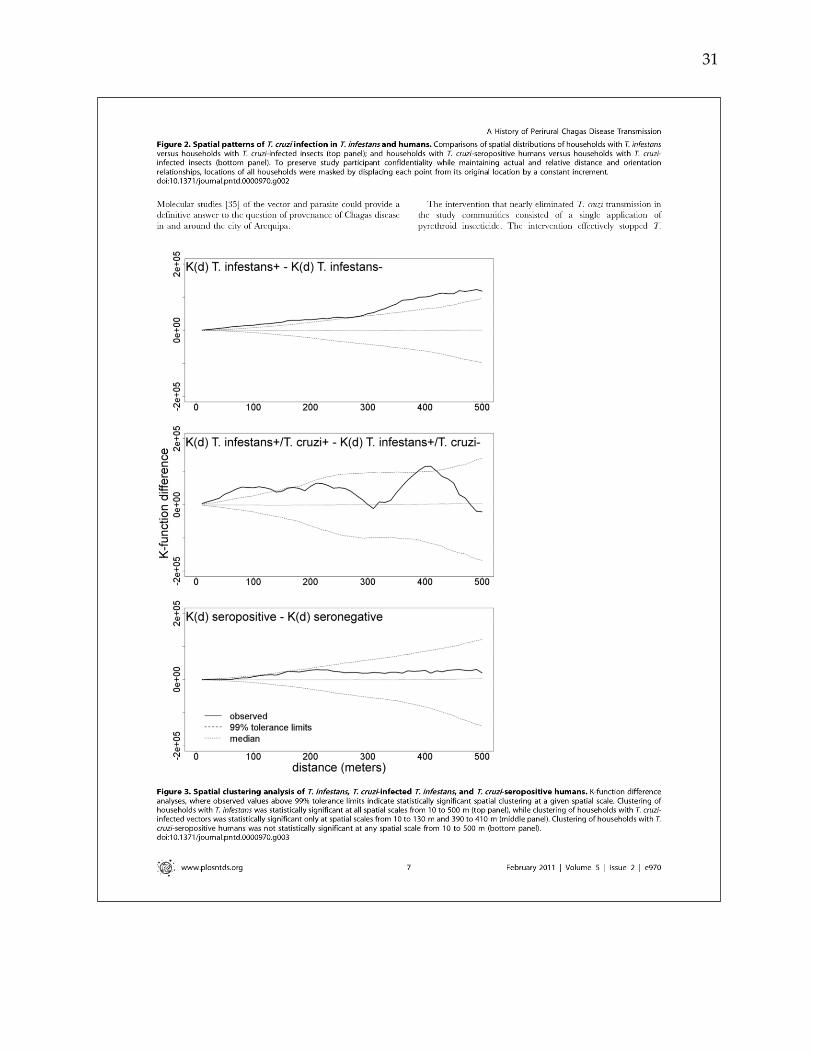
confirmed T. cruzi seropositive. Spatial clustering of parasitic infection was found in
vector insects, but not in human cases. Expanded catalytic models suggest that
transmission was interrupted in the study area in 1996 (95% credible interval: 1991-
2000), with a resultant decline in the average annual incidence of infection from 0.9%
(95% credible interval: 0.6-1.3%) to 0.1% (95% credible interval: 0.005-0.3%). Through a
search of archival newspaper reports, documentation of a 1995 vector control campaign
was uncovered, independently validating model estimates.
High levels of T. cruzi transmission had been ongoing in peri-rural La Joya prior to
interruption of parasite transmission through a little-documented vector control
17
campaign in 1995. Despite the efficacy of the 1995 control campaign, T. cruzi was
rapidly reemerging in vector populations in La Joya, emphasizing the need for
continuing surveillance and control at the rural-urban interface.
2.2 A Country Bug Moves to the City: Urban Infestation by the Chagas Disease Vector
Triatoma infestans in Arequipa, Peru
Data from a large-scale vector control program in Arequipa, Peru, were utilized to
explore the spatial patterns of infestation by Triatoma infestans in an urban and peri-
urban landscape. Of 37,229 households inspected for infestation, 6,982 (18.8%; 95% CI:
18.4 – 19.2%) were infested by T. infestans. Spatially-smoothed prevalence of infestation
varied from 0.0 to 77.9%. Eighty clusters of infestation were identified, ranging in area
from 0.1 to 68.7 hectares and containing as few as one and as many as 1,139 infested
households. Spatial dependence between infested households was significant at
distances up to 2,000 meters. Multilevel logistic regression modeling showed
statistically significant associations between household infestation and household- and
locality-level factors, including housing density, elevation, land surface temperature,
and locality type.
High levels of T. infestans infestation, characterized by spatial heterogeneity, were
found across an extensive urban and peri-urban landscape prior to vector control.
Several environmental and social factors, which may directly or indirectly influence the
18
biology and behavior of T. infestans, were associated with infestation. Spatial clustering
of infestation in the urban context may both challenge and inform surveillance and
control of vector reemergence after insecticide intervention.
2.3 Passive Surveillance of Triatoma infestans Reemergence in Urban and Peri-Urban Arequipa,
Peru
Passive surveillance data from an urban vector control program in Arequipa, Peru,
were utilized to conduct statistical and spatial analysis of Triatoma infestans reemergence
after large-scale insecticide intervention. Of 68,849 surveillance area households, 98
(0.14%; 95% CI: 0.11 – 0.17%) experienced and reported a T. infestans reemergence event
during the 12-month period from May 2009 through April 2010. Multivariate logistic
regression modeling showed statistically significant relationships between reemergence
events and prevalence of infestation prior to primary vector control, prevalence of
primary vector control, and time elapsed since insecticide application. The predicted
probability of a reemergence event varied spatially, with estimated annual incidence
rates ranging from 0.01 to 3.85%. Reemergence events were both clustered and non-
clustered, and were spatially dependent at distances up to 1,600 meters. Event-to-event
spatial proximity occurred at shorter distances in higher risk areas and longer distances
in lower risk areas.
19
While relatively rare, reemergence of T. infestans is a present and possibly persistent
problem in urban and peri-urban Arequipa. Identifiable predictors and patterns of risk
offer opportunities for more effective and efficient strategies for vector surveillance and
control.
2.4 Conclusions
Human invention and intervention have reduced and even eliminated the burden of
many infectious diseases. At the same time, societal and environmental conditions can
converge—or collide—to create circumstances favoring the emergence of infectious
disease in new locations and populations. In Arequipa, Peru, extensive and intensive
infestation by T. infestans, likely caused by rural-to-urban migration and catalyzed by an
urban environment conducive to vector proliferation and dispersion, provides one
example. Equally, political and social inaction can yield unforeseen and unwanted
consequences. The example of La Joya, Peru, illustrates the arc of a fruitful but forgotten
intervention, which eliminated the burden of T. cruzi infection in the town’s children,
yet allowed the reemergence of vector and parasite by failing to continue surveillance
and control. Solving the planet’s public health problems will require not only the
acquisition of new knowledge, but its sensible application as well.
20
REFERENCES
Auchincloss AH, Gebreab SY, Mair C, Diez Roux AV (2012) A review of spatial
methods in epidemiology. Annu Rev Public Health 33: 107-122.
Aufderheide AC, Salo W, Madden M, Streitz J, Buikstra J, Guhl F, Arriaza B, Renier C,
Wittmers Jr LE, Fornaciari G, Allison M (2004) A 9,000-year record of Chagas’ disease.
PNAS 101(7): 2034-2039.
Bergquist NR (2001) Vector-borne parasitic diseases: new trends in data collection and
risk assessment. Acta Trop 79(1): 13-20.
Clarke KC, McLafferty SL, Tempalski BJ (1996). On epidemiology and geographic
information systems: a review and discussion of future directions. Emerg Infect Dis 2:
85–92.
Cromley EK (2003) GIS and disease. Annu Rev Public Health 24: 7–24.
Gatrell AC, Bailey TC, Diggle PJ, Rowlingson BS (1996) Spatial point pattern analysis
and its application in geographical epidemiology. Trans Inst Br Geogr 21(1): 256-274.
Kearns RA (1993) Place and health: Towards a reformed medical geography. Prof Geogr
45(2): 139-147.
Kitron U (1998) Landscape ecology and epidemiology of vector-borne diseases: Tools
for spatial analysis. J Med Entomol 35(4): 435-445.
Levy MZ, Bowman NM, Kawai V, Waller LA, Cornejo del Carpio JG, Cordova
Benzaquen E, Gilman RH, Bern C (2006) Periurban Trypanosoma cruzi-infected Triatoma
infestans, Arequipa, Peru. Emerg Infect Dis 12: 1345-1352.
Lozano-Fuentes S, Elizondo-Quiroga D, Farfan-Ale JA, Loroño-Pino MA, Garcia-Rejon
J, Gomez-Carro S, Lira-Zumbardo V, Najera-Vazquez R, Fernandez-Salas I, Calderon-
Martinez J, Dominguez-Galera M, Mis-Avila P, Morris N, Coleman M, Moore CG, Beaty
BJ, Eisen L (2008) Use of Google Earth™ to strengthen public health capacity and
facilitate management of vector-borne diseases in resource-poor environments. Bull
World Health Organ 86(9): 718-725.
May JM (1950) Medical geography: Its methods and objectives. Geogr Rev 40(1): 9-41.

21
May JM (1958) The ecology of human disease. New York: MD Publications, Inc.
Meade MS (1977) Geography as human ecology: The dimension of population
movement. Geogr Rev 67(4 ): 379-393.
Meade MS, Emch M (2010) Medical geography (Third edition). New York: The Guilford
Press.
Moncayo A, Silveira AC (2009) Current epidemiologic trends for Chagas disease in
Latin America and future challenges in epidemiology, surveillance and health policy.
Mem Inst Oswaldo Cruz 104: 17-30.
Mott KE, Desjeux P, Moncayo A, Ranque P, de Raadt P (1990) Parasitic diseases and
urban development. Bulletin of the World Health Organization. 68(6), 691-698.
Ostfeld RS, Glass GE, Felicia Keesing F (2005) Spatial epidemiology: an emerging (or re-
emerging) discipline. Trends Ecol Evol 20(6): 328-336.
Pinto Dias JC (2007) Southern Cone Initiative for the elimination of domestic
populations of Triatoma infestans and the interruption of transfusional Chagas disease.
Historical aspects, present situation, and perspectives. Mem Inst Oswaldo Cruz 102: 11-
18.
Reithinger R, Tarleton RL, Urbina JA, Kitron U, Gürtler RE (2009) Eliminating Chagas
disease: challenges and a road map. BMJ 338: 1044-1046.
Snow J (1855) On the mode of communication of cholera. London: John Churchill.
Sui DZ (2007) Geographic information systems and medical geography: Toward a new
synergy. Geography Compass 1(3): 556-582.
Tarleton RL, Reithinger R, Urbina JA, Kitron U, Gürtler RE (2007) The challenges of
Chagas disease – Grim outlook of glimmer of hope? PLoS Medicine 4(12): e332.
Waller LA, Gotway CA (2004) Applied spatial statistics for public health data. Hoboken,
New Jersey: John Wiley & Sons, Inc.
World Health Organization (2002) Control of Chagas disease: Second report of the
WHO expert committee. Geneva: World Health Organization.
22
World Health Organization (2007) Reporte del grupo de trabajo científico sobre la
enfermedad de Chagas. Geneva: World Health Organization.
World Health Organization (2008) The global burden of disease: 2004 update. Geneva:
World Health Organization.
World Health Organization (2010) Chagas disease: Control and elimination (Report by
the Secretariat). Geneva: World Health Organization.
World Health Organization (2012) Accelerating work to overcome the global impact of
neglected tropical diseases – A roadmap for implementation. Geneva: World Health
Organization.

23
APPENDIX A
A HISTORY OF CHAGAS DISEASE TRANSMISSION, CONTROL, AND
RE-EMERGENCE IN PERI-RURAL LA JOYA, PERU
24
April 30, 2012
Mr. Stephen Delgado, Senior Research Specialist
University of Arizona, Drachman Hall
1295 N. Martin Ave.
Tucson, AZ. 85271
Dear Mr. Delgado,
This letter is to confirm that PLOS Neglected Tropical Diseases, a journal of
the Public Library of Science (PLOS), gives Stephen Delgado and the
University of Arizona permission to reprint or reuse the article A History of
Chagas Disease Transmission, Control, and Re-Emergence in Peri-Rural La
Joya, Peru
(www.plosntds.org/article/info:doi/10.1371/journal.pntd.0000970) for any
purposes.
It should be noted that use of published articles from any PLOS journal does
not require special permissions, as we release research papers using the
Creative Commons Attribution License
(http://www.plosntds.org/static/license.action) with which authors retain
ownership of the copyright for their article, but authors allow anyone to
download, reuse, reprint, modify, distribute, and/or copy articles in PLOS
journals, so long as the original authors and source are cited.
Sincerely,
Matthew Lopez
Publications Assistant, PLOS Neglected Tropical Diseases
BOARD OF DIRECTORS
Gary E. Ward
University of Vermont
PLOS Chairman of the Board
Patrick O. Brown
Stanford University School of Medicine
PLOS Co-founder
Michael B. Eisen
Lawrence Berkeley National Laboratory
University of California at Berkeley
PLOS Co-founder
Michael W. Carroll
American University
Washington College of Law
Robin Lovell-Badge
MRC National Institute for Medical Research,
London
Heather Joseph
Executive Director, SPARC
Rosalind L. Smyth
The Institute of Child Health
University College London
Jay M. Tenenbaum
CommerceNet
Beth Weil
University of California at Berkeley
David Liddle
US Venture Partners
25
26
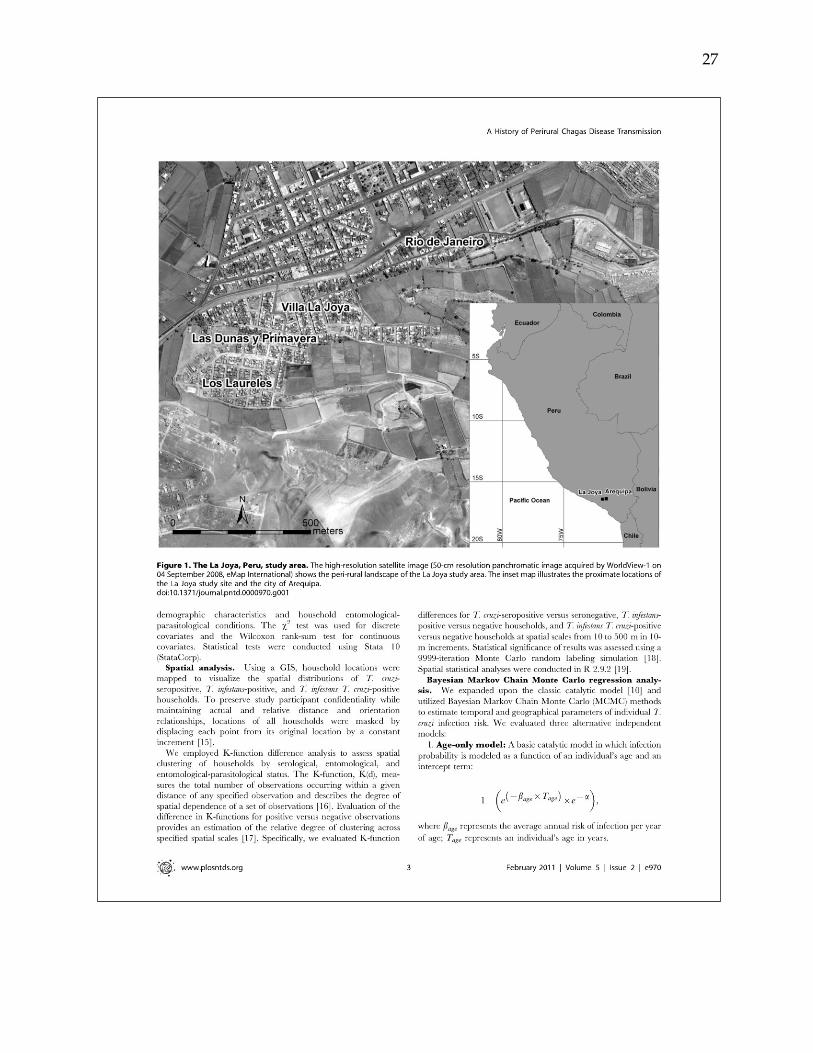
27
28
29
30
31
32
33
34
35
APPENDIX B
A COUNTRY BUG MOVES TO THE CITY: URBAN INFESTATION BY
THE CHAGAS DISEASE VECTOR TRIATOMA INFESTANS IN AREQUIPA, PERU
Paper was prepared to submit to the International Journal of Health Geographics

36
Title
A Country Bug Moves to the City: Urban Infestation by the Chagas Disease Vector
Triatoma infestans in Arequipa, Peru

37
Authors and affiliations
Stephen Delgado1,2
Kacey C. Ernst2
María Luz Hancco Pumahuanca3
Stephen R. Yool1
Andrew C. Comrie1
Charles R. Sterling4
Robert H. Gilman3,5
Michael Z. Levy6
and The Chagas Disease Working Group in Arequipa, Peru
1School of Geography and Development, University of Arizona, 409 Harvill Building,
1103 East 2nd Street, Tucson, Arizona 85721, USA
2Division of Epidemiology and Biostatistics, University of Arizona, A302 Drachman
Hall, 1295 North Martin Avenue, Tucson, Arizona 85724, USA
3Universidad Peruana Cayetano Heredia, Avenida Honorio Delgado 430, Urbanización
Ingeniería, Lima, Peru
4School of Animal and Comparative Biomedical Sciences, University of Arizona, 1117
East Lowell Street, Tucson, Arizona 85721, USA
5Bloomberg School of Public Health, Johns Hopkins University, Baltimore, Maryland,
USA

38
6Department of Biostatistics and Epidemiology, University of Pennsylvania, 819
Blockley Hall, 423 Guardian Drive, Philadelphia, Pennsylvania 19104, USA
39
Abstract
Background: Interruption of vector-borne transmission of Trypanosoma cruzi remains an
unrealized objective in many Latin American countries. The task of vector control is
complicated by the emergence of vector insects in urban areas.
Methodology/Principal Findings: Utilizing data from a large-scale vector control program
in Arequipa, Peru, we explored the spatial patterns of infestation by Triatoma infestans in
an urban and peri-urban landscape. Of 37,229 households inspected for infestation,
6,982 (18.8%; 95% CI: 18.4 – 19.2%) were infested by T. infestans. Spatially-smoothed
prevalence of infestation varied from 0.0 to 77.9%. Eighty clusters of infestation were
identified, ranging in area from 0.1 to 68.7 hectares and containing as few as one and as
many as 1,139 infested households. Spatial dependence between infested households
was significant at distances up to 2,000 meters. Multilevel logistic regression modeling
showed statistically significant associations between household infestation and
household- and locality-level factors, including housing density, elevation, land surface
temperature, and locality type.
Conclusions/Significance: High levels of T. infestans infestation, characterized by spatial
heterogeneity, were found across extensive urban and peri-urban landscape prior to
vector control. Several environmental and social factors, which may directly or
indirectly influence the biology and behavior of T. infestans, were associated with

40
infestation. Spatial clustering of infestation in the urban context may both challenge and
inform surveillance and control of vector reemergence after insecticide intervention.
41
Introduction
Chagas disease, also known as American trypanosomiasis, is caused by the
protozoan parasite Trypanosoma cruzi and is endemic in Latin America. Typically, T.
cruzi is transmitted to humans via the infected excretions of various blood-feeding
triatomine insect species, including Triatoma infestans. Less commonly, infection may
result from congenital transmission, blood transfusion, organ transplantation, and
incidental ingestion of parasite-contaminated food or drink [Heymann, 2008]. Chagas
disease is characterized by an acute phase, which lasts 6 – 8 weeks, and a chronic phase,
which persists for life. In most cases, both the acute and chronic phases of infection are
asymptomatic. However, 10 – 40% of cases, depending on the geographic region,
progress over a period of years to chronic disease, including potentially fatal cardiac
and gastrointestinal disorders [WHO, 2002]. Globally, eight million persons are infected
with T. cruzi, resulting in 11,000 deaths and the loss of 430,000 disability-adjusted life
years (DALYs) annually [WHO, 2008; WHO, 2010].
Prevention and control of Chagas disease are achieved primarily via large-scale
insecticide application initiatives [WHO, 2012], and Triatoma infestans, which lives
nearly exclusively in and around human households, is a principal target for vector
control [WHO, 2002]. While the Southern Cone Initiative has succeeded in interrupting
T. cruzi transmission by T. infestans in Brazil, Chile, and Uruguay [Pinto Dias, 2007;
WHO, 2007], T. infestans-mediated T. cruzi transmission persists in parts of Argentina,
42
Bolivia, Paraguay, and Peru [Tarleton, 2007; Moncayo, 2009]. Moreover, efforts to
eliminate T. infestans have been complicated by the expansion of this species from
sparsely populated rural regions into densely populated urban areas [Mott, 1990, Levy,
2006].
While the ecology of T. infestans infestation in rural environments has been studied
extensively, urban infestation by this insect has been investigated only preliminarily. To
advance understanding of vector infestation in the urban context, this study examines
infestation by T. infestans across an urban and peri-urban landscape prior to
implementation of vector control. Our study focuses on Arequipa, Peru, which lies in an
area with extensive T. infestans infestation and epidemic T. cruzi transmission
[Moncayo, 2009; Levy, 2011]. Utilizing data collected from multiple sources at multiple
spatial scales, we employ spatial point pattern analysis and multilevel logistic
regression to elucidate spatial patterns in infestation by T. infestans and to assess
associations between several environmental and social factors and T. infestans
infestation in an urban landscape.
The paper is organized into the following sections: Methods, Results, and
Discussion. The Methods section describes the study area, details methods for data
collection (household data, remote sensing data, and census data), and elaborates
methods for data analysis (spatial point pattern analysis, remote sensing image analysis,
and statistical analysis). The Results section highlights important findings in narrative

43
format, visualizes geographical data via various figures, and details statistical outcomes
in table format. Finally, the Discussion section interprets study findings, relates these
findings to previously published work, and describes study limitations.
44
Methods
Study area
Arequipa (population 864,250) is situated in southwestern Peru and is the country’s
third most populous province. This study focuses on six of the province’s twenty-nine
districts: Jacobo Hunter, Jose Luis Bustamante y Rivero, Paucarpata, Sachaca, Socabaya,
and Tiabaya. The districts encompass a geographically contiguous area of 139 square
kilometers adjacent to the capital city of Arequipa, and include nearly forty percent of
the province’s population [INEI, 2007] (Figure 1).
In 2003, the Gerencia Regional de Salud de Arequipa (GRSA) initiated a vector
control program to eliminate household infestation by T. infestans. The program is
ongoing, is implemented on a district-by-district basis, and consists of a simple stepwise
process. First, each household is assigned a unique alphanumeric code, and household
codes and locations are catalogued on hand-drawn maps. Second, GRSA personnel go
door-to-door, inspecting and spraying each household that consents to participate in
the program. For each participating household, the presence or absence of T. infestans is
recorded and each household is sprayed whether or not insects are found. Finally, the
inspection and insecticide application process is repeated approximately six months
later.
45
Data collection
Household data.Maps of household locations, household unique identifier codes,
and dates and results of household T. infestans inspections were provided by the GRSA.
Using GRSA maps and Google Earth imagery, we assigned geographic coordinates to
68,849 households within the study area. Of these, 37,229 (54.1%) households had been
inspected for infestation by T. infestans and sprayed with insecticide during the period
from September 2003 through December 2008. Household geographic coordinates,
household T. infestans infestation status (0/1), and household unique identifier codes
were stored in a relational database management system for subsequent analysis.
Remote sensing data. Advanced Spaceborne Thermal Admission and Reflection
Radiometer (ASTER) Global Digital Elevation Model Version 2 (GDEM V2) 30-meter-
resolution imagery of the study area (ASTGTM2_S17W072) was acquired from the
National Aeronautics and Space Administration (NASA) Earth Observing System Data
and Information System (EOSDIS) (http://reverb.echo.nasa.gov). Landsat 5 Thematic
Mapper (TM) 120-meter resolution thermal imagery (band 6: 10.40 – 12.50 µm) and 30-
meter resolution visible (band 3: 0.63 – 0.69 µm) and near-infrared (band 4: 0.76 – 0.90
µm) imagery of the study area (WRS path 3 row 71) were obtained from the United
States Geological Survey (USGS) EarthExplorer (http://earthexplorer.usgs.gov). Cloud-
free images were attained for nine dates in 2008: 18 March, 19 April, 21 May, 24 July, 25
August, 26 September, 12 October, 13 November, and 15 December. A Landsat 5 TM
46
band 3 image acquired on 25 July 25 1987 was obtained from NASA’s Global
Orthorectifed Landsat Data Set (http://www.landsat.org/ortho/) as reference for
geometric correction of 2008 images [Tucker, 2004].
Census data. In Peru, census areas are subdivided into departments, provinces,
districts, and localities. A database of the locality in which each study household was
located was provided by the GRSA, and a census classification of locality types was
obtained from the Peru National Institute of Statistics and Informatics (INEI). Locality
type categories included city (ciudad), housing development (urbanización), town
(pueblo), shantytown (pueblo joven), housing association (asociación de viviendas), housing
cooperative (cooperativa de viviendas), annex (anexo), hamlet (caserio), and rural
community (comunidad campesina) [INEI, 1993]. The GRSA and INEI databases were
joined and each household was assigned a categorical variable specifying locality type
for 34,275 of the 37,229 (92.1%) households with documented T. infestans inspection
data.
Data analysis
Spatial point pattern analysis. Spatial variation in household infestation by T.
infestans was evaluated by dividing the kernel-smoothed density of infested households
by the kernel-smoothed density of all inspected households. An isotropic Gaussian
smoothing kernel with a standard deviation () of 45.7 meters was utilized for this
47
analysis, where was selected using a likelihood cross-validation method. A 999-
iteration random labeling simulation was performed to identify areas where infestation
by T. infestans was significantly elevated [Kelsall, 1995; Diggle, 2003]. Similarly, spatial
variation in household participation in the inspection and insecticide application
program was evaluated by dividing the kernel-smoothed density of inspected
households by the kernel-smoothed density of all mapped households, with = 34.8
meters. The kernel-smoothed density of all mapped households, with = 27.8 meters,
was estimated for evaluation as a covariate in logistic regression [Diggle 1985, Diggle
2003].
Spatial dependence between households infested by T. infestans was assessed by
computing the difference in the K-function for infested households and non-infested
households at 100-meter increments from 0 to 2000 meters. A 999-iteration random
labeling simulation was executed to identify distances at which spatial dependence of
infested households was statistically significant [Diggle, 1991].
Spatial statistical analyses were conducted using R version 2.15.2 (The R Project for
Statistical Computing, http://www.r-project.org). Maps of spatial variation in household
infestation and household density were constructed using ArcGIS version 10 (ESRI,
http://www.esri.com).
48
Remote sensing image analysis. Remote sensing data were utilized to derive and
extract household point-level estimates of elevation and land surface temperature for
evaluation as covariates in logistic regression.
The ASTER GDEM2 image was projected to the WGS 84 UTM 19N coordinate
system and resampled to a 30-meter pixel size to match the projection and spatial
resolution of Landsat 5 TM imagery, and elevation data were extracted to household
point locations.
Landsat 5 TM and ASTER GDEM2 images were cropped to a 701-column by 474-
row area corresponding to the rectangle bounding the six study area districts. Landsat 5
TM band 3, 4, and 6 images from 2008 were geometrically corrected utilizing a simple
root mean square error minimization routine and the Landsat 5 TM band 3 image from
1985 as reference [Goslee, 2011]. Atmospheric correction of Landsat 5 TM band 3 and 4
images was performed using a modified dark object subtraction method [Song, 2000],
followed by topographic correction utilizing a Minnaert method [Riaño, 2003]. The
normalized difference vegetation index (NDVI) was calculated from Landsat 5 TM band
3 and 4 images [Jensen, 2005], and land surface emissivity was estimated from NDVI
[Jiménez-Muñoz, 2009] for each date in 2008. Land surface temperature was derived
using Landsat 5 TM band 6 thermal infrared images; land surface emissivity images;
and coefficients for atmospheric transmissivity, upwelling atmospheric radiance, and
downwelling atmospheric radiance [Barsi, 2005; Chander, 2009]. Land surface
49
temperature images were overlaid, median land surface temperature was calculated for
each raster pixel, and these data were extracted to household point locations.
Processing of ASTER GDEM V2 and Landsat 5 TM images was conducted using the
landsat package version 1.0.8 in R version 2.15.2 [Goslee, 2011]. Atmospheric
coefficients were obtained from the Atmospheric Correction Parameter Calculator
(http://atmcorr.gsfc.nasa.gov). ArcGIS version 10 was utilized to create maps of
elevation and land surface temperature, and to extract values for these variables to
household point locations.
Statistical analysis. Prevalence of infestation was calculated for the 37,229
households inspected for T. infestans. Median and interquartile range values were
computed for the spatially smoothed prevalence of household participation in the
inspection and insecticide application program. The t-test with unequal variances was
employed to compare mean values for housing density, elevation, and land surface
temperature for houses that had been inspected versus those that had not.
Univariate and multivariate logistic regression were used to evaluate the
associations between household infestation and household-level variables, including
housing density, elevation, and median land surface temperature (Figure 2). To account
for non-linearity in logistic regression, housing density and elevation were converted
from continuous to categorical variables based on their respective quintiles. Median
land surface temperature was maintained as a continuous variable.

50
To address spatial dependence among observations and to assess locality-level
effects, three multilevel logistic regression models were evaluated: a model including
only locality-level random effects (Model 0); a model including household-level
covariates and locality-level random effects (Model 1); and a model including
household-level covariates, a locality-level covariate, and locality-level random effects
(Model 2). In addition to standard odds ratios, median odds ratios (MOR) was
calculated for locality-level random effects, and the interval odds ratio (IOR) was
calculated for the locality-level covariate [Larsen, 2005; Merlo, 2006].
The locality level covariate is a dichotomous categorization of locality type into
shantytown and other, where the category other consisted primarily of housing
developments, cities, and towns. Locality type information was unavailable for 2,954
(7.9%) of mapped households. These were omitted from logistic regression modeling,
leaving 34,725 households located in 160 localities for regression analyses (Table 1).
Model 0. Locality-level random effects only:
logit[Pr(yij = 1)] = β0 + uj
Model 1. Household-level effects and locality-level random effects:
logit[Pr(yij = 1)] = β0 + β1 densityij + β2 elevationij + β3 temperatureij + uj
Model 2. Household- and locality-level effects and locality-level random effects:
logit[Pr(yij =1)] = β0 + β1 densityij + β2 elevationij + β3 temperatureij + β4 locality typej + uj
51
Logit is the link function; Pr(yij = 1) is the probability of household infestation; i and j
indicate the ith household and the jth locality, β1 is the vector of regression coefficients
for density, where density is kernel-smoothed housing density (households/hectare)
categorized by quintiles; β2 is the vector of regression coefficients for elevation, where
elevation is elevation (meters above sea level) categorized by quintiles; β3 is the
regression coefficient for temperature, where temperature is estimated annual median
land surface temperature (°C); β4 is the regression coefficient for locality type, where
locality type is a dichotomous categorization of localities into shantytown and other; β0 is
the household-level intercept; and uj is the locality-level random effect.
Regression model goodness of fit was assessed using the likelihood ratio test. Spatial
autocorrelation in deviance residuals of the least- and best-fit models was evaluated
utilizing the mark correlation function (Km) at 25-meter increments from 0 to 500 meters.
A 999-iteration random labeling simulation was executed to identify distances at which
regression residual spatial autocorrelation was statistically significant [Goreaud, 2000].
Stata/IC 12.1 (http://www.stata.com) was utilized for statistical analyses, and R
version 2.15.2 was used for spatial analysis of regression residuals.
52
Results
Of the 68,849 mapped households, 37,229 (54.1%) had been inspected and sprayed,
while 31,620 (45.9%) had not. Triatoma infestans were found in 6,982 (18.8%; 95%
confidence interval (CI): 18.4 – 19.2%) of the inspected households. Prevalence of
household infestation varied widely across the study area, with spatially smoothed
estimates ranging from 0.0 to 77.9% (Figure 3). Eighty areas were identified that
exceeded the upper limit of the 999-iteration random labeling simulation of the kernel
density estimate ratio for infested households versus inspected households. These
clusters of infestation, which ranged in area from 0.1 to 68.7 hectares, contained as few
as 1 and as many as 1,139 infested households. In total, the clusters encompassed 3,278
(46.9%) of the 6,982 infested households. The K-function difference for infested versus
non-infested households exceeded the upper limit of the 999-iteration random labeling
simulation at all 100-meter increments up to 2000 meters.
The median spatially smoothed prevalence of participation in the vector control
campaign was 90.9% (interquartile range: 81.0 – 95.7%) in areas where households were
inspected and sprayed; however, large areas remained to be reached by the campaign
(Figure 3). The households that had not been inspected and sprayed differed slightly
from those that had in terms of housing density and elevation, but not land surface
temperature. Mean housing density for participant households was 31.6 households per
hectare versus 28.8 for non-participant households (p < 0.0001), while mean elevation
53
for participant households was 2,350 meters above sea level versus 2,417 for non-
participant households (p < 0.0001). Mean land surface temperature was 31.3°C and
32.2°C for participant and non-participant households, respectively (p = 0.1652).
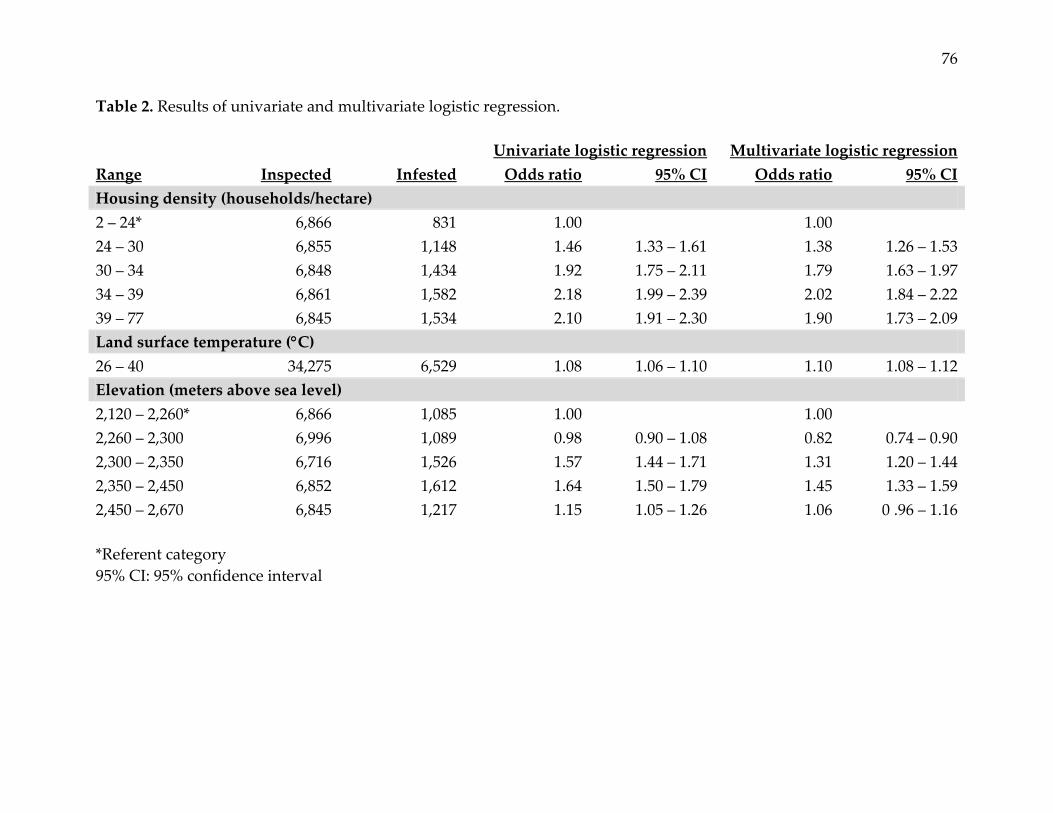
Univariate logistic regression showed statistically significant relationships between
household infestation and housing density, elevation, and land surface temperature.
For housing density, odds of infestation were approximately two times higher in the
highest versus the lowest quintile. For elevation, odds of infestation were modestly
higher in the third and fourth quintiles relative to the lowest, but were only minimally
increased in the highest quintile. Odds of infestation increased 8% with each 1°C
increase in land surface temperature. Covariates remained statistically significant in the
multivariate model, with a modest increase in the odds of infestation associated with
land surface temperature, and moderate decreases in the odds of infestation associated
with housing density and elevation (Table 2).
Multilevel logistic regression represented an improvement over ordinary logistic
regression, and the data were best fit by Model 2: logit[Pr(yij =1)] = β0 + β1 densityij + β2
elevationij + β3 temperatureij + β4 locality typej + uj (Table 3). Spatial autocorrelation in
deviance residuals was distinctly decreased in the best-fit multilevel model versus the
ordinary multivariate model (Figure 4.)
Locality-level random effects were substantial. The MOR, which is the median value
of the odds ratio when comparing a higher- to a lower-risk locality, indicated that the
54
median odds of infestation were two and one-half times greater in higher versus lower
risk localities (Table 3).
The effect of the locality-level covariate, locality type, was also significant.
Households located in shantytowns had 75% higher odds of infestation than
households situated in other locality types. However, the IOR, which is the interval
between the 10th and 80th percentile centered on the median value of the distribution of
odds ratios for locality type, included the value one. This indicates that the effect of
locality type is not as strong as the locality-level random effect (Table 3).
Household-level effects all remained statistically significant. Odds of infestation
increased 10% with each 1°C increase in land surface temperature, which was similar to
the estimate from ordinary multivariate logistic regression. The highest housing density
quintile had 75% higher odds of infestation relative to the lowest quintile, which is
slightly diminished compared to results from the ordinary multivariate model. The
fourth elevation quintile had greater than twice the odds of infestation relative to the
lowest quintile, but the highest quintile showed only 50% higher odds of infestation
relative to the lowest quintile. The effect of elevation was substantially increased in the
multilevel versus the ordinary multivariate logistic regression model.
55
Discussion
Infestation by T. infestans has been found in many urban areas in Latin America,
including Santiago, Chile; Cochabamba and Sucre, Bolivia; and Arequipa, Peru
[Schenone, 1985; Tibayrenc, 1984; Levy, 2006]. In affected areas—urban as well as
rural—prevention and control of Chagas disease continues to rely on control of vector
insects [WHO, 2012]. While infestation by and control of T. infestans has been
extensively examined in the rural context, infestation in the urban milieu is less well
understood. Utilizing spatial and multilevel logistic regression analysis of data collected
from multiple sources at multiple spatial scales, we offer insights into the dynamics of
infestation by T. infestans in an urban landscape.
Prior to implementation of vector control, extensive household infestation by T.
infestans was present in urban and peri-urban Arequipa. The intensity of infestation was
spatially heterogeneous, with areas of very low and very high prevalence of infestation.
Numerous clusters of infestation, small and large, were found across the six study
districts, indicating that urban and peri-urban landscapes offer environments conducive
to the proliferation and dispersion of T. infestans. In rural landscapes, T. infestans can
actively disperse by crawling or flying at distances up to approximately 100 or 2,000
meters, respectively [Vazquez-Prokopec, 2004; Schofield 1992]. While flight has been
observed as a main mechanism of infestation in urban San Juan, Argentina [Vallvé,
1996], in this study, spatial dependence between infested households was observed at
56
distances from 0 to 2,000 meters, suggesting that urban T. infestans may disperse at
shorter distances by crawling and at longer distances by flying.
Identifying extant clusters of infestation prior to vector control may have critical
consequences for implementing effective surveillance of vector reemergence subsequent
to vector control. In an extensive but sparsely populated rural area in the Gran Chaco of
Argentina, reinfestation by T. infestans tended to cluster in areas where infestation was
clustered prior to vector control [Porcasi, 2006]. Infestation clusters in an extensively
and densely populated urban area may be similarly problematic. The existence of
numerous infestation clusters in Arequipa, many encompassing large areas and many
households, should be priority areas for surveillance by the GRSA. Where feasible,
utilization of a geographic information system to monitor T. infestans reemergence—as
well as other health risks and outcomes—might be a cost effective investment for
resource-constrained public health institutions in Arequipa, and elsewhere in the
developing world [Mott, 1995; Stansfield, 2006].
Spatial heterogeneity in urban infestation by T. infestans is likely influenced by
myriad factors operating at multiple spatial scales. We evaluated only a few features,
which were chosen based on ecological plausibility and data availability. In ordinary
univariate and multivariate logistic regression, housing density, elevation, and land
surface temperature were all positively, if not always linearly, associated with
household infestation. Housing density may facilitate vector dispersal. In higher-
57
density urban areas, new habitats and blood sources found in nearby houses are located
at short distances, thereby facilitating dispersal of refuge- or blood-seeking vectors.
Also, attraction to light is an important influence in the dissemination of T. infestans,
and the plentiful presence of light sources in higher-density urban areas may promote
insect dispersal [Zeledón, 1981]. Land surface temperature may affect vector biology
and behavior. Both laboratory and field experiments demonstrate that T. infestans flight
initiation increases at higher temperatures [Lehane, 1992; Schofield, 1992], thereby
promoting vector dispersal in warmer urban areas. Laboratory studies also indicate that
the feeding rate and development rate of T. infestans increase at higher temperatures
[Catalá, 1991, Gorla, 1989]. Hunger is reportedly the principal cause for dispersion of
triatomines [Zeledón, 1981]; and temperature-mediated rates of feeding and
development, which requires a blood meal to mature from one life stage to the next,
may promote vector dispersal in warmer urban areas. Elevation may act indirectly
through socioeconomic circumstances, rather than directly through biophysical
constraints. In Arequipa, lower socioeconomic status populations, often rural-to-urban
migrants, typically inhabit the higher elevation hillsides, while higher socioeconomic
status populations usually reside in lower elevation valleys [Bayer, 2009]. As such,
higher infestation at higher elevation in Arequipa may be attributable to two factors:
passive introduction of insects resulting from seasonal migration to nearby rural areas
where T. infestans are prevalent, and substandard living conditions that provide habitats

58
suitable for T. infestans infestation [Bayer, 2009]. The slight decrease in infestation at the
highest elevations may result from the relatively recent inhabitation of these areas,
leaving little time for infestation to have occurred. Elevation is unlikely to be a
biophysical constraint for infestation in the currently populated areas of Arequipa, as T.
infestans have been found as high as 3,682 meters above sea level in Argentina, well
above the elevation of the study area [Zeledón, 1981].
Multilevel logistic regression revealed the importance of locality-level contextual
effects and substantially diminished spatial autocorrelation present in ordinary logistic
regression. The locality-level random effect, which estimates the influence of
unobserved contextual effects within each locality, indicated that these unmeasured
factors are associated, in median, with substantially higher risk of household
infestation. In Arequipa, and elsewhere, urban shantytowns have been identified as
areas at higher risk for infestation by Chagas disease vectors, as well as vector-borne
transmission of T. cruzi [Schenone, 1985; Tibayrenc, 1984; Levy, 2006; Bowman, 2008].
We provide further evidence that shantytowns are at higher risk for infestation by T.
infestans, and we offer a quantitative assessment of this effect. Controlling for locality
type, household-level effects for housing density, elevation, and land surface
temperature all remained statistically significant and substantial.
We recognize that our study is limited in many respects. First, while we believe that
household location and infestation status data are both precise and accurate, we did not
59
consider more detailed data regarding the number, life stage, and T. cruzi infection
status of insects found during the vector control campaign. Nor did we have complete
data regarding households (e.g., construction materials, domestic animals) or their
occupants. More detailed data likely would have improved the insights provided by
our analyses. Second, we recognize that point-level household covariates are extracted
from remote sensing data collected at a 30-meter scale (elevation, land surface
temperature) or are spatially smoothed estimates (housing density). We also
understand that land surface temperature data do not capture fine-scale temporal
variability that occurs across and within days of the year, nor do they describe fine-scale
spatial variation in ambient micro-climatic conditions. These issues of scale could
conceivably bias the relative magnitude of observed effects. Third, while most
households within the study area were mapped, only 54% had been inspected and
sprayed at the time of our data analysis. However, we do show that the areas that had
been inspected and sprayed had excellent rates of participation, and that non-
participant households were not substantially different than participant households in
terms of the covariates evaluated. Nonetheless, we recognize that an extensive
proportion of the study area remains unevaluated for infestation.
The geography and ecology of T. infestans—as well as vector species for many other
infectious diseases—are changing. Decreasing funding and political will and increasing
insecticide resistance are endangering gains made towards interruption of vector-borne

60
transmission of T. cruzi [Tarleton, 2007]. For many vector-borne diseases in many parts
of the world, these are not only public health concerns but also social justice issues, as
economically and politically marginalized populations may suffer disproportionately.
Many potentially powerful tools (e.g., Google Earth, The R Project for Statistical
Computing), data sources (e.g., NASA, NOAA), and spatial and statistical methods are
now freely available. Finding novel uses for these resources in conjunction with local
knowledge and information—as well as increasing capacity to do so—could inspire
new perspective on and solutions to existing and emerging public health problems and
their social and environmental causes and consequences.

61
Acknowledgements
We gratefully acknowledge the invaluable contributions of the following institutions.
The Gerencia Regional de Salud de Arequipa (GRSA) conducted vector surveillance
and control and shared these data with us. The Tropical Medicine Research Center
(TMRC) Peru working group conducted household georeferencing and assisted with
database management. The Ministerio de Salud del Perú (MINSA), Dirección General
de Salud de las Personas (DGSP), Estrategia Sanitaria Nacional de Prevención y Control
de Enfermedades Metaxénicas y Otras Transmitidas por Vectores (ESNPCEMOTVS),
Dirección General de Salud Ambiental (DIGESA); Gobierno Regional de Arequipa; Pan
American Health Organization (PAHO); and Canadian International Development
Agency (CIDA) provided financial, logistical, and technical support. ASTER GDEM is a
product of METI and NASA.
62
References
Barsi JA, Schott JR, Palluconi FD, Hood SJ (2005) Validation of a Web-based
atmospheric correction tool for single thermal band images. Proc SPIE 5882, Earth
Observing Systems X: 58820E.
Bayer AM, Hunter GC, Gilman RH, Cornejo del Carpio JG, Naquira C, Bern C, Levy
MZ (2009) Chagas disease, migration and community settlement patterns in Arequipa,
Peru. PLoS Negl Trop Dis 3: e567.
Bowman NM, Kawai V, Levy MZ, Cornejo del Carpio, J.G., Cabrera L, et al. (2008)
Chagas disease transmission in periurban communities of Arequipa, Peru. Clinical
Infectious Diseases 46: 1822-1828.
Catalá S (1991) The biting rate of Triatoma infestans in Argentina. Medical and
Veterinary Entomology 5: 325-333.
Chander G, Markham BL, Helder DL (2009) Summary of current radiometric calibration
coefficients for Landsat MSS, TM, ETM+, and EO-1 ALI sensors. Remote Sensing of
Environment 113: 893-903.
Diggle PJ (1985) A kernel method for smoothing point process data. Applied Statistics
34: 138-147.
Diggle PJ, Chetwynd AG (1991) Second-order analysis of spatial clustering for
inhomogeneous populations. Biometrics 47: 1155-1163.
Diggle PJ (2003) Statistical analysis of spatial point patterns (Second edition). London:
Arnold. 168 p.
Goreaud F (2000). Apports de l’analyse de la structure spatiale en foret temp r e
l’ tude et la mod lisation des peuplements complexes. Th se de doctorat, ENG EF,
Nancy, France.
Gorla DE, Schofield CJ (1989) Population dynamics of Triatoma infestans under natural
climatic conditions in the Argentine Chaco. Medical and Veterinary Entomology 3: 179-
194.
Goslee SC (2011) Analyzing remote sensing data in R: The landsat package. Journal of
Statistical Software 43: 1-25.
63
Heymann DL, ed. (2008) Control of communicable diseases manual (19th edition).
Washington, DC: American Public Health Association.
Instituto Nacional de Estadística e Informática del Perú (1993) Estadística de Centros
Poblados 1993. http://www.inei.gob.pe.
Instituto Nacional de Estadística e Informática del Perú (2007) XI Censo de Población y
VI de Vivienda 2007. http://www.inei.gob.pe.
Jensen JR (2005) Introductory digital image processing: A remote sensing perspective
(Third edition). Upper Saddle River, NJ: Pearson Education, Inc.
Jiménez-Muñoz JC, Cristóbal J, Sobrino JA, Sòria G, Ninyerola M, Pons X (2009)
Revision of the single-channel algorithm for land surface temperature retrieval from
Landsat thermal-infrared data. IEEE Transactions on Geoscience and Remote Sensing
47: 339-349.
Kelsall JE, Diggle PJ (1995) Non-parametric estimation of spatial variation in relative
risk. Statistic in Medicine 14: 2335-2342.
Larsen K, Merlo J (2005) Appropriate assessment of neighborhood effects on individual
health: Integrating random and fixed effects in multilevel logistic regression. Am J
Epidemiol 161: 81-88.
Levy MZ, Bowman NM, Kawai V, Waller LA, Cornejo del Carpio JG, Cordova
Benzaquen E, Gilman RH, Bern C (2006) Periurban Trypanosoma cruzi-infected Triatoma
infestans, Arequipa, Peru. Emerg Infect Dis 12: 1345-1352.
Levy MZ, Small DS, Vilhena DA, Bowman NM, Kawai V, et al. (2011) Retracing micro-
epidemics of Chagas disease using epicenter regression. PLoS Comput Biol 7(9):
e1002146.
Lehane MJ, McEwen PK, Whitaker CJ, Schofield CJ (1992) The role of temperature and
nutritional status in flight initiation by Triatoma infestans. Acta Tropica 52: 27-38.
Merlo J, Chaix B, Ohlsson H, Beckham A, Johnell K, Hjerpe P, Råstam L, Larsen K (2006)
A brief conceptual tutorial of multilevel analysis in social epidemiology: using
measures of clustering in multilevel logistic regression to investigate contextual
phenomena. J Epidemiol Community Health 60: 290-297.
64
Moncayo A, Silveira AC (2009) Current epidemiologic trends for Chagas disease in
Latin America and future challenges in epidemiology, surveillance and health policy.
Mem Inst Oswaldo Cruz 104: 17-30.
Mott KE, Desjeux P, Moncayo A, Ranque P, de Raadt P (1990) Parasitic diseases and
urban development. Bulletin of the World Health Organization 68: 691-696.
Mott KE, Nuttall I, Desjeux P, Cattland P (1995) New geographical approaches to
control of some parasitic zoonoses. Bulletin of the World Health Organization 73: 247-
257.
Pinto Dias JC (2007) Southern Cone Initiative for the elimination of domestic
populations of Triatoma infestans and the interruption of transfusional Chagas disease.
Historical aspects, present situation, and perspectives. Mem Inst Oswaldo Cruz 102: 11-
18.
Porcasi X, Catalá SS, Hrellac H, Scavuzzo MC, Gorla DE (2006) Infestation of rural
houses by Triatoma infestans (Hemiptera: Reduviidae) in southern area of Gran Chaco in
Argentina. J Med Entomol 43: 1060-1067.
Riaño D, Chuvieco E, Salas J, Aguado I (2003) Assessment of different topographic
corrections in Landsat-TM data for mapping vegetation types. IEEE Transactions on
Geoscience and Remote Sensing 41: 1056-1061.
Schenone H (1985) Enfermedad de Chagas en chile: Sectores rurales y periurbanos del
area de endemo-enzootia relaciones entre condiciones de la vivienda, infestación
triatomidea domiciliaria e infección por Trypanosoma cruzi del vector, del humano y de
mamíferos domésticos, 1982–1985. Boletin Chileno de Parasitologia 40: 58-67.
Schofield CJ, Lehane MJ, McEwen PK, Catalá S, Gorla DE (1992) Dispersive flight by
Triatoma infestans under natural climatic conditions in Argentina. Med Vet Entomol 6:
51-56.
Song C, Woodcock CE, Seto KC, Lenney MP, Macomber SA (2000) Classification and
change detection using Landsat TM data: When and how to correct atmospheric effects?
Remote Sens Environ 75: 230-244.
65
Stansfield SK, Walsh J, Prata N, Evans T (2006) Information to Improve Decision
Making for Health. In: Jamison DT, Breman JG, Measham AR, Alleyne G, Claeson M,
Evans DB, Jha P, Mills A, Musgrove P, editors. Disease control priorities in developing
countries. Washington, DC: Oxford University Press and The World Bank. pp. 1017-
1013.
Tarleton RL, Reithinger R, Urbina JA, Kitron U, Gürtler RE (2007) The challenges of
Chagas disease – Grim outlook of glimmer of hope? PLoS Medicine 4: e332.
Tibayrenc M (1984) La maladie de Chagas en Bolivie : données préliminaires sur les
cycles domestiques : méthodes simplifiées de captures des triatomes. Cahiers ORSTOM.
Série Entomologie Médicale et Parasitologie 22: 51-53.
Tucker CJ, Grant DM, Dykstra JD (2004) NASA’s global orthorectified Landsat data set.
Photogrammetric Engineering & Remote Sensing 70: 313-322.
Vallvé SL, Rojo H, Wisnivesky-Colli C (1996) Urban ecology of Triatoma infestans in San
Juan, Argentina. Mem. Inst. Oswaldo Cruz 91 : 405-408.
Vazquez-Prokopec GM, Ceballos LA, Kitron U, Gürtler RE (2004) Active dispersal of
natural populations of Triatoma infestans (Hemiptera: Reduviidae) in rural northwestern
Argentina. J Med Entomol 41: 614–21
World Health Organization (2002) Control of Chagas disease: Second report of the
WHO expert committee. Geneva: World Health Organization.
World Health Organization (2007) Reporte del grupo de trabajo científico sobre la
enfermedad de Chagas. Geneva: World Health Organization.
World Health Organization (2008) The global burden of disease: 2004 update. Geneva:
World Health Organization.
World Health Organization (2010) Chagas disease: Control and elimination (Report by
the Secretariat). Geneva: World Health Organization.
World Health Organization (2012) Accelerating work to overcome the global impact of
neglected tropical diseases – A roadmap for implementation. Geneva: World Health
Organization.
66
Zeledón R, Rabinovich JE (1981) Chagas disease: An ecological appraisal with special
emphasis on its insect vectors. Ann Rev Entomol 26: 101-133.
67
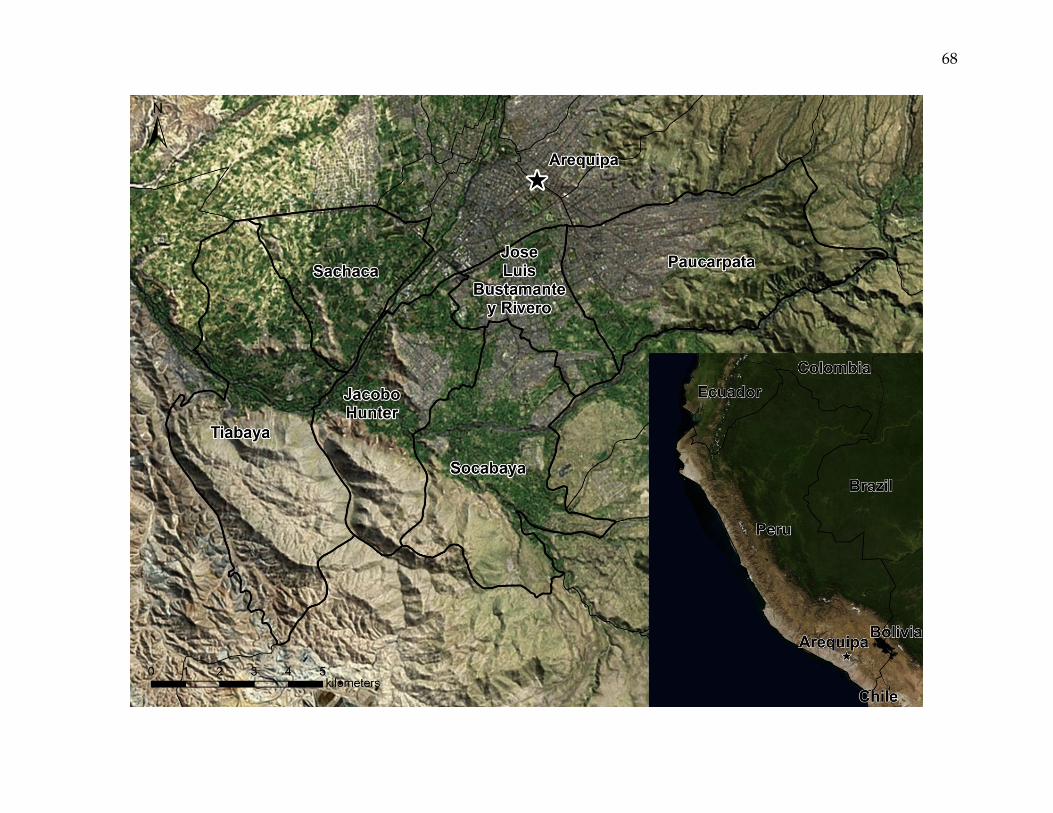
Figure 1. The Arequipa, Peru, study area.
Satellite imagery of the six study area districts, the city of Arequipa, and the surrounding area. The inset map shows the
locations of Arequipa, Peru, and bordering areas. The study area encompasses a mosaic of urban, peri-urban, and rural
landscapes.
68
69
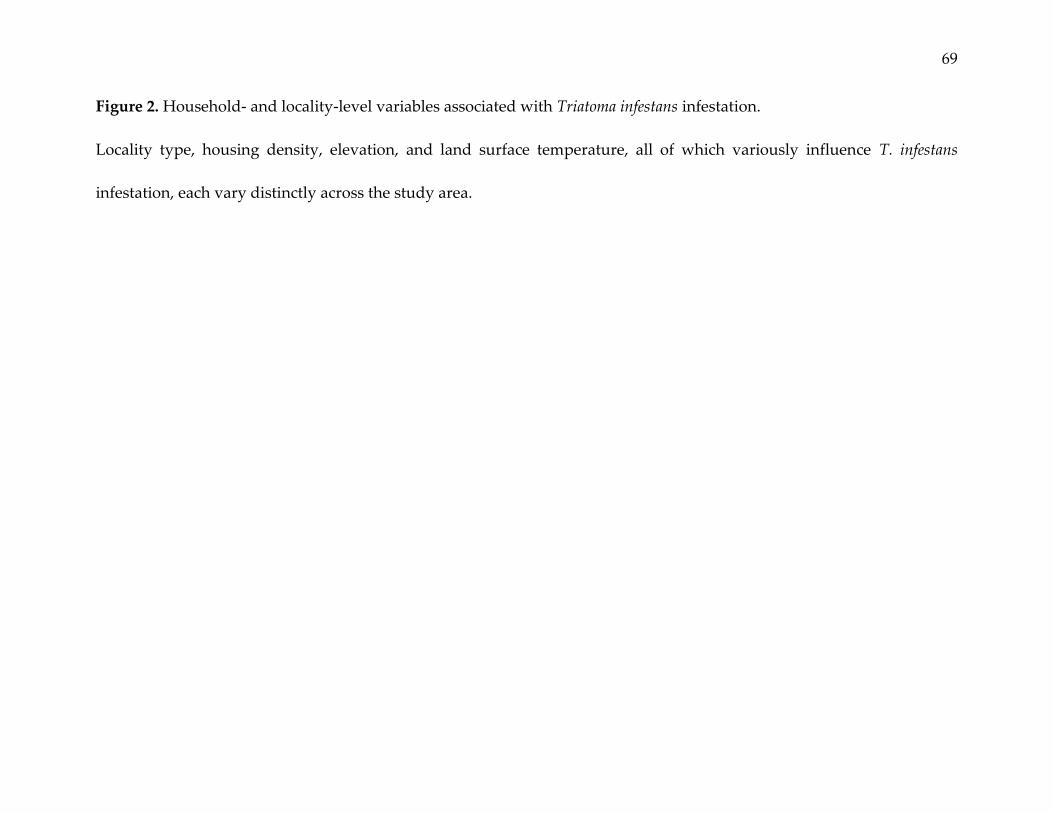
Figure 2. Household- and locality-level variables associated with Triatoma infestans infestation.
Locality type, housing density, elevation, and land surface temperature, all of which variously influence T. infestans
infestation, each vary distinctly across the study area.
70
71
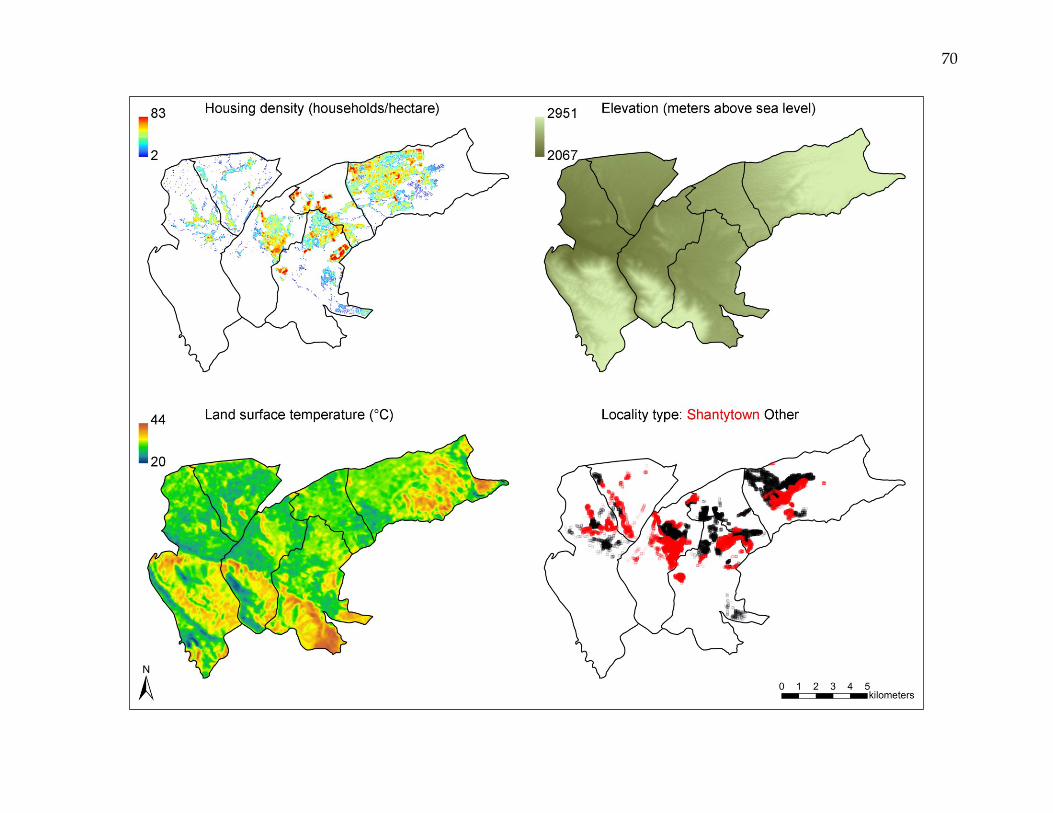
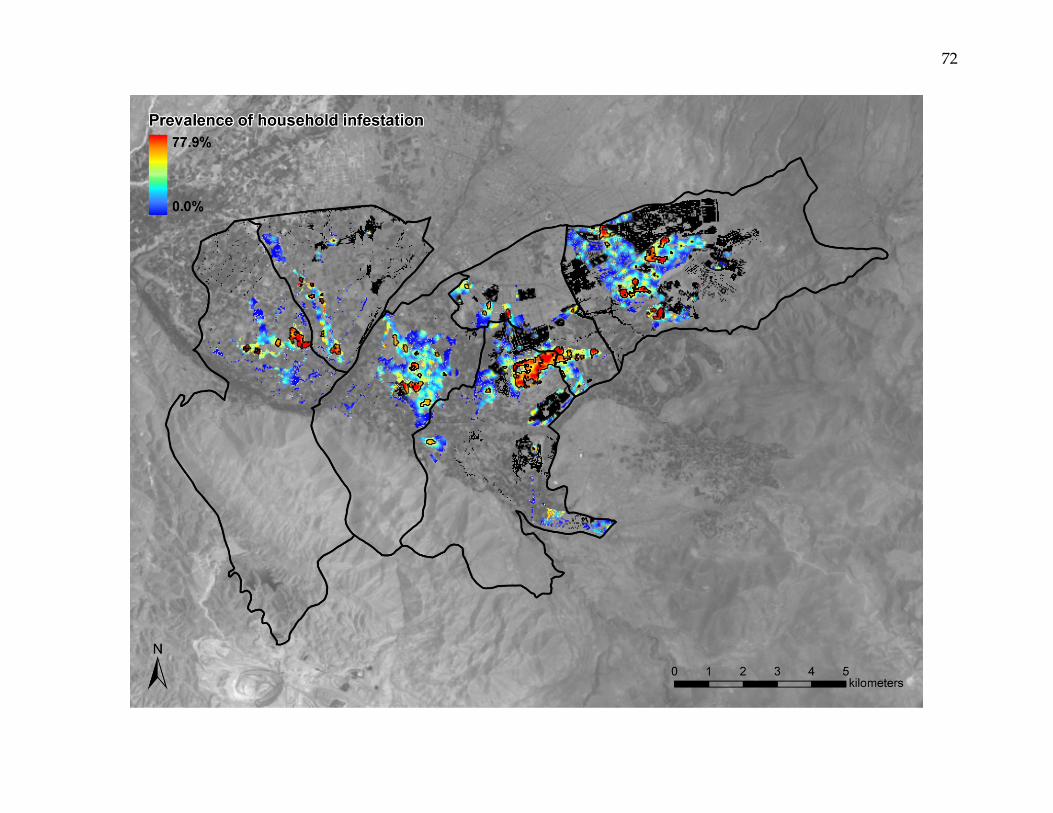
Figure 3. Kernel-smoothed prevalence of household Triatoma infestans infestation.
Spatially smoothed prevalence of household infestation varied from 0.0 – 77.9% across the study area. Infestation clusters
are outlined in black. Black pixels represent areas where households were mapped, but had not undergone inspection and
insecticide application. Household T. infestans infestation was characterized by areas of both very high and very low
intensity, with numerous clusters infestation, some of which encompassed large areas and many households.
72
73
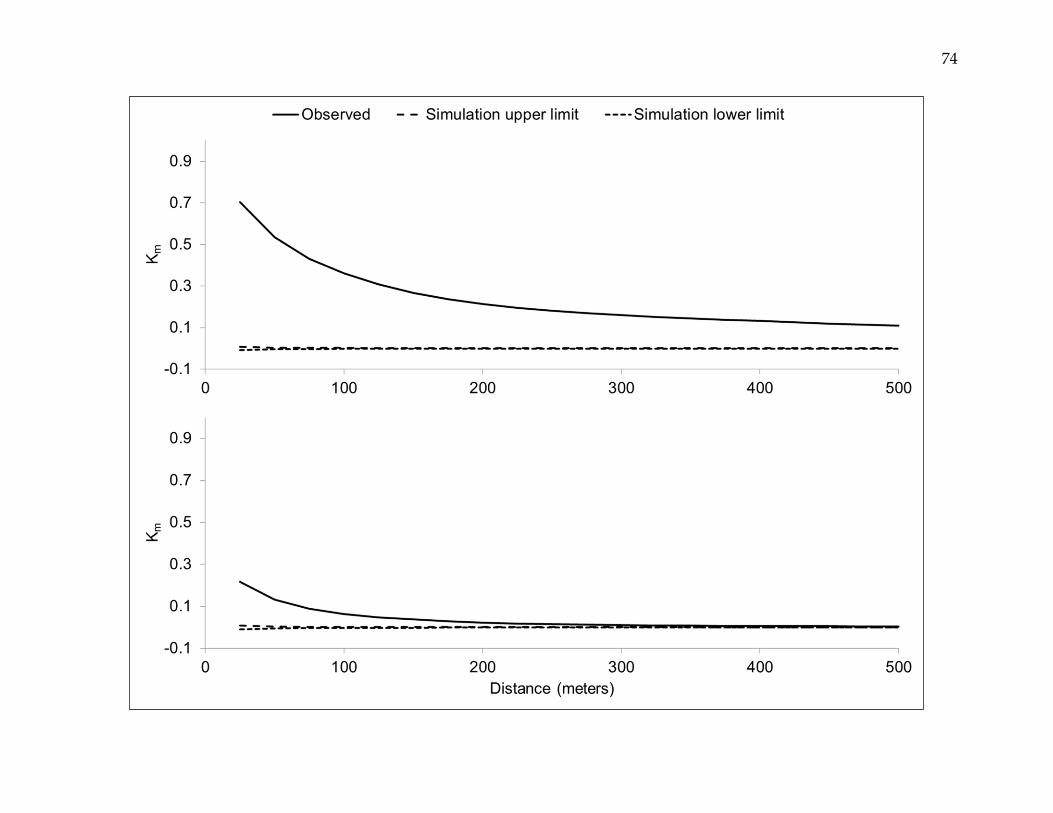
Figure 4. Spatial autocorrelation in deviance residuals for least- and best-fit regression models.
Comparison of spatial autocorrelation in the deviance residuals from the ordinary multivariate logistic regression model
(upper panel) versus the best-fit multilevel logistic regression model (lower panel).The mark correlation function (Km)
may vary between -1 (negative spatial autocorrelation) and +1 (positive spatial autocorrelation), with an expected value of
0 for no spatial autocorrelation. Spatial autocorrelation was substantially reduced, albeit not eliminated, in multilevel
versus ordinary logistic regression.
74
75
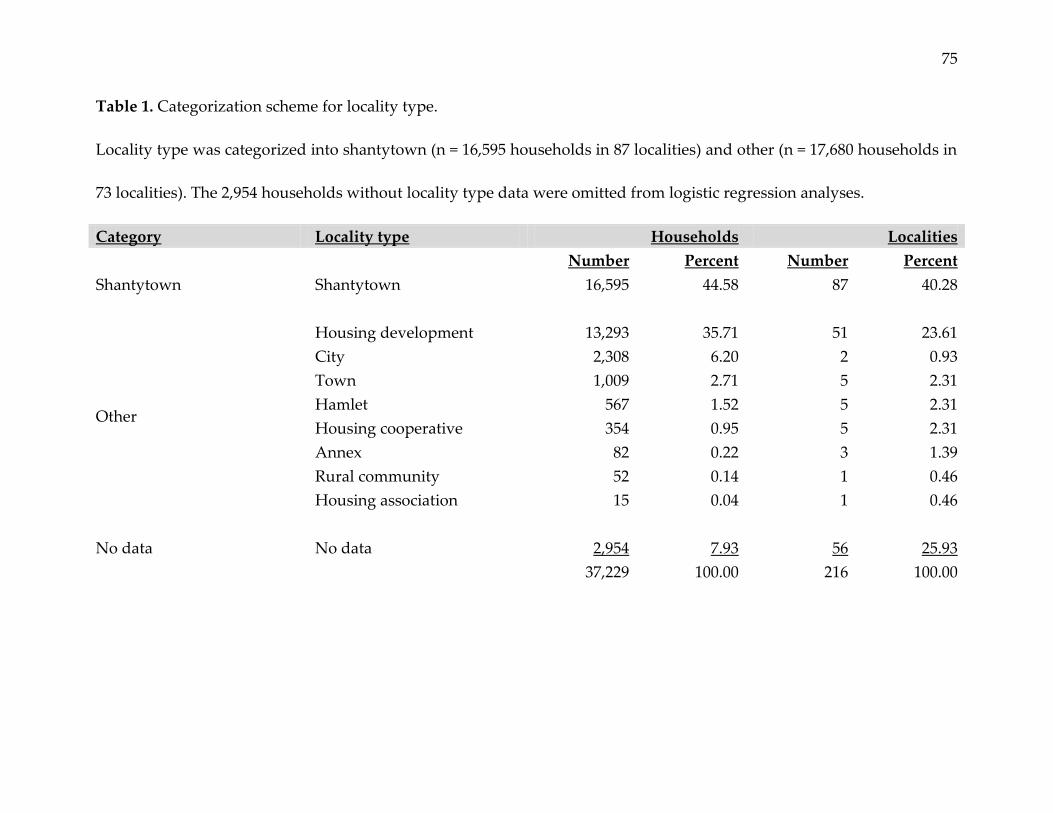
Table 1. Categorization scheme for locality type.
Locality type was categorized into shantytown (n = 16,595 households in 87 localities) and other (n = 17,680 households in
73 localities). The 2,954 households without locality type data were omitted from logistic regression analyses.
Category Locality type Households Localities
Number Percent Number Percent
Shantytown Shantytown 16,595 44.58 87 40.28
Other
Housing development 13,293 35.71 51 23.61
City 2,308 6.20 2 0.93
Town 1,009 2.71 5 2.31
Hamlet 567 1.52 5 2.31
Housing cooperative 354 0.95 5 2.31
Annex 82 0.22 3 1.39
Rural community 52 0.14 1 0.46
Housing association 15 0.04 1 0.46
No data No data 2,954 7.93 56 25.93
37,229 100.00 216 100.00
76
Table 2. Results of univariate and multivariate logistic regression.
Univariate logistic regression Multivariate logistic regression
Range Inspected Infested Odds ratio 95% CI Odds ratio 95% CI
Housing density (households/hectare)
2 – 24* 6,866 831 1.00 1.00
24 – 30 6,855 1,148 1.46 1.33 – 1.61 1.38 1.26 – 1.53
30 – 34 6,848 1,434 1.92 1.75 – 2.11 1.79 1.63 – 1.97
34 – 39 6,861 1,582 2.18 1.99 – 2.39 2.02 1.84 – 2.22
39 – 77 6,845 1,534 2.10 1.91 – 2.30 1.90 1.73 – 2.09
Land surface temperature (C)
26 – 40 34,275 6,529 1.08 1.06 – 1.10 1.10 1.08 – 1.12
Elevation (meters above sea level)
2,120 – 2,260* 6,866 1,085 1.00 1.00
2,260 – 2,300 6,996 1,089 0.98 0.90 – 1.08 0.82 0.74 – 0.90
2,300 – 2,350 6,716 1,526 1.57 1.44 – 1.71 1.31 1.20 – 1.44
2,350 – 2,450 6,852 1,612 1.64 1.50 – 1.79 1.45 1.33 – 1.59
2,450 – 2,670 6,845 1,217 1.15 1.05 – 1.26 1.06 0 .96 – 1.16
*Referent category
95% CI: 95% confidence interval
77
APPENDIX C
PASSIVE SURVEILLANCE OF TRIATOMA INFESTANS REEMERGENCE IN
URBAN AND PERI-URBAN AREQUIPA, PERU
Paper was prepared to submit to PLOS Neglected Tropical Diseases

78
Title
Passive Surveillance of Triatoma infestans Reemergence in Urban and Peri-Urban
Arequipa, Peru
79
Authors and affiliations
Stephen Delgado1,2
María Luz Hancco Pumahunaca3
Michael Z. Levy4
1School of Geography and Development, University of Arizona, 409 Harvill Building,
1103 East 2nd Street, Tucson, Arizona 85721, USA
2Division of Epidemiology and Biostatistics, University of Arizona, A302 Drachman
Hall, 1295 North Martin Avenue, Tucson, Arizona 85724, USA
3Universidad Peruana Cayetano Heredia, Avenida Honorio Delgado 430, Urbanización
Ingeniería, Lima, Peru
4Department of Biostatistics and Epidemiology, University of Pennsylvania, 819
Blockley Hall, 423 Guardian Drive, Philadelphia, Pennsylvania 19104, USA
80
Abstract
Background: Insecticide interventions have interrupted vector-borne transmission of
Trypanosoma cruzi in many areas in Latin American. However, post-intervention
reemergence of vector insects complicates continuing control of Chagas disease.
Methodology/Principal Findings: Utilizing passive surveillance data from an urban vector
control program in Arequipa, Peru, we conducted statistical and spatial analysis of
Triatoma infestans reemergence after large-scale insecticide intervention. Of 68,849
surveillance area households, 98 (0.14%; 95% CI: 0.11 – 0.17%) experienced and reported
a T. infestans reemergence event during the 12-month period from May 2009 through
April 2010. Multivariate logistic regression modeling showed statistically significant
relationships between reemergence events and prevalence of infestation prior to
primary vector control, prevalence of primary vector control, and time elapsed since
insecticide application. The predicted probability of a reemergence event varied
spatially, with estimated annual incidence rates ranging from 0.01 to 3.85%.
Reemergence events were both clustered and non-clustered, and were spatially
dependent at distances up to 1,600 meters. Event-to-event spatial proximity occurred at
shorter distances in higher risk areas and longer distances in lower risk areas.
81
Conclusions/Significance: While relatively rare, reemergence of T. infestans is a present
and possibly persistent problem in urban and peri-urban Arequipa. Identifiable
predictors and patterns of risk offer opportunities for more effective and efficient
strategies for vector surveillance and control.
82
Introduction
Chagas disease, also known as American trypanosomiasis, is caused by the
protozoan parasite Trypanosoma cruzi and is endemic in Latin America. Typically, T.
cruzi is transmitted to humans via the infected excretions of various blood-feeding
insect species, including Triatoma infestans. The disease is characterized by an acute
phase, which lasts 6 – 8 weeks, and a chronic phase, which persists for life. In most
cases, both the acute and chronic phases of infection are asymptomatic. However, 10 –
40% of cases, depending on the geographic region, progress over a period of years to
chronic disease, including potentially fatal cardiac and gastrointestinal disorders
[WHO, 2002]. Globally, eight million persons are infected with T. cruzi, resulting in
11,000 deaths and the loss of 430,000 disability-adjusted life years (DALYs) annually
[WHO, 2008; WHO, 2010].
Large-scale insecticide interventions are the primary means for prevention and
control of Chagas disease [WHO, 2012]. Triatoma infestans, which lives nearly
exclusively in and around human households, is a principal target for vector control
[WHO, 2002]. While the Southern Cone Initiative has succeeded in interrupting T. cruzi
transmission by T. infestans in Brazil, Chile, and Uruguay [Pinto Dias, 2007; WHO,
2007], T. infestans-mediated T. cruzi transmission persists in parts of Argentina, Bolivia,
Paraguay, and Peru [Moncayo, 2009; Tarleton, 2007]. Throughout the region, post-
83
intervention reemergence of vector insects complicates continuing control of Chagas
disease [WHO, 2010].
While reemergence of T. infestans has been studied extensively in rural
environments, the problem has been investigated only preliminarily in urban contexts.
This study examines reemergence of T. infestans after implementation of a large-scale
insecticide intervention in an urban environment. Our study focuses on Arequipa, Peru,
where an ongoing T. infestans vector control campaign was initiated in 2003. Utilizing
statistical and spatial analysis of data from an urban vector control and surveillance
program, we offer insights into the patterns and predictors of T. infestans reemergence
in an urban context.
The paper is organized into the following sections: Methods, Results, and
Discussion. The Methods section describes the study area, details methods for data
collection, and elaborates methods for data analysis (spatial data preparation, statistical
analysis, regression model evaluation, and spatial point pattern analysis). The Results
section highlights important findings in narrative format, visualizes geographical data
via various figures, and details statistical outcomes in table format. Finally, the
Discussion section interprets study findings, relates these findings to previously
published work, and describes study limitations.

84
Methods
Study area
Arequipa (population 864,250) is situated in southwestern Peru and is the country’s
third most populous province. This study focuses on six of the province’s twenty-nine
districts: Jacobo Hunter, Jose Luis Bustamante y Rivero, Paucarpata, Sachaca, Socabaya,
and Tiabaya. The districts encompass a geographically contiguous area of 139 square
kilometers adjacent to the capital city of Arequipa, and include nearly forty percent of
the province’s population [INEI, 2007] (Figure 1).
In 2003, the Gerencia Regional de Salud de Arequipa (GRSA) initiated a vector
control program, which is implemented on a district-by-district basis. In accordance
with World Health Organization (WHO) guidelines, the program consists of three
phases [WHO, 2002].
Phase one involves preparation for vector control. Key preparatory phase activities
include household coding and mapping.
Phase two comprises primary vector control. GRSA personnel proceed house-to-
house, applying residual pyrethroid insecticide and documenting the presence/absence
of T. infestans. The process is repeated approximately six months later.
Phase three consists of vector surveillance, both active and passive, as well as
ancillary vector control. In active surveillance, GRSA personnel proactively conduct
household searches for T. infestans. Active surveillance focuses on areas not yet reached
85
by primary vector control, as well as areas already reached by primary vector control
but considered at high risk for T. infestans reemergence. In passive surveillance, local
residents simply report the presence of T. infestans in their homes to GRSA surveillance
posts, health posts, or health centers. Whether discovered via active surveillance or
reported via passive surveillance, households experiencing a reemergence event
undergo inspection and insecticide application.
Data collection
Household data. Data were provided by the GRSA and included maps of
household locations, household unique identifier codes, primary vector control data
from September 2003 through December 2008, and passive surveillance data from May
2009 through April 2010. Using GRSA maps and Google Earth imagery, we assigned
geographic coordinates to 68,849 households within the study area. Primary vector
control data indicated whether or not a household received primary vector control; for
those that did, insecticide application dates and whether or not T. infestans was present
were recorded. Passive surveillance data recorded passive surveillance report dates and
confirmed the presence of T. infestans.
The present analysis is limited to passive surveillance reports received by the GRSA
during the 12-month period from May 2009 through April 2010. Households with a
86
passive surveillance report and confirmed presence of T infestans are defined as
reemergence events; otherwise households are defined as non-events.
Data analysis
Spatial data preparation. Two dichotomous variables and one continuous variable
were spatially smoothed for evaluation as explanatory variables in logistic regression.
Household T. infestans infestation status prior to primary vector control (0/1) was
spatially smoothed by dividing the kernel density estimate of infested households by
the kernel density estimate of all primary vector control households. An isotropic
Gaussian smoothing kernel with a standard deviation () of 45.7 meters was utilized for
this analysis, where was selected using a likelihood cross-validation method.
Similarly, household primary vector control status (0/1) was spatially smoothed by
dividing the kernel density estimate of insecticide-treated households by the kernel
density estimate of all surveillance area households, with = 34.8 meters. [Diggle, 1985;
Berman, 1989; Kelsall, 1995; Diggle, 2003]. Time elapsed (years) since household
insecticide application was spatially smoothed using a Nadaraya-Watson smoother,
with = 14.28 meters [Nadaraya, 1964; Watson, 1964, Nadaraya, 1989].
Spatial smoothing was conducted using R version 3.0.0 (The R Project for Statistical
Computing, http://www.r-project.org). Summary statistics for spatially smoothed data
87
were calculated using Stata/IC 12.1 (http://www.stata.com). Maps of spatially smoothed
variables were constructed using ArcGIS version 10.1 (ESRI, http://www.esri.com).
Statistical analysis. The incidence of T. infestans reemergence events during the 12-
month study period was calculated as the number of reemergence events divided by
the number of households within the surveillance area. The chi-square test was utilized
to evaluate the association between T. infestans reemergence events and whether or not
a household received primary vector control.
Counts of T. infestans reemergence events were tabulated by epidemiological week,
and the mean and variance of the number of events per week were calculated. The
variance-to-mean ratio (VMR) was computed to assess temporal variation in
reemergence events, where a VMR value near one indicates a Poisson-distributed
pattern [Cox, 1966].
Univariate logistic regression was used to assess associations between T. infestans
reemergence events and three explanatory variables: (1) spatially smoothed prevalence
of household infestation prior to vector control, (2) spatially smoothed prevalence of
primary vector control, and (3) spatially smoothed time elapsed since household
insecticide application. Backward selection was utilized to specify a multivariate logistic
regression model, with the probability of variable removal equal to 0.05. All variables
evaluated in univariate models remained in the multivariate model.
88
Logistic regression analyses were conducted using Stata/IC 12.1. Because
households without primary vector control lacked data for logistic regression
explanatory variables, analysis was limited to households with primary vector control
(N = 37,229).
Regression model evaluation. Receiver operator characteristic (ROC) analysis
was utilized to assess the accuracy, sensitivity, and specificity of the multivariate
logistic regression model. The area under the curve (AUC) was calculated as a summary
measure of model accuracy. Using predicted probabilities from the multivariate logistic
regression model, each household was classified as an event or non-event, where the
threshold for classification of T. infestans reemergence events and non-events was
estimated using an optimality criterion: minimum((1 – sensitivities)2 + (1 – specificities)2).
The sensitivity and specificity of the classification were calculated, where sensitivity is
the number of correctly classified events divided by the total number of events and
specificity is the number of correctly classified non-events divided by the total number
of non-events. Ten thousand-replicate bootstrap samples were utilized to estimate 95%
confidence intervals for the AUC, sensitivity, and specificity [Carpenter, 2000; Robin,
2011].
Using local maxima from the ROC curve, threshold values were identified to
categorize households as having negligible, low, or elevated risk for incidence of T.
infestans reemergence. The first threshold value was defined by the local maxima below
89
which no reemergence events occurred, and the second threshold value was defined by
the local maxima at which the optimality criterion cutoff was located.
R version 3.0.0 was used for ROC analysis, and ArcGIS version 10.1 was utilized to
construct predicted probability and risk maps.
Spatial point pattern analysis. Kernel density estimate ratio analysis was
employed to detect clusters of T. infestans reemergence events, where the kernel-
smoothed density of event households was divided by the kernel-smoothed density of
all surveillance area households. An isotropic Gaussian smoothing kernel with a
standard deviation () of 27.8 meters was utilized for this analysis, where was
selected using a likelihood cross-validation method. A 999-iteration random labeling
simulation was performed to identify areas where event clusters were statistically
significant at the simulated p ≤ 0.01 level [Kelsall, 1995; Diggle, 2003].
K-function difference analysis was used to detect spatial dependence among
reemergence events, where the K-function for non-event household was subtracted
from the K-function for event households at 100-meter intervals from 0 to 2,000 meters.
A 999-iteration random labeling simulation was executed to identify distances at which
spatial dependence among event households was statistically significant at the
simulated p ≤ 0.001 level [Diggle, 1991].
Nearest neighbor analysis was utilized to evaluate event-to-event proximity. For
each event, the Euclidean distance to its nearest neighbor event was calculated. The
90
Wilcoxon rank-sum test was used to compare inter-event nearest neighbor distances for
events that occurred in low versus elevated risk areas.
Spatial analyses were conducted using R version 3.0.0, and Stata/IC 12.1 was utilized
for statistical analyses.
91
Results
Of the 68,849 surveillance area households, 98 (0.14%; 95% CI: 0.11 – 0.17%) T.
infestans reemergence events occurred during the 12-month period from May 2009
through April 2010. This equates to an annual incidence rate of 14 reemergence events
per 10,000 households. Of the 37,229 households that received primary vector control,
57 (0.15%) suffered a reemergence event, while among the 31,620 households that did
not receive primary vector control, 41 (0.13%) experienced a reemergence event (χ2 =
0.6610, df = 1, p = 0.416) (Figure 2).
The number of weekly T. infestans reemergence events ranged from zero to five, with
mean equal to 1.85 events per week and variance equal to 1.75. The variance-to-mean
ratio was 0.95, suggesting no evidence of temporal clustering of reemergence events.
Spatially smoothed prevalence of T. infestans infestation prior to primary vector
control ranged from 0.0 to 77.9% (median = 16.1%; IQR: 5.8 – 29.3%), and spatially
smoothed prevalence of primary vector control ranged from near zero to 100.0%
(median = 90.9%; IQR: 81.0 – 95.7%). Spatially smoothed time elapsed since household
insecticide application ranged from 1.3 to 6.4 years (median = 3.7 years; IQR: 2.2 – 5.2
years) (Figure 3).
Multivariate logistic regression showed statistically significant associations between
the probability of a T. infestans reemergence event and prevalence of household
infestation prior to vector control, prevalence of primary vector control, and time
92
elapsed since household insecticide application. Households in areas with higher
prevalence of T. infestans infestation prior to vector control were associated with higher
odds of experiencing a reemergence event. Conversely, households in areas with higher
prevalence of primary vector control were associated with lower odds of suffering a T.
infestans reemergence event. Odds of experiencing a reemergence event increased
substantially with time elapsed since household insecticide application (Table 1).
The predicted probability of a reemergence event ranged from 0.01% to 3.85%
(median = 0.10%; IQR: 0.04 – 0.23%) (Figure 4). Receiver operator characteristic analysis
yielded an AUC of 0.76 (95% CI: 0.70 – 0.82). The optimal threshold for correct
classification of events and non-events corresponded to a predicted probability of
0.21%. Using this threshold value, classification sensitivity was 77.19% (95% CI: 66.67 –
87.72%) and specificity was 71.65% (95% CI: 71.19 – 72.10%).
The elevated risk category for T. infestans reemergence accurately identified more
than three-fourths of the events, while simultaneously reducing the surveillance sample
to approximately one-fourth of all households. Conversely, the negligible risk category
encompassed one-eighth of surveillance area households, none of which reported a
reemergence event (Table 2, Figure 5).
Twenty-nine (29.6%) of the 98 reemergence events were spatially clustered at the
simulated p ≤ 0.01 level. Clusters contained as few as one and as many as seven events,
and each cluster covered an area of less than one hectare (Figure 6). The K-function
93
difference for events versus non-events was statistically significant at the simulated p ≤
0.001 level at distances up to 1,600 meters, but not from 1,600 to 2,000 meters.
For all T. infestans reemergence events, the median inter-event nearest neighbor
distance was 86 meters (IQR: 23 – 420 meters). However, the median inter-event nearest
neighbor distance for events located in elevated risk areas was 44 meters (IQR: 19 – 97
meters), compared to 197 meters (IQR: 30 – 489 meters) for events located in low risk
areas (p = 0.0134) (Figure 7).
94
Discussion
Large-scale insecticide interventions, most notably the Southern Cone Initiative,
have succeeded in interrupting T. cruzi transmission by T. infestans in Brazil, Chile, and
Uruguay [Pinto Dias, 2007; WHO, 2007]. However, T. infestans-mediated T. cruzi
transmission persists in parts of Argentina, Bolivia, Paraguay, and Peru [Moncayo,
2009; Tarleton, 2007]. Throughout the region, post-intervention reemergence of vector
insects complicates continuing control of Chagas disease [WHO, 2010]. While
reemergence of T. infestans has been studied extensively in rural contexts, the problem is
less well understood in the urban milieu. Utilizing statistical and spatial analysis of data
from an urban vector control and surveillance program, we offer insights into the
patterns and predictors of T. infestans reemergence in an urban context.
Based on passive surveillance data, low-level reemergence of T. infestans is occurring
in urban and peri-urban Arequipa. Multivariate logistic regression produced an
ecologically plausible and reasonably informative model of T. infestans reemergence.
Risk of reemergence increased moderately in areas with higher infestation prior to
primary vector control, and risk increased substantially with time elapsed since the
initial insecticide intervention. Conversely, risk was lower in areas with higher
prevalence of primary vector control.
Spatial visualization of multivariate logistic regression predicted probabilities
highlights how risk is differentially distributed across the surveillance area.
95
Operationally, however, a categorical rather than continuous measure of risk may be
more useful. Using ROC curve analysis, we offer a simple categorization schema that
minimizes the area with maximal risk, and maximizes the area with minimal risk. By
parsing risk, surveillance strategies may be more appropriately targeted and resources
more efficiently allocated.
Simple spatial statistics may be utilized to further refine surveillance and control
strategies. Nearest neighbor analysis of event-to-event distances revealed that
reemergence events in lower risk areas tend to be less spatially clustered, while events
in higher risk areas tend to be more spatially clustered. As such, reemergence events
arising in higher risk areas would warrant a more aggressive response, while events
occurring in lower risk areas might merit a less assertive response. An operational
paradigm consisting of three strategies—eradication, mass attack, or positive
response—has been proposed. In the eradication strategy, all houses within a locality
are sprayed with insecticide in response to even one (re-)emergence event. In the mass
attack strategy, all houses within a locality are sprayed if more than 5% of houses
experience events, otherwise only event houses are sprayed. In the positive response
strategy, only event houses are sprayed [Schofield, 2000]. Risk might reasonably dictate
strategy selection. Specifically, the eradication strategy might be applied in higher risk
areas, the mass attack strategy in moderate risk areas, and the positive response
strategy in lower risk areas. Furthermore, a locality might be defined operationally
96
based on the distribution of event-to-event nearest neighbor distances within each risk
stratum.
Spatial patterns can yield important insights into the processes of reemergence.
Spatially clustered reemergence events suggest that household-to-household dispersion
of T. infestans is occurring. Spatial dependence among reemergence events at distances
up to 1,600 meters further suggests that insects are actively dispersing at both shorter
and longer distances. In rural environments, T. infestans can crawl or fly distances up to
100 or 2,000 meters, respectively [Vazquez-Prokopec, 2004; Schofield, 1992]. An
improved understanding of insect dispersal in urban environments might improve
rational strategies for surveillance and control of vector reemergence in urban areas.
While spatial patterns in T. infestans reemergence were apparent in Arequipa, no
evidence of temporal variation was found. In contrast, seasonal variation in
reemergence of T. infestans has been observed in rural northwest Argentina, with higher
reemergence rates from May to November than from November to May [zu Dohna,
2009]. However, the Argentina study was conducted over five years in a rural
landscape, while the present study was executed over one year in an urban context.
Longer-term data will be required to determine if seasonal variation is detectable in
urban Arequipa.
We acknowledge that our study has numerous limitations. First, we utilized passive
but not active surveillance data. Reporting of vector (re-)emergence by household

97
inhabitants is considered more sensitive than household inspection, especially when
insect densities are low [Moncayo, 2009]. Due to concerns about misclassification bias,
and other potential biases associated with active surveillance, analysis was limited to
passive surveillance data. Second, we recognize that surveillance data likely
underestimate the true incidence of reemergence events, as an event must be both
noticed and reported for it to be recorded. Third, a substantial proportion of
reemergence events occurred in households without primary vector control and
therefore lacked explanatory variable data. These households were therefore excluded
from logistic regression analysis. As such, risk estimates for T. infestans reemergence are
limited to households with primary vector control. Finally, the study period was
relatively short and reemergence events were relatively rare. Longer-term analyses may
yield more robust risk estimates and may elucidate temporal and/or spatial patterns not
detected in the present analysis.
Insecticide interventions have been substantially successful in interrupting vector-
borne T. cruzi transmission in much of Latin America. Reemergence of vector insects
remains a concern, however. As populations swell, and financial and political
commitments subside, successful public health interventions will require both efficacy
and efficiency. Readily accessible tools (e.g., Google Earth, The R Project for Statistical
Computing) and routinely collected data (e.g., health and environmental surveillance
data) offer opportunities to maximize impact and innovation at minimal expense.

98
Acknowledgements
We gratefully acknowledge the invaluable contributions of the following institutions.
The Gerencia Regional de Salud de Arequipa (GRSA) conducted vector surveillance
and control and shared these data with us. The Tropical Medicine Research Center
(TMRC) Peru working group conducted household georeferencing and assisted with
database management. The Ministerio de Salud del Perú (MINSA), Dirección General
de Salud de las Personas (DGSP), Estrategia Sanitaria Nacional de Prevención y Control
de Enfermedades Metaxénicas y Otras Transmitidas por Vectores (ESNPCEMOTVS),
Dirección General de Salud Ambiental (DIGESA); Gobierno Regional de Arequipa; Pan
American Health Organization (PAHO); and Canadian International Development
Agency (CIDA) provided financial, logistical, and technical support. ASTER GDEM is a
product of METI and NASA.
99
References
Berman M, Diggle P (1989) Estimating weighted integrals of the second-order intensity
of a spatial point process. Journal of the Royal Statistical Society, Series B 51: 81-92.
Carpenter J, Bithell J (2000) Bootstrap confidence intervals: when, which, what? A
practical guide for medical statisticians. Statistics in Medicine 19: 1141–1164.
Cox DR, Lewis PAW (1966) The statistical analysis of series of events. London:
Metheun.
Diggle PJ (1985) A kernel method for smoothing point process data. Applied Statistics
34: 138-147.
Diggle PJ, Chetwynd AG (1991) Second-order analysis of spatial clustering for
inhomogeneous populations. Biometrics 47: 1155-1163.
Diggle PJ (2003) Statistical analysis of spatial point patterns (Second edition). London:
Arnold. 168 p.
Instituto Nacional de Estadística e Informática del Perú (2007) XI Censo de Población y
VI de Vivienda 2007. http://www.inei.gob.pe.
Kelsall JE, Diggle PJ (1995) Non-parametric estimation of spatial variation in relative
risk. Statistic in Medicine 14: 2335-2342.
Moncayo A, Silveira AC (2009) Current epidemiologic trends for Chagas disease in
Latin America and future challenges in epidemiology, surveillance and health policy.
Mem Inst Oswaldo Cruz 104: 17-30.
Nadaraya EA (1964) On estimating regression. Theory of Probability and Its
Applications 9: 141-142.
Nadaraya EA (1989) Nonparametric estimation of probability densities and regression
curves. Dordrecht, Netherlands: Kluwer Academic Publishers.
100
Pinto Dias JC (2007) Southern Cone Initiative for the elimination of domestic
populations of Triatoma infestans and the interruption of transfusional Chagas
disease. Historical aspects, present situation, and perspectives. Mem Inst Oswaldo Cruz
102: 11-18.
Robin X, Turck N, Hainard A, Tiberti N, Lisacek F, Sanchez J-C, Müller M (2011) pROC:
an open source package for R and S+ to analyze and compare ROC curves. BMC
Bioinformatics 12: 77.
Schofield CJ, Lehane MJ, McEwen PK, Catalá S, Gorla DE (1992) Dispersive flight by
Triatoma infestans under natural climatic conditions in Argentina. Med Vet Entomol 6:
51-56.
Schofield CJ (2000) Challenges of Chagas disease vector control in Central America:
Position paper. Global Collaboration for Development of Pesticides for Public Health
(GCDPP), World Health Organization Communicable Disease Control, Prevention and
Eradication, WHO Pesticide Evaluation Scheme (WHOPES).
Tarleton RL, Reithinger R, Urbina JA, Kitron U, Gürtler RE (2007) The challenges of
Chagas disease – Grim outlook of glimmer of hope? PLoS Medicine 4: e332.
Vazquez-Prokopec GM, Ceballos LA, Kitron U, Gürtler RE (2004) Active dispersal of
natural populations of Triatoma infestans (Hemiptera: Reduviidae) in rural
northwestern Argentina. J Med Entomol 41: 614–21.
Watson GS (1964) Smooth regression analysis. Sankhya A 26: 359-372.
World Health Organization (2002) Control of Chagas disease: Second report of the
WHO expert committee. Geneva: World Health Organization.
World Health Organization (2007) Reporte del grupo de trabajo científico sobre la
enfermedad de Chagas. Geneva: World Health Organization.
World Health Organization (2008) The global burden of disease: 2004 update. Geneva:
World Health Organization.
World Health Organization (2010) Chagas disease: Control and elimination (Report by
the Secretariat). Geneva: World Health Organization.

101
World Health Organization (2012) Accelerating work to overcome the global impact of
neglected tropical diseases – A roadmap for implementation. Geneva: World Health
Organization.
zu Dohna H, Cecere MC, Gürtler RE, Kitron U, Cohen JE (2009) Spatial re-establishment
dynamics of local populations of vectors of Chagas disease. PLoS Negl Trop Dis 3: e490.

102
Figure 1. The Arequipa, Peru, study area.
The satellite image shows the six study area districts, the city of Arequipa, and the surrounding area. The inset map
indicates the locations of Arequipa, Peru, and bordering areas. The study area encompasses a mosaic of urban, peri-
urban, and rural landscapes.
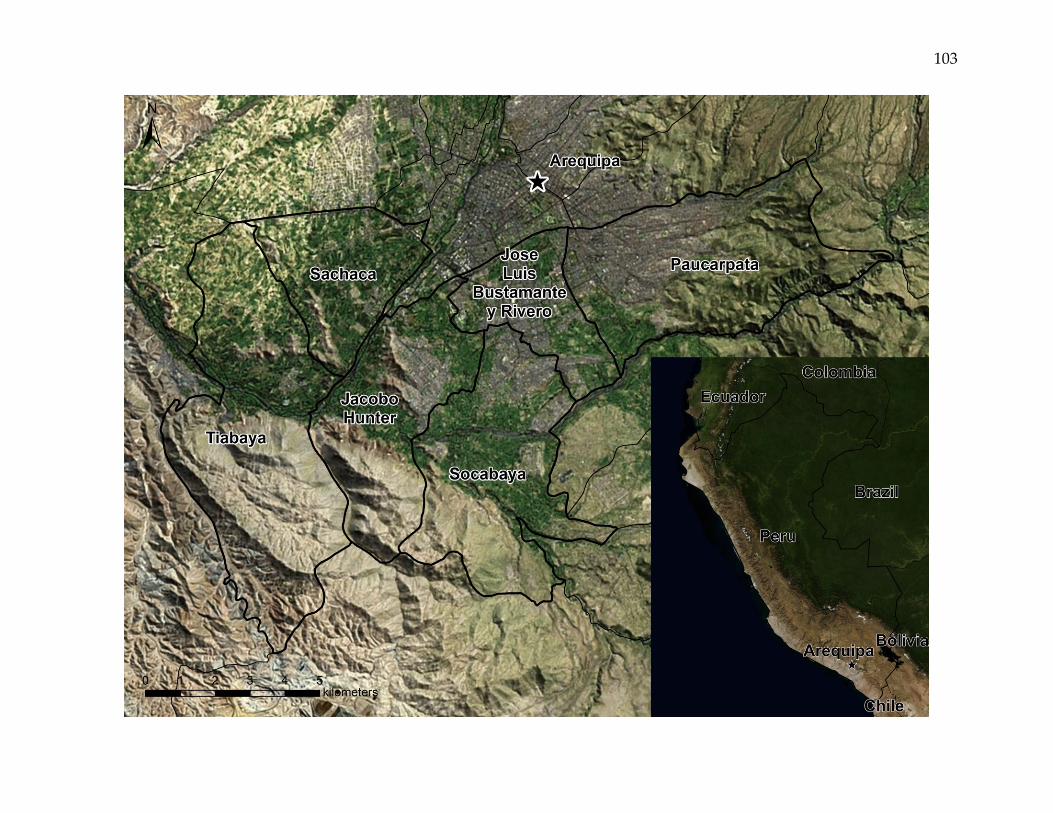
103
104
Figure 2. Surveillance area and locations of Triatoma infestans reemergence events.
The image shows the locations of the 98 households with T. infestans reemergence events during the 12-month period
from May 2009 through April 2010. Black triangles indicate houses that received primary vector control (n = 57), while red
triangles indicate those that did not (n = 41). Each of the six surveillance area districts experienced multiple T. infestans
reemergence events during the 12-month study period.
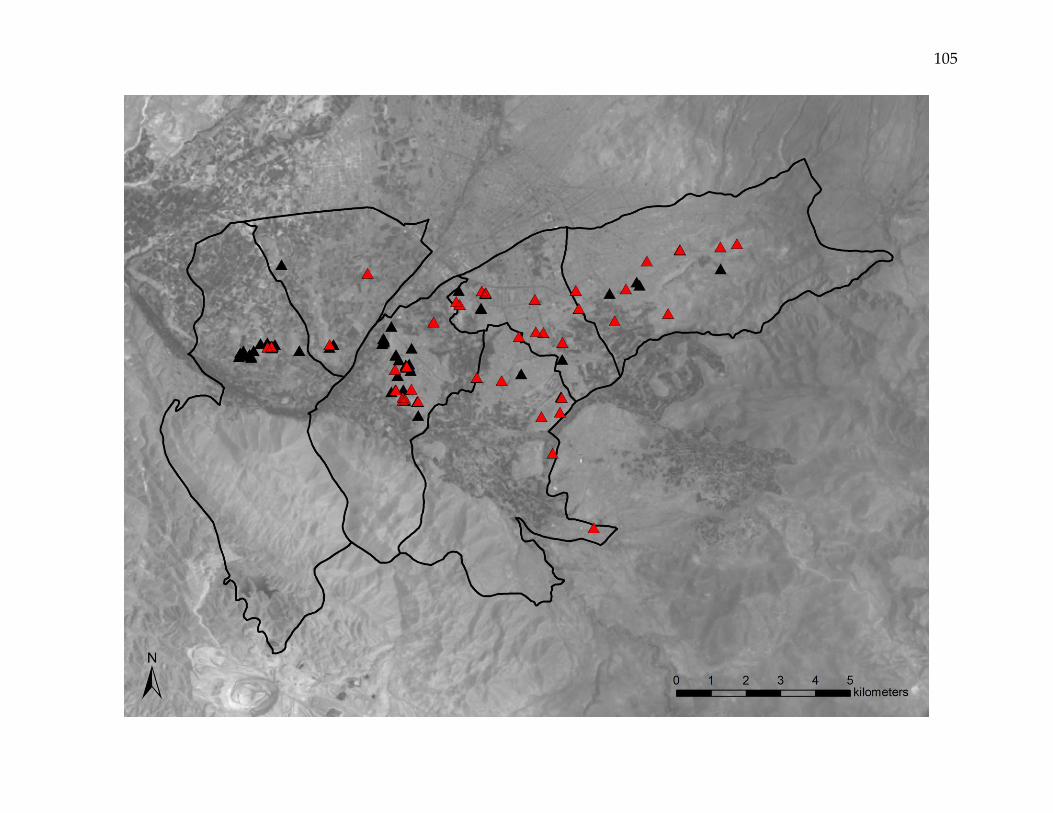
105
106
Figure 3. Locations of Triatoma infestans reemergence events and spatial distributions of multivariate logistic regression
model explanatory variables.
The panels show the locations of T. infestans reemergence events and explanatory variables included in multivariate
logistic regression analysis. Analysis was limited to households that received primary vector control (black triangles, n =
57). Prevalence of infestation prior to vector control, prevalence of primary vector control, and time elapsed since
insecticide application, all of which variously influence incidence of T. infestans reemergence events, each vary distinctly
across the study area.
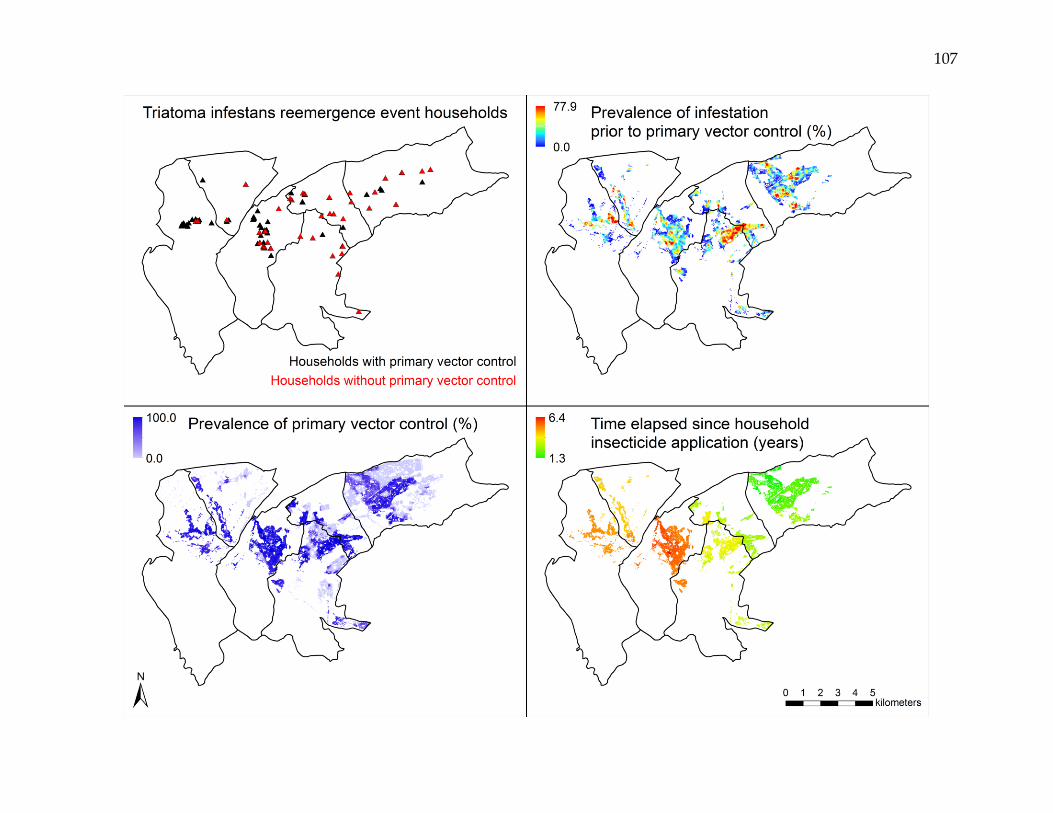
107

108
Figure 4. Map of multivariate logistic regression model predicted probabilities of Triatoma infestans reemergence events.
The predicted probabilities of T. infestans reemergence varied across the surveillance area, and were generally higher in
the three western-most districts.
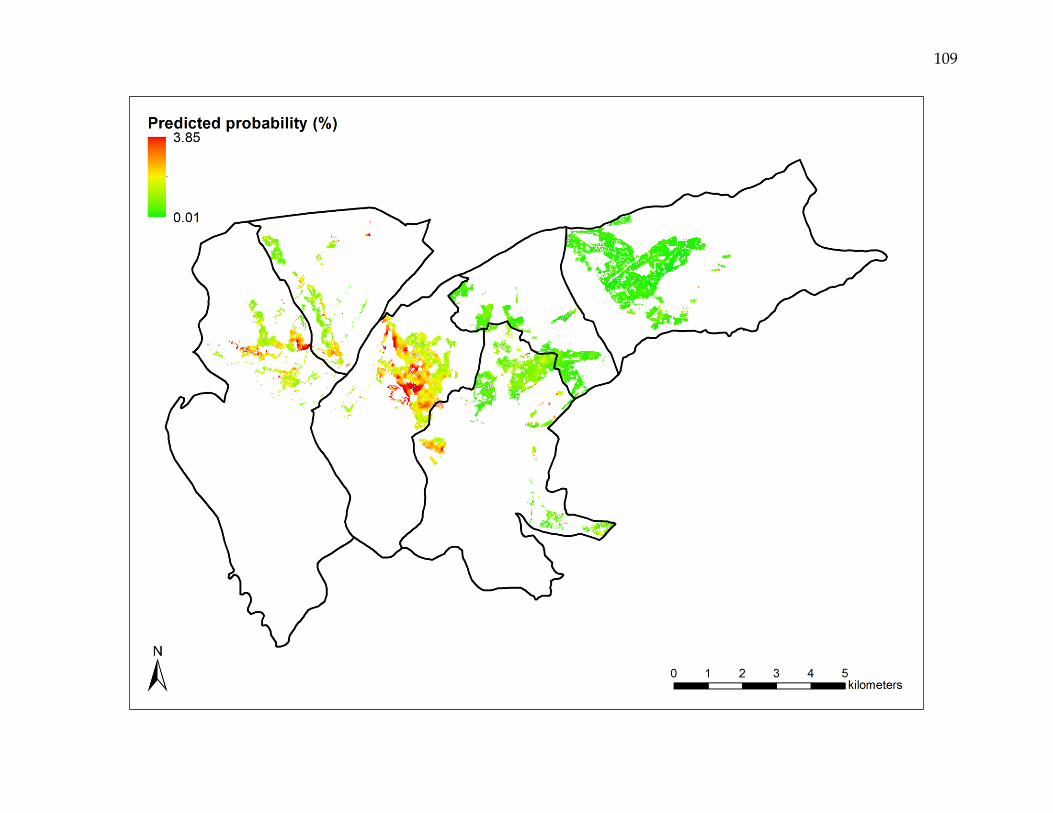
109
110
Figure 5. Risk map for Triatoma infestans reemergence.
Elevated risk of T. infestans reemergence was generally concentrated in the three western-most districts, while the more
eastern districts were generally characterized by low to negligible risk.
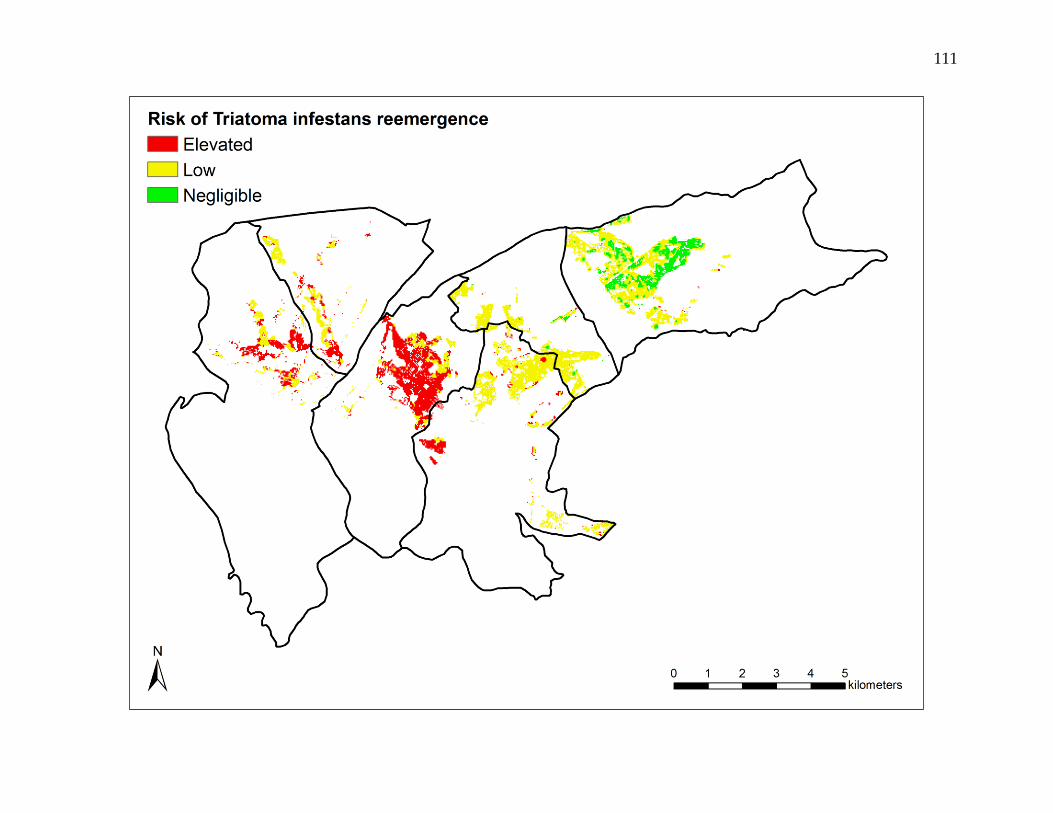
111
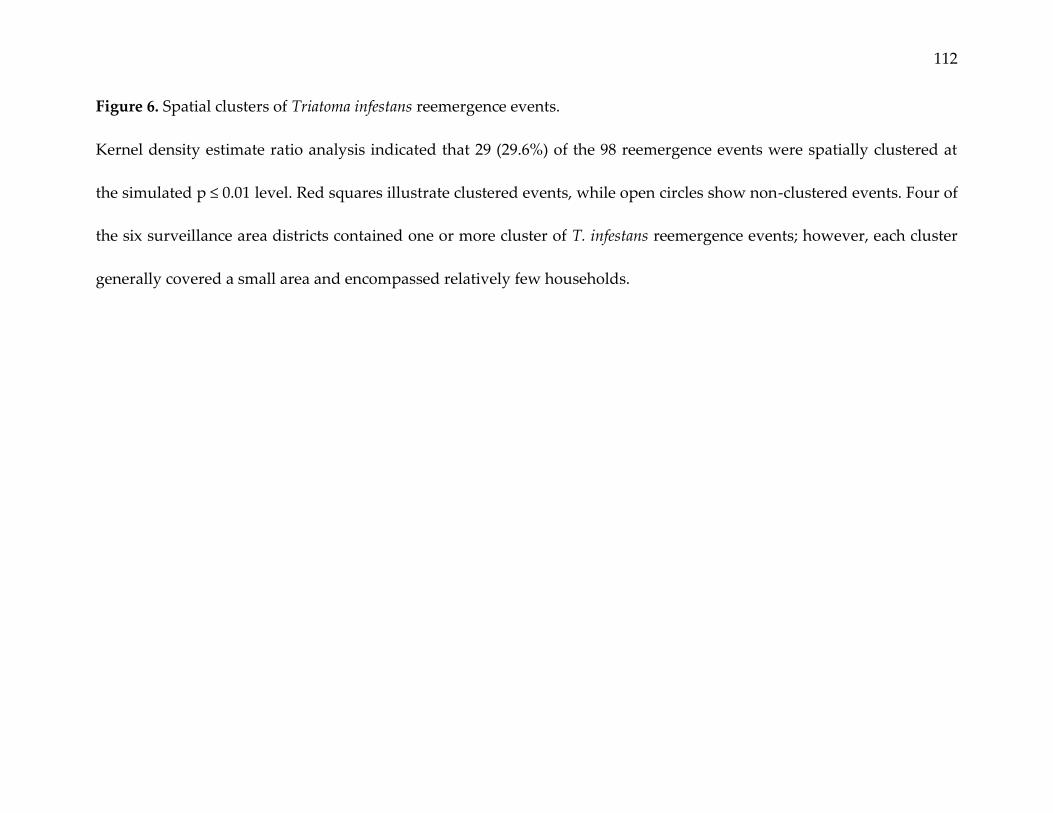
112
Figure 6. Spatial clusters of Triatoma infestans reemergence events.
Kernel density estimate ratio analysis indicated that 29 (29.6%) of the 98 reemergence events were spatially clustered at
the simulated p ≤ 0.01 level. ed squares illustrate clustered events, while open circles show non-clustered events. Four of
the six surveillance area districts contained one or more cluster of T. infestans reemergence events; however, each cluster
generally covered a small area and encompassed relatively few households.
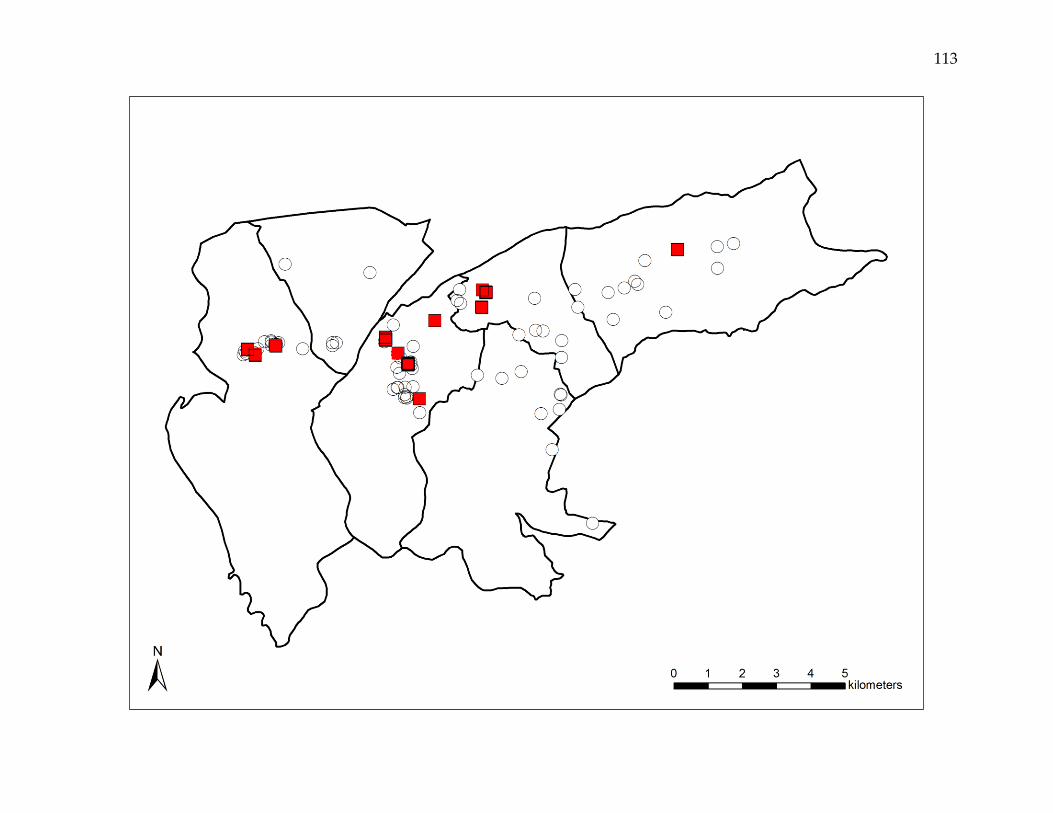
113

114
Figure 7. Box plots comparing inter-event nearest neighbor distances for Triatoma infestans reemergence events located in
low versus elevated risk areas.
In elevated risk areas, T. infestans reemergence events tended to be situated in close proximity to one another, while in
low risk areas, reemergence events tended to be located at farther distances from one another.
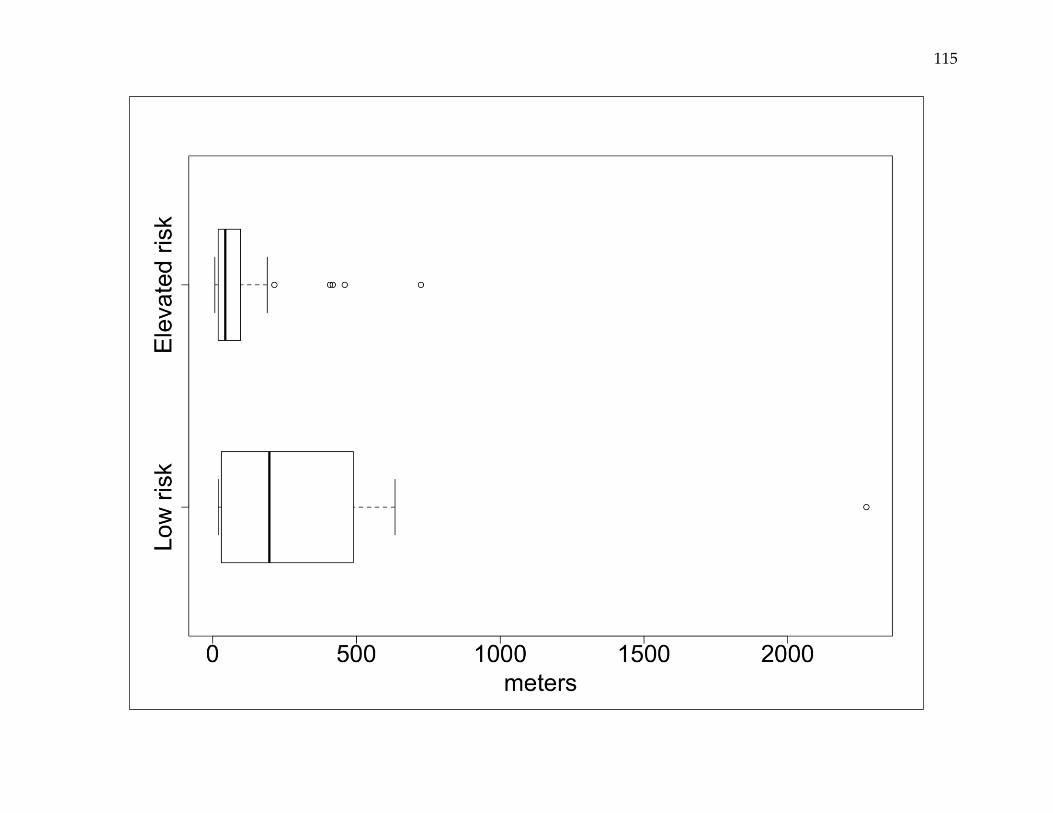
115
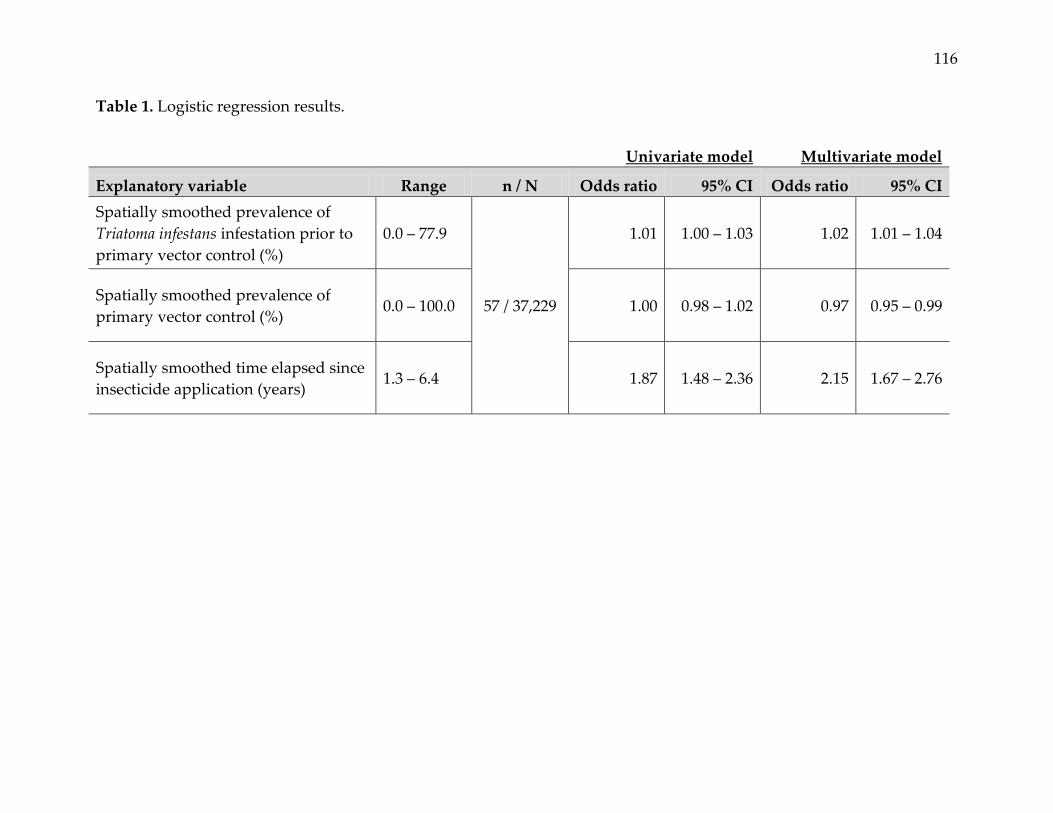
116
Table 1. Logistic regression results.
Univariate model Multivariate model
Explanatory variable Range n / N Odds ratio 95% CI Odds ratio 95% CI
Spatially smoothed prevalence of
Triatoma infestans infestation prior to
primary vector control (%)
0.0 – 77.9
57 / 37,229
1.01 1.00 – 1.03 1.02 1.01 – 1.04
Spatially smoothed prevalence of
primary vector control (%) 0.0 – 100.0 1.00 0.98 – 1.02 0.97 0.95 – 0.99
Spatially smoothed time elapsed since
insecticide application (years) 1.3 – 6.4 1.87 1.48 – 2.36 2.15 1.67 – 2.76
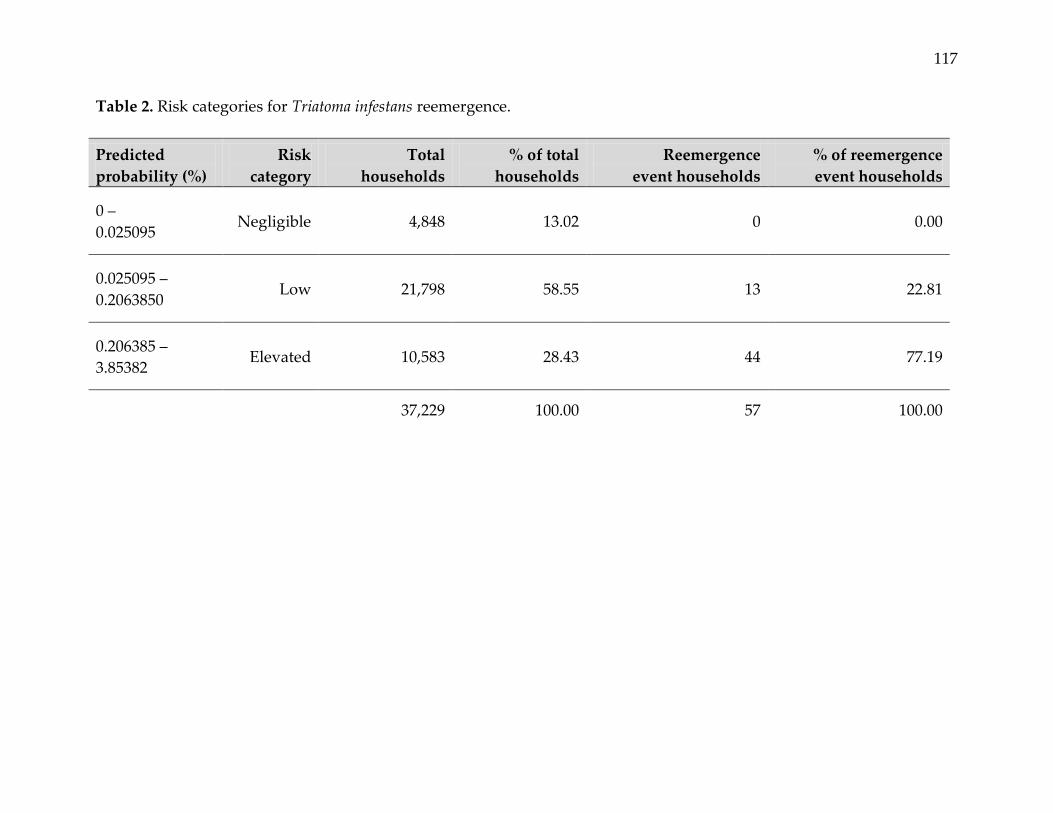
117
Table 2. Risk categories for Triatoma infestans reemergence.
Predicted
probability (%)
Risk
category
Total
households
% of total
households
Reemergence
event households
% of reemergence
event households
0 –
0.025095 Negligible 4,848 13.02 0 0.00
0.025095 –
0.2063850 Low 21,798 58.55 13 22.81
0.206385 –
3.85382 Elevated 10,583 28.43 44 77.19
37,229 100.00 57 100.00