emc vnxe3200 capacity and performance metrics · this white paper discusses the capacity and...
TRANSCRIPT
White Paper
Abstract
This white paper explains the capacity and performance metrics features available in the EMC VNXe3200 storage system. Information is provided to detail the ability to create custom metrics dashboards to view data, customize viewing options through filters, and export data from the storage system. May, 2014
EMC VNXe3200 CAPACITY AND PERFORMANCE METRICS A DETAILED REVIEW

2 EMC VNXe3200 Capacity and Performance Metrics A Detailed Review
Copyright © 2014 EMC Corporation. All Rights Reserved. EMC believes the information in this publication is accurate as of its publication date. The information is subject to change without notice. The information in this publication is provided “as is.” EMC Corporation makes no representations or warranties of any kind with respect to the information in this publication, and specifically disclaims implied warranties of merchantability or fitness for a particular purpose. Use, copying, and distribution of any EMC software described in this publication requires an applicable software license. For the most up-to-date listing of EMC product names, see EMC Corporation Trademarks on EMC.com. VMware is a registered trademark or trademark of VMware, Inc. in the United States and/or other jurisdictions. All other trademarks used herein are the property of their respective owners. Part Number H13089

3 EMC VNXe3200 Capacity and Performance Metrics A Detailed Review
Table of Contents
Executive Summary ................................................................................................. 4
Introduction ....................................................................................................................... 4
Audience ............................................................................................................................ 4
Terminology ....................................................................................................................... 5
Metrics Overview ..................................................................................................... 6
Metrics Collection Status .................................................................................................... 6
Metrics Database ............................................................................................................... 6
Metrics Data Aging Policy ................................................................................................... 7
Viewing Metrics ....................................................................................................... 8
Unisphere for VNXe ............................................................................................................ 8
System Capacity Page .................................................................................................... 8
System Performance Page ............................................................................................ 11
Unisphere CLI ................................................................................................................... 17
Metrics Service ............................................................................................................. 17
Available Metrics .......................................................................................................... 17
Historical Metrics ......................................................................................................... 18
Real-Time Metrics ......................................................................................................... 19
Conclusion ............................................................................................................ 19
References ............................................................................................................ 19
Appendix A: Available Performance Metrics ............................................................ 20

4 EMC VNXe3200 Capacity and Performance Metrics A Detailed Review
Executive Summary When most people think of their storage environment, they think of large-capacity drives grouped together with their company’s data spread out across these drives. Over the last several years, there has been a large push to use advanced data services with this storage, such as Thin Provisioning, File Deduplication, and Compression. In addition, the storage environments include connectivity to different networks so that storage can be presented to servers and clients. With these complex storage environment configurations, it is often difficult for storage administrators to pinpoint the source of a problem. Storage administrators often must leverage different metrics to diagnose issues or perform routine maintenance on their storage environments.
EMC's VNXe3200 storage systems address these concerns by providing storage administrators the ability to view capacity and performance metrics within the Unisphere for VNXe and Unisphere CLI interfaces. With this information, storage administrators will have the ability to analyze their storage system’s performance and capacity details. All of which can be useful when diagnosing or troubleshooting issues, planning for future initiatives, or forecasting future needs within their storage environment.
Introduction
This white paper discusses the capacity and performance metrics available in EMC’s VNXe3200 storage systems. It describes the different ways a user can easily view and gather metrics data from their storage system.
This paper also describes different metrics features and functionality available and provides general guidelines for using these features. More information can be found in the Unisphere Online Help and the Unisphere CLI documentation.
Audience
This white paper is intended for EMC customers, partners, and employees who are considering the use of capacity and performance metrics for their VNXe3200 storage systems. It is assumed that the reader is at least an IT generalist who has experience as a system or network administrator.

5 EMC VNXe3200 Capacity and Performance Metrics A Detailed Review
Terminology
Bandwidth – Maximum amount of data that can be transmitted through a data channel per unit of time. Commonly expressed in Megabytes per second (MB/s).
Common Internet File System (CIFS) – File-sharing protocol based on the Microsoft Server Message Block (SMB). It allows users to share file systems over the Internet and intranets.
Fibre Channel (FC) – Data transfer interface technology allowing data to be transmitted and received simultaneously. Common transport protocols, such as Internet Protocol (IP) and Small Computer Systems Interface (SCSI), run over Fibre Channel. Consequently, a single connectivity technology can support high-speed I/O and networking.
Internet SCSI (iSCSI) – A protocol that provides a mechanism for accessing raw block-level data storage over network connections. The iSCSI protocol is based on the network-standard client/server model with iSCSI initiators (hosts) acting as storage clients and iSCSI targets acting as storage interfaces. Once a connection is established between an iSCSI host and the iSCSI interface, the host requests storage resources and services from the interface.
NAS Server – A VNXe storage server that uses the CIFS or NFS protocol to catalog, organize, and transfer files within designated File System shares. A NAS Server must be available before you can create file-level storage resources such as CIFS or NFS File Systems, or VMware NFS datastores.
Network File System (NFS) –An access protocol that enables users to access files and folders from Linux/UNIX hosts located on a network.
Storage Pool – A collection of disk drives configured with a particular storage profile. The storage profile defines the type of disks used to provide storage and the type of RAID configured on the disks. The storage pool’s configuration defines the number of disks and quantity of storage associated with the pool.
Storage Processor – A hardware component that performs VNXe storage operations such as creating, managing, and monitoring storage resources.
Throughput – In computers, a measurement of the work that can be processed within a set time period. In networking, a measurement of the amount of data that can be successfully transferred within a set time period. Commonly expressed in I/Os per second (IOPS).
Unisphere for VNXe – The web-based user interface for managing VNXe storage systems.
Unisphere CLI (UEMCLI) – The command-line interface for managing VNXe storage systems.

6 EMC VNXe3200 Capacity and Performance Metrics A Detailed Review
Metrics Overview The VNXe3200 storage system provides you with the ability to view historical capacity and performance metrics of your storage system. The capacity and performance metrics are located in the System Capacity and System Performance pages of Unisphere. Using these historical metrics, you can view trends within the capacity data to help determine if you will need to purchase additional drives. You can also use the performance data to diagnose and troubleshoot issues within your storage environment.
Metrics Collection Status
The Metrics Collection Status indicates if your VNXe3200 system is collecting metrics. The Metrics Collection Status only affects the collection of performance metrics; it does not affect the collection of capacity information for your storage resources (including Storage Pools, File Systems, LUNs, VMware datastores, etc.). The Metrics Collection Status can be set to Enabled or Disabled, and it is set to Enabled by default. You can change or view the Metrics Collection Status using Unisphere or Unisphere CLI.
NOTE: Only users with an Administrator user role can change the Metrics Collection Status. Users with any other user role will be unable to change the Metrics Collection Status setting.
Metrics Database
The metrics database that is used to store all the metrics data collected by the system is built on the system drives (located in drive slots 0-3 of your Disk Processor Enclosure). The database is 8 GB in size and this storage space is automatically created by the system. The metrics database settings are not user configurable.
7 EMC VNXe3200 Capacity and Performance Metrics A Detailed Review
Metrics Data Aging Policy
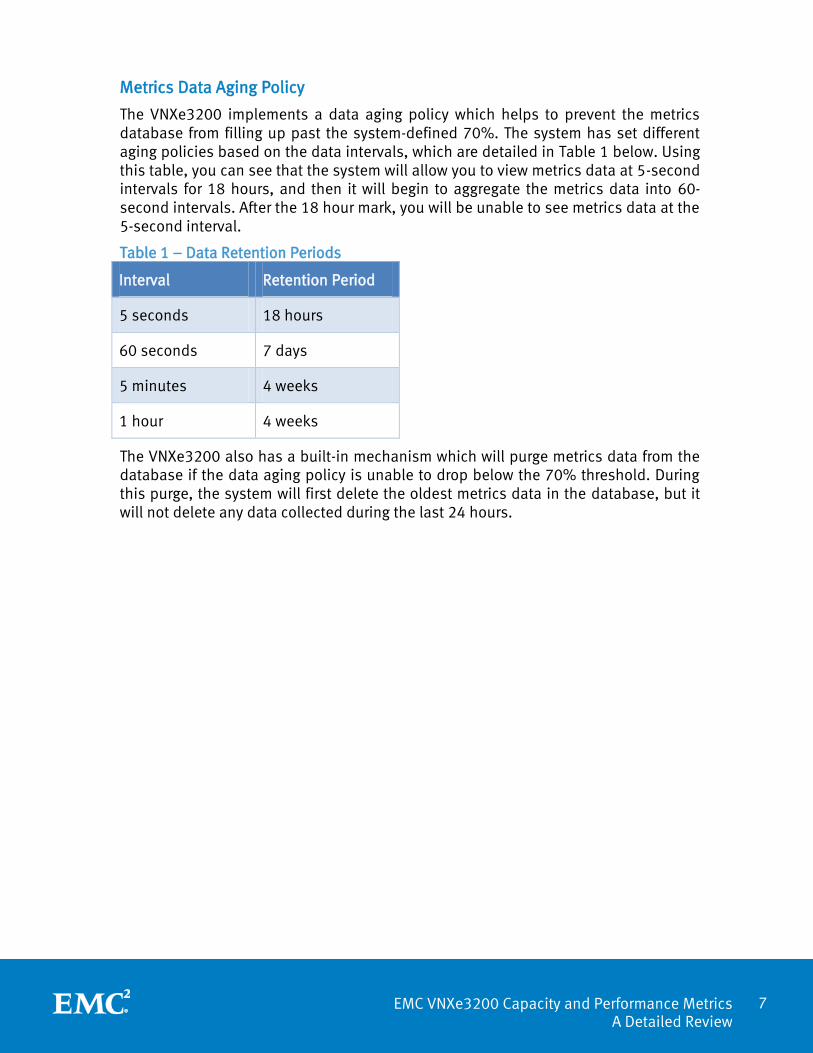
The VNXe3200 implements a data aging policy which helps to prevent the metrics database from filling up past the system-defined 70%. The system has set different aging policies based on the data intervals, which are detailed in Table 1 below. Using this table, you can see that the system will allow you to view metrics data at 5-second intervals for 18 hours, and then it will begin to aggregate the metrics data into 60-second intervals. After the 18 hour mark, you will be unable to see metrics data at the 5-second interval.
Table 1 – Data Retention Periods
Interval Retention Period
5 seconds 18 hours
60 seconds 7 days
5 minutes 4 weeks
1 hour 4 weeks
The VNXe3200 also has a built-in mechanism which will purge metrics data from the database if the data aging policy is unable to drop below the 70% threshold. During this purge, the system will first delete the oldest metrics data in the database, but it will not delete any data collected during the last 24 hours.

8 EMC VNXe3200 Capacity and Performance Metrics A Detailed Review
Viewing Metrics There are different ways you can view metrics data collected on your VNXe3200 storage system. This includes using Unisphere for VNXe or Unisphere CLI with your storage system. Additional details about viewing metrics for each interface are provided in the following sections.
Unisphere for VNXe
Unisphere for VNXe enables you to manage your storage system through a user interface from a supported browser. Using Unisphere, you can view or change the metrics service, view historical metrics graphs, and export metrics data to CSV files. For more information regarding Unisphere, please refer to the Unisphere Online Help or the EMC Unisphere for the VNXe3200 white paper found on EMC Online Support.
System Capacity Page
The System Capacity page is divided into two tabs, Current and Historical. The Current tab, shown in Figure 1, displays the current Storage statistics for your VNXe system, displayed in a user-friendly pie chart. This includes viewing the storage consumed by LUNs, File systems, VMware datastores, data protection (snapshots), and free space available on the storage system.
NOTE: For thin-provisioned storage resources, the pie chart slice represents the allocated value at the current moment in time. For thick-provisioned storage resources, the pie chart slice represents the storage resource size that is provisioned.
Figure 1 – System Capacity page showing the Current tab

9 EMC VNXe3200 Capacity and Performance Metrics A Detailed Review
Also in the Current tab, you will see System Utilization statistics which shows the total space, used space, and available space of all the storage pools available on the storage system.
A smaller version of the Current tab’s storage utilization pie chart, displayed as System Capacity, can also be found in the main Dashboard page of your VNXe system, as shown in Figure 2.
You will notice a More… link available in the lower-right of the view block, which will bring you to the System Capacity page. The System Capacity view block can also be added to any additional dashboards that are created or customized as well.
For more information regarding customizing dashboards and the available view blocks, please refer to the Unisphere Online Help.
Figure 2 – System Capacity widget

10 EMC VNXe3200 Capacity and Performance Metrics A Detailed Review
The Historical tab, shown in Figure 3, displays a graphical utilization history of your storage system according to the allocated system capacity. The values in the graph include the total space used by thick-provisioned storage resources, allocated space for thin-provisioned storage resources, and the space used by snapshots and metadata.
NOTE: The storage system samples capacity utilization history data points once a day. Therefore, storage space allocated and deleted within a day is not accounted for in this historical view.
Figure 3 – System Capacity page showing the Historical tab

11 EMC VNXe3200 Capacity and Performance Metrics A Detailed Review
System Performance Page
The System Performance page, shown in Figure 4, is where you can analyze performance metrics for your storage system by viewing and interacting with charts that display historical performance data. The charts enable you to compare changes in performance across multiple metrics, such as bandwidth and throughput.
Figure 4 – System Performance Page
Leveraging the metrics graphs, you can view the aggregated performance metrics information which allows you to quickly locate any high-level performance issues. Within a line chart, you can apply filters and view breakdown categories which allow you to drill down into more detail. You also have the ability to use the preset time ranges available, or you can create a customized time range to view across the metrics graphs in a dashboard.
Once you have all the filters, breakdown categories, and time range options setup for your metrics dashboard, you can use the export feature to download the metrics data to a comma-separated values (CSV) file. The metrics data that is exported will reflect the metrics graph’s filtered state at the time of the export, meaning any applied filters and selected breakdown categories will be included in the CSV file.
The System Performance page includes the ability to create multiple metrics dashboards which operate independently from each other. The customized options selected in one metrics dashboard do not apply to any other metrics dashboards that may be created.
Within the System Performance page, you will see the metrics panel located on the left side of the page in Unisphere, as shown in Figure 5. From the metrics panel, you can select the different charts that you would like to view in the current metrics

12 EMC VNXe3200 Capacity and Performance Metrics A Detailed Review
dashboard. There is a counter located at the top of the metrics panel which displays the number of charts that are currently displayed in the metrics dashboard.
NOTE: You can view up to five (5) metrics charts in a single metrics dashboard.
Figure 5 – System Performance Metrics Panel
If you are looking for a specific chart within the metrics panel, you can use the filter option. You will be able to type in a string of text which will dynamically apply to the list of available metrics charts and only show the matching items.
If you have already selected some metrics charts for your metrics dashboard and you would like to select a whole new set of metrics charts, then you can use the Remove All Charts link at the top of the metrics panel. This will clear out all the metrics charts from the dashboard allowing you to reset the current metrics dashboard. The metrics panel can also be collapsed and expanded which will redraw any metrics graphs in the current metrics dashboard to fill the space accordingly.
The System Performance page has a few options available from within this page, including the Metrics Collection Status option shown in Figure 6. The Metrics Collection Status indicates if your VNXe3200 system is collecting metrics. The Metrics Collection Status only affects the collection of performance metrics for your system; it

13 EMC VNXe3200 Capacity and Performance Metrics A Detailed Review
does not affect the collection of capacity information for your storage resources (including Storage Pools, File systems, LUNs, VMware datastores, etc.).
Figure 6 –Metrics Collection Status
If you click the Metrics Collection Status link on the System Performance page, you will be presented with the Metrics Collection Configuration window, as shown in Figure 7. From this window, you can enable or disable metrics collection on your VNXe system.
NOTE: Disabling the metrics collection process does not delete any metrics data the system has already collected, and it does not affect the viewing of any metrics data previously collected. You will need to enable the metrics collection process to see new data in the metrics graphs on the System Performance page.
Figure 7 – Metrics Collection Configuration window
The System Performance page has a few options available from within this page, including the time range options shown in Figure 8. These time range options apply to the data shown in the metrics graphs for the active metrics dashboard. There are some preset time range options available which allow you to see metrics data in intervals as small as 15 minutes or as large as 1 week.
Figure 8 – System Performance page options with time range controls highlighted

14 EMC VNXe3200 Capacity and Performance Metrics A Detailed Review
You can also set a custom time range interval with which you can view the metrics data. Clicking the Custom or Edit time range option links will open the Custom Time Range window shown in Figure 9. Using this window, you can configure the start and end times for the interval that you would like to use to view the data in the metrics graphs.
Once the interval is set, you will see it displayed below the time range options. By using the buttons on both sides of the current time interval (shown in Figure 8), you can shift the interval forward and backwards. For more information on using the time range controls and options on the System Performance page, please refer to Unisphere Online Help.
Figure 9 – Custom Time Range window
The System Performance page includes a button to export the current metrics dashboard to a CSV file, shown in Figure 10 next to the help button.
Figure 10 – System Performance page Export and Help buttons
15 EMC VNXe3200 Capacity and Performance Metrics A Detailed Review
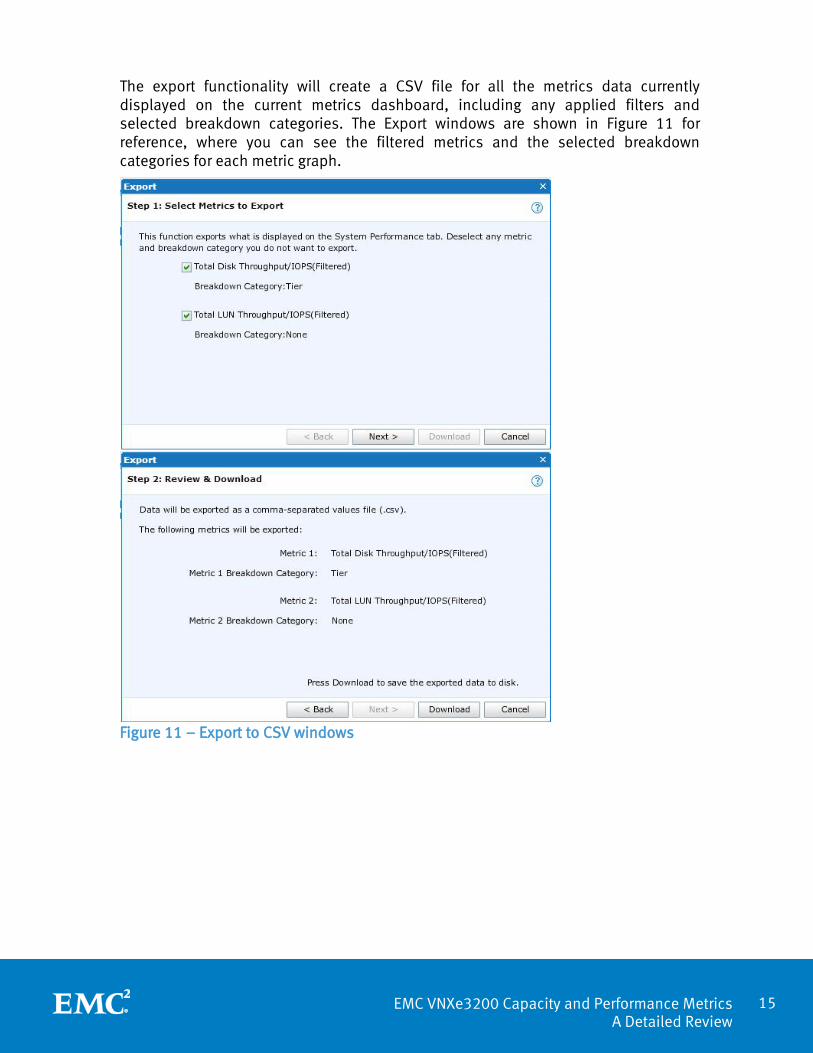
The export functionality will create a CSV file for all the metrics data currently displayed on the current metrics dashboard, including any applied filters and selected breakdown categories. The Export windows are shown in Figure 11 for reference, where you can see the filtered metrics and the selected breakdown categories for each metric graph.
Figure 11 – Export to CSV windows
16 EMC VNXe3200 Capacity and Performance Metrics A Detailed Review
Breakdown Categories and Filters
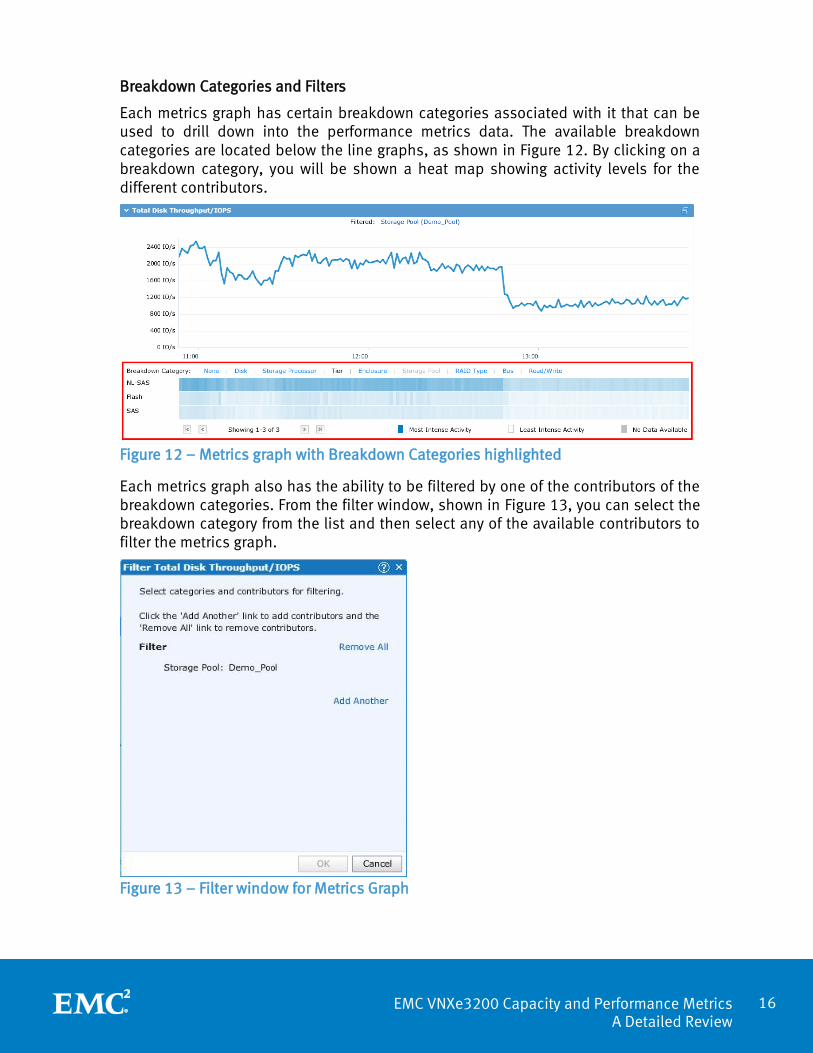
Each metrics graph has certain breakdown categories associated with it that can be used to drill down into the performance metrics data. The available breakdown categories are located below the line graphs, as shown in Figure 12. By clicking on a breakdown category, you will be shown a heat map showing activity levels for the different contributors.
Figure 12 – Metrics graph with Breakdown Categories highlighted
Each metrics graph also has the ability to be filtered by one of the contributors of the breakdown categories. From the filter window, shown in Figure 13, you can select the breakdown category from the list and then select any of the available contributors to filter the metrics graph.
Figure 13 – Filter window for Metrics Graph
17 EMC VNXe3200 Capacity and Performance Metrics A Detailed Review
Unisphere CLI
Unisphere CLI enables you to run commands on a system through a prompt from a Microsoft Windows or UNIX/Linux host. Unisphere CLI is intended for advanced users who want to use commands in scripts for automating routine tasks. Using Unisphere CLI, you can view or change settings for the metrics service, view available metrics paths, and view historical and real-time metrics values. For more information regarding Unisphere CLI, please refer to the Unisphere CLI User Guide on EMC Online Support.
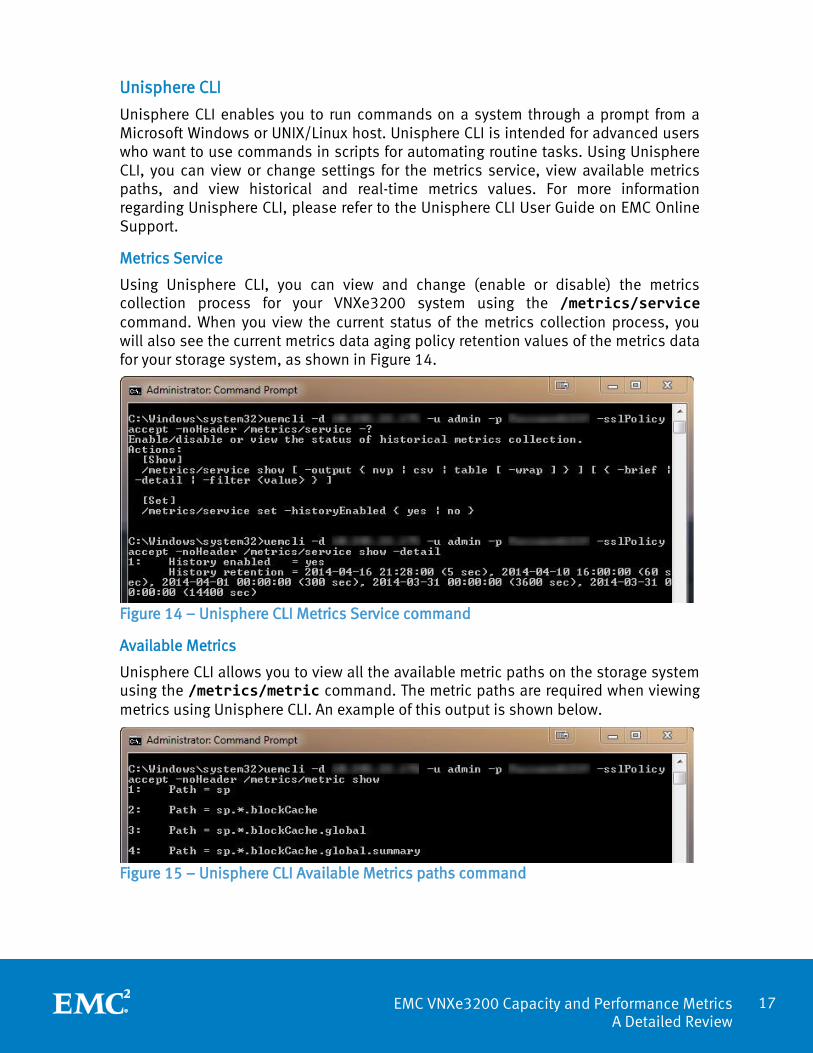
Metrics Service
Using Unisphere CLI, you can view and change (enable or disable) the metrics collection process for your VNXe3200 system using the /metrics/service command. When you view the current status of the metrics collection process, you will also see the current metrics data aging policy retention values of the metrics data for your storage system, as shown in Figure 14.
Figure 14 – Unisphere CLI Metrics Service command
Available Metrics
Unisphere CLI allows you to view all the available metric paths on the storage system using the /metrics/metric command. The metric paths are required when viewing metrics using Unisphere CLI. An example of this output is shown below.
Figure 15 – Unisphere CLI Available Metrics paths command
18 EMC VNXe3200 Capacity and Performance Metrics A Detailed Review
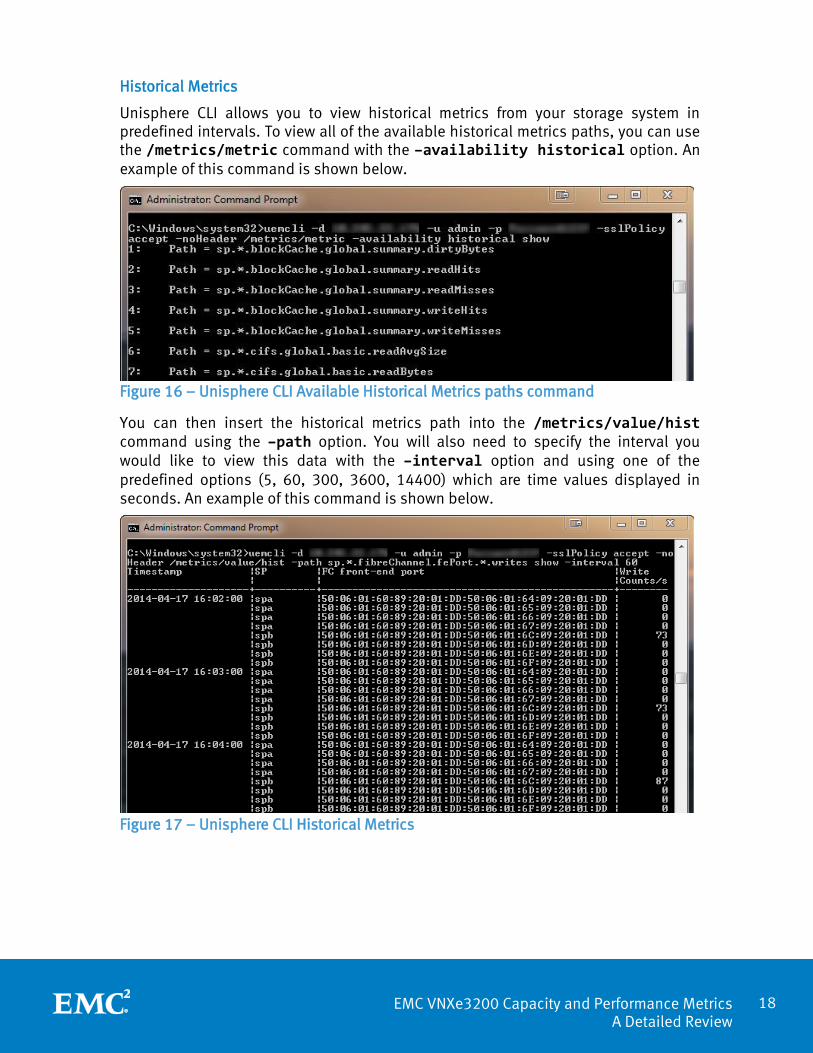
Historical Metrics
Unisphere CLI allows you to view historical metrics from your storage system in predefined intervals. To view all of the available historical metrics paths, you can use the /metrics/metric command with the –availability historical option. An example of this command is shown below.
Figure 16 – Unisphere CLI Available Historical Metrics paths command
You can then insert the historical metrics path into the /metrics/value/hist command using the –path option. You will also need to specify the interval you would like to view this data with the –interval option and using one of the predefined options (5, 60, 300, 3600, 14400) which are time values displayed in seconds. An example of this command is shown below.
Figure 17 – Unisphere CLI Historical Metrics

19 EMC VNXe3200 Capacity and Performance Metrics A Detailed Review
Real-Time Metrics
Unisphere CLI allows you to view real-time metrics from your storage system. All metrics are available to be viewed in real-time using the /metrics/value/rt command. Using the –path option with this command allows you to specify the exact metric path you would like to view. You can specify the interval by using the –interval option and providing a value within the allowed time range (1-300) in seconds. An example of this command is shown below.
Figure 18 – Unisphere CLI Real-Time Metrics
Conclusion By leveraging the capacity and performance metrics functionality available in EMC’s VNXe3200 storage systems, administrators have the ability to view and analyze metrics data to assist them in their daily tasks and operations. With the flexibility to view the metrics data in the Unisphere for VNXe interface or the Unisphere CLI interface, administrators with different backgrounds and knowledge can gather and extract information from their storage system using a method that they are familiar with. Whether users are diagnosing current issues or planning for future initiatives, the metrics functionality provides administrators with the ability to gather the information needed to make a well-informed decision in their storage environment.
References For additional information regarding any of the topics presented in this white paper, please refer to the following documentation available on EMC Online Support:
EMC Unisphere for the VNXe3200: Next-Generation Storage Management white paper
Unisphere CLI User Guide

20 EMC VNXe3200 Capacity and Performance Metrics A Detailed Review
Appendix A: Available Performance Metrics The tables below provide a description for all the available metric charts that can be viewed in Unisphere for VNXe. For more information regarding the metrics charts and their available breakdown categories, please refer to Unisphere Online Help on your VNXe3200 system.
Table 2 – Cache Performance Metrics Metric Description
FAST Cache Dirty Pages Ratio of dirty pages to total pages in the FAST Cache, expressed as a percent.
Total Cache Dirty Size Amount of data in the write cache, in MB, that has not yet been flushed out to disks.
Total Cache Throughput/IOPS Total number of I/O requests, in I/O per second, passing through the cache.
Table 3 – CIFS Performance Metrics Metric Description
Average CIFS I/O Size Average size of CIFS I/O requests, in KB, across all ports in the storage system.
Total CIFS Bandwidth Total amount of CIFS I/O requests, in KB/s, across all ports in the storage system.
Total CIFS Throughput/IOPS Total number of CIFS I/O requests, in I/O per second, across all ports in the storage system.
Table 4 – CPU Performance Metrics Metric Description
Average CPU Utilization Total amount of processing cycles, as a percentage, across all cores in the storage system SPs.

21 EMC VNXe3200 Capacity and Performance Metrics A Detailed Review
Table 5 – Disk Performance Metrics Metric Description
Average Disk Queue Length Average number of disk I/O requests in the system queue, in counts per second, across all disks used in provisioned storage.
Average Disk Response Time Average time spent completing disk I/O requests, in microseconds, across all disks used in provisioned storage, including time spent in the queue.
Average Disk Service Time Average time spent completing disk I/O requests, in microseconds, across all disks used in provisioned storage, not including time spent in the queue.
Total Disk Bandwidth Total amount of disk I/O requests, in KB/s, across all disks used in provisioned storage.
Total Disk Throughput/IOPS Total number of disk I/O requests, in I/O per second, across all disks used in provisioned storage.
Table 6 – Fibre Channel (FC) Performance Metrics Metric Description
Total Fibre Channel Bandwidth Total amount of Fibre Channel I/O requests, in KB/s, across all ports in the storage system.
Total Fibre Channel Throughput/IOPS
Total number of Fibre Channel I/O requests, in I/O per second, across all ports in the storage system.
Table 7 – File System Performance Metrics Metric Description
Average File System I/O Size Average size of file system I/O requests, in KB, across all file systems in the storage system.
Total File System Bandwidth Total amount of file system I/O requests, in KB/s, across all file systems in the storage system.
Total File System Throughput/IOPS
Total number of file system I/O requests, in I/Os per second, across all file systems in the storage system.

22 EMC VNXe3200 Capacity and Performance Metrics A Detailed Review
Table 8 – iSCSI Performance Metrics Metric Description
Total iSCSI Bandwidth Total amount of iSCSI I/O requests, in KB/s, across all ports in the storage system.
Total iSCSI Throughput/IOPS Total number of iSCSI I/O requests, in I/Os per second, across all ports in the storage system.
Table 9 – LUN Performance Metrics Metric Description
Average LUN I/O Size Average size of LUN I/O requests, in KB, across all LUNs in the storage system.
Average LUN Queue Length Average number of LUN I/O requests in the system queue, in counts per second, across all LUNs in the storage system.
Total LUN Bandwidth Total amount of LUN I/O requests, in KB/s, across all LUNs in the storage system.
Total LUN Throughput/IOPS Total number of LUN I/O requests, in I/Os per second, across all LUNs in the storage system.
Table 10 – Network Port Performance Metrics Metric Description
Total Network Bandwidth Total amount of file I/O requests, in KB/s, across all ports in the storage system.
Total Network Throughput/IOPS Total number of file I/O requests, in packets per second, across all ports in the storage system.
Table 11 – NFS Performance Metrics Metric Description
Average NFS I/O Size Total amount of NFS I/O requests, in KB, across all ports in the storage system.
Total NFS Bandwidth Total amount of NFS I/O requests, in KB/s, across all ports in the storage system.
Total NFS Throughput/IOPS Total number of NFS I/O requests, in I/Os per second, across all ports in the storage system.