embodied energy counting of sustainable heat, … energy counting of sustainable heat, power and...
TRANSCRIPT

Embodied energy counting of sustainable heat, power and steel processes
Magdalena Losowska
______________________________________________________

Embodied energy counting of sustainable heat, power and steel processes
Magdalena Losowska
A 30 ECTS credit units Master´s thesis
Prof. Markku Hurme
The Master Thesis was supported by a grant from Iceland, Liechtenstein and Norway through the EEA Financial Mechanism - Project PL0460.
A Master´s thesis done at RES | The School for Renewable Energy Science
in affiliation with University of Iceland & University of Akureyri
Akureyri, February 2011

Embodied energy counting of sustainable heat, power and steel processes
A 30 ECTS credit units Master´s thesis
© Magdalena Losowska, 2011
RES | The School for Renewable Energy Science
Solborg at Nordurslod
IS600 Akureyri, Iceland
Telephone + 354 464 0100
www.res.is

i
ABSTRACT
The focus of this research is in the area of embodied solar energy. Emergy based environmental evaluation of renewable energy based on heat, power and steel recycling processes was performed.
The research approach adopted Odum’s method of emergy analysis. A biomass based combined heat and power (CHP) plant process was evaluated first. Next, a steel recycling process based on scrap and performed in an Electric Arc Furnace was analyzed to calculate the embodied energy consumption of recycled steel. Two energy alternatives were developed: biomass-based and coal-based cogeneration. In each accounting study case a system boundary was defined and a member’s input and output was investigated. The result of each analysis was the emergy table with output transformity value, suitable in further comparisons. Developed systems were based on a renewable energy and raw materials. Pine residues served as the combustion fuel in the cogeneration plant and scrap metal was recycled in the steel mill. The cogeneration and steel market situation of Poland was discussed. Advisability of adequate emergy analysis in Polish reality was presented. The emergy analysis results provided evidence that fully sustainable manufacturing processes are the future of sustainable economy which would be able to fulfill the emission abatement requirements. The bio-based cogeneration system appeared to have approximately 1,63 times less solar emergy output than fossil-based. Similar results occurred in case of steel recycling study. The presented approach could be used for analyzing resource consumption of processes and used as an energy focused sustainability index.

ii
PREFACE This thesis is based upon studies conducted between September 2010 and January 2011 at the Aalto University School of Engineering, Department of Biotechnology and Chemical Technology, Finland.
I would like to express my gratitude to my thesis advisor – Professor, Markku Hurme and my instructor, Ms. Sha Sha. Due to their co-operation, assistance and support this thesis ended in success. Thesis results were used in the article Renewable energy based environmental accounting of heat, power and steel production written by Ms. Sha Sha, Prof. Markku Hurme and by the thesis author. The paper will be presented in the publication: Chemical Engineering Transaction, vol. 25, 2011 – PRES’11 Proceedings (14th International Conference on Process Integration, Modelling and Optimisation for Energy Saving and Pollution Reduction).
iii
TABLE OF CONTENTS
1 Introduction ................................................................................................................... 1
1.1 Background ............................................................................................................ 1
1.2 Goal and Scope....................................................................................................... 1
1.3 Methodology .......................................................................................................... 1
2 Literature review ........................................................................................................... 3
2.1 Emergy principles ................................................................................................... 3
2.1.1 Emergy Indices ..............................................................................................4
2.1.2 Emergy analysis – purpose ............................................................................6
2.1.3 Emergy analysis – methodology ....................................................................6
2.2 Combined heat and power production ..................................................................... 9
2.2.1 Thermodynamic principles .......................................................................... 12
2.2.2 Power cycle equipment ................................................................................ 15
2.2.3 Biomass for CHP ......................................................................................... 18
2.3 Steel recycling ...................................................................................................... 20
2.3.1 Steel production technologies ...................................................................... 21
2.3.2 Environmental performance ......................................................................... 23
2.3.3 Raw materials in steel recycling................................................................... 25
3 Research ...................................................................................................................... 28
3.1 Biomass-based Cogeneration Plant case study ...................................................... 28
3.1.1 Process stages, system diagram.................................................................... 30
3.1.2 Input analysis .............................................................................................. 32
3.1.3 Transformity analysis .................................................................................. 36
3.1.4 CHP emergy table ....................................................................................... 40
3.2 Steel recycling study case ..................................................................................... 41
3.2.1 Steel recycling process and system diagram ................................................. 42
3.2.2 Input analysis .............................................................................................. 45
3.2.3 Transformity analysis .................................................................................. 48
3.2.4 Steel recycling emergy table ........................................................................ 50
3.3 Fossil fuel-based systems ...................................................................................... 51
3.3.1 Coal-based CHP case study ......................................................................... 51
3.3.2 Steel recycling based on the fossil energy .................................................... 53
3.4 Results - comparison ............................................................................................ 55
3.5 Emergy implementation in Polish cogeneration and steel industry market............. 56

iv
3.5.1 Bio-based cogeneration ............................................................................... 56
3.5.2 Steel market in Poland ................................................................................. 58
3.5.3 Polish market – emergy analysis implementation ......................................... 59
4 Conclusions ................................................................................................................. 60
References ....................................................................................................................... 61
Appendix A ....................................................................................................................... 1

v
LIST OF FIGURES
Figure 2.1 Generic system diagram and energy system symbols ........................................8
Figure 2.2 Separate production and CHP cogeneration comparison .................................. 10
Figure 2.3 CHP share in the electricity generation ........................................................... 11
Figure 2.4 Common CHP generation types ...................................................................... 13
Figure 2.5 Rankine cycle ................................................................................................. 14
Figure 2.6 Back pressure steam turbine ........................................................................... 17
Figure 2.7 Extraction turbine ........................................................................................... 17
Figure 2.8 Turbines configuration comparison ................................................................ 18
Figure 2.9 Share of world crude steel production, 2009 ................................................... 20
Figure 2.10 Steel production possibilities ........................................................................ 22
Figure 2.11 Electric Arc Furnace Layout ......................................................................... 23
Figure 2.12 Emission comparison ................................................................................... 24
Figure 2.13 The main sources of scrap ............................................................................ 26
Figure 2.14 Steel scrap prices2005-2008, $/tones ............................................................ 27
Figure 3.1 Biomass based cogeneration system – elements .............................................. 30
Figure 3.2 CHP system emergy diagram .......................................................................... 32
Figure 3.3 Detailed steel recycling diagram ...................................................................... 44
Figure 3.4 Simplified steel recycling diagram .................................................................. 45
Figure 3.5 Cogeneration share in electricity production in Poland ................................... 56
Figure 3.6 Manufacture of crude steel by process ............................................................ 58

vi
LIST OF TABLES
Table 2.1 Turbines properties comparison ....................................................................... 18
Table 2.2 Energy intensity comparison (per ton of crude steel produced) ......................... 25
Table 3.1 Forssa plant characteristics ............................................................................... 29
Table 3.2 Input division ................................................................................................... 32
Table 3.3 Pine biomass properties ................................................................................... 33
Table 3.4 Input summary ................................................................................................. 35
Table 3.5 Energy content comparison............................................................................... 37
Table 3.6 Biodiesel-based road transport. Emergy evaluation ........................................... 37
Table 3.7 Steam and power transformity evaluation for biomass-based CHP .................... 39
Table 3.8 Biomass-based CHP emergy table .................................................................... 40
Table 3.9 Impact on the solar emergy .............................................................................. 40
Table 3.10 Steel production input list (per 1 ton of molten steel) ...................................... 41
Table 3.11 Steel mill assumptions .................................................................................... 42
Table 3.12 Steel manufacture demand per 1 ton, annual demand ...................................... 45
Table 3.13 Steel recycling input division .......................................................................... 46
Table 3.14 Refractories – chemical composition ............................................................. 47
Table 3.15 Oxygen emergy evaluation, based on biomass CHP ........................................ 48
Table 3.16 Steel recycling emergy evaluation .................................................................. 50
Table 3.17 Impact on the total emergy ............................................................................. 50
Table 3.18 Main assumptions in the coal-based CHP plant ............................................... 51
Table 3.19 Coal-based CHP emergy evaluation ................................................................ 52
Table 3.20 Coal-based CHP – input contribution .............................................................. 53
Table 3.21 Oxygen emergy evaluation, based on coal-CHP .............................................. 53
Table 3.22 Steel recycling emergy analysis based on fossil energy ................................... 54
Table 3.23 Steel emergy, input contribution ..................................................................... 54
Table 3.24 CHP emergy evaluation comparison ............................................................... 55
Table 3.25 Steel mill emergy evaluation comparison ........................................................ 55
Table 3.26 Electricity generated by cogeneration, available technology 2009 .................. 57
Table 3.27 Biomass potential in Poland ........................................................................... 57
1
1 INTRODUCTION
1.1 Background
Sustainable development and availability of nonrenewable resources are the two significant issues occupying the policy arena. Public attention is focused into global warming and CO2 emission. Climate change continues to become very important and force scientists and researchers to analyze the industry’s role in pollution and fossil fuel usage. To evaluate system sustainability and assure it to be comparable on an equivalent basis an emergy method was developed. Transformity value which provides a quality factor and show how much energy and resources were used to produce a product or service became an important indicator in the process evaluation.
1.2 Goal and Scope
The goal of the research was to calculate solar emergy consumption for a steam production process and electricity generation in a bio-fuel based combined heat and power (CHP) plant. The information from the cogeneration plant calculation was used for developing the embodied renewable energy consumption of steel recycling process and in Polish industry example. Transformities from the bio-based systems were used as a basis in the comparative analysis with the fossil-based systems. The aim was to evaluate and emphasize the environmental sustainability of bio-based processes.
1.3 Methodology
First the literature on emergy principle, analysis and accurate accounting of the inputs, outputs and storage of energy, materials, and information was studied. The cogeneration process and the steel recycling process were analyzed. At the same time specific information about those two processes was collected. Odum’s method was applied to calculate the emergy values based on fully renewable basis. The research was done by calculation. The emergy was selected as the indicator, since the aim was to express the embodied energy by a unified indicator for all items (e.g. raw material, energy, labor, investment cost etc.). Firstly the renewable basis was implemented and then to obtain a comparison, a fossil fuel was added.
The emergy calculation process used a thermodynamic basis of different forms of energy, materials and human services. Each input and output was converted into equivalents of one form of energy. Systems diagrams of processes were drawn to organize evaluations and account for all inputs and outputs. Tables of the materials, labor, and energy flows were constructed from the diagrams. The different units for each inflow and outflow were multiplied by adequate transformities to convert them into solar emergy.
The main steps of emergy accounting for the processes were as follow: system boundary definition and individual input and output analysis. The next step was the development of the emergy diagram, taking into consideration all data on the relevant industrial, economic

2
and ecological processes and products, emergy table evaluation and at the end – the result analysis. The reference to the Polish steel and cogeneration market was presented. Emergy implementation in the country’s bio and fossil fuel-based systems was discussed.

3
2 LITERATURE REVIEW
In the chapter the state of the art of emergy analysis, cogeneration processes and steel recycling was studied. Systems’ principles which had significant contribution to the research work were discussed.
2.1 Emergy principles
When the energy crisis began in the 1970s, humankind started to be contingent on oil and other fossil fuels. In the following years, researchers identified changes in air pollution and as a consequence - in ecosystems. Scientists began to recognize the importance of ecosystems’ role in the global economy. They started to be aware of the environment and the industry’s negative impact on our lives.
The idea of emergy was born in 1950s. The concept evolved over the next few decades. The author who had the biggest contribution to that theory was Howard T. Odum. An American professor and ecologist, he recognized the role the environment played in the economy. He assumed that economic activities were shaped not only by economic rules, but also by ecosystem constraints. He also developed the concept that energy offered a common ground for integrating economic and ecosystems sciences. Together with his brother, he was trying to find the common unit or formula which could cover different energy flows, not only the well known ones like heat flow. Common unit would provide a possibility for comparison of different resources, products or even money with each other. New theory should provide information about the level of sustainability of the system and because of that should direct the decision towards clean practices.
When an environmental situation arises, people often assess it in physical units. Grams of CO2 released, carbon footprint, number of squared kilometers of forest cut out or number of endangered species in a given area – those are units commonly used while talking about pollution and environment. When considering the economical world and human activities, dollar, euro or other currencies are used. For decades it was very difficult to recalculate or convert physical units into money and vice versa. Odum and coworkers faced the problem of how to solve and analyze environmental problems which have social, economic and ecological consequences. They developed a method capable of expressing the costs and benefits which exist in every field of science. With the emergy analysis it was possible to incorporate resource limitations, labor, energy and their contributions into the formulations of economics. They concentrated on solar energy, which was often the common denominator for accounting different processes, because it is always required for all production systems and it is incorporated in all products production stages. Theory of emergy considered the differences in the ability to do work among other energies of different kinds. We define emergy as an available solar energy of one kind previously used up directly and indirectly to make a product or service (Bastianoni et al. 2007). The unit of emergy is emjoule. Emjoule represents the energy which was used to make a present product or service and now that energy is embodied in it. The emergy per unit of time is called the flow of emergy or in a shorter way - empower. The unit of it is seJ/s, seJ/year, etc.
The emergy concept and the interpretation of its results explain how systems could be organized in hierarchies by using energy at the efficiency that generates the most power. Typical analysis of emergy considers every system to be a network of energy flow. The

4
final value is determined by the number and magnitude of the streams and processes involved in the defined system. The analysis provides an energetic basis for quantification and valuation of ecosystems, goods and services. Emergy is often called the ecocentric valuation method because it is placing the center of interest in the ecology. It is a nature-centered theory, versus human-centered. Emergy analysis as a technique is important for appreciating the contribution of ecosystems to all human activities, meeting the challenges of sustainable development and making it achievable for saving resources for the future. For professor Odum and his coworkers it was obvious to use emergy to evaluate all sorts of systems and processes known to humankind. Because of the fact that life on the Earth is continuously maintained by transformations of energy from the Sun - large view of emergy theory presents the dependence on the Sun, directly and indirectly. Since solar energy is the main energy input to many processes, all other energies could be scaled and recalculated to solar equivalents to give one, common unit – solar emjoules. Different kinds of energy can be derived from it, through energy transformations - economy, ecosystems, agricultural systems and human dominated systems can be incorporated to this energy flow network (Hau et al. 2004).
2.1.1 Emergy Indices Energy, generally speaking, as a quantity means the ability to perform a task or work. It is measured by different units like kWh, British Thermal Unit (BTU) or calories. It is said that the ability to do a work depends on the energy quality and quantity, which cannot be indicated in listed units. In the past, the energy quality was called the fossil fuel equivalent. It means that it was measured by the amount of energy from the fossil fuels (lower quality grade) which were needed to develop the higher quality grade, for example electricity. In his books, Howard Odum presented the whole process from its source – the Sun. He simplified the concept: energy from the sunlight reaches the plant matter, then the coal is formed, next step is oil made from coal and the last is electricity generated in the fossil fuel power plant.
When the emergy concept was being created, firstly its precursor – net energy was defined. Scientists suggested that the net energy is the amount of energy after all the costs of getting and cumulating the energy are subtracted. The quality of energy was measured based on a fossil fuel energy standard. One kcal of fossil fuel is equal to 2000 kcal of sunlight (Odum 1996). The energy quality factors were placed on a fossil fuel basis and they were called Fossil Fuel Work Equivalents (FFWE). The FFWE unit was replaced with Coal equivalents (CE) in late 1970s and then the system of evaluating energy quality was placed on a solar basis and termed solar equivalents (SE) (Brown & Ulgiati 2004). All the well known processes which occur on Earth can be arranged with each other in a network series, e.g. energy chains in organisms, ecosystems, and economies. Energy hierarchy could look as such: some amount of joules of sunlight are required to make a joule of organic matter, then many joules of organic matter are required to make a joule of fuel, some joules of fuel are required to make a joule of electric power and so on. The energy hierarchy concept assumes that every kind of energy is transformed from one state to another. Energy flow and the hierarchy of energy used in emergy analysis are usually presented in the emergy diagrams. From the left side of the diagram to the right the amount of energy decreases. At the same time the quality is higher while going to the right side. The more energy transformations are required the more quality has got the unit. Studies of emergy analysis require several emergy intensities to be defined. First one and probably the most common and important is transformity. It is an emergy input per unit of

5
available energy (or just exergy) output. Transformity is often called a measure of energy quality. It is used to determine the emergy of commonly used resources, products and processes. The higher the transformity, the more emergy was used to make the product. By solar transformity we define the solar emergy required to make 1 J of a service or product. The unit is seJ/J (Brown & Ulgiati 2004). To calculate the solar transformity we use formula as follows (Hau et al. 2004):
푀 = 휏 ∙ 퐵 (1) where:
푀- emergy [seJ]
휏 – transformity [seJ/unit]
퐵 - available energy [unit]
The example can be presented as follows: if 5000 solar joules of emergy are required to generate one Joule of wood, then the solar transformity of that specific wood is 5000 solar Joules of emergy per Joule. It can be abbreviated as 5000 seJ/J. Solar transformity (the largest but the most dispersed energy input) of the sunlight absorbed by our planet is by the definition equal to 1. Most of the transformities calculated by Odum and coworkers was counted from the yearly emergy flow to the Earth. Those analyses made some years ago are still used (Brown & Ulgiati 2004). Specific energy is the second term related to emergy analysis. It is defined as the emergy per unit mass output. In most of the cases it is expressed in solar emergy per one gram (abbreviation – seJ/g). The solid units can be evaluated with emergy per unit mass for its concentration. Because of the fact that some energy is required to concentrate those materials, when the concentration increases, also the unit emergy increases. This rule can be explained as the fact that the higher concentration is related to the units in which more environmental work was required to make them (to make the spatial form and to make the chemical formula) (Brown & Ulgiati 2004). Emergy per unit money (energy dollar ratio CE/$) – emergy needed to generate one unit of economic product. It is convenient when converting money payments to emergy units. The amount of emergy per unit money is used to express the monetary payments since the money for the product or service is paid to people, not directly to the environment. The quantity of resources which are bought depends on the amount of emergy and on the amount of circulating money. The ratio can be calculated by dividing the total emergy use of a state by its gross domestic product (GDP). The unit is emJoules/$. The ratio varies every year since e.g. the inflation has impact on the GDP value in each country (Hau et al. 2004).
푀 = 퐹( ) (2)
where:
푀- emergy
퐹 – economic input
푀 – nation’s emergy
퐹 - nation’s GDP

6
Ratio which defines the amount of emergy supporting one unit of labor needed for a process is called the emergy per unit labor. The unit of the ratio is seJ/$, seJ/kcal or seJ/J. The calculation of the emergy in the labor is made since the workers apply their work to the process and because of that they invest in the whole emergy which made their work possible (Brown & Ulgiati 2004).
2.1.2 Emergy analysis – purpose The emergy analysis was developed a long time before Life Cycle Assessment, Industrial Ecology and other methods used to present the industry’s influence to the environment were made. For decades it was a comprehensive tool for investigation of sustainability of the specific system or a process. It helped with the understanding of the interactions between human activity and its influence on the natural resources. Emergy analysis is based on the thermodynamic principles. In the calculations the system theory and systems ecology principles are used. Nowadays emergy is used mainly to (Hau et al. 2004):
• Connect the economic and environmental world. Emergy can be calculated for any system and consequently, systems can be compared on an objective basis, independent of their monetary values.
• Investigate the environmental impact of systems and processes based on specific resources.
• Investigate the level of resources’ renewability. As a base, the time and space convergence which were required to make those resources are taken into account. The higher the convergence of environmental work the lower the renewability.
• Calculate the quality of flows of the resources, in a quantitative way. This is especially dedicated to those resources which have no market and thus cannot be calculated in monetary terms. One example of those resources is fertile topsoil.
• Evaluate the emergy per unit money and emergy per unit labor. • Increase the time taken into account in the analysis in order to include the memory of
resource flow converging to the process or system. • Analyze the quality assessment from the donor side to investigate the user side
assessment. The calculation should provide the answer as to much the system relies on the support from biosphere.
• Analyze the role of the environment in the systems which are not the point of interest of society, like processes in global biosphere. The resource supply and the output side can be investigated.
• Investigate processes which are based on small flows on physical carriers and at the same time are supported by huge indirect flows of resources, e.g. creation of information.
• Provide a holistic alternative to existing analysis. Emergy is concerned with whole systems, not a specific state or stage of a process.
2.1.3 Emergy analysis – methodology The goal of the emergy analysis of a specific product or service is to determine the solar energy which is required in a direct or indirect way to allow a system to produce that product or service. Emergy principle states that the emergy of renewable energy, nonrenewable resources, products or services is determined by the energy required to make

7
them. The analysis is based on the principles of thermodynamics, system theory and systems ecology science. When calculating the energy required in the process, the connection between the demand for all the resources and human activities is often neglected. It is due to the fact that for the analysis the final result of the energy is more important than the conventional economics indicate. It is necessary to say that energy analyses do not focus on the optimizing principles and do not quantify the environment's role in absorbing and processing air and water pollution.
Emergy analysis starts with making the system diagram. The goal is to obtain the overview of the process and to expose the lines connecting following units. It would help to understand the way how the problem is surrounded, what the inputs and outputs are, what the system boundary is and how the main mechanism looks, in general. Diagram provides information necessary to fill the emergy evaluation table. Lines in the diagram could have specific colors to emphasize its role – yellow color for sun and heat input, green for producers, blue for water, nutrients and material resources, red lines for consumers and units with high transformity and purple arrows for money flow (Odum 1996). In another way, in black and white colors, thick black line may mark system boundaries and main process flow. In that case a thin black line should connect additional lines – inputs and assets. Grey or black, thin, dashed line should link wastes coming from all main processes. Also the graphical symbols for each unit like source, storage tank, heat sink, consumers are specific for emergy analysis. The general example of the genetic system diagram and the most important and commonly used symbols are presented in Błąd! Nie można odnaleźć źródła odwołania. As can be seen from it, the Sun and other inputs from the environment are arranged from left to right. On the very right side the final product or service is located. The rest of inputs should be located at the top of the system boundaries.

8
Figure 2.1 Generic system diagram and energy system symbols (Ulgiati, Bargigli & Raugei 2006) The very complex diagram should be made at first, with a detailed list of inputs and outputs. After understanding the process some units and flows could be omitted and aggregated. Simplified diagram combines some components and resources to make it more understandable and to emphasize which flows are important for the process and should be included in the emergy evaluation table. Second step of the emergy analysis is the emergy evaluation table. It is composed of six main columns. They represent (Odum 1996): 1 – Line number for each item evaluated – source, process or storage.
2 – Item name, short description may be provided. 3 – Data units. In each line the flow of raw unit has to be evaluated. Typical and commonly used unit for this type of analysis is Joule, gram or dollar. To obtain those numbers, standard thermodynamic, physical, chemical or economical calculations should be made.
4 – Transformity. The value of solar emergy per unit weight or per unit dollar has to be computed. Some of the scientific sources like Odum 1996 provide detailed tables with given transformities for different sources and raw materials. If some transformity number

9
cannot be found in the source, it could be calculated from the subsystem data assembled for new purpose. There are a few methods such as evaluating the energy distribution graphs or evaluating main energy flows of biosphere. They are aggregated as necessary products or evaluating transformities by combining other transformities. Some of those methods will be presented later in this thesis.
5 – Emergy. To obtain the value of emergy simple calculation has to be made. Data from column 3 (Data units) has to be multiplied by the value from column 4 (Transformity). The unit for column 5 will be seJ/yr. For simplification all values in every row should be expressed in similar power and presented on the computer notation like E8 which is equal to 108. 6 – Emvalue [$/yr] - optional. This additional column could present the emergy per unit money. To obtain that number the value from column 5 should be divided by the emergy/money ratio for specific country, specific currency and specific year.
The main geobiospheric processes on Earth require the presence of sunlight, water and other typical inputs from the environment. When using the transformity values from the literature, there is always a problem with double counting of some data. Most of the time the transformity of geobiospheric processes was counted from the baseline so there is no need to compute theirs inputs one more time. A simple way to determine the emergy value for that process is to choose the largest of the geobiospheric inputs and omit the rest of them. This operation will assume that all of the inputs from the environment are already included in the largest geobiospheric sink. The other rule for emergy counting is to evaluate every component, if necessary, from two sides. One of them is the emergy contained in the available energy which is brought in and the second one is the emergy which is supported by the human services (Odum 1996). The example could be the transportation of biodiesel. In this case the first component is the emergy of fuel and the second one – the emergy of mining, processing and transportation. In some cases the transformity values given in literature could contain those calculations. After filling the whole emergy evaluation table there is a possibility to compare all of the emergy values for each flow. The comparison could be expressed in percentages. It would provide the information on which of the input is more important for the process and which one is the most expensive from the emergy point of view. More complex calculations, which require summation and different ratios, indicate the economic and environmental sustainability of the process. By making the three–arm diagram which includes environmental inputs, purchased feedback and output products to each unit on the energy system diagram there is a possibility to compute emergy ratios. To obtain the solar transformity of products the total solar emergy inputs should be divided by the energy of the yield or mass output. Similarly, the emergy yield ratio of products could be calculated by dividing the yield output emergy flow by the sum of the feedback emergy from the economy (Odum 1996).
2.2 Combined heat and power production
Heat and power cogeneration (CHP), the simultaneous generation of the two, is a well known technology used all over the world. The main advantage and reason for implementation is the efficiency potential. Conventional power generation in the modern coal fired power plants could achieve 34-36%. The remaining 64-66% is released as waste
10
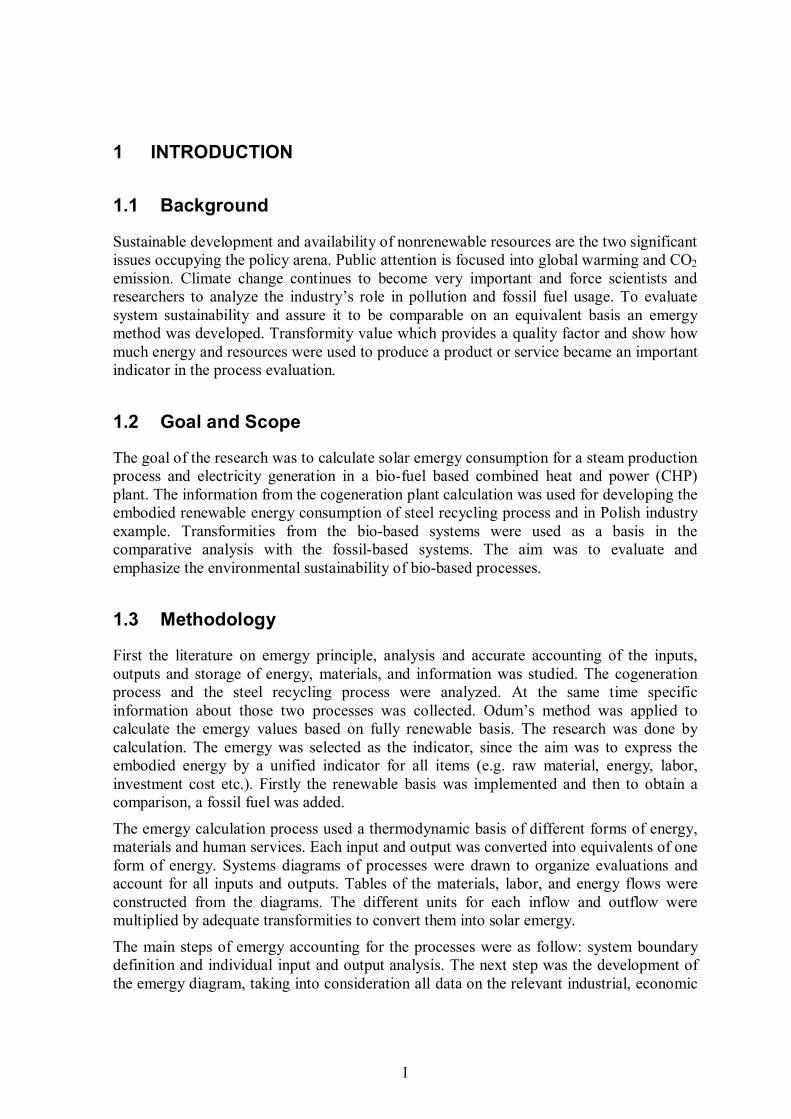
heat. It means that huge energy potential is wasted and cannot be recovered afterwards. CHP technology could reduce the losses to minimum (excluding losses for the electricity transmission) by using the heat for district heating and cooling or for industry’s purposes. Moreover, the steam can be used in steam turbines to generate additional electricity for both industrial and domestic purposes. Utilization of heat released from the steam turbine may provide a system efficiency of 90% or more. Additionally, the electricity generated by the CHP plant if often used locally, in the nearest neighborhood. That is why transmission and distribution losses may be minimized. Figure 2.2 shows the advantage of the efficiency between separate production of heat and power and cogeneration.
Figure 2.2 Separate production and CHP cogeneration comparison In the first case efficiency is equal:
휂 = = 58% (3)
In case of CHP, the efficiency is equal:
휂 = = 85% (4)
In a combined heat and power plant as well as in conventional electricity generation, the biggest losses’ contribution is associated with the transmission and distribution of electricity. Those losses are bigger when electricity is delivered to numerous consumers and smaller when smart grid is taken into consideration, for example. A bigger problem occurs in case of heat transportation. While small distances (on site demand) characterize small losses, long distances of heat transportation cause problems, small efficiency and high cost of insulated pipes. That is why CHP plants are situated as close as possible to the place where the heat is consumed – near the district area.
Size of a CHP plant has to meet the specific demand of a city or industry. Typical plants available nowadays could provide outputs from 1 kWe to 500 MWe (EDUCOGEN 2001). Cogeneration can either meet only the demand for heat or be used as an electricity generator with some additional use of waste heat. Most likely when a plant is sized according to the heat demand, more electricity is generated than needed. In that situation surplus can be sold to the grid.
11
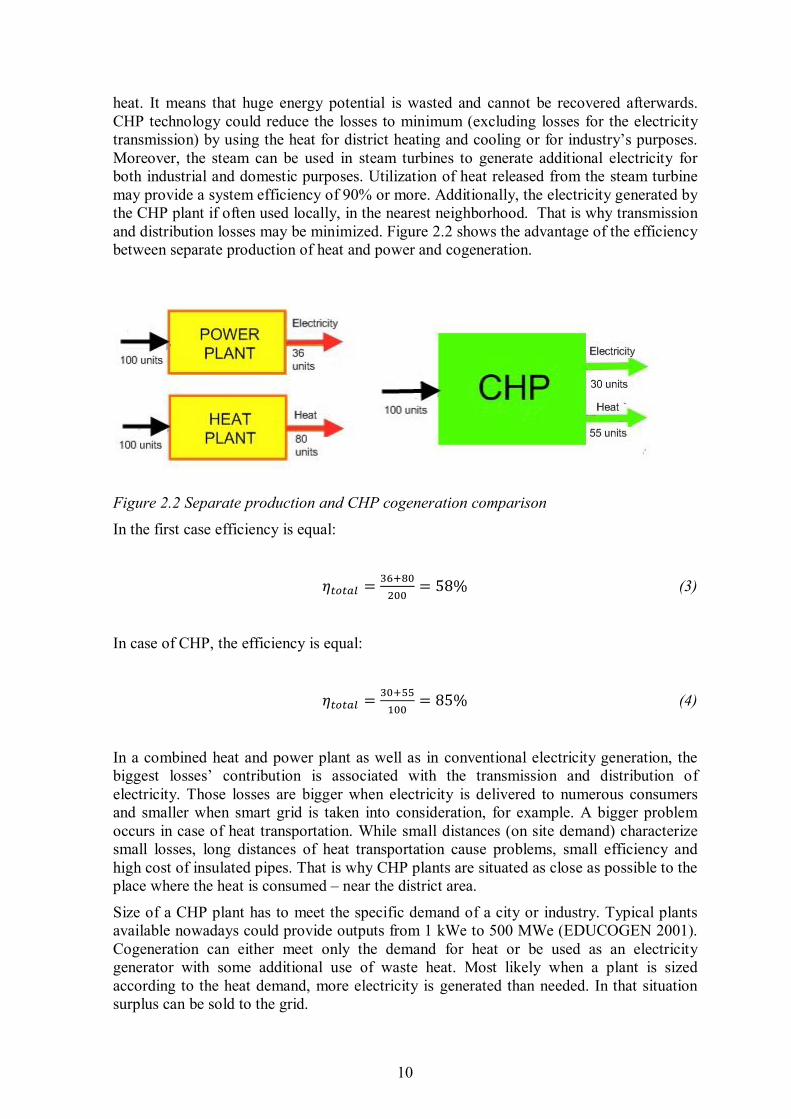
Nowadays except for the large scale CHP used in the industry and district heating, which typically fall into the range of 1 to 50 MWe, the small scale becomes more and more important. Medium size plants could provide approximately 1 MWe to 10 MWe. CHP output under 1 MW of electricity can be considered as small-scale. Micro CHP installation is usually less than 5 kW of electricity and it is placed in houses or small businesses. Instead of burning fuel – coal or wood, to obtain hot water in the heating system, some of the energy is converted to electricity. Bigger than micro - mini CHP installation is usually more than 5 kWe and less than 500 kWe. It is dedicated for a single building or medium sized business (EDUCOGEN 2001). Every country applies different sizes and different appreciations in this area. District heating, hotels, hospitals, swimming polls, prisons and supermarkets are the most common buildings where CHP plant could be a heat and power supplier. Industries with higher needs often supplied by cogeneration plants are: paper mills, wastewater treatment plants, food, textile and minerals processing and ceramics industry. Also thermal enhanced oil recovery wells, motor industry and steel plants which require huge amount of heating and electricity supply could be a CHP plant client.
Figure 2.3 CHP share in the electricity generation (COGEN Europe 2009) A share of CHP technology in total electricity generation in European Union in 2007 is shown in Figure 2.3. The utilization of heat and power generation in the EU is characterized by a wide diversity. Wealthy countries with high level of research and development, like Scandinavian countries, are a leader in that field. Another reason for diversity is a result of historical issues, access to natural resources, climate, electrical policy etc. Total share of electricity generated in CHP plants in The European Union is approximately 11%.
CHP plants are considered as beneficial for local and global society. The main advantages are (Educogen 2001):

12
• Higher efficiency of energy conversion. CHP is the most efficient and effective way
to produce a heat and power, • Lower emissions of GHG and NOx. It is the solution that Kyoto targets for many
countries. • Lower cost of one CHP plant as compared to two for heat and power supply. Lower
production cost means lower cost of energy supplied to houses and to industry. • Decentralized electricity generation with small transmission losses concentrated on
single consumer needs. • Improved electric reliability – lower probability of islanding and lower percentage of
energy needed to be imported from abroad. • Competition on the market. The more CHP plants, the lower the energy prices and
the bigger the employment.
Cogeneration power plants could differ from each other by power and heat output ratio, total efficiency and equipment used. Another differentiation could be due to the type of fuel used. CHP is not a fuel specific technology. Fuels often used in CHP plants are:
• Natural gas • Coal, lignite and coke • Biogas • Biomass • Solid waste • Waste gases • Landfill and sewage gases
CHP systems can operate on diverse fuels, which put that technology on a path to becoming a sustainable energy leader. Some cogeneration plants may accept more than one type of fuel. This provides flexibility and security of supply. The disadvantage is an additional cost of that kind of plants. Besides the cost, fuel choice may be limited by the national emission restrictions and other environmental concerns.
Natural gas and oil are highly valued and often used in CHP plants. As a result they are expensive, but they do not require expensive equipment. Coal and heavy oils are cheaper to buy but they inflict significant equipment costs and additional costs for handling environmental limits.
2.2.1 Thermodynamic principles Simultaneous heat and power generation is proceeded by one single process. Every route in a cogeneration plant consists of four main elements (Educogen 2001):
• Engine - a prime mover • Generator • Heat recovery system • Control system

13
In CHP plants different possibilities of the generation phase exist. The main types are shown in Figure 2.4.
Figure 2.4 Common CHP generation types (COGEN Europe 2009) According to Figure 2.4 main generation types are:
• Steam turbine. One of the most common types of plants. Heating system is used as a
steam condenser. • Gas turbine. The fuel used is typically natural gas. • Gas engine. A reciprocating gas engine is more competitive than a gas turbine. The
fuel used is natural gas. • Engine for biofuels. A reciprocating gas engine or a diesel engine is used. • Molten-carbonate fuel cells with a hot exhaust (Educogen 2001)
Combined heat and power plants use different generators, but the most applicable is a steam turbine. Steam turbines are one of the most versatile and oldest technologies used to drive generators. The thermodynamic cycle which describes the process including steam turbine is called the Rankine cycle (Figure 2.5).

14
Figure 2.5 Rankine cycle (Shet, Sundararajan & Mallikarjuna n.d.) Simple, ideal Rankine cycle with water as a working fluid consists of four main phases:
• 1-2: Isentropic liquid compression. Water coming from the condenser at low pressure is directly pumped into the boiler at high pressure. This phase is adiabatically reversible.
• 2-3: Isobaric heat addition in the boiler. The water conversion into steam occurs at a constant pressure. Heat is added to the boiler.
• 3-4: Isentropic expansion in the turbine. A reversible adiabatic expansion of steam occurs there.
• 4-1: Isobaric heat rejection in the condenser. Constant pressure ensures the steam’s conversion into water.
After the turbine, the electricity generator is mounted. Waste heat is recovered into power. When considering processes inside the CHP plant it is necessary to review the Carnot efficiency. The maximal possible thermal efficiency of a system describes the relationship between work delivered to the system and heat which is a cycle output.
휂 = = 1 − (5)
where: η - efficiency,
TH - temperature of hot reservoir, in the case of CHP plant it is the temperature of the steam produced in the boiler,
TC - temperature of cold reservoir
In practice, real CHP efficiency is lower than ideal one. The reason for this is that not all of the fuel is burnt during the process, losses occur during the mechanical devices (pumps, boilers and turbines) operation. The temperature of the steam leaving the boiler is critical to the eventual power cycle efficiency, but the second law of thermodynamics limitation has to be taken into consideration during the CHP plant designing phase.

15
2.2.2 Power cycle equipment Heat from fuel is the main source of energy in CHP plants. To ensure best efficiency and best system performance specific equipment needs to be chosen during the design phase. Two main components which influence the cogeneration efficiency are boilers and turbines. A wide range of technologies are available.
Boilers are used to convert water to high pressure steam, which is further processed in the steam turbines. Steam boilers are classified by the application, type of steam circulation or by combustion method. The major types of boilers are:
• Pile burners, • Grate boilers, • Suspension fired boilers, • Fluidized bed boilers, • Heat recovery steam generators.
Pile burners are a simple technology known for centuries. They are able to handle wet fuels. Typical capacity of individual cell is equal to around 5 MWth, but in terms of scale they could reach 10-15 MWth. The efficiency is quite low and could range between 50 and 60%. Most often a pile burner consists of a two-stage combustion chamber with a separate furnace and boiler which is located above the secondary chamber. First part of air needed in the combustion process is added through the floor and walls. The second part, which accompanies burning gases, reaches the combustion chamber through the pile. As a result heavy emissions occur. Ash is removed manually, after it has been cooled. Pile burners have a system slow response time so they are not commonly used in CHP plants (Overend 2003).
A Grate boiler differs from a pile burner because on the bottom of the furnace it contains a moving grate, cooled by air. As a result ash may be collected continuously. Because of that a cycling operation problem from pile burners may be avoided. Fuel is distributed evenly, by a pneumatic stocker. More efficient combustion is a result of a thin layer in a combustion chamber (Overend 2003). Grate firing is commonly used in small and medium-sized furnaces (15 kW – 30 MW).
Suspension fired boilers rarely appear in biomass CHP plants. They require a fuel with particle size smaller than 1 mm and low moisture. To obtain such a feedstock very energy intensive and cost intensive process has to be performed. Otherwise particles in mentioned size and properties occur in furniture manufacture and they could be combusted in suspension fired boilers (Overend 2003). In last decades fluidized bed boilers have become common all over the world because of the fact that combustion can be performed with different types of fuel. Even low quality fuels could obtain high combustion efficiency in that kind of boiler. Temperature during the combustion phase is low so the NOx emission is reduced. The main principle is based on a layer of sand or sand-like media. The combustion air is blown through the sand layer. This type of combustion ensures high efficiency, low emissions, fuel flexibility and fuel particle size flexibility. There are two main types of fluidized bed boilers:
• Bubbling fluidized bed (BFB) • Circulating fluidized bed (CFB)

16
In the first type the air velocity is low so medium particles are not lifted above the bed and whole combustion occurs in the bed. In the CFB the solids’ velocity is much higher which causes intensive mixing. The air velocity is also high and the medium particles are carried out of the bed. They are captured by a cyclone situated in the outlet of combustor (Teir 2003). Cyclone transfers the particles again to the bottom part of the combustor to ensure that every matter is burnt. It causes the process to be very effective and efficient, limestone material on the bed is wasted slowly and the NOx emission is low. Typically BFB boilers have output lower than 100 MW and CFB boilers range from 100 MW to 500 MW. Circulating fluidized bed boilers become more and more popular in the CHP plants because of theirs high combustion efficiency and environment friendly performance. Heat recovery steam generators (HRSG) are boilers in which heat produced in different stages is recovered and used to produce steam or boil water. HRSG boilers are commonly used in power plants since the steam from the gas turbine is very clean. In those cases boilers are a type called natural circulation. If the life span of the power plant is long enough, the boiler is fitted with an economizer (Teir 2003). Additional burner may be mounted if more power output is needed and the steam temperature is not high enough. The main purpose of HRSG is to cool down the flue gases which are a result of different metallurgical or chemical processes. Consequently, those gases can be further processed or released without causing harm to the environment.
Once the steam has been produced, it reaches its designated temperature and pressure. It is ready to pass through the turbine blades at high velocity to rotate the blades. As a consequence the generator will be turned. The power produced by the generator depends on the steam pressure drop inside the turbines. Steam turbines have been used in different kinds of industrial processes for about 100 years. They are destined to drive a generator or other mechanical machinery like boiler feedwater pump, air compressor or refrigerator. They are widely used in CHP plants. The capacity of steam turbines can range from 50 kW to few hundreds of MW. They can be either single stage or multistage, condensing or non-condensing.
The steam turbine consists of two sets of blades – stationary, called nozzles and a moving - rotor blades. They work together to accelerate the steam to high velocity. Steam goes through the stages, from high to low pressure and then it is exhausted (Energy and Environmental Analysis 2008).
The primary type of steam turbines is called the condensing turbine. It produces only power, with high efficiency. Condenser cooled by river water or cooling tower water condenses the steam into liquid. A small amount of air leaks into the system under the atmospheric pressure, so a small compressor is used to remove it from the condenser.
In the CHP plants, where both power and electricity is generated, two main types of steam turbines are implemented:
• Non-condensing turbine • Extraction turbine
17
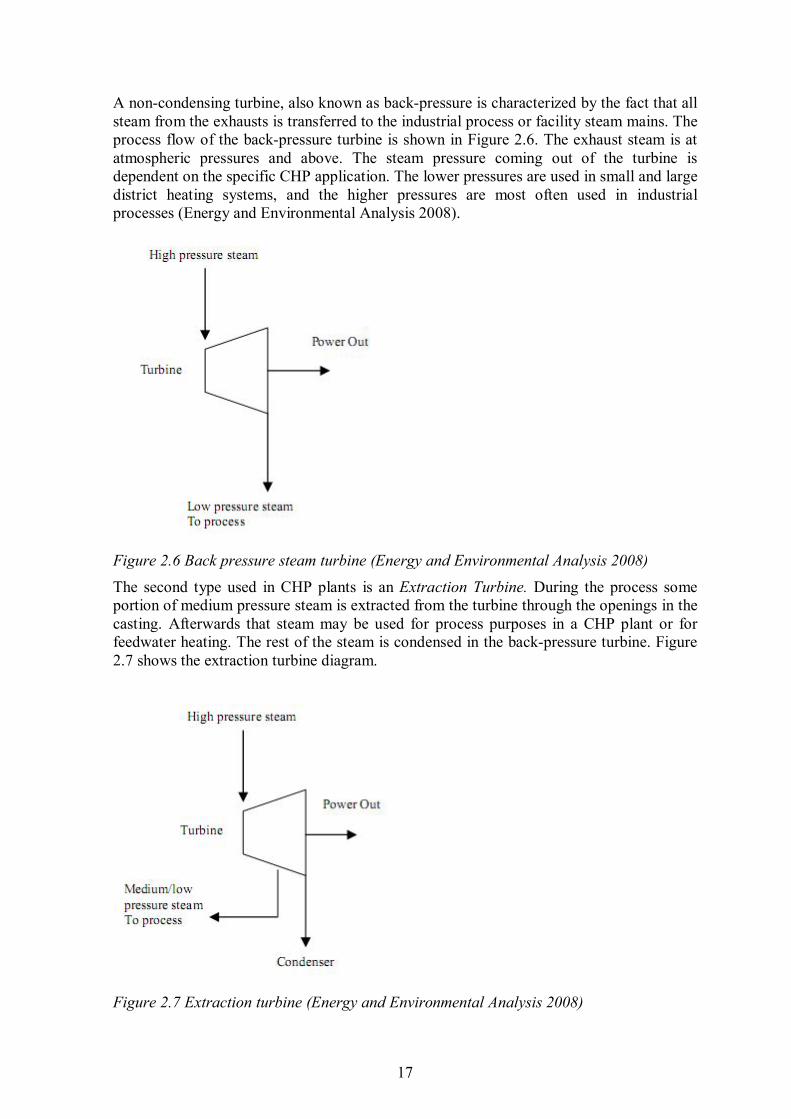
A non-condensing turbine, also known as back-pressure is characterized by the fact that all steam from the exhausts is transferred to the industrial process or facility steam mains. The process flow of the back-pressure turbine is shown in Figure 2.6. The exhaust steam is at atmospheric pressures and above. The steam pressure coming out of the turbine is dependent on the specific CHP application. The lower pressures are used in small and large district heating systems, and the higher pressures are most often used in industrial processes (Energy and Environmental Analysis 2008).
Figure 2.6 Back pressure steam turbine (Energy and Environmental Analysis 2008) The second type used in CHP plants is an Extraction Turbine. During the process some portion of medium pressure steam is extracted from the turbine through the openings in the casting. Afterwards that steam may be used for process purposes in a CHP plant or for feedwater heating. The rest of the steam is condensed in the back-pressure turbine. Figure 2.7 shows the extraction turbine diagram.
Figure 2.7 Extraction turbine (Energy and Environmental Analysis 2008)
18
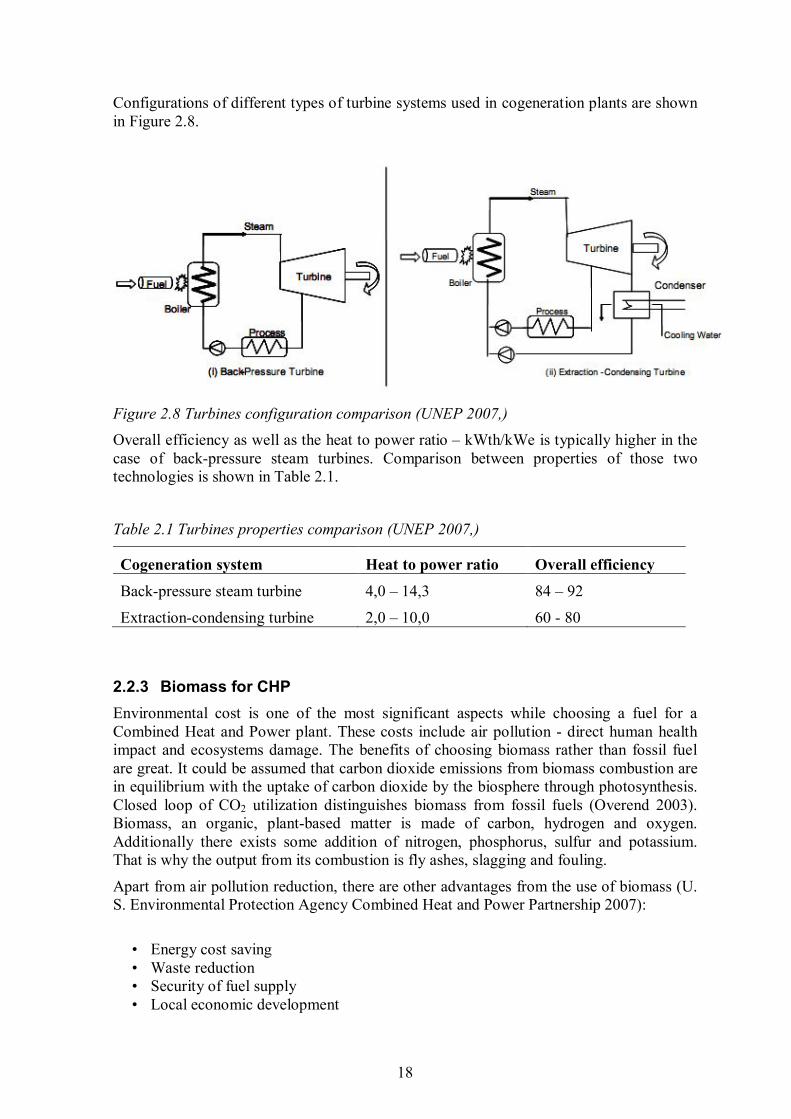
Configurations of different types of turbine systems used in cogeneration plants are shown in Figure 2.8.
Figure 2.8 Turbines configuration comparison (UNEP 2007,) Overall efficiency as well as the heat to power ratio – kWth/kWe is typically higher in the case of back-pressure steam turbines. Comparison between properties of those two technologies is shown in Table 2.1.
Table 2.1 Turbines properties comparison (UNEP 2007,)
Cogeneration system Heat to power ratio Overall efficiency Back-pressure steam turbine 4,0 – 14,3 84 – 92
Extraction-condensing turbine 2,0 – 10,0 60 - 80
2.2.3 Biomass for CHP Environmental cost is one of the most significant aspects while choosing a fuel for a Combined Heat and Power plant. These costs include air pollution - direct human health impact and ecosystems damage. The benefits of choosing biomass rather than fossil fuel are great. It could be assumed that carbon dioxide emissions from biomass combustion are in equilibrium with the uptake of carbon dioxide by the biosphere through photosynthesis. Closed loop of CO2 utilization distinguishes biomass from fossil fuels (Overend 2003). Biomass, an organic, plant-based matter is made of carbon, hydrogen and oxygen. Additionally there exists some addition of nitrogen, phosphorus, sulfur and potassium. That is why the output from its combustion is fly ashes, slagging and fouling.
Apart from air pollution reduction, there are other advantages from the use of biomass (U. S. Environmental Protection Agency Combined Heat and Power Partnership 2007):
• Energy cost saving • Waste reduction • Security of fuel supply • Local economic development

19
• Non-intermittent resource
Biomass could be available from the rural areas in the form of:
• Forest residues and wood wastes – wood chips, yard clippings • Crop residues • Energy crops • Manure biogas
Urban biomass resources are (U. S. Environmental Protection Agency Combined Heat and Power Partnership 2007):
• Wood wastes from cities • Wastewater treatment biogas • Municipal solid waste • Landfill gas • Food residues
Different biomass resources could be combusted in the primary, solid form or converted – gasified to obtain properties required in a specific CHP plant. Conversion from liquid or solid from into other relevant form is used to produce power and/or heat.
Biomass evaluation and selection is a complex process. Available feedstock, its properties and demand have to be carefully estimated during the planning and designing stage. Every failure could cause shortage in supply and low quality of CHP plant performance. Main characteristics taken into consideration during the analysis include (U. S. Environmental Protection Agency Combined Heat and Power Partnership 2007):
• Biomass availability in given area • Typical yearly yield • Moisture content • Energy content • Crop seasonality • Weather dependence • Cost of cultivation • Distance to the nearest plant ~ transportation cost • Availability of other resources which could affect future prices
Use of biomass as a fuel is considered to be carbon neutral. It is assumed that all the plants and trees take some amount of carbon dioxide from the atmosphere and store it while they grow. Biomass combustion in CHP plants or at homes releases the CO2 and returns it to the atmosphere. If the balance is kept and new trees are planted they recapture that CO2 and the carbon cycle is not interrupted. A different situation occurs with coal. The combustion process releases carbon dioxide stored in the ground for millions of years. Additionally coal does not have any storage or sequestration capacity, so it is not considered as a carbon neutral resource.

20
Technology chosen for a specific condition, country and region has to fulfill a list of requirements. Available technology types have to be taken into account to avoid unnecessary problems.
2.3 Steel recycling
Steel is considered as a world's most important and the most widely used material. With the annual production of over 700 000 million tons, steel industry has developed from process and product oriented to a market and consumer oriented industry. Nowadays European Union, which is the second biggest market in the world, is highly focused on high quality manufacturing with high energy efficiency. Innovated steel products are supported by scientists, researchers and skilled workers. Figure 2.9 represents the share of world crude steel production. China is the undisputed leader.
Figure 2.9 Share of world crude steel production, 2009 (World Steel Association 2010a) At the present time steel industry is a powerful and profitable branch which plays an important role in the global economy. Steel as a material, due to its physical, chemical and metallurgical properties, is commonly used and has a wide range of applications. Additional advantages, like reasonable price and lifetime expectancy are the reason why steel today is the most widely used metal. Steel is a major component of buildings construction, tools, mechanical devices, engines, cars, etc. During the 1980s it was mainly used in the construction and automotive sector. Later, the packaging industry became an important customer. It was noticed that steel is a suitable storage material for food and beverages. Other applications are in the electrical and mechanical engineering sector. Because of the fact that pipes made of steel are water, sunlight and oxygen proof makes them strong and durable - they are commonly used in liquid and gaseous fossil fuel transportation. Moreover they are practical in chemical and petrochemical industry and also in oil and gas production. Steel is an alloy made of iron and carbon whose content varies between 0.2% and 2.1% by weight. Percentage of carbon content may differ on steel application. The same is true for various additional alloying elements - manganese, chromium, vanadium, etc. Different parameters used in the production process provide different properties – melting
21
temperature ranges, resistance, brittleness and others. Steel is a constantly researched and tested material, thus the range of steel products and application sectors is constantly expanding. New developments play an important role in product innovations.
The major challenges the steel industry has to confront, the ones having the biggest impact on the steel market in the closest future are access to the raw materials and its cost. In the last few years the Chinese market became the biggest in the world and due to the increasing demand for raw materials from that market the global capacity and production are changing significantly. The European Union faced the threat of shortage of iron ore. It increases the transportation costs and related to that – a final product cost. Transport cost is a significant input factor that is why countries put a lot of effort to improve logistic infrastructure and the functioning of EU suppliers. Access to the iron ore is also a key factor in determining future location investments. Countries like Brazil, India or Russia offer attractive production conditions in terms of good access to raw materials with lower cost of transportation to the production site and also cheaper prices of energy. As a consequence, the European steel producers face the risk of losing control and market share. Due to the imbalances of the steel material market it becomes more profitable to produce steel from the scrap instead of the iron ore. Providing a renewable energy access to the production site may lead to a decrease in high energy prices. Future growth in consumption will force the growth in steel production to satisfy the world’s needs.
2.3.1 Steel production technologies The primary steel production process is highly dependent on coal. Almost 70% of the steel made around the world these days relies on that fossil fuel. The process of making steel consists of removing impurities like sulfur, phosphorus, and excess carbon from iron ore and adding to it the alloying elements such as manganese, nickel, chromium, and vanadium.
Special types of furnaces are used to produce steel. The material which has to be melted is supplied to the furnace and at the same time specific amount of energy is added to melt the material. There exist two main groups of furnaces dedicated to the steel making process:
• Integrated Basic Oxygen Furnace (BOF) • Electric Arc Furnace (EAF)
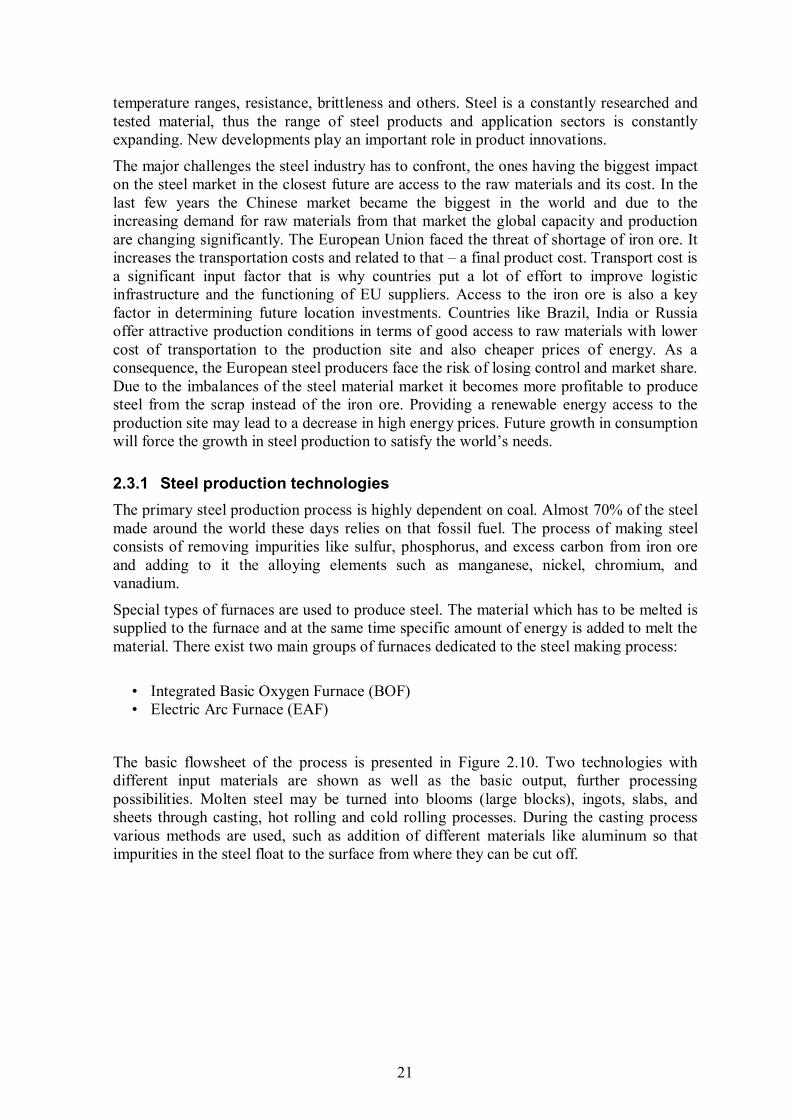
The basic flowsheet of the process is presented in Figure 2.10. Two technologies with different input materials are shown as well as the basic output, further processing possibilities. Molten steel may be turned into blooms (large blocks), ingots, slabs, and sheets through casting, hot rolling and cold rolling processes. During the casting process various methods are used, such as addition of different materials like aluminum so that impurities in the steel float to the surface from where they can be cut off.
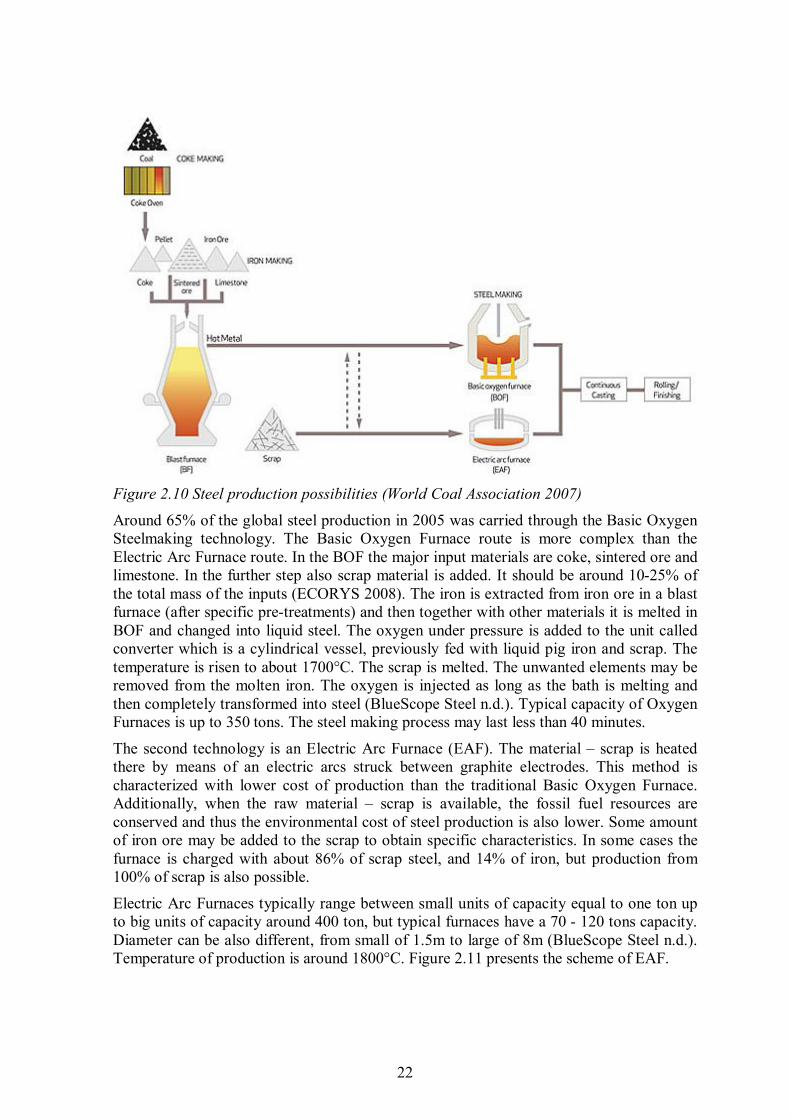
22
Figure 2.10 Steel production possibilities (World Coal Association 2007) Around 65% of the global steel production in 2005 was carried through the Basic Oxygen Steelmaking technology. The Basic Oxygen Furnace route is more complex than the Electric Arc Furnace route. In the BOF the major input materials are coke, sintered ore and limestone. In the further step also scrap material is added. It should be around 10-25% of the total mass of the inputs (ECORYS 2008). The iron is extracted from iron ore in a blast furnace (after specific pre-treatments) and then together with other materials it is melted in BOF and changed into liquid steel. The oxygen under pressure is added to the unit called converter which is a cylindrical vessel, previously fed with liquid pig iron and scrap. The temperature is risen to about 1700°C. The scrap is melted. The unwanted elements may be removed from the molten iron. The oxygen is injected as long as the bath is melting and then completely transformed into steel (BlueScope Steel n.d.). Typical capacity of Oxygen Furnaces is up to 350 tons. The steel making process may last less than 40 minutes.
The second technology is an Electric Arc Furnace (EAF). The material – scrap is heated there by means of an electric arcs struck between graphite electrodes. This method is characterized with lower cost of production than the traditional Basic Oxygen Furnace. Additionally, when the raw material – scrap is available, the fossil fuel resources are conserved and thus the environmental cost of steel production is also lower. Some amount of iron ore may be added to the scrap to obtain specific characteristics. In some cases the furnace is charged with about 86% of scrap steel, and 14% of iron, but production from 100% of scrap is also possible.
Electric Arc Furnaces typically range between small units of capacity equal to one ton up to big units of capacity around 400 ton, but typical furnaces have a 70 - 120 tons capacity. Diameter can be also different, from small of 1.5m to large of 8m (BlueScope Steel n.d.). Temperature of production is around 1800°C. Figure 2.11 presents the scheme of EAF.

23
Figure 2.11 Electric Arc Furnace Layout (World Steel Association 2010b) At first, the furnace is filled with scrap. Power is supplied to the furnace through the graphite electrodes. When the power is added, the arc of electricity from the electrode to the scrap steel is made. The arc in the furnace could be compared to a lightning bolt during a storm. It could generate even 35 MW of electricity. As a result, the temperature inside the furnace is risen to 1600°C - 1800°C. At the same time the side walls and roof of the furnace are cooled by water. After rising the temperature inside, the scrap is being melted. It may be necessary to add some amount of gases and other substances like carbon, oxygen, hydrogen, nitrogen and fluxes in order to remove the leftovers of the impurity from the scrap. The melting process lasts around 80 minutes. Afterwards, the liquid steel is tapped into a ladle and transported to the ladle furnace. There more refining is done and after that the steel can be processed by casting, rolling and then coated and painted. Nowadays new innovations are implemented in the EAF process: two twin DC electrodes may be used, scrap might be preheated and also two (twin) shells might be mounted in the furnace.
Due to the fact that for the thesis’ purpose a fully renewable steel production is considered, only the case of Electric Arc Furnace will be researched. As a comparison some information about Basic Oxygen Furnace will be presented.
2.3.2 Environmental performance Steel production is very energy and fuel intensive. Large amount of CO2 is released every year from steel mills. From the Intergovernmental Panel on Climate Change (IPCC) information it was said that the steel industry accounts for 3-4% of total world greenhouse gas emissions. It was estimated that 1,9 tones of carbon dioxide are emitted for every ton

24
of steel produced in the world. More than 90% of all emissions from the steel sector comes from production in Brazil, China, European Union (27), India, Japan, Russia, Korea, Ukraine and the United States of America. GHG emissions are primarily the result of burning fossil fuels in steel production in developing countries and countries with economies in transition. Steel manufacturers try to concentrate on environmental issues due to the global GHG policy. Kyoto Protocol and national laws in every country put great pressure on reducing emissions from that industry. Although the steel sector has already minimized energy consumption, by 50% since 1975 (World Steel Association 2008), it is still one of the most prominent targets of the Kyoto Protocol. Improvements in energy efficiency, management system, recycling and much more will be required. Reduction quantities have been set for all countries in the world (Tatia 2010).
Three decades ago the advancement in the steel industry began. It initiated the technological innovations but also exposed the environmental threats from this sector. Improved and propagated recycling of steel products and steel production from scrap material may become the most environmental and cost efficient way to meet the global demand. Figure 2.12 presents the comparison in CO2 emission according to different production types. Steel made in combined process in Blast Furnace and Basic Oxygen Furnace is more than four times worse than recycling from 100% of scrap. Even production in Electric Arc Furnace from 70% of scrap and 30% of pig iron (ore) could save approximately 780 kilograms CO2 per ton of liquid steel, when compared to BF-BOF.
Figure 2.12 Emission comparison (Based on Tatia 2010) The more CO2 released means the more energy was used. Production of primary steel from ore is much more energy intensive than recycling - production of secondary steel. The main contributor is the chemical energy required to reduce iron ore to iron. The fact that the input to the EAF process is the scrap all of the fossil fuels is omitted. Table 2.2 shows energy intensity comparison per ton of crude steel produced. In an Electric Arc Furnace it ranges between 9,1 and 12,5 GJ/t and it is two or more times smaller than production in BOF. When little amount of iron ore is added to obtain better steel quality or if scrap quality is bad, the energy consumption as well as the primary energy intensity increase. It is due to the fact that along with the iron, carbon is supplied to the furnace (Price et al.
1174,5
466,4
1959
0
500
1000
1500
2000
2500
EAF 30% Pig iron EAF 100% Scrap BF-BOF
kg C
O2
/ tl
iqui
d st
eel

25
2002). The energy consumption in an Electric Arc Furnace ranges between 350 and 700 kWh/t, but is typically equal to approx. 475 kWh/t (Cruz de Moraes et al. n.d.).
Table 2.2 Energy intensity comparison (per ton of crude steel produced)
Steel production type Energy intensity (GJ/t)
Basic Oxygen Furnace 19,8 – 31,2
Electric Arc Furnace 9,1 – 12,5
It has to be added that energy efficiency of steelmaking mills varies depending on production route, type of iron ore and coal used, mining method, transportation of raw materials, operation control technology, and material efficiency.
2.3.3 Raw materials in steel recycling As it was presented above, the scrap recycling process is performed in the Electric Arc Furnace. Unlike the iron ore and coke, scrap is available all over the world and there are no major reserves of it. Around 500 million tons of scrap is melted each year. Scrap is enriched with limited additions of ferroalloys to obtain a required composition and properties. The main sources of scrap are shown in Figure 2.13. The method of supplying the process with the scrap material can be divided into two main groups:
• Internal scrap – is provided from all of the processes in the steel plant – it is the industry’s own scrap. During the conversion of the raw material to the final product some fraction of the series is lost, damaged or even destroyed because of different system failures. In most of the cases a few percent of the final product is rejected due to the safety margins or quality problems. The percentage of internal scrap varies depending on the type of the process, quality of production and a number of process steps. The amount of internal scrap decrease due to continuous technological improvements.
• Merchant scrap – the source of it is the left over material from industries dependent on steel – car production, mechanical engineering, roof manufacturers, pipeline builders etc. In the same group there is scrap, both domestic and imported, from landfills, car and ship-breaking sites, demolished buildings etc. Merchant scrap represents all of the steel scrap which is available on the market and could be bought. Steel scrap can easily be removed from other recyclables from the landfill because of its magnetic properties.

26
Figure 2.13 The main sources of scrap (based on BlueScope Steel n.d. b) The scrap can be classified according to its main properties, which are (World Steel Association 2010c):
• Chemical composition of steel, e.g. low alloyed and stainless; • Level of impurity elements, e.g. S, P and Cu; • Physical size and shape; • Homogeneity, i.e. the variation within the given specification.
The most valuable and expensive scarp has a low level of impurities. To obtain the highest quality, the size of scarp has to be controlled and modified in the process. Every steel scrap type is standardized for different markets and should also be treated in a different way in the production process. A coarse scrap should not be used in some places in the furnace. A higher quality and more expensive fine scrap should be used. The finer scrap is commonly used to avoid operating problems in the electric arc furnace.
Vehicles
Manufacturing off-cuts
Consumer Durables and Landfill
Industrial Machinery
Demolition
Cans

27
Figure 2.14 Steel scrap prices2005-2008, $/tones (Steel on the net n.d,) Figure 2.14 above represents the general change in scrap prices in years 2005-2008. As it can be noticed, the raw material prices have doubled in the last few years due to the fact that many countries, China especially, have expanded their production. Biomass-based cogeneration and steel recycling technology’s sate of the art from chapter 2 was used as a basis in the further emergy analysis. According to the study goal the emergy evaluation was used to present the sustainability of bio-based processes. Comparison with the coal-based system is included the thesis summary.

28
3 RESEARCH
In the thesis research part the emergy analysis was studied with two cases, cogeneration plant and steel recycling mill. Environmentally friendly systems are introduced. Biomass-based CHP plant and steel plant supplied by mentioned bio-cogeneration plant are analyzed. Next paragraphs are concerned with the same systems, but fueled by coal combustion. Comparison between bio and fossil fuel energy basis are presented. In the further part of the research the Polish bio-based cogeneration and steel industry is presented. Emergy implementation in the country’s bio and fossil fuel-based systems was discussed. First step of all analysis was the generic system diagram design. To obtain it process flow discussion was made. Process description and input demand was calculated according to different study reports. Detailed diagram, with every fundamental step of the processes was created. Adequate energy system symbols were used and the important rules of the designing process were followed. System boundaries were determined. Essential inputs were placed on the left side, the rest of them from the top. Wastes created during the whole production process were located at the bottom of the system boundary and the outputs on the right side. Each input, process, assets, arrows between symbols and other components were located in the diagram according to the Odum’s rules. Secondly the reduced diagram was made by aggregating similar items into group categories. Less significant phases were neglected.
To fill the emergy table, all transformities of every input were selected. Some of them were calculated, the rest was available in the emergy data bases. Embodied solar energy based environmental accounting for renewable energy based heat, power and steel recycling processes was evaluated from the emergy tables.
The same work was carried out for fossil based systems; cogeneration and steel mill. Some assumptions remained from bio-based and some were added to obtain realistic data. Emergy in seJ and transformities were compared to analyze the resource consumption and environmental impact.
It could be summarized that each case study was divided into four main steps: • Process description and emergy system diagram, • List of inputs and raw data, • Transformity values, • Emergy table
3.1 Biomass-based Cogeneration Plant case study
Biomass based Cogeneration Plant study case was chosen to be based on the existing plant in Forssa, Finland. Plant description, equipment type and main characteristics were taken from the report Kirjavainen et al. 2004. Other issues like plant location, fuel used and biomass transport distance were estimated according to the general study goal. Due to the fact that both analyzed plants – CHP and steel mill should be located close to each other and in the same time they should be located in the suitable places, to meet the market requirements, it was not possible to find such a neighborhood with existing plants. However emergy analysis could be performed on the theoretical case studies, because

29
accurate data about processes, cogeneration and steel recycling, is available in the literature. As it was presented in the state of the art part, cogeneration plants differ from each other in efficiency, fuel and technology used. Use of a biomass in heat and power production can be highly environmentally beneficial. Biomass (as a renewable resource) combustion does not contribute to additional CO2 pollution to the atmosphere, especially from the CO2 emission point of view. Since the thesis goal puts effort on the renewability of all processes, only renewable fuels were used during all stages of the cogeneration production. Forssa cogeneration plant involves a steam cycle. Due to that fact different type of renewable fuel can be used. Plant characteristics needed in the emergy analysis are presented in the Table 3.1.
Table 3.1 Forssa plant characteristics
Cogeneration plant Forssa, Finland
Power output 17 MW
Heat output 48 MW
Fuel type wood chips / wood residue
Fuel input 71,7 MW
Total efficiency 90,9%
Electrical efficiency 24%
Thermal efficiency 66%
Technology Bubbling Fluidized Bed boiler, η=85%
Steam temperature 510°C
Steam pressure 62 bar
Steam flow 22,8 kg/s
Commercially available and well know all over the Europe is combination of fluidized bed boilers and steam turbines as a prime mover. Typical cycle containing both of the technologies, describing all important stages, is presented in the Figure 3.1.

30
Figure 3.1 Biomass based cogeneration system – elements (UNEP 2007) Additional assumption made, concerning CHP plant, is that the production is continuous, 8000 hours per year. Due to that fact, the steel recycling plant - the main customer’s heat and power demand will be met. The other assumption is that biomass with the oxygen addition is fully combusted in the boiler.
3.1.1 Process stages, system diagram Figure 3.1 presents the overview of the processes inside the cogeneration plan. Next step of the analysis was the system diagram, which helped to understand the way how the system was surrounded and what were the inputs and outputs. To obtain the diagram short overview of the main stages was analyzed.
Biomass preparation
Biomass used as a fuel in the cogeneration plant has to be prepared before it could be used to generate power and as a consequence of combustion – a steam. Solid, woody biomass has to be transported from the forest or field by the truck tippers and conveyors. Stored feedstock is classified, sorted and then dried. Conveyors are engaged in biomass metering which is then transported to the cogeneration site. Biomass preparation phase was neglected in the emergy analysis due to the data shortage and low overall environmental impact.
Transportation process
Biomass fuel used in CHP plants is usually logged in the close neighborhood. Transportation costs are reduced in that way. Forest residues are carried to the plant site by

31
trucks or rail. For the thesis purpose road transport was chosen. Distance between plant and feedstock source is 100 km. Fuel used in the trucks is a soybean biodiesel.
Biomass pretreatment
The pretreatment process dries out humidity from the feedstock. Steam used in the preheating comes from the internal process in cogeneration plant. The lower the moisture contents of the biomass feedstock the higher the energy efficiency of the combustion process. Therefore, biomass preheating with heat from the process reduces the steam available for steam generation.
Combustion
Fuel is burned in boiler to produce steam at a specified pressure. Boiler efficiency is a significant factor in the whole cogeneration process. In the CHP study case boiler efficiency is equal to 85%. Air is added to make the combustion possible. Usually approximately 5% of water is lost in the cycle flow. It has to be filled up from the water pretreatment stage. Only purified water could be added to the system to avoid turbine or pipes’ corrosion.
Turbine stage
Steam produced from water heated by biomass combustion in boiler is fed into turbine to generate electricity. Turbine used in this study case is a back-pressure turbine. The steam leaving the turbine is at a much lower pressure. Turbine efficiency and its losses matter in the process total efficiency.
Electricity generation
After the turbine converts thermal energy from the high-pressure steam system into mechanical energy to drive the generator and in consequence generate the electricity. It could be stored or send to the industry.
Steam sent to industry or DH
Medium pressure steam is sent to industry or to the district area. Cooling and condensation occurs. In the case of this study, main customer is the steel recycling mill located close to the CHP plant
Ash conditioning
Some part of the ash is light and could be easily carried out of the boiler. Fly ash does not drop and it goes out of the stack. Emissions could be controlled by electrostatic precipitators. The rest of the ash, solid particles, has to be removed from the boiler. Its amount was determined as well as the disposal cost.
System emergy diagram By knowing main stages in the steam and power production and all inputs and relations between individual elements the emergy diagram was made. Usually few diagrams are made and the last one, the simplified one, is used in further analysis. In case of cogeneration system no stages were omitted. It was decided that all components and resources are understandable and important in the whole analysis. CHP system diagram, designed according to Odum’s rules, is presented in Figure 3.2.

32
Figure 3.2 CHP system emergy diagram Components, resources and input energy included in the system diagram were the basis data in the emergy table evaluation.
3.1.2 Input analysis All inputs in the system were divided into three groups: material, service and energy. Due to that fact the input determination was applied, which is shown in the Table 3.2.
Table 3.2 Input division
Input type Name Material Biomass
Material Water
Material Oxygen (in air)
Material Investment cost
Energy Electricity
Energy Thermal energy
Service Labor
Service Biomass transport
Service Ash disposal cost

33
Input properties, analysis The next step in the emergy evaluation was the input demand calculation. Each of the input was converted into basic units – grams, Joules, euro etc.
Biomass feedstock
Wood and forest residues are considered as the most commonly used and cheap biomass fuel for heat and power cogeneration. The availability of feedstock in close proximity to a biomass CHP plant is a critical factor. Pine was chosen as a cogeneration plant fuel. Its properties are presented in the Table 3.3.
Table 3.3 Pine biomass properties (Alakangas 2000)
Property Amount
Carbon content 52,3%
Hydrogen content 6,1%
Oxygen content 41,2%
Nitrogen content 0,08%
Sulfur content 0,01%
Chloride content 0%
Ash content 0,7%
Moisture content 50%
Higher heating value [MJ/kg] 20,62
Lower heating value – dry [MJ/kg] 19,31
Due to the productivity from Table 3.1 biomass annual input is equal to 71,7MW, which amounts to 2,06E+15 J. Since the lower heating value of pine is 19,31 MJ/kg the annual fuel demand in grams was calculated. It amounts to 1,07E+11 g.
Water demand
Steam flow in plant amounts to 22,8 kg/s. Water losses are 5%. Water demand per one year is equal to:
22,6 ∙ 3600 ∙ 8000ℎ ∙ 5% = 3,28퐸10 푔 (6)
Oxygen demand
To obtain the oxygen amount needed in the combustion process the basic assumption was made. Biomass – pine composition (in percentage) was taken into consideration as well as the total annual fuel demand in kilograms. According to chemical processes which occur during the combustion, the oxygen needed to react with each of matter was counted. Due to the fact that 41,19% of total pine mass is oxygen it was subtracted from the amount needed in combustion. Below all chemical reactions are presented.

34
퐶 + 푂 = 퐶푂 (7) 6푔 − 16푔 5,59퐸07 − 푥 푥 = 1,49퐸08 푔
푁푂 + 0,5푂 = 푁푂 (8) 15푔 − 8푔 8,55퐸04 − 푥 푥 = 4,56퐸04 푔
푆 + 푂 = 푆푂 (9)
16푔 − 16푔 1,07퐸04 − 푥 푥 = 1,07퐸04 푔
퐻 + 0,5푂 = 퐻 푂 (10) 2푔 − 8푔 6,51퐸06 − 푥 푥 = 2,6퐸07 푔
Therefore, the oxygen demand is equal to 1,31E+11 g.
Investment cost
Investment cost of a cogeneration plant is equal to 23,9 millions of euro, according to Kirjavainen 2004. The same example – Forssa CHP plant was used. Total investment cost was divided by the investment lifetime - 20 years. It assured that every input in the emergy calculation process was based on a one-year plan. In that case annual cost is € 1,20E+06
Electricity
Electricity used by the plant itself was assumed to be equal to the example in coal CHP plant (Peng et al. 2008).
= 10,33% (11)
Power used by plant amounts to 5,11E+13 J.
Steam
As above, example was taken from Italian CHP plant (Peng et al. 2008).
= 28,63% (12)

35
From equation 12 it was calculated that steam used by the plant amounts to 3,95E+14 J.
Labor
No real data for labor cost in biomass based cogeneration plant was available. The operation and maintenance cost of coal-based CHP plant was taken from the article Mani et al. 2010. It was amount to 5,56 M$. In that value the internal electricity consumption cost, labor charge, debt payment and plant maintenance cost was included. Due to that fact the maintenance, as an additional input, was not needed anymore. (exchange rate: 1€ = 1,34$, date: 24.11.2010) 5,56E+06$ = 4,15E+06€
Transport
Basic assumption in the study case was that every fossil fuel has to be replaced by biofuels, if possible. To obtain that unitary road transport was taken into account. As a fuel the soybean biodiesel was applied.
Two main assumptions concerning transportation phase are:
• Distance – 100km • Amount of biomass needed to be delivered – 1,07E+11g
Ash disposal
Biomass annual demand is 1,07E+08 kg. Pine ash content is equal to 0,74%. The ash output was calculated. It is equal to 7,91E+05 kg.
The summary of input analysis is presented in the Table 3.4.
Table 3.4 Input summary
Name Unit Value/year Pine biomass J 2,06E+15
Water g 3,28E+10
Oxygen g 1,31E+11
CHP investment cost € 1,20E+06
Electricity J 5,11E+13
Thermal energy J 3,95E+14
Labor € 4,15E+06
Biomass transport kg ∙ km 1,07E+08 ∙ 100
Ash outlet g 7,91E+08
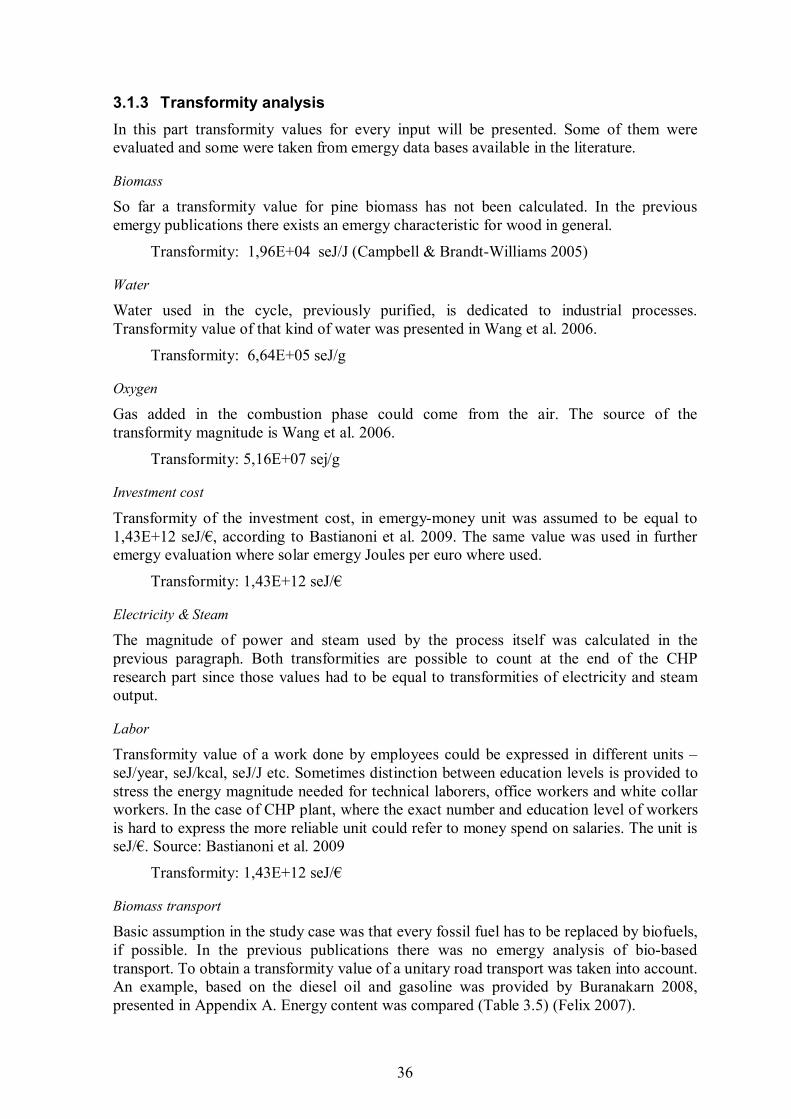
36
3.1.3 Transformity analysis In this part transformity values for every input will be presented. Some of them were evaluated and some were taken from emergy data bases available in the literature.
Biomass
So far a transformity value for pine biomass has not been calculated. In the previous emergy publications there exists an emergy characteristic for wood in general.
Transformity: 1,96E+04 seJ/J (Campbell & Brandt-Williams 2005)
Water
Water used in the cycle, previously purified, is dedicated to industrial processes. Transformity value of that kind of water was presented in Wang et al. 2006.
Transformity: 6,64E+05 seJ/g
Oxygen
Gas added in the combustion phase could come from the air. The source of the transformity magnitude is Wang et al. 2006.
Transformity: 5,16E+07 sej/g
Investment cost
Transformity of the investment cost, in emergy-money unit was assumed to be equal to 1,43E+12 seJ/€, according to Bastianoni et al. 2009. The same value was used in further emergy evaluation where solar emergy Joules per euro where used.
Transformity: 1,43E+12 seJ/€
Electricity & Steam
The magnitude of power and steam used by the process itself was calculated in the previous paragraph. Both transformities are possible to count at the end of the CHP research part since those values had to be equal to transformities of electricity and steam output.
Labor
Transformity value of a work done by employees could be expressed in different units – seJ/year, seJ/kcal, seJ/J etc. Sometimes distinction between education levels is provided to stress the energy magnitude needed for technical laborers, office workers and white collar workers. In the case of CHP plant, where the exact number and education level of workers is hard to express the more reliable unit could refer to money spend on salaries. The unit is seJ/€. Source: Bastianoni et al. 2009
Transformity: 1,43E+12 seJ/€
Biomass transport
Basic assumption in the study case was that every fossil fuel has to be replaced by biofuels, if possible. In the previous publications there was no emergy analysis of bio-based transport. To obtain a transformity value of a unitary road transport was taken into account. An example, based on the diesel oil and gasoline was provided by Buranakarn 2008, presented in Appendix A. Energy content was compared (Table 3.5) (Felix 2007).

37
Table 3.5 Energy content comparison
Fuel type Energy content [MJ/l]
Diesel 36,4
Gasoline 35
Biodiesel 32,5
Afterwards, annual fossil fuel demand (diesel and gasoline) from that unitary process was summed and replaced by biodiesel. The transformity of soybean biodiesel was checked. It is equal to 2,19E+05 seJ/J (Felix 2007). Therefore the emergy evaluation of a clean transportation process was done. Results are presented in the Table 3.6.
Table 3.6 Biodiesel-based road transport. Emergy evaluation
No Item Unit Input resource
Solar emergy (seJ/unit) Emergy (seJ)
Truck materials 1 Conventional steel g 4,88E+12 1,78E+09 8,69E+21
2 High-strength steel g 9,74E+11 1,78E+09 1,73E+21 3 Stainless steel g 1,57E+11 1,78E+09 2,79E+20
4 Other steels g 1,57E+11 1,78E+09 2,79E+20 5 Iron g 1,39E+12 1,78E+09 2,47E+21
6 Aluminum g 6,50E+11 1,63E+10 1,06E+22 7 Rubber g 4,70E+11 4,30E+09 2,02E+21
8 Plastics/composite g 8,62E+11 3,28E+09 2,83E+21 9 Glass g 3,25E+11 4,26E+09 1,38E+21
10 Copper g 1,57E+11 6,77E+10 1,06E+22 11 Zinc die castings g 5,60E+10 6,77E+10 3,79E+21
12 Power metal parts g 1,01E+11 6,70E+09 6,77E+20 13 Other materials g 3,58E+11 1,00E+09 3,58E+20
Road construction 14 Cement g 4,42E+13 2,20E+09 9,72E+22
15 Bitumen g 1,89E+14 3,80E+08 7,18E+22 16 Aggregates g 0,00E+00 1,00E+09 0,00E+00
17 Steel g 7,83E+12 1,78E+09 1,39E+22 18 Concrete pipe g 6,82E+12 1,20E+09 8,18E+21
19 Lumber J 7,47E+14 4,40E+04 3,29E+19

38
20 Fuel J 2,25E+16 6,60E+04 1,49E+21
21 Aluminum culvert g 3,20E+09 1,63E+10 5,22E+19 Fuel used
22 Petroleum gas J 2,39E+16 4,80E+04 1,15E+21 23 Soybean biodiesel J 8,89E+18 2,19E+05 1,95E+24
Services
24 Human services (construction) $ 3,56E+09 1,31E+12 4,66E+21
25 Human services (drivers) $ 1,28E+09 1,31E+12 1,68E+21
26 Other human services (profit) $ 3,31E+10 1,31E+12 4,34E+22
27 Annual Yield of Trucks t km 1,33E+12 1,54E+12 2,04E+24
From the transport emergy analysis the biodiesel based transformity value was calculated. It is equal to 1,54E+12 seJ/tkm. That value was used in further evaluation.
Ash disposal
Ash disposal transformity value could be expressed in emergy-dollar unit. The annual disposal cost was assumed according to Mani et al. 2010. It amounts to 1,6E+05 $, which is equal to 1,19E+05€ (exchange rate: 1€ = 1,34$, date: 24.11.2010).
Transformity: 1,43E+12 seJ/€
Outputs analysis
To obtain the final emergy value of a steam and power produced two remaining transformities were needed to be counted. Since transformity of steam going in to the process has to be equal to the one going out. System of two equations was made. First one presents the emergy balance:
푑 ∙ 휏 + 푑 ∙ 휏 + 푀 = 표 ∙ 휏 + 표 + 휏 (13)
where:
ds – steam demand
휏 s – steam transformity
dp – power demand
휏 p – power transformity Mother - emergy of other inputs
os – steam output op – power output

39
The second equation was based on the power to steam emergy ratio.
푀푀 =
휂휂
휂휂
(14)
where:
M1 – electricity emergy content M2 – thermal energy emergy content
ηCHPe – electrical efficiency in cogeneration plant ηCHPs – thermal energy efficiency in cogeneration plant
ηe – electrical efficiency in (non-cogeneration) power plant = 36% ηs – thermal energy efficiency in non-cogeneration plant = 85%
Table 3.7 presents the emergy evaluation before the electricity and steam transformities calculation.
Table 3.7 Steam and power transformity evaluation for biomass-based CHP
No. Item Unit Value/year Solar transf. (seJ/unit)
Solar emergy (seJ)
Material 1 Biomass J 2,06E+15 1,96E+04 4,04E+19 2 Water g 3,28E+10 6,64E+05 2,18E+16
3 Oxygen (in air) g 1,31E+11 5,16E+07 6,76E+18 4 CHP investment cost € 1,20E+06 1,43E+12 1,72E+18
Energy 5 Electricity J 5,11E+13 훕p 6 Thermal energy J 3,95E+14 훕s
Service 7 Labor € 4,15E+06 1,43E+12 5,93E+18 8 Biomass transport tkm 1,08E+07 1,54E+12 1,66E+19
9 Ash disposal cost € 1,19E+05 1,43E+12 1,70E+17
Output 10 Electricity J 4,95E+14 훕p M1
11 Steam J 1,38E+15 훕s M2
By solving two equations system steam and electricity transformities were calculated. They are equal to:
• Steam transformity – 3,49E+04 seJ/J • Electricity transformity – 8,38E+04 seJ/J

40
3.1.4 CHP emergy table With the steam and power transformity values the emergy table was filled (Table 3.8). The same values were used in the second study case where power and thermal energy are the process inputs.
Table 3.8 Biomass-based CHP emergy table
No. Item Unit Value/year Solar transf. (seJ/unit)
Solar emergy (seJ)
Material 1 Biomass J 2,06E+15 1,96E+04 4,04E+19 2 Water g 3,28E+10 6,64E+05 2,18E+16
3 Oxygen (in air) g 1,31E+11 5,16E+07 6,76E+18 4 CHP investment cost € 1,20E+06 1,43E+12 1,72E+18
Energy 5 Electricity J 5,11E+13 8,38E+04 4,28E+18 6 Thermal energy J 3,95E+14 3,49E+04 1,38E+19
Service 7 Labor € 4,15E+06 1,43E+12 5,93E+18 8 Biomass transport tkm 1,08E+07 1,54E+12 1,66E+19 9 Ash disposal cost € 1,19E+05 1,43E+12 1,70E+17
Output 10 Electricity J 4,95E+14 8,38E+04 4,15E+19 11 Steam J 1,38E+15 3,49E+04 4,82E+19
Electricity transformity is equal to 8,38E+04 seJ/J and the thermal energy transformity amounts to 3,49E+04 seJ/J. Those two values were used in the second study case. Table 3.9 presents the contribution on the cogeneration emergy output.
Table 3.9 Impact on the solar emergy
No. Item Solar emergy (seJ)
Contribution
Material 1 Biomass 4,04E+19 45,0%
2 Water 2,18E+16 0,02% 3 Oxygen (in air) 6,76E+18 7,5%
4 CHP investment cost 1,72E+18 1,9%
Energy 5 Electricity 4,46E+18 4,8%
6 Thermal energy 1,43E+19 15,4%
Service 7 Labor 5,93E+18 6,6%

41
8 Biomass transport 1,97E+19 18,5%
9 Ash disposal cost 1,70E+17 0,2%
Output 10 Electricity 4,32E+19
11 Steam 5,01E+19
The biggest contributor in the total solar emergy value of cogeneration process is the fuel used – pine biomass (45%). Due to the lower heating value, lower than e.g. coal or other fossil fuels, more biomass is needed to meet the specific power and thermal energy demand. Two other inputs which have the big influence on the emergy output are the energy used by the system itself (approx. 20%) and the biomass transport (18,5%).
3.2 Steel recycling study case
Steel recycling mill emergy analysis was based on the theoretical data. European Union report (ECORYS 2008) provides accurate information about steel industry. Most of the assumptions needed in the analysis were available in the EU report as well as on the official World Steel Association website (Steelonthenet 2010).
The main assumption which connects both study cases is that energy and power from biomass based CHP plant is sold to steel mill to assure environmentally friendly production. It was assumed that recycling plant was situated close to cogeneration plant to minimize transmission losses. Steel production was based on scrap, no other raw material like iron ore was added in the production cycle. Scrap was transported by trucks fueled by biodiesel. In the case of steel recycling plant, where the main input is the metal scrap, primary inputs are not required. Their presence would cause a typical problem in the emergy analysis – double counting. Even metal scrap previously used to be a final product and for its production all resources were needed – water, iron ore, etc. In the recycling process no primary resources were used.
List of inputs necessary in steel production was provided by Steelonthenet 2010. It is shown in Table 3.10. It has to be noted that the model is a generalized cost which may vary on the age of the plant and equipment, location and policy in specific country, workers availability, theirs competences etc. Demand was calculated for 1 ton of molten steel.
Table 3.10 Steel production input list (per 1 ton of molten steel)
Item Demand Unit Unit cost [$] Fixed [$] Variable [$] Total $/unit
Steel scrap 1,132 t 315 356,58 356,58
Scrap delivery 1,132 t 5 5,66 5,66 Oxygen 14 m3 0,08 1,12 1,12
Ferroalloys 0,014 t 1400 19,60 19,60 Fluxes 0,043 t 30 1,29 1,29
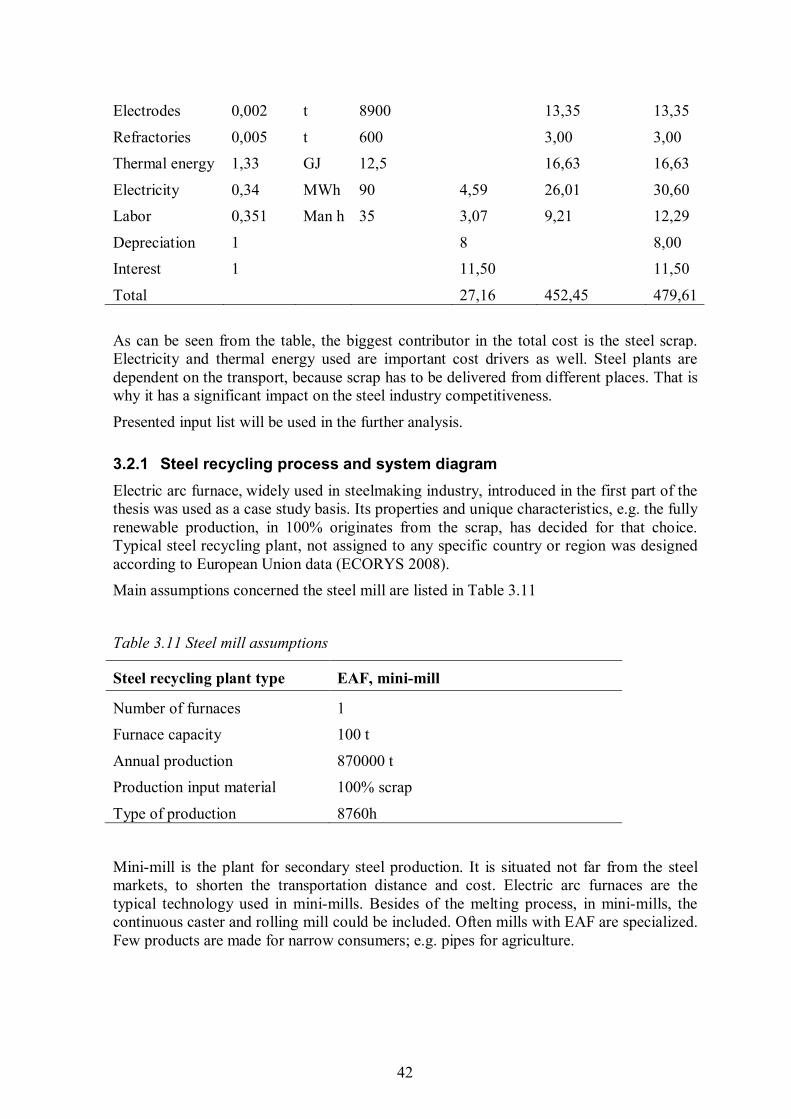
42
Electrodes 0,002 t 8900 13,35 13,35
Refractories 0,005 t 600 3,00 3,00 Thermal energy 1,33 GJ 12,5 16,63 16,63
Electricity 0,34 MWh 90 4,59 26,01 30,60 Labor 0,351 Man h 35 3,07 9,21 12,29
Depreciation 1 8 8,00 Interest 1 11,50 11,50
Total 27,16 452,45 479,61
As can be seen from the table, the biggest contributor in the total cost is the steel scrap. Electricity and thermal energy used are important cost drivers as well. Steel plants are dependent on the transport, because scrap has to be delivered from different places. That is why it has a significant impact on the steel industry competitiveness.
Presented input list will be used in the further analysis.
3.2.1 Steel recycling process and system diagram Electric arc furnace, widely used in steelmaking industry, introduced in the first part of the thesis was used as a case study basis. Its properties and unique characteristics, e.g. the fully renewable production, in 100% originates from the scrap, has decided for that choice. Typical steel recycling plant, not assigned to any specific country or region was designed according to European Union data (ECORYS 2008). Main assumptions concerned the steel mill are listed in Table 3.11
Table 3.11 Steel mill assumptions
Steel recycling plant type EAF, mini-mill
Number of furnaces 1 Furnace capacity 100 t
Annual production 870000 t Production input material 100% scrap
Type of production 8760h
Mini-mill is the plant for secondary steel production. It is situated not far from the steel markets, to shorten the transportation distance and cost. Electric arc furnaces are the typical technology used in mini-mills. Besides of the melting process, in mini-mills, the continuous caster and rolling mill could be included. Often mills with EAF are specialized. Few products are made for narrow consumers; e.g. pipes for agriculture.

43
Steel recycling process description
Scrap transportation
Previously collected and separated metal scrap is delivered to the steel recycling mill by the trucks.
Scrap loading into baskets
In some EAF mills, where scrap preheating is held, the baskets may be pushed to a scrap preheater. Hot gases are used to heat the scrap and recover some part of energy. Overall plant efficiency is increased after this phase.
Scrap charging
The basket with the metal scrap is taken to the EAF furnace area. When the roof is swung off, the scrap is charged. Loading phase has to be carried out very carefully because of the fact that at the bottom of the furnace there is situated a liquid steel so tons of scrap metal falling down could cause small molten steel eruption and dust clouds.
Melting phase
When all scrap is placed in the furnace, the roof has to be closed and the graphite electrodes (typically three) are lowered towards the scrap. Heating and melting operation starts when the electrical power is turned on and the arc which occurs between the electrodes and the solid metal heats up the scrap. The first molten steel occurs at the bottom of the furnace.
Sampling and chemical analysis
The chemical sampling may be an automatic process carried out via special lances. Oxygen and carbon content could be measured via special probes immersed in the molting steel. Other chemical matters are controlled on an arc-emission spectrometer.
Slag formation
During the melting phase the oxygen is blown to the furnace to improve the combustion process. In the same time the slag is formatted on the surface of the molten steel. Slag is made of metal oxides (e.g. CaO which occurs in the form of burnt lime and MgO in the form of dolomite and magnesite) and while forming on the top of the liquid it acts as a blockade for excessive heat loss as well as helps to reduce damage of the refractory lining inside the furnace. Chemical matter which forms the slag is added during the melting phase or before, in the scrap charges phase.
Oxidation of carbon, phosphor, manganese, silicon, aluminum
When more slag formers are added and more oxygen is blown into the furnace impurities such as silicon, sulfur, phosphorus, aluminum, manganese and calcium are burned out and removed.
Sampling - temperature control
Temperature sampling adequately to previous sampling is carried out via automatic lances. Other matters are analyzed on an arc-emission spectrometer.

44
De-slagging
During the slag formation the oxygen is removed from the steel.
Tap – out
As the scrap is melted, more volume is available inside the furnace. At a certain point power is switched off, the furnace roof is opened, and another scrap basket is loaded into the furnace. The power is switched on again and melting of the second basket starts. When all scrap baskets (usually 2 or 3) have been melted, the heating continues for some time in order to superheat the steel to the target temperature at tapping. During this period - usually referred to as the refining period - some metallurgical operations such as desulfurization, dephosphorization and decarburization, may be performed. When the steel has obtained the correct composition and temperature, the furnace power is switched off and the furnace is tapped. Often, a few tons of liquid steel and slag is left in the furnace to help preheat the next charge of scrap and accelerate its meltdown.
Line maintenance
During the tap-out phase the furnace is turned around. It enables the slag door to be cleaned. Any additional repairs may be performed. The furnace interior is checked – the electrodes are inspected for damage or lengthened through the addition of new segments; the taphole is filled with sand at the completion of tapping.
Process diagram First diagram, with all process stages is presented in Figure 3.3.
Figure 3.3 Detailed steel recycling diagram

45
Due to the fact that some stages are less important in the emergy analysis, few phases were omitted. Simplified diagram (Figure 3.4) is easy to understand how the system is surrounded and what are the main inputs and outputs. Diagram provides information necessary to fill the emergy evaluation table.
Figure 3.4 Simplified steel recycling diagram
3.2.2 Input analysis From the European Union report (ECORYS 2008) a list of inputs needed per one ton of steel output was made. The annual production of 870000 tons of steel was multiplied by every raw data. Results are presented in Table 3.12.
Table 3.12 Steel manufacture demand per 1 ton, annual demand
Item Factor Unit Annual demand
Steel scrap 1,132 t 9,85E+5 Scrap transportation 1,132 t 9,85E+5
Oxygen 14 m3 1,22E+07 Ferroalloys 0,014 t 1,22E+10
Fluxes 0,043 t 3,74E+10 Electrodes 0,002 t 1,74E+03
Refractories 0,005 t 4,35E+03 Thermal energy 1,33 J 1,16E+15

46
Electricity 0,34 J 1,06E+15
Labor 12,29 $ 1,07E+07 Investment cost 450 $ 1,96E+07
According to cogeneration case study steel process inputs were divided into the same three categories. It is shown in Table 3.13.
Table 3.13 Steel recycling input division
Input type Name
Material Scrap
Material Oxygen
Material Ferroalloys
Material Fluxes
Material Electrodes
Material Refractories
Material Investment cost
Energy Electricity
Energy Thermal energy
Service Labor
Service Scrap transport
Input demand - discussion
Scrap
Metal scrap, previously classified and sorted, is the main input in the production process. It could come from different sources, from landfill or metallurgic industries. To produce one ton of molten steel 1,132 ton of scrap is needed (ECORYS 2008).
Additional assumption is that steel scrap delivered to the mill is already collected and segregated and those processes are no more needed to be done in the EAF steel plant. Whole transported material is directly placed in the baskets and is ready to be processed
Oxygen
Gas added to the process after the melting phase is pure oxygen. It is blown in to the electric arc furnace to purify the steel.
Ferroalloys
During the production process different metals (ferroalloys) are added to the steel to give it the required chemical composition and in a consequence – required quality and properties. Amount of the ferroalloys and their chemical constitution depend on the further steel application. One example of the metal added to the process is the ferrochrome (FeCr). It is

47
an alloy of chromium and iron with the share of chromium between 50-70%. Around 10-20% of chromium is required in the stainless steel production.
Fluxes
The fluxes are necessary input in the steel production. Application of fluxes is a guarantee that the melting material would be well insulated and the whole process would obtain specific properties. During the recycling process in EAF a lime flux consisting of quicklime or a blend of quicklime and dolomitic lime is added. Flux amount and composition varies on the steel type. It provides thermal and chemical insulation and promotion of heat flow in the steelmaking process. The lime flux removes impurities and forms a slag that can be separated from the steel. It also reduces refractory wear.
Electrodes
Three electrodes lowered towards the scrap at the beginning of the melting phase are made of graphite.
Refractories
Refractories are the fire resisting matters which are located as a thick layer inside the furnace. The conditions inside the electric arc furnace are highly demanding because of the continuous need of high performance and constant quality. The chemical composition of refractories ensures required properties like high durability. It is necessary mainly against a mechanical wear-out, high temperature damage, slag effects and resistance to metal penetration. Refractories may be placed in the bottom, in the sub hearth and in the upper part of the wall in the furnace. Table 3.14 presents the chemical composition of 4 types of the monolithic refractories used in the electric arc furnaces.
Table 3.14 Refractories – chemical composition (based on BBUNL n.d.)
No. MgO % Max SiO2 %Max
1 85 6.5 2 87 5.5
3 91 3.5 4 95 1.0
Investment cost
According to EU data (ECORYS 2008) EAF mills require a total investment of approximately $450/ton capacity. The lifetime of the plant was assumed to be equal to 20 years. Investment cost presented in the Table 3.12 was previously divided by the lifetime of the mill to present the yearly emergy cost.
Labor Since the total number of workers involved in the production process was not possible to calculate and was not available in the literature, the final annual labor demand was expressed in employee’s salaries (Table 3.12).

48
Scrap transport
Since 1,132 t of scrap is needed per one ton of steel and the annual production amounts to 870.000 tons, 9,85E+05 tons of scrap has to be transported every year.
Energy demand
To produce 1 ton of steel in the Electric Arc Furnace 0,34 MWh of electricity and 1,33 GJ of thermal energy is required. Power was taken from CHP plant from biomass-based case study. Electricity is a main input in the melting phase. It feeds three graphite electrodes to generate an electric arc and as a consequence to melt the metal scrap. Thermal energy is used mainly in scrap preheating. It is generated by gas combustion. Due to thesis purpose a renewable gas was taken into account. Biogas – natural gas was chosen to meet a heat demand.
3.2.3 Transformity analysis In this part transformity values for every input will be described.
Scrap
In the previous publications concerning metal recycling the transformity of the main input – metal was equal to the transformity value of the metal made for the first time – from ores. In that situation metal recycled for a second, third etc. time always had higher emergy output when compared to the new one as more and more energy and services would be added with the recycling process. Even if in the process renewable energy and renewable resources were used. That is why for the purpose of the thesis research scrap emergy as an input was assumed to be zero. Because of that main contributors in the process emergy were easy to describe. Energy used and its source of supply had the bigger impact and could emphasize environmental concerns.
Oxygen
Analysis of steel recycling inputs from Table 3.12 assumed that 14m3 of oxygen is required per one ton of steel processed. Since the common transformity unit is in seJ/g simple calculation was needed. Since the density is equal to 1,43 kg/m3 and pressure is 1 atm, the mass of oxygen amounts to 20020g. To ensure suitable conditions in the melting process 20020 g of oxygen was demanded per 1 ton of steel. The annual production was assumed to be 870000 tons so yearly oxygen demand was equal to 1,7E+10 g.
Air transformity, used in CHP case was taken from literature (Wang et al. 2006, transformity: 5,16E+07 seJ/g). To obtain transformity of oxygen a separate emergy evaluation was made, according to data from Garrett 1989. Table 3.15 presents emergy evaluation of oxygen. Investment cost and labor was omitted. Electricity and thermal energy transformities were taken from biomass-based cogeneration plant from previous study.
Table 3.15 Oxygen emergy evaluation, based on biomass CHP
No. Item Unit Value/kg Solar transf. (seJ/unit)
Solar emergy (seJ)

49
Material 1 Air g 3,90E+03 5,16E+07 2,01E+11
Energy 2 Thermal energy J 3,23E+06 3,49E+04 1,13E+11
3 Electricity J 1,58E+06 8,38E+04 1,33E+11
Output 4 Oxygen g 1,00E+03 4,47E+08 4,47E+11
Transformity: 4,47E+08 seJ/g
Ferroalloys
Transformity of the ferroalloys is different with different composition. For the purpose of the thesis it was assumed that the ferroalloys are chemicals in general.
Transformity: 9,90E+09 seJ/g (Peng et al. 2008)
Fluxes
Transformity of specific fluxes has not been determined yet. The main component of fluxes dedicated for Electric Arc Furnace is limestone; its transformity value was used in the analysis.
Transformity: 9,80E+08 seJ/g (Peng et al. 2008)
Electrodes
Transformity value of electrodes used in EAF was provided by Odum 1996.
Transformity: 1,78E+09 seJ/g
Refractories
Transformity of refractories has not been determined yet. Since they have specific chemical composition the transformity value could be assumed to be equal to the transformity of chemicals.
Transformity: 9,90E+09 seJ/g (Peng et al. 2008)
Investment cost
As in the case of other inputs expressed in seJ/€ unit, the investment cost transformity was taken from Bastianoni et al. 2009.
Transformity: 1,43E+12 seJ/€
Labor
The same as in the first case study, labor transformity value was assumed to be in emergy-money basis. It was assumed that reliable data from EU report (ECORYS 2008) should assure accurate labor input magnitude.
Transformity: 1,43E+12 seJ/€ (Bastianoni et al. 2009)
Scrap transport
To obtain as precise value as possible an emergy-money unit was used to express the emergy cost of scrap transport.
Transformity: 1,43E+12 seJ/€ (Bastianoni et al. 2009)

50
Energy demand
To produce 1 ton of steel in the Electric Arc Furnace 0,34 MWh of electricity. Transformity value was taken from the biomass CHP case study to ensure a clean energy source.
Transformity of electricity: 8,38E+04 seJ/J
Thermal energy
Per 1 ton of molten steel 1,33 GJ of thermal energy is required. Natural gas transformity was taken from Bastianoni et al. 2009.
Transformity: 4,35E+04 seJ/J
3.2.4 Steel recycling emergy table With each annual input demand and each transformity the emergy table was filled. Since there was only one output – molten steel, no additional calculation concerning output transformity ratio was needed. Emergy evaluation result is shown in Table 3.16.
Table 3.16 Steel recycling emergy evaluation
No. Item Unit Value/year Solar transf. (seJ/unit)
Solar emergy (seJ)
Material 1 Scrap g 9,85E+11 0 0
2 Oxygen g 1,74E+10 4,47E+08 7,78E+18
3 Ferroalloys € 1,27E+07 1,43E+12 1,82E+19
4 Fluxes g 3,74E+10 9,80E+08 3,67E+19
5 Electrodes g 1,74E+09 1,78E+09 3,10E+18
6 Refractories g 4,35E+09 9,90E+09 4,31E+19
7 Investment cost € 1,46E+07 1,43E+12 2,09E+19
Energy 8 Electricity J 1,06E+15 8,38E+04 8,92E+19
9 Thermal energy J 1,16E+15 4,35E+04 5,03E+19
Service 10 Labour € 7,98E+06 1,43E+12 1,14E+19
11 Scrap transport € 3,67E+06 1,43E+12 5,25E+18
Output 12 Steel g 8,70E+11 3,23E+08 2,81E+20
In the following calculation, the main emergy contributors to steel recycling were studied and presented in Table 3.17.
Table 3.17 Impact on the total emergy
No. Item Solar emergy (seJ) Contribution
Material 1 Scrap 0

51
2 Oxygen 8,99E+17 2,8%
3 Ferroalloys 1,82E+19 6,5%
4 Fluxes 3,67E+19 13,1%
5 Electrodes 3,10E+18 1,1%
6 Refractories 4,31E+19 15,3%
7 Investment cost 2,09E+19 7,4%
Energy 8 Electricity 9,91E+19 31,8%
9 Thermal energy 4,50E+19 17,9%
Service 10 Labour 1,14E+19 4,1%
11 Scrap transport 5,25E+18 1,9%
Output 12 Steel 2,78E+20
Table 3.16 presents the emergy analysis of a 100-ton capacity EAF furnace supplied by the electricity and thermal energy from renewable sources. Biomass-based CHP plant from the fist study case was used in that purpose. The results show that the main emergy contributor in recycling is the electricity used - 31,8%. Also thermal energy from biogas (17,9%), refractories (15,3%) and fluxes (13,1%) influences the process in the emergy point of view.
The comparison of solar emergy between renewable energy and fossil energy employed in recycling steel plant was evaluated in the next chapter.
3.3 Fossil fuel-based systems
Emergy analysis prepared for two systems from paragraph 3.1 and 3.2 was based on the renewable energy. To obtain a wider overview how energy source influences the system energy demand and its environmental impact a comparison with fossil-based processes was made.
3.3.1 Coal-based CHP case study Adequately to the previous CHP study case all inputs and main assumptions remain. The same cogeneration plant was used as a basis. The same fuel demand and energy & thermal output were achieved. It was assumed that no technological changes were needed. The same type of boiler, the Bubbling Fluidized Bed boiler, with the same efficiency of 85% was used in the emergy evaluation.
Table 3.18 Main assumptions in the coal-based CHP plant
Cogeneration plant Forssa, Finland
Power output 17 MW
Heat output 48 MW
Fuel type Hard coal

52
Fuel input 71,7 MW
Total efficiency 90,9%
Electrical efficiency 24%
Thermal efficiency 66%
Technology Bubbling Fluidized Bed boiler, η=85%
Steam flow 22,8 kg/s
Carbon content in the fuel 80 - 90%
Fuel energy content 25 MJ/kg
The system diagram is essentially similar as in the biomass CHP study. New input demand was calculated. According to Peng et al. 2008 – a coal based CHP system was used to evaluate a magnitude of resources used in that kind of cogeneration technology. All transformities for coal, limestone and chemicals were provided by that publication. Investment cost was assumed to be the same as for the biomass-based cogeneration plant. The new equation system, according to equation system from the biomass-based CHP plant (eq. 13, 14), was prepared to obtain electricity and thermal energy transformity. From that evaluation it was calculated:
• Solar transformity of electricity - 1,37E+05 seJ/J • Solar transformity of thermal energy – 5,70E+04 seJ/J
Coal-based emergy evaluation was made. Results are shown in Table 3.19.
Table 3.19 Coal-based CHP emergy evaluation
No. Item Unit Value/year Solar transf. (seJ/unit)
Solar emergy (seJ)
Material 1 Coal J 2,06E+15 3,92E+04 8,09E+19
2 Water g 3,28E+10 6,64E+05 2,18E+16
3 Oxygen (in air) g 1,22E+11 5,16E+07 6,31E+18
4 Investment cost € 1,20E+06 1,43E+12 1,72E+18
5 Limestone g 9,19E+09 9,80E+08 9,00E+18
6 Chemicals g 7,26E+07 9,90E+09 7,18E+17
Energy 7 Electricity J 5,11E+13 1,37E+05 7,00E+18
8 Thermal energy J 3,95E+14 5,71E+04 2,25E+19
Service 9 Labor € 4,15E+06 1,43E+12 5,93E+18
10 Fuel transport tkm 8,25E+06 1,54E+12 1,27E+19
11 Ash disposal cost € 1,19E+05 1,43E+12 1,70E+17
Output 12 Electricity J 4,95E+14 1,37E+05 6,78E+19

53
13 Steam J 1,38E+15 5,71E+04 7,88E+19
List of inputs with their impact on final solar emergy is presented in Table 3.20.
Table 3.20 Coal-based CHP – input contribution
No. Item Solar emergy (seJ)
Contribution
Material 1 Coal 8,09E+19 55,2%
2 Water 2,18E+16 0,0%
3 Oxygen (in air) 6,31E+18 4,3%
4 Investment cost 1,72E+18 1,2%
5 Limestone 9,00E+18 6,1%
6 Chemicals 7,18E+17 0,5%
Energy 7 Electricity 7,18E+18 4,8%
8 Thermal energy 2,31E+19 15,4%
Service 9 Labor 5,93E+18 4,0%
10 Fuel transport 1,50E+19 8,7%
11 Ash disposal cost 1,70E+17 0,1%
Output 12 Electricity 6,96E+19 13 Steam 8,09E+19
Adequately to the biomass-based cogeneration emergy analysis the main contributor is the fuel used – in this case a coal. It accounts to approximately 55,2% of total solar emery impact. The second is thermal energy produced by the plant itself (15,4%). Coal transport has also big influence.
3.3.2 Steel recycling based on the fossil energy In the case of steel recycling mill no significant change was necessary. The only modification occurred in electricity transformity value, which was taken from emergy analysis of coal-based cogeneration plant and in oxygen transformity. Gas transformity was calculated in the adequate process to Table 3.15. Thermal energy and power used there was taken from fossil-based cogeneration study. Oxygen transformity evaluation is shown in Table 3.21
Table 3.21 Oxygen emergy evaluation, based on coal-CHP
No. Item Unit Value/kg Solar transf. (seJ/unit)
Solar emergy (seJ)
Material 1 Air g 3,90E+03 5,16E+07 2,01E+11

54
Energy 2 Thermal energy J 3,23E+06 5,70E+04 1,84E+11
3 Electricity J 1,58E+06 1,37E+05 2,17E+11
Output 4 Oxygen g 1,00E+03 6,02E+08 6,02E+11
Fossil-based emergy evaluation is shown in Table 3.22.
Table 3.22 Steel recycling emergy analysis based on fossil energy
No. Item Unit Value/year Solar transf. (seJ/unit)
Solar emergy (seJ)
Material 1 Scrap g 9,85E+11 0 0
2 Oxygen g 1,74E+10 6,02E+08 1,05E+19
3 Ferroalloys € 1,27E+07 1,43E+12 1,82E+19
4 Fluxes g 3,74E+10 9,80E+08 3,67E+19
5 Electrodes g 1,74E+09 1,78E+09 3,10E+18
6 Refractories g 4,35E+09 9,90E+09 4,31E+19
7 Investment cost € 1,46E+07 1,43E+12 2,09E+19
Energy 8 Electricity J 1,06E+15 1,37E+05 1,46E+20
9 Thermal energy J 1,16E+15 4,35E+04 5,03E+19
Service 10 Labor € 7,98E+06 1,43E+12 1,14E+19
11 Scrap transport € 3,67E+06 1,43E+12 5,25E+18
Output 12 Steel g 8,70E+11 3,97E+08 3,45E+20
Percent of participation in final steel emergy output is shown in Table 3.23.
Table 3.23 Steel emergy, input contribution
No. Item Solar emergy (seJ) Contribution
Material 1 Scrap 0
2 Oxygen 8,99E+17 3,0%
3 Ferroalloys 1,82E+19 5,3%
4 Fluxes 3,67E+19 10,6%
5 Electrodes 3,10E+18 0,9%
6 Refractories 4,31E+19 12,5%
7 Investment cost 2,09E+19 6,0%
Energy 8 Electricity 1,50E+20 42,3%
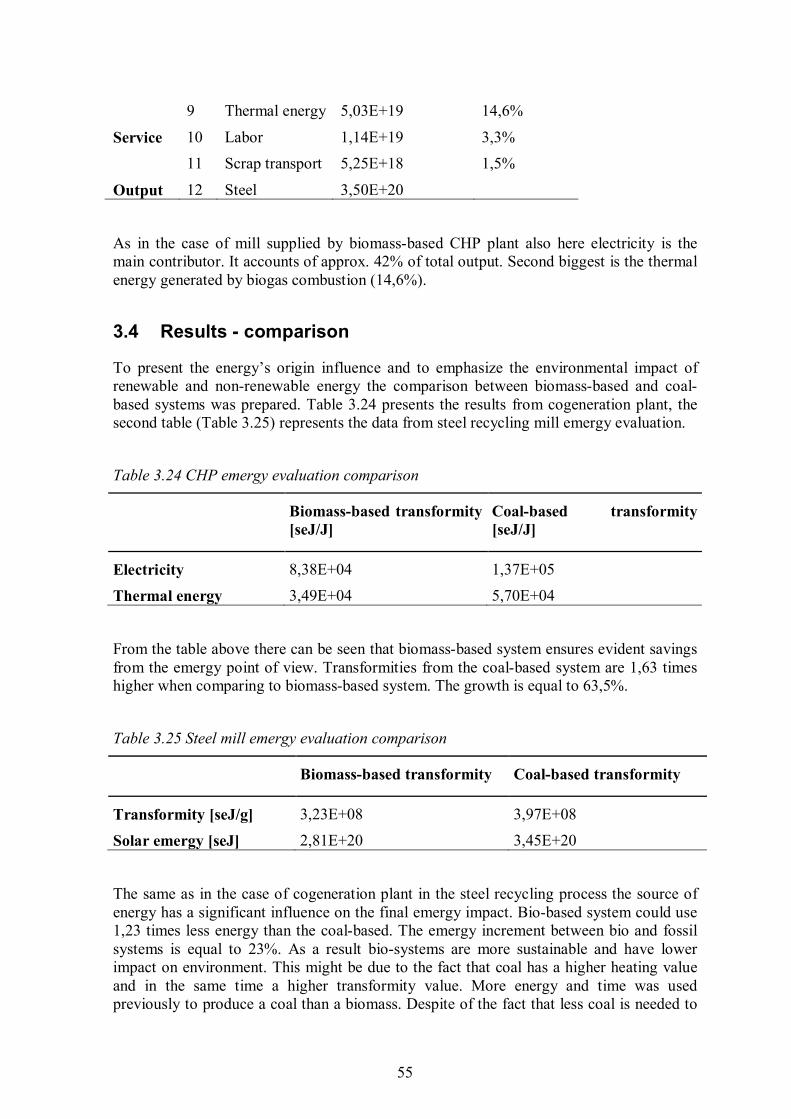
55
9 Thermal energy 5,03E+19 14,6%
Service 10 Labor 1,14E+19 3,3%
11 Scrap transport 5,25E+18 1,5%
Output 12 Steel 3,50E+20
As in the case of mill supplied by biomass-based CHP plant also here electricity is the main contributor. It accounts of approx. 42% of total output. Second biggest is the thermal energy generated by biogas combustion (14,6%).
3.4 Results - comparison
To present the energy’s origin influence and to emphasize the environmental impact of renewable and non-renewable energy the comparison between biomass-based and coal-based systems was prepared. Table 3.24 presents the results from cogeneration plant, the second table (Table 3.25) represents the data from steel recycling mill emergy evaluation.
Table 3.24 CHP emergy evaluation comparison
Biomass-based transformity [seJ/J]
Coal-based transformity [seJ/J]
Electricity 8,38E+04 1,37E+05
Thermal energy 3,49E+04 5,70E+04
From the table above there can be seen that biomass-based system ensures evident savings from the emergy point of view. Transformities from the coal-based system are 1,63 times higher when comparing to biomass-based system. The growth is equal to 63,5%.
Table 3.25 Steel mill emergy evaluation comparison
Biomass-based transformity Coal-based transformity
Transformity [seJ/g] 3,23E+08 3,97E+08
Solar emergy [seJ] 2,81E+20 3,45E+20
The same as in the case of cogeneration plant in the steel recycling process the source of energy has a significant influence on the final emergy impact. Bio-based system could use 1,23 times less energy than the coal-based. The emergy increment between bio and fossil systems is equal to 23%. As a result bio-systems are more sustainable and have lower impact on environment. This might be due to the fact that coal has a higher heating value and in the same time a higher transformity value. More energy and time was used previously to produce a coal than a biomass. Despite of the fact that less coal is needed to

56
generate the same electricity and power – the final solar emergy value of the fuel is higher. Moreover bio-CHP and bio-based steel processes emit lower amount of CO2. The lower the transformity value the less energy and resources were used to produce specific product. Since the bio-based systems have lower specific emergy it could be concluded that they are more sustainable than coal-based. By knowing the main contributors in the emergy evaluation – fuel used and transportation phase additional analyses could be performed to minimize the environmental impact. Turn into renewables could benefit in different aspects of humans life, environment’s health and in fossil resources depletion.
3.5 Emergy implementation in Polish cogeneration and steel industry market
In the paragraph Polish cogeneration and steel industry is presented. Theoretical potential of using emergy analysis in biomass-based CHP plant and in bio-energy-based steel mills is discussed. Results from emergy analysis comparison from previous paragraph are taken into account in the discussion.
3.5.1 Bio-based cogeneration Poland, one of the largest countries in Central Europe, has very fragmented power system. With approximately 400 power plants it is one of the largest power markets in that part of Europe. Usually in every bigger city there is a DH (district heating) system. The trend over last few years has been a decline in plants number due to the centralization and technology exchanging.
Cogeneration is a well known technology in Polish market. It is used in both – district heating and in industries, like sugar, chemical, textiles and paper factories and in steel mills. Technical and numerical development in CHP market depends on the heat demand of district areas. It was estimated than more than 15% of Polish electricity generation is supplied by cogeneration plants (Black & Veatch n.d). Cogeneration share in electricity market is shown in Figure 3.5.
Figure 3.5 Cogeneration share in electricity production in Poland (Surma 2009)
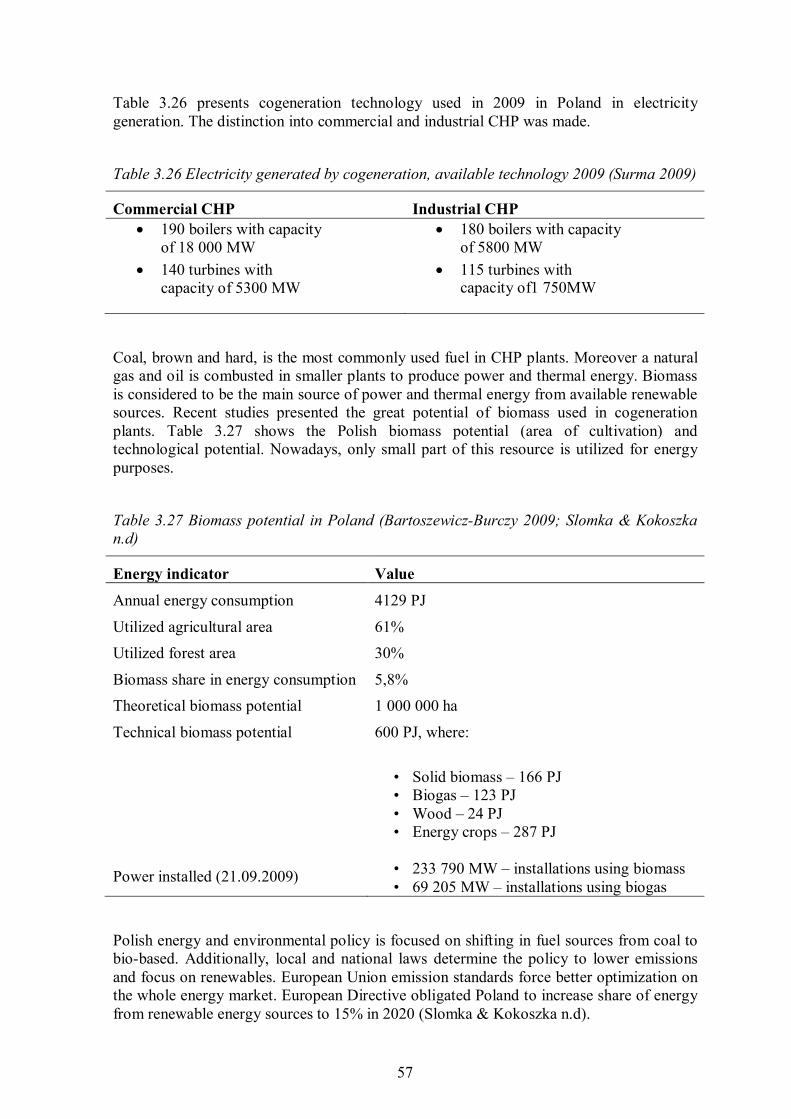
57
Table 3.26 presents cogeneration technology used in 2009 in Poland in electricity generation. The distinction into commercial and industrial CHP was made.
Table 3.26 Electricity generated by cogeneration, available technology 2009 (Surma 2009)
Commercial CHP Industrial CHP 190 boilers with capacity
of 18 000 MW 140 turbines with
capacity of 5300 MW
180 boilers with capacity of 5800 MW
115 turbines with capacity of1 750MW
Coal, brown and hard, is the most commonly used fuel in CHP plants. Moreover a natural gas and oil is combusted in smaller plants to produce power and thermal energy. Biomass is considered to be the main source of power and thermal energy from available renewable sources. Recent studies presented the great potential of biomass used in cogeneration plants. Table 3.27 shows the Polish biomass potential (area of cultivation) and technological potential. Nowadays, only small part of this resource is utilized for energy purposes.
Table 3.27 Biomass potential in Poland (Bartoszewicz-Burczy 2009; Slomka & Kokoszka n.d)
Energy indicator Value Annual energy consumption 4129 PJ
Utilized agricultural area 61% Utilized forest area 30%
Biomass share in energy consumption 5,8% Theoretical biomass potential 1 000 000 ha
Technical biomass potential 600 PJ, where:
• Solid biomass – 166 PJ • Biogas – 123 PJ • Wood – 24 PJ • Energy crops – 287 PJ
Power installed (21.09.2009) • 233 790 MW – installations using biomass
• 69 205 MW – installations using biogas
Polish energy and environmental policy is focused on shifting in fuel sources from coal to bio-based. Additionally, local and national laws determine the policy to lower emissions and focus on renewables. European Union emission standards force better optimization on the whole energy market. European Directive obligated Poland to increase share of energy from renewable energy sources to 15% in 2020 (Slomka & Kokoszka n.d).

58
3.5.2 Steel market in Poland Poland is a steelmaking country. Large metal industry sector evolved after the Second World War. Today there exist tens of large and small steel mills. Two of them, in Katowice and Cracow city, are a multi-million tons, the rest is middle size and small (Metals Consulting International 2009). The branch is much regionalized, but the main production is placed in the southern part of the country. The Polish market of steel distribution is more dispersed than the analogous markets of Western Europe.
Annual demand for finished steel products in Poland currently amounts to approximately 11 million tons. With approximately 300 kg per capita consumption, Poland is slowly closing in on the EU average of 400 kg. Two southern regions account for 40% of steel demand due to the spread of steel demand (Metals Consulting International 2009).
Steel plants in Poland struggle with high energy cost, low productivity, low working conditions and high emission levels. Due to environmental protection policy much progress has been made in those areas as well as in a waste management. In Poland the legislative weaknesses and problem with land ownership cause uncertainty in a waste management responsibility. More than a half of the steel demand comes from building and machine construction and infrastructure industry. The situation is steel consumption is expected to be improved in the future because of the automotive industry.
Steel production In 2008 when Poland produced 7,1 million metric tons of crude steel the Blast Oxygen Furnace contribution was 45,4% and Electric Arc Furnace – 54,6% which was 3,9 million metric tons. Figure 3.6 shows changes in the Polish steel production according to the production method in the years 2005-2009.
Figure 3.6 Manufacture of crude steel by process (Polish Steel Association 2010) Black color indicates production in BOF technology and red – in EAF. As can be seen from the figure in 2009, during the global crisis, Polish steel industry was badly declined. Lower consumption reduced the finished goods prices. Additionally high electricity prices lead to fall in crude steel output. Cheaper steel was and is being imported from China. Competition among steel suppliers from Asia and Europe is constantly growing.
Electric Arc Furnace, predominant technology in Polish market is highly dependent on the electricity prices. This is related to the price of energy from coal combustion. In 2010

59
declines in sales and production have slowed in steel-consuming sectors. Due to positive economic development Polish steel industry started to improve their reality. On the other hand foreign industries which placed their divisions in Poland cooperate with still mills which create a chance in sphere of production and material demand. Prospects for the steel industry in Poland are promising. It was analyzed that demand for steel will be continuously driven by investments in the infrastructure, energy sector, road and rail transport and in different new industries located in the country (Polish Steel Association 2010).
3.5.3 Polish market – emergy analysis implementation Steel market, a highly important sector in Polish economy, where a scrap-based Electric Arc Furnace is predominated technology, could cooperate with bio-based cogeneration plants. Biomass with its large potential could be commonly used in CHP plants associated with steel recycling mills, because different biomass sources are available in the whole Polish territory. Avoiding the high prices of gas would lower the electricity prices – one of the biggest barriers to a sustainable development of the steel sector. Significant reduction in CO2 and other emissions are the additional advantage. Emergy analysis of bio-based CHP system supplying with electricity and thermal energy the Electric Arc Furnace steel recycling mill showed an environmentally friendly mutual cooperation. From a steel case study it was presented that in system supplied by biomass combustion instead of coal combustion a transformity value (which is an inverse value of the system energy effectiveness) was approximately 1,23 times lower. Such cooperation could support achieving a renewable energy targets by lowering the emissions. Emergy evaluation, adequate to the one analyzed in the thesis, could be easily performed in every steel mill in Poland to investigate the environmental impact of present configuration. Later, bio-based cogeneration supply option should be taken into account for a comparison. The transformity and fuel cost comparison would provide a general overview of a sustainable development.

60
4 CONCLUSIONS
In the thesis study, the energy based environmental accounting using the embodied solar energy approach (emergy) was carried out. Two combustion fuels in a cogeneration process were studied. Woody biomass and coal fired alternatives were used in the emergy evaluation. Secondly two types of energy from a CHP plant were studied in the hypothetical steel recycling mill. In each pair of results which represented renewable and fossil-based energy utilization, a transformity value and solar emergy output were compared. The analysis showed that:
• In case of a cogeneration plant the ratio between fossil and green energy’s
transformities amounts to 1,63, which corresponds to 63% of emergy growth. • In the steel emergy evaluation the ratio was equal to 1,23; difference - 23%.
The emergy analysis proved that the fuel type was the main contributor in the final solar emergy output. From the literature review it was clear that the lower the specific emergy (the transformity) of the products, the fewer resources were demanded from nature and society to produce goods or services. Therefore the emergy analysis describes the energy based sustainability of the system. The main contributors affecting sustainability can be tracked down by the analysis, research and development studies and other engineering methods directed to improve the aspects most hampering sustainability.
Emergy methodology was adopted for analyzing process concepts from the sustainability point of view. Majority of transformities available in literature are typically fossil energy based, so analyses based on renewable energy are needed. Moreover, calculations made in different countries supply a different magnitude of transformity values. By using data from different publications, a significant inaccuracy can result. When considering an emergy-money unit the uncertainty is even higher and could cause a mistake in further comparisons and sustainability index calculations. Emergy analysis as a method rooted in thermodynamics is energy sustainability focused. It was developed to express every inflow and outflow - energy, materials, labor and economic services, as solar energy units. It however, does not describe the emissions creating environmental pollution, which affects the biosphere. Therefore a separate analysis (for example a Life Cycle Assessment) for other environmental effects is needed to complement the emergy method. The LCA method, which usually does not include labor and information, was developed for the environmental assessment of industrial processes. It includes only direct environmental inputs. Future work concerning the Polish market should be based on a real steel mill data analysis. Specific transportation distance, investment cost and chemicals added during the melting phase could provide more precise results. As a complement, a Life Cycle Assessment evaluation may be performed to investigate the pollution magnitude. Two analyses together would provide comprehensive information, contributing to ecosystems and sustainability dynamics. Additionally, knowing the transformity values from a cogeneration process and a steel mill would mean those processes could be easily compared with adequate processes to evaluate the environmentally friendly technologies. Transformity values computed in the study case could provide data for further emergy analyses of different process alternatives and markets.

61
REFERENCES
Alakangas, E 2000, ‘Properties of fuels used in Finland’, VTT. Research Notes 2045, Espoo.
Bartoszewicz-Burczy, H 2009, Country Study on Political Framework and Availability of Biomass, Institute of Power Engineering Warsaw, viewed 19 January 2011, http://www.central2013.eu/fileadmin/user_upload/Downloads/outputlib/4biomass_country_study_Poland.pdf
Bastianoni S, Campbell, DE, Ridolfi, R, Pulselli, FM 2009, ‘The solar transformity of petroleum fuels’, Ecological Modelling, vol. 220, pp. 40-50.
Bastianoni, S, Facchini, A, Susani, L, Tiezzi, E 2007, ‘Emergy as a function of exergy’, Energy, vol. 32, pp. 1158–1162.
BBUNL n.d., Refractories for Electric Arc Furnace EBT (UHP), Bharat Bhari Udyog Nigam Ltd, India, viewed 22 October 2010, http://www.bbunl.com/refractories_electric_ebt.html Black & Veatch n.d., Poland, Country Profile, European Bank for Reconstruction and Development, viewed 20 January 2011, http://www.ebrdrenewables.com/sites/renew/countries/Poland/profile.aspx
BlueScope Steel n.d. a, Steelmaking, Australia, viewed 22 December 2010, http://www.bluescopesteel.com/about-bluescope-steel/student-information/steelmaking
BlueScope Steel n.d. b, Recycling in the Steel Industry, viewed 22 December 2010, http://www.bluescopesteel.com/about-bluescope-steel/student-information/recycling-in-the-steel-industry Brown, M, Ulgiati, S 2004, ‘Energy quality, emergy, and transformity: H. T. Odum’s contributions to quantifying and understanding systems’, Ecological Modelling, vol. 178, pp. 201–213.
Brown, MT, Ulgiati, S 2002, ‘Emergy evaluations and environmental loading of electricity production systems’, Journal of Cleaner Production, vol. 10, pp. 321–334.
Buranakarn, V 1998, ‘Evaluation of recycling and reuse of building materials using the energy analysis method, PhD thesis, University of Florida, Gainesville.
Campbell, DE, Brandt-Williams, SL 2005, Environmental Accounting Using Emergy: Evaluation of the State of West Virginia, U.S. Environmental Protection Agency, Office of Research and Development, National Health and Environmental Effects Research Laboratory, Atlantic Ecology Division, Narragansett, RI 02882.
COGEN Europe 2009, What is Cogeneration?, 7 February, viewed 18 November 2010, http://www.cogeneurope.eu/category/about-cogen/what-is-cogeneration/
Cruz de Moraes, G, Filho, W, Grant, M, Shifrin, V, Popenov, A, Delabroy, O, Oliveira, F n.d., Implementation of PYREJET Technology in Electric Arc Furnaces at Siderurgica Barra Mansa, ACI, div of Air Liquide Advanced Technologies US LLC, viewed 18 November 2010,

62
http://www.americancombustion.com/file/otherelement/pj/12%20pyrejet_barra_mansa48726.pdf ECORYS 2008, Study on Competitiveness of the European Steel Sector, Within the Framework Contract of Sectoral Competitiveness Studies – ENTR/06/054, Rotterdam. ECORYS 2008, Study on the Competitiveness of the European Steel Sector, viewed 15 November 2010, http://ec.europa.eu/enterprise/sectors/metals-minerals/files/final_report_steel_en.pdf
EDUCOGEN 2001, A guide to cogeneration, The European Association for the Promotion of Cogeneration, http://www.cogeneurope.eu/wp-content/uploads//2009/02/educogen_cogen_guide.pdf
Energy and Environmental Analysis 2008, Technology Characterization: Steam Turbines, Arlington, USA.
Felix, ER 2007, ‘Integrated energy, environmental and financial analysis of biofuels production from switchgrass, hybrid poplar, soybean and castorbean’, MSc thesis, University of Maryland, College Park. Garrett, DE 1989, Chemical Engineering Economics, Van Nostrand Reinhold, New York
Hau, J, Bakshi, B 2004, ‘Promise and problems of emergy analysis’, Ecological Modelling, vol. 178, pp. 215–225.
Kirjavainen, M, Sipila, K, Savola, T, Salomon, M 2004, Small-scale biomass CHP technologies, Situation in Finland, Denmark and Sweden, OPET Report 12, VTT Processes, Espoo. Mani, S, Sokhansanj, S, Tagore, S, Turhollow, AF 2010, ‘Techno-economic analysis of using corn stover to supply heat and power to a corn ethanol plant – Part 2: Cost of heat and power generation systems’, Biomass and bioenergy, vol. 34, pp. 356–364.
Metals Consulting International 2009, Polish steel industry report, Supply and demand-side review, Executive summary, viewed 20 January 2011, http://www.steelonthenet.com/pdf/commerce/Polish_steel_summary.pdf Odum, TH 1996, Environmental Accounting, Emergy and Environmental Decision Making, John Wiley & Sons, Inc., USA. Odum, TH 1998, ‘Emergy Evaluation’, International Workshop on Advances in Energy Studies: Energy flows in ecology and economy, Porto Venere, Italy, May 27, viewed 30 October 2010, http://www.mnforsustain.org/emergy_odum_howard_t_emergy_evaluation.htm#2. Energy Hierarchy Overend, RP 2003, ‘Heat, Power and Combined Heat and Power’, Elsevier, pp 63-102.
Peng, T, Lu, HF, Wu, WL, Campbell, DE, Zhao, GS, Zou, JH, Chen, J 2008, ‘Should a small combined heat and power plant (CHP) open to its regional power and heat networks? Integrated economic, energy, and emergy evaluation of optimization plans for Jiufa CHP’, Energy, vol. 33, pp. 437–445.
Polish Steel Association 2010, Polish steel industry, viewed 18 January 2011, http://www.hiph.com.pl/ANALIZY_RAPORTY/pliki/pps2010_.pdf
Price, L, Sinton, J, Worrell, E, Phylipsen, D, Huc, X, Li, J, 2002, ‘Energy use and carbon dioxide emissions from steel production in China’, Energy vol. 27, pp. 429–446
63
Shet, USP, Sundararajan, T, Mallikarjuna, JM n.d., 5.2 Rankine Cycle, Indian Institute of Technology Madras, viewed 1 December 2010, http://nptel.iitm.ac.in/courses/IIT-MADRAS/Applied_Thermodynamics/Module_5/2_%20Rankinecycle.pdf
Slomka, M, Kokoszka, M n.d., Renewable Energy, Polish Information and Foreign Investment Agency, viewed 20 January 2011, http://www.paiz.gov.pl/sectors/renewable_energy Steel on the net n.d., World steel raw materials & energy prices, viewed 15 December 2010, http://steelonthenet.com/commodity_prices.html
Steelonthenet 2010, Electric Arc Furnace Steelmaking Costs 2010, Conversion costs for electric arc steelmaking, viewed 20 October 2010, http://www.steelonthenet.com/steel_cost_eaf.html Surma, T 2009, District Heating in Poland, Vattenfall HeatPoland S.A., viewed 19 January 2011, http://www.lsta.lt/files/events/EHP_Zagrebas/DH%20in%20PL_Zagrebl(TS).ppt.pdf Tatia, P 2010, Green Steel Making – Gas Based Technology for Sponge Iron Industry, Sponge Iron Manufacturers Association of India, viewed 18 December 2010, http://industrymonitor.in/steel/2010/09/green-steel-making-gas-based-technology-for-sponge-iron-industry/
Teir, S 2003, Steam Boiler Technology, 2nd edn, Laboratory of Energy engineering and Environmental Protection, Espoo, Finland U. S. Environmental Protection Agency Combined Heat and Power Partnership 2007, Biomass Combined Heat and Power Catalog of Technologies, USA, viewed 20 December 2010, http://epa.gov/chp/documents/biomass_chp_catalog.pdf
Ulgiati, S, Bargigli, S, Raugei, M 2006, ‘An emergy evaluation of complexity, information and technology, towards maximum power and zero emissions’, Journal of Cleaner Production, vol. 15, pp. 1359-1372. UNEP 2007, Technical Study Report: Biomass Fired FBC Boiler for Cogeneration, UNEP-DTIE Energy Branch Wang, L, Ni, W, Li, Z 2006, ‘Emergy evaluation of combined heat and power plant eco–industrial park (CHP plant EIP)’, Resources, Conservation and Recycling, vol. 48, pp. 56–70.
World Coal Association 2007, Coal & Steel, UK, viewed 22 January 2010, http://www.worldcoal.org/_assetrequest.php?doc=/bin/pdf/original_pdf_file/coal_steel_report(03_06_2009).pdf World Steel Association 2008, Steel and energy, viewed 19 December 2010, http://www.worldsteel.org/pictures/programfiles/Fact%20sheet_Energy.pdf
World Steel Association 2010a, World crude steel output decreases by -8.0% in 2009, 22 January, viewed 21 December 2010, http://www.worldsteel.org/?action=newsdetail&id=285 World Steel Association 2010b, Furnace Layout, viewed 20 December 2010, http://www.steeluniversity.org/content/html/eng/default.asp?catid=25&pageid=2081271948

64
World Steel Association 2010c, Raw Materials, viewed 20 December 2010, http://www.steeluniversity.org/content/html/eng/default.asp?catid=25&pageid=2081271934

A - 1
APPENDIX A
Emergy evaluation of a transportation process based on fossil fuels (Buranakarn 1998).
No Item Unit Input resource Solar emergy (seJ/unit) Emergy (seJ)
Truck materials 1 Conventional steel g 4,88E+12 1,78E+09 8,69E+21
2 High-strength steel g 9,74E+11 1,78E+09 1,73E+21 3 Stainless steel g 1,57E+11 1,78E+09 2,79E+20
4 Other steels g 1,57E+11 1,78E+09 2,79E+20 5 Iron g 1,39E+12 1,78E+09 2,47E+21
6 Aluminum g 6,50E+11 1,63E+10 1,06E+22 7 Rubber g 4,70E+11 4,30E+09 2,02E+21
8 Plastics/composite g 8,62E+11 3,28E+09 2,83E+21 9 Glass g 3,25E+11 4,26E+09 1,38E+21
10 Copper g 1,57E+11 6,77E+10 1,06E+22 11 Zinc die castings g 5,60E+10 6,77E+10 3,79E+21 12 Power metal parts g 1,01E+11 6,70E+09 6,77E+20
13 Other materials g 3,58E+11 1,00E+09 3,58E+20 Road construction
14 Cement g 4,42E+13 2,20E+09 9,72E+22 15 Bitumen g 1,89E+14 3,80E+08 7,18E+22
16 Aggregates g 0,00E+00 1,00E+09 0,00E+00 17 Steel g 7,83E+12 1,78E+09 1,39E+22
18 Concrete pipe g 6,82E+12 1,20E+09 8,18E+21 19 Lumber J 7,47E+14 4,40E+04 3,29E+19
20 Fuel J 2,25E+16 6,60E+04 1,49E+21 21 Aluminum culvert g 3,20E+09 1,63E+10 5,22E+19
Fuel used 22 Petroleum gas J 2,39E+16 4,80E+04 1,15E+21
23 Soybean biodiesel J 9,72E+18 2,19E+05 2,13E+24 Services
24 Services - construction $ 3,56E+09 1,31E+12 4,66E+21

A - 2
25 Services - drivers $ 1,28E+09 1,31E+12 1,68E+21
26 Other human services $ 3,31E+10 1,31E+12 4,34E+22 27 Annual Yield of Trucks t km 1,33E+12 1,82E+12 2,42E+24