embodied energy and carbon footprint of household...
TRANSCRIPT
Embodied Energy and Carbon Footprint of Household Latrines in Rural Peru:
The Impact of Integrating Resource Recovery
by
Christopher Galvin
A thesis submitted in partial fulfillment of the requirements for the degree of
Master of Science in Environmental Engineering Department of Civil and Environmental Engineering
College of Engineering University of South Florida
Major Professor: James R. Mihelcic, Ph.D. Qiong Zhang, Ph.D. Daniel Yeh, Ph.D.
Date of Approval: April 3, 2013
Keywords: Life Cycle Assessment, Sustainable Development, Sanitation, Anaerobic Biodigestion, Global Warming
Copyright © 2013, Christopher Galvin
ACKNOWLEDGMENTS
I would like to take this opportunity to thank the following people and institutions that
were instrumental in the completion of this project:
The University of South Florida and the United States Peace Corps, my advisor and
committee members, Dr. James Mihelcic, Dr. Qiong Zhang, and Dr. Daniel Yeh, Pablo Cornejo,
Christine Prouty, Michael MacCarthy, the wonderful people of Santo Domingo, Peru for allowing
me to be part of their small community for two years, and my family for their support and
understanding.
This material is based upon work supported by the National Science Foundation under
Grant No. 0965743. Any opinions, findings, and conclusions or recommendations expressed in
this material are those of the author(s) and do not necessarily reflect the views of the National
Science Foundation.
i
TABLE OF CONTENTS LIST OF TABLES ....................................................................................................................... iii LIST OF FIGURES ..................................................................................................................... v ABSTRACT ................................................................................................................................ vi CHAPTER 1: INTRODUCTION .................................................................................................. 1 1.1 Research Motivation .................................................................................................. 1 1.2 Objective and Hypotheses ......................................................................................... 4 CHAPTER 2: PREVIOUS RESEARCH AND BACKGROUND INFORMATION .......................... 6 2.1 Nutrient Content of Human Excreta ........................................................................... 6 2.2 Anaerobic Digestion .................................................................................................. 7 2.3 Pathogen Destruction in Composting Latrines ........................................................... 9 2.4 Life Cycle Assessments Related to Water and Wastewater ..................................... 13 2.5 Sanitation Technologies Evaluated in this Study ...................................................... 15 2.5.1 Ventilated Improved Pit Latrine ................................................................. 15 2.5.2 Composting Latrine ................................................................................... 17 2.5.3 Pour-Flush Latrine ..................................................................................... 18 2.5.4 Biodigester Latrine .................................................................................... 19 CHAPTER 3: METHODS ......................................................................................................... 22 3.1 Goal and Scope Definition ....................................................................................... 22 3.2 Site Location ............................................................................................................ 22 3.3 Defining the Functional Unit and System Boundary ................................................. 24 3.3.1 Data Collection and Life Cycle Inventory ................................................... 27 3.4 Calculations for Life Cycle Inventory ........................................................................ 29 3.4.1 Material Production ................................................................................... 29 3.4.2 Material Delivery ....................................................................................... 30 3.4.3 Biochemical Oxygen Demand Input .......................................................... 31 3.4.4 Anaerobic Degradation of Domestic Wastewater ...................................... 32 3.4.5 Aerobic Degradation of Domestic Wastewater .......................................... 32 3.4.6 Biogenic Emissions ................................................................................... 33 3.4.7 Resource Recovery through Biogas and Nutrients .................................... 36 3.4.7.1 Biogas ........................................................................................ 36 3.4.7.2 Biodigester Effluent..................................................................... 36 3.4.7.3 Compost and Urine Diversion ..................................................... 37 3.5 Sensitivity Analysis .................................................................................................. 37 3.6 Life Cycle Impact Assessment and Interpretation .................................................... 38 CHAPTER 4: RESULTS AND DISCUSSION ........................................................................... 39 4.1 Impact of Privacy Structure on CED and GWP ........................................................ 39
4.2 CED and GWP Associated with Use Phase and Resource Recovery ...................... 45 4.3 CED and GWP of Household and Community-Level Sanitation Systems ................ 51

ii
4.4 Sensitivity Analysis .................................................................................................. 55 CHAPTER 5: CONCLUSIONS AND RECOMMENDATIONS FOR FUTURE RESEARCH....... 59 REFERENCES ......................................................................................................................... 62 APPENDICES ........................................................................................................................... 68 Appendix A Material Inventories .................................................................................... 69 Appendix B LCA Results Data ....................................................................................... 83 Appendix C Permissions ............................................................................................... 92 C.1 Cairncross and Feachem (1993) Permission ............................................... 92 C.2 Buckley et al. (2008) Permission ................................................................. 92 C.3 Mihelcic et al. (2009) Permission ................................................................. 92

iii
LIST OF TABLES Table 1: Burden of diarrheal disease by global region, 2000 ....................................................... 2 Table 2: Characteristics of daily human excreta per person ........................................................ 6 Table 3: Nutrient concentrations of potential biodigester feeds ................................................... 8 Table 4: Microbiological analysis of five samples obtained from active compost latrines in
Panama ...................................................................................................................... 12 Table 5: Chemical composition of compost samples ................................................................. 13 Table 6: Embodied energy of eight water supply interventions in Mali ....................................... 15 Table 7: Basic characteristics of the four latrine technologies considered in this study.............. 24 Table 8: Model input data collected and SimaPro inputs ........................................................... 29 Table 9: Distances to site location from material origins ............................................................ 31 Table 10: Biogenic emissions associated with each system ...................................................... 36 Table 11: Latrine design variations considered in this study ...................................................... 40 Table 12: Cumulative energy demand of latrine components for construction phase ................ 43 Table 13: Global warming potential of latrine components for construction phase ..................... 44 Table 14: Contributions to cumulative energy demand of four sanitation systems that
consider resource recovery over 20-year life. ............................................................ 46 Table 15: Contributions to global warming potential of sanitation systems over 20-year life ...... 49 Table 16: Sensitivity factors for privacy shelter (construction phase) results ............................. 57 Table 17: Sensitivity factors for construction and use phase results .......................................... 58 Table A.1: Material inventory for VIP latrine adobe fiber cement privacy structure .................... 69 Table A.2: Material inventory for VIP latrine brick corrugated metal privacy structure................ 70 Table A.3: Material inventory for VIP latrine adobe fiber cement privacy structure
(unlined pit) .............................................................................................................. 71
iv
Table A.4: Material inventory for pour-flush latrine adobe fiber cement privacy structure .......... 72 Table A.5: Material inventory for pour-flush latrine brick corrugated metal privacy structure...... 73 Table A.6: Material inventory for composting latrine adobe fiber cement privacy structure ........ 75 Table A.7: Material inventory for composting latrine brick corrugated metal privacy structure ... 76 Table A.8: Material inventory for biodigester latrine adobe fiber cement privacy structure ......... 78 Table A.9: Material inventory for biodigester latrine brick corrugated metal privacy structure .... 80 Table B.1: LCA results for construction and use phase of VIP latrine adobe fiber cement
privacy structure ...................................................................................................... 83 Table B.2: LCA results for construction phase of VIP latrine brick corrugated metal privacy
structure .................................................................................................................. 84 Table B.3: LCA results for construction phase of VIP latrine adobe fiber cement (unlined pit)
privacy structure ...................................................................................................... 85 Table B.4: LCA results for construction and use phase of pour-flush latrine adobe
fiber cement privacy structure .................................................................................. 86 Table B.5: LCA results for construction phase of pour-flush latrine brick corrugated
metal privacy structure ............................................................................................. 87 Table B.6: LCA results for construction and use phase of composting latrine adobe
fiber cement privacy structure .................................................................................. 88 Table B.7: LCA results for construction phase of composting latrine brick corrugated metal
privacy structure ...................................................................................................... 89 Table B.8: LCA results for construction and use phase of biodigester latrine adobe
fiber cement privacy structure .................................................................................. 90 Table B.9: LCA results for biodigester latrine brick corrugated metal privacy structure .............. 91
v
LIST OF FIGURES Figure 1: Access to water and sanitation statistics and child mortality rates for Peru .................. 3 Figure 2: The influence of time and temperature on a variety of excreted pathogens ................ 11 Figure 3: Components of a VIP latrine ...................................................................................... 17 Figure 4: Two-vault composting latrine ...................................................................................... 18 Figure 5: Pour-flush latrine with off-set collection pit.................................................................. 19 Figure 6: Diagram of Taiwanese style household biodigester latrine ......................................... 20 Figure 7: Photo of Taiwanese style biodigester installed in Santo Domingo, Piura, Peru .......... 21 Figure 8: Location of study site in Piura, Peru ........................................................................... 23 Figure 9: System diagram showing the inputs and outputs for: (a) VIP latrine (b) pour-flush
latrine (c) composting latrine and (d) biodigester latrine ............................................ 26 Figure 10: LCA framework used in this study for materials associated with the four
household sanitation technologies ........................................................................... 28 Figure 11: Diagram of VIP latrine showing different theoretical layers ....................................... 35 Figure 12: (a) Cumulative energy demand and (b) global warming potential of construction
phase of sanitation systems ..................................................................................... 41 Figure 13: Cumulative energy demand of four sanitation systems over a 20-year period (a)
without resource recovery and (b) with resource recovery ....................................... 45 Figure 14: Global warming potential of four sanitation systems over a 20-year period (a)
without resource recovery and (b) with resource recovery ....................................... 48 Figure 15: Contribution of materials and biogenic emissions to global warming potential
for each sanitation system ....................................................................................... 50 Figure 16: Cumulative energy demand of household and community level sanitation systems per household over 20-year period (a) without resource recovery and (b) with resource recovery ....................................................................................... 52 Figure 17: Global warming potential of household and community level sanitation systems per household over 20-year period (a) without resource recovery and (b) with
resource recovery .................................................................................................... 53
vi
ABSTRACT
Over seventy percent of the 2.5 billion people who still lack access to basic sanitation
worldwide live in rural areas (WHO/UNICEF, 2012). Despite concerns of water scarcity,
resource depletion, and climate change little research has been conducted on the
environmental sustainability of household sanitation technologies common in rural areas of
developing countries or the potential of resource recovery to mitigate the environmental impacts
of these systems. The environmental sustainability, in terms of embodied energy and carbon
footprint, was analyzed for four household sanitation systems: (1) Ventilated Improved Pit (VIP)
latrine, (2) pour-flush latrine, (3) composting latrine, and (4) biodigester latrine. Variations in
design and construction materials used change the embodied energy of the systems. It was
found that systems that used clay brick in the construction of the superstructure had an average
cumulative energy demand 4,307 MJ and a global warming potential 362 kilograms of
greenhouse gas equivalent (kgCO2 eq) higher than systems that used adobe brick in the
construction of the superstructure. It was also found that systems that incorporate resource
recovery, such as a composting or biodigester latrine, can become net energy producers over
their service life, recovering between 29,333 and 253,190 MJ over a 20-year period, compared
to the 11,275 to 19,990 MJ required for their construction and maintenance. Recovering the
resources from the waste also significantly lowered the global warming potential of these
systems from 2,079-49,655 kgCO2 eq to 616-1,882 kgCO2 eq; significantly less than the global
warming potential of VIP latrine or pour-flush latrines (8,642-15,789 kgCO2 eq). In addition, two
community wastewater treatment systems that serve 420-1,039 individuals considered in a
similar study had a higher cumulative energy demand per household (44,869 MJ and 38,403
MJ) than the household sanitation systems (11,275-19,990 MJ). The community wastewater
vii
treatment systems had a lower global warming potential (2019-2,092 kgCO2 eq) than household
systems that did not recover resources (8,642-15,789 kg CO2 eq), but higher than household
systems that incorporate resource recovery (616-1,882 kgCO2 eq). The goal of this study is to
provide insight to policy makers in the development field to promote decision making based on
environmental sustainability in the implementation of improved sanitation coverage in rural
areas of developing countries.
1
CHAPTER 1: INTRODUCTION
1.1 Research Motivation
2.5 billion people currently lack access to basic sanitation worldwide (WHO/UNICEF,
2012). The United Nations (UN) Millennium Development Goal (MDG) 7 Target 3 seeks to halve
this number of people not served by improved sanitation by 2015 while ensuring environmental
sustainability (UN, 2006). Although significant progress has been made, the world is likely to fall
short of this goal. In addition, increasing greenhouse gas (GHG) concentrations and projected
anthropogenic climate change appear likely to negatively impact sustainable development
(IPCC, 2007). Water use is a major component of environmental sustainability and 70% of the
world’s fresh water is already used for irrigation (Zimmerman et al., 2008). Furthermore,
agricultural production, water, and energy use will continue to increase as the global population
approaches an expected 9 billion people in 2050 (FAO, 2011). Health and economic factors are
commonly used to evaluate sanitation systems; however, this study provides an environmental
sustainability context that, as part of a holistic approach, can be used when considering the
improvement of sanitation coverage in developing countries and around the world. This is part
of a new paradigm that has emerged in wastewater treatment where the sanitation systems are
now viewed as resource recovery systems (RSSs), that should allow the perceived negative
impact of wastewater to become a net positive impact (Guest et al., 2009).
The relationship between sanitation, water quality, and health has long been recognized
as a valuable topic for academic research, professional journals, and international funding (e.g.,
Clasen and Bastable, 2003; Clasen et al., 2007; Fry et al., 2010; CDC, 2012). For example, the
World Health Organization (WHO) estimates that consumption of contaminated water and lack
of sanitation and hygiene account for 3.2% of deaths and 4.2% of Disability Adjusted Life Years
2
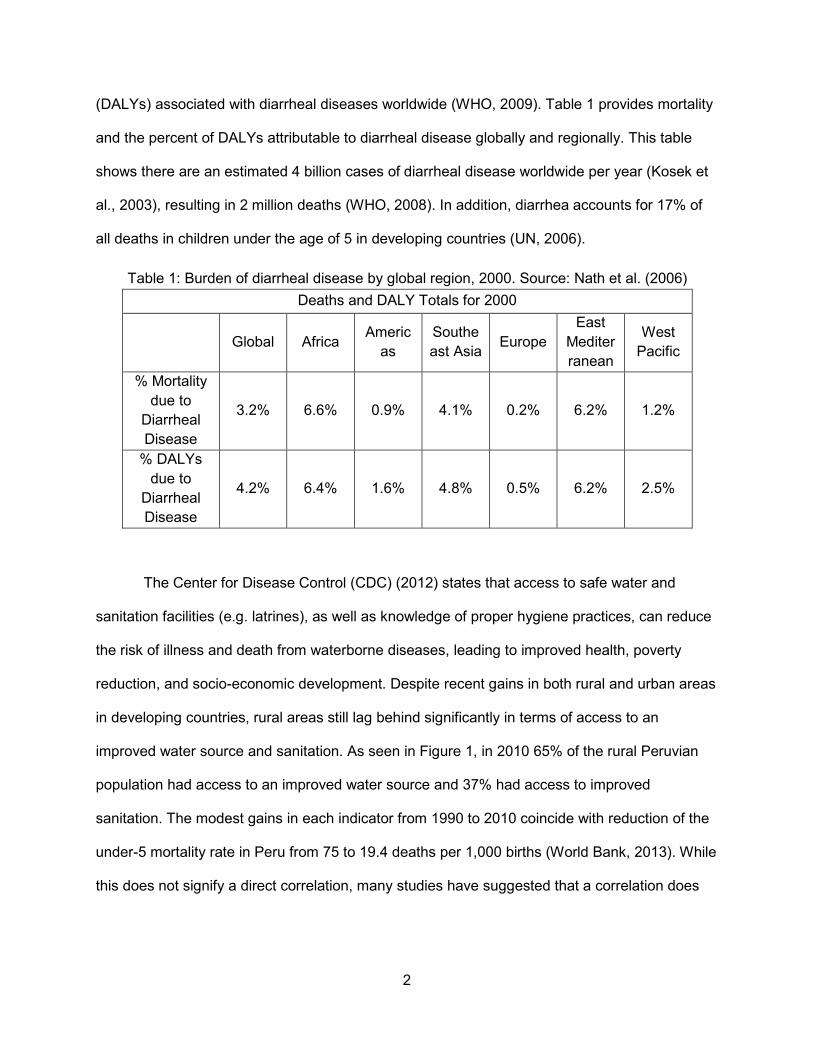
(DALYs) associated with diarrheal diseases worldwide (WHO, 2009). Table 1 provides mortality
and the percent of DALYs attributable to diarrheal disease globally and regionally. This table
shows there are an estimated 4 billion cases of diarrheal disease worldwide per year (Kosek et
al., 2003), resulting in 2 million deaths (WHO, 2008). In addition, diarrhea accounts for 17% of
all deaths in children under the age of 5 in developing countries (UN, 2006).
The Center for Disease Control (CDC) (2012) states that access to safe water and
sanitation facilities (e.g. latrines), as well as knowledge of proper hygiene practices, can reduce
the risk of illness and death from waterborne diseases, leading to improved health, poverty
reduction, and socio-economic development. Despite recent gains in both rural and urban areas
in developing countries, rural areas still lag behind significantly in terms of access to an
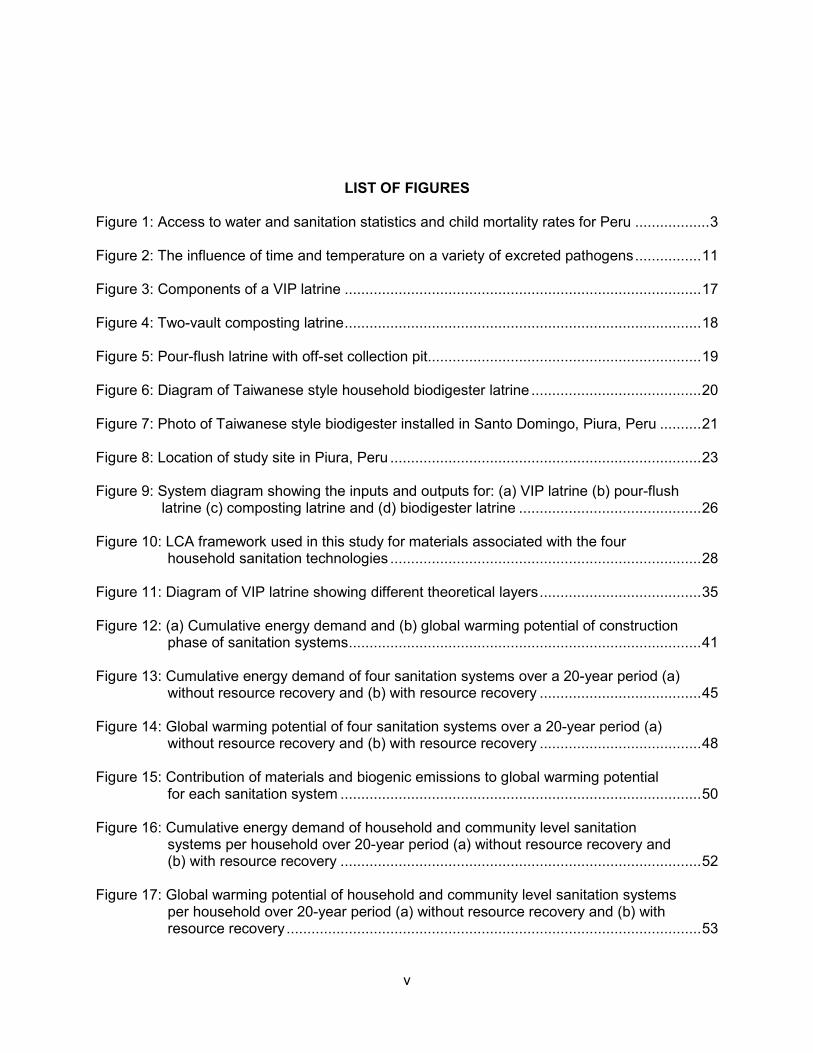
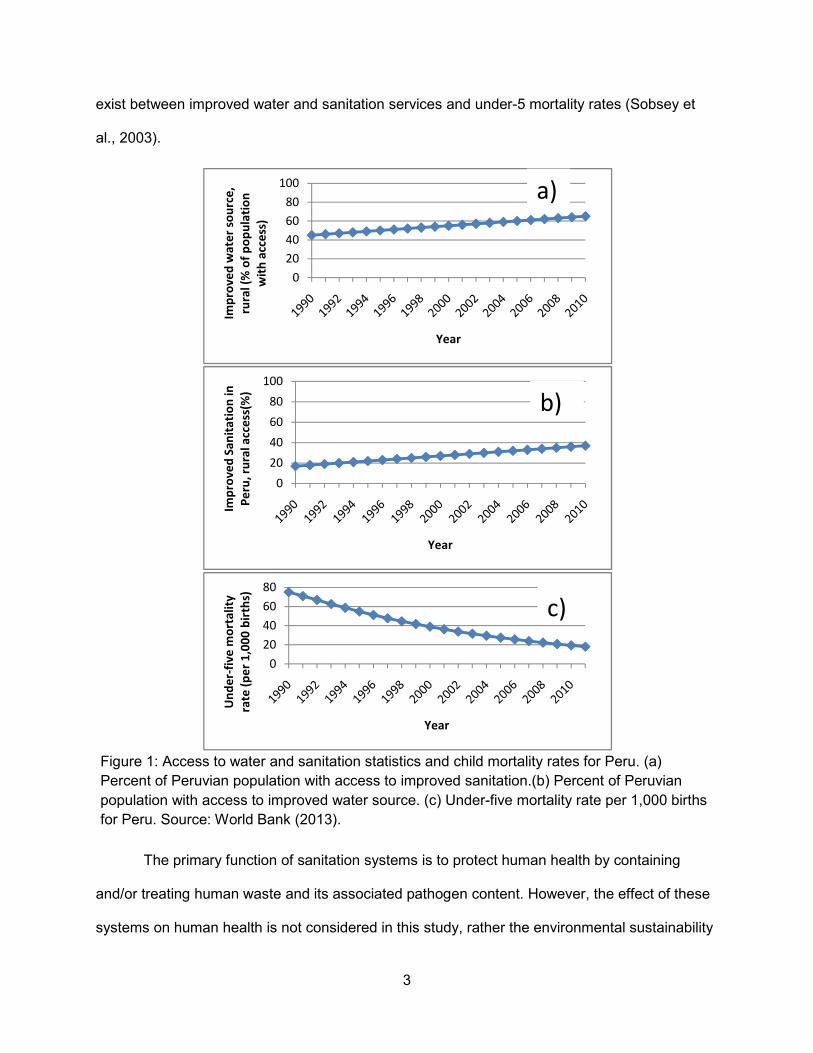
improved water source and sanitation. As seen in Figure 1, in 2010 65% of the rural Peruvian
population had access to an improved water source and 37% had access to improved
sanitation. The modest gains in each indicator from 1990 to 2010 coincide with reduction of the
under-5 mortality rate in Peru from 75 to 19.4 deaths per 1,000 births (World Bank, 2013). While
this does not signify a direct correlation, many studies have suggested that a correlation does
Table 1: Burden of diarrheal disease by global region, 2000. Source: Nath et al. (2006)
Deaths and DALY Totals for 2000
Global Africa Americ
as
Southe
ast Asia Europe
East
Mediter
ranean
West
Pacific
% Mortality
due to
Diarrheal
Disease
3.2% 6.6% 0.9% 4.1% 0.2% 6.2% 1.2%
% DALYs
due to
Diarrheal
Disease
4.2% 6.4% 1.6% 4.8% 0.5% 6.2% 2.5%
3
exist between improved water and sanitation services and under-5 mortality rates (Sobsey et
al., 2003).
The primary function of sanitation systems is to protect human health by containing
and/or treating human waste and its associated pathogen content. However, the effect of these
systems on human health is not considered in this study, rather the environmental sustainability
Figure 1: Access to water and sanitation statistics and child mortality rates for Peru. (a)
Percent of Peruvian population with access to improved sanitation.(b) Percent of Peruvian
population with access to improved water source. (c) Under-five mortality rate per 1,000 births
for Peru. Source: World Bank (2013).
0
20
40
60
80
100
Imp
rov
ed
wa
ter
sou
rce
,
rura
l (%
of
po
pu
lati
on
wit
h a
cce
ss)
Year
a)
0
20
40
60
80
100
Imp
rov
ed
Sa
nit
ati
on
in
Pe
ru,
rura
l a
cce
ss(%
)
Year
b)
0
20
40
60
80
Un
de
r-fi
ve
mo
rta
lity
rate
(p
er
1,0
00
bir
ths)
Year
c)
4
of household sanitation systems is analyzed in terms of the amount of embodied energy and
greenhouse gas (GHG) emissions associated with particular sanitation technologies, some
which include resource recovery as a design objective.
1.2 Objective and Hypotheses
In this study, a Life Cycle Assessment (LCA) is performed on four household sanitation
systems found in the region of Alto-Piura, Peru. Some of the sanitation technologies evaluated
in this study are integrated with resource recovery. The sanitation systems are assessed and
compared quantitatively for their environmental sustainability in terms of embodied energy (MJ)
and carbon footprint (kgCO2 eq). Although these household systems have a relatively small
environmental impact individually when compared to other wastewater treatment systems,
especially in developed countries, when extrapolated over the 2.5 billion people who currently
lack access to improved sanitation worldwide (WHO/UNICEF 2012), their implementation may
be significant on a regional or global scale. This study also compares the results of the
environmental sustainability of household sanitation systems to the results from a study
performed in rural Bolivia on small community-managed sanitation systems designed to serve
between 700 and 1,500 people employing wastewater lagoons and anaerobic reactors. This
provides an evaluation of the influence that scale of the sanitation technology will have on the
environmental sustainability of sanitation coverage in developing countries. Accordingly, two
hypotheses were developed for this research.
1. Although they will have higher Cumulative Energy Demand (CED) due to increased
material requirements during installation and maintenance, sanitation systems such as
composting latrines and biodigester latrines that incorporate energy recovery will have
lower Global Warming Potential (GWP) over their service life when compared to
ventilated improved pit (VIP) latrines and pour-flush latrines.

5
2. Because of the high amount of energy associated with installation and maintenance of
community waste collection systems, it is expected that decentralized household level
collection and treatment systems will have comparatively lower CED per household than
a centralized waste collection system.

6
CHAPTER 2: PREVIOUS RESEARCH AND BACKGROUND INFORMATION
2.1 Nutrient Content of Human Excreta
Resource and energy recovery can play an important role in helping to reduce the
energy, costs, and resources of wastewater treatment. Table 2 provides the basic
characteristics of human excreta. This table shows that the average person produces 500 kg of
urine and 50 kg of feces per year, containing 5.7 kg of nitrogen, 0.6 kg of phosphorus, and 1.2
kg of potassium (Heinonen-Tanski and van Wijk-Sijbesma, 2005). Recycling all the nutrients in
domestic wastewater could reduce the global use of commercial fertilizers by 35-45% (Lind et
al., 2001). One study quantified the amount of phosphorus produced in human excreta (urine
and feces) worldwide as being 1.6 million metric tons in 2009, which corresponds to
approximately 22% the global phosphorus demand (Mihelcic et al., 2011). In addition, Verbyla et
al. (2013) estimate that the effluent of two community wastewater treatment plants in Bolivia
contain the same amount of nutrients as the fertilizer used to produce crops containing 10-75
days’ worth of the recommended food energy intake for each person discharging waste to the
system. Recovery of the nutrients found in human waste thus has a great potential as a more
sustainable strategy to offset commercial fertilizer needs.
Table 2: Characteristics of daily human excreta per person. Adapted from Esrey (2000).
Elements Urine
(grams/capita-day)
Feces
(grams/capita-day)
Urine + Feces
(grams/capita-day)
Nitrogen 11.0 1.55 12.5
Phosphorus 1.0 0.5 1.5
Potassium 2.5 1.0 3.5
Organic Carbon 6.6 21.4 30
Wet weight 1,200 70-140 1,200-1,400
Dry weight 60 35 95

7
2.2 Anaerobic Digestion
One common wastewater treatment strategy for energy and resource recovery in tropical
and sub-tropical climates is the anaerobic digestion of wasted solids from the activated sludge
treatment process. This strategy provides two benefits: (1) biogas is generated, which can be
combusted to produce heat and electricity and (2) fertilizer can be processed from the biosolids,
and is often marketed as a substitute to commercial fertilizers. For example, the 54.2 million
gallon per day Howard F. Curren, advanced wastewater treatment plant (WWTP) in Tampa, FL,
uses biogas powered generators to produce 36,000 kWh of energy per day, approximately 25%
of the plant’s energy use. Additionally, 22.2 dry tons of processed sludge are harvested per day
for land application (City of Tampa, 2012). Anaerobic processing of industrial waste and
municipal wastewater is not limited to the U.S. and it is also common in countries such as Brazil,
China, India, Colombia and Mexico, as a way to improve sanitation infrastructure and recover
valuable resources. For instance, 85 Upflow Anaerobic Sludge Blanket (UASB) wastewater
treatment plants were constructed in Mexico between 1987 and 1998 (Monroy et al., 2000).
Energy and resource recovery through anaerobic digestion is also possible at the
household level. Numerous studies have examined household biodigestion as a means of
management of human and agricultural wastes in developing countries due to their potential for
energy and resource recovery (Gunnerson and Stuckey, 1983; GTZ, 1999; Buysman, 2009;
Walekhwa et al., 2009; Ocwieja, 2010; Rowse, 2011). For example, Chen et al. (2010) report
that as of 2007, 26.5 million household biodigesters using pig, human, and agricultural waste
feed have been built in China. From 1991 to 2005 an estimated 833,000 TJ of energy was
produced by these systems in China, resulting in a reduction of greenhouse gases (GHG)
emissions of 73,200 Gg CO2 equivalents (Yu et al., 2008).Another study found that users in the
Liangshui and Guichi counties of China used 2,175 kWh (7,831 MJ) per year from biogas per
household (Xiaohua et al., 2007).
8
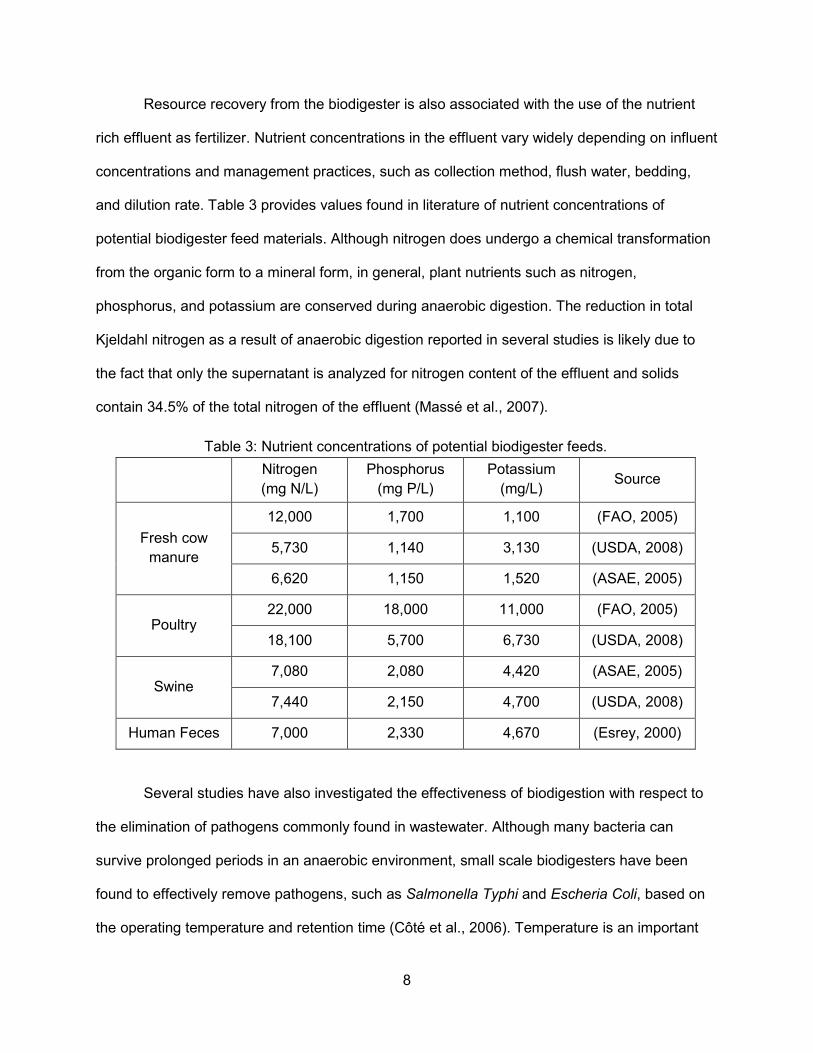
Resource recovery from the biodigester is also associated with the use of the nutrient
rich effluent as fertilizer. Nutrient concentrations in the effluent vary widely depending on influent
concentrations and management practices, such as collection method, flush water, bedding,
and dilution rate. Table 3 provides values found in literature of nutrient concentrations of
potential biodigester feed materials. Although nitrogen does undergo a chemical transformation
from the organic form to a mineral form, in general, plant nutrients such as nitrogen,
phosphorus, and potassium are conserved during anaerobic digestion. The reduction in total
Kjeldahl nitrogen as a result of anaerobic digestion reported in several studies is likely due to
the fact that only the supernatant is analyzed for nitrogen content of the effluent and solids
contain 34.5% of the total nitrogen of the effluent (Massé et al., 2007).
Several studies have also investigated the effectiveness of biodigestion with respect to
the elimination of pathogens commonly found in wastewater. Although many bacteria can
survive prolonged periods in an anaerobic environment, small scale biodigesters have been
found to effectively remove pathogens, such as Salmonella Typhi and Escheria Coli, based on
the operating temperature and retention time (Côté et al., 2006). Temperature is an important
Table 3: Nutrient concentrations of potential biodigester feeds.
Nitrogen
(mg N/L)
Phosphorus
(mg P/L)
Potassium
(mg/L) Source
Fresh cow
manure
12,000 1,700 1,100 (FAO, 2005)
5,730 1,140 3,130 (USDA, 2008)
6,620 1,150 1,520 (ASAE, 2005)
Poultry 22,000 18,000 11,000 (FAO, 2005)
18,100 5,700 6,730 (USDA, 2008)
Swine 7,080 2,080 4,420 (ASAE, 2005)
7,440 2,150 4,700 (USDA, 2008)
Human Feces 7,000 2,330 4,670 (Esrey, 2000)
9
operational parameter in terms of how pathogens are destroyed during anaerobic digestion. For
example, destruction times of pathogens are generally represented in months in the
psychrophilic range (-10 to 15°C), days in the mesophilic range (20 to 45°C), and hours in the
thermophilic range (45 to 120°C) (Sahlström, 2003). Residence time of the waste is also
important. For example, Taiwanese-style biodigesters typically operate with a 45-day solids
retention time in the mesophilic range (Gunnerson and Stuckey, 1986). In addition, a laboratory
experiment of batch anaerobic digestion found that all Salmonella was removed after 15 days at
35°C or after 25 days at room temperature and 99.6% of E. coli was removed in 5 days at 35°C
(Kumar et al., 1999). Another field study measured zero coliform forming units (CFU) in the
effluent of a Taiwanese style biodigester operated with a 50-day solids retention time (Botero
and Preston, 1987).
Furthermore, Massé et al. (2011) found that although the majority of pathogens found in
swine waste (e.g. Salmonella, Campylobacter spp., and Yersinia enterocolitica) were reduced
below detectable levels when treated by psychrophilic sequenced batch reactors; however,
Clostridium perfringens and Enterococcus spp levels remained high within the digesters
throughout treatment. Although research shows the substantial removal of pathogens from
waste through anaerobic digestion, proper waste management should be used to reduce the
risk associated with use of effluent in agriculture, especially when human waste is digested.
2.3 Pathogen Destruction in Composting Latrines
Composting latrines have been promoted by development organizations as a sanitation
technology with the added benefit of resource recovery through organic fertilizer production.
However, social acceptability of this technology varies in different parts of world. For example, in
China and Southeast Asia the use of human excreta as agricultural fertilizer has been common
for thousands of years. One study found that 75% of farmers surveyed in central Vietnam
reported using fresh or partially composted human feces to fertilize their farmland or garden
10
(Jensen et al., 2013). In contrast, acceptability of composting latrines in other parts of the world
such as Africa and Central and South America may be lower and depend strongly on the
education and training aspects of individual projects (Karlsson and Larsson, 2000; Hurtado,
2005).
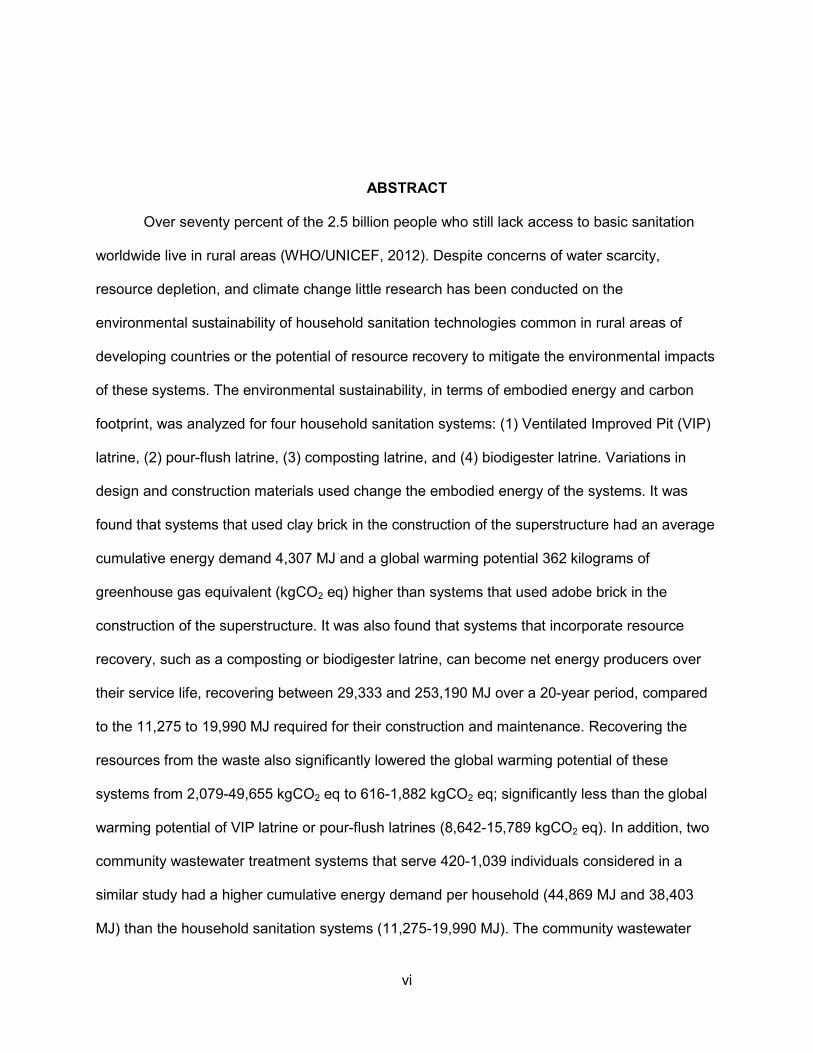
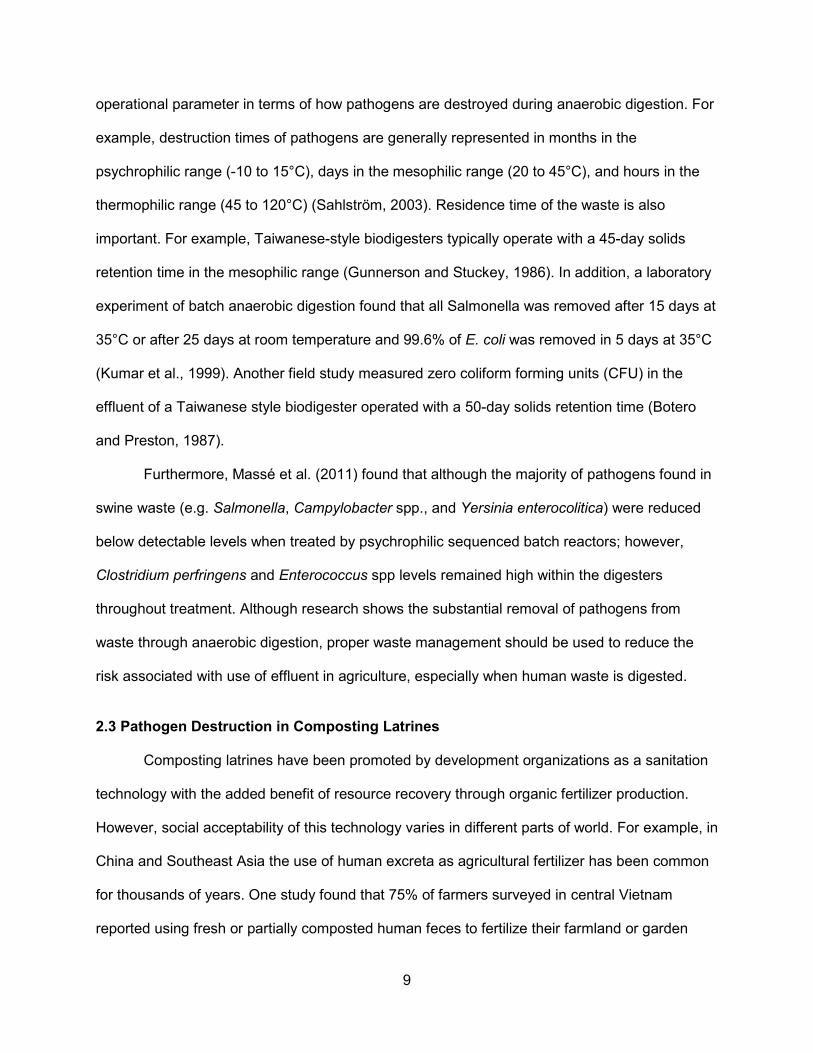
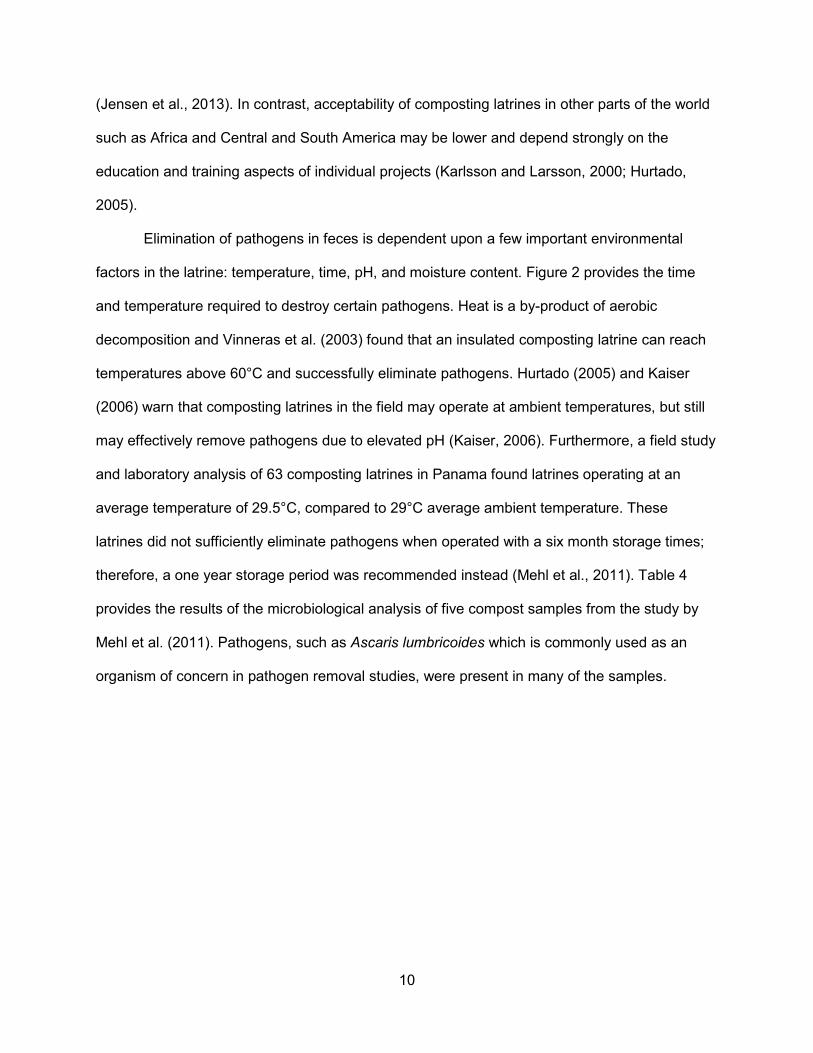
Elimination of pathogens in feces is dependent upon a few important environmental
factors in the latrine: temperature, time, pH, and moisture content. Figure 2 provides the time
and temperature required to destroy certain pathogens. Heat is a by-product of aerobic
decomposition and Vinneras et al. (2003) found that an insulated composting latrine can reach
temperatures above 60°C and successfully eliminate pathogens. Hurtado (2005) and Kaiser
(2006) warn that composting latrines in the field may operate at ambient temperatures, but still
may effectively remove pathogens due to elevated pH (Kaiser, 2006). Furthermore, a field study
and laboratory analysis of 63 composting latrines in Panama found latrines operating at an
average temperature of 29.5°C, compared to 29°C average ambient temperature. These
latrines did not sufficiently eliminate pathogens when operated with a six month storage times;
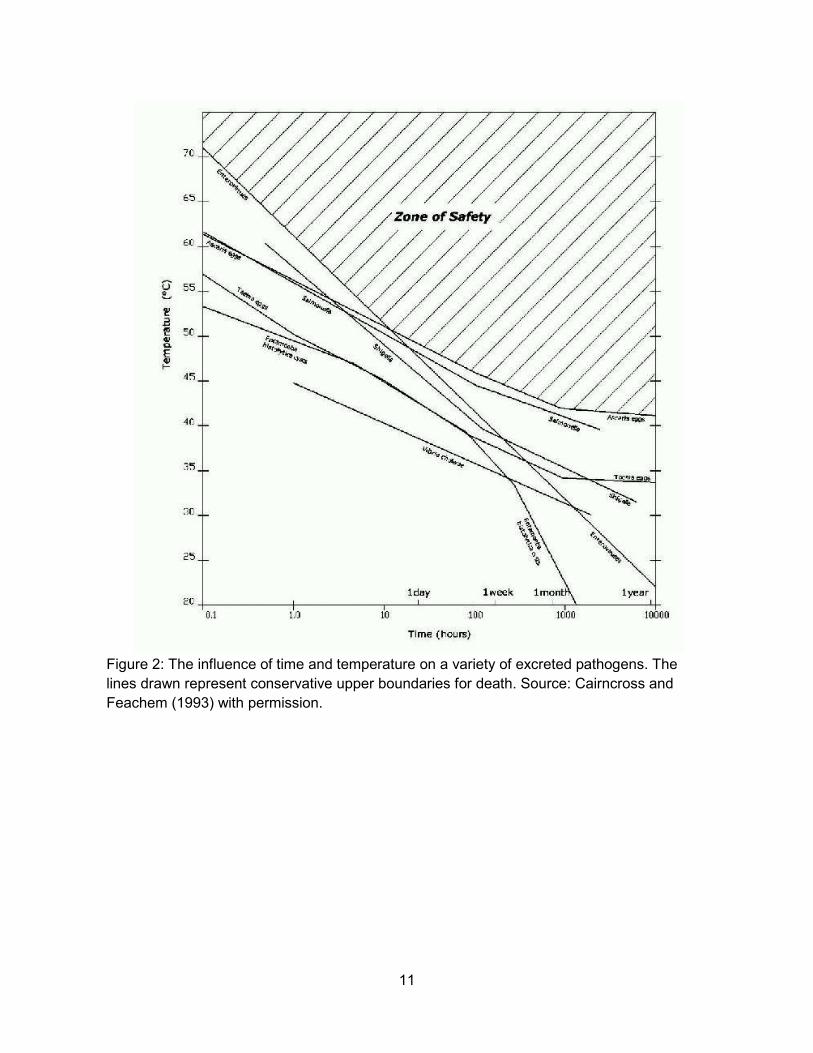
therefore, a one year storage period was recommended instead (Mehl et al., 2011). Table 4
provides the results of the microbiological analysis of five compost samples from the study by
Mehl et al. (2011). Pathogens, such as Ascaris lumbricoides which is commonly used as an
organism of concern in pathogen removal studies, were present in many of the samples.
11
Figure 2: The influence of time and temperature on a variety of excreted pathogens. The
lines drawn represent conservative upper boundaries for death. Source: Cairncross and
Feachem (1993) with permission.

12
Several studies have determined that in order to improved aerobic decomposition in a
composting latrine, the addition of desiccant after each use is necessary to not only desiccate
pathogens, but also raise the carbon to nitrogen (C:N) ratio to the ideal ratio of 15:1 to 30:1
(Karlsson and Larsson, 2000; Mehl et al., 2011). The C:N ratio of wood ash and saw dust,
commonly used desiccants, are 25:1 and 200-500:1, respectively. Untreated human feces have
approximately a 5:1 C:N ratio, while finished compost has a 10:1 C:N ratio (Richard and
Trautmann, 1996). Often insufficient desiccant is added by the users to raise the ratio to the
recommended value as seen in Table 5. The additional nutrients found in compost increased
the yield of covo, spinach, lettuce and onions by 300-700% in field trials in Mozambique using
composted human feces in a 50:50 mixture with regular soil (Morgan, 2007).
Table 4: Microbiological analysis of five samples obtained from active compost latrines in
Panama. (N/O = Not Observed) Data from Mehl et al. (2011).
Bacteria Helminths Protozoa
Samp
le
Total
colifor
ms
(CFU/
100
g)
E. coli Salm
onella
Shigu
ella
Klebsi
ella
(CFU/
100
g)
Taeni
asoliu
m
Taeni
asagi
nata
Ascari
slumb
ricoid
es
Trichu
ristric
hura
Enta
moeb
as
Giardi
a
lambli
a
A 8.E+0
4 N/O N/O N/O N/O N/O N/O
infertil
e egg
infecti
ve
egg
Enta
moeb
a coli
cyst
N/O
B 7.E+0
3 N/O N/O N/O N/O eggs N/O
infertil
e egg N/O N/O N/O
C 3.E+0
4 N/O N/O N/O
4.E+0
3
adult
sectio
ns
and
eggs
N/O egg N/O N/O N/O
D 3.E+0
4 N/O N/O N/O
6.E+0
3 N/O N/O
fertile
egg N/O N/O N/O
E 7.E+0
4 N/O N/O N/O N/O N/O N/O
infertil
e egg N/O N/O N/O
13
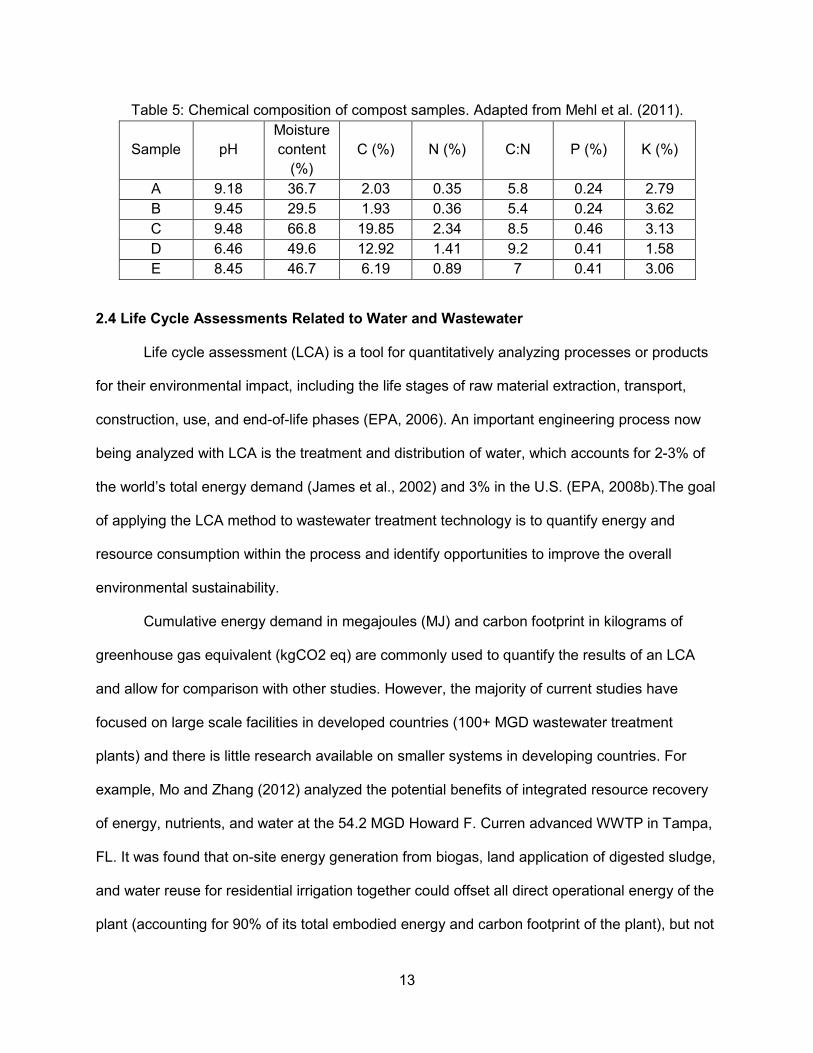
2.4 Life Cycle Assessments Related to Water and Wastewater
Life cycle assessment (LCA) is a tool for quantitatively analyzing processes or products
for their environmental impact, including the life stages of raw material extraction, transport,
construction, use, and end-of-life phases (EPA, 2006). An important engineering process now
being analyzed with LCA is the treatment and distribution of water, which accounts for 2-3% of
the world’s total energy demand (James et al., 2002) and 3% in the U.S. (EPA, 2008b).The goal
of applying the LCA method to wastewater treatment technology is to quantify energy and
resource consumption within the process and identify opportunities to improve the overall
environmental sustainability.
Cumulative energy demand in megajoules (MJ) and carbon footprint in kilograms of
greenhouse gas equivalent (kgCO2 eq) are commonly used to quantify the results of an LCA
and allow for comparison with other studies. However, the majority of current studies have
focused on large scale facilities in developed countries (100+ MGD wastewater treatment
plants) and there is little research available on smaller systems in developing countries. For
example, Mo and Zhang (2012) analyzed the potential benefits of integrated resource recovery
of energy, nutrients, and water at the 54.2 MGD Howard F. Curren advanced WWTP in Tampa,
FL. It was found that on-site energy generation from biogas, land application of digested sludge,
and water reuse for residential irrigation together could offset all direct operational energy of the
plant (accounting for 90% of its total embodied energy and carbon footprint of the plant), but not
Table 5: Chemical composition of compost samples. Adapted from Mehl et al. (2011).
Sample pH
Moisture
content
(%)
C (%) N (%) C:N P (%) K (%)
A 9.18 36.7 2.03 0.35 5.8 0.24 2.79
B 9.45 29.5 1.93 0.36 5.4 0.24 3.62
C 9.48 66.8 19.85 2.34 8.5 0.46 3.13
D 6.46 49.6 12.92 1.41 9.2 0.41 1.58
E 8.45 46.7 6.19 0.89 7 0.41 3.06
14
the total embodied energy of the plant (which includes the construction phase). Another study
compared direct, indirect, and total embodied energy of two drinking water treatment plants in
the U.S., one in Tampa, FL using surface water as its source and the other in Kalamazoo, MI
using groundwater as a source. It found that the two plants had comparable total embodied
energy per volume of water provided (10.3 MJ/m3 for the groundwater plant and 10.7 MJ/m3 for
the surface water plant). However, the groundwater plant had higher direct energy usage due to
increased pumping requirements while the surface water plant had higher indirect energy usage
due to the additional treatment and chemicals required for the lower quality raw water source
(Mo et al., 2011).
A study in rural Bolivia compared the cumulative energy demand and GHG emissions
over a 20-year period of two community wastewater treatment systems serving between 420-
1,039 users with different water reuse and energy recovery conditions. It was determined that
for an existing Upflow Anaerobic Sludge Blanket (UASB) reactor, the addition of energy
recovery from biogas would reduce the carbon footprint by 57.2% compared to the existing
condition. In comparison, reuse of effluent for a three-pond wastewater treatment system would
reduce the carbon footprint by 0.1-2.1% compared to river water irrigation (Cornejo et al., 2013).
In another study investigating the economic, social, and environmental sustainability of
community wastewater treatment facilities, basic treatment methods, such as lagoons, were
determined to be more appropriate than mechanical treatment methods, such as activated
sludge (Muga and Mihelcic, 2008). In many rural areas, community systems that include a
collection system and treatment lagoons are not feasible due to cost, community size, low
population density, geography, lack of funding for infrastructure, and/or inability to operate and
maintain the facility (IPCC, 2007). In this case, household level systems may be more
appropriate. In order to meet the United Nations MDG 7 target for improved sanitation coverage
many more household sanitation systems will need to be constructed. When considered on a

15
global scale, this represents a large investment of finite resources, especially for local or
regional governments of developing countries.
One study was identified that analyzed the embodied energy of eight water supply
interventions in Sub-Saharan Africa (four source level and four household level) (Held et al.
2012). Table 6 provides the embodied energy of these interventions. Human energy was
included in the calculation of the embodied energy and, although it is typically considered
negligible in this type of analysis, accounted for over 90% of the total embodied energy in four of
the eight interventions. When the human energy is segregated by gender it shows that over
99% is provided by women (mainly during the use phase) and 1% by men (mainly during the
construction phase) for seven of the eight interventions.
2.5 Sanitation Technologies Evaluated in this Study
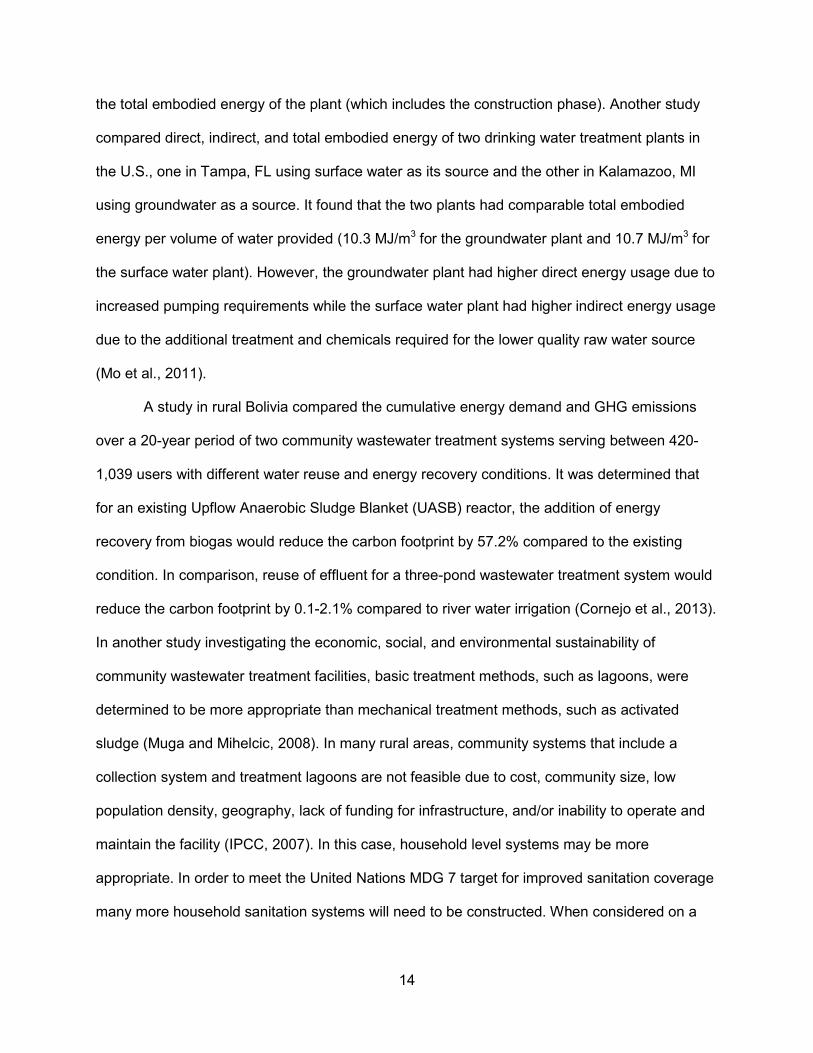
2.5.1 Ventilated Improved Pit Latrine
The Ventilated Improved Pit (VIP) latrine is a relatively basic sanitation technology
common in rural areas of developing countries due to its low cost and ease of maintenance.
Similar to the standard pit latrine, it consists of three parts: (1) the pit, (2) the platform, and (3)
the superstructure (see Figure 3). Materials used to construct the privacy structure can vary,
depending on local preferences and availability; however, adobe brick, clay brick, or corrugated
metal are common. The VIP latrine should be oriented so the prevailing wind enters the pit
Table 6: Embodied energy of eight water supply interventions in Mali. Adapted from Held et al.
(2012).
Intervention Intervention type Embodied Energy (GJ per
functional unit)
Rope pump Source protection 117
Chlorination Point of use 131
Improved well Source protection 134
Biosand filter Point of use 139
India Mark II hand pump Source protection 245
Solar pump Source protection 302
Ceramic filter Point of use 343
Boiling with fuelwood Point of use 172,559

16
through the superstructure and exits through the ventilation tube, suppressing unpleasant odors
inside. Additionally, the ventilation tube is placed where it will be heated by sunlight to promote
the upward flow of air out of the pit. The pit may be lined or unlined, depending on soil type. The
service life can be estimated with the following formula:
���������� = ��� ������������ ∗ �������ℎ
�������� �� ∗ ����������������
The accumulation rate is typically 0.2-0.9 m3/capita-year depending on the pit’s contact
with the water table and the anal cleansing materials used (Mihelcic et al., 2009). When the pit
is around 80% full (typically around 30 cm from the slab) a new pit should be dug and the latrine
relocated, reusing the materials in the privacy structure if possible. The original pit should be
capped with soil to prevent contamination of the surrounding area and is an ideal location for
planting a fruit tree to take advantage of the nutrients of the waste left in the pit.
17
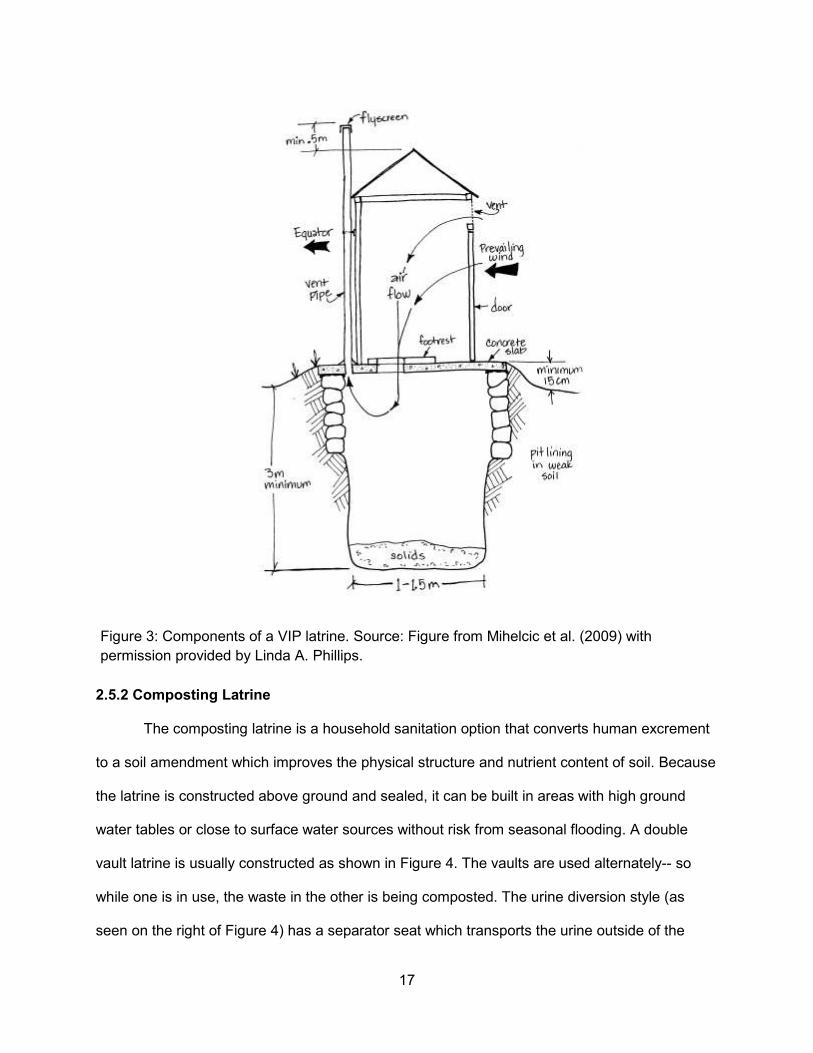
2.5.2 Composting Latrine
The composting latrine is a household sanitation option that converts human excrement
to a soil amendment which improves the physical structure and nutrient content of soil. Because
the latrine is constructed above ground and sealed, it can be built in areas with high ground
water tables or close to surface water sources without risk from seasonal flooding. A double
vault latrine is usually constructed as shown in Figure 4. The vaults are used alternately-- so
while one is in use, the waste in the other is being composted. The urine diversion style (as
seen on the right of Figure 4) has a separator seat which transports the urine outside of the
Figure 3: Components of a VIP latrine. Source: Figure from Mihelcic et al. (2009) with
permission provided by Linda A. Phillips.
18
latrine where it may be collected (as considered in this study) or can be allowed to drain into a
soak pit. Diverting the urine promotes the decomposition of the feces in two ways: (1) by
lowering its moisture content and increasing oxygen transfer within the compost and (2) by
raising the C:N ratio of the compost by isolating the nitrogen found in urine from the composting
feces. The urine is also easily reused as fertilizer (Shaw, 2010). Composting latrines require
specific use and maintenance to ensure their proper functioning. For example, a dry organic
desiccant must be kept on hand for addition after each use and the compost removed when it is
ready for harvesting (i.e., annually).
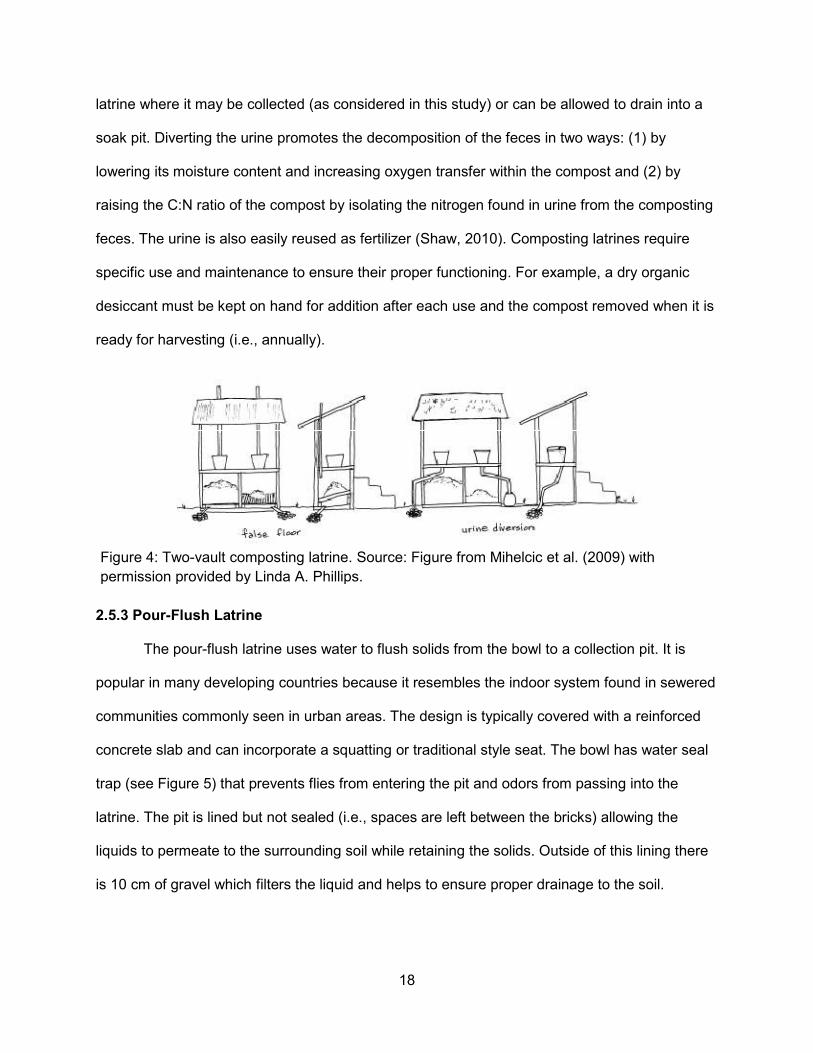
2.5.3 Pour-Flush Latrine
The pour-flush latrine uses water to flush solids from the bowl to a collection pit. It is
popular in many developing countries because it resembles the indoor system found in sewered
communities commonly seen in urban areas. The design is typically covered with a reinforced
concrete slab and can incorporate a squatting or traditional style seat. The bowl has water seal
trap (see Figure 5) that prevents flies from entering the pit and odors from passing into the
latrine. The pit is lined but not sealed (i.e., spaces are left between the bricks) allowing the
liquids to permeate to the surrounding soil while retaining the solids. Outside of this lining there
is 10 cm of gravel which filters the liquid and helps to ensure proper drainage to the soil.
Figure 4: Two-vault composting latrine. Source: Figure from Mihelcic et al. (2009) with
permission provided by Linda A. Phillips.
19
Overall, pour-flush latrines are appropriate in areas with reliable, year-round water supply that
can accommodate the extra water usage associated with flushing the latrine.
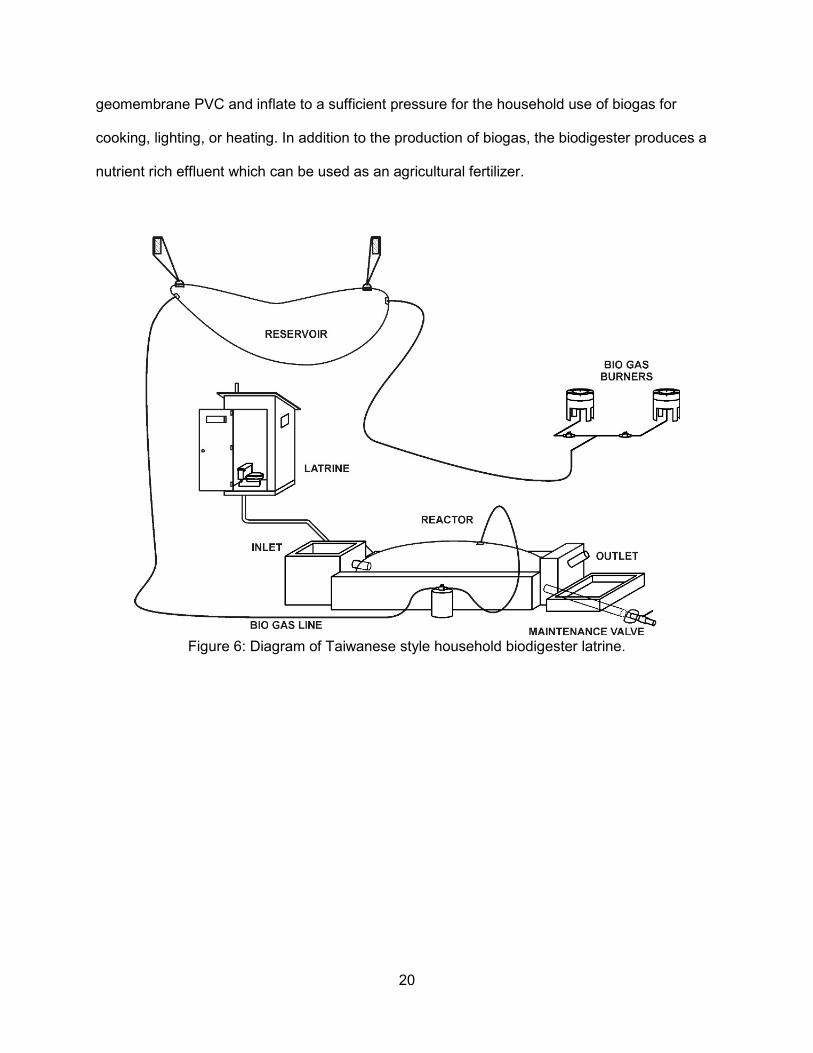
2.5.4 Biodigester Latrine
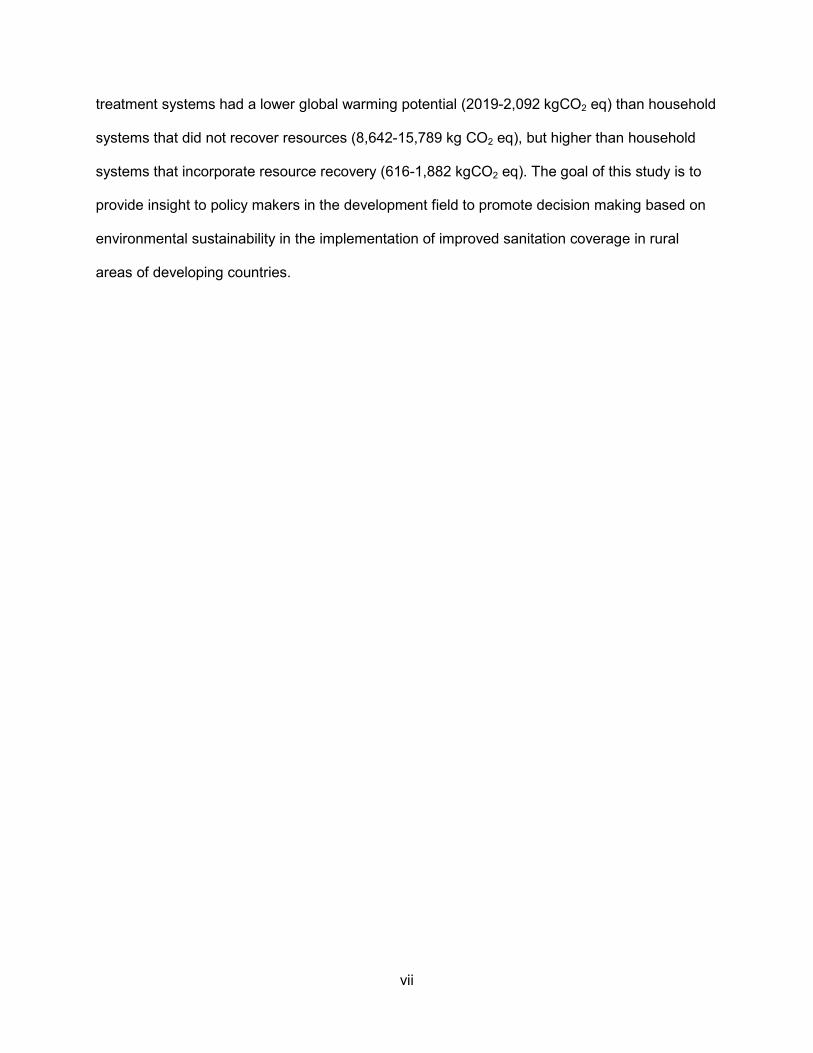
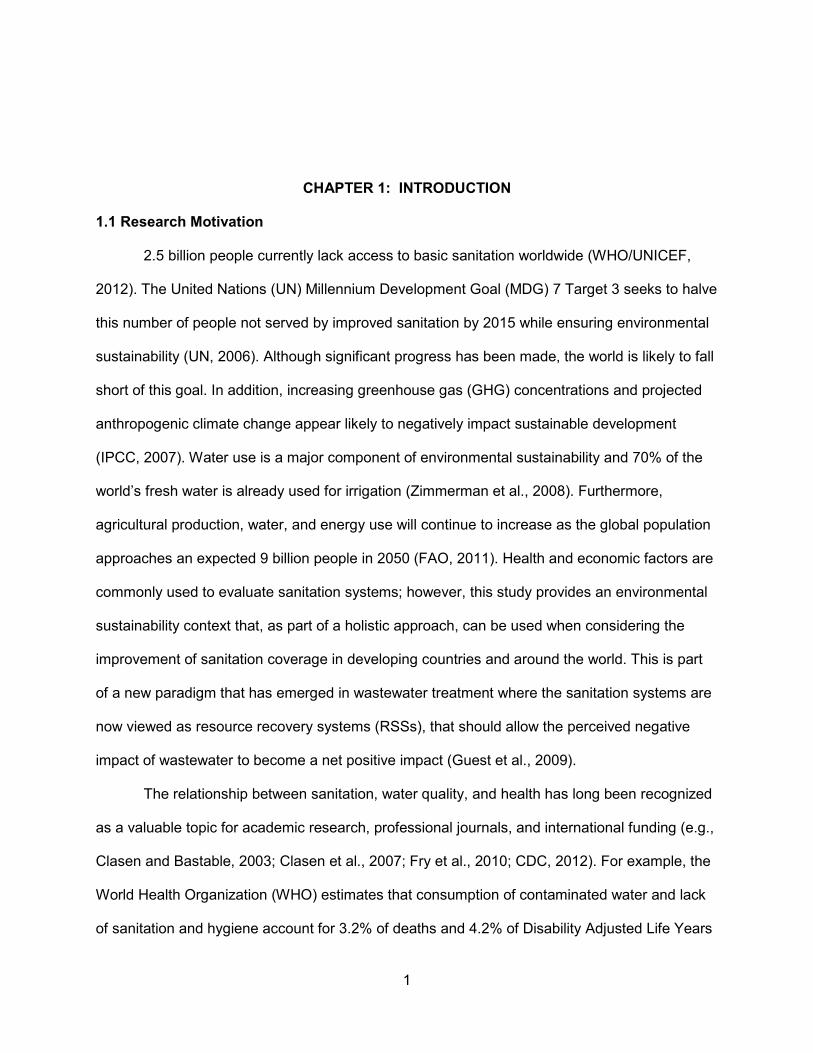
Figure 6 provides a diagram of a household biodigester latrine using a Taiwanese
flexible bag-style digester. Figure 7 provides a photo of what this type of biodigester looks like in
the field. This system is operated semi-continuously with inputs from both the household flush
latrine and manually mixed slurry from cow manure. A solids retention time of 45 days is
recommended to allow time for proper functioning of the reactor. As the reactor is filled the
entrance and exit pipes are sealed by the contained slurry, preventing air from entering the
reactor and allowing the anaerobic digestion process to take place. This initial loading of the
reactor is referred to as “charging” the digester and consists of a period of 2-3 weeks of
operation while the anaerobic bacteria and archaea involved in methanogenesis (production of
methane) multiply and produce biogas. The reactor and reservoir are made from a
Figure 5: Pour-flush latrine with off-set collection pit. Source: Figure from Mihelcic et al. (2009)
with permission provided by Linda A. Phillips.
20
geomembrane PVC and inflate to a sufficient pressure for the household use of biogas for
cooking, lighting, or heating. In addition to the production of biogas, the biodigester produces a
nutrient rich effluent which can be used as an agricultural fertilizer.
Figure 6: Diagram of Taiwanese style household biodigester latrine.

21
Figure 7: Photo of Taiwanese biodigester installed in Santo Domingo, Piura, Peru (photo from
Christopher Galvin).
22
CHAPTER 3: METHODS 3.1 Goal and Scope Definition
The goal of this study is to quantitatively estimate and compare the environmental
sustainability of four sanitation systems found in the Alto-Piura region of northern Peru, and
common in rural areas of other developing countries. While each represents a relatively small
use of resources or investment during construction and use phases, when extended over a
regional, national, or global scale the results are significant. This study is intended to provide
insight to policy makers in the development field interested in environmental sustainability and
to provide reliable data related to local materials, culturally appropriate technology, energy and
resource recovery, and water conservation.
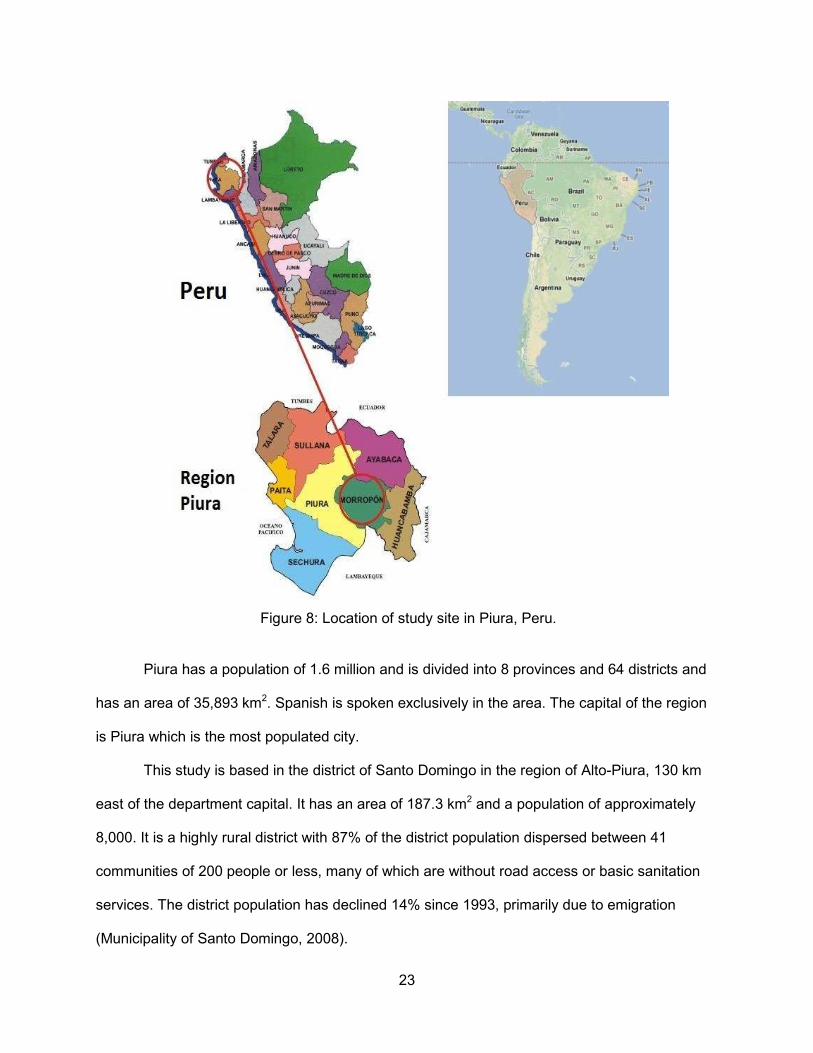
3.2 Site Location
This study takes place in the department of Piura (Peru). As shown in Figure 8, the
department of Piura is located in northern Peru on the western side of the Andes Mountains
sharing a border with Ecuador.
23
Piura has a population of 1.6 million and is divided into 8 provinces and 64 districts and
has an area of 35,893 km2. Spanish is spoken exclusively in the area. The capital of the region
is Piura which is the most populated city.
This study is based in the district of Santo Domingo in the region of Alto-Piura, 130 km
east of the department capital. It has an area of 187.3 km2 and a population of approximately
8,000. It is a highly rural district with 87% of the district population dispersed between 41
communities of 200 people or less, many of which are without road access or basic sanitation
services. The district population has declined 14% since 1993, primarily due to emigration
(Municipality of Santo Domingo, 2008).
Figure 8: Location of study site in Piura, Peru.
24
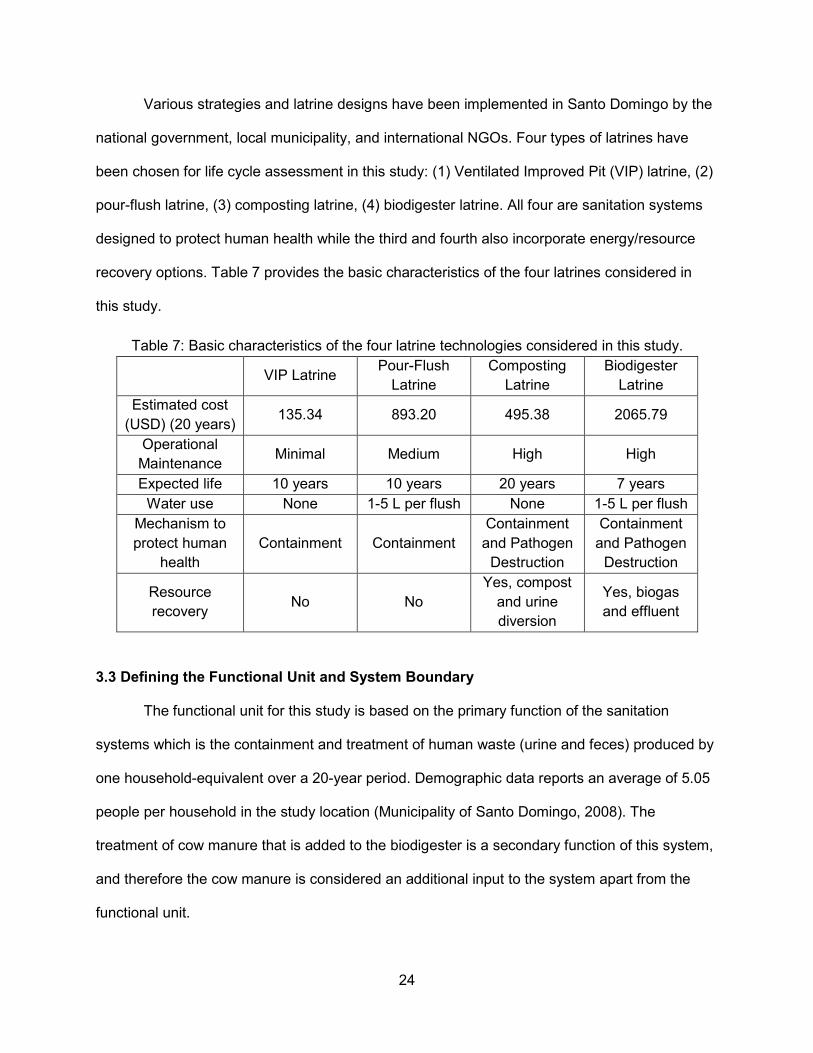
Various strategies and latrine designs have been implemented in Santo Domingo by the
national government, local municipality, and international NGOs. Four types of latrines have
been chosen for life cycle assessment in this study: (1) Ventilated Improved Pit (VIP) latrine, (2)
pour-flush latrine, (3) composting latrine, (4) biodigester latrine. All four are sanitation systems
designed to protect human health while the third and fourth also incorporate energy/resource
recovery options. Table 7 provides the basic characteristics of the four latrines considered in
this study.
3.3 Defining the Functional Unit and System Boundary
The functional unit for this study is based on the primary function of the sanitation
systems which is the containment and treatment of human waste (urine and feces) produced by
one household-equivalent over a 20-year period. Demographic data reports an average of 5.05
people per household in the study location (Municipality of Santo Domingo, 2008). The
treatment of cow manure that is added to the biodigester is a secondary function of this system,
and therefore the cow manure is considered an additional input to the system apart from the
functional unit.
Table 7: Basic characteristics of the four latrine technologies considered in this study.
VIP Latrine Pour-Flush
Latrine
Composting
Latrine
Biodigester
Latrine
Estimated cost
(USD) (20 years) 135.34 893.20 495.38 2065.79
Operational
Maintenance Minimal Medium High High
Expected life 10 years 10 years 20 years 7 years
Water use None 1-5 L per flush None 1-5 L per flush
Mechanism to
protect human
health
Containment Containment
Containment
and Pathogen
Destruction
Containment
and Pathogen
Destruction
Resource
recovery No No
Yes, compost
and urine
diversion
Yes, biogas
and effluent
25
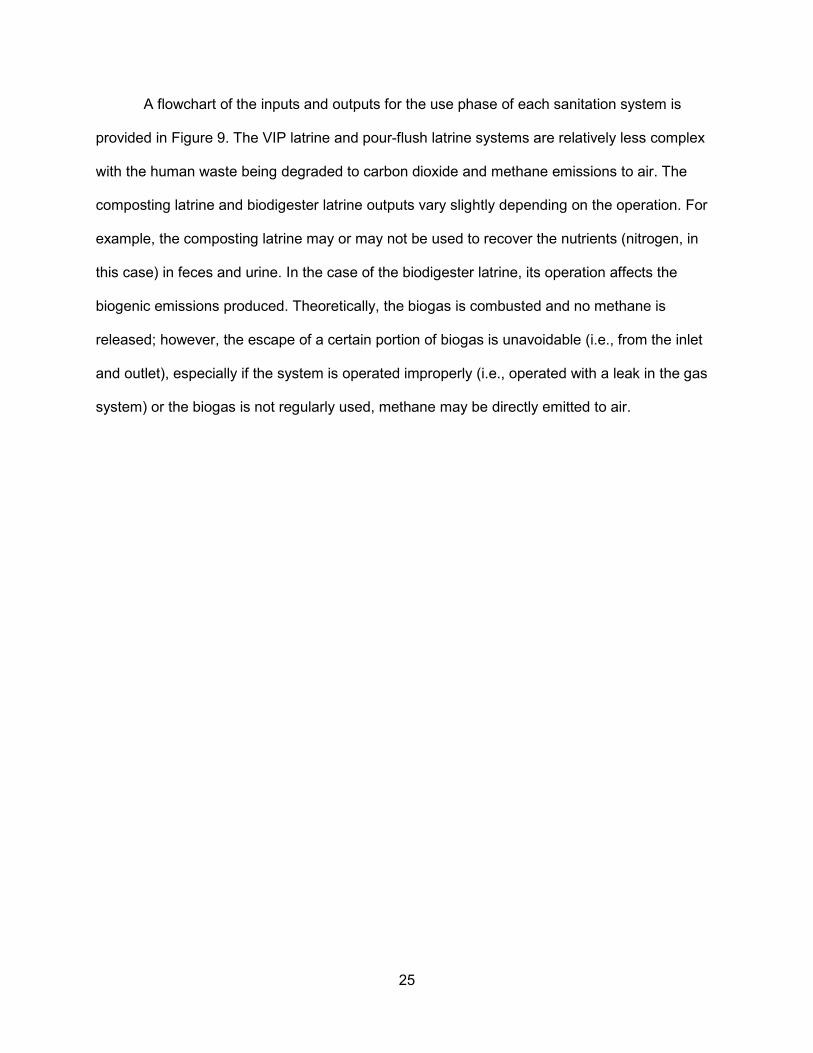
A flowchart of the inputs and outputs for the use phase of each sanitation system is
provided in Figure 9. The VIP latrine and pour-flush latrine systems are relatively less complex
with the human waste being degraded to carbon dioxide and methane emissions to air. The
composting latrine and biodigester latrine outputs vary slightly depending on the operation. For
example, the composting latrine may or may not be used to recover the nutrients (nitrogen, in
this case) in feces and urine. In the case of the biodigester latrine, its operation affects the
biogenic emissions produced. Theoretically, the biogas is combusted and no methane is
released; however, the escape of a certain portion of biogas is unavoidable (i.e., from the inlet
and outlet), especially if the system is operated improperly (i.e., operated with a leak in the gas
system) or the biogas is not regularly used, methane may be directly emitted to air.
26
Figure 9: System diagram showing the inputs and outputs for: (a) VIP latrine (b) pour-flush
latrine (c) composting latrine and (d) biodigester latrine.
27
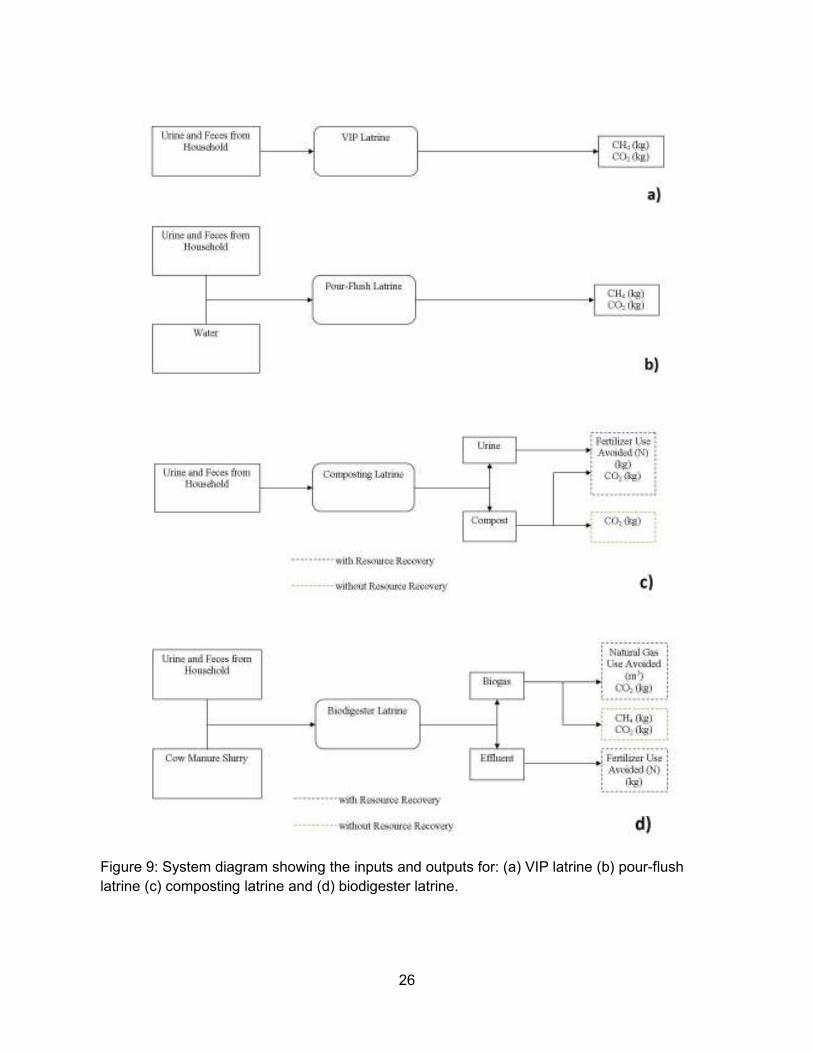
3.3.1 Data Collection and Life Cycle Inventory
Figure 10 provides the LCA framework for materials associated with the four sanitation
technologies. The designs and project budgets for the VIP and composting latrine were
provided by Peace Corps Peru through its technical library. The pour-flush latrine is currently
being implemented by the municipality of Santo Domingo and its design was provided by civil
engineer Cesar Castillo. Several Taiwanese style biodigesters have been installed in the study
site; however, the biodigester latrine is based on literature on biodigesters used as household
sanitation systems (Gunnerson and Stuckey, 1986; GTZ, 1999; Ocwieja, 2010) and developed
in discussions between civil engineer Cesar Castillo and the author. Table 8 provides the model
inputs, data sources, and inventory items used in the LCA in this study.
Material inventories were compiled for each system and entered in SimaPro 7.2 (PRé
Consultants, 2008) using the Ecoinvent database (St. Gallen, Switzerland). Materials and
processes used from the database, such as transport, were assumed to be the same for the
study location.
28
Figure 10: LCA framework used in this study for materials associated with the four household
sanitation technologies.
29
3.4 Calculations for Life Cycle Inventory
3.4.1 Material Production
The total material mass that makes up a particular sanitation technology was estimated
as follows:
�� �������������� = ∑ �� ! ∗ ����ℎ� ���"����#!$!%& (1)
where mass is the weight (kg) of a particular material. The majority of the materials have a
purchase frequency of one, because they do not need to be replaced over the 20-year system
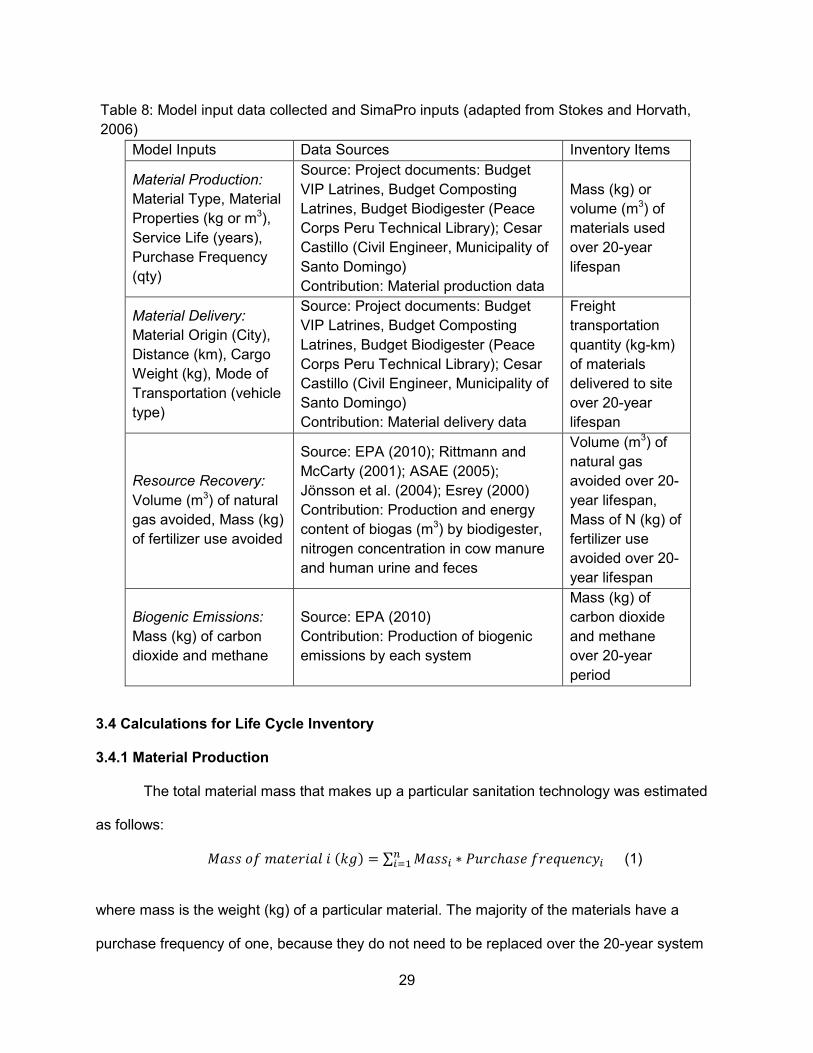
Table 8: Model input data collected and SimaPro inputs (adapted from Stokes and Horvath,
2006)
Model Inputs Data Sources Inventory Items
Material Production:
Material Type, Material
Properties (kg or m3),
Service Life (years),
Purchase Frequency
(qty)
Source: Project documents: Budget
VIP Latrines, Budget Composting
Latrines, Budget Biodigester (Peace
Corps Peru Technical Library); Cesar
Castillo (Civil Engineer, Municipality of
Santo Domingo)
Contribution: Material production data
Mass (kg) or
volume (m3) of
materials used
over 20-year
lifespan
Material Delivery:
Material Origin (City),
Distance (km), Cargo
Weight (kg), Mode of
Transportation (vehicle
type)
Source: Project documents: Budget
VIP Latrines, Budget Composting
Latrines, Budget Biodigester (Peace
Corps Peru Technical Library); Cesar
Castillo (Civil Engineer, Municipality of
Santo Domingo)
Contribution: Material delivery data
Freight
transportation
quantity (kg-km)
of materials
delivered to site
over 20-year
lifespan
Resource Recovery:
Volume (m3) of natural
gas avoided, Mass (kg)
of fertilizer use avoided
Source: EPA (2010); Rittmann and
McCarty (2001); ASAE (2005);
Jönsson et al. (2004); Esrey (2000)
Contribution: Production and energy
content of biogas (m3) by biodigester,
nitrogen concentration in cow manure
and human urine and feces
Volume (m3) of
natural gas
avoided over 20-
year lifespan,
Mass of N (kg) of
fertilizer use
avoided over 20-
year lifespan
Biogenic Emissions:
Mass (kg) of carbon
dioxide and methane
Source: EPA (2010)
Contribution: Production of biogenic
emissions by each system
Mass (kg) of
carbon dioxide
and methane
over 20-year
period

30
life. The geomembrane reactor and gas reservoir for the biodigester latrine were assumed to
have a 7-year life (2.68 purchase frequency). The service lives of the VIP and pour-flush latrines
are based on the amount of time for the pit to fill with accumulated solids, which was assumed
to be 10 years. Therefore, the entire VIP latrine (superstructure and pit) must be reconstructed
only once over the 20-year period and the materials associated with the construction have a
purchase frequency of 2. In the case of the pour-flush latrine, the superstructure and plumbing
are still serviceable if connected to a new pit; therefore, it is only necessary to construct a new
collection pit once over a 20-year period. Thus the materials associated with the construction of
a new collection pit (brick, cement, sand, gravel, and rebar) have a frequency of 2.
3.4.2 Material Delivery
Material delivery was determined in kg-kilometers (kg-km) for each system as follows:
'������#���������������-��� = ∑ �� !���� ∗ '� �����!����$!%& (2)
In Equation 2, mass is the weight (kg) of a particular material and distance is the
distance the material is transported to the construction site. Some materials are available
locally, such as water and wood, while others are produced in other locations and transported to
the site location by truck. The truck capacity was assumed to be 3-16 tons based on the
author’s in country experience. Specific distances from material origin to the study location are
provided in Table 9.
31
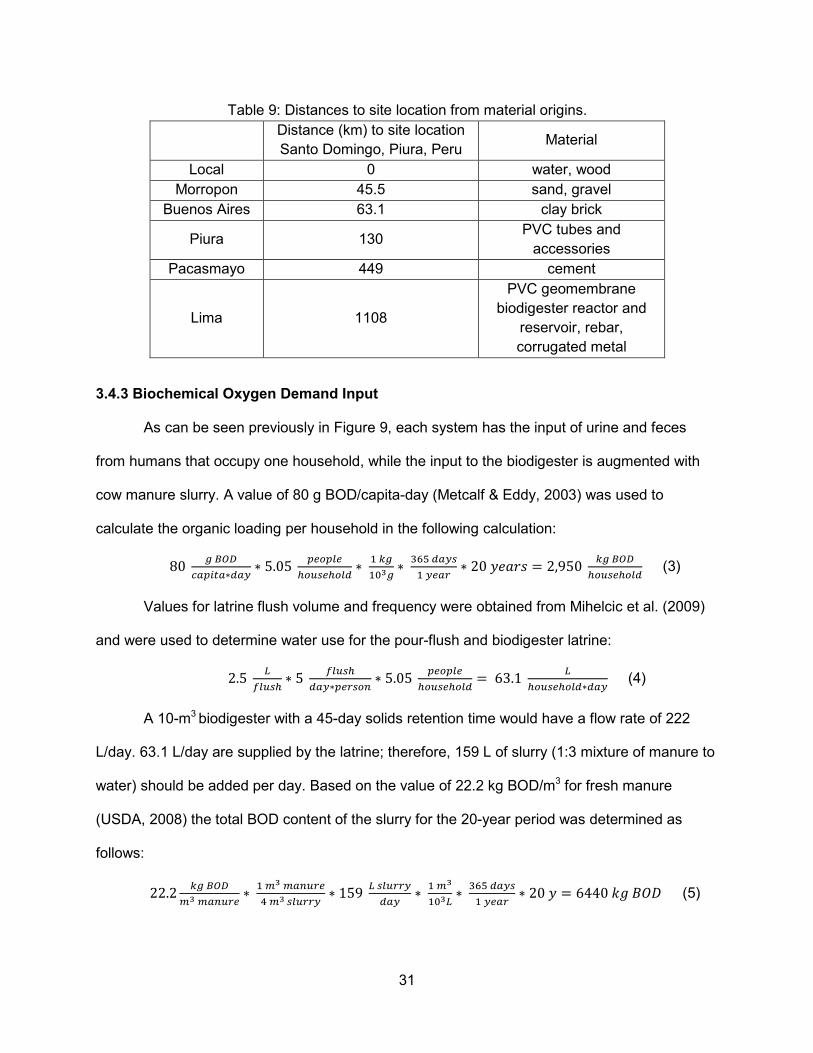
3.4.3 Biochemical Oxygen Demand Input
As can be seen previously in Figure 9, each system has the input of urine and feces
from humans that occupy one household, while the input to the biodigester is augmented with
cow manure slurry. A value of 80 g BOD/capita-day (Metcalf & Eddy, 2003) was used to
calculate the organic loading per household in the following calculation:
80*+,-
./0!1/∗2/3∗ 5.05
067086
97:;69782∗&<*
&=>*∗ ?@A2/3;
&36/B∗ 20#��� = 2,950
<*+,-
97:;69782 (3)
Values for latrine flush volume and frequency were obtained from Mihelcic et al. (2009)
and were used to determine water use for the pour-flush and biodigester latrine:
2.5F
G8:;9∗ 5
G8:;9
2/3∗06B;7$∗ 5.05
067086
97:;69782= 63.1
F
97:;69782∗2/3 (4)
A 10-m3 biodigester with a 45-day solids retention time would have a flow rate of 222
L/day. 63.1 L/day are supplied by the latrine; therefore, 159 L of slurry (1:3 mixture of manure to
water) should be added per day. Based on the value of 22.2 kg BOD/m3 for fresh manure
(USDA, 2008) the total BOD content of the slurry for the 20-year period was determined as
follows:
22.2<*+,-
K>K/$:B6∗&K>K/$:B6
LK>;8:BB3∗ 159
F;8:BB3
2/3∗&K>
&=>F∗?@A2/3;
&36/B∗ 20# = 6440��NO' (5)
Table 9: Distances to site location from material origins.
Distance (km) to site location
Santo Domingo, Piura, Peru Material
Local 0 water, wood
Morropon 45.5 sand, gravel
Buenos Aires 63.1 clay brick
Piura 130 PVC tubes and
accessories
Pacasmayo 449 cement
Lima 1108
PVC geomembrane
biodigester reactor and
reservoir, rebar,
corrugated metal
32
Therefore the total BOD input to the biodigester over 20 years was estimated to be
9,390 kg.
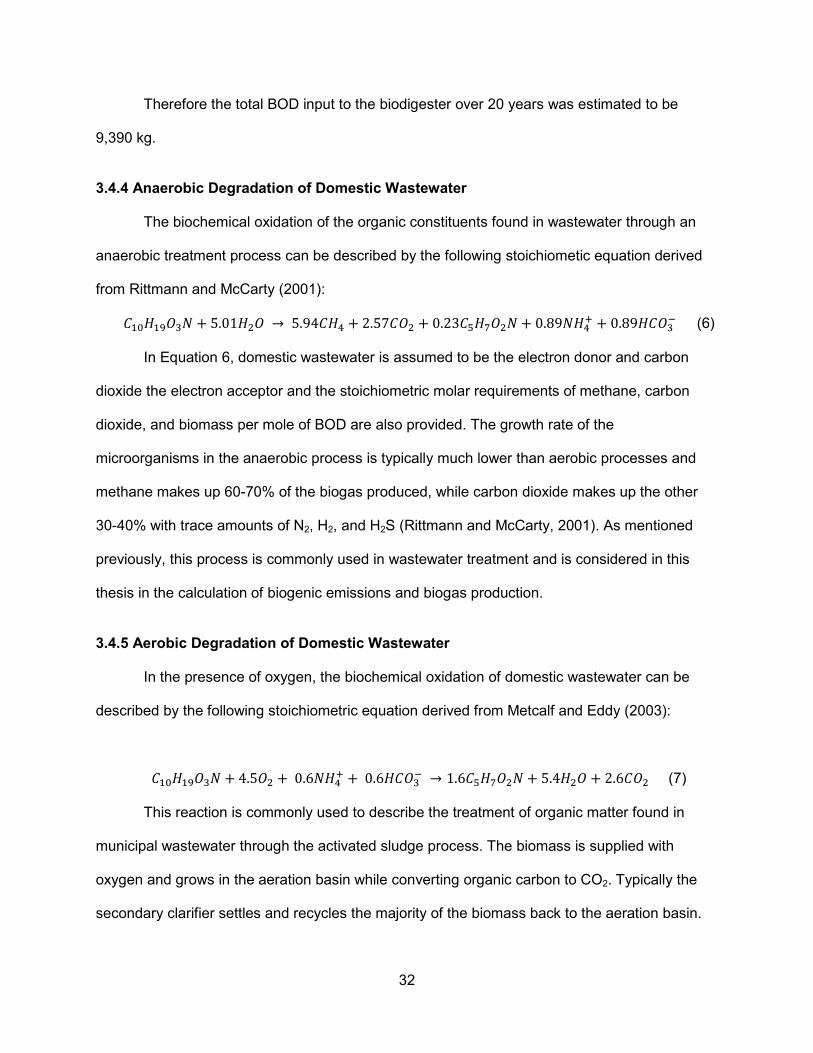
3.4.4 Anaerobic Degradation of Domestic Wastewater
The biochemical oxidation of the organic constituents found in wastewater through an
anaerobic treatment process can be described by the following stoichiometic equation derived
from Rittmann and McCarty (2001):
�&=P&QO?� + 5.01PSO → 5.94�PL + 2.57�OS + 0.23�APVOS� + 0.89�PLW + 0.89P�O?
X (6)
In Equation 6, domestic wastewater is assumed to be the electron donor and carbon
dioxide the electron acceptor and the stoichiometric molar requirements of methane, carbon
dioxide, and biomass per mole of BOD are also provided. The growth rate of the
microorganisms in the anaerobic process is typically much lower than aerobic processes and
methane makes up 60-70% of the biogas produced, while carbon dioxide makes up the other
30-40% with trace amounts of N2, H2, and H2S (Rittmann and McCarty, 2001). As mentioned
previously, this process is commonly used in wastewater treatment and is considered in this
thesis in the calculation of biogenic emissions and biogas production.
3.4.5 Aerobic Degradation of Domestic Wastewater
In the presence of oxygen, the biochemical oxidation of domestic wastewater can be
described by the following stoichiometric equation derived from Metcalf and Eddy (2003):
�&=P&QO?� + 4.5OS + 0.6�PLW + 0.6P�O?
X → 1.6�APVOS� + 5.4PSO + 2.6�OS(7)
This reaction is commonly used to describe the treatment of organic matter found in
municipal wastewater through the activated sludge process. The biomass is supplied with
oxygen and grows in the aeration basin while converting organic carbon to CO2. Typically the
secondary clarifier settles and recycles the majority of the biomass back to the aeration basin.
33
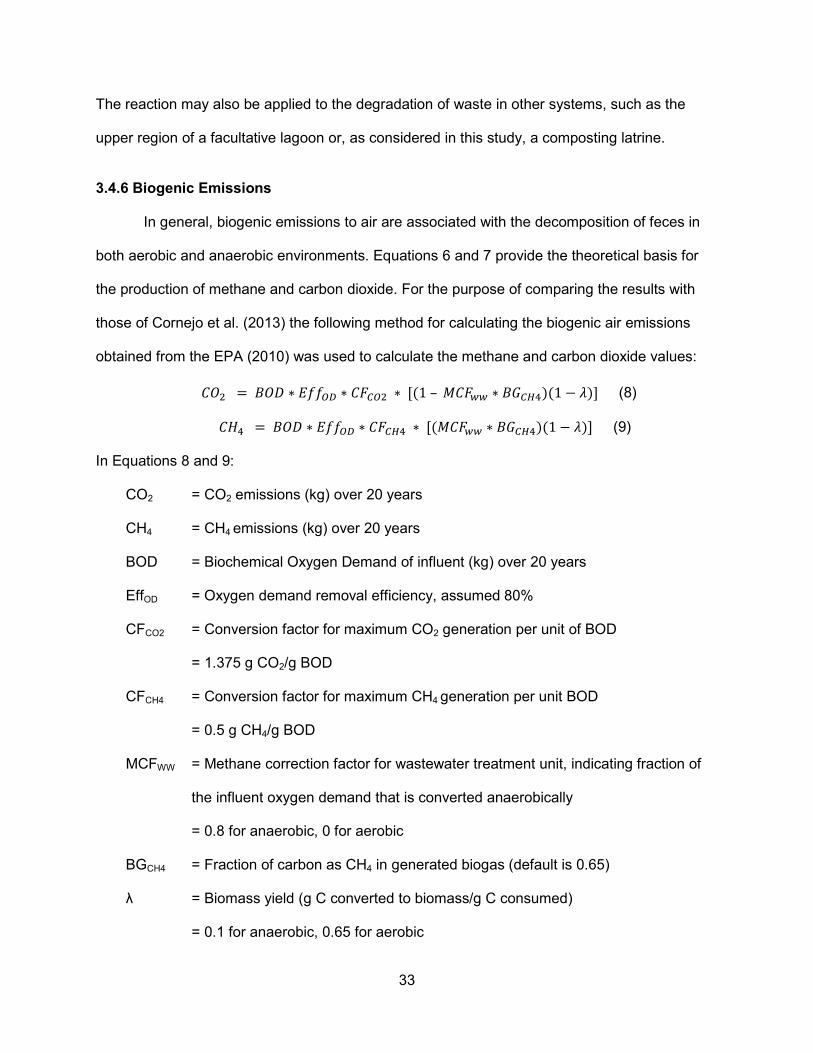
The reaction may also be applied to the degradation of waste in other systems, such as the
upper region of a facultative lagoon or, as considered in this study, a composting latrine.
3.4.6 Biogenic Emissions
In general, biogenic emissions to air are associated with the decomposition of feces in
both aerobic and anaerobic environments. Equations 6 and 7 provide the theoretical basis for
the production of methane and carbon dioxide. For the purpose of comparing the results with
those of Cornejo et al. (2013) the following method for calculating the biogenic air emissions
obtained from the EPA (2010) was used to calculate the methane and carbon dioxide values:
�OS = NO' ∗ Y,- ∗ �Z[,S ∗ [�1–��Z ^ ∗ N_[`L��1 − b�] (8)
�PL = NO' ∗ Y,- ∗ �Z[`L ∗ [���Z ^ ∗ N_[`L��1 − b�] (9)
In Equations 8 and 9:
CO2 = CO2 emissions (kg) over 20 years
CH4 = CH4 emissions (kg) over 20 years
BOD = Biochemical Oxygen Demand of influent (kg) over 20 years
EffOD = Oxygen demand removal efficiency, assumed 80%
CFCO2 = Conversion factor for maximum CO2 generation per unit of BOD
= 1.375 g CO2/g BOD
CFCH4 = Conversion factor for maximum CH4 generation per unit BOD
= 0.5 g CH4/g BOD
MCFWW = Methane correction factor for wastewater treatment unit, indicating fraction of
the influent oxygen demand that is converted anaerobically
= 0.8 for anaerobic, 0 for aerobic
BGCH4 = Fraction of carbon as CH4 in generated biogas (default is 0.65)
λ = Biomass yield (g C converted to biomass/g C consumed)
= 0.1 for anaerobic, 0.65 for aerobic

34
In the past decomposition within a pit of a pit latrine has been considered a strictly
anaerobic process; however, one study identified during the literature review has shown that a
significant portion of the organic content may decompose aerobically before it is covered and
continues decomposing anaerobically (Bhagwan et al., 2008). This process is shown in Figure
11 which depicts the four different theoretical decomposition zones within the contents of the pit
of a latrine. The ratio of aerobic to anaerobic decomposition taking place in the pit latrine is
believed to depend on the moisture content of the material, the permeability of the surrounding
soil, the level of the water table, flow of air through the pit, and addition of other materials to the
pit (such as water for flushing, anal cleansing materials, or desiccants). The results of the
calculation in this study to determine the amount of methane and carbon dioxide emitted from a
pit latrine are presented for two cases for the pit and pour-flush latrine: (1) completely anaerobic
decomposition and (2) 50% aerobic, 50% anaerobic decomposition.

35
Equations 8 and 9 were used to calculate the mass of carbon dioxide and methane
produced by each sanitation system are provided in Table 10. These values were inputted to
SimaPro as emissions to air in the use phase of each system.
Table 10: Biogenic emissions associated with each system.
CO2 (kg) CH4 (kg)
VIP latrine 1,4001 5101
1,2702 2552
Pour-flush latrine 1,4001 5101
1,2702 2552
Composting latrine 1,140 -
Biodigester latrine 4,4603 1,7603
9,2904 -
1Assuming complete anaerobic degradation
2Assuming 50% anaerobic, 50% aerobic degradation
3Assuming biogas is not captured, and is instead released directly to air
4Assuming all biogas is captured and combusted
Figure 11: Diagram of VIP latrine showing different theoretical layers. (a) fresh stool; (b)
partially degraded aerobic surface layer; (c) partially degraded anaerobic layer beneath
surface; (d) completely stabilized anaerobic layer. Source: Buckley et al. (2008) with
permission.

36
3.4.7 Resource Recovery through Biogas and Nutrients
3.4.7.1 Biogas
The biogas produced by the biodigester is calculated using Equations 8 and 9 from the
EPA method (EPA, 2010). An 80% BOD removal efficiency has been reported as typical for the
Taiwanese style digesters (Lansing et al., 2008). This value results in the production of 2,700 m3
of methane and 2,490 m3 of CO2 over a 20-year period (or 259 m3 of biogas per year). When
accounting for the difference in energy content (35.8 MJ/m3 for methane and 39 MJ/m3 for
natural gas) (Rittmann and McCarty, 2001; McGraw-Hill, 1982), this yields an equivalent of
2,470 m3 of natural gas use avoided over the 20-year period. This value is then inputted to
SimaPro as an avoided product in the use phase of the biodigester latrine.
3.4.7.2 Biodigester Effluent
The fertilizer potential of the biodigester was determined based on the nitrogen content
of the effluent. A 222 L/day flowrate of digestate would produce16,200 m3 of effluent over a 20-
year period. Table 3 provided the nutrient concentration found in potential biodigester feeds.
The nitrogen content of the human waste was determined using the values from Table 2 (Esrey,
2000).
12.5*d
06B;7$∗2/3∗ 5.05������ ∗
?@A2/3;
36/B∗ 20#��� ∗
&<*
&=>*= 461��� (10)
The nitrogen content of the manure slurry was determined using values from ASAE
(2005). Typical cow manure slurry for household biodigesters consists of a 1:3 ratio of manure
to water. As mentioned in section 3.4.3 (Biochemical Oxygen Demand) 159 L of cow manure
slurry are added daily to satisfy the operational requirements of the biodigester.
6620K*d
F∗&FK/$:B6
LF;8:BB3∗ &AQF
2/3∗ ?@A2/3;
36/B∗ 20#��� ∗
&<*
&=eK*= 1921��� (11)
The sum of the values from Equations 10 and 11 results in 2,382 kg N produced in the
biodigester effluent over a 20-year period. This value was inputted to SimaPro as the mass of
37
urea fertilizer (as N) use avoided. Other elements present in the effluent and compost, such as
potassium and calcium, are not included in the resource recovery calculation because these
elements are not the main components of fertilizers typically used in the study site.
3.4.7.3 Compost and Urine Diversion
According to the data provided previously in Table 2, one person produces 11 g of
nitrogen in urine and 1.55 g of nitrogen in feces per day (Esrey, 2000; Jönsson et al., 2004).
Nitrogen losses associated with urine diversion, collection, and use are assumed to be
negligible because there is little opportunity for the volatilization of ammonia within a sealed
receptacle. The feces are aerobically composted within the chambers of the composting latrine.
A model for the loss of nitrogen during aerobic decomposition from Kirchman and Witter (1989)
predicts a 34.3% loss of nitrogen through the volatilization of ammonia for compost with C:N
ratio of 10 and 1-year storage time. This is within the 10-50% range suggested by Jönsson et al.
(2004) for nitrogen loss during aerobic composting. Assuming 34.3% loss of nitrogen, a
household composting latrine with urine diversion (and collection) would therefore produce 443
kg of nitrogen over a 20-year span. This value is inputted to SimaPro as urea fertilizer (as N)
use avoided in the use phase of the composting latrine.
3.5 Sensitivity Analysis
A sensitivity analysis was performed to identify changes to which input parameters the
results are more sensitive. The top five contributors in each system were considered. The value
for each input was modified by 20% and the CED and GWP of the system were calculated to
determine how the change in the input impacted the resulting CED and GWP. The percent
change in CED and GWP was then divided by the percent change of the input parameter to
determine the sensitivity factor.

38
3.6 Life Cycle Impact Assessment and Interpretation
To perform the impact assessment and interpretation steps of the life cycle, the
Cumulative Energy Demand (CED) and Global Warming Potential (GWP) methods in SimaPro
7.2 (PRé Consultants, 2008) were used to calculate the results. Embodied energy in terms of
CED (MJ) was quantified using the CED method and carbon footprint in terms of GWP (kgCO2
eq) was quantified using the Intergovernmental Panel on Climate Change (IPCC) 2007 GWP
100a method.

39
CHAPTER 4: RESULTS AND DISCUSSION
4.1 Impact of Privacy Structure on CED and GWP
The CED and GWP values of the construction phase of the four latrine designs and their
variations are provided in this section. The materials used in construction of the privacy
structure of the latrine can vary depending on location. This will change the latrine’s
environmental impact without affecting its function as a sanitation system. Many possibilities
exist in constructing a privacy structure of a latrine due to material availability, cost, and
regional/local preferences. In this study, two scenarios were chosen for comparison of the CED
and GWP contributed by the privacy shelter: (1) adobe brick walls with a fiber cement roof and
(2) brick walls with a corrugated metal roof. Table 11 provides a description of the design
variations considered in this study. Complete material inventories for each latrine are provided
in Appendix A. The CED and GWP for the construction phase, including the privacy structure
and other construction aspects, of each latrine are provided in Figure 12.

40
Table 11: Latrine design variations considered in this study.
Variation of latrine
type and privacy
shelter
Notes
VIP latrine adobe fiber
cement
• Pit lined with brick
• Adobe walls, fiber cement roof
VIP latrine adobe fiber
cement (unlined pit)
• Pit unlined
• Adobe walls, fiber cement roof
VIP latrine brick
corrugated metal
• Pit lined with brick
• Brick walls, corrugated metal roof
Pour-flush latrine
adobe fiber cement
• Pit lined with brick
• Adobe walls, fiber cement roof
Pour-flush latrine brick
corrugated metal
• Pit lined with brick
• Brick walls, corrugated metal roof
Composting latrine
adobe fiber cement
• Chambers built from brick
• Upper walls built from adobe, fiber cement roof
Composting latrine
brick corrugated metal
• Chambers built from brick
• Upper walls built from brick, corrugated metal roof
Biodigester latrine
adobe fiber cement
• Trench reactor housing lined with adobe with concrete
inlet and outlets
• Superstructure built from adobe, fiber cement roof
Biodigester latrine
brick corrugated metal
• Trench reactor housing lined with adobe with concrete
inlet and outlets
• Superstructure walls built from brick, corrugated metal
roof

41
Figures 12a and 12b show that the unlined VIP latrine has the lowest CED and GWP
values at 760 MJ and 58.4 kgCO2 eq, respectively. There is no brick used in this design for
lining the pit or construction of the privacy structure and the CED is over 7.5 times less than the
same latrine design with a brick lined pit. Excluding the unlined VIP latrine, the CED values of
the other latrines vary between 5,724 MJ for the VIP latrine with adobe fiber cement privacy
structure and 20,474 MJ for the biodigester latrine with brick corrugated metal privacy structure.
Figure 12: (a) Cumulative energy demand and (b) global warming potential of construction
phase of sanitation systems.
0.0E+0
5.0E+3
1.0E+4
1.5E+4
2.0E+4
VIP latrine Pour-flush
latrine
Composting
latrine
Biodigester
latrine
CE
D (
MJ
pe
r h
ou
seh
old
)
Adobe fiber cement
Brick corrugated
metal
Adobe fiber cement
(unlined pit)
a)
0.0E+0
5.0E+2
1.0E+3
1.5E+3
2.0E+3
VIP latrine Pour-flush
latrine
Composting
latrine
Biodigester
latrine
GW
P (
kg
CO
2e
q p
er
ho
use
ho
ld)
Adobe fiber cement
Brick corrugated
metal
Adobe fiber cement
(unlined pit)
b)
42
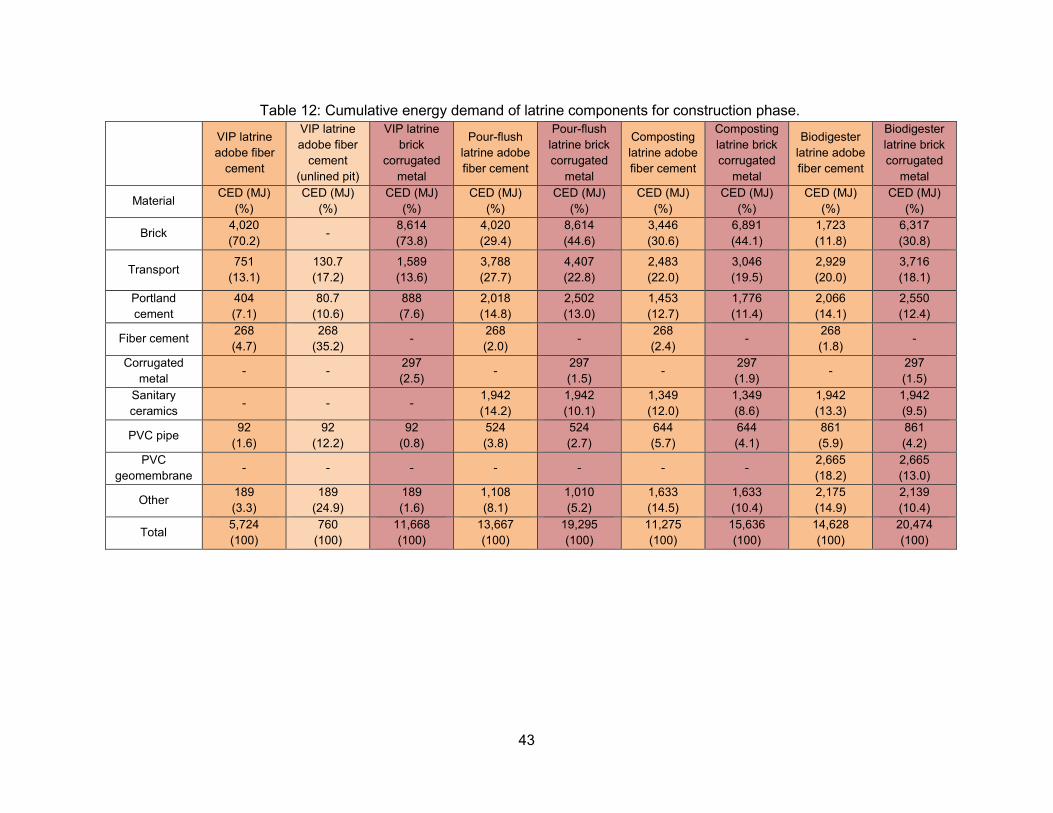
Designs using brick as a construction material have an average CED of 5,445 MJ higher for the
construction phase than those using adobe. The GWP values for each latrine vary between 502
kgCO2 eq for VIP latrine with adobe fiber cement privacy structure to 1,724 kgCO2 eq for the
pour-flush latrine with brick corrugated metal privacy structure. Similarly, designs using brick
have average GWP 512 kgCO2 eq higher than those using adobe. The difference between the
CED and GWP values for fiber cement and corrugated metal was negligible at (29 MJ and 7.3
kgCO2 eq, respectively). The contributions to the overall CED and GWP for each latrine are
provided in Tables 12 and 13. Complete LCA results can be found in Appendix B.
43
Table 12: Cumulative energy demand of latrine components for construction phase.
VIP latrine
adobe fiber
cement
VIP latrine
adobe fiber
cement
(unlined pit)
VIP latrine
brick
corrugated
metal
Pour-flush
latrine adobe
fiber cement
Pour-flush
latrine brick
corrugated
metal
Composting
latrine adobe
fiber cement
Composting
latrine brick
corrugated
metal
Biodigester
latrine adobe
fiber cement
Biodigester
latrine brick
corrugated
metal
Material CED (MJ)
(%)
CED (MJ)
(%)
CED (MJ)
(%)
CED (MJ)
(%)
CED (MJ)
(%)
CED (MJ)
(%)
CED (MJ)
(%)
CED (MJ)
(%)
CED (MJ)
(%)
Brick 4,020
(70.2) -
8,614
(73.8)
4,020
(29.4)
8,614
(44.6)
3,446
(30.6)
6,891
(44.1)
1,723
(11.8)
6,317
(30.8)
Transport 751
(13.1)
130.7
(17.2)
1,589
(13.6)
3,788
(27.7)
4,407
(22.8)
2,483
(22.0)
3,046
(19.5)
2,929
(20.0)
3,716
(18.1)
Portland
cement
404
(7.1)
80.7
(10.6)
888
(7.6)
2,018
(14.8)
2,502
(13.0)
1,453
(12.7)
1,776
(11.4)
2,066
(14.1)
2,550
(12.4)
Fiber cement 268
(4.7)
268
(35.2) -
268
(2.0) -
268
(2.4) -
268
(1.8) -
Corrugated
metal - -
297
(2.5) -
297
(1.5) -
297
(1.9) -
297
(1.5)
Sanitary
ceramics - - -
1,942
(14.2)
1,942
(10.1)
1,349
(12.0)
1,349
(8.6)
1,942
(13.3)
1,942
(9.5)
PVC pipe 92
(1.6)
92
(12.2)
92
(0.8)
524
(3.8)
524
(2.7)
644
(5.7)
644
(4.1)
861
(5.9)
861
(4.2)
PVC
geomembrane - - - - - - -
2,665
(18.2)
2,665
(13.0)
Other 189
(3.3)
189
(24.9)
189
(1.6)
1,108
(8.1)
1,010
(5.2)
1,633
(14.5)
1,633
(10.4)
2,175
(14.9)
2,139
(10.4)
Total 5,724
(100)
760
(100)
11,668
(100)
13,667
(100)
19,295
(100)
11,275
(100)
15,636
(100)
14,628
(100)
20,474
(100)

44
Table 13: Global warming potential of latrine components for construction phase.
VIP latrine adobe and
fiber cement
VIP latrine adobe fiber
cement (unlined pit)
VIP latrine brick
corrugated metal
Pour-flush latrine adobe fiber cement
Pour-flush latrine brick corrugated
metal
Composting latrine adobe fiber cement
Composting latrine brick corrugated
metal
Biodigester latrine adobe fiber cement
Biodigester latrine brick corrugated
metal
Material GWP
(kgCO2 eq) (%)
GWP (kgCO2 eq)
(%)
GWP (kgCO2 eq)
(%)
GWP (kgCO2 eq)
(%)
GWP (kgCO2 eq)
(%)
GWP (kgCO2 eq)
(%)
GWP (kgCO2 eq)
(%)
GWP (kgCO2 eq)
(%)
GWP (kgCO2 eq)
(%)
Brick 338
(67.3) -
724 (66.8)
338 (28.3)
724 (42.0)
290 (30.7)
579 (43.2)
145 (13.4)
531 (33.2)
Transport 43.2 (8.6)
7.5 (12.9)
127 (11.7)
218 (18.2)
253 (14.7)
143 (15.1)
175 (13.0)
211 (16.6)
214 (13.3)
Portland cement
87.3 (17.4)
17.5 (29.9)
192 (17.7)
436 (36.5)
541 (31.4)
314 (33.3)
384 (28.6)
447 (41.2)
551 (34.5)
Fiber cement 19.9 (4.0)
19.9 (34.1)
- 19.9 (1.7)
- 19.9 (2.1)
- 19.9 (1.8)
-
Corrugated metal
- - 27.2 (2.5)
- 27.2 (1.6)
- 27.2 (2.0)
- 27.2 (1.7)
Sanitary ceramics
- - - 106 (8.9)
106 (6.1)
73.5 (7.8)
73.5 (5.5)
106 (9.8)
106 (6.6)
PVC pipe 4.4
(0.9) 4.4
(7.5) 4.4
(0.4) 24.9 (2.1)
24.9 (1.4)
30.6 (3.2)
30.6 (2.3)
41.0 (3.8)
41.0 (2.6)
PVC geomembrane
- - - - - - - 87.3 (8.1)
87.3 (5.4)
Other 9.1
(1.8) 9.1
(15.7) 9.1
(0.8) 51.5 (4.3)
47.8 (2.8)
72.7 (7.7)
72.7 (5.4)
69.9 (6.4)
63.1 (3.9)
Total 502
(100) 58.4 (100)
1,084 (100)
1,194 (100)
1,724 (100)
943 (100)
1,342 (100)
1,084 (100)
1,620 (100)
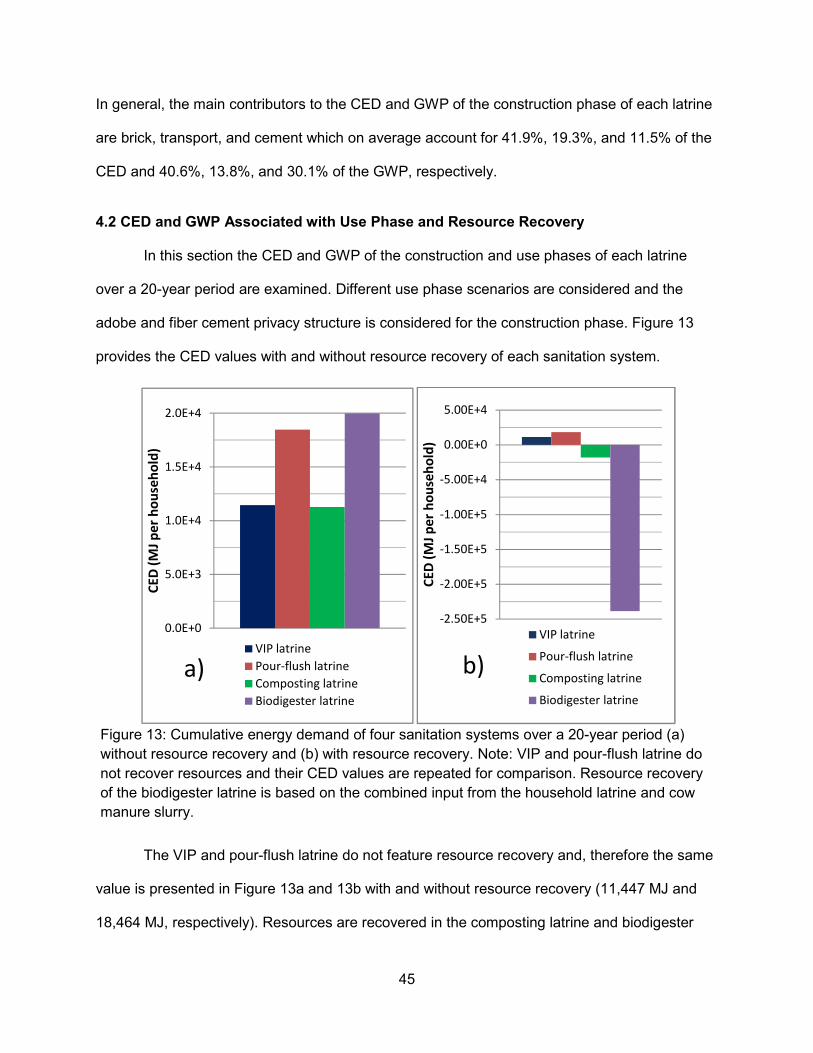
45
In general, the main contributors to the CED and GWP of the construction phase of each latrine
are brick, transport, and cement which on average account for 41.9%, 19.3%, and 11.5% of the
CED and 40.6%, 13.8%, and 30.1% of the GWP, respectively.
4.2 CED and GWP Associated with Use Phase and Resource Recovery
In this section the CED and GWP of the construction and use phases of each latrine
over a 20-year period are examined. Different use phase scenarios are considered and the
adobe and fiber cement privacy structure is considered for the construction phase. Figure 13
provides the CED values with and without resource recovery of each sanitation system.
The VIP and pour-flush latrine do not feature resource recovery and, therefore the same
value is presented in Figure 13a and 13b with and without resource recovery (11,447 MJ and
18,464 MJ, respectively). Resources are recovered in the composting latrine and biodigester
Figure 13: Cumulative energy demand of four sanitation systems over a 20-year period (a)
without resource recovery and (b) with resource recovery. Note: VIP and pour-flush latrine do
not recover resources and their CED values are repeated for comparison. Resource recovery
of the biodigester latrine is based on the combined input from the household latrine and cow
manure slurry.
0.0E+0
5.0E+3
1.0E+4
1.5E+4
2.0E+4
CE
D (
MJ
pe
r h
ou
seh
old
)
VIP latrine
Pour-flush latrine
Composting latrine
Biodigester latrine
a)
-2.50E+5
-2.00E+5
-1.50E+5
-1.00E+5
-5.00E+4
0.00E+0
5.00E+4
CE
D (
MJ
pe
r h
ou
seh
old
)
VIP latrine
Pour-flush latrine
Composting latrine
Biodigester latrine
b)
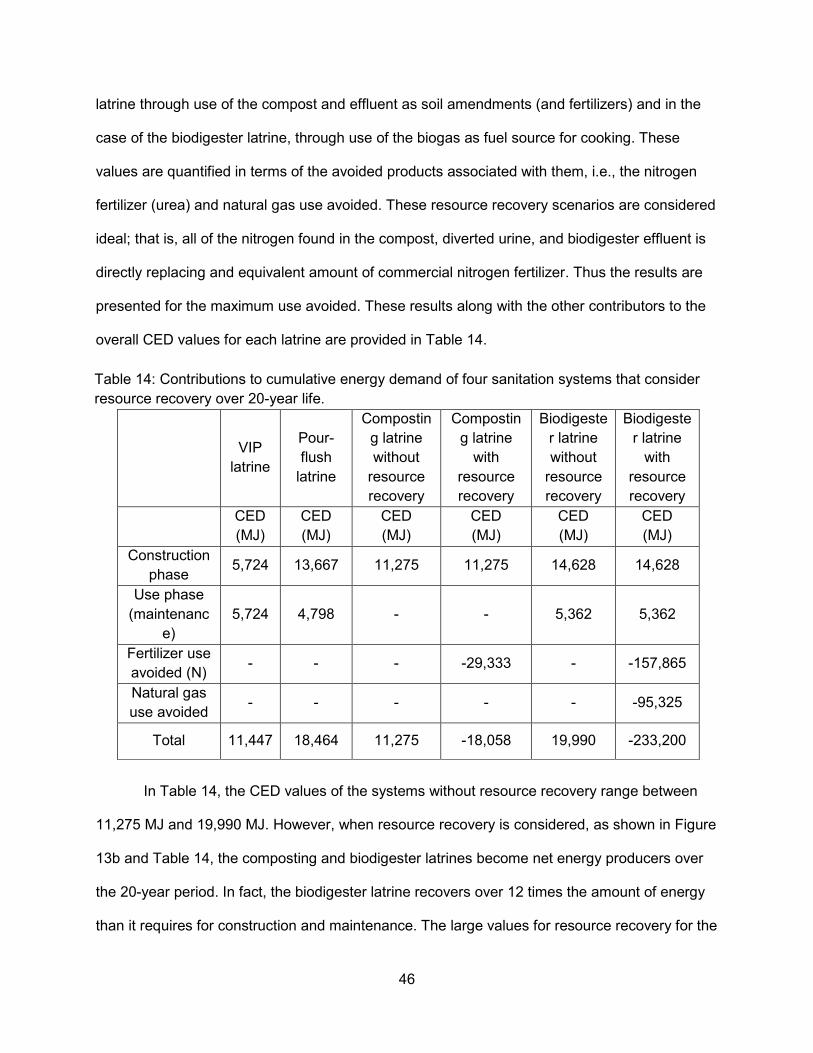
46
latrine through use of the compost and effluent as soil amendments (and fertilizers) and in the
case of the biodigester latrine, through use of the biogas as fuel source for cooking. These
values are quantified in terms of the avoided products associated with them, i.e., the nitrogen
fertilizer (urea) and natural gas use avoided. These resource recovery scenarios are considered
ideal; that is, all of the nitrogen found in the compost, diverted urine, and biodigester effluent is
directly replacing and equivalent amount of commercial nitrogen fertilizer. Thus the results are
presented for the maximum use avoided. These results along with the other contributors to the
overall CED values for each latrine are provided in Table 14.
In Table 14, the CED values of the systems without resource recovery range between
11,275 MJ and 19,990 MJ. However, when resource recovery is considered, as shown in Figure
13b and Table 14, the composting and biodigester latrines become net energy producers over
the 20-year period. In fact, the biodigester latrine recovers over 12 times the amount of energy
than it requires for construction and maintenance. The large values for resource recovery for the
Table 14: Contributions to cumulative energy demand of four sanitation systems that consider
resource recovery over 20-year life.
VIP
latrine
Pour-
flush
latrine
Compostin
g latrine
without
resource
recovery
Compostin
g latrine
with
resource
recovery
Biodigeste
r latrine
without
resource
recovery
Biodigeste
r latrine
with
resource
recovery
CED
(MJ)
CED
(MJ)
CED
(MJ)
CED
(MJ)
CED
(MJ)
CED
(MJ)
Construction
phase 5,724 13,667 11,275 11,275 14,628 14,628
Use phase
(maintenanc
e)
5,724 4,798 - - 5,362 5,362
Fertilizer use
avoided (N) - - - -29,333 - -157,865
Natural gas
use avoided - - - - - -95,325
Total 11,447 18,464 11,275 -18,058 19,990 -233,200
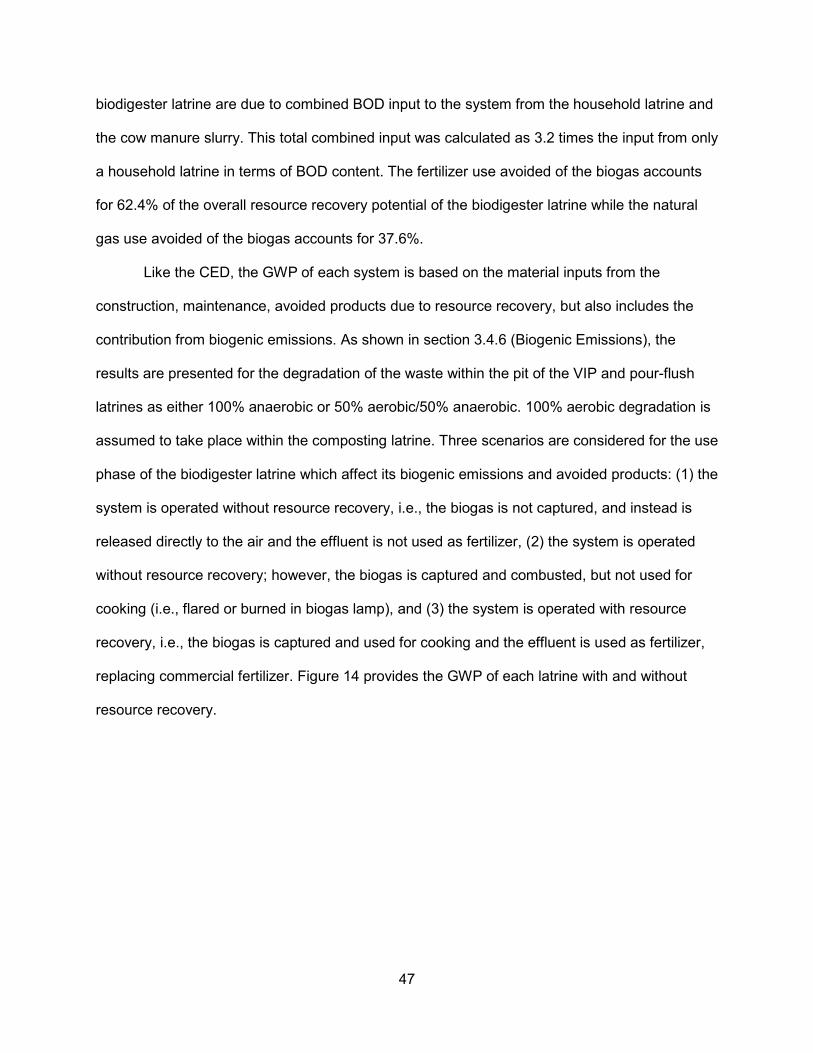
47
biodigester latrine are due to combined BOD input to the system from the household latrine and
the cow manure slurry. This total combined input was calculated as 3.2 times the input from only
a household latrine in terms of BOD content. The fertilizer use avoided of the biogas accounts
for 62.4% of the overall resource recovery potential of the biodigester latrine while the natural
gas use avoided of the biogas accounts for 37.6%.
Like the CED, the GWP of each system is based on the material inputs from the
construction, maintenance, avoided products due to resource recovery, but also includes the
contribution from biogenic emissions. As shown in section 3.4.6 (Biogenic Emissions), the
results are presented for the degradation of the waste within the pit of the VIP and pour-flush
latrines as either 100% anaerobic or 50% aerobic/50% anaerobic. 100% aerobic degradation is
assumed to take place within the composting latrine. Three scenarios are considered for the use
phase of the biodigester latrine which affect its biogenic emissions and avoided products: (1) the
system is operated without resource recovery, i.e., the biogas is not captured, and instead is
released directly to the air and the effluent is not used as fertilizer, (2) the system is operated
without resource recovery; however, the biogas is captured and combusted, but not used for
cooking (i.e., flared or burned in biogas lamp), and (3) the system is operated with resource
recovery, i.e., the biogas is captured and used for cooking and the effluent is used as fertilizer,
replacing commercial fertilizer. Figure 14 provides the GWP of each latrine with and without
resource recovery.
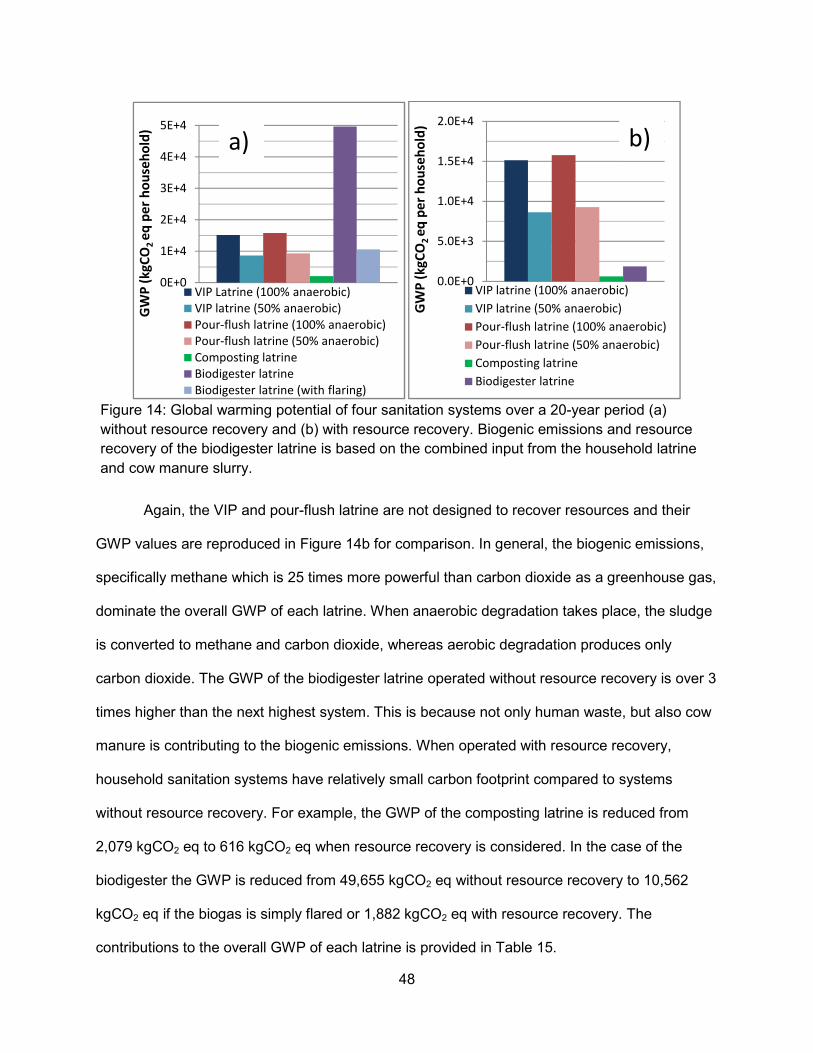
48
Again, the VIP and pour-flush latrine are not designed to recover resources and their
GWP values are reproduced in Figure 14b for comparison. In general, the biogenic emissions,
specifically methane which is 25 times more powerful than carbon dioxide as a greenhouse gas,
dominate the overall GWP of each latrine. When anaerobic degradation takes place, the sludge
is converted to methane and carbon dioxide, whereas aerobic degradation produces only
carbon dioxide. The GWP of the biodigester latrine operated without resource recovery is over 3
times higher than the next highest system. This is because not only human waste, but also cow
manure is contributing to the biogenic emissions. When operated with resource recovery,
household sanitation systems have relatively small carbon footprint compared to systems
without resource recovery. For example, the GWP of the composting latrine is reduced from
2,079 kgCO2 eq to 616 kgCO2 eq when resource recovery is considered. In the case of the
biodigester the GWP is reduced from 49,655 kgCO2 eq without resource recovery to 10,562
kgCO2 eq if the biogas is simply flared or 1,882 kgCO2 eq with resource recovery. The
contributions to the overall GWP of each latrine is provided in Table 15.
Figure 14: Global warming potential of four sanitation systems over a 20-year period (a)
without resource recovery and (b) with resource recovery. Biogenic emissions and resource
recovery of the biodigester latrine is based on the combined input from the household latrine
and cow manure slurry.
0E+0
1E+4
2E+4
3E+4
4E+4
5E+4
GW
P (
kg
CO
2 e
q p
er
ho
use
ho
ld)
VIP Latrine (100% anaerobic)
VIP latrine (50% anaerobic)
Pour-flush latrine (100% anaerobic)
Pour-flush latrine (50% anaerobic)
Composting latrine
Biodigester latrine
Biodigester latrine (with flaring)
a)
0.0E+0
5.0E+3
1.0E+4
1.5E+4
2.0E+4
GW
P (
kg
CO
2 e
q p
er
ho
use
ho
ld)
VIP latrine (100% anaerobic)
VIP latrine (50% anaerobic)
Pour-flush latrine (100% anaerobic)
Pour-flush latrine (50% anaerobic)
Composting latrine
Biodigester latrine
b)
49
Table 15: Contributions to global warming potential of sanitation systems over 20-year life.
VIP latrine1 VIP latrine
2
Pour-flush
latrine1
Pour-flush
latrine2
Composting
latrine
without
resource
recovery
Composting
latrine with
resource
recovery
Biodigester
latrine
without
resource
recovery3
Biodigester
latrine with
resource
recovery4
Biodigester
latrine
without
resource
recovery
with
flaring4
GWP
(kgCO2 eq)
(%)
GWP
(kgCO2 eq)
(%)
GWP
(kgCO2 eq)
(%)
GWP
(kgCO2 eq)
(%)
GWP
(kgCO2 eq)
(%)
GWP
(kgCO2 eq)
GWP
(kgCO2 eq)
(%)
GWP
(kgCO2 eq)
GWP
(kgCO2 eq)
(%)
Construction
phase
502
(3.3)
502
(3.3)
1,211
(7.7)
1,211
(12.9)
943
(45.4) 943
1,084
(2.2) 1,084
1,084
(10.3)
Use phase
(maintenance)
502
(3.3)
502
(3.3)
453
(2.9)
453
(4.8)
186
(0.4) 186
186
(1.8)
Direct CH4 12,741
(84.1)
6,370
(73.7)
12,741
(80.7)
6,370
(67.9) - -
43,926
(88.5) - -
Direct CO2 1,401
(9.2)
1,268
(14.7)
1,401
(8.9)
1,268
(13.5)
1,135
(54.6) 1,135
4,460
(9.0) 9,293
9,293
(88.0)
Fertilizer use
avoided (N) - - - - - -1,462 - -7,869 -
Natural gas
use avoided - - - - - - - -811 -
Total 15,146
(100)
8,642
(100)
15,789
(100)
9,286
(100)
2,079
(100) 616
49,655
(100) 1,882
10,562
(100) 1Assuming complete anaerobic degradation
2Assuming 50% anaerobic, 50% aerobic degradation
3Assuming biogas is not captured, and is instead released directly to air
4Assuming all biogas is captured and combusted

In general, the biogenic emissions dominate the overall GWP of each latrine
contribution of biogenic emissions to the GWP is lowest for the composting latrine at 1,135
kgCO2 eq, or 54.6% of the overall GWP
taking place within the composting latrine which produces on
contributions of biogenic emissions, maintenance and construction
latrine are also presented in Figure 1
of the systems; however, one study done on thermophilic composting of swine wasting
measured only a 30% reduction of the total organic carbon due to thermophilic composting of
swine waste (Zhu, 2007). Using a 30% BOD removal efficiency, the biogenic CO
the composting latrine would be 426 kgCO
efficiency.
Figure 15: Contribution of materials and biogenic emissions to global
each sanitation system. 1Assuming complete anaerobic degradation
2Assuming 50% anaerobic, 50% aerobic degradation
3Assuming biogas is not captured, and is instead released directly to air
4Assuming all biogas is captured and combusted
0.0E+0
1.0E+4
2.0E+4
3.0E+4
4.0E+4
5.0E+4
GW
P (
kg
CO
2e
q)
50
In general, the biogenic emissions dominate the overall GWP of each latrine
contribution of biogenic emissions to the GWP is lowest for the composting latrine at 1,135
% of the overall GWP. This is due to the strictly aerobic biochemical
taking place within the composting latrine which produces only carbon dioxide. The
of biogenic emissions, maintenance and construction to the overall GWP of each
ed in Figure 15. An 80% BOD removal efficiency was assumed for each
of the systems; however, one study done on thermophilic composting of swine wasting
measured only a 30% reduction of the total organic carbon due to thermophilic composting of
Using a 30% BOD removal efficiency, the biogenic CO
the composting latrine would be 426 kgCO2 eq compared to 1,135 kgCO2 eq with an 80%
of materials and biogenic emissions to global warming potential for
Assuming complete anaerobic degradation
Assuming 50% anaerobic, 50% aerobic degradation
Assuming biogas is not captured, and is instead released directly to air
Assuming all biogas is captured and combusted
Use phase
(maintenanc
e)Construction
Direct carbon
dioxide
In general, the biogenic emissions dominate the overall GWP of each latrine. The
contribution of biogenic emissions to the GWP is lowest for the composting latrine at 1,135
biochemical process
The
to the overall GWP of each
An 80% BOD removal efficiency was assumed for each
of the systems; however, one study done on thermophilic composting of swine wasting
measured only a 30% reduction of the total organic carbon due to thermophilic composting of
Using a 30% BOD removal efficiency, the biogenic CO2 emissions of
eq with an 80%
warming potential for
Use phase
(maintenanc
Construction
Direct carbon

51
4.3 CED and GWP of Household and Community-Level Sanitation Systems
The CED and GWP of two community wastewater treatment systems in rural Bolivia
were studied by Cornejo et al. (2013). The community system of Sapecho serves a sewered
community of 1,039 people (206 households) and includes a grit chamber, upflow anaerobic
sludge blanket (UASB) reactor and two maturation lagoons. The community system of San
Antonio serves a sewered community of 420 people (150 households) and includes a three-
pond system (one facultative and two maturation lagoons). Both systems are currently operated
without resource recovery, but the calculations made by Cornejo et al. (2013) are based on
potential use phases implementing resource recovery. In the case the community system of
Sapecho, resource recovery is associated with the recovery of biogas produced by the UASB
reactor and reuse of the system’s effluent for irrigation. For the community system of San
Antonio resource recovery is only associated with reuse of the system’s effluent for irrigation.
The results from this study on community systems in terms of CED are provided in Figure 16
along with the results for household systems discussed in the previous section that are
presented for comparison.
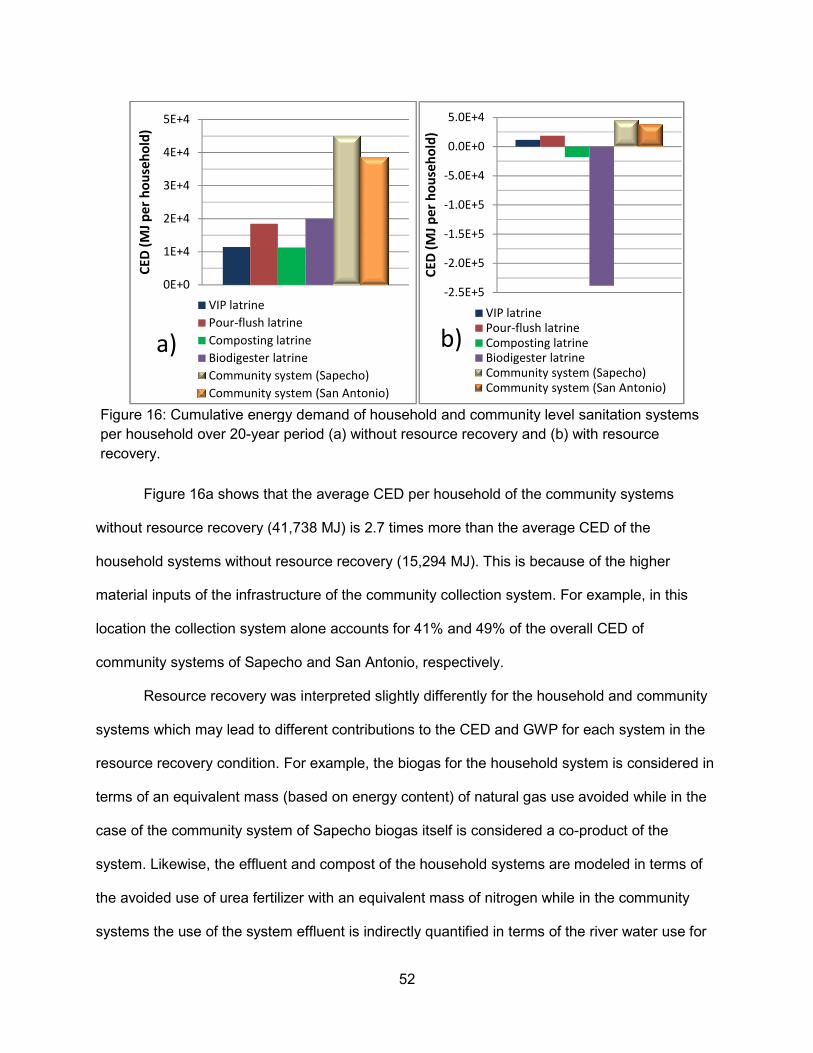
Figure 16a shows that the
without resource recovery (41,738 MJ
household systems without resource recovery (15,294 MJ
material inputs of the infrastructure of the community
location the collection system alone
community systems of Sapecho
Resource recovery was interpreted slightly
systems which may lead to different contributions to the CED and GWP for each system in the
resource recovery condition. For example,
terms of an equivalent mass (based on energy content) of natural gas use avoided while in the
case of the community system of
system. Likewise, the effluent and compost
the avoided use of urea fertilizer
systems the use of the system effluent is indirectly quantified in terms of t
Figure 16: Cumulative energy demand of household and community level sanitation systems
per household over 20-year period (a)
recovery.
0E+0
1E+4
2E+4
3E+4
4E+4
5E+4
CE
D (
MJ
pe
r h
ou
seh
old
)
VIP latrine
Pour-flush latrine
Composting latrine
Biodigester latrine
Community system (Sapecho)
Community system (San Antonio)
a)
52
he average CED per household of the community systems
resource recovery (41,738 MJ) is 2.7 times more than the average CED of the
resource recovery (15,294 MJ). This is because of the
infrastructure of the community collection system. For example, in this
he collection system alone accounts for 41% and 49% of the overall CED of
and San Antonio, respectively.
interpreted slightly differently for the household and community
different contributions to the CED and GWP for each system in the
For example, the biogas for the household system is
terms of an equivalent mass (based on energy content) of natural gas use avoided while in the
of Sapecho biogas itself is considered a co-product of the
system. Likewise, the effluent and compost of the household systems are modeled in terms of
fertilizer with an equivalent mass of nitrogen while in the community
effluent is indirectly quantified in terms of the river water use for
: Cumulative energy demand of household and community level sanitation systems
year period (a) without resource recovery and (b) with resource
Composting latrine
Biodigester latrine
Community system (Sapecho)
Community system (San Antonio)
-2.5E+5
-2.0E+5
-1.5E+5
-1.0E+5
-5.0E+4
0.0E+0
5.0E+4
CE
D (
MJ
pe
r h
ou
seh
old
)
VIP latrine
Pour-flush latrine
Composting latrine
Biodigester latrine
Community system (Sapecho)
Community system (San Antonio)
b)
CED per household of the community systems
average CED of the
the higher
For example, in this
CED of
for the household and community
different contributions to the CED and GWP for each system in the
usehold system is considered in
terms of an equivalent mass (based on energy content) of natural gas use avoided while in the
product of the
of the household systems are modeled in terms of
nitrogen while in the community
he river water use for
: Cumulative energy demand of household and community level sanitation systems
out resource recovery and (b) with resource
Community system (Sapecho)
Community system (San Antonio)

irrigation avoided and crop yield increases
fertilizer is not commonly used in agriculture in the Bolivian study site.
resource recovery potential for the use of the effluent in the community
underestimated compared to the resource recovery potential of the use of the compost and
household biodigester effluent. Figure 1
systems with resource recovery are 44,869 MJ for Sapecho and
Figure 17 provides the global warming potential of household and community level
sanitation systems per household over 20
Similar to the case of household latrines,
biogenic emissions that are the main contributors to the overall
Biogenic emissions account for 67% of the overall
resource recovery and 53% of the overall GWP of
Figure 17: Global warming potential of household and community level sanitation systems
household over 20-year period (a)
0E+0
1E+4
2E+4
3E+4
4E+4
5E+4
GW
P (
kg
CO
2 e
q p
er
ho
use
ho
ld)
VIP Latrine (100% anaerobic)
VIP latrine (50% anaerobic)
Pour-flush latrine (100% anaerobic)
Pour-flush latrine (50% anaerobic)
Composting latrine
Biodigester latrine
Biodigester latrine (w/ flaring)
Community system (Sapecho)
Community system (San Antonio)
53
and crop yield increases. This was done because commercial nitrogen
fertilizer is not commonly used in agriculture in the Bolivian study site. It is thus
resource recovery potential for the use of the effluent in the community systems is
underestimated compared to the resource recovery potential of the use of the compost and
Figure 16b shows that the CED per household of the community
systems with resource recovery are 44,869 MJ for Sapecho and 38,403 MJ for San Antonio.
provides the global warming potential of household and community level
sanitation systems per household over 20-years.
Similar to the case of household latrines, the results in Figure 17 are influenced by
are the main contributors to the overall GWP of the community systems.
Biogenic emissions account for 67% of the overall GWP of the Sapecho system
resource recovery and 53% of the overall GWP of San Antonio system. Impleme
lobal warming potential of household and community level sanitation systems
year period (a) without resource recovery and (b) with resource recovery
VIP Latrine (100% anaerobic)
VIP latrine (50% anaerobic)
flush latrine (100% anaerobic)
flush latrine (50% anaerobic)
Biodigester latrine (w/ flaring)
Community system (Sapecho)
Community system (San Antonio)
a)
0.00E+0
2.50E+3
5.00E+3
7.50E+3
1.00E+4
1.25E+4
1.50E+4
1.75E+4
GW
P (
kg
CO
2 e
q p
er
ho
use
ho
ld)
VIP latrine (100% anaerobic)
VIP latrine (50% anaerobic)
Pour-flush latrine (100% anaerobic)
Pour-flush latrine (50% anaerobic)
Composting latrine
Biodigester latrine
Community system (Sapecho)
Community system (San Antonio)
This was done because commercial nitrogen
likely that the
systems is
underestimated compared to the resource recovery potential of the use of the compost and
of the community
for San Antonio.
provides the global warming potential of household and community level
are influenced by
GWP of the community systems.
WP of the Sapecho system without
Implementation of
lobal warming potential of household and community level sanitation systems per
and (b) with resource recovery.
VIP latrine (100% anaerobic)
VIP latrine (50% anaerobic)
flush latrine (100% anaerobic)
flush latrine (50% anaerobic)
Community system (Sapecho)
Community system (San Antonio)
b)
54
combined resource recovery in the Sapecho system (recovery of biogas and irrigation with
system effluent) was estimated to reduce the overall GWP from 4,930 kgCO2 eq to 2,092 kgCO2
eq, or 58.4%. In the case of the San Antonio system, implementation of resource recovery
(irrigation with system effluent) was estimated to reduce the overall GWP from 2,022 kgCO2 eq
to 2,019 kgCO2 eq., or 0.1%. The community systems have a lower GWP per household than
the conventional household latrines that do not recover resources, i.e., VIP and pour-flush
latrine, but have a slightly higher GWP than household systems that incorporate resource
recovery. Similarly, a study by Fuchs and Mihelcic (2011) in the same study site in Bolivia as
Cornejo et al. (2013) determined that decentralized or semi-decentralized sanitation systems,
such as condominial sewer systems, most closely satisfied the appropriate technology
characteristics measured.
The BOD input was calculated slightly differently for the household and community
systems. As mentioned in section 3.4.3 (Biochemical Oxygen Demand Input), the BOD input
value for the household systems is based on the value of BOD production rate per capita of 80
g BOD/person-day typically used in the wastewater design literature (Metcalf and Eddy, 2003).
For the community treatment systems, the BOD input was based on actual field measurements
of the influent wastewater. These values, when converted to a BOD production rate per capita
result in a value of only 16 g BOD/person-day for the Sapecho system and 27 g/person-day for
the San Antonio system. These values are 3-5 times lower than the literature value for
conventional wastewater treatment design likely due to the fact that the wastewater does not
include food waste and that it is a largely agricultural area where people may not have access to
residential bathrooms during the work day. This leads to subsequently lower values for the
biogenic emissions and biogas production for the community systems compared to the
household systems.
55
4.4 Sensitivity Analysis
Sensitivity factors (SFs) for the privacy structure results are provided in Table 16 and for
the use phase and resource recovery results in Table 17. Larger sensitivity factors indicate
greater sensitivity in the results to changes in input values and vice versa.
For both the privacy structure and use phase results, the most sensitive items in terms of
embodied energy include: brick, transport, cement, and the PVC geomembrane, in the case of
the biodigester latrine. Their high contribution of these input parameters to the total embodied
energy (27-95%) may be the reason they are more sensitive. Individual contributions to CED
are provided in Appendix B. Future studies can refine these input values to improve the
accuracy of the model.
When considering only the privacy structure results, the most sensitive items in terms of
carbon footprint are similar to those of embodied energy: brick, transport, and cement, which
account for between 42-96% of the total GWP. However, when considering the use phase, the
most sensitive items are the biogenic emissions of methane and carbon dioxide, which account
for between 50-97% of the GWP, followed by brick, transport, and cement. Future research
refining the calculation in terms of the actual biogenic emissions associated with each system,
and to a lesser extent material inputs, would improve the accuracy of the model.
It is possible that in the study site the biogas, when used for cooking, would actually
replace propane rather than natural gas. The energy ladder that is commonly used to explain
how households advance to cleaner and more expensive forms of energy from solid fuels
considers propane and natural gas usage at a similar level of development (Smith et al., 1994).
However, if one considers the resource recovery potential of the biogas as propane use avoided
rather than natural gas use avoided affects the results for CED and GWP. The overall CED for
the biodigester latrine using propane use avoided for the biogas is 8.8% higher (- 212,700 MJ)
than in terms of natural gas use avoided (- 233,200 MJ). The GWP for the biodigester latrine is

56
7.7% lower with the biogas considered in terms of propane use avoided (1,740 kgCO2 eq) than
when considered as natural gas use avoided (1,880 kgCO2 eq).

57
Table 16: Sensitivity factors for privacy shelter (construction phase) results.
Variation of latrine type
and privacy shelter
Input SF of
CED
SF of
GWP
VIP latrine adobe fiber
cement
Brick 0.703 0.673
Transport 0.131 0.085
Cement 0.070 0.174
Fiber cement 0.048 0.040
PVC pipe 0.013 0.010
VIP latrine adobe fiber
cement (unlined pit)
Fiber cement 0.352 0.337
Transport 0.174 0.128
PVC pipe 0.122 0.085
Cement 0.108 0.299
Plywood 0.069 0.017
VIP latrine brick corrugated
metal
Brick 0.738 0.690
Transport 0.137 0.088
Cement 0.076 0.183
Corrugated metal 0.026 0.026
PVC pipe 0.008 0.004
Pour-flush latrine adobe fiber
cement
Brick 0.294 0.283
Transport 0.277 0.182
Cement 0.148 0.365
Sanitary ceramics 0.142 0.089
PVC pipe 0.039 0.021
Pour-flush latrine brick
corrugated metal
Brick 0.442 0.420
Transport 0.226 0.147
Cement 0.128 0.314
Sanitary ceramics 0.100 0.061
PVC pipe 0.027 0.015
Composting latrine adobe
fiber cement
Brick 0.306 0.307
Transport 0.220 0.151
Cement 0.129 0.333
Sanitary ceramics 0.120 0.078
PVC pipe 0.057 0.032
Composting latrine brick
corrugated metal
Brick 0.441 0.432
Transport 0.195 0.130
Cement 0.114 0.286
Sanitary ceramics 0.087 0.055
PVC pipe 0.041 0.023
Biodigester latrine adobe
fiber cement
Transport 0.204 0.157
Geomembrane PVC 0.186 0.082
Cement 0.144 0.417
Sanitary ceramics 0.136 0.099
Brick 0.120 0.135
Biodigester latrine brick
corrugated metal
Brick 0.309 0.328
Transport 0.182 0.132
Geomembrane PVC 0.130 0.054
Cement 0.125 0.340
Sanitary ceramics 0.095 0.065

58
Table 17: Sensitivity factors for construction and use phase results.
Latrine type and use
phase
Input SF of
CED
SF of
GWP
VIP latrine adobe fiber
cement (100% anaerobic)
Biogenic CH4 - 0.841
Biogenic CO2 - 0.093
Brick 0.704 0.045
Transport 0.132 0.006
Cement 0.071 0.012
VIP latrine adobe fiber
cement (50% anaerobic,
50% aerobic)
Biogenic CH4 - 0.841
Biogenic CO2 - 0.093
Brick 0.704 0.045
Transport 0.132 0.006
Cement 0.071 0.012
Pour-flush latrine adobe fiber
cement (100% anaerobic)
Biogenic CH4 - 0.803
Biogenic CO2 - 0.088
Brick 0.439 0.043
Transport 0.175 0.012
Cement 0.158 0.040
Pour-flush latrine adobe fiber
cement (50% anaerobic,
50% aerobic)
Biogenic CH4 - 0.688
Biogenic CO2 - 0.137
Brick 0.451 0.073
Transport 0.179 0.020
Cement 0.163 0.057
Composting latrine adobe
fiber cement without
resource recovery
Biogenic CO2 - 0.546
Brick 0.306 0.139
Transport 0.220 0.069
Cement 0.129 0.151
Sanitary ceramics 0.120 0.035
Biodigester latrine adobe
fiber cement without
resource recovery
Biogenic CH4 - 0.885
Biogenic CO2 - 0.090
Geomembrane PVC 0.387 0.005
Transport 0.118 0.003
Cement 0.105 0.009
Biodigester latrine adobe
fiber cement without
resource recovery with
flaring
Biogenic CO2 - 0.880
Geomembrane PVC 0.387 0.024
Transport 0.169 0.018
Cement 0.105 0.042
Sanitary ceramics 0.099 0.010
59
CHAPTER 5: CONCLUSIONS AND RECOMMENDATIONS FOR FUTURE RESEARCH
The original hypothesis proposed in this thesis that sanitation systems that incorporate
resource recovery will have higher CED than systems that do not recover resources due to
additional material requirements during installation and maintenance, but will have lower GWP
over their service life than those that do not. The first point of this hypothesis implies that
additional material inputs are required to allow for resource recovery. Based on the results of
this study, this is not correct. When only the construction phase is considered there is no
correlation between the CED values of sanitation systems that incorporate resource recovery
and those that do not. The VIP latrine had the lowest CED (5,724 MJ), followed by the
composting latrine (11,275 MJ), the pour-flush latrine (13,667 MJ), and the biodigester latrine
(14,628 MJ). However, when the use phase is considered the energy recovered through
resource recovery more than offsets the energy required for construction and maintenance of
both the composting and biodigester latrine. The composting latrine requires 11,275 MJ for
construction and maintenance and recovers 29,933 MJ through use of the compost as a
fertilizer substitute. The biodigester latrine requires 19,990 MJ for construction and maintenance
and recovers 253,190 MJ through use of the effluent as a fertilizer substitute and the biogas as
a substitute for natural gas for cooking. Therefore, both the composting and biodigester latrine
are net energy producers over a 20-year period. Although they are not carbon neutral, their
GWP of the systems incorporating resource recovery is considerably lower than the GWP of
systems that do not. For example, the composting latrine has a GWP of 616 kgCO2 eq and the
biodigester latrine has a GWP of 1,882 kgCO2 eq compared to 15,146 kgCO2 eq and 15,789
kgCO2 eq for the VIP latrine and pour-flush latrine, respectively.
60
The second hypothesis proposed in this thesis was that community systems that
incorporate a collection system have a higher CED than household systems due to the material
input requirements associated with the infrastructure of the system. Based on the results of this
study this hypothesis is true. The CED values of the community systems of Sapecho (44,869
MJ per household) and San Antonio (38,403 MJ per household) with resource recovery were
higher than the CED of any household sanitation systems with or without resource recovery
(which ranged between 11,275 and 19,990 MJ). This result is because of the contribution of the
collection system to the (which accounts for an average of 18,600 MJ per household) to the
overall CED of the community systems. Interestingly, the GWP of community systems (2,019-
2,092 kgCO2 eq) is less than the GWP of household systems that do not incorporate resource
recovery (8,642-15,789 kgCO2 eq) and slightly more than household systems that recover
resources (616-1,882 kgCO2 eq).
As expected, the use of local materials in the construction of the privacy structure
improves the environmental sustainability of the systems. Adobe brick is prepared manually at
the construction site and dried in the sun while brick that is produced off-site in an industrial
process has large energy input requirements. Design variations and material use have a large
impact on the results in terms of CED. The main contributor to the GWP over the lifetime of
these systems is the biogenic emissions, specifically for those that produce methane.
There is little data available about the actual biochemical processes taking place with the
pit of a VIP or pour-flush latrine. Recent research suggests a combination of aerobic and
anaerobic decomposition takes place within the pit; however, future research could more
precisely determine the ratio of these processes occurring in the pit to allow for more accurate
calculation of the associated biogenic emissions over the life of the latrine.
In addition, the service life of the Taiwanese tubular biodigester in the field can vary
depending on maintenance and protection of the geomembrane from mechanical failure.
Improperly operated or maintained biodigesters can produce significantly higher greenhouse

61
gas emissions due to biogas leaks. Future studies can more precisely determine this
technology’s service life and when applied in rural areas of developing countries and allow for
more accurate description its potential to mitigate the effects of climate change.
62
REFERENCES American Society of Agricultural Engineers (ASAE). (2005). Manure Production and
Characteristics. St. Joseph, MI. Bhagwan, J., Still, D., Buckley, C., and Foxon, K. (2008). Challenges with up-scaling dry
sanitation technologies. Water Science and Technology, 58 (1), 21-27.
Buckley, C., Foxon, K., Brouckaert, C., Rodda, N., Nwaneri, C., Balboni, E., Couderc, A., and
Magagna, D. (2008). Scientific Support for the Design and Operation of Ventilated
Improved Pit Latrines (VIPs) and the Efficacy of Pit Latrine Additives. South Africa:
Water Research Commission.
Botero Botero, R. and Preston, T. (1987). Biodigestor de bajo costo para la produccion de
biogas y fertilizante a partir de excretas. Retrieved January 28, 2013, from: http://www.produccion-animal.com.ar/Biodigestores/04-biodigestores.pdf.
Buysman, E. (2009). Anaerobic Digestion for Developing Countries with Cold Climates -
Utilizing solar heat to address technical challenges and facilitating dissemination through the use of carbon finance. Master’s Thesis. University of Wagenigen. Retrieved April 23, 2012, from https://wecf.eu/.
Cairncross, S. and Feachem, R. (1993). Environmental Health Engineering in the Tropics: An
Introductory Text. Second Edition, Wiley and Sons, Chichester. Centers for Disease Control and Prevention (CDC). (2012). Global Water Sanitation and
Hygiene 1600 Clifton Rd. Atlanta, GA 30333, USA. Retrieved January, 2013 fromhttp://www.cdc.gov.healthywater/global/index.html.
Chen, Y., Yang, G., Sweeney, S., and Feng, Y. (2010). Household biogas use in rural China: A
study of opportunities and constraints. Renewable and Sustainable Energy Reviews, 14 (1), 545-549.
City of Tampa. (2012). Advanced Wastewater Treatment Plant. Retrieved January 16, 2013
from http://www.tampagov.net/dept_wastewater/. Clasen, T. F. and Bastable, A. (2003). Faecal contamination of drinking water during collection
and household storage: the need to extend protection to the point of use. Journal of Water and Health, 1 (3), 109-115.
Clasen, T., Schmidt, W., Rabie, T., Roberts, I., and Cairncross, S. (2007). Interventions to
improve water quality for preventing diarrhoea: systematic review and meta-analysis. BMJ. Retrieved January 22, 2013, from: http://www.bmj.com/content/334/7597/782.
63
Cornejo, P., Zhang, Q., and Mihelcic, J.R. (2013). Embodied Energy and Carbon Footprint of Wastewater Treatment and Resource Recovery Strategies in a Developing World Setting. Unpublished.
Côté, C., Massé, I., and Quessy, S. (2006). Reduction of indicator and pathogenic
microorganisms by psychrophilic anaerobic digestion in swine slurries. Bioresource Technology, 97 (4), 686-691.
EPA. (2006a). Life Cycle Assessment: Principles and Practice. EPA 600-R-06-060. Cincinnati. EPA. (2006b). Wastewater Management Fact Sheet-heat Drying. EPA 832-F-06-024. Retrieved
January 25, 2013 from: http://water.epa.gov/scitech/wastetech/upload/2006_10_16_mtb_heat-drying.pdf.
EPA. (2010). Greenhouse Gas Emissions Estimation Methodologies for Biogenic Emissions
from Selected Source Categories. Draft. Washington, D.C.
Esrey, S. (2000). Towards a recycling society: ecological sanitation - closing the loop to food
security. UNICEF Ecological Sanitation Symposium. New York, NY. FAO. (2005). Fertilizer use by crop in Ghana. Retrieved January 29, 2013, from:
http://www.fao.org/docrep/008/a0013e/a0013e08.htm FAO. (2011). The State of Food Insecurity in the World 2011.1-50. Rome. Fry, L.M., Cowden, J.R., Watkins, D.W., Clasen, T., and Mihelcic, J.R. (2010). Quantifying
Health Improvements from Water Quantity Enhancement: An Engineering Perspective Applied to Rainwater Harvesting in West Africa. Environmental Science & Technology, 44 (24), 9535–9541.
Fuchs, V.J. and Mihelcic, J.R. (2011). Analyzing appropriateness in sanitation projects in the
Alto Beni region of Bolivia, Waterlines, 30 (2), 122-134. GTZ. (1999). Biogas Digest volume 1 Biogas Basics.1-45. GTZ. (1999). Biogas Digest Volume II Biogas - Application and Product Development. Guest, J.S., Skerlos S.J., Barnard J.L., Beck M.B., Daigger G.T., Hilger H., Jackson S.J.,
Karvazy K., Kelly L., Macpherson L., Mihelcic J.R., Pramanik A., Raskin L., van Loosdrecht M.C.M., Yeh D.H., and Love N.G. (2009). A New Planning and Design Paradigm to Achieve Sustainable Resource Recovery from Wastewater. Environmental Science & Technology, 43 (16), 6126–6130.
Gunnerson, C.G. and Stuckey, D.C. (1986). Anaerobic Digestion- Principles and Practices for
Biogas systems. Washington DC, World Bank & UNDP: 178. Heinonen-Tanski, H. and van Wijk-Sijbesma, C. (2005). Human excreta for plant production.
Bioresource Technology, 96 (4), 403-411.

64
Held, R.B., Zhang, Q., and Mihelcic, J.R. (2012). Quantification of human and embodied energy of improved water provided by source and household interventions. Journal of Cleaner Production, doi:10.1016/j.jclepro.2012.01.018.
Hurtado, D. (2005). Compost Latrines in Rural Panama: Design, Construction and Evaluation of
Pathogen Removal. Michigan Technological University, Houghton, MI. Retrieved January 17, 2013, from: http://usfmi.weebly.com/thesesreports.html.
Intergovernmental Panel on Climate Change. (2007). Fourth Assessment Report: Climate
Change. Cambridge University Press. Cambridge. James, K., Campbell, S., and Godlobe, C. (2002). Watergy: Taking Advantage of Untapped
Energy and Water Efficiency Opportunities in Municipal Water Systems. Alliance to Save Energy. Washington D.C.
Jensen, P. K., Phuc, P. D., Dalsgaard, A., and Konradsen, F. (2013). Successful sanitation
promotion must recognize the use of latrine wastes in agriculture — the example of Viet Nam. Bulletin of the World Health Organization. Retrieved January 16, 2013, from: http://www.scielosp.org/.
Jönsson, H., Stingzing, A. R., Vinneras, B., and Salomon, E. (2004). Guidelines on the Use of
Urine and Faeces in Crop Production Report 2004-2. Retrieved January 29, 2013, from: http://www.ecosanres.org/pdf_files/ESR_Publications_2004/ESR2web.pdf
Kaiser, J. (2006). An Analysis of the Use of Desiccant as a Method of Pathogen Removal in
Compost Latrines in Rural Panama. Master’s Report, Michigan Technological University, Houghton, MI. Retrieved January 17, 2013, from: http://usfmi.weebly.com/thesesreports.html.
Karlsson, J., and Larsson, M. (2000). Composting of latrine products in Addis Ababa, Ethiopia.
Lulea University of Technology. Retrieved January 16, 2013, from: http://epubl.ltu.se/1402-1617/2000/032/index-en.html.
Kosek, M., Bern, C., and Guerrant, R. L. (2003). The global burden ofdiarrhoeal disease, as
estimated from studies published between 1992 and 2000. WHO 81, 197–204. Kumar, R., Gupta, M.K., and Kanwar, S.S. (1999). Fate of bacterial pathogens in cattle dung
slurry subjected to anaerobic digestion. World Journal of Microbiology and Biotechnology, 15 (3), 335-338.
Lansing, S., Botero Botero, R., and Martin, J. (2008). Waste treatment and biogas quality in
small-scale agricultural digesters. Bioresource Technology, 99 (13), 5881-5890. Lind, B.B., Ban, Z., and Bydén, S. (2001). Volume reduction and concentration of nutrients in
human urine. Ecological Engineering, 16 (4), 561-566. Massé, D., Croteau, F., and Masse, L. (2007). The fate of crop nutrients during digestion of
swine manure in psychrophilic anaerobic sequencing batch reactors. Bioresource
Technology, 98 (15), 2819–2823.

65
Massé, D., Gilbert, Y., and Topp, E. (2011). Pathogen removal in farm-scale psychrophilic
anaerobic digesters processing swine manure. Bioresource Technology, 102 (2), 641–
646.
Metcalf and Eddy. (2003). Wastewater Engineering, Treatment and Reuse.Tata McGraw-Hill.
New Delhi.
McGraw Hill. (1982). Encyclopeda of Science and Technology. McGraw Hill, Inc. New York, NY. Mehl, J., Kaiser, J., Hurtado, D., Gibson, D., Izurieta, R., and Mihelcic, J.R. (2011). Pathogen
destruction and solids decomposition in composting latrines: study of fundamental mechanisms and user operation in rural Panama. Journal of Water and Health, 9 (1), 187-199.
Mihelcic, J.R., Myre, E.A., Fry, L.M., Phillips, L.D., and Barkdoll, B.D. (2009). Field Guide in
Environmental Engineering for Development Workers: Water, Sanitation, Indoor Air. American Society of Civil Engineers (ASCE) Press. Reston, VA.
Mihelcic, J.R., Fry, L.M., and Shaw, R. (2011). Global potential of phosphorus recovery from
human urine and feces. Chemosphere, 84 (6), 832-839. Mo, W., Zhang, Q., Mihelcic, J.R., and Hokanson, D.R. (2011). Embodied energy comparison of
surface water and groundwater supply options. Water Research, 45 (17), 5577-5586. Mo, W. and Zhang, Q. (2012). Can municipal wastewater treatment systems be carbon neutral?
Journal of Environmental Management, 112 (15), 360-367. Monroy, O., Fama, G., Meraz, M., Montoya, L., and Macarie, H. (2000). Anaerobic digestion for
wastewater treatment in Mexico: state of the technology. Water Resources, 34 (6), 1803-1816.
Morgan, P. (2007). Toilets That Make Compost: Low-cost, sanitary toilets that produce valuable
compost for crops in an African context. Retrieved January 15, 2013, from: books.google.com.
Muga, H. E. and Mihelcic, J. R.. (2008). Sustainability of wastewater treatment technologies.
Journal of Environmental Management, 88 (3), 437-447. Municipality of Santo Domingo. (2008). Plan de Desarollo Concertado 2008-2011.Piura:
RAISAPP E.I.R.L. Nath K.J., Bloomfield S.F., and Jones, M. (2006). Household water storage, handling and point-
of-use treatment. A review commissioned by IFH. Retrieved January 20, 2013, from: http://www.ifh-homehygiene.org.
Ocwieja, S. (2010). Life Cycle Thinking Assessment Applied to Three Biogas Projects in Central
Uganda. Michigan Technological University. Retrieved January 20, 2013, from: http://usfmi.weebly.com/thesesreports.html.
66
Rittmann, B. and McCarty, P. (2001). Environmental Biotechnology: Principles and Applications.
McGraw-Hill. New York.
Richard T. and Trautmann N. (1996). C/N Ratio. The Cornell Composting Website. Retrieved
January 17, 2008, from: http://compost.css.cornell.edu/calc/cn_ratio.html. Rowse, L. (2011). Design of Small Scale Anaerobic Digesters for Application in Rural
Developing Countries. Master's Thesis. University of South Florida. Retrieved January 16, 2013, from: http://usfmi.weebly.com/thesesreports.html.
Sahlström, L. (2003). A review of survival of pathogenic bacteria in organic waste used in
biogas plants. Bioresource Technology, 87 (2), 161-166. Shaw, R. (2010). The use of human urine as a crop fertilizer in Mali, West Africa. Michigan
Technological University. Retrieved online January 20, 2013, from:
http://usfmi.weebly.com/thesesreports.html.
Smith, K., Apte, M., Yuqing, M., Wongsekiarttirat, W., and Kulkarni, A. (1994). Air pollution and
the energy ladder in asian cities. Energy, 19 (5), 587-600.
Sobsey, M. D., Handzel, T., and Venczel, L. (2003). Chlorination and safe storage of household drinking water in developing countries to reduce waterborne disease. Water Science and Technology, 47 (3), 221-228.
United Nations. (2006). UN Statistical Division. Progress towards the Millennium Development
Goals, 1990-2000. The United Nations, New York. United States Department of Agriculture. (2008). Agricultural Waste Management Field
Handbook. Washington D.C. Verbyla, M., Oakley, S., and Mihelcic, J.R. (2013). Wastewater infrastructure for small cities in
an urbanizing world: Integrating the protection of human health and the environment with
resource recovery and food security. Environmental Science and Technology, In press.
http://dx.doi.org/10.1021/es3050955.
Vinneras, B., Bjorklund, A., and Jonsson, H. (2003). Thermal composting of faecal matter as
treatment and possible disinfection method--laboratory-scale and pilot-scale studies. Bioresource Technology, 88 (1), 47-54.
Walekhwa, P., Mugisha, J., and Drake, L. (2009). Biogas energy from family-sized digesters in
Uganda: Critical factors and policy implications. Energy Policy, 37 (7), 2754-2762. WHO/UNICEF. (2012). Progress on Sanitation and Drinking-Water: 2012 Update. Emerson,
Wajdowicz Studios. New York. World Health Organization. (1996). Fact Sheets on Environmental Sanitation. Retrieved January
28, 2013, from: http://helid.digicollection.org/en/. World Health Organization. (2009).The World Health Report 2004. Geneva.

67
World Health Organization. (2008). Water, Sanitation, and Health. Retrieved January 8, 2013, from: http://www.who.int/water_sanitation_health/en/.
World Bank. (2013). World Development Indicators. Retrieved January, 2013, from:
http://data.worldbank.org/. Wang, X., Di, C., Hu, X., Wu, W., Jiang, X., and Jiang, S. (2007). The influence of using biogas
digesters on family energy consumption and its economic benefit in rural areas—comparative study between Lianshui and Guichi in China. Renewable and Sustainable Energy Reviews, 11 (5), 1018-1024.
Yu, L., Yaoqiu, K., Ningsheng, H., Zhifeng, W., and Lianzhong, X. (2008). Popularizing
household-scale biogas digesters for rural sustainable energy development and greenhouse gas mitigation. Renewable Energy, 33 (9), 2027-2035.
Zhu, N. (2007). Effect of low initial C/N ratio on aerobic composting of swine manure with rice
straw. Bioresource Technology, 98 (1), 9-13. Zimmerman, J.B., Mihelcic, J.R., Smith, J. (2008). Global Stressors on Water Quality and
Quantity. Environmental Science & Technology, 42 (12), 4247-4254.

68
APPENDICES
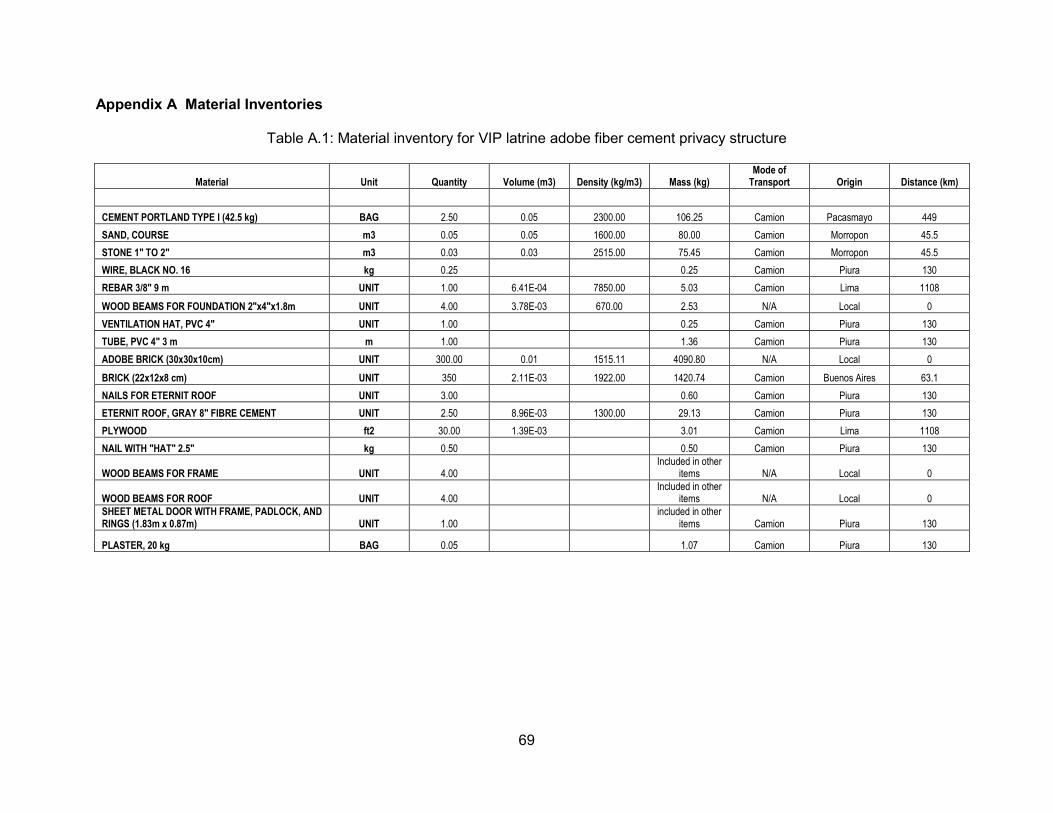
69
Appendix A Material Inventories
Table A.1: Material inventory for VIP latrine adobe fiber cement privacy structure
Material Unit Quantity Volume (m3) Density (kg/m3) Mass (kg) Mode of Transport Origin Distance (km)
CEMENT PORTLAND TYPE I (42.5 kg) BAG 2.50 0.05 2300.00 106.25 Camion Pacasmayo 449
SAND, COURSE m3 0.05 0.05 1600.00 80.00 Camion Morropon 45.5
STONE 1" TO 2" m3 0.03 0.03 2515.00 75.45 Camion Morropon 45.5
WIRE, BLACK NO. 16 kg 0.25
0.25 Camion Piura 130
REBAR 3/8" 9 m UNIT 1.00 6.41E-04 7850.00 5.03 Camion Lima 1108
WOOD BEAMS FOR FOUNDATION 2"x4"x1.8m UNIT 4.00 3.78E-03 670.00 2.53 N/A Local 0
VENTILATION HAT, PVC 4" UNIT 1.00
0.25 Camion Piura 130
TUBE, PVC 4" 3 m m 1.00
1.36 Camion Piura 130
ADOBE BRICK (30x30x10cm) UNIT 300.00 0.01 1515.11 4090.80 N/A Local 0
BRICK (22x12x8 cm) UNIT 350 2.11E-03 1922.00 1420.74 Camion Buenos Aires 63.1
NAILS FOR ETERNIT ROOF UNIT 3.00
0.60 Camion Piura 130
ETERNIT ROOF, GRAY 8" FIBRE CEMENT UNIT 2.50 8.96E-03 1300.00 29.13 Camion Piura 130
PLYWOOD ft2 30.00 1.39E-03
3.01 Camion Lima 1108
NAIL WITH "HAT" 2.5" kg 0.50
0.50 Camion Piura 130
WOOD BEAMS FOR FRAME UNIT 4.00
Included in other items N/A Local 0
WOOD BEAMS FOR ROOF UNIT 4.00
Included in other items N/A Local 0
SHEET METAL DOOR WITH FRAME, PADLOCK, AND RINGS (1.83m x 0.87m) UNIT 1.00
included in other items Camion Piura 130
PLASTER, 20 kg BAG 0.05
1.07 Camion Piura 130

70
Appendix A (Continued)
Table A.2: Material inventory for VIP latrine brick corrugated metal privacy structure
Material Unit Quantity Volume (m3) Density (kg/m3) Mass (kg) Mode of Transport Origin Distance (km)
CEMENT PORTLAND TYPE I (42.5 kg) BAG 5.50 0.10 2300.00 233.75 Camion Pacasmayo 449
SAND, COURSE m3 0.05 0.05 1600.00 80.00 Camion Morropon 45.5
STONE 1" TO 2" m3 0.03 0.03 2515.00 75.45 Camion Morropon 45.5
WIRE, BLACK NO. 16 kg 0.25
0.25 Camion Piura 130
REBAR 3/8" 9 m UNIT 1.00 6.41E-04 7850.00 5.03 Camion Lima 1108
WOOD BEAMS FOR FOUNDATION 2"x4"x1.8m UNIT 4.00 3.78E-03 670.00 2.53 N/A Local 0
VENTILATION HAT, PVC 4" UNIT 1.00
0.25 Camion Piura 130
TUBE, PVC 4" 3 m m 1.00
1.36 Camion Piura 130
BRICK (22x12x8 cm) UNIT 750 2.11E-03 1922.00 3044.45 Camion Buenos Aires 63.1
CORRUGATED METAL (2.4x0.8 m) UNIT 2.5
10.03 Camion Lima 1108
PLYWOOD ft2 30.00 1.39E-03
- Camion Lima 1108
NAIL WITH "HAT" 2.5" kg 0.50
0.50 Camion Piura 130
WOOD BEAMS FOR FRAME UNIT 4.00
included in other items N/A Local 0
WOOD BEAMS FOR ROOF UNIT 4.00
included in other items N/A Local 0
SHEET METAL DOOR WITH FRAME, PADLOCK, AND RINGS (1.83m x 0.87m) UNIT 1.00
included in other items Camion Piura 130
PLASTER, 20 kg BAG 0.05
1.07 Camion Piura 130
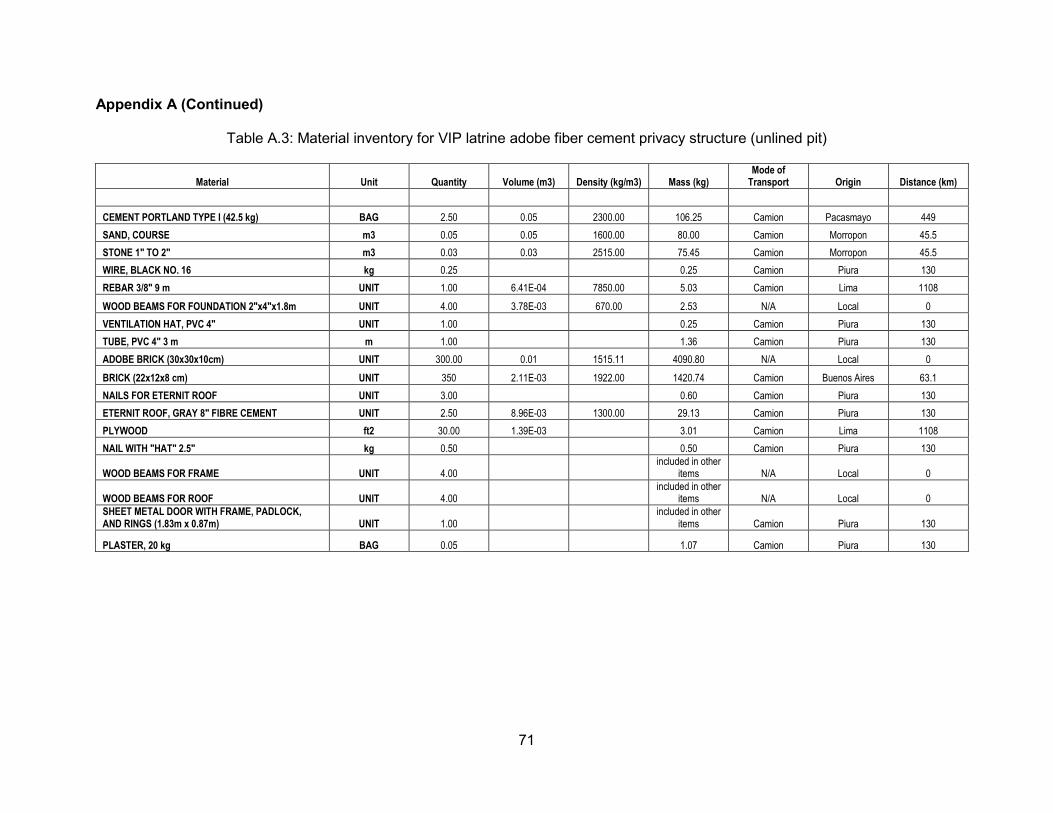
71
Appendix A (Continued)
Table A.3: Material inventory for VIP latrine adobe fiber cement privacy structure (unlined pit)
Material Unit Quantity Volume (m3) Density (kg/m3) Mass (kg) Mode of Transport Origin Distance (km)
CEMENT PORTLAND TYPE I (42.5 kg) BAG 2.50 0.05 2300.00 106.25 Camion Pacasmayo 449
SAND, COURSE m3 0.05 0.05 1600.00 80.00 Camion Morropon 45.5
STONE 1" TO 2" m3 0.03 0.03 2515.00 75.45 Camion Morropon 45.5
WIRE, BLACK NO. 16 kg 0.25
0.25 Camion Piura 130
REBAR 3/8" 9 m UNIT 1.00 6.41E-04 7850.00 5.03 Camion Lima 1108
WOOD BEAMS FOR FOUNDATION 2"x4"x1.8m UNIT 4.00 3.78E-03 670.00 2.53 N/A Local 0
VENTILATION HAT, PVC 4" UNIT 1.00
0.25 Camion Piura 130
TUBE, PVC 4" 3 m m 1.00
1.36 Camion Piura 130
ADOBE BRICK (30x30x10cm) UNIT 300.00 0.01 1515.11 4090.80 N/A Local 0
BRICK (22x12x8 cm) UNIT 350 2.11E-03 1922.00 1420.74 Camion Buenos Aires 63.1
NAILS FOR ETERNIT ROOF UNIT 3.00
0.60 Camion Piura 130
ETERNIT ROOF, GRAY 8" FIBRE CEMENT UNIT 2.50 8.96E-03 1300.00 29.13 Camion Piura 130
PLYWOOD ft2 30.00 1.39E-03
3.01 Camion Lima 1108
NAIL WITH "HAT" 2.5" kg 0.50
0.50 Camion Piura 130
WOOD BEAMS FOR FRAME UNIT 4.00
included in other items N/A Local 0
WOOD BEAMS FOR ROOF UNIT 4.00
included in other items N/A Local 0
SHEET METAL DOOR WITH FRAME, PADLOCK, AND RINGS (1.83m x 0.87m) UNIT 1.00
included in other items Camion Piura 130
PLASTER, 20 kg BAG 0.05
1.07 Camion Piura 130

72
Appendix A (Continued)
Table A.4: Material inventory for pour-flush latrine adobe fiber cement privacy structure
Material Unit Quantity Volume (m3) Density (kg/m3) Mass (kg) Mode of Transport Origin Distance (km)
CEMENT PORTLAND TYPE I (42.5 kg) BAG 12.50 0.23 2300.00 531.25 Camion Pacasmayo 449
SAND, COURSE m3 0.78 0.78 1600.00 2855.59 Camion Morropon 45.5
SAND, FINE m3 0.74 0.74 1600.00 1190.40 Camion Morropon 45.5
STONE 1/2" TO 3/4" m3 1.73 1.73 2515.00 4888.26 Camion Morropon 45.5
MIXED AGGREGATE, SAND AND STONE m3 1.11 1.11 1922.00 included in other
item Camion Morropon 45.5
WIRE, BLACK NO. 16 kg 2.10
2.10 Camion Piura 130
WIRE, BLACK NO. 8 kg 0.32
0.32 Camion Piura 130
REBAR 3/8" 9 m UNIT 3.00 6.41E-04 7850.00 15.10 Camion Lima 1108
NAILS FOR ETERNIT ROOF UNIT 3.00
0.60 Camion Piura 130
ETERNIT ROOF, GRAY 8" FIBRE CEMENT UNIT 2.50 8.96E-03 1300.00 29.13 Camion Lima 1108
ADOBE BRICKS (30x30x10cm) UNIT 300.00 0.01 1515.11 4090.80 N/A Local 0
BRICK (22x12x8 cm) UNIT 350.00 2.11E-03 1922.00 1420.74 Camion Buenos Aires 63.1
PLYWOOD ft2 30.49 0.0014 670.00 - N/A Local 0
WOOD BEAMS 4"x4"x1.5 m UNIT 4.00 0.0155 670.00 - N/A Local 0
HINGE 3" UNIT 3.00
0.75 Camion Piura 130
DOOR KNOB UNIT 1.00
0.59 Camion Piura 130
NAILS FOR WOOD C/C 1" kg 0.10
0.10 Camion Piura 130
NAILS FOR WOOD C/C 2" kg 0.15
0.15 Camion Piura 130
NAILS FOR WOOD C/C 3" kg 0.64
0.64 Camion Piura 130
NYLON MESH, MOSQUITO m2 0.24
0.10 Camion Piura 130
TOILET, PREFABRICATED UNIT 1.00
34.11 Camion Lima 1108
SINK, PREFABRICATED UNIT 1.00
11.07 Camion Piura 130
TOILET SEAT (PLASTIC) UNIT 1.00
2.68 Camion Piura 130
PLASTER 16 kg BAG BAG 0.29
4.71 Camion Piura 130
CONCRETE BOX FOR CONTROL VALVE UNIT 1.00
20.00 Camion Piura 130
VALVE PVC 1/2" UNIT 1.00
1.10 Camion Piura 130
ADAPTOR, PVC 1/2" UNIT 3.00
0.30 Camion Piura 130

73
Appendix A (Continued)
Table A.4: (Continued) TUBE, PVC 1/2" 5m UNIT 1.00
1.24 Camion Piura 130
FAUCET, BRONZE 1/2" UNIT 1.00
0.60 Camion Piura 130
ELBOW, PVC 90 1/2" UNIT 2.00
0.20 Camion Piura 130
TEE, PVC 1/2" UNIT 1.00
0.10 Camion Piura 130
TUBE, PVC 2" m 3.08
3.20 Camion Piura 130
TUBE, PVC 4" m 7.21
3.27 Camion Piura 130
VENTILATION HAT, PVC 2" UNIT 1.00
0.10 Camion Piura 130
ELBOW, PVC 90 2" UNIT 1.00
0.10 Camion Piura 130
ELBOW, PVC 90 4" UNIT 1.00
0.10 Camion Piura 130
TEE PVC SAL 4"x2" UNIT 1.00
0.10 Camion Piura 130
Table A.5: Material inventory for pour-flush latrine brick corrugated metal privacy structure
Material Unit Quantity Volume (m3) Density (kg/m3) Mass (kg) Mode of Transport Origin Distance (km)
CEMENT PORTLAND TYPE I (42.5 kg) BAG 15.50 0.29 2300.00 658.75 Camion Pacasmayo 449
SAND, COURSE m3 0.78 0.78 1600.00 2855.59 Camion Morropon 45.5
SAND, FINE m3 0.74 0.74 1600.00 1190.40 Camion Morropon 45.5
STONE 1/2" TO 3/4" m3 1.73 1.73 2515.00 4888.26 Camion Morropon 45.5
MIXED AGGREGATE, SAND AND STONE m3 1.11 1.11 1922.00 included in other
item Camion Morropon 45.5
WIRE, BLACK NO. 16 kg 2.10
2.10 Camion Piura 130
WIRE, BLACK NO. 8 kg 0.32
0.32 Camion Piura 130
REBAR 3/8" 9 m UNIT 3.00 6.41E-04 7850.00 15.10 Camion Lima 1108
CORRUGATED METAL (2.4x0.8 m) UNIT 2.5
10.03 Camion Lima 1108
BRICK (22x12x8 cm) UNIT 750.00 2.11E-03 1922.00 3044.45 Camion Buenos Aires 63.1
PLYWOOD ft2 30.49 0.0014 670.00
N/A Local 0
WOOD BEAMS 4"x4"x1.5 m UNIT 4.00 0.0155 670.00
N/A Local 0

74
Appendix A (Continued)
Table: A.5 (Continued)
HINGE 3" UNIT 3.00
0.75 Camion Piura 130
DOOR KNOB UNIT 1.00
0.59 Camion Piura 130
NAILS FOR WOOD C/C 1" kg 0.10
0.10 Camion Piura 130
NAILS FOR WOOD C/C 2" kg 0.15
0.15 Camion Piura 130
NAILS FOR WOOD C/C 3" kg 0.64
0.64 Camion Piura 130
NYLON MESH, MOSQUITO m2 0.24
0.10 Camion Piura 130
TOILET, PREFABRICATED UNIT 1.00
34.11 Camion Lima 1108
SINK, PREFABRICATED UNIT 1.00
11.07 Camion Piura 130
TOILET SEAT (PLASTIC) UNIT 1.00
2.68 Camion Piura 130
PLASTER 16 kg BAG BAG 0.29
4.71 Camion Piura 130
PAINT, OCRE kg 2.36
2.36 Camion Piura 130
CONCRETE BOX FOR CONTROL VALVE UNIT 1.00
20.00 Camion Piura 130
VALVE PVC 1/2" UNIT 1.00
1.10 Camion Piura 130
ADAPTOR, PVC 1/2" UNIT 3.00
0.30 Camion Piura 130
TUBE, PVC 1/2" 5m UNIT 1.00
1.24 Camion Piura 130
FAUCET, BRONZE 1/2" UNIT 1.00
0.60 Camion Piura 130
ELBOW, PVC 90 1/2" UNIT 2.00
0.20 Camion Piura 130
TEE, PVC 1/2" UNIT 1.00
0.10 Camion Piura 130
TUBE, PVC 2" m 3.08
3.20 Camion Piura 130
TUBE, PVC 4" m 7.21
3.27 Camion Piura 130
VENTILATION HAT, PVC 2" UNIT 1.00
0.10 Camion Piura 130
ELBOW, PVC 90 2" UNIT 1.00
0.10 Camion Piura 130
ELBOW, PVC 90 4" UNIT 1.00
0.10 Camion Piura 130
TEE PVC SAL 4"x2" UNIT 1.00
0.10 Camion Piura 130

75
Appendix A (Continued)
Table A.6: Material inventory for composting latrine adobe fiber cement privacy structure
Material Unit Quantity Volume (m3) Density (kg/m3) Mass (kg) Mode of Transport Origin Distance (km)
ADOBE BRICK (0.3x0.3x0.1 m) UNIT 300 9.00E-03 1515.11 4090.80 N/A Local 0
SAND, COURSE m3 0.567 0.57 1600.00 907.20 Camion Morropon 45.5
SAND, SIFTED m3 0.378 0.38 1600.00 604.80 Camion Morropon 45.5
WOOD, 3 m (3 cm diameter) PIECE 3 6.36E-07 670.00
N/A Local 0
WOOD, 2.4 m (3 cm diameter) PIECE 3 5.09E-07 670.00
N/A Local 0
WOOD, 2"x0.25x1.5 m PIECE 1 1.91E-02 670.00
N/A Local 0
STONE, CRUSHED m3 0.855 0.86 2515.00 2150.33 Camion Morropon 45.5
STONE, MEDIUM m3 0.414 0.41 2515.00 1041.21 Camion Morropon 45.5
CEMENT PORTLAND TYPE I (42.5 kg) BAG 9
2300.00 382.50 Camion Pacasmayo 449
REBAR 1/2" 9 m UNIT 3 1.14E-03 7850.00 26.85 Camion Lima 1108
REBAR 1/4" 9 m UNIT 0.52 1.14E-03 7850.00 4.65 Camion Lima 1108
WIRE No. 16 kg 1.5
1.50 Camion Piura 130
BRICK (22x12x8 cm) UNIT 300 2.11E-03 1922.00 1217.78 Camion Buenos Aires 63.1
TUBE, PVC 8" 5 m UNIT 0.14
0.11 Camion Piura 130
TUBE, PVC 2" 3 m UNIT 2.5
8.00 Camion Piura 130
ELBOW, PVC 2" 90 UNIT 6
1.00 Camion Piura 130
TEE, PVC 2" UNIT 1
0.10 Camion Piura 130
TEE, PVC 4" UNIT 1
0.10 Camion Piura 130
ELBOW, PVC 4" 90 UNIT 1
0.10 Camion Piura 130
TUBE, DESAGUE BLACK 4" 3 m UNIT 1
1.36 Camion Piura 130
VENTILATION HAT, PVC 4" UNIT 1
0.10 Camion Piura 130
NYLON MESH m2 0.26
0.10 Camion Piura 130
PLYWOOD ft2 30 0.0014 670.00 0.93 Camion Piura 130

76
Appendix A (Continued)
Table A.6: (Continued)
RUBBER m2 0.05 1.50E-04 1522.00 0.23 Camion Piura 130
HINGE, 3" WITH SCREWS UNIT 5
1.75 Camion Piura 130
LATCH, 1.5" UNIT 2
0.25 Camion Piura 130
ETERNIT ROOF, GRAY 8" FIBRE CEMENT UNIT 2.50 8.96E-03 1300.00 29.13 Camion Lima 1108
TOILET SEAT (PLASTIC) UNIT 2
2.68 Camion Piura 130
URINAL (PORCELAIN) UNIT 1
15.40 Camion Piura 130
SEPARATOR SEAT (FIBER GLASS) UNIT 2
16.00 Camion Piura 130
PLASTIC SHEET (DOUBLE WIDE 1.5) m 3
0.90 Camion Piura 130
Table A.7: Material inventory for composting latrine brick corrugated metal privacy structure
Material Unit Quantity Volume (m3) Density (kg/m3) Mass (kg) Mode of Transport Origin Distance (km)
SAND, COURSE m3 0.567 0.57 1600.00 907.20 Camion Morropon 45.5
SAND, SIFTED m3 0.378 0.38 1600.00 604.80 Camion Morropon 45.5
WOOD, 3 m (3 cm diameter) PIECE 3 6.36E-07 670.00 - N/A Local 0
WOOD, 2.4 m (3 cm diameter) PIECE 3 5.09E-07 670.00 - N/A Local 0
WOOD, 2"x0.25x1.5 m PIECE 1 1.91E-02 670.00 - N/A Local 0
STONE, CRUSHED m3 0.855 0.86 2515.00 2150.33 Camion Morropon 45.5
STONE, MEDIUM m3 0.414 0.41 2515.00 1041.21 Camion Morropon 45.5
CEMENT PORTLAND TYPE I (42.5 kg) BAG 11
2300.00 467.50 Camion Pacasmayo 449
REBAR 1/2" 9 m UNIT 3 1.14E-03 7850.00 26.85 Camion Lima 1108
REBAR 1/4" 9 m UNIT 0.52 1.14E-03 7850.00 4.65 Camion Lima 1108
WIRE No. 16 kg 1.5
1.50 Camion Piura 1108
BRICK (22x12x8 cm) UNIT 600 2.11E-03 1922.00 2435.56 Camion Buenos Aires 63.1
TUBE, PVC 8" 5 m UNIT 0.14
0.11 Camion Piura 130

77
Appendix A (Continued)
Table A.7: (Continued)
TUBE, PVC 2" 3 m UNIT 2.5
8.00 Camion Piura 130
ELBOW, PVC 2" 90 UNIT 6
1.00 Camion Piura 130
TEE, PVC 2" UNIT 1
0.10 Camion Piura 130
TEE, PVC 4" UNIT 1
0.10 Camion Piura 130
ELBOW, PVC 4" 90 UNIT 1
0.10 Camion Piura 130
TUBE, DESAGUE BLACK 4" 3 m UNIT 1
1.36 Camion Piura 130
VENTILATION HAT, PVC 4" UNIT 1
0.10 Camion Piura 130
NYLON MESH m2 0.26
0.10 Camion Piura 130
PLYWOOD ft2 30 0.0014 670.00 0.93 Camion Piura 130
RUBBER m2 0.05 1.50E-04 1522.00 0.23 Camion Piura 130
HINGE, 3" WITH SCREWS UNIT 5
1.75 Camion Piura 130
LATCH, 1.5" UNIT 2
0.25 Camion Piura 130
CORRUGATED METAL (2.4x0.8 m) UNIT 2.5
10.03 Camion Lima 1108
DOOR KIT (WOOD WITH SCREWS) KIT 1 4.48E-03 670.00 3.00 Camion Piura 130
TOILET SEAT (PLASTIC) UNIT 2
2.68 Camion Piura 130
URINAL (PORCELAIN) UNIT 1
15.40 Camion Piura 130
SEPARATOR SEAT (FIBER GLASS) UNIT 2
16.00 Camion Piura 130
PLASTIC SHEET (DOUBLE WIDE 1.5) m 3
0.90 Camion Piura 130

78
Appendix A (Continued)
Table A.8: Material inventory for biodigester latrine adobe fiber cement privacy structure
Material Unit Quantity Volume (m3) Density (kg/m3) Mass (kg) Mode of Transport Origin Distance (km)
REACTOR 10m3 (8x1.42 m) GEOMEMBRANE 0.6 mm thick UNIT 1.00 2.24E-02 1400.00 34.00 Camion Lima 1108
GAS RESERVOIR (2.2x0.9 m) UNIT 1.00 4.50E-03 1400.00 10.00 Camion Lima 1108
PLASTIC, BLACK (1.5 m wide) m 18.00
5.36 Camion Piura 130
PLASTIC, TRANSPARENT (1.5 wide) m 10.00
2.98 Camion Piura 130
CEMENT PORTLAND TYPE 1 (42.5 kg) BAG 12.80
544.00 Camion Pacasmayo 449
BRICK (22x12x8 cm) UNIT 150.00 2.11E-03 1922.00 608.89 Camion Buenos Aires 63.1
ADOBE BRICK (30x30x10cm) UNIT 500.00 0.01 1515.11 6818.00 N/A Local 0
SAND, COURSE m3 0.53
1600.00 843.76 Camion Morropon 45.5
SAND, FINE m3 0.83
1600.00 1328.00 Camion Morropon 45.5
STONE, 1/2" TO 3/4" m3 1.11
2515.00 2826.25 Camion Morropon 45.5
MIXED AGGREGATE, SAND AND STONE m3 0.07
1922.00 included in other
item Camion Morropon 45.5
WIRE, BLACK No. 16 kg 2.10
2.10 Camion Piura 130
WIRE, BLACK No. 8 kg 0.32
0.32 Camion Piura 130
DRY GRASS BUSHEL 1.00
20.00 N/A Local 0
CHICKEN WIRE (1x1 cm) m 1.00
1.00 Camion Piura 130
TUBE PVC 1/2" 5 m UNIT 6.00
7.44 Camion Piura 130
VALVE PVC 1/2" UNIT 3.00
0.30 Camion Piura 130
TEE PVC 1/2" UNIT 6.00
0.60 Camion Piura 130
ELBOW PVC 1/2" UNIT 5.00
0.50 Camion Piura 130
COUPLING 1" TO 1/2" (GAS EXIT) UNIT 3.00
0.30 Camion Piura 130
NIPPLE FOR HOSE CONNECTION 1/2" TO 3/8" UNIT 5.00
0.50 Camion Piura 130
HOSE, GAS 3/8" m 7.00
1.00 Camion Piura 130
HOSE CLAMP 3/8" UNIT 5.00
0.50 Camion Piura 130
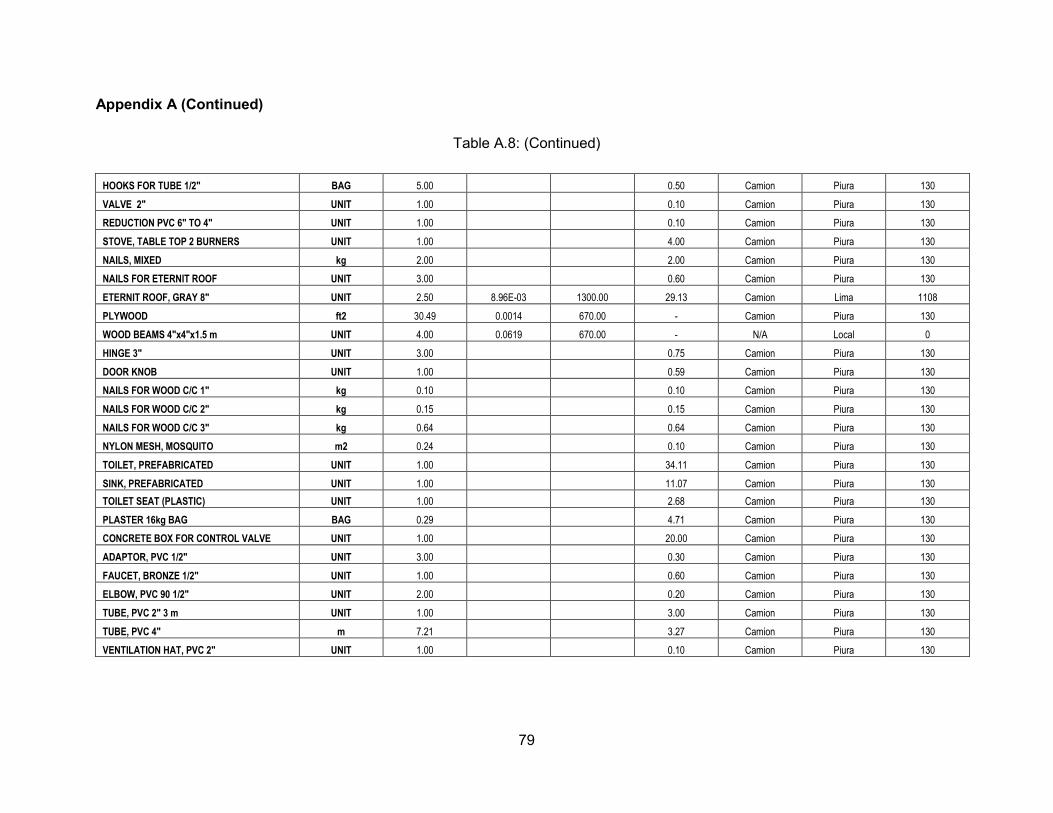
79
Appendix A (Continued)
Table A.8: (Continued)
HOOKS FOR TUBE 1/2" BAG 5.00
0.50 Camion Piura 130
VALVE 2" UNIT 1.00
0.10 Camion Piura 130
REDUCTION PVC 6" TO 4" UNIT 1.00
0.10 Camion Piura 130
STOVE, TABLE TOP 2 BURNERS UNIT 1.00
4.00 Camion Piura 130
NAILS, MIXED kg 2.00
2.00 Camion Piura 130
NAILS FOR ETERNIT ROOF UNIT 3.00
0.60 Camion Piura 130
ETERNIT ROOF, GRAY 8" UNIT 2.50 8.96E-03 1300.00 29.13 Camion Lima 1108
PLYWOOD ft2 30.49 0.0014 670.00 - Camion Piura 130
WOOD BEAMS 4"x4"x1.5 m UNIT 4.00 0.0619 670.00 - N/A Local 0
HINGE 3" UNIT 3.00
0.75 Camion Piura 130
DOOR KNOB UNIT 1.00
0.59 Camion Piura 130
NAILS FOR WOOD C/C 1" kg 0.10
0.10 Camion Piura 130
NAILS FOR WOOD C/C 2" kg 0.15
0.15 Camion Piura 130
NAILS FOR WOOD C/C 3" kg 0.64
0.64 Camion Piura 130
NYLON MESH, MOSQUITO m2 0.24
0.10 Camion Piura 130
TOILET, PREFABRICATED UNIT 1.00
34.11 Camion Piura 130
SINK, PREFABRICATED UNIT 1.00
11.07 Camion Piura 130
TOILET SEAT (PLASTIC) UNIT 1.00
2.68 Camion Piura 130
PLASTER 16kg BAG BAG 0.29
4.71 Camion Piura 130
CONCRETE BOX FOR CONTROL VALVE UNIT 1.00
20.00 Camion Piura 130
ADAPTOR, PVC 1/2" UNIT 3.00
0.30 Camion Piura 130
FAUCET, BRONZE 1/2" UNIT 1.00
0.60 Camion Piura 130
ELBOW, PVC 90 1/2" UNIT 2.00
0.20 Camion Piura 130
TUBE, PVC 2" 3 m UNIT 1.00
3.00 Camion Piura 130
TUBE, PVC 4" m 7.21
3.27 Camion Piura 130
VENTILATION HAT, PVC 2" UNIT 1.00
0.10 Camion Piura 130
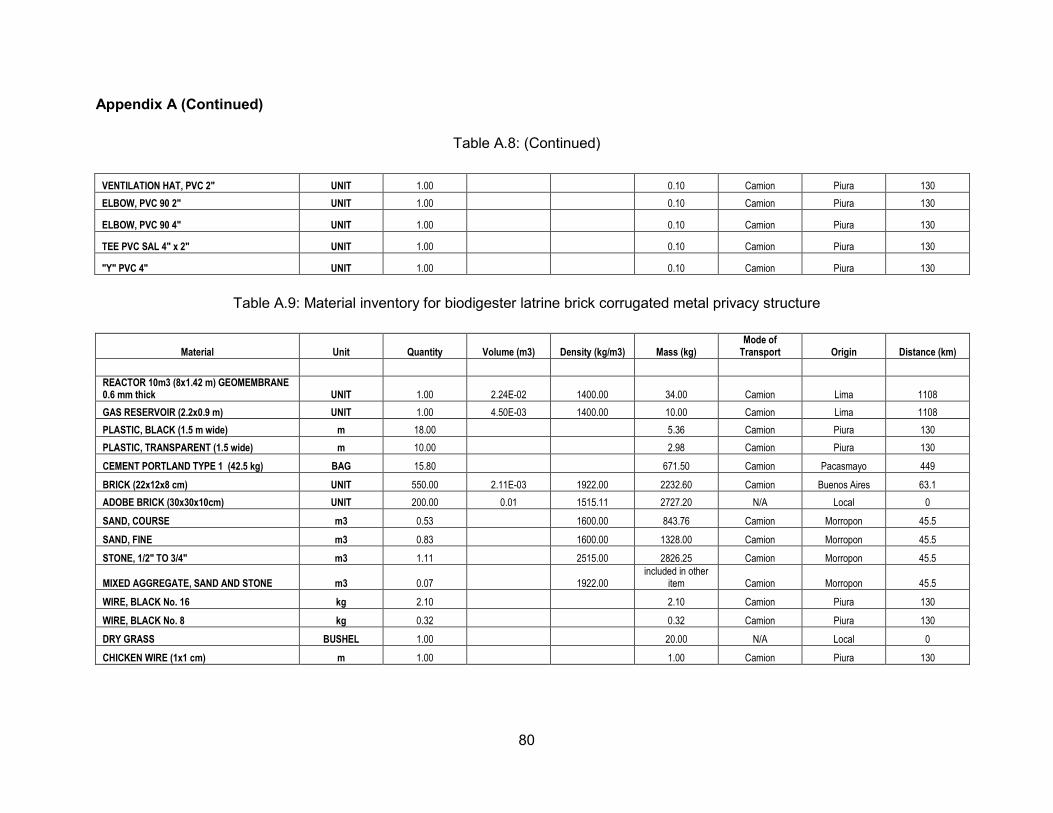
80
Appendix A (Continued)
Table A.8: (Continued)
VENTILATION HAT, PVC 2" UNIT 1.00
0.10 Camion Piura 130
ELBOW, PVC 90 2" UNIT 1.00
0.10 Camion Piura 130
ELBOW, PVC 90 4" UNIT 1.00
0.10 Camion Piura 130
TEE PVC SAL 4" x 2" UNIT 1.00
0.10 Camion Piura 130
"Y" PVC 4" UNIT 1.00
0.10 Camion Piura 130
Table A.9: Material inventory for biodigester latrine brick corrugated metal privacy structure
Material Unit Quantity Volume (m3) Density (kg/m3) Mass (kg) Mode of Transport Origin Distance (km)
REACTOR 10m3 (8x1.42 m) GEOMEMBRANE 0.6 mm thick UNIT 1.00 2.24E-02 1400.00 34.00 Camion Lima 1108
GAS RESERVOIR (2.2x0.9 m) UNIT 1.00 4.50E-03 1400.00 10.00 Camion Lima 1108
PLASTIC, BLACK (1.5 m wide) m 18.00
5.36 Camion Piura 130
PLASTIC, TRANSPARENT (1.5 wide) m 10.00
2.98 Camion Piura 130
CEMENT PORTLAND TYPE 1 (42.5 kg) BAG 15.80
671.50 Camion Pacasmayo 449
BRICK (22x12x8 cm) UNIT 550.00 2.11E-03 1922.00 2232.60 Camion Buenos Aires 63.1
ADOBE BRICK (30x30x10cm) UNIT 200.00 0.01 1515.11 2727.20 N/A Local 0
SAND, COURSE m3 0.53
1600.00 843.76 Camion Morropon 45.5
SAND, FINE m3 0.83
1600.00 1328.00 Camion Morropon 45.5
STONE, 1/2" TO 3/4" m3 1.11
2515.00 2826.25 Camion Morropon 45.5
MIXED AGGREGATE, SAND AND STONE m3 0.07
1922.00 included in other
item Camion Morropon 45.5
WIRE, BLACK No. 16 kg 2.10
2.10 Camion Piura 130
WIRE, BLACK No. 8 kg 0.32
0.32 Camion Piura 130
DRY GRASS BUSHEL 1.00
20.00 N/A Local 0
CHICKEN WIRE (1x1 cm) m 1.00
1.00 Camion Piura 130
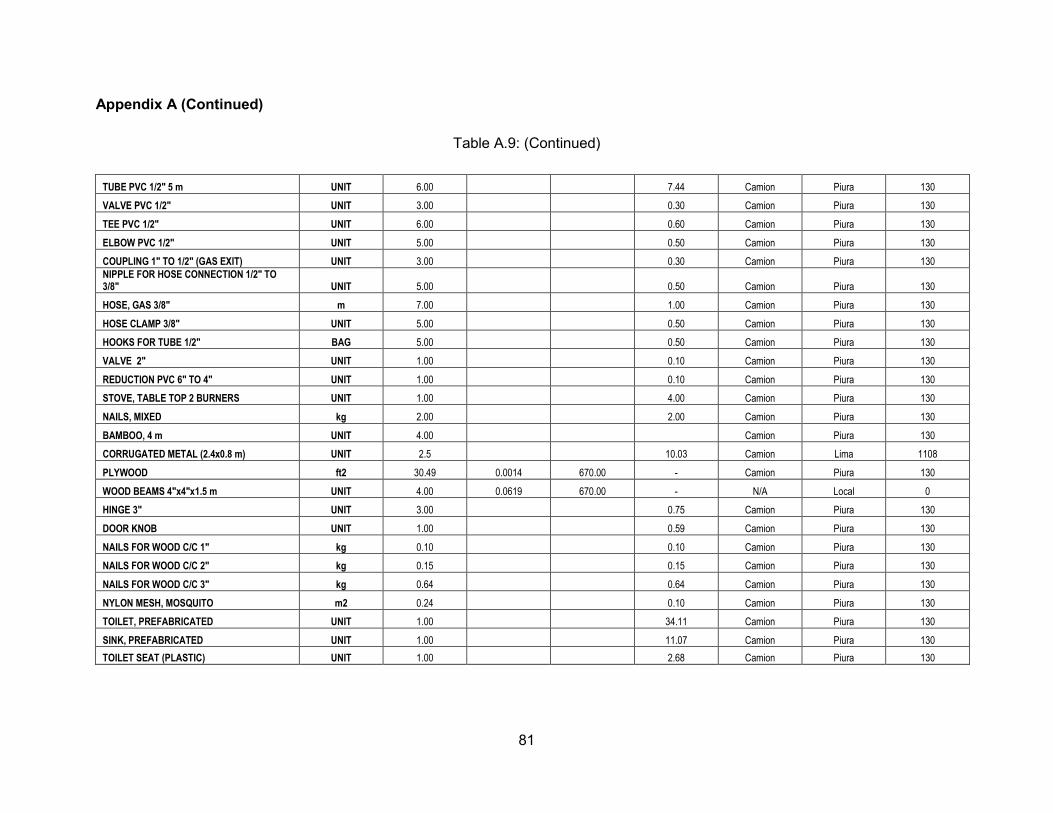
81
Appendix A (Continued)
Table A.9: (Continued)
TUBE PVC 1/2" 5 m UNIT 6.00
7.44 Camion Piura 130
VALVE PVC 1/2" UNIT 3.00
0.30 Camion Piura 130
TEE PVC 1/2" UNIT 6.00
0.60 Camion Piura 130
ELBOW PVC 1/2" UNIT 5.00
0.50 Camion Piura 130
COUPLING 1" TO 1/2" (GAS EXIT) UNIT 3.00
0.30 Camion Piura 130
NIPPLE FOR HOSE CONNECTION 1/2" TO 3/8" UNIT 5.00
0.50 Camion Piura 130
HOSE, GAS 3/8" m 7.00
1.00 Camion Piura 130
HOSE CLAMP 3/8" UNIT 5.00
0.50 Camion Piura 130
HOOKS FOR TUBE 1/2" BAG 5.00
0.50 Camion Piura 130
VALVE 2" UNIT 1.00
0.10 Camion Piura 130
REDUCTION PVC 6" TO 4" UNIT 1.00
0.10 Camion Piura 130
STOVE, TABLE TOP 2 BURNERS UNIT 1.00
4.00 Camion Piura 130
NAILS, MIXED kg 2.00
2.00 Camion Piura 130
BAMBOO, 4 m UNIT 4.00
Camion Piura 130
CORRUGATED METAL (2.4x0.8 m) UNIT 2.5
10.03 Camion Lima 1108
PLYWOOD ft2 30.49 0.0014 670.00 - Camion Piura 130
WOOD BEAMS 4"x4"x1.5 m UNIT 4.00 0.0619 670.00 - N/A Local 0
HINGE 3" UNIT 3.00
0.75 Camion Piura 130
DOOR KNOB UNIT 1.00
0.59 Camion Piura 130
NAILS FOR WOOD C/C 1" kg 0.10
0.10 Camion Piura 130
NAILS FOR WOOD C/C 2" kg 0.15
0.15 Camion Piura 130
NAILS FOR WOOD C/C 3" kg 0.64
0.64 Camion Piura 130
NYLON MESH, MOSQUITO m2 0.24
0.10 Camion Piura 130
TOILET, PREFABRICATED UNIT 1.00
34.11 Camion Piura 130
SINK, PREFABRICATED UNIT 1.00
11.07 Camion Piura 130
TOILET SEAT (PLASTIC) UNIT 1.00
2.68 Camion Piura 130
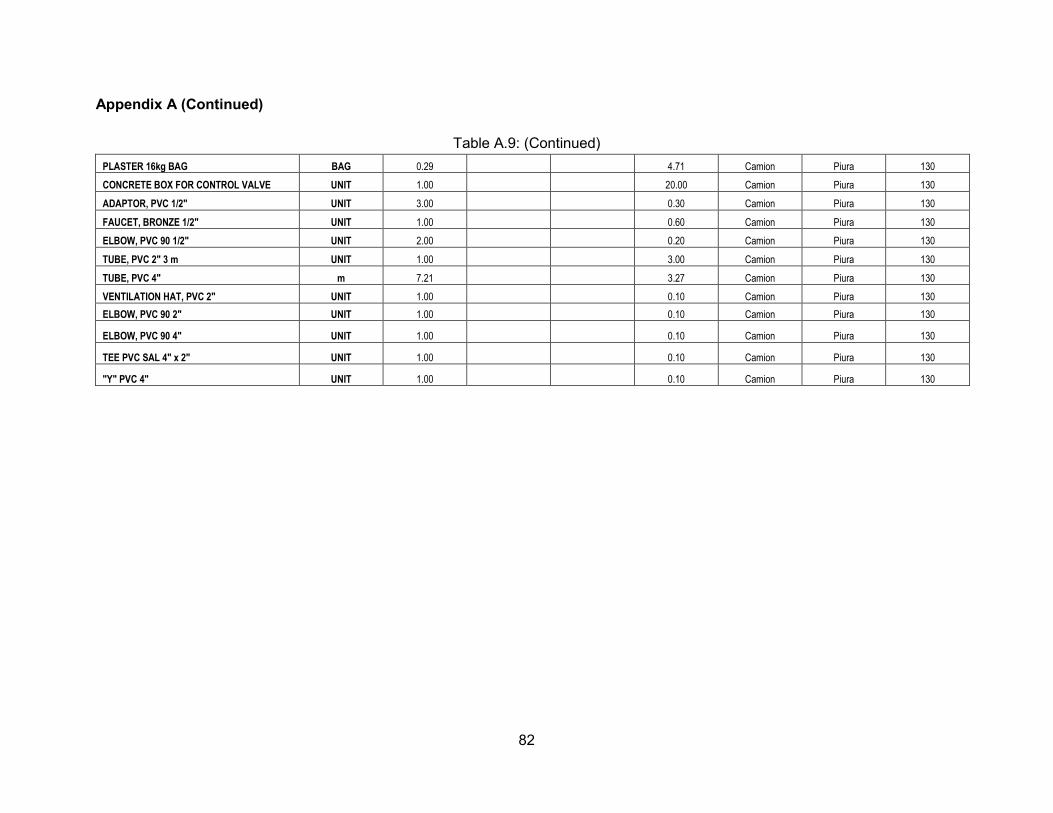
82
Appendix A (Continued)
Table A.9: (Continued)
PLASTER 16kg BAG BAG 0.29
4.71 Camion Piura 130
CONCRETE BOX FOR CONTROL VALVE UNIT 1.00
20.00 Camion Piura 130
ADAPTOR, PVC 1/2" UNIT 3.00
0.30 Camion Piura 130
FAUCET, BRONZE 1/2" UNIT 1.00
0.60 Camion Piura 130
ELBOW, PVC 90 1/2" UNIT 2.00
0.20 Camion Piura 130
TUBE, PVC 2" 3 m UNIT 1.00
3.00 Camion Piura 130
TUBE, PVC 4" m 7.21
3.27 Camion Piura 130
VENTILATION HAT, PVC 2" UNIT 1.00
0.10 Camion Piura 130
ELBOW, PVC 90 2" UNIT 1.00
0.10 Camion Piura 130
ELBOW, PVC 90 4" UNIT 1.00
0.10 Camion Piura 130
TEE PVC SAL 4" x 2" UNIT 1.00
0.10 Camion Piura 130
"Y" PVC 4" UNIT 1.00
0.10 Camion Piura 130

83
Appendix B LCA Results Data Table B.1: LCA results for construction and use phase of VIP latrine adobe fiber cement privacy structure
Construction phase Unit Input
CED (MJ)
GWP (kgCO2 eq)
Brick, at plant/RER S kg 1,420.7 4,019.7 337.9
Transport, lorry 3.5-16t, fleet average/RER S kgkm 182,581.9 751.2 43.2
Portland cement, strength class Z 42.5, at plant/CH S kg 106.3 403.5 87.3
Fibre cement corrugated slab, at plant/CH S kg 29.1 267.6 19.9
PVC pipe E kg 1.4 92.4 4.4
Plywood, outdoor use, at plant/RER S m3 1.40E-03 49.6 0.9
Sawn timber, softwood, planed, air dried, at plant/RER S m3 3.78E-03 40.9 0.3
Steel rebar, blast furnace and electric arc furnace route, production mix, at plant GLO S kg 5.0 53.5 5.2
PVC (emulsion polyerisation) E kg 0.3 17.2 0.8
Iron and steel, production mix/US kg 1.6 16.6 1.4
Sand, at mine/CH S kg 80.0 4.6 0.2
Gravel, round, at mine/CH S kg 75.5 4.4 0.2
Stucco, at plant/CH S kg 1.6 2.3 0.1
Adobe brick kg 4,090.8 - -
Total construction phase 5,723.6 501.8
Use phase
Brick, at plant/RER S kg 1,420.7 4,019.7 337.9
Transport, lorry 3.5-16t, fleet average/RER S kgkm 182,581.9 751.2 43.2
Portland cement, strength class Z 42.5, at plant/CH S kg 106.3 403.5 87.3
Fibre cement corrugated slab, at plant/CH S kg 29.1 267.6 19.9
PVC pipe E kg 1.4 92.4 4.4
Plywood, outdoor use, at plant/RER S m3 1.40E-03 49.6 0.9
Sawn timber, softwood, planed, air dried, at plant/RER S m3 3.78E-03 40.9 0.3
Steel rebar, blast furnace and electric arc furnace route, production mix, at plant GLO S kg 5.0 53.5 5.2
PVC (emulsion polyerisation) E kg 0.3 17.2 0.8
Iron and steel, production mix/US kg 1.6 16.6 1.4
Sand, at mine/CH S kg 80.0 4.6 0.2
Gravel, round, at mine/CH S kg 75.5 4.4 0.2
Stucco, at plant/CH S kg 1.6 2.3 0.1
Adobe brick kg 4,090.8 - -
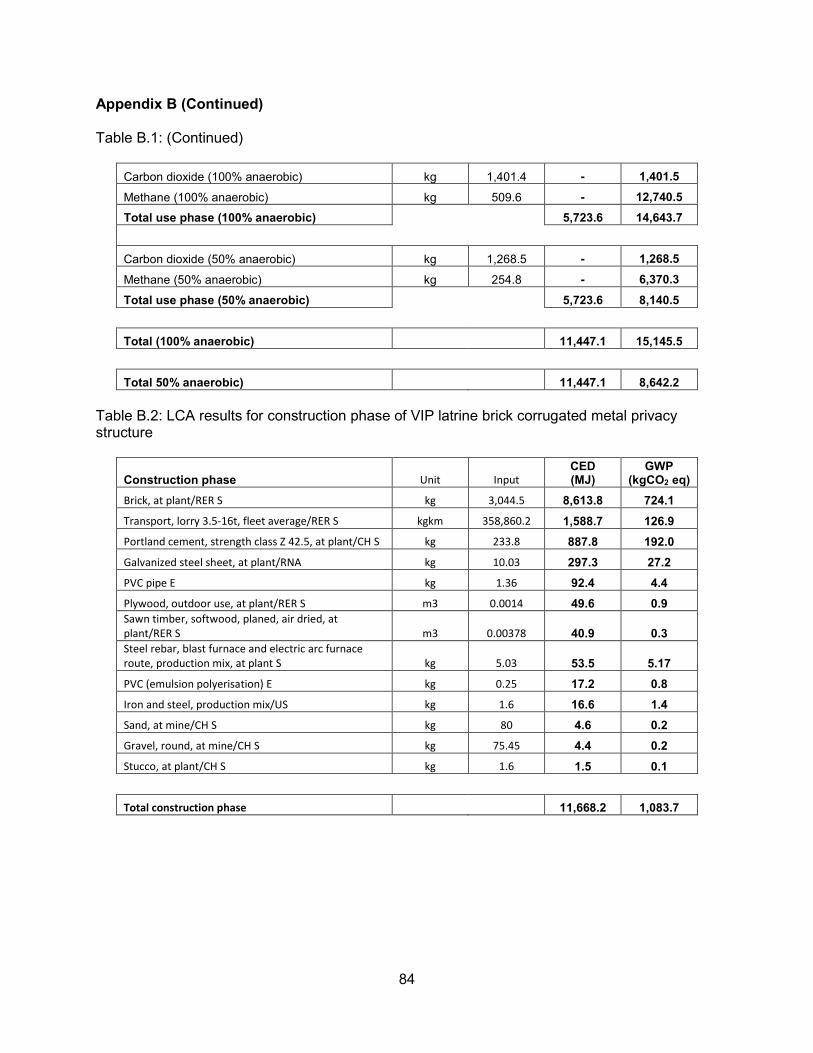
84
Appendix B (Continued) Table B.1: (Continued)
Carbon dioxide (100% anaerobic) kg 1,401.4 - 1,401.5
Methane (100% anaerobic) kg 509.6 - 12,740.5
Total use phase (100% anaerobic) 5,723.6 14,643.7
Carbon dioxide (50% anaerobic) kg 1,268.5 - 1,268.5
Methane (50% anaerobic) kg 254.8 - 6,370.3
Total use phase (50% anaerobic) 5,723.6 8,140.5
Total (100% anaerobic) 11,447.1 15,145.5
Total 50% anaerobic) 11,447.1 8,642.2
Table B.2: LCA results for construction phase of VIP latrine brick corrugated metal privacy structure
Construction phase Unit Input
CED (MJ)
GWP (kgCO2 eq)
Brick, at plant/RER S kg 3,044.5 8,613.8 724.1
Transport, lorry 3.5-16t, fleet average/RER S kgkm 358,860.2 1,588.7 126.9
Portland cement, strength class Z 42.5, at plant/CH S kg 233.8 887.8 192.0
Galvanized steel sheet, at plant/RNA kg 10.03 297.3 27.2
PVC pipe E kg 1.36 92.4 4.4
Plywood, outdoor use, at plant/RER S m3 0.0014 49.6 0.9
Sawn timber, softwood, planed, air dried, at
plant/RER S m3 0.00378 40.9 0.3
Steel rebar, blast furnace and electric arc furnace
route, production mix, at plant S kg 5.03 53.5 5.17
PVC (emulsion polyerisation) E kg 0.25 17.2 0.8
Iron and steel, production mix/US kg 1.6 16.6 1.4
Sand, at mine/CH S kg 80 4.6 0.2
Gravel, round, at mine/CH S kg 75.45 4.4 0.2
Stucco, at plant/CH S kg 1.6 1.5 0.1
Total construction phase 11,668.2 1,083.7
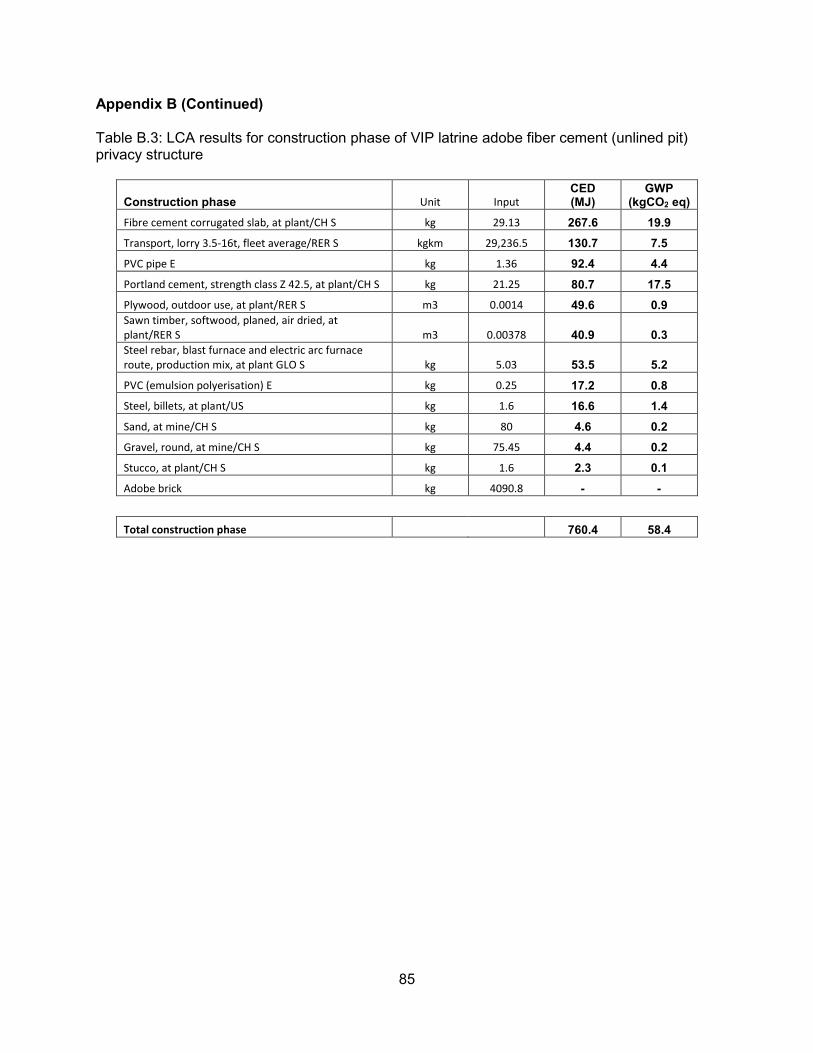
85
Appendix B (Continued) Table B.3: LCA results for construction phase of VIP latrine adobe fiber cement (unlined pit) privacy structure
Construction phase Unit Input
CED (MJ)
GWP (kgCO2 eq)
Fibre cement corrugated slab, at plant/CH S kg 29.13 267.6 19.9
Transport, lorry 3.5-16t, fleet average/RER S kgkm 29,236.5 130.7 7.5
PVC pipe E kg 1.36 92.4 4.4
Portland cement, strength class Z 42.5, at plant/CH S kg 21.25 80.7 17.5
Plywood, outdoor use, at plant/RER S m3 0.0014 49.6 0.9
Sawn timber, softwood, planed, air dried, at
plant/RER S m3 0.00378 40.9 0.3
Steel rebar, blast furnace and electric arc furnace
route, production mix, at plant GLO S kg 5.03 53.5 5.2
PVC (emulsion polyerisation) E kg 0.25 17.2 0.8
Steel, billets, at plant/US kg 1.6 16.6 1.4
Sand, at mine/CH S kg 80 4.6 0.2
Gravel, round, at mine/CH S kg 75.45 4.4 0.2
Stucco, at plant/CH S kg 1.6 2.3 0.1
Adobe brick kg 4090.8 - -
Total construction phase 760.4 58.4
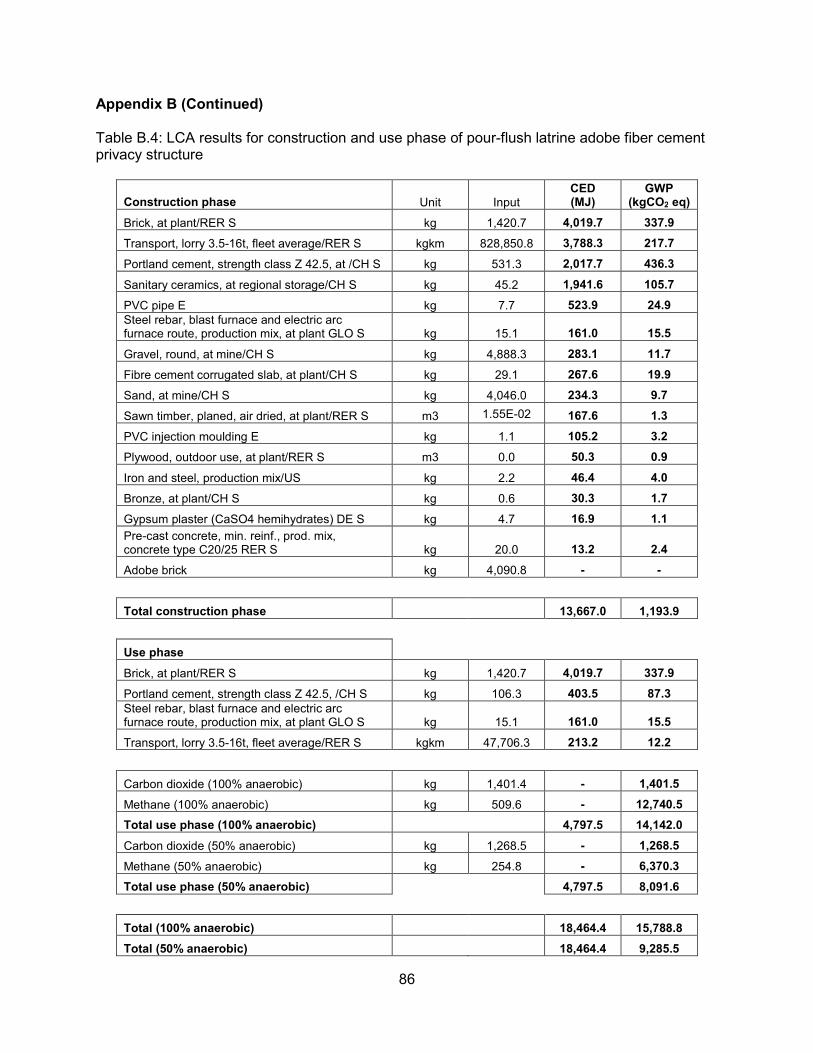
86
Appendix B (Continued) Table B.4: LCA results for construction and use phase of pour-flush latrine adobe fiber cement privacy structure
Construction phase Unit Input
CED (MJ)
GWP (kgCO2 eq)
Brick, at plant/RER S kg 1,420.7 4,019.7 337.9
Transport, lorry 3.5-16t, fleet average/RER S kgkm 828,850.8 3,788.3 217.7
Portland cement, strength class Z 42.5, at /CH S kg 531.3 2,017.7 436.3
Sanitary ceramics, at regional storage/CH S kg 45.2 1,941.6 105.7
PVC pipe E kg 7.7 523.9 24.9
Steel rebar, blast furnace and electric arc furnace route, production mix, at plant GLO S kg 15.1 161.0 15.5
Gravel, round, at mine/CH S kg 4,888.3 283.1 11.7
Fibre cement corrugated slab, at plant/CH S kg 29.1 267.6 19.9
Sand, at mine/CH S kg 4,046.0 234.3 9.7
Sawn timber, planed, air dried, at plant/RER S m3 1.55E-02 167.6 1.3
PVC injection moulding E kg 1.1 105.2 3.2
Plywood, outdoor use, at plant/RER S m3 0.0 50.3 0.9
Iron and steel, production mix/US kg 2.2 46.4 4.0
Bronze, at plant/CH S kg 0.6 30.3 1.7
Gypsum plaster (CaSO4 hemihydrates) DE S kg 4.7 16.9 1.1
Pre-cast concrete, min. reinf., prod. mix, concrete type C20/25 RER S kg 20.0 13.2 2.4
Adobe brick kg 4,090.8 - -
Total construction phase 13,667.0 1,193.9
Use phase
Brick, at plant/RER S kg 1,420.7 4,019.7 337.9
Portland cement, strength class Z 42.5, /CH S kg 106.3 403.5 87.3
Steel rebar, blast furnace and electric arc furnace route, production mix, at plant GLO S kg 15.1 161.0 15.5
Transport, lorry 3.5-16t, fleet average/RER S kgkm 47,706.3 213.2 12.2
Carbon dioxide (100% anaerobic) kg 1,401.4 - 1,401.5
Methane (100% anaerobic) kg 509.6 - 12,740.5
Total use phase (100% anaerobic) 4,797.5 14,142.0
Carbon dioxide (50% anaerobic) kg 1,268.5 - 1,268.5
Methane (50% anaerobic) kg 254.8 - 6,370.3
Total use phase (50% anaerobic) 4,797.5 8,091.6
Total (100% anaerobic) 18,464.4 15,788.8
Total (50% anaerobic) 18,464.4 9,285.5
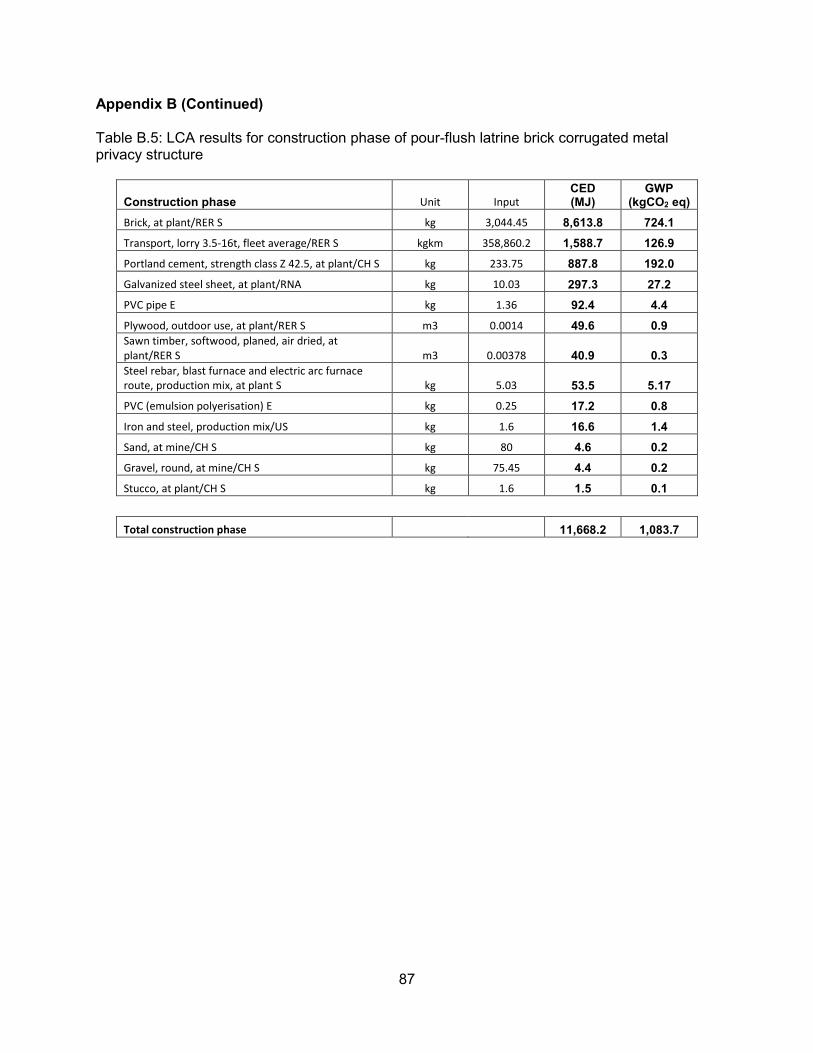
87
Appendix B (Continued) Table B.5: LCA results for construction phase of pour-flush latrine brick corrugated metal privacy structure
Construction phase Unit Input
CED (MJ)
GWP (kgCO2 eq)
Brick, at plant/RER S kg 3,044.45 8,613.8 724.1
Transport, lorry 3.5-16t, fleet average/RER S kgkm 358,860.2 1,588.7 126.9
Portland cement, strength class Z 42.5, at plant/CH S kg 233.75 887.8 192.0
Galvanized steel sheet, at plant/RNA kg 10.03 297.3 27.2
PVC pipe E kg 1.36 92.4 4.4
Plywood, outdoor use, at plant/RER S m3 0.0014 49.6 0.9
Sawn timber, softwood, planed, air dried, at
plant/RER S m3 0.00378 40.9 0.3
Steel rebar, blast furnace and electric arc furnace
route, production mix, at plant S kg 5.03 53.5 5.17
PVC (emulsion polyerisation) E kg 0.25 17.2 0.8
Iron and steel, production mix/US kg 1.6 16.6 1.4
Sand, at mine/CH S kg 80 4.6 0.2
Gravel, round, at mine/CH S kg 75.45 4.4 0.2
Stucco, at plant/CH S kg 1.6 1.5 0.1
Total construction phase 11,668.2 1,083.7
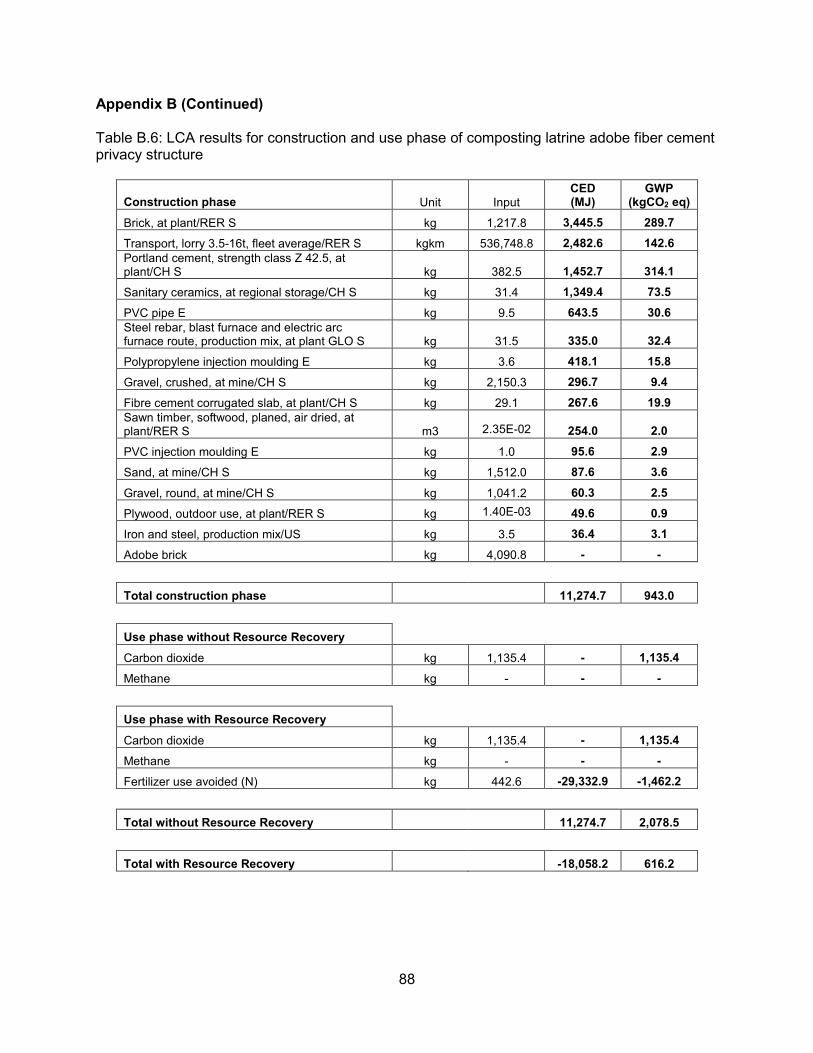
88
Appendix B (Continued) Table B.6: LCA results for construction and use phase of composting latrine adobe fiber cement privacy structure
Construction phase Unit Input
CED (MJ)
GWP (kgCO2 eq)
Brick, at plant/RER S kg 1,217.8 3,445.5 289.7
Transport, lorry 3.5-16t, fleet average/RER S kgkm 536,748.8 2,482.6 142.6
Portland cement, strength class Z 42.5, at plant/CH S kg 382.5 1,452.7 314.1
Sanitary ceramics, at regional storage/CH S kg 31.4 1,349.4 73.5
PVC pipe E kg 9.5 643.5 30.6
Steel rebar, blast furnace and electric arc furnace route, production mix, at plant GLO S kg 31.5 335.0 32.4
Polypropylene injection moulding E kg 3.6 418.1 15.8
Gravel, crushed, at mine/CH S kg 2,150.3 296.7 9.4
Fibre cement corrugated slab, at plant/CH S kg 29.1 267.6 19.9
Sawn timber, softwood, planed, air dried, at plant/RER S m3 2.35E-02 254.0 2.0
PVC injection moulding E kg 1.0 95.6 2.9
Sand, at mine/CH S kg 1,512.0 87.6 3.6
Gravel, round, at mine/CH S kg 1,041.2 60.3 2.5
Plywood, outdoor use, at plant/RER S kg 1.40E-03 49.6 0.9
Iron and steel, production mix/US kg 3.5 36.4 3.1
Adobe brick kg 4,090.8 - -
Total construction phase 11,274.7 943.0
Use phase without Resource Recovery
Carbon dioxide kg 1,135.4 - 1,135.4
Methane kg - - -
Use phase with Resource Recovery
Carbon dioxide kg 1,135.4 - 1,135.4
Methane kg - - -
Fertilizer use avoided (N) kg 442.6 -29,332.9 -1,462.2
Total without Resource Recovery 11,274.7 2,078.5
Total with Resource Recovery -18,058.2 616.2
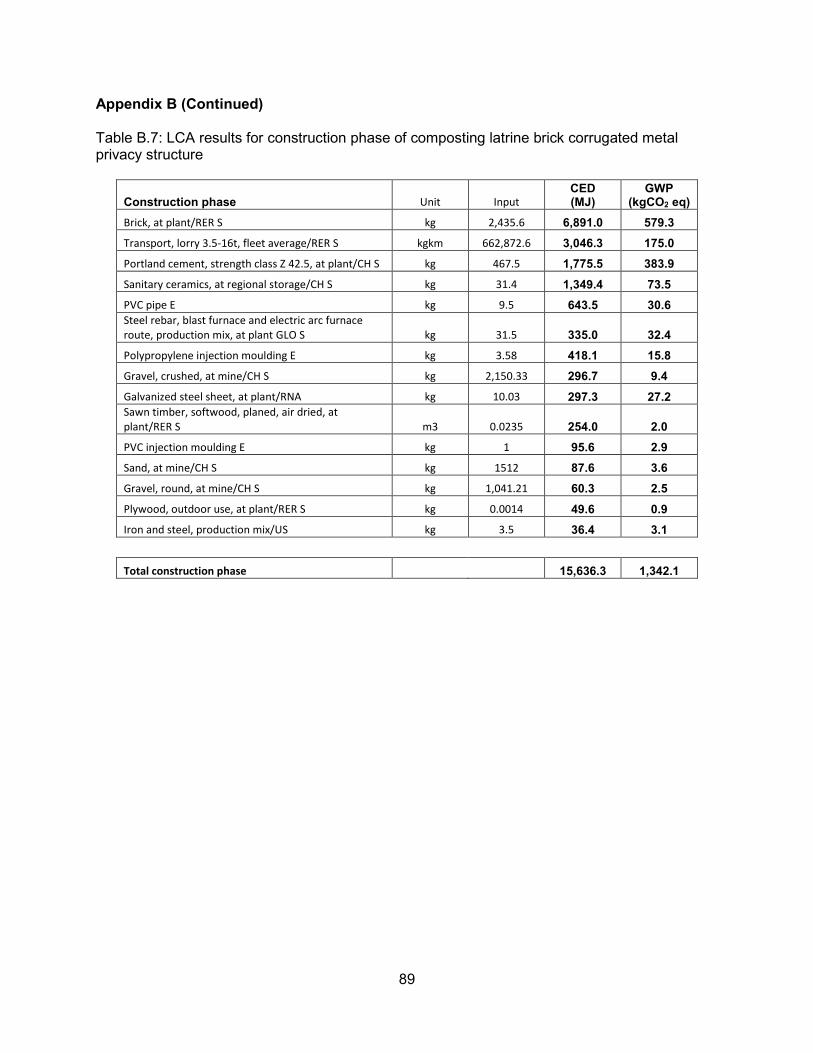
89
Appendix B (Continued) Table B.7: LCA results for construction phase of composting latrine brick corrugated metal privacy structure
Construction phase Unit Input
CED (MJ)
GWP (kgCO2 eq)
Brick, at plant/RER S kg 2,435.6 6,891.0 579.3
Transport, lorry 3.5-16t, fleet average/RER S kgkm 662,872.6 3,046.3 175.0
Portland cement, strength class Z 42.5, at plant/CH S kg 467.5 1,775.5 383.9
Sanitary ceramics, at regional storage/CH S kg 31.4 1,349.4 73.5
PVC pipe E kg 9.5 643.5 30.6
Steel rebar, blast furnace and electric arc furnace
route, production mix, at plant GLO S kg 31.5 335.0 32.4
Polypropylene injection moulding E kg 3.58 418.1 15.8
Gravel, crushed, at mine/CH S kg 2,150.33 296.7 9.4
Galvanized steel sheet, at plant/RNA kg 10.03 297.3 27.2
Sawn timber, softwood, planed, air dried, at
plant/RER S m3 0.0235 254.0 2.0
PVC injection moulding E kg 1 95.6 2.9
Sand, at mine/CH S kg 1512 87.6 3.6
Gravel, round, at mine/CH S kg 1,041.21 60.3 2.5
Plywood, outdoor use, at plant/RER S kg 0.0014 49.6 0.9
Iron and steel, production mix/US kg 3.5 36.4 3.1
Total construction phase 15,636.3 1,342.1

90
Appendix B (Continued) Table B.8: LCA results for construction and use phase of biodigester latrine adobe fiber cement privacy structure
Construction phase Unit Input
CED (MJ)
GWP (kgCO2 eq)
Transport, lorry 3.5-16t, fleet average/RER S kgkm 676,569.4 2,928.6 168.3
Polyvinylchloride, bulk polymerised, at plant/RER S kg 44.0 2,665.2 87.3
Portland cement, strength class Z 42.5, at plant/CH S kg 544.0 2,066.1 446.7
Sanitary ceramics, at regional storage/CH S kg 45.2 1,941.6 105.7
Brick, at plant/RER S kg 608.9 1,722.8 144.8
PVC pipe E kg 12.7 860.9 41.0
Sawn timber, softwood, planed, air dried, at plant/RER S m3 0.1 669.2 5.3
Polyethylene low density granulate (PE-LD), production mix, at plant RER kg 8.3 614.5 17.5
Polypropylene injection moulding E kg 3.0 353.9 13.4
Fibre cement corrugated slab, at plant/CH S kg 29.1 267.6 19.9
Gravel, round, at mine/CH S kg 2,826.3 163.7 6.8
Iron and steel, production mix/US kg 9.0 137.8 11.9
Sand, at mine/CH S kg 2,171.8 125.8 5.2
Gypsum plaster (CaSO4 alpha hemihydrates) DE S kg 4.7 16.9 4.9
Plywood, outdoor use, at plant/RER S m3 1.40E-03 49.6 0.9
Bronze, at plant/CH S kg 0.6 30.3 1.7
Pre-cast concrete, min. reinf., prod. mix, concrete type C20/25, w/o consideration of casings RER S kg 20.0 13.2 2.4
Adobe brick kg 6,818.0 - -
Total construction phase 14,627.5 1,083.6
Use phase general Polyvinylchloride, bulk polymerised, at plant/RER
S kg 81.8 4,957.2 162.5
Transport, lorry 3.5-16t, fleet average/RER S kgkm 90,678.7 405.2 23.3
Use phase without Resource Recovery
Carbon dioxide kg 4,460.1 - 4,460.1
Methane kg 1,757.0 - 43,925.8
Total use phase without Resource Recovery 5,362.4 48,571.6
Total without Resource Recovery 19,989.9 49,655.2
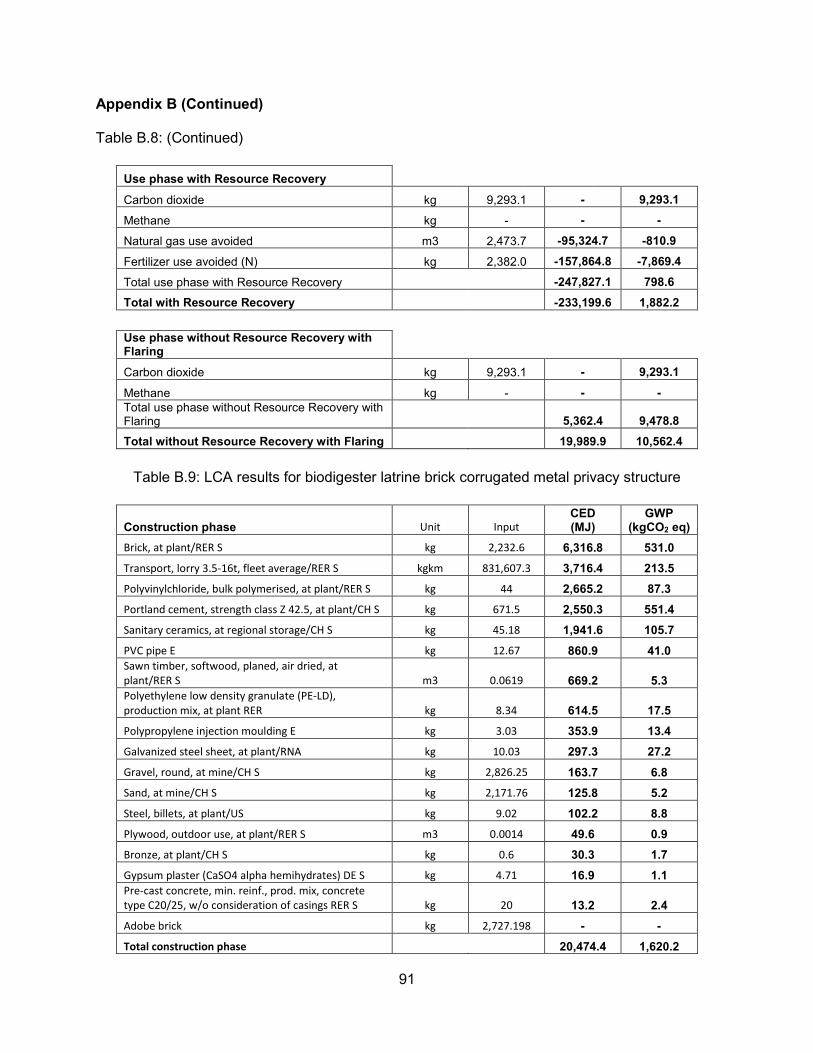
91
Appendix B (Continued) Table B.8: (Continued)
Use phase with Resource Recovery
Carbon dioxide kg 9,293.1 - 9,293.1
Methane kg - - -
Natural gas use avoided m3 2,473.7 -95,324.7 -810.9
Fertilizer use avoided (N) kg 2,382.0 -157,864.8 -7,869.4
Total use phase with Resource Recovery -247,827.1 798.6
Total with Resource Recovery -233,199.6 1,882.2
Use phase without Resource Recovery with
Flaring
Carbon dioxide kg 9,293.1 - 9,293.1
Methane kg - - -
Total use phase without Resource Recovery with Flaring 5,362.4 9,478.8
Total without Resource Recovery with Flaring 19,989.9 10,562.4
Table B.9: LCA results for biodigester latrine brick corrugated metal privacy structure
Construction phase Unit Input
CED (MJ)
GWP (kgCO2 eq)
Brick, at plant/RER S kg 2,232.6 6,316.8 531.0
Transport, lorry 3.5-16t, fleet average/RER S kgkm 831,607.3 3,716.4 213.5
Polyvinylchloride, bulk polymerised, at plant/RER S kg 44 2,665.2 87.3
Portland cement, strength class Z 42.5, at plant/CH S kg 671.5 2,550.3 551.4
Sanitary ceramics, at regional storage/CH S kg 45.18 1,941.6 105.7
PVC pipe E kg 12.67 860.9 41.0
Sawn timber, softwood, planed, air dried, at
plant/RER S m3 0.0619 669.2 5.3
Polyethylene low density granulate (PE-LD),
production mix, at plant RER kg 8.34 614.5 17.5
Polypropylene injection moulding E kg 3.03 353.9 13.4
Galvanized steel sheet, at plant/RNA kg 10.03 297.3 27.2
Gravel, round, at mine/CH S kg 2,826.25 163.7 6.8
Sand, at mine/CH S kg 2,171.76 125.8 5.2
Steel, billets, at plant/US kg 9.02 102.2 8.8
Plywood, outdoor use, at plant/RER S m3 0.0014 49.6 0.9
Bronze, at plant/CH S kg 0.6 30.3 1.7
Gypsum plaster (CaSO4 alpha hemihydrates) DE S kg 4.71 16.9 1.1
Pre-cast concrete, min. reinf., prod. mix, concrete
type C20/25, w/o consideration of casings RER S kg 20 13.2 2.4
Adobe brick kg 2,727.198 - -
Total construction phase 20,474.4 1,620.2
92
Appendix C Permissions C.1 Cairncross and Feachem (1993) Permission
C.2 Buckley et al. (2008) Permission
C.3 Mihelcic et al. (2009) Permission