embarcadero performance center 2.7 expert guide:...
TRANSCRIPT

Embarcadero Performance Center 2.7 Expert Guide: DB2

Copyright © 1994-2009 Embarcadero Technologies, Inc.
Embarcadero Technologies, Inc. 100 California Street, 12th FloorSan Francisco, CA 94111 U.S.A.All rights reserved.
All brands and product names are trademarks or registered trademarks of their respective owners. This software/documentation contains proprietary information of Embarcadero Technologies, Inc.; it is provided under a license agreement containing restrictions on use and disclosure and is also protected by copyright law. Reverse engineering of the software is prohibited.
If this software/documentation is delivered to a U.S. Government Agency of the Department of Defense, then it is delivered with Restricted Rights and the following legend is applicable:
Restricted Rights Legend Use, duplication, or disclosure by the Government is subject to restrictions as set forth in subparagraph (c)(1)(ii) of DFARS 252.227-7013, Rights in Technical Data and Computer Software (October 1988).
If this software/documentation is delivered to a U.S. Government Agency not within the Department of Defense, then it is delivered with Restricted Rights, as defined in FAR 552.227-14, Rights in Data-General, including Alternate III (June 1987).
Information in this document is subject to change without notice. Revisions may be issued to advise of such changes and additions. Embarcadero Technologies, Inc. does not warrant that this documentation is error-free.

>
DB2 Expert Guide. . . . . . . . . . . . . . . . . . . . . . . . . . . . . . . . . . . . . . . . . . . . . . . . . . . . . . . . . . . . . . . . . . . . . . . . . . . . . 10
Home View Statistics . . . . . . . . . . . . . . . . . . . . . . . . . . . . . . . . . . . . . . . . . . . . . . . . . . . . . . . . . . . . . . . . . . . . . . . 10
Memory Vital Signs . . . . . . . . . . . . . . . . . . . . . . . . . . . . . . . . . . . . . . . . . . . . . . . . . . . . . . . . . . . . . . . . . . . . . . 10
Contention Vital Signs. . . . . . . . . . . . . . . . . . . . . . . . . . . . . . . . . . . . . . . . . . . . . . . . . . . . . . . . . . . . . . . . . . . . 10
I/O Vital Signs . . . . . . . . . . . . . . . . . . . . . . . . . . . . . . . . . . . . . . . . . . . . . . . . . . . . . . . . . . . . . . . . . . . . . . . . . . 11
Users Vital Signs. . . . . . . . . . . . . . . . . . . . . . . . . . . . . . . . . . . . . . . . . . . . . . . . . . . . . . . . . . . . . . . . . . . . . . . . 11
Space Vital Signs . . . . . . . . . . . . . . . . . . . . . . . . . . . . . . . . . . . . . . . . . . . . . . . . . . . . . . . . . . . . . . . . . . . . . . . 11
Instance Vital Signs. . . . . . . . . . . . . . . . . . . . . . . . . . . . . . . . . . . . . . . . . . . . . . . . . . . . . . . . . . . . . . . . . . . . . . 11
Memory Page Statistics . . . . . . . . . . . . . . . . . . . . . . . . . . . . . . . . . . . . . . . . . . . . . . . . . . . . . . . . . . . . . . . . . . . . . 12
Buffer Pool Hit Ratio . . . . . . . . . . . . . . . . . . . . . . . . . . . . . . . . . . . . . . . . . . . . . . . . . . . . . . . . . . . . . . . . . . . . . 12
Buffer Pool Index Hit Ratio . . . . . . . . . . . . . . . . . . . . . . . . . . . . . . . . . . . . . . . . . . . . . . . . . . . . . . . . . . . . . . . . 13
Database Heap Utilization. . . . . . . . . . . . . . . . . . . . . . . . . . . . . . . . . . . . . . . . . . . . . . . . . . . . . . . . . . . . . . . . . 13
Catalog Cache Hit Ratio . . . . . . . . . . . . . . . . . . . . . . . . . . . . . . . . . . . . . . . . . . . . . . . . . . . . . . . . . . . . . . . . . . 13
Sort Overflow Percentage . . . . . . . . . . . . . . . . . . . . . . . . . . . . . . . . . . . . . . . . . . . . . . . . . . . . . . . . . . . . . . . . . 14
Hash Join Overflow Percentage . . . . . . . . . . . . . . . . . . . . . . . . . . . . . . . . . . . . . . . . . . . . . . . . . . . . . . . . . . . . 14
Catalog Cache Overflows . . . . . . . . . . . . . . . . . . . . . . . . . . . . . . . . . . . . . . . . . . . . . . . . . . . . . . . . . . . . . . . . . 15
Package Cache Overflows . . . . . . . . . . . . . . . . . . . . . . . . . . . . . . . . . . . . . . . . . . . . . . . . . . . . . . . . . . . . . . . . 15
Private Workspace Overflows . . . . . . . . . . . . . . . . . . . . . . . . . . . . . . . . . . . . . . . . . . . . . . . . . . . . . . . . . . . . . . 15
Shared Workspace Overflows. . . . . . . . . . . . . . . . . . . . . . . . . . . . . . . . . . . . . . . . . . . . . . . . . . . . . . . . . . . . . . 16
Lock List Utilization . . . . . . . . . . . . . . . . . . . . . . . . . . . . . . . . . . . . . . . . . . . . . . . . . . . . . . . . . . . . . . . . . . . . . . 16
Package Cache Hit Ratio . . . . . . . . . . . . . . . . . . . . . . . . . . . . . . . . . . . . . . . . . . . . . . . . . . . . . . . . . . . . . . . . . 17
Session Leaders – Memory . . . . . . . . . . . . . . . . . . . . . . . . . . . . . . . . . . . . . . . . . . . . . . . . . . . . . . . . . . . . . . . 17
Sort Heap Utilization . . . . . . . . . . . . . . . . . . . . . . . . . . . . . . . . . . . . . . . . . . . . . . . . . . . . . . . . . . . . . . . . . . . . . 17
Shared Workspace Hit Ratio. . . . . . . . . . . . . . . . . . . . . . . . . . . . . . . . . . . . . . . . . . . . . . . . . . . . . . . . . . . . . . . 18
I/O Page Statistics. . . . . . . . . . . . . . . . . . . . . . . . . . . . . . . . . . . . . . . . . . . . . . . . . . . . . . . . . . . . . . . . . . . . . . . . . . 18
Direct Read Ratio . . . . . . . . . . . . . . . . . . . . . . . . . . . . . . . . . . . . . . . . . . . . . . . . . . . . . . . . . . . . . . . . . . . . . . . 19
Logical Read Ratio . . . . . . . . . . . . . . . . . . . . . . . . . . . . . . . . . . . . . . . . . . . . . . . . . . . . . . . . . . . . . . . . . . . . . . 19
Physical Read Ratio . . . . . . . . . . . . . . . . . . . . . . . . . . . . . . . . . . . . . . . . . . . . . . . . . . . . . . . . . . . . . . . . . . . . . 20
Synchronous Read Ratio . . . . . . . . . . . . . . . . . . . . . . . . . . . . . . . . . . . . . . . . . . . . . . . . . . . . . . . . . . . . . . . . . 20
Asynchronous Read Ratio . . . . . . . . . . . . . . . . . . . . . . . . . . . . . . . . . . . . . . . . . . . . . . . . . . . . . . . . . . . . . . . . 20
Direct Write Ratio . . . . . . . . . . . . . . . . . . . . . . . . . . . . . . . . . . . . . . . . . . . . . . . . . . . . . . . . . . . . . . . . . . . . . . . 20
Synchronous Write Ratio . . . . . . . . . . . . . . . . . . . . . . . . . . . . . . . . . . . . . . . . . . . . . . . . . . . . . . . . . . . . . . . . . 20
Asynchronous Write Ratio. . . . . . . . . . . . . . . . . . . . . . . . . . . . . . . . . . . . . . . . . . . . . . . . . . . . . . . . . . . . . . . . . 20
Log Read Rate . . . . . . . . . . . . . . . . . . . . . . . . . . . . . . . . . . . . . . . . . . . . . . . . . . . . . . . . . . . . . . . . . . . . . . . . . 21
Direct Read Rate. . . . . . . . . . . . . . . . . . . . . . . . . . . . . . . . . . . . . . . . . . . . . . . . . . . . . . . . . . . . . . . . . . . . . . . . 21
Synchronous Read Rate . . . . . . . . . . . . . . . . . . . . . . . . . . . . . . . . . . . . . . . . . . . . . . . . . . . . . . . . . . . . . . . . . . 21
Asynchronous Read Rate . . . . . . . . . . . . . . . . . . . . . . . . . . . . . . . . . . . . . . . . . . . . . . . . . . . . . . . . . . . . . . . . . 21
Log Write Rate . . . . . . . . . . . . . . . . . . . . . . . . . . . . . . . . . . . . . . . . . . . . . . . . . . . . . . . . . . . . . . . . . . . . . . . . . 21
Direct Write Rate. . . . . . . . . . . . . . . . . . . . . . . . . . . . . . . . . . . . . . . . . . . . . . . . . . . . . . . . . . . . . . . . . . . . . . . . 21
Synchronous Write Rate . . . . . . . . . . . . . . . . . . . . . . . . . . . . . . . . . . . . . . . . . . . . . . . . . . . . . . . . . . . . . . . . . . 22
EMBARCADERO TECHNOLOGIES > EMBARCADERO PERFORMANCE CENTER 2.7 EXPERT GUIDE: DB2 3

>
Asynchronous Write Rate . . . . . . . . . . . . . . . . . . . . . . . . . . . . . . . . . . . . . . . . . . . . . . . . . . . . . . . . . . . . . . . . . 22
Prefetchers . . . . . . . . . . . . . . . . . . . . . . . . . . . . . . . . . . . . . . . . . . . . . . . . . . . . . . . . . . . . . . . . . . . . . . . . . . . . 22
Page Cleaners . . . . . . . . . . . . . . . . . . . . . . . . . . . . . . . . . . . . . . . . . . . . . . . . . . . . . . . . . . . . . . . . . . . . . . . . . 22
Log Space Cleans. . . . . . . . . . . . . . . . . . . . . . . . . . . . . . . . . . . . . . . . . . . . . . . . . . . . . . . . . . . . . . . . . . . . . . . 22
Dirty Page Cleans . . . . . . . . . . . . . . . . . . . . . . . . . . . . . . . . . . . . . . . . . . . . . . . . . . . . . . . . . . . . . . . . . . . . . . . 23
Prefetch Wait Time . . . . . . . . . . . . . . . . . . . . . . . . . . . . . . . . . . . . . . . . . . . . . . . . . . . . . . . . . . . . . . . . . . . . . . 23
Buffer Pool Hit Ratio . . . . . . . . . . . . . . . . . . . . . . . . . . . . . . . . . . . . . . . . . . . . . . . . . . . . . . . . . . . . . . . . . . . . . 23
Buffer Pool Index Hit Ratio . . . . . . . . . . . . . . . . . . . . . . . . . . . . . . . . . . . . . . . . . . . . . . . . . . . . . . . . . . . . . . . . 24
Victim Cleans Ratio. . . . . . . . . . . . . . . . . . . . . . . . . . . . . . . . . . . . . . . . . . . . . . . . . . . . . . . . . . . . . . . . . . . . . . 24
Threshold Cleans Ratio. . . . . . . . . . . . . . . . . . . . . . . . . . . . . . . . . . . . . . . . . . . . . . . . . . . . . . . . . . . . . . . . . . . 24
Log Space Cleans Ratio . . . . . . . . . . . . . . . . . . . . . . . . . . . . . . . . . . . . . . . . . . . . . . . . . . . . . . . . . . . . . . . . . . 24
Session Leaders – I/O. . . . . . . . . . . . . . . . . . . . . . . . . . . . . . . . . . . . . . . . . . . . . . . . . . . . . . . . . . . . . . . . . . . . 25
Space Page Statistics . . . . . . . . . . . . . . . . . . . . . . . . . . . . . . . . . . . . . . . . . . . . . . . . . . . . . . . . . . . . . . . . . . . . . . . 25
DMS Space (Total Used and Total Free) . . . . . . . . . . . . . . . . . . . . . . . . . . . . . . . . . . . . . . . . . . . . . . . . . . . . . 26
DMS Utilization . . . . . . . . . . . . . . . . . . . . . . . . . . . . . . . . . . . . . . . . . . . . . . . . . . . . . . . . . . . . . . . . . . . . . . . . . 26
SMS Space (Total Used and Total Free) . . . . . . . . . . . . . . . . . . . . . . . . . . . . . . . . . . . . . . . . . . . . . . . . . . . . . 26
SMS Utilization . . . . . . . . . . . . . . . . . . . . . . . . . . . . . . . . . . . . . . . . . . . . . . . . . . . . . . . . . . . . . . . . . . . . . . . . . 27
Active Log Size . . . . . . . . . . . . . . . . . . . . . . . . . . . . . . . . . . . . . . . . . . . . . . . . . . . . . . . . . . . . . . . . . . . . . . . . . 27
Active Log Used . . . . . . . . . . . . . . . . . . . . . . . . . . . . . . . . . . . . . . . . . . . . . . . . . . . . . . . . . . . . . . . . . . . . . . . . 27
Active Log Free . . . . . . . . . . . . . . . . . . . . . . . . . . . . . . . . . . . . . . . . . . . . . . . . . . . . . . . . . . . . . . . . . . . . . . . . . 27
Active Log Utilization. . . . . . . . . . . . . . . . . . . . . . . . . . . . . . . . . . . . . . . . . . . . . . . . . . . . . . . . . . . . . . . . . . . . . 27
Secondary Logs Allocated . . . . . . . . . . . . . . . . . . . . . . . . . . . . . . . . . . . . . . . . . . . . . . . . . . . . . . . . . . . . . . . . 27
Secondary Log Used HWM. . . . . . . . . . . . . . . . . . . . . . . . . . . . . . . . . . . . . . . . . . . . . . . . . . . . . . . . . . . . . . . . 28
Inaccessible Containers . . . . . . . . . . . . . . . . . . . . . . . . . . . . . . . . . . . . . . . . . . . . . . . . . . . . . . . . . . . . . . . . . . 28
Tablespaces Low on Space . . . . . . . . . . . . . . . . . . . . . . . . . . . . . . . . . . . . . . . . . . . . . . . . . . . . . . . . . . . . . . . 28
Abnormal State Tablespaces . . . . . . . . . . . . . . . . . . . . . . . . . . . . . . . . . . . . . . . . . . . . . . . . . . . . . . . . . . . . . . 29
Tablespace Overview . . . . . . . . . . . . . . . . . . . . . . . . . . . . . . . . . . . . . . . . . . . . . . . . . . . . . . . . . . . . . . . . . . . . 29
Object Page Statistics . . . . . . . . . . . . . . . . . . . . . . . . . . . . . . . . . . . . . . . . . . . . . . . . . . . . . . . . . . . . . . . . . . . . . . . 30
Buffer Pools Tab – Overview . . . . . . . . . . . . . . . . . . . . . . . . . . . . . . . . . . . . . . . . . . . . . . . . . . . . . . . . . . . . . . 30
Buffer Pools Tab – I/O Analysis . . . . . . . . . . . . . . . . . . . . . . . . . . . . . . . . . . . . . . . . . . . . . . . . . . . . . . . . . . . . 30
Tablespaces Tab – Overview . . . . . . . . . . . . . . . . . . . . . . . . . . . . . . . . . . . . . . . . . . . . . . . . . . . . . . . . . . . . . . 31
Tablespaces Tab – I/O Analysis . . . . . . . . . . . . . . . . . . . . . . . . . . . . . . . . . . . . . . . . . . . . . . . . . . . . . . . . . . . . 32
Containers Tab . . . . . . . . . . . . . . . . . . . . . . . . . . . . . . . . . . . . . . . . . . . . . . . . . . . . . . . . . . . . . . . . . . . . . . . . . 33
Tables Tab . . . . . . . . . . . . . . . . . . . . . . . . . . . . . . . . . . . . . . . . . . . . . . . . . . . . . . . . . . . . . . . . . . . . . . . . . . . . 33
Contention Page Statistics . . . . . . . . . . . . . . . . . . . . . . . . . . . . . . . . . . . . . . . . . . . . . . . . . . . . . . . . . . . . . . . . . . . 34
Deadlocks . . . . . . . . . . . . . . . . . . . . . . . . . . . . . . . . . . . . . . . . . . . . . . . . . . . . . . . . . . . . . . . . . . . . . . . . . . . . . 34
Lock Waits. . . . . . . . . . . . . . . . . . . . . . . . . . . . . . . . . . . . . . . . . . . . . . . . . . . . . . . . . . . . . . . . . . . . . . . . . . . . . 35
Lock Timeouts. . . . . . . . . . . . . . . . . . . . . . . . . . . . . . . . . . . . . . . . . . . . . . . . . . . . . . . . . . . . . . . . . . . . . . . . . . 35
Lock Escalations . . . . . . . . . . . . . . . . . . . . . . . . . . . . . . . . . . . . . . . . . . . . . . . . . . . . . . . . . . . . . . . . . . . . . . . . 35
Applications Waiting on Locks . . . . . . . . . . . . . . . . . . . . . . . . . . . . . . . . . . . . . . . . . . . . . . . . . . . . . . . . . . . . . 36
EMBARCADERO TECHNOLOGIES > EMBARCADERO PERFORMANCE CENTER 2.7 EXPERT GUIDE: DB2 4

>
Lock Overview. . . . . . . . . . . . . . . . . . . . . . . . . . . . . . . . . . . . . . . . . . . . . . . . . . . . . . . . . . . . . . . . . . . . . . . . . . 36
Lock List Utilization . . . . . . . . . . . . . . . . . . . . . . . . . . . . . . . . . . . . . . . . . . . . . . . . . . . . . . . . . . . . . . . . . . . . . . 36
Lock Wait Time . . . . . . . . . . . . . . . . . . . . . . . . . . . . . . . . . . . . . . . . . . . . . . . . . . . . . . . . . . . . . . . . . . . . . . . . . 37
Average Lock Wait Time . . . . . . . . . . . . . . . . . . . . . . . . . . . . . . . . . . . . . . . . . . . . . . . . . . . . . . . . . . . . . . . . . . 37
Users Page Statistics . . . . . . . . . . . . . . . . . . . . . . . . . . . . . . . . . . . . . . . . . . . . . . . . . . . . . . . . . . . . . . . . . . . . . . . 38
Connections . . . . . . . . . . . . . . . . . . . . . . . . . . . . . . . . . . . . . . . . . . . . . . . . . . . . . . . . . . . . . . . . . . . . . . . . . . . 38
Connections Idle . . . . . . . . . . . . . . . . . . . . . . . . . . . . . . . . . . . . . . . . . . . . . . . . . . . . . . . . . . . . . . . . . . . . . . . . 39
Connections Active . . . . . . . . . . . . . . . . . . . . . . . . . . . . . . . . . . . . . . . . . . . . . . . . . . . . . . . . . . . . . . . . . . . . . . 39
Connections Waiting . . . . . . . . . . . . . . . . . . . . . . . . . . . . . . . . . . . . . . . . . . . . . . . . . . . . . . . . . . . . . . . . . . . . . 39
Static SQL Statements . . . . . . . . . . . . . . . . . . . . . . . . . . . . . . . . . . . . . . . . . . . . . . . . . . . . . . . . . . . . . . . . . . . 39
Dynamic SQL Statements. . . . . . . . . . . . . . . . . . . . . . . . . . . . . . . . . . . . . . . . . . . . . . . . . . . . . . . . . . . . . . . . . 39
Transactions . . . . . . . . . . . . . . . . . . . . . . . . . . . . . . . . . . . . . . . . . . . . . . . . . . . . . . . . . . . . . . . . . . . . . . . . . . . 40
Transactions Per Second . . . . . . . . . . . . . . . . . . . . . . . . . . . . . . . . . . . . . . . . . . . . . . . . . . . . . . . . . . . . . . . . . 40
Sorts Per Transaction . . . . . . . . . . . . . . . . . . . . . . . . . . . . . . . . . . . . . . . . . . . . . . . . . . . . . . . . . . . . . . . . . . . . 40
Lock Waits Per Transaction . . . . . . . . . . . . . . . . . . . . . . . . . . . . . . . . . . . . . . . . . . . . . . . . . . . . . . . . . . . . . . . 40
Selects Per Transaction . . . . . . . . . . . . . . . . . . . . . . . . . . . . . . . . . . . . . . . . . . . . . . . . . . . . . . . . . . . . . . . . . . 40
Rows Selected Per Transaction . . . . . . . . . . . . . . . . . . . . . . . . . . . . . . . . . . . . . . . . . . . . . . . . . . . . . . . . . . . . 40
Session Leaders – Memory . . . . . . . . . . . . . . . . . . . . . . . . . . . . . . . . . . . . . . . . . . . . . . . . . . . . . . . . . . . . . . . 40
Session Leaders – I/O. . . . . . . . . . . . . . . . . . . . . . . . . . . . . . . . . . . . . . . . . . . . . . . . . . . . . . . . . . . . . . . . . . . . 41
Session Leaders – CPU . . . . . . . . . . . . . . . . . . . . . . . . . . . . . . . . . . . . . . . . . . . . . . . . . . . . . . . . . . . . . . . . . . 41
Max. Connections . . . . . . . . . . . . . . . . . . . . . . . . . . . . . . . . . . . . . . . . . . . . . . . . . . . . . . . . . . . . . . . . . . . . . . . 42
Percent Executing . . . . . . . . . . . . . . . . . . . . . . . . . . . . . . . . . . . . . . . . . . . . . . . . . . . . . . . . . . . . . . . . . . . . . . . 42
Percent of Maximum . . . . . . . . . . . . . . . . . . . . . . . . . . . . . . . . . . . . . . . . . . . . . . . . . . . . . . . . . . . . . . . . . . . . . 42
Users Detail. . . . . . . . . . . . . . . . . . . . . . . . . . . . . . . . . . . . . . . . . . . . . . . . . . . . . . . . . . . . . . . . . . . . . . . . . . . . 42
Overview Tab . . . . . . . . . . . . . . . . . . . . . . . . . . . . . . . . . . . . . . . . . . . . . . . . . . . . . . . . . . . . . . . . . . . . . . . 43
Locking Tab. . . . . . . . . . . . . . . . . . . . . . . . . . . . . . . . . . . . . . . . . . . . . . . . . . . . . . . . . . . . . . . . . . . . . . . . . 43
Sorting Tab . . . . . . . . . . . . . . . . . . . . . . . . . . . . . . . . . . . . . . . . . . . . . . . . . . . . . . . . . . . . . . . . . . . . . . . . . 44
I/O Tab . . . . . . . . . . . . . . . . . . . . . . . . . . . . . . . . . . . . . . . . . . . . . . . . . . . . . . . . . . . . . . . . . . . . . . . . . . . . 44
Memory Tab . . . . . . . . . . . . . . . . . . . . . . . . . . . . . . . . . . . . . . . . . . . . . . . . . . . . . . . . . . . . . . . . . . . . . . . . 45
SQL Activity Tab . . . . . . . . . . . . . . . . . . . . . . . . . . . . . . . . . . . . . . . . . . . . . . . . . . . . . . . . . . . . . . . . . . . . . 46
Instance Page Statistics . . . . . . . . . . . . . . . . . . . . . . . . . . . . . . . . . . . . . . . . . . . . . . . . . . . . . . . . . . . . . . . . . . . . . 47
Sort Heap Utilization . . . . . . . . . . . . . . . . . . . . . . . . . . . . . . . . . . . . . . . . . . . . . . . . . . . . . . . . . . . . . . . . . . . . . 49
Monitor Heap Utilization . . . . . . . . . . . . . . . . . . . . . . . . . . . . . . . . . . . . . . . . . . . . . . . . . . . . . . . . . . . . . . . . . . 49
Sort Heap (MB) . . . . . . . . . . . . . . . . . . . . . . . . . . . . . . . . . . . . . . . . . . . . . . . . . . . . . . . . . . . . . . . . . . . . . . . . . 49
Private Memory (MB) . . . . . . . . . . . . . . . . . . . . . . . . . . . . . . . . . . . . . . . . . . . . . . . . . . . . . . . . . . . . . . . . . . . . 50
Piped Sorts Requested . . . . . . . . . . . . . . . . . . . . . . . . . . . . . . . . . . . . . . . . . . . . . . . . . . . . . . . . . . . . . . . . . . . 50
Piped Sorts Rejected . . . . . . . . . . . . . . . . . . . . . . . . . . . . . . . . . . . . . . . . . . . . . . . . . . . . . . . . . . . . . . . . . . . . 50
Post Threshold Sorts. . . . . . . . . . . . . . . . . . . . . . . . . . . . . . . . . . . . . . . . . . . . . . . . . . . . . . . . . . . . . . . . . . . . . 51
Post Threshold Hash Joins . . . . . . . . . . . . . . . . . . . . . . . . . . . . . . . . . . . . . . . . . . . . . . . . . . . . . . . . . . . . . . . . 51
Buffer Utilization . . . . . . . . . . . . . . . . . . . . . . . . . . . . . . . . . . . . . . . . . . . . . . . . . . . . . . . . . . . . . . . . . . . . . . . . 52
EMBARCADERO TECHNOLOGIES > EMBARCADERO PERFORMANCE CENTER 2.7 EXPERT GUIDE: DB2 5

>
Request Block Utilization . . . . . . . . . . . . . . . . . . . . . . . . . . . . . . . . . . . . . . . . . . . . . . . . . . . . . . . . . . . . . . . . . 52
Message Anchor Utilization. . . . . . . . . . . . . . . . . . . . . . . . . . . . . . . . . . . . . . . . . . . . . . . . . . . . . . . . . . . . . . . . 52
Connection Entry Utilization . . . . . . . . . . . . . . . . . . . . . . . . . . . . . . . . . . . . . . . . . . . . . . . . . . . . . . . . . . . . . . . 52
Instance Identification . . . . . . . . . . . . . . . . . . . . . . . . . . . . . . . . . . . . . . . . . . . . . . . . . . . . . . . . . . . . . . . . . . . . 53
Monitor Switches. . . . . . . . . . . . . . . . . . . . . . . . . . . . . . . . . . . . . . . . . . . . . . . . . . . . . . . . . . . . . . . . . . . . . . . . 53
Idle . . . . . . . . . . . . . . . . . . . . . . . . . . . . . . . . . . . . . . . . . . . . . . . . . . . . . . . . . . . . . . . . . . . . . . . . . . . . . . . . . . 54
Stolen . . . . . . . . . . . . . . . . . . . . . . . . . . . . . . . . . . . . . . . . . . . . . . . . . . . . . . . . . . . . . . . . . . . . . . . . . . . . . . . . 54
Requests . . . . . . . . . . . . . . . . . . . . . . . . . . . . . . . . . . . . . . . . . . . . . . . . . . . . . . . . . . . . . . . . . . . . . . . . . . . . . . 54
Registered. . . . . . . . . . . . . . . . . . . . . . . . . . . . . . . . . . . . . . . . . . . . . . . . . . . . . . . . . . . . . . . . . . . . . . . . . . . . . 54
Request Overflows . . . . . . . . . . . . . . . . . . . . . . . . . . . . . . . . . . . . . . . . . . . . . . . . . . . . . . . . . . . . . . . . . . . . . . 55
Waiting for Tokens . . . . . . . . . . . . . . . . . . . . . . . . . . . . . . . . . . . . . . . . . . . . . . . . . . . . . . . . . . . . . . . . . . . . . . 55
Assigned from Pool . . . . . . . . . . . . . . . . . . . . . . . . . . . . . . . . . . . . . . . . . . . . . . . . . . . . . . . . . . . . . . . . . . . . . . 55
Created Empty Pool . . . . . . . . . . . . . . . . . . . . . . . . . . . . . . . . . . . . . . . . . . . . . . . . . . . . . . . . . . . . . . . . . . . . . 55
Database Configuration . . . . . . . . . . . . . . . . . . . . . . . . . . . . . . . . . . . . . . . . . . . . . . . . . . . . . . . . . . . . . . . . . . 56
Memory Pools . . . . . . . . . . . . . . . . . . . . . . . . . . . . . . . . . . . . . . . . . . . . . . . . . . . . . . . . . . . . . . . . . . . . . . . . . . 56
Memory Pool Utilization . . . . . . . . . . . . . . . . . . . . . . . . . . . . . . . . . . . . . . . . . . . . . . . . . . . . . . . . . . . . . . . . . . 56
Memory Pool Size . . . . . . . . . . . . . . . . . . . . . . . . . . . . . . . . . . . . . . . . . . . . . . . . . . . . . . . . . . . . . . . . . . . . . . . 57
Instance Utilities . . . . . . . . . . . . . . . . . . . . . . . . . . . . . . . . . . . . . . . . . . . . . . . . . . . . . . . . . . . . . . . . . . . . . . . . 57
FCM Throughput . . . . . . . . . . . . . . . . . . . . . . . . . . . . . . . . . . . . . . . . . . . . . . . . . . . . . . . . . . . . . . . . . . . . . . . . 57
FCM Resource Utilization . . . . . . . . . . . . . . . . . . . . . . . . . . . . . . . . . . . . . . . . . . . . . . . . . . . . . . . . . . . . . . . . . 58
Agent Utilization . . . . . . . . . . . . . . . . . . . . . . . . . . . . . . . . . . . . . . . . . . . . . . . . . . . . . . . . . . . . . . . . . . . . . . . . 58
Percent of Agents Stolen . . . . . . . . . . . . . . . . . . . . . . . . . . . . . . . . . . . . . . . . . . . . . . . . . . . . . . . . . . . . . . . . . 58
Other Views and Statistics . . . . . . . . . . . . . . . . . . . . . . . . . . . . . . . . . . . . . . . . . . . . . . . . . . . . . . . . . . . . . . . . . . . . . . 59
Archive View . . . . . . . . . . . . . . . . . . . . . . . . . . . . . . . . . . . . . . . . . . . . . . . . . . . . . . . . . . . . . . . . . . . . . . . . . . . . . . 59
Health Index View . . . . . . . . . . . . . . . . . . . . . . . . . . . . . . . . . . . . . . . . . . . . . . . . . . . . . . . . . . . . . . . . . . . . . . . . . 60
Hot Objects . . . . . . . . . . . . . . . . . . . . . . . . . . . . . . . . . . . . . . . . . . . . . . . . . . . . . . . . . . . . . . . . . . . . . . . . . . . . . . . 60
Hot Tables. . . . . . . . . . . . . . . . . . . . . . . . . . . . . . . . . . . . . . . . . . . . . . . . . . . . . . . . . . . . . . . . . . . . . . . . . . . . . 60
Hot Code . . . . . . . . . . . . . . . . . . . . . . . . . . . . . . . . . . . . . . . . . . . . . . . . . . . . . . . . . . . . . . . . . . . . . . . . . . . . . . 61
Lock View . . . . . . . . . . . . . . . . . . . . . . . . . . . . . . . . . . . . . . . . . . . . . . . . . . . . . . . . . . . . . . . . . . . . . . . . . . . . . . . . 61
All Locks Tab. . . . . . . . . . . . . . . . . . . . . . . . . . . . . . . . . . . . . . . . . . . . . . . . . . . . . . . . . . . . . . . . . . . . . . . . . . . 62
All Locks Tab for Oracle . . . . . . . . . . . . . . . . . . . . . . . . . . . . . . . . . . . . . . . . . . . . . . . . . . . . . . . . . . . . . . . 62
All Locks Tab for SQL Server . . . . . . . . . . . . . . . . . . . . . . . . . . . . . . . . . . . . . . . . . . . . . . . . . . . . . . . . . . . 62
All Locks Tab for Sybase. . . . . . . . . . . . . . . . . . . . . . . . . . . . . . . . . . . . . . . . . . . . . . . . . . . . . . . . . . . . . . . 63
All User Locks Tab . . . . . . . . . . . . . . . . . . . . . . . . . . . . . . . . . . . . . . . . . . . . . . . . . . . . . . . . . . . . . . . . . . . . . . 64
Blocking Locks Tab . . . . . . . . . . . . . . . . . . . . . . . . . . . . . . . . . . . . . . . . . . . . . . . . . . . . . . . . . . . . . . . . . . . . . . 65
Blocking Locks Tab for Oracle . . . . . . . . . . . . . . . . . . . . . . . . . . . . . . . . . . . . . . . . . . . . . . . . . . . . . . . . . . 65
Blocking Locks Tab for SQL Server . . . . . . . . . . . . . . . . . . . . . . . . . . . . . . . . . . . . . . . . . . . . . . . . . . . . . . 66
Blocking Locks Tab for Sybase . . . . . . . . . . . . . . . . . . . . . . . . . . . . . . . . . . . . . . . . . . . . . . . . . . . . . . . . . . 67
Locks View for DB2. . . . . . . . . . . . . . . . . . . . . . . . . . . . . . . . . . . . . . . . . . . . . . . . . . . . . . . . . . . . . . . . . . . . . . 68
Applications . . . . . . . . . . . . . . . . . . . . . . . . . . . . . . . . . . . . . . . . . . . . . . . . . . . . . . . . . . . . . . . . . . . . . . . . . 69
EMBARCADERO TECHNOLOGIES > EMBARCADERO PERFORMANCE CENTER 2.7 EXPERT GUIDE: DB2 6

>
Locks Held Tab . . . . . . . . . . . . . . . . . . . . . . . . . . . . . . . . . . . . . . . . . . . . . . . . . . . . . . . . . . . . . . . . . . . . . . 69
Locks Waiting Tab. . . . . . . . . . . . . . . . . . . . . . . . . . . . . . . . . . . . . . . . . . . . . . . . . . . . . . . . . . . . . . . . . . . . 69
Unit of Work Tab . . . . . . . . . . . . . . . . . . . . . . . . . . . . . . . . . . . . . . . . . . . . . . . . . . . . . . . . . . . . . . . . . . . . . 70
Operating System View . . . . . . . . . . . . . . . . . . . . . . . . . . . . . . . . . . . . . . . . . . . . . . . . . . . . . . . . . . . . . . . . . . . . . 70
OS Page Statistics . . . . . . . . . . . . . . . . . . . . . . . . . . . . . . . . . . . . . . . . . . . . . . . . . . . . . . . . . . . . . . . . . . . . . . . . . 71
Summary Tab . . . . . . . . . . . . . . . . . . . . . . . . . . . . . . . . . . . . . . . . . . . . . . . . . . . . . . . . . . . . . . . . . . . . . . . . . . 72
Processor Time . . . . . . . . . . . . . . . . . . . . . . . . . . . . . . . . . . . . . . . . . . . . . . . . . . . . . . . . . . . . . . . . . . . . . . . . . 72
Processor Speed. . . . . . . . . . . . . . . . . . . . . . . . . . . . . . . . . . . . . . . . . . . . . . . . . . . . . . . . . . . . . . . . . . . . . . . . 73
Processor . . . . . . . . . . . . . . . . . . . . . . . . . . . . . . . . . . . . . . . . . . . . . . . . . . . . . . . . . . . . . . . . . . . . . . . . . . . . . 73
Disk Time . . . . . . . . . . . . . . . . . . . . . . . . . . . . . . . . . . . . . . . . . . . . . . . . . . . . . . . . . . . . . . . . . . . . . . . . . . . . . 73
Load Average . . . . . . . . . . . . . . . . . . . . . . . . . . . . . . . . . . . . . . . . . . . . . . . . . . . . . . . . . . . . . . . . . . . . . . . . . . 73
Paged Memory Used . . . . . . . . . . . . . . . . . . . . . . . . . . . . . . . . . . . . . . . . . . . . . . . . . . . . . . . . . . . . . . . . . . . . 73
Number of Processors . . . . . . . . . . . . . . . . . . . . . . . . . . . . . . . . . . . . . . . . . . . . . . . . . . . . . . . . . . . . . . . . . . . 74
Swap Memory Used . . . . . . . . . . . . . . . . . . . . . . . . . . . . . . . . . . . . . . . . . . . . . . . . . . . . . . . . . . . . . . . . . . . . . 74
Average Disk Queue. . . . . . . . . . . . . . . . . . . . . . . . . . . . . . . . . . . . . . . . . . . . . . . . . . . . . . . . . . . . . . . . . . . . . 74
Page Faults/Sec . . . . . . . . . . . . . . . . . . . . . . . . . . . . . . . . . . . . . . . . . . . . . . . . . . . . . . . . . . . . . . . . . . . . . . . . 74
Processor Queue . . . . . . . . . . . . . . . . . . . . . . . . . . . . . . . . . . . . . . . . . . . . . . . . . . . . . . . . . . . . . . . . . . . . . . . 75
Network Output Queue/Network Queue . . . . . . . . . . . . . . . . . . . . . . . . . . . . . . . . . . . . . . . . . . . . . . . . . . . . . . 75
Available Physical Memory . . . . . . . . . . . . . . . . . . . . . . . . . . . . . . . . . . . . . . . . . . . . . . . . . . . . . . . . . . . . . . . . 75
Available Paged Memory . . . . . . . . . . . . . . . . . . . . . . . . . . . . . . . . . . . . . . . . . . . . . . . . . . . . . . . . . . . . . . . . . 76
Available Swap Memory . . . . . . . . . . . . . . . . . . . . . . . . . . . . . . . . . . . . . . . . . . . . . . . . . . . . . . . . . . . . . . . . . . 76
Total Physical Memory . . . . . . . . . . . . . . . . . . . . . . . . . . . . . . . . . . . . . . . . . . . . . . . . . . . . . . . . . . . . . . . . . . . 76
Total Paged Memory/Total Swap Memory . . . . . . . . . . . . . . . . . . . . . . . . . . . . . . . . . . . . . . . . . . . . . . . . . . . . 76
Used Disk Space. . . . . . . . . . . . . . . . . . . . . . . . . . . . . . . . . . . . . . . . . . . . . . . . . . . . . . . . . . . . . . . . . . . . . . . . 77
Total Disk Space . . . . . . . . . . . . . . . . . . . . . . . . . . . . . . . . . . . . . . . . . . . . . . . . . . . . . . . . . . . . . . . . . . . . . . . . 77
Free Disk Space . . . . . . . . . . . . . . . . . . . . . . . . . . . . . . . . . . . . . . . . . . . . . . . . . . . . . . . . . . . . . . . . . . . . . . . . 77
Top Memory Process . . . . . . . . . . . . . . . . . . . . . . . . . . . . . . . . . . . . . . . . . . . . . . . . . . . . . . . . . . . . . . . . . 77
Processes Overview . . . . . . . . . . . . . . . . . . . . . . . . . . . . . . . . . . . . . . . . . . . . . . . . . . . . . . . . . . . . . . . . . . . . . 78
Top CPU Process . . . . . . . . . . . . . . . . . . . . . . . . . . . . . . . . . . . . . . . . . . . . . . . . . . . . . . . . . . . . . . . . . . . . 78
Top I/O Process . . . . . . . . . . . . . . . . . . . . . . . . . . . . . . . . . . . . . . . . . . . . . . . . . . . . . . . . . . . . . . . . . . . . . 78
Number of Logins . . . . . . . . . . . . . . . . . . . . . . . . . . . . . . . . . . . . . . . . . . . . . . . . . . . . . . . . . . . . . . . . . . . . . . . 78
Number of Processes . . . . . . . . . . . . . . . . . . . . . . . . . . . . . . . . . . . . . . . . . . . . . . . . . . . . . . . . . . . . . . . . . . . . 78
CPU Tab . . . . . . . . . . . . . . . . . . . . . . . . . . . . . . . . . . . . . . . . . . . . . . . . . . . . . . . . . . . . . . . . . . . . . . . . . . . 78
CPU Utilization . . . . . . . . . . . . . . . . . . . . . . . . . . . . . . . . . . . . . . . . . . . . . . . . . . . . . . . . . . . . . . . . . . . 79
% Privileged Time . . . . . . . . . . . . . . . . . . . . . . . . . . . . . . . . . . . . . . . . . . . . . . . . . . . . . . . . . . . . . . 79
% User Time . . . . . . . . . . . . . . . . . . . . . . . . . . . . . . . . . . . . . . . . . . . . . . . . . . . . . . . . . . . . . . . . . . 79
Interrupts/Sec . . . . . . . . . . . . . . . . . . . . . . . . . . . . . . . . . . . . . . . . . . . . . . . . . . . . . . . . . . . . . . . . . 79
Context Switches/Sec . . . . . . . . . . . . . . . . . . . . . . . . . . . . . . . . . . . . . . . . . . . . . . . . . . . . . . . . . . . 80
Processor Queue Length. . . . . . . . . . . . . . . . . . . . . . . . . . . . . . . . . . . . . . . . . . . . . . . . . . . . . . . . . . . . 80
Processes Tab . . . . . . . . . . . . . . . . . . . . . . . . . . . . . . . . . . . . . . . . . . . . . . . . . . . . . . . . . . . . . . . . . . . . . . 80
EMBARCADERO TECHNOLOGIES > EMBARCADERO PERFORMANCE CENTER 2.7 EXPERT GUIDE: DB2 7

>
I/O Tab . . . . . . . . . . . . . . . . . . . . . . . . . . . . . . . . . . . . . . . . . . . . . . . . . . . . . . . . . . . . . . . . . . . . . . . . . . . . 81
Memory Tab . . . . . . . . . . . . . . . . . . . . . . . . . . . . . . . . . . . . . . . . . . . . . . . . . . . . . . . . . . . . . . . . . . . . . . . . 82
Paging Activity . . . . . . . . . . . . . . . . . . . . . . . . . . . . . . . . . . . . . . . . . . . . . . . . . . . . . . . . . . . . . . . . . . . . 82
Pages Input/Sec . . . . . . . . . . . . . . . . . . . . . . . . . . . . . . . . . . . . . . . . . . . . . . . . . . . . . . . . . . . . . . . 82
Pages Output/Sec . . . . . . . . . . . . . . . . . . . . . . . . . . . . . . . . . . . . . . . . . . . . . . . . . . . . . . . . . . . . . . 82
Free Physical . . . . . . . . . . . . . . . . . . . . . . . . . . . . . . . . . . . . . . . . . . . . . . . . . . . . . . . . . . . . . . . . . . 83
Free Paged . . . . . . . . . . . . . . . . . . . . . . . . . . . . . . . . . . . . . . . . . . . . . . . . . . . . . . . . . . . . . . . . . . . 83
Total Physical . . . . . . . . . . . . . . . . . . . . . . . . . . . . . . . . . . . . . . . . . . . . . . . . . . . . . . . . . . . . . . . . . 83
Total Paged . . . . . . . . . . . . . . . . . . . . . . . . . . . . . . . . . . . . . . . . . . . . . . . . . . . . . . . . . . . . . . . . . . . 83
Page Faults/Sec . . . . . . . . . . . . . . . . . . . . . . . . . . . . . . . . . . . . . . . . . . . . . . . . . . . . . . . . . . . . . . . 83
Cache Efficiency . . . . . . . . . . . . . . . . . . . . . . . . . . . . . . . . . . . . . . . . . . . . . . . . . . . . . . . . . . . . . . . . . . 84
Copy Read Hits % . . . . . . . . . . . . . . . . . . . . . . . . . . . . . . . . . . . . . . . . . . . . . . . . . . . . . . . . . . . . . . 84
Data Map Hits % . . . . . . . . . . . . . . . . . . . . . . . . . . . . . . . . . . . . . . . . . . . . . . . . . . . . . . . . . . . . . . . 84
MDL Read Hits % . . . . . . . . . . . . . . . . . . . . . . . . . . . . . . . . . . . . . . . . . . . . . . . . . . . . . . . . . . . . . . 84
Pin Read Hits %. . . . . . . . . . . . . . . . . . . . . . . . . . . . . . . . . . . . . . . . . . . . . . . . . . . . . . . . . . . . . . . . 85
Space Tab . . . . . . . . . . . . . . . . . . . . . . . . . . . . . . . . . . . . . . . . . . . . . . . . . . . . . . . . . . . . . . . . . . . . . . . . . . 85
Disk Space Free . . . . . . . . . . . . . . . . . . . . . . . . . . . . . . . . . . . . . . . . . . . . . . . . . . . . . . . . . . . . . . . . . . 85
Disk Space Detail . . . . . . . . . . . . . . . . . . . . . . . . . . . . . . . . . . . . . . . . . . . . . . . . . . . . . . . . . . . . . . . . . 85
Network Tab . . . . . . . . . . . . . . . . . . . . . . . . . . . . . . . . . . . . . . . . . . . . . . . . . . . . . . . . . . . . . . . . . . . . . . . . 86
Session Detail View . . . . . . . . . . . . . . . . . . . . . . . . . . . . . . . . . . . . . . . . . . . . . . . . . . . . . . . . . . . . . . . . . . . . . . . . 86
Oracle Session Detail View. . . . . . . . . . . . . . . . . . . . . . . . . . . . . . . . . . . . . . . . . . . . . . . . . . . . . . . . . . . . . . . . 86
Session Memory Tab for Oracle . . . . . . . . . . . . . . . . . . . . . . . . . . . . . . . . . . . . . . . . . . . . . . . . . . . . . . . . . 87
Session I/O Tab for Oracle . . . . . . . . . . . . . . . . . . . . . . . . . . . . . . . . . . . . . . . . . . . . . . . . . . . . . . . . . . . . . 87
Session Contention Tab for Oracle . . . . . . . . . . . . . . . . . . . . . . . . . . . . . . . . . . . . . . . . . . . . . . . . . . . . . . . 87
Session Objects Tab for Oracle . . . . . . . . . . . . . . . . . . . . . . . . . . . . . . . . . . . . . . . . . . . . . . . . . . . . . . . . . 88
Session Network Tab for Oracle . . . . . . . . . . . . . . . . . . . . . . . . . . . . . . . . . . . . . . . . . . . . . . . . . . . . . . . . . 89
Session SQL Tab for Oracle . . . . . . . . . . . . . . . . . . . . . . . . . . . . . . . . . . . . . . . . . . . . . . . . . . . . . . . . . . . . 89
Session Statistics Tab for Oracle . . . . . . . . . . . . . . . . . . . . . . . . . . . . . . . . . . . . . . . . . . . . . . . . . . . . . . . . 89
SQL Server Session Detail View. . . . . . . . . . . . . . . . . . . . . . . . . . . . . . . . . . . . . . . . . . . . . . . . . . . . . . . . . . . . 90
Overview Tab for SQL Server . . . . . . . . . . . . . . . . . . . . . . . . . . . . . . . . . . . . . . . . . . . . . . . . . . . . . . . . . . . 90
SQL Tab for SQL Server . . . . . . . . . . . . . . . . . . . . . . . . . . . . . . . . . . . . . . . . . . . . . . . . . . . . . . . . . . . . . . . 92
Blocked By Tab for SQL Server . . . . . . . . . . . . . . . . . . . . . . . . . . . . . . . . . . . . . . . . . . . . . . . . . . . . . . . . . 92
Blocking Tab for SQL Server. . . . . . . . . . . . . . . . . . . . . . . . . . . . . . . . . . . . . . . . . . . . . . . . . . . . . . . . . . . . 94
All Locks Tab for SQL Server . . . . . . . . . . . . . . . . . . . . . . . . . . . . . . . . . . . . . . . . . . . . . . . . . . . . . . . . . . . 95
Sybase Session Detail View . . . . . . . . . . . . . . . . . . . . . . . . . . . . . . . . . . . . . . . . . . . . . . . . . . . . . . . . . . . . . . . 96
Overview Tab for Sybase . . . . . . . . . . . . . . . . . . . . . . . . . . . . . . . . . . . . . . . . . . . . . . . . . . . . . . . . . . . . . . 96
SQL Tab for Sybase . . . . . . . . . . . . . . . . . . . . . . . . . . . . . . . . . . . . . . . . . . . . . . . . . . . . . . . . . . . . . . . . . . 97
Blocked By Tab for Sybase . . . . . . . . . . . . . . . . . . . . . . . . . . . . . . . . . . . . . . . . . . . . . . . . . . . . . . . . . . . . . 98
Blocking Tab for Sybase . . . . . . . . . . . . . . . . . . . . . . . . . . . . . . . . . . . . . . . . . . . . . . . . . . . . . . . . . . . . . . . 98
All Locks Tab for Sybase. . . . . . . . . . . . . . . . . . . . . . . . . . . . . . . . . . . . . . . . . . . . . . . . . . . . . . . . . . . . . . . 99
EMBARCADERO TECHNOLOGIES > EMBARCADERO PERFORMANCE CENTER 2.7 EXPERT GUIDE: DB2 8

>
DB2 Session Detail View . . . . . . . . . . . . . . . . . . . . . . . . . . . . . . . . . . . . . . . . . . . . . . . . . . . . . . . . . . . . . . . . 100
Application Tab for DB2 . . . . . . . . . . . . . . . . . . . . . . . . . . . . . . . . . . . . . . . . . . . . . . . . . . . . . . . . . . . . . . 101
Unit of Work Tab for DB2 . . . . . . . . . . . . . . . . . . . . . . . . . . . . . . . . . . . . . . . . . . . . . . . . . . . . . . . . . . . . . 102
Locking Tab for DB2 . . . . . . . . . . . . . . . . . . . . . . . . . . . . . . . . . . . . . . . . . . . . . . . . . . . . . . . . . . . . . . . . . 104
Memory Tab for DB2 . . . . . . . . . . . . . . . . . . . . . . . . . . . . . . . . . . . . . . . . . . . . . . . . . . . . . . . . . . . . . . . . . 105
I/O Tab for DB2 . . . . . . . . . . . . . . . . . . . . . . . . . . . . . . . . . . . . . . . . . . . . . . . . . . . . . . . . . . . . . . . . . . . . . 106
SQL Statistics Tab for DB2 . . . . . . . . . . . . . . . . . . . . . . . . . . . . . . . . . . . . . . . . . . . . . . . . . . . . . . . . . . . . 108
Top Sessions View . . . . . . . . . . . . . . . . . . . . . . . . . . . . . . . . . . . . . . . . . . . . . . . . . . . . . . . . . . . . . . . . . . . . . . . . 109
Memory Tab . . . . . . . . . . . . . . . . . . . . . . . . . . . . . . . . . . . . . . . . . . . . . . . . . . . . . . . . . . . . . . . . . . . . . . . . . . 109
Memory Tab for Oracle . . . . . . . . . . . . . . . . . . . . . . . . . . . . . . . . . . . . . . . . . . . . . . . . . . . . . . . . . . . . . . . 110
Memory Tab for SQL Server . . . . . . . . . . . . . . . . . . . . . . . . . . . . . . . . . . . . . . . . . . . . . . . . . . . . . . . . . . . 110
Memory Tab for Sybase . . . . . . . . . . . . . . . . . . . . . . . . . . . . . . . . . . . . . . . . . . . . . . . . . . . . . . . . . . . . . . 111
Memory Tab for DB2 . . . . . . . . . . . . . . . . . . . . . . . . . . . . . . . . . . . . . . . . . . . . . . . . . . . . . . . . . . . . . . . . . 112
I/O Tab . . . . . . . . . . . . . . . . . . . . . . . . . . . . . . . . . . . . . . . . . . . . . . . . . . . . . . . . . . . . . . . . . . . . . . . . . . . . . . 113
I/O Tab for Oracle . . . . . . . . . . . . . . . . . . . . . . . . . . . . . . . . . . . . . . . . . . . . . . . . . . . . . . . . . . . . . . . . . . . 113
I/O Tab for SQL Server . . . . . . . . . . . . . . . . . . . . . . . . . . . . . . . . . . . . . . . . . . . . . . . . . . . . . . . . . . . . . . . 114
I/O Tab for Sybase . . . . . . . . . . . . . . . . . . . . . . . . . . . . . . . . . . . . . . . . . . . . . . . . . . . . . . . . . . . . . . . . . . 115
I/O Tab for DB2 . . . . . . . . . . . . . . . . . . . . . . . . . . . . . . . . . . . . . . . . . . . . . . . . . . . . . . . . . . . . . . . . . . . . . 116
CPU Tab . . . . . . . . . . . . . . . . . . . . . . . . . . . . . . . . . . . . . . . . . . . . . . . . . . . . . . . . . . . . . . . . . . . . . . . . . . . . . 117
CPU Tab for Oracle. . . . . . . . . . . . . . . . . . . . . . . . . . . . . . . . . . . . . . . . . . . . . . . . . . . . . . . . . . . . . . . . . . 118
CPU Tab for SQL Server. . . . . . . . . . . . . . . . . . . . . . . . . . . . . . . . . . . . . . . . . . . . . . . . . . . . . . . . . . . . . . 118
CPU Tab for Sybase . . . . . . . . . . . . . . . . . . . . . . . . . . . . . . . . . . . . . . . . . . . . . . . . . . . . . . . . . . . . . . . . . 118
CPU Tab for DB2 . . . . . . . . . . . . . . . . . . . . . . . . . . . . . . . . . . . . . . . . . . . . . . . . . . . . . . . . . . . . . . . . . . . 119
Top SQL View . . . . . . . . . . . . . . . . . . . . . . . . . . . . . . . . . . . . . . . . . . . . . . . . . . . . . . . . . . . . . . . . . . . . . . . . . . . . 119
EMBARCADERO TECHNOLOGIES > EMBARCADERO PERFORMANCE CENTER 2.7 EXPERT GUIDE: DB2 9

DB2 Expert GuideThis section includes expert help for all DB2 UDB LUW categories and statistics in the Performance Center views and pages. For detailed information on using the application, see Using Performance Center. This help is divided into the following sections:
• Home View Statistics
• Memory Page Statistics
• Object Page Statistics
• Contention Page Statistics
• I/O Page Statistics
• Users Page Statistics
• Space Page Statistics
• Instance Page Statistics
Home View StatisticsIn the Performance Center Home view you can review availability and overall performance of all monitored databases from a single window. Statistics on the Home view are organized into the following categories:
• Memory Vital Signs
• Contention Vital Signs
• I/O Vital Signs
• Users Vital Signs
• Space Vital Signs
• Instance Vital Signs
Memory Vital SignsThe following memory statistics are on the DB2 Home view:
• Buffer Pool Hit Ratio
• Catalog Cache Hit Ratio
• Package Cache Overflows
• Shared Workspace Hit Ratio
NOTE: For the complete set of available memory statistics, see Memory Page Statistics.
Contention Vital SignsThe following contention statistics are on the DB2 Home view:
EMBARCADERO TECHNOLOGIES > EMBARCADERO PERFORMANCE CENTER 2.7 EXPERT GUIDE: DB2 10

DB2 EXPERT GUIDE > HOME VIEW STATISTICS
• Deadlocks
• Lock Timeouts
• Lock Escalations
• Applications Waiting on Locks
NOTE: For the complete set of available Contention statistics, see Contention Page Statistics.
I/O Vital SignsThe following I/O statistics are located on the DB2 Home view:
• Logical Read Ratio
• Physical Read Ratio
• Synchronous Read Ratio
• Asynchronous Read Ratio
NOTE: For the complete set of available I/O statistics, see I/O Page Statistics.
Users Vital SignsThe following users statistics are located on the DB2 Home view:
• Connections
• Max. Connections
• Percent Executing
• Percent of Maximum
NOTE: For the complete set of available Users statistics, see Users Page Statistics.
Space Vital SignsThe following space statistics are located on the DB2 Home view:
• DMS Utilization
• SMS Utilization
• Active Log Utilization
• Tablespaces Low on Space
NOTE: For the complete set of available Space statistics, see Space Page Statistics.
Instance Vital SignsThe following instance statistics are located on the DB2 Instance view:
• Agent Utilization
EMBARCADERO TECHNOLOGIES > EMBARCADERO PERFORMANCE CENTER 2.7 EXPERT GUIDE: DB2 11

DB2 EXPERT GUIDE > MEMORY PAGE STATISTICS
• Sort Heap Utilization
• Percent of Agents Stolen
• Waiting for Tokens
NOTE: For the complete set of available Instance statistics, see Instance Page Statistics.
Memory Page StatisticsThe Memory view includes the following statistics:
• Buffer Pool Hit Ratio
• Buffer Pool Index Hit Ratio
• Database Heap Utilization
• Catalog Cache Hit Ratio
• Memory Overflows
• Sort Overflow Percentage
• Hash Join Overflow Percentage
• Catalog Cache Overflows
• Package Cache Overflows
• Private Workspace Overflows
• Shared Workspace Overflows
• Lock List Utilization
• Package Cache Hit Ratio
• Session Leaders – Memory
• Sort Heap Utilization
• Shared Workspace Hit Ratio
Buffer Pool Hit RatioThe DB2 database server reads and updates all data from a bufferpool because memory access is much faster than disk access. Data is copied from disk to a bufferpool as needed by the applications using the database. When the server needs to read/write data and the data is already in the bufferpool, no disk access is required. However, if the data is not in the bufferpool, it needs to be read from the disk, which is a significantly slower process.
The buffer pool hit ratio indicates the percentage of time that the database server did not need to load a page to service the request for a page. The calculation takes into account all the index and data pages that were requested.
MetricsAvoiding disk I/O is the main issue when you try to improve the performance tuning. A high buffer pool hit ratio is desirable because it indicates a lower frequency of synchronous disk I/O. A database where data is accessed uniformly from very large tables will have a poor hit ratio. There is little you can do to improve the performance in such cases.
EMBARCADERO TECHNOLOGIES > EMBARCADERO PERFORMANCE CENTER 2.7 EXPERT GUIDE: DB2 12

DB2 EXPERT GUIDE > MEMORY PAGE STATISTICS
TroubleshootingThe buffer pool hit ratio on the database Home page is the overall hit ratio of the database. First, drill down to the bufferpool level and check the individual buffer pool hit ratios to identify the elements that may require tuning. Increasing the bufferpool size generally improves the bugger pool hit ratio. You can use one of the following methods to increase the bufferpool size depending on the layout of the data.
1 If the tablespaces using the bufferpool have tables and indexes on them, increase the bufferpool size incrementally until the index page hit ratio stops increasing for that bufferpool. You will not usually get any benefit increasing the bufferpool size after you reach that point.
2 If the tablespaces associated with the bufferpool have only indexes on them, increase the bufferpool size until the index page hit ratio stops increasing.
3 If the tablespaces associated with the bufferpool have only data on them, increase the bufferpool size until the data page hit ratio stops increasing.
One general design guideline is to try and use different tablespaces for indexes and tables and associate different bufferpools with them. This generally improves performance and makes bufferpool tuning much easier.
Buffer Pool Index Hit RatioThe buffer pool index hit ratio is calculated by separating the pages and indexes that are cached by the buffer pool:(1 - ((pool_index_p_reads) / (pool_index_I_reads)))*100%.
TroubleshootingBy tuning the buffer pool index hit ratio separately, you may be able to improve the buffer pool hit ratio.
Database Heap UtilizationThere is one database heap per database, and the database manager uses it on behalf of all applications connected to the database. The database heap utilization is the percentage of database heap that is currently being used.
MetricsThe database heap contains control block information for tables, indexes, table spaces, and bufferpools. It also contains space for event monitor buffers, the log buffer, and temporary memory used by utilities. Thus, the heap utilization can increase or decrease whenever any of the constituent elements change. If the utilization goes above 85% several times or stays above 85% for a sustained period, it may mean that you need to increase the maximum database heap size.
TroubleshootingThe dbheap database configuration parameter determines the maximum amount of heap memory that can be allocated. Examine the individual memory pools and how they are using the memory before increasing this parameter. An excessively large use of one of the memory pools may cause this problem.
Catalog Cache Hit RatioCatalog cache is used to cache the following types of catalog information:
• Metadata for tables, views, and aliases.
• Database authorization information that is used to check authorization when performing operations like CONNECT, LOAD, CREATE, BIND, and so on.
EMBARCADERO TECHNOLOGIES > EMBARCADERO PERFORMANCE CENTER 2.7 EXPERT GUIDE: DB2 13
DB2 EXPERT GUIDE > MEMORY PAGE STATISTICS
• Execute privileges for user-defined functions and stored procedures.
When a database operation accesses catalog information, it inserts this information into the catalog cache so operations accessing the same information can read it from the cache and avoid disk reads.
The catalog cache hit ratio indicates how well the catalog cache avoids accesses to the catalog.
MetricsA high catalog cache hit ratio (> 80%) is desirable and it indicates that the catalog cache is working well. A smaller ratio can indicate that this parameter needs tuning. You may see a smaller ratio immediately following the first connection to the database and execution of DDL/DCL statements since these require heavy catalog accesses.
TroubleshootingIf the catalog cache hit ratio is consistently small, the database configuration parameter catalogcache_sz should be increased. When you increase the value of this parameter, pause to consider whether it would be more effective to allocate the extra memory you are reserving to another purpose such as package cache or bufferpools.
In a partitioned database environment, make the catalog cache_sz larger on the catalog partition than on other partitions because the catalog information required for all partitions will go through this partition.
When tuning this parameter, it is advisable to monitor changes to the database catalog via DDL statements. During the execution of DDL statements, there may be a large drop in the catalog cache hit ratio due to invalidation of the cached data.
Sort Overflow PercentageThe sort overflows statistic is the total number of sorts that ran out of sort heap and that may have required disk space for temporary storage. Sort Overflow Percentage is the percentage of sorts that need more heap space.
MetricsWhen a sort overflows, additional overhead is incurred. The sort requires a merge phase and can potentially require more I/O if data needs to be written to disk.
TroubleshootingSort overflows can be reduced by increasing the sortheap database configuration parameter.
Hash Join Overflow PercentageHash join is an option for the DB2 optimizer. A hash join compares the hash codes before comparing the predicates for tables involved in a join. This reduces the number of comparisons. The hash join overflows percentage metric gives the percentage of all hash join operations that ran out of sort heap and may have required disk space for temporary storage since the current instance of Performance Analyst started monitoring the database.
MetricsAn overflowing hash join incurs a large overhead because of the amount of disk I/O required to complete the operation. If this value crosses the 30% mark, the DBA should take action.
TroubleshootingIncrease the sortheap database configuration parameter to reduce the number of overflows.
EMBARCADERO TECHNOLOGIES > EMBARCADERO PERFORMANCE CENTER 2.7 EXPERT GUIDE: DB2 14

DB2 EXPERT GUIDE > MEMORY PAGE STATISTICS
Catalog Cache OverflowsThe catalog cache overflow statistic is the number of times the catalog cache overflowed the bounds of its allocated memory.
MetricsCatalog cache overflows can cause unnecessary lock escalations. This can result in loss of concurrency, or ‘out of memory’ errors from other heaps allocated to the database’s shared memory. Overflows of the catalog cache can also cause performance degradation.
DB2 reclaims the catalog cache space by evicting table descriptor information for tables, views, or aliases and/or authorization information that is not currently being used by any transaction.
TroubleshootingUse this element with the catalog cache high watermark to determine whether the size of the catalog cache needs to be increased to avoid overflowing.
If the number of overflows is large, the catalog cache may be too small for the workload. Enlarging the catalog cache can improve its performance. If the workload includes transactions that compile a large number of SQL statements referencing many tables, views, aliases, user-defined functions, or stored procedures in a single unit of work, then compiling fewer SQL statements in a single transaction can improve the performance of the catalog cache. Or, if the workload includes binding packages that contain many SQL statements referencing many tables, views, aliases, user-defined functions, or stored procedures, you can try splitting packages so that they include fewer SQL statements to improve performance.
Package Cache OverflowsThe package cache overflows metric is the number of times that the package cache overflowed the bounds of its allocated memory.
MetricsPackage cache overflows can cause unnecessary lock escalations. This can result in loss of concurrency, or ‘out of memory’ errors from other heaps allocated to the database’s shared memory. Overflows of the package cache can also cause performance degradation.
TroubleshootingUse this element with the package cache high watermark to determine whether the size of the package cache needs to be increased to avoid overflowing.
Private Workspace OverflowsThe private workspace overflows statistic is the number of times that private workspaces overflowed the bounds of their allocated memory.
MetricsPrivate workspace overflows can cause performance degradation as well as ‘out of memory’ errors from other heaps allocated to the agent’s private memory.
TroubleshootingUse this element with the private workspace high watermark to determine whether the size of the private workspace needs to be increased to avoid overflowing.
EMBARCADERO TECHNOLOGIES > EMBARCADERO PERFORMANCE CENTER 2.7 EXPERT GUIDE: DB2 15
DB2 EXPERT GUIDE > MEMORY PAGE STATISTICS
Shared Workspace OverflowsThe shared workspace overflows metric is the number of times that shared workspaces overflowed the bounds of their allocated memory.
MetricsOverflows of shared workspaces can cause performance degradation. Overflows can also ‘out of memory’ errors from the other heaps allocated out of application’s shared memory.
TroubleshootingUse this element with the shared workspace high watermark to determine whether the size of the shared workspaces need to be increased to avoid overflowing.
Lock List UtilizationLock list utilization is the percentage of total database memory allocated for locks that is currently being used.
MetricsThere is only one lock list for each database and it contains the locks held by all applications connected to the database. Once the lock list is full, the database manager starts escalating row locks to table locks to free up space. This escalation may result in serious performance degradation because of reduced concurrency. Additionally, the number of deadlocks and transaction rollbacks may go up.
If this metric reaches the 75% mark, you should consider bringing this percentage down with tuning.
TroubleshootingDepending on the database’s activity level, you may be able to reduce the lock utilization by following these recommendations:
Increase size of lock list: If there is not enough lock list space available, lock escalations will occur, thereby increasing contention and reducing concurrency. Update the locklist database configuration parameter to increase this value.
Tune applications to reduce locking: On the Locks tab of the Users detail section, identify the applications that are holding many locks and then consider the following steps for controlling the size of the lock list:
• Make the transactions shorter by increasing the COMMIT frequency. This ensures that locks are released frequently, thus freeing up lock space.
• Before you update many rows in a single table, lock the entire table (using the SQL LOCK TABLE statement). This prevents many row-level locks from being obtained (although this decreases concurrency)
• To control how locking is done for a specific table, use the LOCKSIZE parameter of the ALTER TABLE.
• To decrease the number of share locks held, use the Cursor Stability isolation level when possible. If the applications’ integrity requirements are not compromised, use Uncommitted Read instead of Cursor Stability to further decrease the amount of locking.
Decrease percentage of lock list: If a small number of applications are consuming most of the lock space, decrease the percentage of lock list for each application. You can throttle back those applications by decreasing the maxlocks database configuration parameter. This reduces the amount of lock list memory available to each application thereby allowing for better distribution of lock list memory.
NOTE: Decreasing the percentage of lock list should be the last resort, and used only if you cannot decrease utilization with the other recommendations. It can cause a large number of lock escalations.
EMBARCADERO TECHNOLOGIES > EMBARCADERO PERFORMANCE CENTER 2.7 EXPERT GUIDE: DB2 16

DB2 EXPERT GUIDE > MEMORY PAGE STATISTICS
Package Cache Hit RatioThe sections for frequently used dynamic and static SQL statements are cached in the package cache.
The package cache hit ratio indicates how well the package cache is avoiding catalog accesses to packages and recompilations.
MetricsA high package cache hit ratio (> 80%) is a good thing. It indicates that the package cache is working well. In the case of static SQL statements, package caching allows the Database Manager to reduce the internal overhead by eliminating the need to access system catalogs when reloading a package. For dynamic SQL, the benefit of package caching is even greater since it a cache hit eliminates the need for recompilation.
The package cache hit ratio metric is particularly important for transaction-processing applications since a typical workload involves repeatedly executing the same SQL statements.
TroubleshootingExecuting DDL statements can invalidate sections of SQL statements in the cache, causing the hit ratio to decrease dramatically. Before attempting to tune this parameter, you should check the DDL activity to see if that is causing a skew. No amount of tuning will improve the package cache performance if the DDL activity is causing package invalidations in the cache.
If the DDL activity is minimal and package cache hit ratio is consistently small, consider increasing the package cache size (pckcachesz) in the database configuration. When increasing the value of this parameter, consider whether it might be more effective to allocate the extra memory being reserved to another purpose such as catalog cache or bufferpools.
Session Leaders – MemorySession Leaders – Memory shows the top five memory consuming applications that are running in the database. The details include:
Agent ID: A system-wide unique identifier for the application. On a single-partitioned database, this identifier consists of a 16 bit counter. On a multi-partitioned database, this identifier consists of the coordinating partition number concatenated with a 16 bit counter. In addition, this identifier will be the same on every partition where the application may make a secondary connection.
Auth ID: The authorization ID of the user who invoked the application that is being monitored.
Memory: The total memory pool usage for the application.
NOTE: Click the Session Leaders -- Memory heading to view more details on the Top Sessions View.
Sort Heap UtilizationThe amount of memory allocated for each sort may be some or all of the available sort heap size. Sort heap size is the amount of memory available for each sort as defined in the database configuration parameter sortheap. Shared sort memory utilization gives the percentage of the sort heap being used.
It is possible for a single application to have concurrent sorts active. For example, in some cases a SELECT statement with a subquery can cause concurrent sorts.
EMBARCADERO TECHNOLOGIES > EMBARCADERO PERFORMANCE CENTER 2.7 EXPERT GUIDE: DB2 17
DB2 EXPERT GUIDE > I /O PAGE STATISTICS
MetricsMemory estimates do not usually include sort heap space. If excessive sorting is occurring, the extra memory used for the sort heap should be added to the base memory requirements for running the database manager. Generally, the larger the sort heap, the more efficient the sort. Typically the shared sort utilization should be less than or equal to 70%. You should consider tuning the database if you see a utilization value greater than this.
TroubleshootingTo bring the sort heap utilization to an acceptable level, use the following guidelines:
• Examine the queries you are running on the database to see if you can add indexes to columns frequently accessed in the WHERE clause. This minimizes the use of the sort heap.
• If you are using dynamic bitmaps or hash join buffers in your queries, or your queries frequently require large sorts, increase the sortheap size.
• If you adjust the sortheap size, also look at the sheapthres database manager configuration parameter to see if it too needs to be adjusted
If you are adjusting the sortheap size, you may also benefit from rebinding your packages since the optimizer takes this parameter into account when determining the access paths.
Shared Workspace Hit RatioWhen sections are required by an application for executing dynamic or static SQL statements, they are placed in the shared workspace. The shared workspace exists at the application level and is shared among applications using the database.
The hit ratio is a percentage indicating how well the shared SQL workspace is helping to avoid initialization of sections for SQL statements that are about to be executed. A high ratio indicates the shared workspace is successful in avoiding this action.
MetricsA shared workspace is shared by many applications. If applications have similar database access patterns, they can benefit greatly if they find required sections in the shared workspace. If an application finds a section in the shared workspace (e.g., a hit), that application avoids the setup and initialization cost for that section. A high hit ratio is desirable for this metric. Typically, you should expect to see a high ratio (>80%) in transaction processing environments.
TroubleshootingShared workspace memory is allocated from the application control heap (app_ctl_heap_sz database configuration parameter) and increasing this may improve the hit ratio.
I/O Page StatisticsThe I/O statistics page displays the following vital DB2 I/O statistics:
• Direct Read Ratio
• Logical Read Ratio
• Physical Read Ratio
• Synchronous Read Ratio
EMBARCADERO TECHNOLOGIES > EMBARCADERO PERFORMANCE CENTER 2.7 EXPERT GUIDE: DB2 18

DB2 EXPERT GUIDE > I /O PAGE STATISTICS
• Asynchronous Read Ratio
• Direct Write Ratio
• Synchronous Write Ratio
• Asynchronous Write Ratio
• Log Read Rate
• Direct Read Rate
• Synchronous Read Rate
• Asynchronous Read Rate
• Log Write Rate
• Direct Write Rate
• Synchronous Write Rate
• Asynchronous Write Rate
• I/O Agent Statistics
• Prefetchers
• Page Cleaners
• Log Space Cleans
• Dirty Page Cleans
• Prefetch Wait Time
• Key I/O Ratios
• Buffer Pool Hit Ratio
• Buffer Pool Index Hit Ratio
• Victim Cleans Ratio
• Threshold Cleans Ratio
• Log Space Cleans Ratio
• Session Leaders – I/O
Direct Read RatioDirect Read Ratio is the percentage of all reads that were direct reads. Direct reads are read operations that do not use the buffer pool.
Logical Read RatioLogical Read Ratio is the percentage of all reads that were logical reads. Logical Reads is the sum of all Buffer Pool Data Logical Reads and Buffer Pool Index Logical Reads.
EMBARCADERO TECHNOLOGIES > EMBARCADERO PERFORMANCE CENTER 2.7 EXPERT GUIDE: DB2 19
DB2 EXPERT GUIDE > I /O PAGE STATISTICS
Physical Read RatioPhysical Read Ratio is the percentage of all reads that were physical reads. Physical Reads is the sum of all Buffer Pool Data Physical Reads and Buffer Pool Index Physical Reads.
Synchronous Read RatioSynchronous Read Ratio is the percentage of all index and data reads that performed synchronously by the database manager prefetchers.
Asynchronous Read RatioAsynchronous Read Ratio is the percentage of all index and data reads that performed asynchronously by the database manager prefetchers.
MetricsPrefetching refers to the technique whereby the Database Manager can read several pages on the physical reads device simultaneously into a bufferpool in anticipation of access to these pages. Since each physical read operation is costly, a 50% async read ratio is desirable. It shows that the prefetchers are working well and read waits are being minimized.
TroubleshootingThe num_ioserver database configuration parameter defines the number of prefetchers that are available for the database. To get an optimal async read ratio, you should set the num_ioserver database configuration parameter to 1-2 more than the number of physical storage devices used by the database to ensure that asynchronous I/O is occurring. This parameter should be changed judiciously. Having too many prefetchers invariably results in high system I/O because prefetchers can read many more pages than required into the bufferpools.
Direct Write RatioDirect Write Ratio is the percentage of all writes that were direct writes. Direct Writes are write operations that do not use the buffer pool.
Synchronous Write RatioSynchronous Write Ratio is the percentage of all index and data writes that were performed synchronously by the database manager bufferpool page cleaners.
Asynchronous Write RatioAsynchronous Write Ratio is the percentage of all index and data writes that were performed asynchronously by the database manager bufferpool page cleaners.
MetricsPage cleaners write changed pages from bufferpool to disk before the space in the bufferpool is needed by a database agent. If the page cleaners are not working well, the problem may manifest itself in two ways:
• The database agents need to synchronously free space in bufferpools resulting in poorer response time.
EMBARCADERO TECHNOLOGIES > EMBARCADERO PERFORMANCE CENTER 2.7 EXPERT GUIDE: DB2 20

DB2 EXPERT GUIDE > I /O PAGE STATISTICS
• If the system crashes, the recovery time of the system is greater because there will be a large number of pages that would not have been committed to disk at the time of the crash and they require processing for a large number of log records.
An overall async write ratio of 50% is desirable for most transactional database systems. If your database is 'query only' (i.e., updates are rarely or never performed), it is fine to have an async write ratio of 0 to less than 50%. Even in 'query only' databases if the queries create temp tables on the database for intermediate results, a 30-40% async write ratio is desirable.
TroubleshootingThe async write ratio can be tuned using the num_iocleaners database configuration parameter, which specifies the number of asynchronous page cleaners for a database. Increasing the number of page cleaners generally results in a higher async write ratio. The following rules of thumb should be followed when tuning this parameter:
• For most transactional systems set this parameter to between one and the number of physical storage devices used by the database.
• For workloads that consists mainly of simple reads from the database, set this parameter to zero.
• When you define very large bufferpools on your database you may need to increase the num_iocleaners
• Monitor the victim page cleaners% metric when tuning the num_iocleaners.
Log Read RateLog Read Rate is the number of pages (per second) the logger read from disk during the last monitoring interval.
Direct Read RateDirect Reads Rate is the number of read operations not using the buffer pool (per second) during the last monitoring interval.
Synchronous Read RateSynchronous Read Rate is the number of synchronous reads (per second) in the last monitoring interval.
Asynchronous Read RateAsynchronous Read Rate is the number of asynchronous reads (per second) in the last monitoring interval.
Log Write RateLog Write Rate is the number of pages (per second) the logger read from disk during the last monitoring interval.
Direct Write RateDirect Write Rate is the number of write operations not using the buffer pool (per second) during the last monitoring interval.
EMBARCADERO TECHNOLOGIES > EMBARCADERO PERFORMANCE CENTER 2.7 EXPERT GUIDE: DB2 21

DB2 EXPERT GUIDE > I /O PAGE STATISTICS
Synchronous Write RateSynchronous Write Rate is the number of synchronous writes (per second) in the last monitoring interval.
Asynchronous Write RateAsynchronous Write Rate is the number of asynchronous writes (per second) in the last monitoring interval.
PrefetchersThe num_ioserver database configuration parameter defines the number of prefetchers that are available for the database.
TroubleshootingTo get an optimal async read ratio, you should set the num_ioserver database configuration parameter to 1-2 more than the number of physical storage devices used by the database to ensure that asynchronous I/O is occurring. This parameter should be changed judiciously since having too many prefetchers invariably results in high system I/O because prefetchers can read many more pages than required into the bufferpools.
Page CleanersThe num_iocleaners database configuration parameter specifies the number of asynchronous page cleaners for a database. Increasing the number of page cleaners generally results in a higher async write ratio.
TroubleshootingThe following rules of thumb can be followed when tuning this parameter:
• For most transactional systems set this parameter to between 1 and the number of physical storage devices used by the database.
• For workloads that consists of mainly simple reads from the database, set this parameter to 0.
• When you define very large bufferpools on your database you may need to increase the num_iocleaners.
Monitor the victim page cleaners% metric when tuning the num_iocleaners.
Log Space CleansLog Space Cleans is the number of times a page cleaner was invoked because the logging space used reached a predefined criterion for the database.
MetricsThis element can help you determine whether you have enough space for logging, and whether you need more log files or larger log files. The page cleaning criterion is set using the softmax configuration parameter. Page cleaners are triggered when the oldest page in the buffer pool contains an update described by a log record that is older than the current log position by the criterion value.
EMBARCADERO TECHNOLOGIES > EMBARCADERO PERFORMANCE CENTER 2.7 EXPERT GUIDE: DB2 22

DB2 EXPERT GUIDE > I /O PAGE STATISTICS
Dirty Page CleansDirty Page Cleans is the sum of all buffer pool victim page cleaners triggered and buffer pool threshold cleaners triggered. Buffer pool victim page cleaners triggered is the number of times a page cleaner was invoked because a synchronous write was needed during the victim buffer replacement for the database. Buffer pool threshold cleaners triggered is the number of times a page cleaner was invoked because a buffer pool had reached the dirty page threshold criterion for the database.
Prefetch Wait TimeThis is the total time database applications spent waiting for prefetchers to finish loading.
MetricsNone.
TroubleshootingIf you see a high number for this metric, it indicates there is a bottleneck in the prefetcher operations. Experiment with changing the number of I/O servers (num_ioserver) and the I/O server sizes.
Buffer Pool Hit RatioThe DB2 database server reads and updates all data from a bufferpool because memory access is much faster than disk access. Data is copied from disk to a bufferpool as needed by the applications using the database. When the server needs to read/write data and the data is already in the bufferpool, no disk access is required. However, if the data is not in the bufferpool, it needs to be read from the disk, which is significantly slower process.
The buffer pool hit ratio indicates the percentage of time that the database server did not need to load a page to service the request for a page. The calculation takes into account all the index and data pages that were requested.
MetricsAvoiding disk I/O is the main issue when you try to improve the performance tuning. A high buffer pool hit ratio is desirable because it indicates a lower frequency of synchronous disk I/O. A database where data is accessed uniformly from very large tables will have a poor hit ratio. There is little you can do to improve the performance in such cases.
TroubleshootingThe buffer pool hit ratio on the database Home page is the overall hit ratio of the database. First, drill down to the bufferpool level and check the individual buffer pool hit ratios to identify the elements that may require tuning. Increasing the bufferpool size generally improves the buffer pool hit ratio. You can use one of the following methods to increase the bufferpool size depending on the layout of the data:
1 If the tablespaces using the bufferpool have tables and indexes on them, increase the bufferpool size incrementally until the index page hit ratio stops increasing for that bufferpool. You will not usually get any benefit increasing the bufferpool size after you reach that point.
2 If the tablespaces associated with the bufferpool have only indexes on them, increase the bufferpool size until the index page hit ratio stops increasing.
3 If the tablespaces associated with the bufferpool have only data on them, increase the bufferpool size until the data page hit ratio stops increasing.
One general design guideline is to try and use different tablespaces for indexes and tables and associate different bufferpools with them. This generally improves performance and makes bufferpool tuning much easier.
EMBARCADERO TECHNOLOGIES > EMBARCADERO PERFORMANCE CENTER 2.7 EXPERT GUIDE: DB2 23

DB2 EXPERT GUIDE > I /O PAGE STATISTICS
Buffer Pool Index Hit RatioThe buffer pool index hit ratio is calculated by separating the pages and indexes that are cached by the buffer pool: (1 - ((pool_index_p_reads) / (pool_index_l_reads))) *100%.
TroubleshootingBy tuning the buffer pool index hit ratio separately, you may be able to improve the buffer pool hit ratio.
Victim Cleans RatioVictim Cleans Ratio is the percentage of all page cleans that were victim page cleans. Victim page cleans are triggered when a synchronous write is needed during the victim buffer replacement for the database.
TroubleshootingIf this ratio is low, you may have defined too many page cleaners. Because the buffer pool is meant to defer writing to the last possible moment, having too many page cleaners is counterproductive. If the ratio is high, it might mean that you have too few page cleaners defined, which will increase recovery time after failures.
Threshold Cleans RatioThreshold Cleans Ratio is the percentage of all page cleans that were invoked because a buffer pool had reached the dirty page threshold criterion for the database.
MetricsThis dirty page threshold is set by the chngpgs_thresh configuration parameter. Cleaners are triggered when the number of dirty pages in the pool exceeds the percentage (threshold) applied to the buffer pool size.
TroubleshootingIf this ratio is too low, pages could be written out too early, and they will need to be read back in. If the ratio is too high, too many pages may accumulate, and users will have to write out pages synchronously.
Log Space Cleans RatioThe log space cleaners triggered metric is the number of times a page cleaner was triggered because log space usage reached a predefined threshold for the database.
Metrics The log space cleaners are triggered every time the space used by the DB2 log reaches the limit set in the softmax database configuration parameter. This parameter specifies the percentage of primary log size at which the cleaners are triggered. By default this parameter is set to 100.
A low rate of log space cleaners getting triggered may indicate that logs are not being written to disk frequently enough and that you may need to process a large number of log records and redundant log records in the event of a crash recovery.
High rates of log space cleaners getting triggered can indicate that your primary log is too small or that you have set the softmax too high. In either case, a very high rate of log cleaners being triggered may adversely impact database performance.
EMBARCADERO TECHNOLOGIES > EMBARCADERO PERFORMANCE CENTER 2.7 EXPERT GUIDE: DB2 24
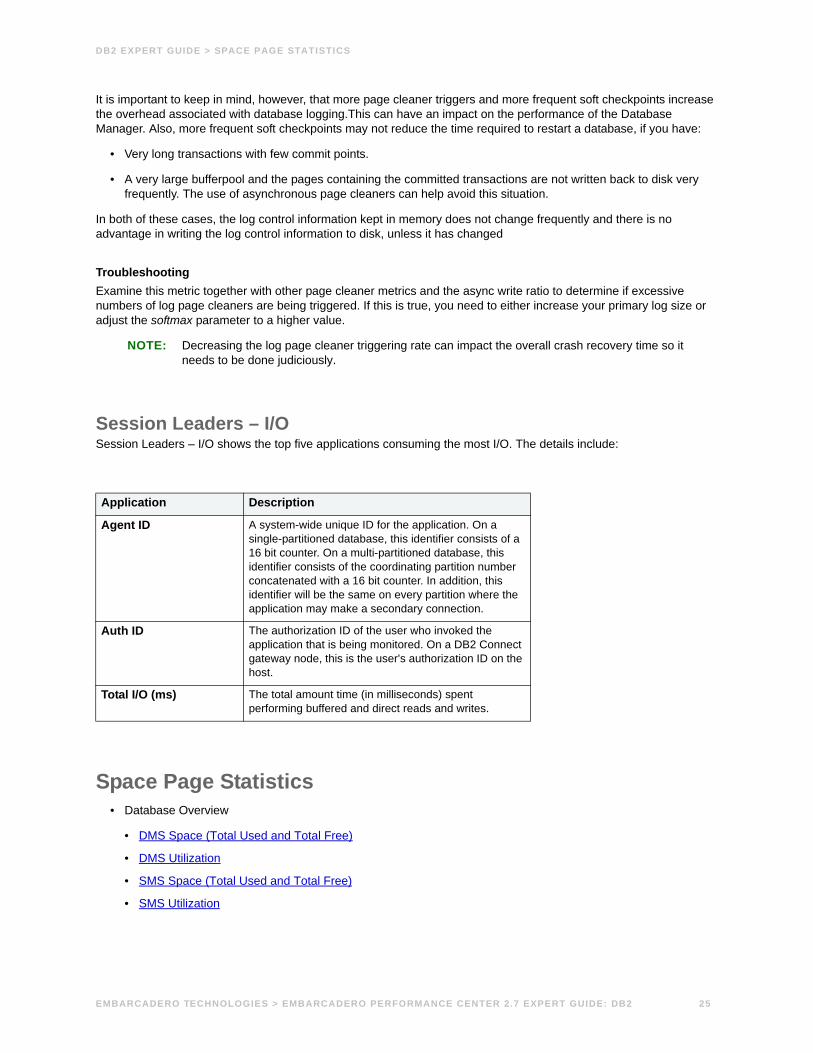
DB2 EXPERT GUIDE > SPACE PAGE STATISTICS
It is important to keep in mind, however, that more page cleaner triggers and more frequent soft checkpoints increase the overhead associated with database logging.This can have an impact on the performance of the Database Manager. Also, more frequent soft checkpoints may not reduce the time required to restart a database, if you have:
• Very long transactions with few commit points.
• A very large bufferpool and the pages containing the committed transactions are not written back to disk very frequently. The use of asynchronous page cleaners can help avoid this situation.
In both of these cases, the log control information kept in memory does not change frequently and there is no advantage in writing the log control information to disk, unless it has changed
TroubleshootingExamine this metric together with other page cleaner metrics and the async write ratio to determine if excessive numbers of log page cleaners are being triggered. If this is true, you need to either increase your primary log size or adjust the softmax parameter to a higher value.
NOTE: Decreasing the log page cleaner triggering rate can impact the overall crash recovery time so it needs to be done judiciously.
Session Leaders – I/OSession Leaders – I/O shows the top five applications consuming the most I/O. The details include:
Space Page Statistics• Database Overview
• DMS Space (Total Used and Total Free)
• DMS Utilization
• SMS Space (Total Used and Total Free)
• SMS Utilization
Application Description
Agent ID A system-wide unique ID for the application. On a single-partitioned database, this identifier consists of a 16 bit counter. On a multi-partitioned database, this identifier consists of the coordinating partition number concatenated with a 16 bit counter. In addition, this identifier will be the same on every partition where the application may make a secondary connection.
Auth ID The authorization ID of the user who invoked the application that is being monitored. On a DB2 Connect gateway node, this is the user's authorization ID on the host.
Total I/O (ms) The total amount time (in milliseconds) spent performing buffered and direct reads and writes.
EMBARCADERO TECHNOLOGIES > EMBARCADERO PERFORMANCE CENTER 2.7 EXPERT GUIDE: DB2 25

DB2 EXPERT GUIDE > SPACE PAGE STATISTICS
• Log Overview
• Active Log Size
• Active Log Used
• Active Log Free
• Active Log Utilization-+
• Secondary Logs Allocated
• Secondary Log Used HWM
• Exception Summary
• Inaccessible Containers
• Tablespaces Low on Space
• Abnormal State Tablespaces
• Tablespace Overview
DMS Space (Total Used and Total Free)The total used and total free metrics show the space details for DMS tablespaces. Specifically, they show the amount of used and free space on the DMS tablespaces in the database.
MetricsUnlike SMS tablespaces, the total available space to the DMS tablespaces is defined at the time the database is defined. The DBA needs to explicitly increase the amount of space on DMS tables by adding/extending tablespace containers (using the ALTER TABLESPACE statement). If left unattended, a DMS tablespace can either remain underutilized or fill up completely. Keeping an eye on the DMS space is important because the once it fills up, the applications trying to write to the database will come to a halt suddenly.
TroubleshootingGo to the Space home page or drilldown to see the usage metrics for individual tablespaces and allocate/deallocate space to containers accordingly using ALTER TABLESPACE command.
DMS UtilizationDMS utilization is the percentage of all DMS tablespaces that are free.
SMS Space (Total Used and Total Free)This metric shows the total amount of free and used SMS space by the database.
MetricsThe maximum size of SMS tablespaces is not set at the time the tablespaces are created. The maximum size that can be reached is the space available on the drives/volumes that the SMS tablespace containers are defined on. You need to periodically examine the available space of the drives/volumes (using OS metrics Space page) to make sure there is enough space available for your database requirements. Since the space is determined by the space available on the drives/volumes, remember that if other applications are reading and writing to the same devices (especially logs, traces, etc), DB2 may be periodically competing for space with these applications.
EMBARCADERO TECHNOLOGIES > EMBARCADERO PERFORMANCE CENTER 2.7 EXPERT GUIDE: DB2 26

DB2 EXPERT GUIDE > SPACE PAGE STATISTICS
TroubleshootingIdeally, try and isolate the DB2 SMS drives/volumes from other applications. If the OS level metrics show that you are running out of space on a volume that is used by a tablespace's containers, you can add more containers defined on volumes with more space, to the tablespace using the ALTER TABLESPACE command.
SMS UtilizationSMS utilization is the percentage of all SMS tablespaces that are free.
Active Log SizeActive Log Size is the total amount of active log space (in megabytes) available in the database.
Active Log UsedActive Log Used is the current amount of active log space (in megabytes) being used in the database.
Active Log FreeActive Log Free is the active log space (in megabytes) in the database that is not currently being used.
Active Log UtilizationActive Log Utilization is the percentage of space consumed in the database. A very high percentage may cause an alert.
Secondary Logs AllocatedThis section shows the secondary logs allocations by the database over the monitoring period.
MetricsWhen the primary log files become full, the secondary log files are allocated one at a time as needed, up to a maximum number as controlled by the logsecond database configuration parameter. Secondary log files are useful in preventing occasional log fill ups but they may not be as efficient as primary log and they also increase the recovery time. If you see a constant reliance on secondary log files, it may indicate infrequent commits by database applications or insufficient primary log space.
TroubleshootingFirst examine the database applications to see if secondary log files are due to long running transactions and whether these transactions can be shortened. If the transactions cannot be shortened or you still see a very frequent use of secondary logs after transaction tuning, increase the primary log size (logprimary, logfilsiz Database configuration parameters) to reduce the dependence on secondary logs.
If there is an occasional long running transaction, and you see your see transaction log full (SQL0964C) error messages, you can either increase the number of secondary log files (logsecond database configuration parameter) or set the number to -1 (no limit on number of secondary log files).
EMBARCADERO TECHNOLOGIES > EMBARCADERO PERFORMANCE CENTER 2.7 EXPERT GUIDE: DB2 27

DB2 EXPERT GUIDE > SPACE PAGE STATISTICS
Secondary Log Used HWMSecondary Log Used HWM is the maximum amount of secondary log space used (in megabytes).
TroubleshootingIf this value is high, you can try several options:
• Increase the size of the log files.
• Create more primary logs.
The following configuration parameters may need to be updated as a result:
• logfilsiz
• logprimary
• logsecond
• logretain
NOTE: If there are no secondary log files defined, the value will be zero.
Inaccessible ContainersThe inaccessible containers metric identifies the number of containers on all tablespaces that are currently inaccessible.
MetricsInaccessible containers represent a serious problem on the database. The database is unable to access/write any data on an inaccessible container. Usually this is caused by either media errors or modifications to the container files/directories from outside DB2.
TroubleshootingDrill down to the Space metrics to examine the inaccessible containers and the tablespaces on which they are contained. You may need to perform a redirected restore on the tablespace from a backup to correct this.
Tablespaces Low on SpaceTablespaces Low on Space is the number of tablespaces in the database where the used space on the tablespace is more than 80% of the total available space.
MetricsThis metric is an indicator that some of the tablespaces in your database may be running out of space. You should drill down to identify the tablespaces that may be at the critical utilization level. In tablespaces where there are little or no inserts after the initial data is loaded, little or no free space may have been left on purpose. In such cases, it is normal to see a high utilization.
TroubleshootingIf this metric goes beyond the normal operational value for your database, consider creating additional space on the tablespaces that are running out of space. You can do this by performing one or more one of the following tasks:
• Clean up unused space by deleting the tables/indexes that are no longer required.
EMBARCADERO TECHNOLOGIES > EMBARCADERO PERFORMANCE CENTER 2.7 EXPERT GUIDE: DB2 28

DB2 EXPERT GUIDE > SPACE PAGE STATISTICS
• Resize or extend the existing containers in the tablespaces.
• Add new containers to the tablespaces.
Abnormal State TablespacesThe tablespaces in abnormal state metric is a count of the number of tablespaces in your database that are not in a 'Normal State'.
MetricsTablespaces in not normal state are not necessarily a cause for alarm. They may have been transitioned to that state intentionally by the DBA for maintenance related tasks. If this metric shows a value that is higher than you anticipated, you may need to drilldown to the Space metrics to see which tablespaces are not normal.
A tablespace can be in one or more of the following states when it is not 'Normal':
• Quiesced: SHARE, UPDATE, EXCLUSIVE
• Pending: Load, delete, backup, roll forward, restore, disable, drop
• In progress: Roll forward, reorg, backup, TBS deletion, TBS creation
• Storage must be defined
• Restore in progress
• Offline and not accessible
• Storage may be defined
• Storage definition is in 'final' state
• Storage definition was changed prior to rollforward
• DMS rebalancer is active
Tablespace OverviewThe Tablespace Overview section includes a list of all of the tablespaces in the database. The following information is presented for each tablespace:
• Tablespace: The name of the tablespace.
• Type: system managed (SMS) or database managed (DMS) tablespace.
• State: This element describes the current state of the tablespace.
• Size (MB): Total space (Used and Free) used by the tablespace on the storage device(s). This will be the same as used space for SMS tables.
• Used (MB): The space currently in use on tablespace.
• Free (MB): The space currently free on the tablespace. (This is not applicable to SMS tablespaces.)
• % Used: The percentage of used space on the tablespace.
EMBARCADERO TECHNOLOGIES > EMBARCADERO PERFORMANCE CENTER 2.7 EXPERT GUIDE: DB2 29

DB2 EXPERT GUIDE > OBJECT PAGE STATISTICS
Object Page StatisticsThe Object view includes the following statistics:
• Buffer Pools Tab – Overview
• Buffer Pools Tab – I/O Analysis
• Tablespaces Tab – Overview
• Tablespaces Tab – I/O Analysis
• Containers Tab
• Tables Tab
Buffer Pools Tab – OverviewThe Buffer Pools tab displays details about the buffer pools in the database being monitored:
Buffer Pools Tab – I/O AnalysisThe Buffer Pools tab displays details about the buffer pools in the database being monitored:
Buffer Pool Details Description
Node: The unique identification number assigned to the node.
Bufferpool: The name of the buffer pool.
Size (MB): The current buffer pool size.
Page Size (KB): The default page size of the buffer pool.
Files Closed: The number of times a database file was closed because the limit for concurrently open files was reached.
Overall Hit Ratio: Indicates the percentage of time that the database server did not need to load a page from in order to service the request for a page.
Index Hit Ratio: The percentage of all index reads that were satisfied because the page was already available in a bufferpool.
Avg Read Time (ms): The average amount of time (in milliseconds) spent reading in data and index pages from table space containers.
Avg Write Time (ms): The average amount of time (in milliseconds) spent writing data and index pages from the buffer pool to disk.
Pages Read Per Minute: The number of physical reads per minute.
Buffer Pool Details Description
Node: The unique identification number assigned to the node.
Bufferpool: The name of the buffer pool.
EMBARCADERO TECHNOLOGIES > EMBARCADERO PERFORMANCE CENTER 2.7 EXPERT GUIDE: DB2 30

DB2 EXPERT GUIDE > OBJECT PAGE STATISTICS
Tablespaces Tab – OverviewThe Tablespaces tab displays details about the tablespaces in the database being monitored:
% Async Reads: The percentage of all index and data reads performed asynchronously by the database manager prefetchers.
% Sync Reads: The percentage of all index and data reads that performed synchronously by the database manager prefetchers.
% Async Writes: The percentage of all index and data writes performed asynchronously by the database manager bufferpool page cleaners.
% Sync Writes: The percentage of all index and data writes that were performed synchronously by the database manager bufferpool page cleaners.
% Block I/O: The percentage of all block/vectored I/O that is block I/O. Block I/O represents the number of times DB2 performs sequential prefetching of pages into the block area of the buffer pool.
% Vectored I/O: The percentage of all block/vectored I/O that is vectored I/O. Vectored I/O represents the number of times DB2 performs sequential prefetching of pages into the page area of the buffer pool.
Avg Async Read (ms): The average amount of time spent reading data and index pages.
Avg Sync Read (ms): The average amount of time spent performing synchronous reads.
Avg Async Write (ms): The average amount of time spent writing data and index pages to disk.
Avg Sync Write (ms): The average amount of time spent performing synchronous writes.
Tablespaces Description
Tablespace: The name of the tablespace.
Type: System managed (SMS) or database managed (DMS) tablespace.
State: This element describes the current state of the tablespace.
Size (MB): The current buffer pool size.
Used (MB): The space currently in use on tablespace.
Free (MB): The space currently free on the tablespace. (This is not applicable to SMS tablespaces.)
% Used: The percentage of space currently in use on tablespace.
Page Size (KB): The default page size of the buffer pool.
Buffer Pool Details Description
EMBARCADERO TECHNOLOGIES > EMBARCADERO PERFORMANCE CENTER 2.7 EXPERT GUIDE: DB2 31

DB2 EXPERT GUIDE > OBJECT PAGE STATISTICS
Tablespaces Tab – I/O AnalysisThe Tablespaces tab displays details about the tablespaces in the database being monitored:
Tablespace: The name of the tablespace.
Bufferpool: The name of the buffer pool.
% Async Reads: The percentage of all index and data reads performed asynchronously by the database manager prefetchers.
% Sync Reads: The percentage of all index and data reads that performed synchronously by the database manager prefetchers.
% Async Writes: The percentage of all index and data writes performed asynchronously by the database manager bufferpool page cleaners.
% Sync Writes: The percentage of all index and data writes that were performed synchronously by the database manager bufferpool page cleaners.
% Block I/O: The percentage of all block/vectored I/O that is block I/O. Block I/O represents the number of times DB2 performs sequential prefetching of pages into the block area of the buffer pool.
% Vectored I/O: The percentage of all block/vectored I/O that is vectored I/O. Vectored I/O represents the number of times DB2 performs sequential prefetching of pages into the page area of the buffer pool.
Avg Async Read (ms): The average amount of time spent reading data and index pages.
Avg Sync Read (ms): The average amount of time spent performing synchronous reads.
Avg Async Write (ms): The average amount of time spent writing data and index pages to disk.
Avg Sync Write (ms): The average amount of time spent performing synchronous writes.
Async Pages Read Per Request: The average number of pages read per asynchronous request.
Files Closed: The number of times a database file was closed because the limit for concurrently open files was reached.
Overall Hit Ratio: Indicates the percentage of time that the database server did not need to load a page from in order to service the request for a page.
Index Hit Ratio: The percentage of all index reads that were satisfied because the page was already available in a bufferpool.
Avg Read Time (ms): The average amount of time (in milliseconds) spent reading in data and index pages from table space containers.
Avg Write Time (ms): The average amount of time (in milliseconds) spent writing data and index pages from the buffer pool to disk.
Pages Read Per Minute:
The number of physical reads per minute.
Tablespaces Description
EMBARCADERO TECHNOLOGIES > EMBARCADERO PERFORMANCE CENTER 2.7 EXPERT GUIDE: DB2 32

DB2 EXPERT GUIDE > OBJECT PAGE STATISTICS
Containers TabThe Containers tab displays details about the containers for a tablespace:
Node: The unique identification number assigned to the node.
Tablespace: The name of the tablespace.
ID: A value that uniquely identifies a tablespace used by the current database.
Type: System managed (SMS) or database managed (DMS) tablespace.
Container: The name of the container. Typically this is the full path of the file/directory/device where the container exists.
ID: A value that uniquely identifies the container within the tablespace
Type: The type of container. An SMS Container will be a directory. A DMS Containers will be a raw device/file/stripped disk/ or stripped file. Together with Container name, and partition, this metric identifies the physical location of the container.
Accessible: This element describes if a container is accessible or not.
Size (MB): The size of the container (in megabytes).
Total Pages: Total pages in the container.
Useable Pages: Usable pages in the container (applicable to DMS Tablespaces only).
Node Name: The name of the node.
FS Type: This is the type of file system that the container is defined on such as 'NTFS'. It is obtained from the IBM supplied user defined function "SYSPROC.SNAPSHOT_CNTRFS" and is only available for DB2 v8.2 databases and above.
FS Size (GB): This is the total size in gigabytes (GB) of the file system that the container is defined on. It is obtained from the IBM supplied user defined function "SYSPROC.SNAPSHOT_CNTRFS" and is only available for DB2 v8.2 databases and above.
FS Free (GB): This is the total amount of space in gigabytes (GB) that is available on the file system that the container is defined on. It is obtained from the IBM supplied user defined function "SYSPROC.SNAPSHOT_CNTRFS" and is only available for DB2 v8.2 databases and above.
NOTE: If the DB2 database is not a DB2 v8.2 database the values in these columns will be N/A or zero.
Tables TabThe Tables tab displays details about the tables in the database being monitored:
Schema: The schema name for the table.
Table Name: The name of the table.
Type: The type of table for which information is returned.
Tablespace: Tablespace where the table data resides.
Bufferpool: The name of the buffer pool.
Rows Read Per Tran: The average number of rows read per transaction.
Rows Read: The number of rows read from the table.
Rows Written: The number of rows written to each table.
EMBARCADERO TECHNOLOGIES > EMBARCADERO PERFORMANCE CENTER 2.7 EXPERT GUIDE: DB2 33

DB2 EXPERT GUIDE > CONTENTION PAGE STATISTICS
Overflow Accesses: The number of reads and writes to overflowed rows in this table.
Page Reorgs: The number of page reorganizations executed for a table.
Data Pages (MB): The amount of tablespace used by data pages (in megabytes).
Index Pages (MB): The amount of tablespace used by index pages (in megabytes).
LOB Pages (MB): The amount of tablespace used by LOB pages (in megabytes).
Long Pages (MB): The amount of tablespace used by long pages (in megabytes).
Contention Page StatisticsThe Contention view includes the following statistics:
• System Contention
• Deadlocks
• Lock Waits
• Lock Timeouts
• Lock Escalations
• Applications Waiting on Locks
• Lock Overview
• Lock List Utilization
• Lock Wait Time
• Average Lock Wait Time
DeadlocksDeadlocks shows the total number of deadlocks that have occurred since this instance of Performance Center started monitoring the database.
MetricsIf a large number of deadlocks are detected, it can indicate that applications are experiencing lock contention problems. Deadlocks are usually caused by one of the following situations:
• Lock escalations on the database.
• Catalog tables locked for Repeatable Read.
• Applications are using inappropriate isolation levels at bind time.
• Applications are obtaining the same locks in a different order.
• Applications are locking tables explicitly where row level locks are sufficient.
TroubleshootingYou may be able to modify the applications causing lock contentions for better concurrency.
To identify the applications that may be causing contentions, go to the Lock View.
EMBARCADERO TECHNOLOGIES > EMBARCADERO PERFORMANCE CENTER 2.7 EXPERT GUIDE: DB2 34

DB2 EXPERT GUIDE > CONTENTION PAGE STATISTICS
Lock WaitsAt the database level, this is the total number of times that applications have had to wait for locks within this database. At the application-connection level, this is the total number of times that this connection requested a lock but had to wait because another connection was already holding a lock on the data.
MetricsThis element may be used with lock_wait_time to calculate, at the database level, the average wait time for a lock. This calculation can be done at either the database or the application-connection level.
TroubleshootingIf the average lock wait time is high, you should look for applications that hold many locks, or have lock escalations, with a focus on tuning your applications to improve concurrency, if appropriate. If escalations are the reason for a high average lock wait time, then the values of one or both of the locklist and maxlocks configuration parameters may be too low.
Lock TimeoutsThe lock timeouts metric identifies the number of times that a request to lock an object timed out without being granted.
MetricsIf the number of lock timeouts becomes excessive when compared to the acceptable range for your database, it can indicate that an application is holding locks for long durations. It can also indicate that the amount of time an application waits for a lock before timing out is too short.
If you have too few lock timeouts and the average lock wait time is too high, it can indicate that the lock timeout configuration parameter is set to an excessively high value.
TroubleshootingFirst you should examine the lock activity at the application level to identify any particular application that is causing excessive lock contentions. If so, you can tune the application to provide better concurrency. If lock timeouts are excessive, and average lock wait times are very short, you can increase the locktimeout database configuration parameter to make the applications wait longer before timing out.
Lock EscalationsThe lock escalations metric indicates the number of times that locks have been escalated from row locks to table locks, since this instance of Performance Center started monitoring the database.
MetricsA lock is escalated when the total number of locks held by an application reaches the maximum amount it is allowed in the lock list memory. There are several possible causes of lock escalations:
• The database lock list size is too small for the concurrent workload
• The maximum percentage of lock list memory allowed for each application is too small
• One or more applications are obtaining an excessive number of locks
Monitor the lock escalations over a period of time to determine what levels are acceptable in your environment. If the escalations are excessive, or are accompanied by deadlocks or long lock waits, consider tuning the database.
EMBARCADERO TECHNOLOGIES > EMBARCADERO PERFORMANCE CENTER 2.7 EXPERT GUIDE: DB2 35

DB2 EXPERT GUIDE > CONTENTION PAGE STATISTICS
Applications Waiting on LocksThe Apps Waiting on Locks metric gives the percentage of all currently connected applications that are waiting for locks.
MetricsIf this number is high, you should investigate whether the applications are having concurrency problems.
TroubleshootingCompare this metric with the lock escalations metric to identify if the lock list memory is too small.
Go to the Locks Waiting Details tab of the Lock View and examine the lock activity at application level to identify the applications that are holding a large number of row locks and table-level locks. You may be able to tune the applications with a high number of locks.
Lock OverviewAgent ID – A system-wide unique ID for the application. On a single-partitioned database, this identifier consists of a 16 bit counter. On a multi-partitioned database, this identifier consists of the coordinating partition number concatenated with a 16 bit counter. In addition, this identifier will be the same on every partition where the application may make a secondary connection.
Auth ID – The authorization ID of the user who invoked the application that is being monitored. On a DB2 Connect gateway node, this is the user's authorization ID on the host.
Application – The name of the application running at the client, as known to the database or DB2 Connect server.
Locks Waiting – The total number of times that applications or connections waited for locks.
Lock Wait Time (ms) – The total elapsed time applications waited for a lock (given in milliseconds).
Timeouts – Indicates the timeout value (in seconds) when an application has issued a SET CURRENT LOCK TIMEOUT statement. In cases where the statement has not been executed, the database level lock timeout will be shown.
Deadlocks – Shows the total number of deadlocks that have occurred since this instance of Performance Center started monitoring the database.
Lock List UtilizationLock list utilization is the percentage of total database memory allocated for locks that is currently being used.
MetricsThere is only one lock list for each database and it contains the locks held by all applications connected to the database. Once the lock list is full, the database manager starts escalating row locks to table locks to free up space. This escalation may result in serious performance degradation because of reduced concurrency. Additionally, the number of deadlocks and transaction rollbacks may go up.
If this metric reaches the 75% mark, you should consider bringing this percentage down with tuning.
TroubleshootingDepending on the database’s activity level, you may be able to reduce the lock utilization by following these recommendations:
EMBARCADERO TECHNOLOGIES > EMBARCADERO PERFORMANCE CENTER 2.7 EXPERT GUIDE: DB2 36

DB2 EXPERT GUIDE > CONTENTION PAGE STATISTICS
Increase size of lock list: If there is not enough lock list space available, lock escalations will occur, thereby increasing contention and reducing concurrency. Update the locklist database configuration parameter to increase this value.
Tune applications to reduce locking: On the Lock View, identify the applications that are holding many locks and then consider the following steps for controlling the size of the lock list:
• Make the transactions shorter by increasing the COMMIT frequency. This ensures that locks are released frequently, thus freeing up lock space.
• Before you update many rows in a single table, lock the entire table (using the SQL LOCK TABLE statement). This prevents many row-level locks from being obtained (although this decreases concurrency).
• To control how locking is done for a specific table, use the LOCKSIZE parameter of the ALTER TABLE.
• To decrease the number of share locks held, use the Cursor Stability isolation level when possible. If the applications’ integrity requirements are not compromised, use Uncommitted Read instead of Cursor Stability to further decrease the amount of locking.
Decrease percentage of lock list: If a small number of applications are consuming most of the lock space, decrease the percentage of lock list for each application. You can throttle back those applications by decreasing the maxlocks database configuration parameter. This reduces the amount of lock list memory available to each application thereby allowing for better distribution of lock list memory.
NOTE: Decreasing the percentage of lock list should be the last resort, and used only if you cannot decrease utilization with the other recommendations. It can cause a large number of lock escalations.
Lock Wait TimeLock Wait Time is the elapsed time (in milliseconds) that all applications were waiting for a lock.
MetricsAt the database level, this is the total amount of elapsed time that all applications were waiting for a lock within this database. At the application-connection and transaction levels, this is the total amount of elapsed time that this connection or transaction has waited for a lock to be granted to it.
This element may be used in conjunction with the lock_waits monitor element to calculate the average wait time for a lock. This calculation can be performed at either the database or the application-connection level.
When using monitor elements providing elapsed times, you should consider:
• Elapsed times are affected by system load, so the more processes you have running, the higher this elapsed time value.
• To calculate this element at the database level, the database system monitor sums the application-level times. This can result in double counting elapsed times at a database level, since more than one application process can be running at the same time.
TroubleshootingNone.
Average Lock Wait TimeThis is the average time, applications waited for locks in the database.
EMBARCADERO TECHNOLOGIES > EMBARCADERO PERFORMANCE CENTER 2.7 EXPERT GUIDE: DB2 37

DB2 EXPERT GUIDE > USERS PAGE STATISTICS
MetricsThis metric helps you determine if the applications are spending a large amount of time waiting to obtain locks.
TroubleshootingIf the average lock wait time is high, you should look for applications that hold many locks or have lock escalations. If appropriate, you may need to tune such applications for better concurrency. If escalations are the reason for high average lock wait time, the values of one or both of the locklist and maxlocks database configuration parameters may be too low.
Users Page StatisticsThe Users view includes the following statistics:
• Session Activity Summary
• Connections
• Connections Idle
• Connections Active
• Connections Waiting
• Static SQL Statements
• Dynamic SQL Statements
• Session Transaction Summary
• Transactions
• Transactions Per Second
• Sorts Per Transaction
• Lock Waits Per Transaction
• Selects Per Transaction
• Rows Selected Per Transaction
• Session Leaders – Memory
• Session Leaders – I/O
• Session Leaders – CPU
• Max. Connections
• Percent Executing
• Percent of Maximum
Related Topics• Users Detail
ConnectionsThe total connections metric is the number of applications currently connected to the database.
EMBARCADERO TECHNOLOGIES > EMBARCADERO PERFORMANCE CENTER 2.7 EXPERT GUIDE: DB2 38

DB2 EXPERT GUIDE > USERS PAGE STATISTICS
MetricsYou can use this metric to help you get an overview of the level of database activity and the amount of system resources in use.
TroubleshootingThis metric can help you adjust the setting of the maxappls and max_coordagents configuration parameters. For example, if this value is always the same as maxappls, you consider increasing the value of maxappls.
Connections IdleThe connections idle metric indicates the number of applications that are currently connected to the database for which the database manager is not executing any requests.
MetricsYou may use this element to help you understand the level of activity within a database and the amount of system resource being used.
Connections ActiveThe connections active statistic indicates the number of applications for which the database manager is currently executing requests.
MetricsYou can use this element to understand how many of the database manager agent tokens are being used by applications connected to this database.
Connections WaitingThis metric indicates the percentage of all connected applications waiting on locks.
MetricsIf this number is high, the application may have concurrency problems.
TroubleshootingYou can identify the applications that are holding locks or exclusive locks for a long time from the Users Detail>Locks page and tune such applications for better concurrency.
Static SQL StatementsThe static SQL metric is the number of static SQL statement executions attempted on the database each second.
Dynamic SQL StatementsThe dynamic SQL metric is the number of dynamic SQL statement executions being attempted on the database each second.
EMBARCADERO TECHNOLOGIES > EMBARCADERO PERFORMANCE CENTER 2.7 EXPERT GUIDE: DB2 39

DB2 EXPERT GUIDE > USERS PAGE STATISTICS
TransactionsTransactions is the number of transactions executed on the database since the start of this instance of Performance Center.
MetricsA low number of units of work compared to the overall SQL activity (static + dynamic SQL statements) indicate long transactions. This may in turn be an indicator of poor concurrency and heavy log usage.
Transactions Per SecondTransactions per second is the number of transactions (units of work) completed per second on the database.
MetricsA small rate of transactional activity on the database can indicate that applications are not doing frequent commits, which may lead to logging and concurrency problems.
TroubleshootingDrill down to the Users Detail>SQL Activity page to check which applications are running their transactions for long periods of time.
Sorts Per TransactionSorts per transaction is the number sorts that have been executed during per transaction.
Lock Waits Per TransactionLock Waits Per transaction is the number of times per transaction applications or connections had to wait because another connection was holding a lock on the data.
Selects Per TransactionSelects per transaction is the number of SQL SELECT statements executed per transaction.
Rows Selected Per TransactionRows selected per transaction is the number of rows per transaction that have been selected and returned to the application.
Session Leaders – MemorySession Leaders – Memory shows the top five memory consumption applications that are running in the database. The details include:
EMBARCADERO TECHNOLOGIES > EMBARCADERO PERFORMANCE CENTER 2.7 EXPERT GUIDE: DB2 40

DB2 EXPERT GUIDE > USERS PAGE STATISTICS
Session Leaders – I/OI/O shows the top five applications consuming the most I/O. The details include:
Session Leaders – CPUSession Leaders – CPU shows the top five applications with the highest CPU usage. The details include:
Session Leader Details Description
Agent ID: A system-wide unique ID for the application. On a single-partitioned database, this identifier consists of a 16 bit counter. On a multi-partitioned database, this identifier consists of the coordinating partition number concatenated with a 16 bit counter. In addition, this identifier will be the same on every partition where the application may make a secondary connection.
Auth ID: The authorization ID of the user who invoked the application that is being monitored. On a DB2 Connect gateway node, this is the user's authorization ID on the host.
Memory: Total memory pool usage for the application.
Details Description
Agent ID A system-wide unique ID for the application. On a single-partitioned database, this identifier consists of a 16 bit counter. On a multi-partitioned database, this identifier consists of the coordinating partition number concatenated with a 16 bit counter. In addition, this identifier will be the same on every partition where the application may make a secondary connection.
Auth ID The authorization ID of the user who invoked the application that is being monitored. On a DB2 Connect gateway node, this is the user's authorization ID on the host.
Total I/O (ms) The total amount time (in milliseconds) spent performing buffered and direct reads and writes.
Details Description
Agent ID: A system-wide unique ID for the application. On a single-partitioned database, this identifier consists of a 16 bit counter. On a multi-partitioned database, this identifier consists of the coordinating partition number concatenated with a 16 bit counter. In addition, this identifier will be the same on every partition where the application may make a secondary connection.
EMBARCADERO TECHNOLOGIES > EMBARCADERO PERFORMANCE CENTER 2.7 EXPERT GUIDE: DB2 41
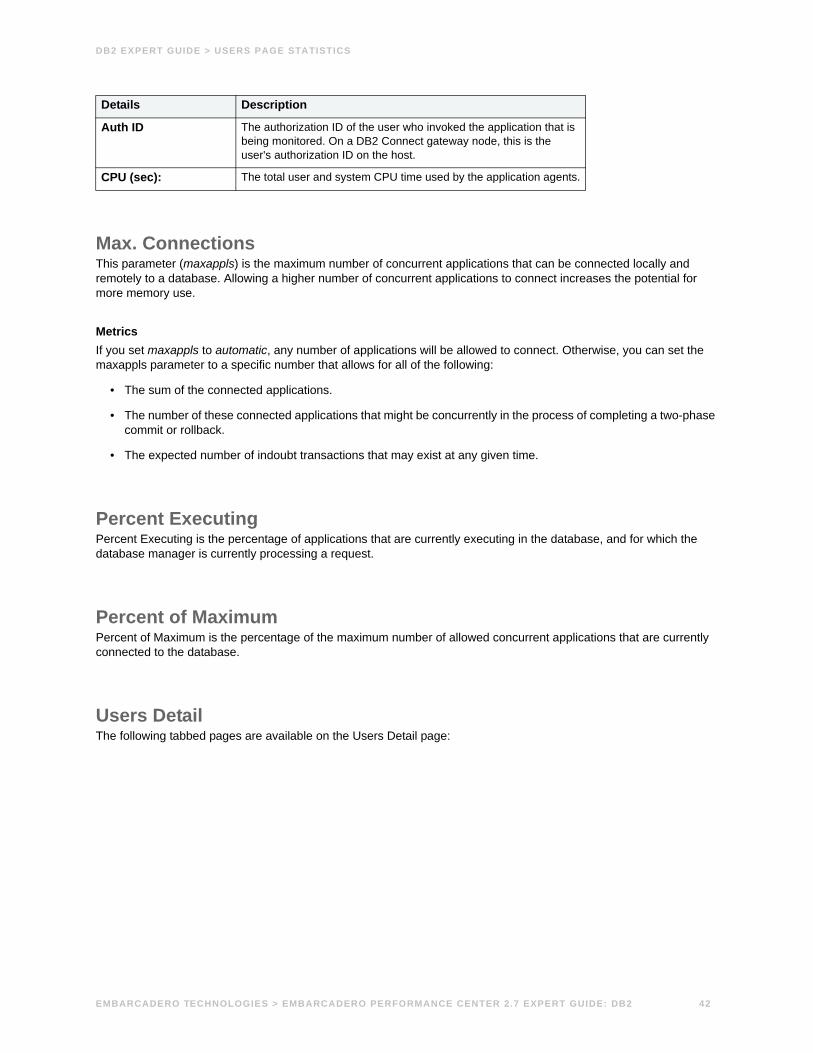
DB2 EXPERT GUIDE > USERS PAGE STATISTICS
Max. ConnectionsThis parameter (maxappls) is the maximum number of concurrent applications that can be connected locally and remotely to a database. Allowing a higher number of concurrent applications to connect increases the potential for more memory use.
MetricsIf you set maxappls to automatic, any number of applications will be allowed to connect. Otherwise, you can set the maxappls parameter to a specific number that allows for all of the following:
• The sum of the connected applications.
• The number of these connected applications that might be concurrently in the process of completing a two-phase commit or rollback.
• The expected number of indoubt transactions that may exist at any given time.
Percent ExecutingPercent Executing is the percentage of applications that are currently executing in the database, and for which the database manager is currently processing a request.
Percent of MaximumPercent of Maximum is the percentage of the maximum number of allowed concurrent applications that are currently connected to the database.
Users DetailThe following tabbed pages are available on the Users Detail page:
Auth ID The authorization ID of the user who invoked the application that is being monitored. On a DB2 Connect gateway node, this is the user's authorization ID on the host.
CPU (sec): The total user and system CPU time used by the application agents.
Details Description
EMBARCADERO TECHNOLOGIES > EMBARCADERO PERFORMANCE CENTER 2.7 EXPERT GUIDE: DB2 42

DB2 EXPERT GUIDE > USERS PAGE STATISTICS
Overview Tab
Locking Tab
Column Description
Agent ID This is a system-wide unique indentifier for the application.
Auth ID The authorization ID of the user who invoked the application that is being monitored.
Client PID The process ID of the client application that made the connection to the database.
OS User ID The authorization ID used to access the operating system.
Application Name of the application executable.
Status The current status of the application.
Coord Node In a multi-node system, this is the node number of the node where the selected application connected or attached to the instance.
UOW Elapsed Time (sec) The elapsed execution time of the most recently completed unit of work.
Memory Used (KB) Total memory pool usage for the application.
Lock Wait Time (ms) The current amount of wait time for the process, in milliseconds.
Total Sort Time (ms) The total elapsed time (in milliseconds) for all sorts that have been executed.
User CPU Time (sec) The total user CPU time used by the application agents.
System CPU Time (sec) The total system CPU time used by the application agents.
Buffered I/O Time (ms) The total time spent by application in performing buffered reads and writes.
Direct I/O Time (ms) The total time spent by application in performing non-buffered reads and writes.
Column Description
Agent ID This is a system-wide unique indentifier for the application.
Auth ID The authorization ID of the user who invoked the application that is being monitored.
Client PID The process ID of the client application that made the connection to the database.
OS User ID The authorization ID used to access the operating system.
Application Name of the application executable.
Status The current status of the application.
Coord Node In a multi-node system, this is the node number of the node where the selected application connected or attached to the instance.
Lock Wait Time (ms) The current amount of wait time for the process, in milliseconds.
Lock Waits At the database level, this is the total number of times that applications have had to wait for locks within this database. At the application-connection level, this is the total number of times that this connection requested a lock but had to wait because another connection was already holding a lock on the data.
Locks Waiting The number of agents waiting on a lock.
Locks Held The number of locks currently held either by all applications in the database (database level) or by all agents for the application (application level).
Deadlocks The total number of deadlocks that have occurred since this instance of Performance Center started monitoring the database.
EMBARCADERO TECHNOLOGIES > EMBARCADERO PERFORMANCE CENTER 2.7 EXPERT GUIDE: DB2 43

DB2 EXPERT GUIDE > USERS PAGE STATISTICS
Sorting Tab
I/O Tab
Timeouts The number of times that a request to lock an object timed out without being granted.
Timeout Value (sec) Indicates the timeout value (in seconds) when an application has issued a SET CURRENT LOCK TIMEOUT statement.
Lock Escalations The number of times that locks have been escalated from row locks to table locks, since this instance of Performance Center started monitoring the database.
X Lock Escalations The number of times that locks have been escalated from several row locks to one exclusive table lock, or the number of times an exclusive lock on a row caused the table lock to become an exclusive lock.
Column Description
Agent ID This is a system-wide unique indentifier for the application.
Auth ID The authorization ID of the user who invoked the application that is being monitored.
Client PID The process ID of the client application that made the connection to the database.
OS User ID The authorization ID used to access the operating system.
Application Name of the application executable.
Status The current status of the application.
Coord Node In a multi-node system, this is the node number of the node where the selected application connected or attached to the instance.
Total Sort Time (ms) The total elapsed time (in milliseconds) for all sorts that have been executed.
Total Sorts The total number of sorts that have been executed.
Sort Overflows The total number of sorts that ran out of sort heap and may have required disk space for temporary storage.
Hash Joins The total number of hash joins executed.
Hash Join Loops The total number of times that a single partition of a hash join was larger than the available sort heap space.
Hash Join Overflows The number of times that hash join data exceeded the available sort heap space.
Hash Join Small Overflows The number of times that hash join data exceeded the available sort heap space by less than 10%.
Column Description
Agent ID This is a system-wide unique indentifier for the application.
Auth ID The authorization ID of the user who invoked the application that is being monitored.
Client PID The process ID of the client application that made the connection to the database.
OS User ID The authorization ID used to access the operating system.
Column Description
EMBARCADERO TECHNOLOGIES > EMBARCADERO PERFORMANCE CENTER 2.7 EXPERT GUIDE: DB2 44
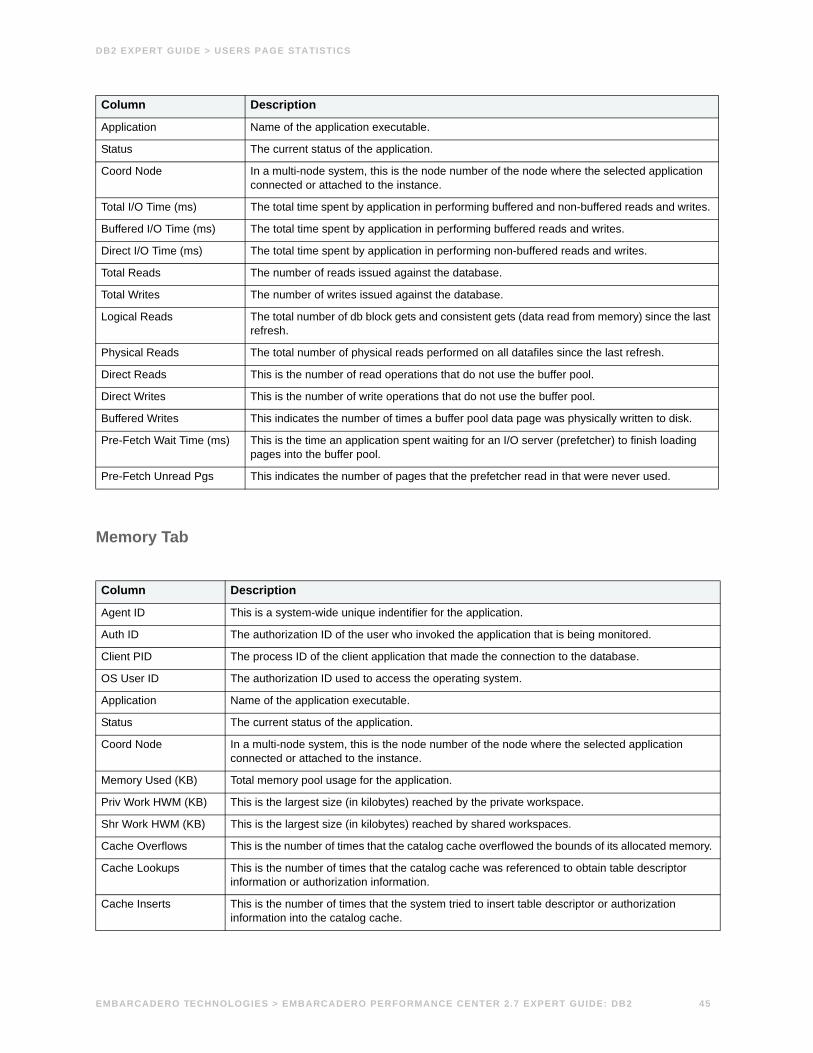
DB2 EXPERT GUIDE > USERS PAGE STATISTICS
Memory Tab
Application Name of the application executable.
Status The current status of the application.
Coord Node In a multi-node system, this is the node number of the node where the selected application connected or attached to the instance.
Total I/O Time (ms) The total time spent by application in performing buffered and non-buffered reads and writes.
Buffered I/O Time (ms) The total time spent by application in performing buffered reads and writes.
Direct I/O Time (ms) The total time spent by application in performing non-buffered reads and writes.
Total Reads The number of reads issued against the database.
Total Writes The number of writes issued against the database.
Logical Reads The total number of db block gets and consistent gets (data read from memory) since the last refresh.
Physical Reads The total number of physical reads performed on all datafiles since the last refresh.
Direct Reads This is the number of read operations that do not use the buffer pool.
Direct Writes This is the number of write operations that do not use the buffer pool.
Buffered Writes This indicates the number of times a buffer pool data page was physically written to disk.
Pre-Fetch Wait Time (ms) This is the time an application spent waiting for an I/O server (prefetcher) to finish loading pages into the buffer pool.
Pre-Fetch Unread Pgs This indicates the number of pages that the prefetcher read in that were never used.
Column Description
Agent ID This is a system-wide unique indentifier for the application.
Auth ID The authorization ID of the user who invoked the application that is being monitored.
Client PID The process ID of the client application that made the connection to the database.
OS User ID The authorization ID used to access the operating system.
Application Name of the application executable.
Status The current status of the application.
Coord Node In a multi-node system, this is the node number of the node where the selected application connected or attached to the instance.
Memory Used (KB) Total memory pool usage for the application.
Priv Work HWM (KB) This is the largest size (in kilobytes) reached by the private workspace.
Shr Work HWM (KB) This is the largest size (in kilobytes) reached by shared workspaces.
Cache Overflows This is the number of times that the catalog cache overflowed the bounds of its allocated memory.
Cache Lookups This is the number of times that the catalog cache was referenced to obtain table descriptor information or authorization information.
Cache Inserts This is the number of times that the system tried to insert table descriptor or authorization information into the catalog cache.
Column Description
EMBARCADERO TECHNOLOGIES > EMBARCADERO PERFORMANCE CENTER 2.7 EXPERT GUIDE: DB2 45

DB2 EXPERT GUIDE > USERS PAGE STATISTICS
SQL Activity Tab
Catlg Cache Hit Ratio The catalog cache hit ratio indicates how well the catalog cache is helping to avoid actual accesses to the catalog on disk. A high ratio indicates successful avoidance of actual disk I/O accesses.
Pkg Cache Hit Ratio The package cache hit ratio indicates how well the package cache is helping to avoid reloading packages and sections for static SQL from the system catalogs as well as helping to avoid recompiling dynamic SQL statements. A high ratio indicates successful avoidance of these activities.
Priv Work Hit Ratio The private workspace hit ratio indicates how well the private SQL workspace is helping to avoid having to initialize sections for SQL statements that are about to be executed. A high ratio indicate successful avoidance of this action.
Shr Work Hit Ratio The shared workspace hit ratio indicates how well the shared SQL workspace is helping to avoid having to initialize sections for SQL statements that are about to be executed. A high ratio indicate successful avoidance of this action.
Appl Sect Hit Ratio The application workspace hit ratio indicates how well the application SQL workspace is helping to avoid having to initialize sections for SQL statements that are about to be executed. A high ratio indicate successful avoidance of this action.
Column Description
Agent ID This is a system-wide unique indentifier for the application.
Auth ID The authorization ID of the user who invoked the application that is being monitored.
Client PID The process ID of the client application that made the connection to the database.
OS User ID The authorization ID used to access the operating system.
Application Name of the application executable.
Status The current status of the application.
Coord Node In a multi-node system, this is the node number of the node where the selected application connected or attached to the instance.
Rows Read This is the number of rows read from the table.
Rows Written This is the number of rows changed (inserted, deleted, or updated) in the table.
Rows Read Per Tran The average number of rows read per transaction.
Rows Written Per Tran The average number of rows read per transaction.
Transactions The total number of active transactions in that have not yet been committed, or are waiting on a blocking lock to complete.
Commits This is the total number of commits initiated by the database manager.
Rollbacks This is the total number of rollbacks initiated by the database manager.
Rows Selected This is the number of rows that have been selected and returned to the application.
Rows Inserted This is the number of row insertions attempted.
Rows Updated This is the number of row updates attempted.
Rows Deleted This is the number of row deletions attempted.
Select Stmts This is the percentage of all executed statements that were SQL Select Statements.
Column Description
EMBARCADERO TECHNOLOGIES > EMBARCADERO PERFORMANCE CENTER 2.7 EXPERT GUIDE: DB2 46

DB2 EXPERT GUIDE > INSTANCE PAGE STATISTICS
Instance Page StatisticsSummary Tab
• Memory
• Sort Heap Utilization
• Monitor Heap Utilization
• Sort Heap (MB)
• Private Memory (MB)
• Sorts/Joins
• Piped Sorts Requested
• Piped Sorts Rejected
• Post Threshold Sorts
• Post Threshold Hash Joins
• FCM
• Buffer Utilization
• Request Block Utilization
• Message Anchor Utilization
• Connection Entry Utilization
• Instance Identification
• Product Name
• Service Level
• Instance Type
• Instance Name
• Last Reset Time
• Active Databases
• Number of Nodes
• Operating System
DDL Stmts This is the percentage of all executed statements that were SQL DDL Statements.
Failed Stmts This is the percentage of all executed statements that were SQL Failed Statements.
Column Description
EMBARCADERO TECHNOLOGIES > EMBARCADERO PERFORMANCE CENTER 2.7 EXPERT GUIDE: DB2 47
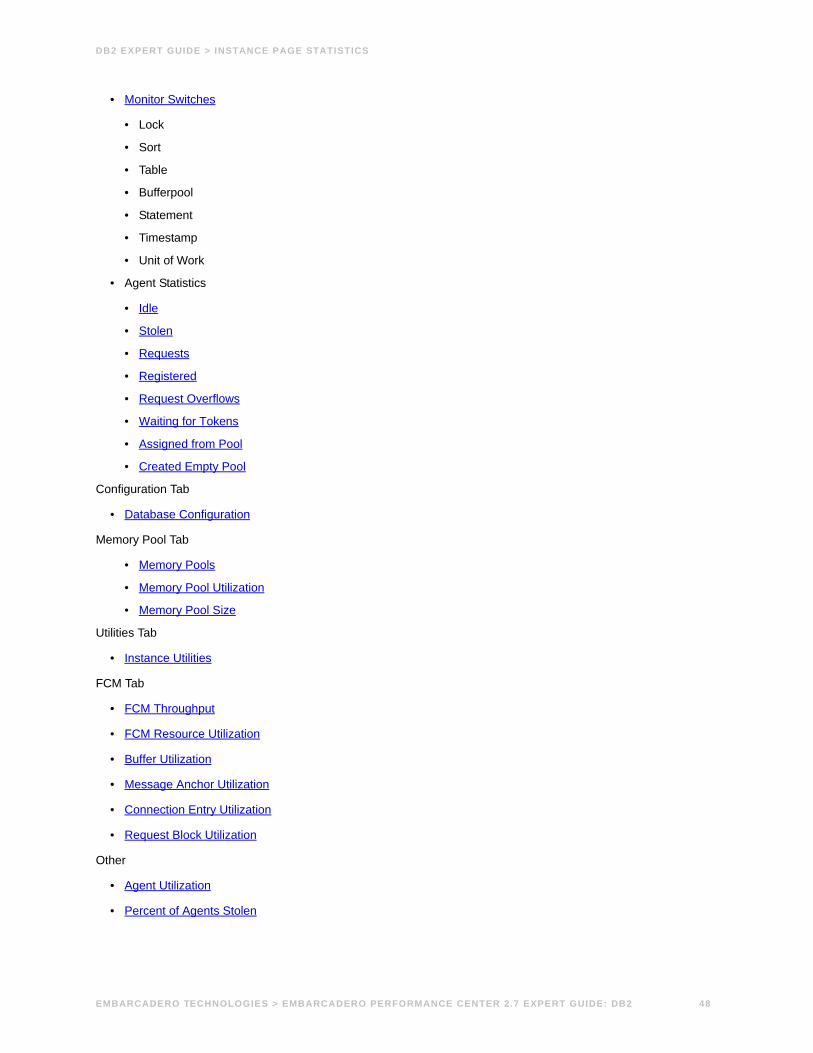
DB2 EXPERT GUIDE > INSTANCE PAGE STATISTICS
• Monitor Switches
• Lock
• Sort
• Table
• Bufferpool
• Statement
• Timestamp
• Unit of Work
• Agent Statistics
• Idle
• Stolen
• Requests
• Registered
• Request Overflows
• Waiting for Tokens
• Assigned from Pool
• Created Empty Pool
Configuration Tab
• Database Configuration
Memory Pool Tab
• Memory Pools
• Memory Pool Utilization
• Memory Pool Size
Utilities Tab
• Instance Utilities
FCM Tab
• FCM Throughput
• FCM Resource Utilization
• Buffer Utilization
• Message Anchor Utilization
• Connection Entry Utilization
• Request Block Utilization
Other
• Agent Utilization
• Percent of Agents Stolen
EMBARCADERO TECHNOLOGIES > EMBARCADERO PERFORMANCE CENTER 2.7 EXPERT GUIDE: DB2 48
DB2 EXPERT GUIDE > INSTANCE PAGE STATISTICS
Sort Heap UtilizationThe amount of memory allocated for each sort may be some or all of the available sort heap size. Sort heap size is the amount of memory available for each sort as defined in the database configuration parameter sortheap. Shared sort memory utilization gives the percentage of the sort heap being used.
It is possible for a single application to have concurrent sorts active. For example, in some cases a SELECT statement with a subquery can cause concurrent sorts.
MetricsMemory estimates do not usually include sort heap space. If excessive sorting is occurring, the extra memory used for the sort heap should be added to the base memory requirements for running the database manager. Generally, the larger the sort heap, the more efficient the sort. Typically the shared sort utilization should be less than or equal to 70%. You should consider tuning the database if you see a utilization value greater than this.
TroubleshootingTo bring the sort heap utilization to an acceptable level, use the following guidelines:
• Examine the queries you are running on the database to see if you can add indexes to columns frequently accessed in the WHERE clause. This minimizes the use of the sort heap.
• If you are using dynamic bitmaps or hash join buffers in your queries, or your queries frequently require large sorts, increase the sortheap size.
• If you adjust the sortheap size, also look at the sheapthres database manager configuration parameter to see if it too needs to be adjusted
If you are adjusting the sortheap size, you may also benefit from rebinding your packages since the optimizer takes this parameter into account when determining the access paths.
Monitor Heap UtilizationThe Monitor Heap Utilization statistic measures the consumption of monitor heap memory based on the memory pool. The utilization is calculated from using the following equation (db2.pool_cur_size / db2.pool_max_size) * 100.
MetricThe rate of utilization is measured by looking at the current memory heap pool size being used in relation to the maximum memory heap pool size. When the percentage reaches the maximum 100%, monitor operations may fail.
TroubleshootingIf you are experiencing trouble, consider increasing the monitor heap memory size.
Sort Heap (MB)The Sort Heap metric is the total number of allocated pages of sort heap space for all sorts at the database manager level and at the moment the snapshot was captured.
MetricSort heap size is the amount of memory available for each sort as defined in the sortheap database configuration parameter. At the database manager level, it is the total sort heap space allocated in all active databases in the database manager.
EMBARCADERO TECHNOLOGIES > EMBARCADERO PERFORMANCE CENTER 2.7 EXPERT GUIDE: DB2 49

DB2 EXPERT GUIDE > INSTANCE PAGE STATISTICS
TroubleshootingIf excessive sorting is occurring, you can add the extra memory used for the sort heap to the base memory requirements. Often, the larger the sort heap, the more efficient the sort. Use the information returned at the database manager level to help you adjust the sheapthres parameter.
Private Memory (MB)This is the amount of private memory that the instance of the database manager has allocated at the time the snapshot was taken.
To change the amount of private memory allocated, change the minimum committed private memory configuration parameter (min_priv_mem). The default value is recommended, but you can use it to commit more memory to the database server. If you set the allocation too high, you can have a negative impact on the performance of non-DB2 applications.
Piped Sorts RequestedThis metric gives the number of piped sorts that have been requested.
MetricsEach active sort on the system allocates memory, which may result in sorting taking up too much of the available system memory. A piped sort is not accepted if the sort heap threshold is exceeded when the sort heap is allocated for the sort.
The sort list heap (sortheap) and sort heap threshold (sheapthres) configuration parameters help control the amount of memory used for sort operations. These parameters are also used to determine whether a sort will be piped.
Since piped sorts may reduce disk I/O, allowing more piped sorts can improve the performance of sort operations and possibly the performance of the overall system.
TroubleshootingIf piped sorts are being rejected, you might consider decreasing your sort heap or increasing your sort heap threshold. You should be aware of the possible implications of either of these options. If you increase the sort heap threshold there is the possibility that more memory will remain allocated for sorting. This could cause paging memory to disk. If you decrease the sort heap, you might require an extra merge phase that could slow down the sort.
Piped Sorts RejectedThe piped sorts rejects statistic is the number of piped sorts that were rejected by the database manager.
MetricsEach active sort on the system allocates memory, which may result in sorting taking up too much of the available system memory. A piped sort is not accepted if the sort heap threshold is exceeded when the sort heap is allocated for the sort.
The sort list heap (sortheap) and sort heap threshold (sheapthres) configuration parameters help control the amount of memory used for sort operations. These parameters are also used to determine whether a sort will be piped.
Since piped sorts may reduce disk I/O, allowing more piped sorts can improve the performance of sort operations and possibly the performance of the overall system.
EMBARCADERO TECHNOLOGIES > EMBARCADERO PERFORMANCE CENTER 2.7 EXPERT GUIDE: DB2 50

DB2 EXPERT GUIDE > INSTANCE PAGE STATISTICS
TroubleshootingIf piped sorts are being rejected, you might consider decreasing your sort heap or increasing your sort heap threshold. You should be aware of the possible implications of either of these options. If you increase the sort heap threshold there is the possibility that more memory will remain allocated for sorting. This could cause paging memory to disk. If you decrease the sort heap, you might require an extra merge phase that could slow down the sort.
Post Threshold SortsThe post threshold sorts is the number of sorts that have requested heaps after the sort heap threshold has been exceeded.
MetricsUnder normal conditions, the Database Manager allocates sort heap using the value specified by the sortheap configuration parameter. If the amount of memory allocated to sort heaps exceeds the sort heap threshold (sheapthres configuration parameter), the database manager allocates sort heap using a value less than that specified by the sortheap configuration parameter.
Each active sort on the system allocates memory, which may result in sorting taking up too much of the system memory available. Sorts that start after the sort heap threshold has been reached may not receive an optimum amount of memory to execute. As a result, however, the entire system may benefit.
TroubleshootingBy modifying the sort heap threshold and sort heap size configuration parameters, the performance of sort operations and/or the overall system can be improved. If this element's value is high, you can:
• Increase the sort heap threshold (sheapthres) or,
• Adjust applications to use fewer or smaller sorts via SQL query changes.
Post Threshold Hash JoinsThe post threshold hash joins statistic is the number of times that a hash join heap request was limited because of concurrent use of shared or private sort heap space.
MetricsEach active sort on the system allocates memory, which may result in sorting taking up too much of the available system memory. A piped sort is not accepted if the sort heap threshold is exceeded when the sort heap is allocated for the sort.
The sort list heap (sortheap) and sort heap threshold (sheapthres) configuration parameters help control the amount of memory used for sort operations. These parameters are also used to determine whether a sort will be piped.
Since piped sorts may reduce disk I/O, allowing more piped sorts can improve the performance of sort operations and possibly the performance of the overall system.
TroubleshootingIf this value is large (greater than 5% of hash join overflows), the sort heap threshold should be increased.
EMBARCADERO TECHNOLOGIES > EMBARCADERO PERFORMANCE CENTER 2.7 EXPERT GUIDE: DB2 51

DB2 EXPERT GUIDE > INSTANCE PAGE STATISTICS
Buffer UtilizationThis element indicates the percentage of all FCM buffers that are currently being used by the fast communication manager.
MetricsNone.
TroubleshootingYou can use this information to tune fcm_num_anchors. If the utilization percentage is high, you should increase the fcm_num_anchors to ensure that operations do not run out of FCM message anchors. If the utilization is low, you can decrease fcm_num_anchors to conserve system resources.
Request Block UtilizationThis element indicates the percentage of all request blocks that are currently being used by the fast communication manager.
NOTE: This metric is only applicable to DB2 version 7. In DB2 version 8, the maximum request blocks are adjusted dynamically and automatically
TroubleshootingYou can use this information to tune fcm_num_rqb. If the utilization percentage is high, you should increase the fcm_num_rqb to ensure that operations do not run out of FCM request blocks. If the utilization is low, you can decrease fcm_num_rqb to conserve system resources.
Message Anchor UtilizationThis element indicates the percentage of all message anchors that are currently being used by the fast communication manager.
NOTE: This metric is only applicable to DB2 version 7. In DB2 version 8, the maximum message anchors are adjusted dynamically and automatically
MetricsNone.
TroubleshootingYou can use this information to tune fcm_num_buffers. If the utilization percentage is high, you should increase the fcm_num_buffers to ensure that operations do not run out of FCM buffers. If the utilization is low, you can decrease fcm_num_buffers to conserve system resources.
Connection Entry UtilizationThe connection entry utilization element indicates the percentage of all connection entries that are currently being used by the fast communication manager.
NOTE: This metric is only applicable to DB2 version 7. In DB2 version 8, the maximum connection entries are adjusted dynamically and automatically.
EMBARCADERO TECHNOLOGIES > EMBARCADERO PERFORMANCE CENTER 2.7 EXPERT GUIDE: DB2 52

DB2 EXPERT GUIDE > INSTANCE PAGE STATISTICS
TroubleshootingYou can use this information to tune fcm_num_connect. If the utilization percentage is high, you should increase the fcm_num_connect to ensure that operations do not run out of FCM connection entries. If the utilization is low, you can decrease fcm_num_connect to conserve system resources.
Instance IdentificationThe following information about the database instance is displayed.
Monitor SwitchesMonitor switches control the collection of potentially expensive data by the database manager. Each switch can be set to ON or OFF.
LockThe lock monitor switch controls the collection of data related to the lock wait times and deadlocks.
SortThe sort monitor switch controls the collection of data related to the number of heaps used and sort performance.
TableThe table monitor switch controls the collection of data related to the measure of activity (rows read/written).
BufferpoolThe bufferpool monitor switch controls the collection of data related to the number of reads and writes and the amount of time taken.
StatementThe statement monitor switch controls the collection of data related to the start/stop time and statement identification.
Database Instance Information Description
Product Name: The name of the database software.
Service Level: The FixPack level.
Instance Type: The type of DB2 server.
Instance Name: The name of the DB2 instance.
DB2 Start Time: The date and time that the database manager was started using the db2start command.
Active Databases: The number of active databases running on the server.
Number of Nodes: The number of nodes running on the instance.
Operating System: The operating system the database is running on.
EMBARCADERO TECHNOLOGIES > EMBARCADERO PERFORMANCE CENTER 2.7 EXPERT GUIDE: DB2 53

DB2 EXPERT GUIDE > INSTANCE PAGE STATISTICS
TimestampThe timestamp monitor switch controls the collection of timestamps. This switch is ON by default.
Unit of WorkThe unit of work monitor switch controls the collection of data related to start and end times and completion status.
IdleAn idle agent is one type of worker agent, that is an agent that carries out application requests but that has no fixed attachment to any given application. More specifically, an idle agent doesn’t have a local database or outbound connection.
Metrics The idle agents metric is the number of agents in the agent pool that are currently unassigned to an application and are, therefore, “idle.”
Having idle agents available to service requests for agents can improve performance.
TroubleshootingYou can use this element to help set the num_poolagents configuration parameter.
StolenThis is the number of times agents are stolen. Agents are stolen when an idle agent is reassigned from one application to another.
MetricAgents stolen can be used along with associate_agents_top to evaluate the load the application places on the system.
TroubleshootingIf agents_stolen is high, try increasing the num_poolagents configuration parameter.
RequestsThis metric is the number of requests for agents from the agent pool. As requests are made, idle agents are deployed.
TroubleshootingAdjust the num_poolagents configuration parameter if there are there are more requests than agents available.
RegisteredThe agents registered metric is the number of agents registered in the Database Manager instance that is being monitored (coordinator agents and subagents).
EMBARCADERO TECHNOLOGIES > EMBARCADERO PERFORMANCE CENTER 2.7 EXPERT GUIDE: DB2 54
DB2 EXPERT GUIDE > INSTANCE PAGE STATISTICS
MetricsNone.
TroubleshootingYou can use this element to help evaluate your setting for the maxagents configuration parameter.
Request OverflowsRequest Overflows is the maximum number of agents associated with an application. The max_agent_overflows metric is the number of requests received after the maxagents configuration parameter has been reached.
Waiting for TokensThe agents waiting for tokens statistic is the number of agents waiting for a token so they can execute a transaction in the database manager.
MetricsEach application has a dedicated coordinator agent to process database requests within the Database Manager. Furthermore, each agent has to get a token before it can execute a transaction. The maximum number of agents that can execute Database Manager transactions is limited by the configuration parameter maxcagents.
TroubleshootingYou can use this element to help evaluate your setting for the maxcagents configuration parameter.
Assigned from PoolThis is the number of agents that have been assigned from the pool of agents available.
TroubleshootingUse the agents_created_empty_pool in conjunction with the agents_from_pool metric to determine how often an agent has to be created because the pool is empty. If you see the ratio (Agents Created Due to Empty Agent Pool / Agents Assigned from Pool) is high, consider increasing the num_poolagents configuration parameter.
A low ratio suggests num_poolagents is set too high and rarely used agents are wasting resources. A high ratio may indicate the workload is too high for that node.
Created Empty PoolThis is the number of agents created because the agent pool ran dry. The metric includes the number of agents at startup (num_intiagents).
TroubleshootingUse the agents_created_empty_pool in conjunction with the agents_from_pool metric to determine how often an agent has to be created because the pool is empty. If you see the ratio (Agents Created Due to Empty Agent Pool / Agents Assigned from Pool) is high, consider increasing the num_poolagents configuration parameter.
EMBARCADERO TECHNOLOGIES > EMBARCADERO PERFORMANCE CENTER 2.7 EXPERT GUIDE: DB2 55

DB2 EXPERT GUIDE > INSTANCE PAGE STATISTICS
A low ratio suggests num_poolagents is set too high and rarely used agents are wasting resources. A high ratio may indicate the workload is too high for that node.
Database ConfigurationThe following information about the Database Manager (Instance) is available on the configuration tab:
Memory PoolsThis section shows the memory pool usage details of the selected memory pool over time.
MetricsThe nature of memory_pool data elements varies between platforms. On Windows systems, no memory usage is reported at the database level, while on UNIX systems, memory is reported at the database level. Instead of reporting this memory at the database level, the system monitor for Windows systems reports it in instance -level snapshots. This divergence in reporting is due to differences in the underlying memory architecture between Windows systems and UNIX systems.
Memory Pool UtilizationThis section shows the percentage of utilization of the selected memory pool.
MetricsYou can use this metric to see if a memory pool is nearly full. You can diagnose the problems with specific memory pools by monitoring their utilization over time.
Database Manager Information Description
Parameter: The parameter name.
Description: The description of the parameter.
Value: The value set for the parameter.
Modifiable: Whether the parameter is modifiable or not.
Usage Details Description
Node: Indicates the database partition number.
Memory Pool: This is the kind of memory pool. Each pool type is only shown once.
Utilization: The percentage of utilization of the selected memory pool.
High Watermark (MB): The largest size of a memory pool since its creation.
Current Size (MB): The current size of a memory pool.
Max Size (MB): The internally configured size of a memory pool in DB2 UDB.
EMBARCADERO TECHNOLOGIES > EMBARCADERO PERFORMANCE CENTER 2.7 EXPERT GUIDE: DB2 56

DB2 EXPERT GUIDE > INSTANCE PAGE STATISTICS
TroubleshootingIf the value of the pool utilization is consistently close to or exceeds 100%, you may need to increase the configuration parameter associated with that pool.
Memory Pool SizeThis section shows the current memory pool size for the selected application (or database level).
Instance UtilitiesThe Utilities tab of the Instance Page gives information on the utilities currently executing in the database manager (available in DB2 version 8 only). The Utilitity details are as follows:
FCM ThroughputThis section gives a detailed view of inter-node communication in a multipartition environment. The information shown here includes the connection status and buffers sent and received between various combinations of partitions in a multi-partitioned environment. The columns presented here include:
Source Node: Partition that sends the information.
Target Node: Partition that received the information.
Buffers Sent: Number of Buffers sent from source node to the target node.
Buffers Received: Number of Buffers sent from source node to the target node.
Connection Status: Status of the connection between nodes.
MetricsIf the total number of FCM buffers sent or received between selected nodes is high, you may want to redistribute the database, or move tables to reduce the inter-node traffic.
Utility Details Description
Node: Indicates the database partition number.
Database: Database on which the utility is operating.
ID: The unique identifier corresponding to the utility invocation.
Type: Class of the utility (Rebalance, Backup, Restore, Reorg, etc.).
Description: A brief description of the work the utility is performing.
Start Time: The time the utility was invoked.
% Complete: Shows the completion status of the utility.
EMBARCADERO TECHNOLOGIES > EMBARCADERO PERFORMANCE CENTER 2.7 EXPERT GUIDE: DB2 57

DB2 EXPERT GUIDE > INSTANCE PAGE STATISTICS
FCM Resource UtilizationThe FCM Resource Utilization chart shows the following:
Node: Indicates the database partition number.
FCM Buffer Utilization: The current utilization and low watermark of FCM buffers.
FCM Message Anchor Utilization: The current utilization and low watermark of FCM message anchors.
FCM Connection Entries Utilization: The current utilization and low watermark of FCM connection entries.
FCM Request Block Utilization: The current utilization and low watermark of FCM request blocks.
Agent UtilizationAgent Utilization is the percentage of available database manager agents (maxagents) that are currently registered on the database manager (agents_registered).
Percent of Agents StolenPercent of Agents Stolen is the percentage of all agent requests—including the number of agents assigned from the agent pool (agents_from_pool), the number of agents created because the agent pool was empty (agents_created_empty_pool), and the number of agents stolen (agents_stolen)—that were agents stolen.
EMBARCADERO TECHNOLOGIES > EMBARCADERO PERFORMANCE CENTER 2.7 EXPERT GUIDE: DB2 58

Other Views and StatisticsIn addition to the Home view, Enterprise view, and the performance category views, Performance Center offers many other views. The tables below lists, by database platform, the other views available in Performance Center:
Archive View• Metrics
To allow for point-in-time recovery, Oracle writes copies of redo log information to disk. When a database is running in archive log mode, a DBA, with proper backup techniques in place, can recover nicely from a database error and roll forward to almost any point in time as long as the proper archive logs are in place.
The I/O needed to write these archive logs is handled by Oracle's ARCH process. The Archive view allows archive files written by the ARCH process to be viewed by user-specified time frames. The table below describes the information available on the Archive view:
TIP: To configure the grid to show/hide row numbers, use the Options Editor.
MetricsNumerous archive files can be written to disk if there is heavy redo log activity. Batch jobs have the potential to move very fast; sometimes so fast that the online redo logs wrap back around before they have a chance to be archived. Messages indicating this has happened show up in the Oracle alert log. If this happens frequently, you should think about increasing the size of the online redo log files, or increasing the number of redo logs in general.
View Oracle SQL Server Sybase DB2
Alert Log x x x x
Archive x
Configuration Parameters x x x
Health Index x x x x
Hot Objects x
Instance Parameters x
Lock x x x x
Operating System x x x x
Session Detail x x x x
SQL Server Logs x
Top Sessions x x x x
Top SQL x x x
Trends x x x x
Column Description
Date/Time The timestamp of the archive log (when the log was written).
Title The actual archive log file name and path.
EMBARCADERO TECHNOLOGIES > EMBARCADERO PERFORMANCE CENTER 2.7 EXPERT GUIDE: SYBASE 59

OTHER VIEWS AND STATISTICS > HEALTH INDEX VIEW
Seeing archive files written at a rate of more than one every 30-60 minutes can indicate the redo size is too small (or there is an above-average data modification load).
If you do not want to lose an archive file that can be needed for recovery and you are using Oracle 8 or later, you can take advantage of the feature where you can write archive files to more than one destination on disk. This feature also allows multiple ARCH processes to be invoked. Investigate using the Init.ora parameters log_archive_dest_n and log_archive_max_processes.
Always remember one thing with respect to archive files and running Oracle in archive log mode: Running out of archive file space on the server can halt all activity in a database. Make sure you have ample free space available on your archive drives. And, you should also implement a purge procedure for older archives in conjunction with your backup routine.
Health Index View • Metrics
Performance Center's global and category-specific health indexes are fast and efficient indicators you can use to determine if a database is experiencing problems. They also locate the most problematic area(s). With the Health Index view, you can scan individual category indexes simultaneously and see, over time, where the problem areas reside.
MetricsGenerically speaking, you should investigate any index that falls below 90. Temporary dips in a health index graph should not be a cause for concern unless the dips form a pattern and occur on a predictable and continuous basis.
Hot ObjectsThe following tabbed pages are available on the Hot Objects view:
• Hot Tables
• Hot Code
NOTE: The Hot Objects view is for Oracle datasources.
Hot Tables• Metrics
Certain objects in an Oracle database are accessed more than others. These objects can become a source of contention given certain conditions. The Hot Tables tab of the Hot Objects view identifies tables that are being frequently accessed through various SQL statements. The table below describes the information that Performance Center displays on the Hot Tables tab of the Hot Objects view:
Column Description
Table Owner The owner of the table.
Table Name The name of the table.
Command Issued The SQL statement command issued against the table.
Executions The number of SQL executions the object has experienced.
EMBARCADERO TECHNOLOGIES > EMBARCADERO PERFORMANCE CENTER 2.7 EXPERT GUIDE: SYBASE 60

OTHER VIEWS AND STATISTICS > LOCK VIEW
MetricsDML activity against tables can cause contention for space management objects like free lists. Oracle9i and above provides automatic segment management, which can remove problems with free lists and the like.
Hot Code• Metrics
Certain objects in an Oracle database are accessed more than others. Data objects can become a source of contention given certain conditions, while code objects rarely cause contention issues. The Hot Code tab of the Hot Objects view identifies code objects (procedure, functions, etc.) that are being frequently accessed through various SQL statements. The table below describes the information that Performance Center displays on the Hot Code tab of the Hot Objects view:
MetricsOften referenced code objects should be pinned in the shared pool using the Oracle DBMS_SHARED_POOL package. Objects with many executions and loads should be considered candidates for pinning.
Lock ViewThe following tabbed pages are available on the Lock view:
• All Locks
• All User Locks (Oracle only)
• Blocking Locks
• Locks View for DB2
Disk Reads The number of estimated disk reads from the object.
Buffer Gets The number of estimated logical I/O’s from the object.
Rows Processed The number of estimated rows processed from the object.
Column Description
Object Owner The owner of the object.
Object Name The name of the object.
Object Type The type of object (package, etc.)
# of Executions The number of estimated executions for the object.
Loads The number of times the object was loaded into the shared pool.
Locks The number of locks the object has experienced.
Pins The number of times the object was pinned in the shared pool.
Column Description
EMBARCADERO TECHNOLOGIES > EMBARCADERO PERFORMANCE CENTER 2.7 EXPERT GUIDE: SYBASE 61

OTHER VIEWS AND STATISTICS > LOCK VIEW
All Locks TabThe information on the All Locks tab of the Locks view depends on the target DBMS:
• Oracle
• SQL Server
• Sybase
All Locks Tab for Oracle• Metrics
To modify database information or structures, a user session must obtain a lock on the object to perform its task. In addition to user locks, Oracle issues lock requests to carry out its internal duties. The All Locks tab of the Locks view displays information about all locks currently on a system. The table below describes the information available on the All Locks tab of the Locks view for Oracle:
TIP: To configure the grid to show/hide row numbers, use the Options Editor.
MetricsLocks held for unusually long periods are candidates for further investigation. The application logic can be inefficient or the program may not be issuing COMMIT frequently enough.
All Locks Tab for SQL Server• Metrics
To modify database information or structures, a user session must obtain a lock on the object to perform its task. In addition to user locks, SQL Server issues lock requests to carry out its internal duties. Performance Center displays information about all locks currently on a system on the All Locks tab of the Locks view and the Lock Detail grid on the Lock tab of the Contention Detail view.
Column Description
SID The session identifier of the session holding the lock.
User Name The user account of the session holding the lock. NULL if it is a background process.
Lock Mode The lock mode (EXCLUSIVE, SHARE, etc.)
Request Type The type of lock requested by the session.
Object Name The name of the object being locked.
Object Type The type of object being locked (TABLE, etc.)
Lock Type The type of lock (TRANSACTION, DML, etc.)
Lock ID 1 The lock identifier #1 (depends on type).
Lock ID 2 The lock identifier #2 (depends on type).
EMBARCADERO TECHNOLOGIES > EMBARCADERO PERFORMANCE CENTER 2.7 EXPERT GUIDE: SYBASE 62

OTHER VIEWS AND STATISTICS > LOCK VIEW
The table below describes the information available on the tab and the grid:
NOTE: The information in the Lock Detail grid is available in the Lock Detail grid on the Locks tab of the Contention Detail view and the All Locks tab of the Locks view.
TIP: To configure the grid to show/hide row numbers, use the Options Editor.
MetricsLocks held for unusually long periods are candidates for further investigation. The application logic may be inefficient or the program may not be issuing COMMIT frequently enough.
All Locks Tab for Sybase• Metrics
Column Description
SPID The process ID of the process holding the lock.
Login The login name of the process.
NT User The operating system name of the process.
Database The database where the locks are occurring.
Table Name The name of the table involved in a lock. This will be NULL for non-table locks or table locks that take place in the tempdb database.
Ndx ID The index ID involved in the lock.
Lock Type The type of lock (database, table, row ID, etc.)
Lock Mode The mode of the lock (shared, exclusive, etc.)
Lock Status The status of the lock (waiting or granted).
Owner Type Whether the lock came from a regular session or a transaction.
Program The executable the process is using against the server.
BLK SPID If nonzero, the process ID of the process blocking the requested lock. A value of zero indicates that the process is not blocked.
Wait Time The time the process has waited for the lock, in milliseconds.
Status Indicates if the process is actively performing work, is idle, blocked by another process, etc.
Command The command the process is currently issuing.
NT Domain The name of the Windows 2000/NT domain.
EMBARCADERO TECHNOLOGIES > EMBARCADERO PERFORMANCE CENTER 2.7 EXPERT GUIDE: SYBASE 63
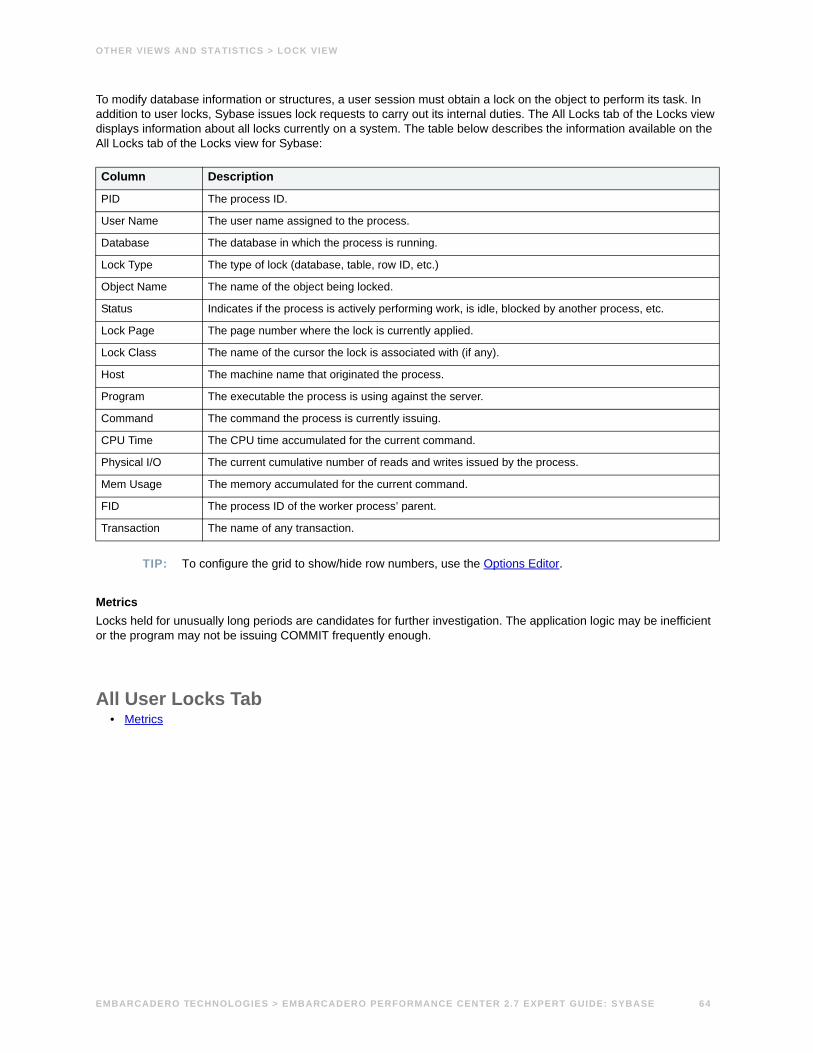
OTHER VIEWS AND STATISTICS > LOCK VIEW
To modify database information or structures, a user session must obtain a lock on the object to perform its task. In addition to user locks, Sybase issues lock requests to carry out its internal duties. The All Locks tab of the Locks view displays information about all locks currently on a system. The table below describes the information available on the All Locks tab of the Locks view for Sybase:
TIP: To configure the grid to show/hide row numbers, use the Options Editor.
MetricsLocks held for unusually long periods are candidates for further investigation. The application logic may be inefficient or the program may not be issuing COMMIT frequently enough.
All User Locks Tab• Metrics
Column Description
PID The process ID.
User Name The user name assigned to the process.
Database The database in which the process is running.
Lock Type The type of lock (database, table, row ID, etc.)
Object Name The name of the object being locked.
Status Indicates if the process is actively performing work, is idle, blocked by another process, etc.
Lock Page The page number where the lock is currently applied.
Lock Class The name of the cursor the lock is associated with (if any).
Host The machine name that originated the process.
Program The executable the process is using against the server.
Command The command the process is currently issuing.
CPU Time The CPU time accumulated for the current command.
Physical I/O The current cumulative number of reads and writes issued by the process.
Mem Usage The memory accumulated for the current command.
FID The process ID of the worker process’ parent.
Transaction The name of any transaction.
EMBARCADERO TECHNOLOGIES > EMBARCADERO PERFORMANCE CENTER 2.7 EXPERT GUIDE: SYBASE 64

OTHER VIEWS AND STATISTICS > LOCK VIEW
To modify database information or structures, a user session must obtain a lock on the object to perform its task. The All User Locks tab of the Locks view displays information about all user locks currently on a system. The table below describes the information available on the All User Locks tab of the Locks view:
NOTE: The All User Locks tab of the Locks view is only available for Oracle datasources.
TIP: To configure the grid to show/hide row numbers, use the Options Editor.
MetricsLocks held for unusually long periods are candidates for further investigation. The application logic may be inefficient or the program may not be issuing COMMITs frequently enough.
Blocking Locks TabThe information on the Blocking Locks tab of the Locks view depends on the target DBMS.
• Oracle
• SQL Server
• Sybase
Blocking Locks Tab for Oracle• Metrics
Blocking-lock situations can make the database appear frozen, rivalling only a stuck archive in effect. A single blocking user has the potential to stop work for nearly all other processes on a small system, or can cause major headaches on large systems. Although Oracle supports unlimited row-level locking, blocking-lock situations do occur - sometimes frequently.
Column Description
User Name The user account that holds the lock.
Terminal The machine name of the client session.
SID The unique Oracle identifier for the session.
Serial # The serial number of the lock.
Table The name of the object being locked.
Lock Mode The lock mode (EXCLUSIVE, SHARE, etc.)
Request The type of lock requested by the session.
EMBARCADERO TECHNOLOGIES > EMBARCADERO PERFORMANCE CENTER 2.7 EXPERT GUIDE: SYBASE 65

OTHER VIEWS AND STATISTICS > LOCK VIEW
The Blocking Locks tab of the Locks view contains information relating to user accounts that are currently blocked and the sessions that are blocking them. The table below describes the information available on the Blocking Locks tab of the Locks view for Oracle:
TIP: To configure the grid to show/hide row numbers, use the Options Editor.
MetricsWhen a blocking lock is discovered, the DBA can quickly remedy the situation by issuing a KILL against the offending process. This eliminates the user’s stranglehold on the objects the user was accessing. Other user processes then usually complete in an instant. Tools like Performance Center make it easier to discover the blocking-lock situation.
The culprit of blocking-lock scenarios is often the application design, or the SQL used within the application itself. Properly coding an application to reference database objects in an efficient order, and then using the right SQL to get the job done, is an art. Most DBAs who have had to face Oracle Forms applications have suffered through the dreaded SELECT…FOR UPDATE statements that place unnecessary restrictive locks on nearly every read operation. The key to avoiding lock contention is to process user transactions in the quickest and most efficient manner possible - something not always easy to do.
Data warehouses, whose data is mostly read, can benefit from tablespaces set in read-only mode. Read-only mode signals to the other databases that exclusive locks need not be used for the data contained within the tablespace. This is especially helpful in Oracle Parallel Server environments and drastically reduces ping activity.
Blocking Locks Tab for SQL Server• Metrics
Performance Center displays information about all blocking locks currently on a system on the Blocking Locks tab of the Locks view and the Blocking Lock Detail grid on the Blocking Lock tab of the Contention Detail view.
Column Description
Blocked SID The session ID of the session waiting for the lock.
Blocked User The user account of the session waiting for the lock.
Wait Time (sec) The current wait time for the session, in seconds.
Blocking SID The session ID of the session holding the offending lock.
Blocking User The user account of the session holding the offending lock.
Lock Type The type of lock (TRANSACTION, DML, etc.)
Lock Mode The lock mode (EXCLUSIVE, SHARE, etc.)
Request Type The type of lock being requested by the session.
Locked Object The name of the object being locked.
EMBARCADERO TECHNOLOGIES > EMBARCADERO PERFORMANCE CENTER 2.7 EXPERT GUIDE: SYBASE 66

OTHER VIEWS AND STATISTICS > LOCK VIEW
The table below describes the information available on the tab and the grid:
NOTE: The information in the Blocking Lock Detail grid is available in the Blocking Lock Detail grid on the Blocking Locks tab of the Contention view and the Blocking Locks tab of the Locks view.
TIP: To configure the grid to show/hide row numbers, use the Options Editor.
MetricsWhen a blocking lock is discovered, the DBA can quickly remedy the situation by issuing a KILL against the offending process. This eliminates the user’s stranglehold on the objects the user was accessing. Other user processes then usually complete in an instant. Tools like Performance Center make it easier to discover the blocking-lock situation.
Blocking Locks Tab for Sybase• Metrics
Column Description
SPID The process ID of the process holding the lock.
Login The login name of the process.
NT User The operating system name of the process.
Database The database where the locks are occurring.
Table Name The name of the table involved in a lock. This will be NULL for non-table locks or table locks that take place in the tempdb database.
Ndx ID The index ID involved in the lock.
Lock Type The type of lock (database, table, row ID, etc.).
Lock Mode The mode of the lock (shared, exclusive, etc.).
Lock Status The status of the lock (waiting or granted).
Owner Type Whether the lock came from a regular session or a transaction.
Program The executable the process is using against the server.
BLK SPID If nonzero, the process ID of the process blocking the requested lock. A value of zero indicates that the process is not blocked.
Wait Time The time the process has waited for the lock, in milliseconds.
Status Indicates if the process is actively performing work, is idle, blocked by another process, etc.
Command The command the process is currently issuing.
NT Domain The name of the Windows 2000/NT domain.
EMBARCADERO TECHNOLOGIES > EMBARCADERO PERFORMANCE CENTER 2.7 EXPERT GUIDE: SYBASE 67

OTHER VIEWS AND STATISTICS > LOCK VIEW
The Blocking Locks tab of the Locks view contains information relating to user accounts that are currently blocked and the sessions that are blocking them. The table below describes the information available on the Blocking Locks tab of the Locks view for Sybase:
TIP: To configure the grid to show/hide row numbers, use the Options Editor.
MetricsWhen a blocking lock is discovered, the DBA can quickly remedy the situation by issuing a KILL against the offending process. This eliminates the user’s stranglehold on the objects the user was accessing. Other user processes then usually complete in an instant. Tools like Performance Center make it easier to discover the blocking-lock situation.
Locks View for DB2The Locks view displays all processes that are currently holding locks on an IBM DB2 UDB database. The following sections of this view are available to display lock information:
• Applications
• Locks Held Tab
Column Description
Holding PID The process ID that owns the blocking lock.
Holding User The user account of the session holding the offending lock.
Waiting PID The session PID of the session waiting for the lock.
Waiting User The user account of the session waiting for the lock.
Database The database in which the process is running.
Object Name The table on which the lock is being held.
Status Indicates if the process is actively performing work, is idle, blocked by another process, etc.
Lock Type The type of lock being applied.
Time Blocked The time that a process has been waiting for the lock, in seconds.
Lock Page The page number where the lock is currently applied.
Lock Class The name of the cursor the lock is associated with (if any).
Holding Host The name of the host computer with the blocking lock.
Waiting Host The name of the host computer waiting for the lock.
Holding Program The program the process is running that has the lock.
Waiting Program The program the process is running that is waiting for the lock.
Holding Command The command being issued by the process holding the lock.
Waiting Command The command being issued by the process waiting for the lock.
CPU Time The CPU time accumulated for the current command.
Physical I/O The physical I/O accumulated for the current command.
Mem Usage The memory accumulated for the current command.
Holding FID The process ID of the worker process' parent that has the lock.
Waiting FID The process ID of the worker process' parent that is waiting for the lock.
Transaction The name of the associated transaction (if any).
EMBARCADERO TECHNOLOGIES > EMBARCADERO PERFORMANCE CENTER 2.7 EXPERT GUIDE: SYBASE 68

OTHER VIEWS AND STATISTICS > LOCK VIEW
• Locks Waiting Tab
• Unit of Work Tab
ApplicationsThis section lists the following lock information for all applications:
Agent ID – The application handle of the agent holding a lock for which this application is waiting.
Auth ID – The authorization ID of the user who invoked the application that is being monitored.
OS User ID – The authorization ID used to access the operating system.
Client PID – The process ID of the client application that made the connection to the database.
Application – Name of the application executable.
Status – The lock's status (waiting or granted).
Locks Held – The number of locks on the lock being held.
Locks Waiting – Indicates the number of agents waiting on a lock
Lock Wait Time (ms) – The current amount of wait time for the process, in milliseconds.
Timeouts – The number of times that a request to lock an object timed out without being granted.
Deadlocks – Processes that cannot proceed because they are waiting on a set of resources held by each other or held by other processes.
Locks Held TabThis tab displays all the locks held by the selected application in the Applications list. The following data is available:
Lock Mode – The type of lock being held.
Object Type – The type of object against which the application holds a lock (for object-lock-level information), or the type of object for which the application is waiting to obtain a lock (for application-level and deadlock-level information).
Table Schema – Schema of the table that the lock is on.
Table Name – Name of the table that the lock is on. This element is only set if Object Type indicates Table.
Tablespace – The name of the table space against which the lock is held.
Lock Status – The lock's status (waiting or granted).
Escalation – Indicates whether a lock request was made as part of a lock escalation.
Locks Waiting TabThis tab displays all the locks waiting by the selected application in the Applications list. The following data is available:
Agent ID – The application handle of the agent holding a lock for which this application is waiting.
Application ID – The application ID of the application that is holding a lock on the object that this application is waiting to obtain.
Lock Mode – The type of lock being held.
EMBARCADERO TECHNOLOGIES > EMBARCADERO PERFORMANCE CENTER 2.7 EXPERT GUIDE: SYBASE 69

OTHER VIEWS AND STATISTICS > OPERATING SYSTEM VIEW
Mode Requested – The lock mode being requested by the application.
Object Type – The type of object against which the application holds a lock.
Table Schema – Schema of the table that the lock is on.
Table Name – Name of the table that the lock is on. This element is only set if Object Type indicates Table.
Tablespace – The name of the table space against which the lock is held.
Wait Start Time – The date and time that this application started waiting to obtain a lock on the object that is currently locked by another application
Escalation – Indicates whether a lock request was made as part of a lock escalation.
Unit of Work TabThis tab displays the SQL statement text for the selected application. The statement is available if the selected application is in lock wait status or is the thread blocking other applications. This enables you to easily identify what SQL statements are causing lock wait conditions and to help diagnose deadlock scenarios.
Click Explain SQL to view an explain plan for the statement.
Operating System ViewThe Operating System view displays vital operating system statistics on the following tabbed pages:
• Summary
• CPU
• Processes
• I/O
• Memory
• Space
• Network
EMBARCADERO TECHNOLOGIES > EMBARCADERO PERFORMANCE CENTER 2.7 EXPERT GUIDE: SYBASE 70

OTHER VIEWS AND STATISTICS > OS PAGE STATISTICS
To use integrated security, or gather certain operating system statistics, there are two main things to know:
1 You must enable the Performance Center Server for operating system monitoring. To enable it, you must select the Enable operating system monitoring option on the Machine tab of the Datasource Properties dialog.
2 You must supply the credentials necessary to view these statistics. To be able to view performance counters on a remote computer, Microsoft requires specific permissions on the remote computer that you want to monitor.
Because the Performance Center Server collects data using the registry, monitoring a remote computer requires the use of the Remote Registry Service. If the service stops due to failure, the system restarts it automatically only once. Therefore, if the service stops again, you must manually restart it. You can change this default behavior by modifying the properties for Remote Registry Service. To access service properties, see Services under Services and Applications in Computer Management or see Administrative Tools. You can also check the Event Viewer’s Application and System Logs for events that might have stopped the service.
Remote data collection also requires access to specific registry subkeys and system files. To provide remote access to the registry to collect data on remote systems, Microsoft requires that users have a minimum of Read access to the Winreg subkey in HKEY_LOCAL_MACHINE\SYSTEM\CurrentControlSet\Control\SecurePipeServers. By default, members of the Administrators group have Full Control access and members of the Backup Operators group have Read access. Microsoft also requires that users have Read access to the registry subkey that stores counter names and descriptions used by System Monitor, HKEY_LOCAL_MACHINE\SOFTWARE\Microsoft\Windows NT\CurrentVersion\Perflib\LanguageID, where LanguageID is the numeric code for the spoken language for the operating system installation. (For English, the subkey is Perflib\009.) By default, Microsoft gives Full Control access to the System account and members of the Administrators and Creator Owners groups. Therefore, a local user on a server who is not logged in as an administrator cannot see performance counters.
In addition, users might also require read access to the files that supply counter names and descriptions to the registry, Perfc*.dat and Perfh*.dat. (where the asterisk is a wildcard character representing the specific language code; for English, these are Perfc009.dat and Perfh009.dat.) If these files reside on an NTFS volume, to have access to them, the access control lists (ACLs) on these files must specify that the user has such access. By default, members of the Administrators and Interactive groups have sufficient access.
OS Page StatisticsIn many scenarios, an optimally tuned database may not perform well because there are constraints imposed by the system where the database is running. These constraints may include processes competing with the database sever for resources (CPU, I/O, or Memory), a slow CPU, insufficient or slow I/O devices, and insufficient memory. In the OS Statistics page of Performance Center you can examine operating system metrics for the following platforms:
• AIX
• HP-UX
NOTE: To view processor info and swap disk info on an HP-UX box, you need to login as ROOT in the OS login.
• Linux
• Solaris
• Unix
• Windows XP, 2000, and NT
EMBARCADERO TECHNOLOGIES > EMBARCADERO PERFORMANCE CENTER 2.7 EXPERT GUIDE: SYBASE 71

OTHER VIEWS AND STATISTICS > OS PAGE STATISTICS
Summary TabThe OS Summary tab displays the following statistics to communicate the general overall performance levels of the operating system:
• Disk Time
• Load Average
• Processor Time
• Paged Memory Used (Windows)
• Swap Memory Used (AIX, HP-UX, Linux, Solaris, Unix)
• Average Disk Queue
• Network Output Queue (Windows)
• Network Queue (Solaris)
• Page Faults/Sec
• Processor Queue
• Processor Speed
• Processor
• Available Paged Memory (Windows)
• Available Physical Memory
• Available Swap Memory (AIX, HP-UX, Linux, Solaris, Unix)
• Total Paged Memory (Windows)
• Total Physical Memory
• Total Swap Memory (AIX, HP-UX, Linux, Solaris, Unix)
• Free Disk Space
• Total Disk Space
• Used Disk Space
• Number of Logins
• Number of Processes
• Number of Processors
• Top CPU Process
• Top I/O Process
• Top Memory Process
Processor TimeThe Processor Time statistic indicates the percentage of time the processor is working. This counter is a primary indicator of processor activity.
EMBARCADERO TECHNOLOGIES > EMBARCADERO PERFORMANCE CENTER 2.7 EXPERT GUIDE: SYBASE 72
OTHER VIEWS AND STATISTICS > OS PAGE STATISTICS
MetricsIf your computer seems to be running sluggishly, this statistic could be displaying a high percentage.
TroubleshootingUpgrade to a processor with a larger L2 cache, a faster processor, or install an additional processor.
Processor SpeedThe Processor Speed statistic displays the speed of the active processor in MHz. The speed is approximate.
ProcessorThe Processor Statistic displays the type of processor currently in use, for example, GenuineIntel.
Disk TimeThe Disk Time statistic is the percentage of elapsed time that the selected disk drive/device was busy servicing read or write requests.
MetricsYou should avoid consistently seeing values for this statistic greater then 90%.
TroubleshootingAdd more disk drives and partition the files among all of the drives.
Load AverageThe Load Average statistic represents the system load averages over the last 1, 5, and 15 minutes.
MetricsHigh load averages usually mean that the system is being used heavily and the response time is correspondingly slow.
Paged Memory UsedThe Paged Memory Used statistic is the ratio of Commit Memory Bytes to the Commit Limit. Committed memory is where memory space has been reserved in the paging file if it needs to be written to disk. The commit limit is determined by the size of the paging file. As the paging file increases, so does the commit limit.
NOTE: This statistic is available for the Windows platform.
MetricsThis value displays the current percentage value only and not an average. If the percentage of paged memory used is above 90%, you may be running out of memory.
EMBARCADERO TECHNOLOGIES > EMBARCADERO PERFORMANCE CENTER 2.7 EXPERT GUIDE: SYBASE 73

OTHER VIEWS AND STATISTICS > OS PAGE STATISTICS
TroubleshootingIncrease the size of page file.
Number of ProcessorsThis statistic displays the number of processors currently in use.
Swap Memory UsedThe Swap Memory Used statistic is the percentage of swap space currently in use.
MetricsIf the percentage of swap memory used is above 90%, you may be running out of memory.
TroubleshootingIncrease the size of your swap files.
Average Disk QueueThe Average Disk Queue statistic is the average number of both read and write requests that were queued for the selected disk during the sample interval.
MetricsThis metric is useful in identifying I/O related bottlenecks. If the disk queue lengths for certain disks are consistently much higher than others, you may need to redistribute the load among available disks. If the disk queues lengths for all disks are consistently large, and you see a high amount of I/O activity, your disks may be inefficient.
TroubleshootingSome things you can do if you have problems with this statistic include:
• Redistribute the data on the disk with the large average disk queue to other disks.
• Upgrade to faster disk(s).
Page Faults/SecThe Page Faults/Sec statistic is the overall rate faulted pages are handled by the processor. It is measured in numbers of pages faulted per second. A page fault occurs when a process requires code or data that is not in its working set. This counter includes both hard faults and soft faults.
MetricsThis counter displays the difference between the values observed in the last two samples, divided by the duration of the sample interval.
EMBARCADERO TECHNOLOGIES > EMBARCADERO PERFORMANCE CENTER 2.7 EXPERT GUIDE: SYBASE 74

OTHER VIEWS AND STATISTICS > OS PAGE STATISTICS
TroubleshootingIf the number of page faults remains consistently high, you can check with your Windows System Administrator for further investigation. Often, large numbers of page faults are not a problem so long as they are soft faults. However, hard faults, that require disk access, can cause delays.
Processor Queue The Processor Queue Length statistic is the number of threads in the processor queue.
MetricsUnlike the disk counters, this counter shows ready threads only, not threads that are running. There is a single queue for processor time even on computers with multiple processors. Therefore, if a computer has multiple processors, you need to divide this value by the number of processors servicing the workload. A sustained processor queue of less than 10 threads per processor is normally acceptable, dependent of the workload.
TroubleshootingA sustained high value in the Processor Queue could indicate that a processor bottleneck has developed due to threads of a process requiring more process cycles than are available. If this is the case, you should look at installing a faster (or an additional) processor.
Network Output Queue/Network QueueThe Network Output Queue Length statistic is the number of threads in the processor queue.
NOTE: The name of this statistic depends on the platform of the operating system.
MetricsUnlike the disk counters, this counter shows ready threads only, not threads that are running. There is a single queue for processor time even on computers with multiple processors. Therefore, if a computer has multiple processors, you need to divide this value by the number of processors servicing the workload. A sustained processor queue of less than 10 threads per processor is normally acceptable, dependent of the workload.
TroubleshootingA sustained high value in the Processor Queue Length could indicate that a processor bottleneck has developed due to threads of a process requiring more process cycles than are available. If this is the case, you should look at installing a faster (or an additional) processor.
Available Physical MemoryThe Available Physical Memory statistic represents the amount of RAM available to all processes.
MetricsThis counter displays the last observed value only and not an average. Use this value with the Total physical memory and paging metrics (Memory details page). If the available physical memory is very small compared to this value, and the paging activity is high, your system may be running low on memory.
TroubleshootingSome things you can do if you have problems with this statistic include:
EMBARCADERO TECHNOLOGIES > EMBARCADERO PERFORMANCE CENTER 2.7 EXPERT GUIDE: SYBASE 75

OTHER VIEWS AND STATISTICS > OS PAGE STATISTICS
• Check the running processes to see if there are any memory leaks.
• Stop any services that are not required.
• Install additional RAM.
Available Paged MemoryThe Available Paged Memory statistic shows the amount of virtual memory available for the processes.
NOTE: This statistic is available for the Windows platform.
MetricsIf the available virtual memory is less than 10% of the total virtual memory, your system may run out of memory.
TroubleshootingIncrease the size of page file.
Available Swap MemoryThe Available Swap Memory statistic represents the amount of virtual memory available for the processes.
MetricsIf the available Available Swap Memory is less than 10% of the total Swap Memory, your system may run out of memory.
TroubleshootingIncrease the size of swap files.
Total Physical MemoryThe Total Physical Memory statistic shows the amount of physical memory installed on your computer.
MetricsThis is an informational metric and displays the total amount installed on the machine. Use this value with the available physical memory and paging metrics (Memory details page). If the available physical memory is very small compared to this value, and the paging activity is high, your system may be running low on memory.
Total Paged Memory/Total Swap MemoryThe Total Paged Memory statistic shows the maximum amount of virtual memory available to all processes.
NOTE: The name of this statistic depends on the platform of the operating system.
MetricsIt is recommended that this value is between 1.5 to 3 times the amount of RAM on the system.
EMBARCADERO TECHNOLOGIES > EMBARCADERO PERFORMANCE CENTER 2.7 EXPERT GUIDE: SYBASE 76

OTHER VIEWS AND STATISTICS > OS PAGE STATISTICS
Used Disk SpaceThe Used Disk Space statistic shows the amount of allocated space, in megabytes on all logical disk drives.
TroubleshootingThere are many things a DBA can do to ensure that a database does not encounter a space problem due to physical space limitations:
• If a database currently resides on a disk that has little free space, you can add more files to the database. Of course, you should add the new files to other physical hard disks that can accommodate a growing database.
• You should examine hard disks with shrinking disk space to see if you can relocate or delete files to allow more free space.
Total Disk SpaceTotal Disk Space displays the total allocated and unallocated space, in megabytes on all logical disk drives.
TroubleshootingThere are many things a DBA can do to ensure that a database does not encounter a space problem due to physical space limitations, here are two:
1 If a database currently resides on a disk that has little free space, you can add more files to the database. Of course, you should add the new files to other physical hard disks that can accommodate a growing database.
2 You should examine hard disks with shrinking disk space to see if you can relocate or delete files to allow more free space.
Free Disk SpaceThe Free Disk Space statistic shows the unallocated space, in megabytes on all logical disk drives.
TroubleshootingThere are many things a DBA can do to ensure that a database does not encounter a space problem due to physical space limitations:
• If a database currently resides on a disk that has little free space, you can add more files to the database. Of course, you should add the new files to other physical hard disks that can accommodate a growing database.
• You should examine hard disks with shrinking disk space to see if you can relocate or delete files to allow more free space.
Top Memory ProcessTop Memory Process shows the current process that is consuming the most amount of memory. The information displayed is dependent on the platform of the operating system. Information displayed includes the name of the process, process ID, amount of memory consumed expressed in KB, amount of CPU expressed as a percentage, the amount of Major Page Faults, and the amount of I/O expressed in KB/sec.
MetricsIf you are running out of memory on the system, this is a quick way to identify the top memory user. If the displayed process is using a significant portion of the total memory, it could be causing the memory issues.
EMBARCADERO TECHNOLOGIES > EMBARCADERO PERFORMANCE CENTER 2.7 EXPERT GUIDE: SYBASE 77

OTHER VIEWS AND STATISTICS > OS PAGE STATISTICS
Processes OverviewThe Processes Overview of the OS Summary includes the following sections:
• Top CPU Process
• Top I/O Process
• Top Memory Process
Top CPU ProcessTop CPU Process shows the current process that is consuming the most amount of CPU. The information displayed is dependent on the platform of the operating system. Information displayed includes the name of the process, process ID, amount of memory consumed expressed in KB, amount of CPU expressed as a percentage, the amount of Major Page Faults, and the amount of I/O expressed in KB/sec.
MetricsIf the amount of CPU time used by this process is close to 100% and the CPU usage is very high, this process may be the bottleneck on the server.
TroubleshootingInvestigate the process further to see if it is in an inconsistent state. Also, look at minimum requirements for CPU speed for the process. You may need to upgrade your CPU.
Top I/O ProcessThe Top I/O Process statistic shows the current process that is consuming the most amount of CPU. The information displayed is dependent on the platform of the operating system. Information displayed includes the name of the process, process ID, amount of memory consumed expressed in KB, amount of CPU expressed as a percentage, the amount of Major Page Faults, and the amount of I/O expressed in KB/sec.
Number of LoginsThis statistic displays the total number of logins on the server.
Number of ProcessesThis statistic displays the total number of processes on the server.
CPU TabThe CPU tab of the OS Detail includes the following sections:
• Context Switches/Sec
• CPU Utilization
• Interrupts/Sec
• Processor Queue Length
EMBARCADERO TECHNOLOGIES > EMBARCADERO PERFORMANCE CENTER 2.7 EXPERT GUIDE: SYBASE 78

OTHER VIEWS AND STATISTICS > OS PAGE STATISTICS
CPU UtilizationThe CPU Utilization section includes the following information:
• % Privileged Time
• % User Time
% Privileged TimeThe % Privileged Time statistic is the percentage of elapsed time that the process threads spent executing code in privileged mode.
NOTE: For Windows systems, when a Windows system service is called, the service will often run in privileged mode to gain access to system-private data. Such data is protected from access by threads executing in user mode. Calls to the system can be explicit or implicit, such as page faults or interrupts. These kernel commands, are considered privileged to keep the low-level commands executing and prevent a system freeze. Unlike some early operating systems, Windows uses process boundaries for subsystem protection in addition to the traditional protection of user and privileged modes. Some work done by Windows on behalf of the application might appear in other subsystem processes in addition to the privileged time in the process.
MetricsThe ideal range should be 0-40% (less than 40% indicates excessive system activity).
TroubleshootingIf your CPU consistently runs at less than 40% you may need to upgrade your system to include a faster processor(s).
% User TimeThe % User Time statistic is the percentage of elapsed time the processor spends in the user mode. User mode is a restricted processing mode designed for applications, environment subsystems, and integral subsystems. The alternative, privileged mode, is designed for operating system components and allows direct access to hardware and all memory. The operating system switches application threads to privileged mode to access operating system services. This counter displays the average busy time as a percentage of the sample time.
MetricsIf the Privileged Time is high in conjunction with Physical Disk Reads, consider upgrading the disk I/O subsystem.
Interrupts/SecThe Interrupts/Sec statistic is the average rate, in incidents per second, at which the processor received and serviced hardware interrupts. It does not include deferred procedure calls (DPCs), which are counted separately. This value is an indirect indicator of the activity of devices that generate interrupts, such as the system clock, the mouse, disk drivers, data communication lines, network interface cards, and other peripheral devices. These devices normally interrupt the processor when they have completed a task or require attention. Normal thread execution is suspended. The system clock typically interrupts the processor every ten milliseconds, creating a background of interrupt activity. This counter displays the difference between the values observed in the last two samples, divided by the duration of the sample interval.
MetricsThe ideal rage should be 0-5000. A number greater then 5000 indicates possible excessive hardware interrupts; justification is dependent on device activity.
EMBARCADERO TECHNOLOGIES > EMBARCADERO PERFORMANCE CENTER 2.7 EXPERT GUIDE: SYBASE 79
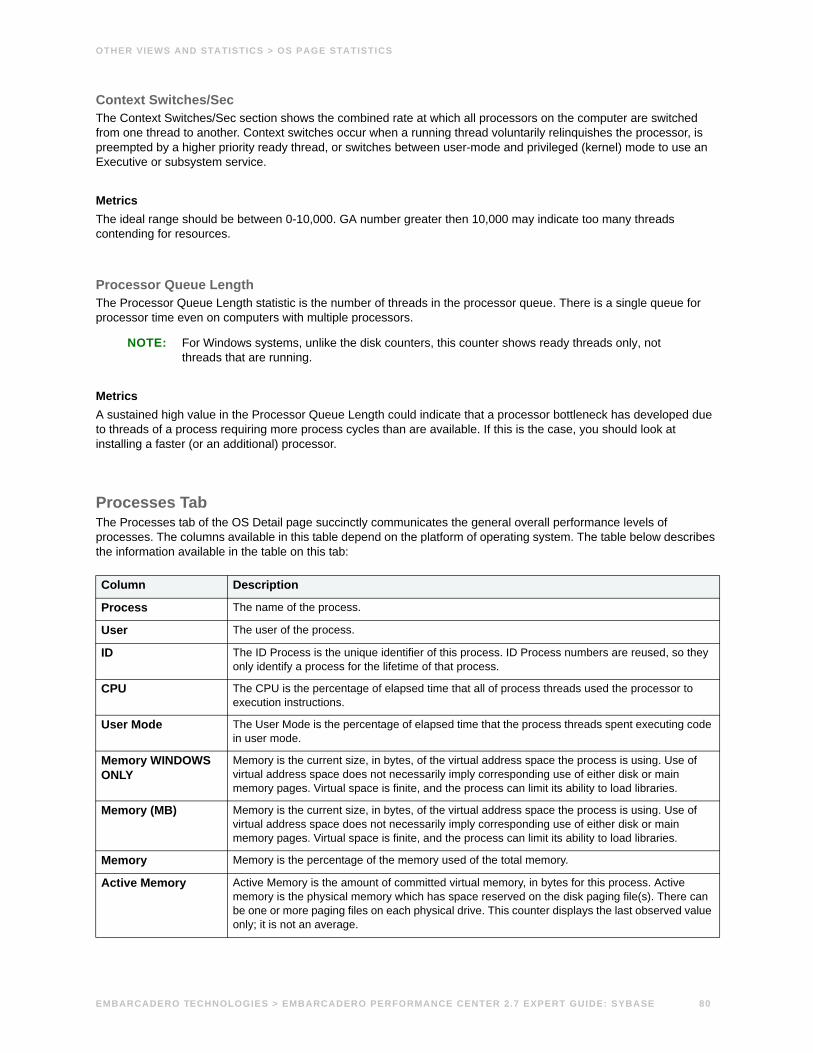
OTHER VIEWS AND STATISTICS > OS PAGE STATISTICS
Context Switches/SecThe Context Switches/Sec section shows the combined rate at which all processors on the computer are switched from one thread to another. Context switches occur when a running thread voluntarily relinquishes the processor, is preempted by a higher priority ready thread, or switches between user-mode and privileged (kernel) mode to use an Executive or subsystem service.
MetricsThe ideal range should be between 0-10,000. GA number greater then 10,000 may indicate too many threads contending for resources.
Processor Queue LengthThe Processor Queue Length statistic is the number of threads in the processor queue. There is a single queue for processor time even on computers with multiple processors.
NOTE: For Windows systems, unlike the disk counters, this counter shows ready threads only, not threads that are running.
MetricsA sustained high value in the Processor Queue Length could indicate that a processor bottleneck has developed due to threads of a process requiring more process cycles than are available. If this is the case, you should look at installing a faster (or an additional) processor.
Processes TabThe Processes tab of the OS Detail page succinctly communicates the general overall performance levels of processes. The columns available in this table depend on the platform of operating system. The table below describes the information available in the table on this tab:
Column Description
Process The name of the process.
User The user of the process.
ID The ID Process is the unique identifier of this process. ID Process numbers are reused, so they only identify a process for the lifetime of that process.
CPU The CPU is the percentage of elapsed time that all of process threads used the processor to execution instructions.
User Mode The User Mode is the percentage of elapsed time that the process threads spent executing code in user mode.
Memory WINDOWS ONLY
Memory is the current size, in bytes, of the virtual address space the process is using. Use of virtual address space does not necessarily imply corresponding use of either disk or main memory pages. Virtual space is finite, and the process can limit its ability to load libraries.
Memory (MB) Memory is the current size, in bytes, of the virtual address space the process is using. Use of virtual address space does not necessarily imply corresponding use of either disk or main memory pages. Virtual space is finite, and the process can limit its ability to load libraries.
Memory Memory is the percentage of the memory used of the total memory.
Active Memory Active Memory is the amount of committed virtual memory, in bytes for this process. Active memory is the physical memory which has space reserved on the disk paging file(s). There can be one or more paging files on each physical drive. This counter displays the last observed value only; it is not an average.
EMBARCADERO TECHNOLOGIES > EMBARCADERO PERFORMANCE CENTER 2.7 EXPERT GUIDE: SYBASE 80

OTHER VIEWS AND STATISTICS > OS PAGE STATISTICS
I/O TabThe table below describes the information available in this section:
I/O Data The rate at which the process is reading and writing bytes in I/O operations. This counter counts all I/O activity generated by the process to include file, network and device I/Os.
Elapsed Time The total elapsed time, in seconds, that this process has been running.
Thread Count The number of threads currently active in this process. An instruction is the basic unit of execution in a processor, and a thread is the object that executes instructions. Every running process has at least one thread.
Handle Count The total number of handles currently open by this process. This number is equal to the sum of the handles currently open by each thread in this process.
Priority The current base priority of this process. Threads within a process can raise and lower their own base priority relative to the process' base priority.
Creating Proc ID The Creating Process ID value is the Process ID of the process that created the process. The creating process may have terminated, so this value may no longer identify a running process.
Page Faults/Sec Page Faults/Sec is the rate at which page faults by the threads executing in this process are occurring. A page fault occurs when a thread refers to a virtual memory page that is not in its working set in main memory. This may not cause the page to be fetched from disk if it is on the standby list and hence already in main memory, or if it is in use by another process with whom the page is shared.
Page File Page File is the current number of kilobytes that this process has used in the paging file(s). Paging files are used to store pages of memory used by the process that are not contained in other files. Paging files are shared by all processes, and the lack of space in paging files can prevent other processes from allocating memory.
Private Private is the current size, in kilobytes, of memory that this process has allocated that cannot be shared with other processes.
Column Description
Disk The disk number assignment.
Reading (KB/s) The amount of bytes read from the device.
Writing (KB/s) The amount of bytes written to the device.
Disk Read Time Disk Read Time is the percentage of elapsed time that the selected disk drive was busy servicing read requests.
Disk Write Time Disk Write Time is the percentage of elapsed time that the selected disk drive was busy servicing write requests.
Disk Time Disk Time is the percentage of elapsed time that the selected disk was busy servicing requests.
Avg. Read Queue Avg. Disk Read Queue Length is the average number of read requests that were queued for the selected disk during the sample interval.
Avg. Write Queue Avg. Disk Write Queue Length is the average number of write requests that were queued for the selected disk during the sample interval.
Disk Reads/Sec Disk Reads/Sec is the rate of read operations on the disk.
Disk Writes/Sec Disk Writes/Sec is the rate of write operations on the disk.
Column Description
EMBARCADERO TECHNOLOGIES > EMBARCADERO PERFORMANCE CENTER 2.7 EXPERT GUIDE: SYBASE 81

OTHER VIEWS AND STATISTICS > OS PAGE STATISTICS
Memory TabThe Memory tab of the OS Detail page includes the following sections:
• Cache Efficiency
• Free Physical
• Free Paged
• Paging Activity
• Page Faults
• Total Physical
• Total Paged
Paging ActivityThe Paging Activity section includes the following statistics:
• Pages Input/Sec
• Pages Output/Sec
Pages Input/SecThe Pages Input/Sec statistic is the number of pages read from disk to resolve hard page faults. Hard page faults occur when a process requires code or data that is not in its working set or elsewhere in physical memory, and must be retrieved from disk.
MetricsThis value was designed as a primary indicator of the kinds of faults that cause system-wide delays. It includes pages retrieved to satisfy faults in the file system cache (usually requested by applications) and in non-cached mapped memory files. This counter counts numbers of pages, and can be compared to other counts of pages, such as Memory: Page Faults/sec, without conversion. This counter displays the difference between the values observed in the last two samples, divided by the duration of the sample interval.
TroubleshootingAlthough it never hurts to have as much physical memory as your system can handle, there are some things you can check within your system to alleviate the memory bottleneck.
• Check to see if you have any drivers or protocols that are running but not being used. They use space in all memory pools even if they are idle.
• Check to see if you have additional space on your disk drive that you could use to expand the size of your page file. Normally, the bigger the initial size of your page file, the better, in performance terms.
Pages Output/SecThe Pages Output/Sec statistic is the number of pages written to disk to free up space in physical memory. Pages are written back to disk only if they are changed in physical memory. A high rate of pages output might indicate a memory shortage.
EMBARCADERO TECHNOLOGIES > EMBARCADERO PERFORMANCE CENTER 2.7 EXPERT GUIDE: SYBASE 82

OTHER VIEWS AND STATISTICS > OS PAGE STATISTICS
MetricsWindows NT writes more pages back to disk to free up space when low in physical memory. This counter counts numbers of pages, and can be compared to other counts of pages, without conversion. This counter displays the difference between the values observed in the last two samples, divided by the duration of the sample interval.
TroubleshootingAlthough it never hurts to have as much physical memory as your system can handle, there are some things you can check within your system to alleviate the memory bottleneck.
• Check to see if you have any drivers or protocols that are running but not being used. They use space in all memory pools even if they are idle.
• Check to see if you have additional space on your disk drive that you could use to expand the size of your page file. Normally, the bigger the initial size of your page file, the better, in performance terms.
Free PhysicalThe Free Physical statistic is the amount of physical memory that is uncommitted.
MetricsNone.
Free PagedThe Free Paged statistic is the amount of uncommitted virtual memory.
MetricsNone.
Total PhysicalThe Total Physical statistic is the total physical memory available.
MetricsNone.
Total PagedThe Total Paged statistic is the amount of total virtual memory, in bytes. Used Memory is the physical memory that has space reserved on the disk paging file(s). There can be one or more paging files on each physical drive.
MetricsNone.
Page Faults/SecThe Page Faults/Sec statistic is the overall rate faulted pages are handled by the processor. It is measured in numbers of pages faulted per second. A page fault occurs when a process requires code or data that is not in its working set. This counter includes both hard faults and soft faults.
EMBARCADERO TECHNOLOGIES > EMBARCADERO PERFORMANCE CENTER 2.7 EXPERT GUIDE: SYBASE 83

OTHER VIEWS AND STATISTICS > OS PAGE STATISTICS
MetricsThis counter displays the difference between the values observed in the last two samples, divided by the duration of the sample interval.
TroubleshootingIf the number of page faults remains consistently high, you can check with your Windows System Administrator for further investigation. Often, large numbers of page faults are not a problem so long as they are soft faults. However, hard faults, that require disk access, can cause delays.
Cache EfficiencyThe Cache Efficiency section of the Memory tab succinctly communicates the general overall performance levels of the server's memory. The following statistics are available in this section:
• Copy Read Hits%
• Data Map Hits%
• MDL Read Hits%
• Pin Read Hits%
Copy Read Hits %The Copy Read Hits % statistic is the percentage of cache copy read requests that hit the cache and does not require a disk read to provide access to the page in the cache.
MetricsWhen the page is pinned in the memory, the page's physical address in the file system cache will not be altered. A copy read is a file read operation where a page in the cache is copied to the application's buffer. Because this value reflects hits, it ideally should be close to 100%. An amount below 100% indicates misses.
TroubleshootingAdding physical memory to a server results in a larger file system cache, which is generally more efficient. Defragmenting disks also helps, putting related pages in the cache together and thereby improving the cache hit rate
Data Map Hits %The Data Map Hits % statistic is the percentage of data maps in the file system cache that could be resolved without having to retrieve a page from the disk.
MetricsBecause this value reflects hits, it ideally should be close to 100%. An amount below 100% indicates misses.
TroubleshootingAdding physical memory to a server results in a larger file system cache, which is generally more efficient. Defragmenting disks also helps, putting related pages in the cache together and thereby improving the cache hit rate.
MDL Read Hits %The MDL Read Hits % statistic is the percentage of Memory Descriptor List Read requests to the file system cache that hit the cache and does not require disk access to provide memory access to the pages in the cache.
EMBARCADERO TECHNOLOGIES > EMBARCADERO PERFORMANCE CENTER 2.7 EXPERT GUIDE: SYBASE 84

OTHER VIEWS AND STATISTICS > OS PAGE STATISTICS
MetricsBecause this value reflects hits, it ideally should be close to 100%. An amount below 100% indicates misses.
TroubleshootingAdding physical memory to a server results in a larger file system cache, which is generally more efficient. Defragmenting disks also helps, putting related pages in the cache together and thereby improving the cache hit rate.
Pin Read Hits %The Pin Read Hits % statistic is the percentage of pin read requests that hit the file system cache and does not require a disk read in order to provide access to the page in the file system cache.
MetricsBecause this value reflects hits, it ideally should be close to 100%. An amount below 100% indicates misses.
TroubleshootingAdding physical memory to a server results in a larger file system cache, which is generally more efficient. Defragmenting disks also helps, putting related pages in the cache together and thereby improving the cache hit rate.
Space TabThe Space tab of the OS Detail page includes the following sections:
• Disk Space Free
• Disk Space Detail
Disk Space FreeThe Disk Space Free metric displays the amount of free disk space in megabytes.
MetricNone.
Disk Space Detail The Disk Space Detail section of the Space tab succinctly communicates the general overall performance levels of the server’s disks and space allotment. The table below describes the statistics in this section:
Statistic Description
Partition The drive letter of the disk.
Total Space Total size of the disk/device's capacity expressed in MBs.
Used Space Amount of MBs currently allocated on the particular disk/device.
Free Space Amount of MBs currently unallocated and free on the particular disk/device.
EMBARCADERO TECHNOLOGIES > EMBARCADERO PERFORMANCE CENTER 2.7 EXPERT GUIDE: SYBASE 85

OTHER VIEWS AND STATISTICS > SESSION DETAIL VIEW
Network TabThe Network tab of the OS Detail page succinctly communicates the general overall performance levels of the server's networking. The statistics available in this section depend on the platform of operating system. The table below describes the information available in this section:
Session Detail View The Session Detail view is available for the following database platforms:
• Oracle Session Detail View
• SQL Server Session Detail View
• Sybase Session Detail View
• DB2 Session Detail View
Oracle Session Detail ViewThe following tabbed pages are available on the Session Detail view for Oracle:
• Session Contention
• Session I/O
• Session Memory
• Session Network
• Session Objects
• Session SQL
• Session Statistics
Column Description
Network Interface The name of network interface.
INET Address/Address The IP address assigned to the network interface.
Pkts Sent/Sec The number of packets sent per second.
Pkts Received/Sec The number of packets received per second.
Sent (KB/Sec) The number of bytes sent per second.
Received (KB/Sec) The number of bytes received per second.
Out Pkts Discarded The number of outbound packets discarded.
In Pkts Discarded The number of inbound packets discarded.
Out Pkt Errors The number of outbound packet errors.
In Pkt Errors The number of inbound packet errors.
Queue Length The queue length.
Collisions The number of collisions.
Packets Discarded The number of packets discarded.
EMBARCADERO TECHNOLOGIES > EMBARCADERO PERFORMANCE CENTER 2.7 EXPERT GUIDE: SYBASE 86

OTHER VIEWS AND STATISTICS > SESSION DETAIL VIEW
Session Memory Tab for Oracle• Metrics
The Session Memory tab of the Session Detail view presents the statistics surrounding a session's memory usage. The table below describes the information available on the Session Memory tab of the Session Detail view for Oracle:
MetricsSessions with abnormally high memory usage can affect overall performance at the server level, as this memory (PGA and UGA) is allocated outside of the Oracle SGA (unless the multi-threaded server option is being used). If cache hit ratios at the session level are lower than 85 percent, data access can be inefficient.
TIP: To configure the grid to show/hide row numbers, use the Options Editor.
Session I/O Tab for Oracle• Metrics
The Session I/O tab of the Session Detail view presents the statistics surrounding a session's I/O activity. The table below describes the information available on the Session I/O tab of the Session Detail view for Oracle:
MetricsSeeing high values for physical reads and writes can indicate an inefficient session. Large numbers of physical reads can imply a session with too many large table scans or inefficient SQL operations. Large numbers of physical writes can be okay for sessions inputting large volumes of data into the database. Or, they could also indicate a session involved in heavy disk sort activity.
TIP: To configure the grid to show/hide row numbers, use the Options Editor.
Session Contention Tab for Oracle• Metrics
The Session Contention tab of the Session Detail view presents information relating to resources on which the current session is waiting. The first grid displays user waits. The second grid displays user locks. The table below describes the information available in the User Waits grid on the Session Contention tab of the Session Detail view for Oracle:
Column Description
Statistic The name of the memory related statistic.
Value The cumulative value for the memory statistic.
Cache Hit Ratio The percentage of data obtained from memory access vs. physical I/O.
Column Description
Statistic The name of the I/O related statistic.
Value The cumulative value for the I/O statistic.
Column Description
Wait Cause The wait event being experienced by the session.
Program The program the session is executing against Oracle.
Seconds The number of seconds the session has spent in the wait.
EMBARCADERO TECHNOLOGIES > EMBARCADERO PERFORMANCE CENTER 2.7 EXPERT GUIDE: SYBASE 87

OTHER VIEWS AND STATISTICS > SESSION DETAIL VIEW
The table below describes the information available in the User Locks grid on the Session I/O tab of the Session Detail view for Oracle:
MetricsYou can ignore some waits, like the SQL*Net more data from client and SQL*Net message from client. Others, like enqueue waits, can be indicative of a lock contention problem. Waits, like db file scattered reads, can indicate sessions involved in long table scan operations.
Locks that are held for unusually long periods require further investigation. The application logic can be inefficient or the program is not issuing COMMITs frequently enough. The culprit of blocking-lock scenarios is usually the application design, or the SQL used within the application itself. Properly coding an application to reference database objects in an efficient order, and then using the correct SQL to get the job done is an art. Most DBAs who have had to face Oracle Forms applications have suffered through the dreaded SELECT…FOR UPDATE statements. These place unnecessary restrictive locks on nearly every read operation. The key to avoiding lock contention is to process user transactions as quickly and efficiently as possible.
TIP: To configure the grid to show/hide row numbers, use the Options Editor.
Session Objects Tab for Oracle• Metrics
The Session Objects tab of the Session Detail view presents information regarding the objects in use by a session. The table below describes the information available in the Objects Accessed grid on the Session Objects tab of the Session Detail view for Oracle:
The Rollback Segments Accessed grid displays the names of rollback segments currently being used by the session.
State The status of the wait event (WAITING, etc.)
Column Description
User The user account being used by the session.
Terminal The client machine name used by the session.
SID The unique Oracle identifier for the session.
Serial # The serial number for the session.
Table The object locked by the session.
Lock Mode The lock mode used by the session.
Title The lock request issued by the session.
Column Description
Owner The owner of the object.
Type The type of object (TABLE, VIEW, etc.).
Object The name of the object.
Column Description
EMBARCADERO TECHNOLOGIES > EMBARCADERO PERFORMANCE CENTER 2.7 EXPERT GUIDE: SYBASE 88

OTHER VIEWS AND STATISTICS > SESSION DETAIL VIEW
Metrics Once you have an idea of which objects your users access most often, you can refine some processes to facilitate access to them. You can use the Oracle 8 concept of the KEEP buffer cache to force Oracle to hold often-referenced data for data objects. The KEEP buffer cache is ideal for holding small look-up tables. If you have an earlier version of Oracle or do not want to split up your current buffer cache, you can use the CACHE table attribute to encourage Oracle to keep data blocks of CACHE’d tables at the most recently used end of the LRU buffer cache chain.
If you consistently see a session with active rollbacks, it can indicate locks are being held for long durations. It can also indicate that a session is using code without frequent enough COMMIT points.
TIP: To configure the grid to show/hide row numbers, use the Options Editor.
Session Network Tab for Oracle• Metrics
The Session Network tab of the Session Detail view presents information about requests being sent to and from the database with respect to the current session. The table below describes the information available on the Session Network tab of the Session Detail view for Oracle:
MetricsNone.
TIP: To configure the grid to show/hide row numbers, use the Options Editor.
Session SQL Tab for Oracle• Metrics
The Session SQL tab of the Session Detail view presents information relating to any current SQL issued by the session as well as any SQL previously issued by the session.
MetricsTo determine access paths, you should export and run through an EXPLAIN PLAN session any SQL that you suspect of inefficient access.
TIP: To configure the grid to show/hide row numbers, use the Options Editor.
Session Statistics Tab for Oracle• Metrics
The Session Statistics tab of the Session Detail view presents information relating to all recorded performance and miscellaneous statistics for the current session. The table below describes the information available on the Session Statistics tab of the Session Detail view for Oracle:
Column Description
Statistic The name of the SQL*Net related statistic.
Value The cumulative value of the SQL*Net related statistic.
Column Description
Statistic The name of the session related statistic.
EMBARCADERO TECHNOLOGIES > EMBARCADERO PERFORMANCE CENTER 2.7 EXPERT GUIDE: SYBASE 89

OTHER VIEWS AND STATISTICS > SESSION DETAIL VIEW
MetricsNone.
TIP: To configure the grid to show/hide row numbers, use the Options Editor.
SQL Server Session Detail ViewThe Session Detail view down provides a granular look at the details when a process is acting in a way that merits further investigation. It also presents data about a particular process in a way that makes it easier to understand and view apart from all other processes that SQL Server is running.
The following tabbed pages are available on the Session Detail view for SQL Server:
• All Locks
• Blocked By
• Blocking
• Overview
• SQL
Overview Tab for SQL Server• Metrics
The Overview tab of the Session Detail view displays information to analyze the details of a particular process. The tables below describe the statistics for each category on the Overview tab of the Session Detail view for SQL Server. The available categories are:
• Contention
• General
• I/O
• Memory
• Network
• Users
General StatisticsThe table below describes the statistics in the General category on the Overview tab of the Session Detail view:
Value The cumulative value of the session related statistic.
Statistic Description
SPID The SQL Server process ID. Unique value across all processes.
Login Name The SQL Server login name of the process.
NT User If using Windows Authentication, the name of the Windows NT user for this process. If using a trusted connection, the Windows NT user name.
Column Description
EMBARCADERO TECHNOLOGIES > EMBARCADERO PERFORMANCE CENTER 2.7 EXPERT GUIDE: SYBASE 90

OTHER VIEWS AND STATISTICS > SESSION DETAIL VIEW
Memory StatisticsThe table below describes the statistics in the Memory category on the Overview tab of the Session Detail view:
Contention StatisticsThe table below describes the statistics in the Contention category on the Overview tab of the Session Detail view:
I/O StatisticsThe table below describes the statistics in the I/O category on the Overview tab of the Session Detail view:
Users StatisticsThe table below describes the statistics in the Users category on the Overview tab of the Session Detail view:
Status Indicates if the process is actively performing work, is idle, blocked by another process, etc.
Database The database in which the process is running.
Program The executable the process is using against the server.
Host The machine name that originated the process.
Statistic Description
Memory Usage The number of pages in the procedure cache (SQL Cache) that are currently allocated to this process. A negative number indicates that pages are being released (freed) from this process.
Buffer Cache Hit Ratio The percentage of data page requests by this process that is available in memory as opposed to performing a physical I/O to disk.
Statistic Description
Blocked By If the process is being blocked, the SPID of the blocking process. A value of zero means that the process is not blocked.
Wait Time The number of milliseconds that the process has been waiting to be serviced. A value of zero indicates that the process is not waiting.
Last Wait Type The last or current SQL Server wait type.
Wait Resource The SQL Server's textual representation of a lock resource.
Statistic Description
Physical I/O The number of physical and logical reads performed by this session.
Physical Reads The number of physical reads from disk performed by this session.
Logical Reads The number of reads from memory performed by this process.
Logical Writes The number of writes to memory performed by this process.
Statistic Description
CPU Usage The cumulative CPU time for the process. The CPU usage is updated regardless of the value of the SET STATISTICS TIME ON option.
Open Trans The current number of open transactions owned by the process.
Login Time For client process, the last time a client logged into the SQL Server instance. For system processes, the time that SQL Server was started.
Statistic Description
EMBARCADERO TECHNOLOGIES > EMBARCADERO PERFORMANCE CENTER 2.7 EXPERT GUIDE: SYBASE 91

OTHER VIEWS AND STATISTICS > SESSION DETAIL VIEW
Network StatisticsThe table below describes the statistics in the Network category on the Overview tab of the Session Detail view:
MetricsHigh memory usage and a low cache hit ratio for a given process over a sustained period of time could indicate that the process is using poorly written code. Check the SQL tab to investigate further.
Also, watch for an unusually high percentage of CPU use over a long period of time. This could indicate a rogue process that must be terminated by the DBA using a KILL command for the session.
SQL Tab for SQL Server• Metrics
The SQL tab of the Session Detail view presents information relating to any current SQL issued by the session as well as any SQL previously issued by the session.
MetricsTo determine access paths, you should export and run through a QUERY PLAN session, any SQL suspect of inefficient access.
Blocked By Tab for SQL Server• Metrics
• Troubleshooting
Without a doubt, blocking lock situations can give the appearance of a “frozen” database almost more than anything else. A single blocking user has the potential to stop work for nearly all other processes on a small system, and can cause major headaches on large systems. Although SQL Server supports row-level locking, blocking lock situations do crop up - sometimes frequently.
Last Batch For client process, the last time a remote stored procedure call or an EXECUTE statement was executed. For system processes, the time that SQL Server was started.
Statistic Description
Net Address The unique identifier of the network card in the client machine that owns the process.
Net Library When a process is initiated from a client, the controlling mechanism is the network connection. Each network connection has a library associated with it. This value is the name library associated with the network connection responsible for this process.
Statistic Description
EMBARCADERO TECHNOLOGIES > EMBARCADERO PERFORMANCE CENTER 2.7 EXPERT GUIDE: SYBASE 92

OTHER VIEWS AND STATISTICS > SESSION DETAIL VIEW
MetricsThe Blocked By tab contains information relating to processes that are currently blocking the process featured in the Session Detail view. The table below describes the information available on the Blocked By tab of the Session Detail view for SQL Server:
TIP: To configure the grid to show/hide row numbers, use the Options Editor.
TroubleshootingOnce discovered, a blocking lock situation can normally be quickly remedied - the DBA issues a KILL against the offending process, which eliminates the user's stranglehold on the objects the user was accessing. Other user processes then nearly almost always complete in an instant. Discovering the blocked lock situation is made easier by using tools like Performance Center, but preventing the blocking lock situation in the first place is tricky.
The culprit of blocking lock scenarios is usually the application design, or the SQL being used within the application itself. Properly coding an application to reference database objects in an efficient order, and then using the right SQL to get the job done, is an art. The key to avoiding lock contention is to process user transactions in the quickest and most efficient manner possible - something not always easy to do.
By default, all processes wait indefinitely for locks in SQL Server. You can change this behavior by using the SET LOCK_TIMEOUT command, which limits the number of seconds that a process waits for a lock before timing out.
Column Description
SPID The SQL Server process ID. It is a unique value across all processes.
Status Indicates if the process is actively performing work, is idle, blocked by another process, etc.
Login The SQL Server login name of the process.
NT User If using Windows Authentication, the name of the Windows NT user for this process. If using a trusted connection, the Windows NT user name.
Host The machine name that originated the process.
Program The executable the process is using against the server.
Memory The number of pages in the procedure cache (SQL Cache) that are currently allocated to this process. A negative number indicates that pages are being released (freed) from this process.
CPU The cumulative CPU time for the process. The CPU usage is updated regardless of the value of the SET STATISTICS TIME ON option.
Physical I/O The current cumulative number of physical disk reads and writes issued by the process.
Blocked If the process is being blocked, the SPID of the blocking process.
Database The database in which the process is running.
Command The current command being executed by the process.
Last Batch For a client process, the last time a remote stored procedure call or an EXECUTE statement was executed. For system processes, the time that SQL Server was started.
Login Time For a client process, the last time a client logged into the SQL Server instance. For system processes, the time that SQL Server was started.
Wait Time The time that the process has been waiting to be serviced, in milliseconds. A value of zero indicates that the process is not waiting.
Wait Type The last or current SQL Server wait type.
Open Xacts The current number of open transactions owned by the process.
NT Domain If using Windows Authentication or a trusted connection, the name of the Windows domain of the user who owns the process.
EMBARCADERO TECHNOLOGIES > EMBARCADERO PERFORMANCE CENTER 2.7 EXPERT GUIDE: SYBASE 93

OTHER VIEWS AND STATISTICS > SESSION DETAIL VIEW
Blocking Tab for SQL Server• Metrics
• Troubleshooting
Without a doubt, blocking lock situations can give the appearance of a “frozen” database almost more than anything else. A single blocking user has the potential to stop work for nearly all other processes on a small system, and can cause major headaches on large systems. Although SQL Server supports row-level locking, blocking lock situations do crop up - sometimes frequently.
MetricsThe Blocking tab contains information on blocks issued by the featured process that are blocking other processes. The table below describes the information available on the Blocking tab of the Session Detail view for SQL Server:
TIP: To configure the grid to show/hide row numbers, use the Options Editor.
TroubleshootingOnce discovered, a blocking lock situation can normally be quickly remedied - the DBA issues a KILL against the offending process, which eliminates the user's stranglehold on the objects the user was accessing. Other user processes then nearly almost always complete in an instant. Discovering the blocked lock situation is made easier by using tools like Performance Center, but preventing the blocking lock situation in the first place is tricky.
Column Description
SPID The SQL Server process ID. It is a unique value across all processes.
Status Indicates if the process is actively performing work, is idle, blocked by another process, etc.
Login The SQL Server login name of the process.
NT User If using Windows Authentication, the name of the Windows NT user for this process. If using a trusted connection, the Windows NT user name.
Host The machine name that originated the process.
Program The executable the process is using against the server.
Memory The number of pages in the procedure cache (SQL Cache) that are currently allocated to this process. A negative number indicates that pages are being released (freed) from this process.
CPU The cumulative CPU time for the process. The CPU usage is updated regardless of the value of the SET STATISTICS TIME ON option.
Physical I/O The current cumulative number of physical disk reads and writes issued by the process.
Database The database in which the process is running.
Command The current command being executed by the process.
Last Batch For client process, this value represents the last time a remote stored procedure call or an EXECUTE statement was executed. For system processes, it represents the time at which SQL Server was started.
Login Time For client process, the last time a client logged into the SQL Server instance. For system processes, the time that SQL Server was started.
Wait Time The time that the process has been waiting to be serviced, in milliseconds. A value of zero indicates that the process is not waiting.
Wait Type The last or current SQL Server wait type.
Open Xacts The current number of open transactions owned by the process.
NT Domain If using Windows Authentication or a trusted connection, the name of the Windows Domain of the user who owns the process.
EMBARCADERO TECHNOLOGIES > EMBARCADERO PERFORMANCE CENTER 2.7 EXPERT GUIDE: SYBASE 94
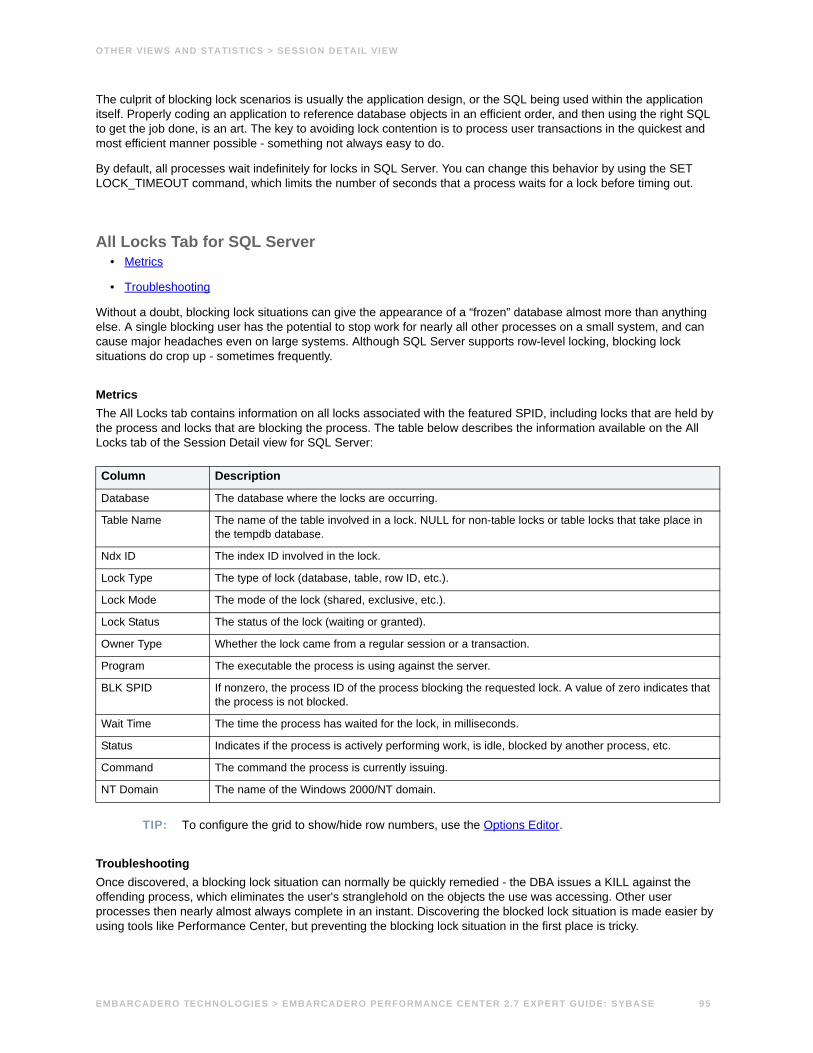
OTHER VIEWS AND STATISTICS > SESSION DETAIL VIEW
The culprit of blocking lock scenarios is usually the application design, or the SQL being used within the application itself. Properly coding an application to reference database objects in an efficient order, and then using the right SQL to get the job done, is an art. The key to avoiding lock contention is to process user transactions in the quickest and most efficient manner possible - something not always easy to do.
By default, all processes wait indefinitely for locks in SQL Server. You can change this behavior by using the SET LOCK_TIMEOUT command, which limits the number of seconds that a process waits for a lock before timing out.
All Locks Tab for SQL Server• Metrics
• Troubleshooting
Without a doubt, blocking lock situations can give the appearance of a “frozen” database almost more than anything else. A single blocking user has the potential to stop work for nearly all other processes on a small system, and can cause major headaches even on large systems. Although SQL Server supports row-level locking, blocking lock situations do crop up - sometimes frequently.
MetricsThe All Locks tab contains information on all locks associated with the featured SPID, including locks that are held by the process and locks that are blocking the process. The table below describes the information available on the All Locks tab of the Session Detail view for SQL Server:
TIP: To configure the grid to show/hide row numbers, use the Options Editor.
TroubleshootingOnce discovered, a blocking lock situation can normally be quickly remedied - the DBA issues a KILL against the offending process, which eliminates the user's stranglehold on the objects the use was accessing. Other user processes then nearly almost always complete in an instant. Discovering the blocked lock situation is made easier by using tools like Performance Center, but preventing the blocking lock situation in the first place is tricky.
Column Description
Database The database where the locks are occurring.
Table Name The name of the table involved in a lock. NULL for non-table locks or table locks that take place in the tempdb database.
Ndx ID The index ID involved in the lock.
Lock Type The type of lock (database, table, row ID, etc.).
Lock Mode The mode of the lock (shared, exclusive, etc.).
Lock Status The status of the lock (waiting or granted).
Owner Type Whether the lock came from a regular session or a transaction.
Program The executable the process is using against the server.
BLK SPID If nonzero, the process ID of the process blocking the requested lock. A value of zero indicates that the process is not blocked.
Wait Time The time the process has waited for the lock, in milliseconds.
Status Indicates if the process is actively performing work, is idle, blocked by another process, etc.
Command The command the process is currently issuing.
NT Domain The name of the Windows 2000/NT domain.
EMBARCADERO TECHNOLOGIES > EMBARCADERO PERFORMANCE CENTER 2.7 EXPERT GUIDE: SYBASE 95

OTHER VIEWS AND STATISTICS > SESSION DETAIL VIEW
The culprit of blocking lock scenarios is usually the application design, or the SQL being used within the application itself. Properly coding an application to reference database objects in an efficient order, and then using the right SQL to get the job done, is an art. The key to avoiding lock contention is to process user transactions in the quickest and most efficient manner possible - something not always easy to do.
By default, all processes wait indefinitely for locks in SQL Server. You can change this behavior by using the SET LOCK_TIMEOUT command, which limits the number of seconds that a process waits for a lock before timing out.
Sybase Session Detail ViewThe Session Detail view down provides a granular look at the details when a process is acting in a way that merits further investigation. It also presents data about a particular process in a way that makes it easier to understand and view apart from all other processes that Sybase is running.
The following tabbed pages are available on the Session Detail view for Sybase:
• Overview
• SQL
• Blocked By
• Blocking
• All Locks
Overview Tab for SybaseThe Overview tab of the Session Detail view displays information to analyze the details of a particular process. The tables below describe the statistics for each category on the Overview tab of the Session Detail view for Sybase. The available categories are:
• Contention
• Execution
• General
• I/O
• Memory
• Users
General StatisticsThe table below describes the statistics in the General category on the Overview tab of the Session Detail view:
Statistic Description
SPID The Sybase process ID. Unique value across all processes.
Login Name The Sybase login name of the process.
Family ID The ID of the coordinating process and all of its worker processes.
Status Indicates if the process is actively performing work, is idle, blocked by another process, etc.
Database The database in which the process is running.
Program The executable the process is using against the server.
EMBARCADERO TECHNOLOGIES > EMBARCADERO PERFORMANCE CENTER 2.7 EXPERT GUIDE: SYBASE 96

OTHER VIEWS AND STATISTICS > SESSION DETAIL VIEW
Memory StatisticsThe Memory Usage statistic in the Memory category on the Overview tab of the Session Detail view is the number of pages in the procedure cache (SQL Cache) that are currently allocated to this process. A negative number indicates that pages are being released (freed) from this process.
Contention StatisticsThe table below describes the statistics in the Contention category on the Overview tab of the Session Detail view:
I/O StatisticsThe Physical I/O statistic in the I/O category on the Overview tab of the Session Detail view is the number of physical and logical reads performed by this session.
Users StatisticsThe table below describes the statistics in the Users category on the Overview tab of the Session Detail view:
Execution StatisticsThe table below describes the statistics in the Execution category on the Overview tab of the Session Detail view:
SQL Tab for Sybase• Metrics
The SQL tab of the Session Detail view presents information relating to any current SQL issued by the session as well as any SQL previously issued by the session.
Metrics To determine access paths, you should export and run through a QUERY PLAN session, any SQL suspect of inefficient access.
Host The machine name that originated the process.
Statistic Description
Blocked By If the process is being blocked, the SPID of the blocking process. A value of zero indicates that the process is not blocked.
Time Blocked The SQL Server's wait time.
Statistic Description
CPU Usage The cumulative CPU time for the process. The CPU usage is updated regardless of the value of the SET STATISTICS TIME ON option.
Active Trans The current number of open transactions owned by the process.
Statistic Description
Exec Class The execution class for the current process.
Priority The priority of the current process.
Affinity The affinity level for the current process.
Statistic Description
EMBARCADERO TECHNOLOGIES > EMBARCADERO PERFORMANCE CENTER 2.7 EXPERT GUIDE: SYBASE 97

OTHER VIEWS AND STATISTICS > SESSION DETAIL VIEW
Blocked By Tab for Sybase• Metrics
• Troubleshooting
Without a doubt, blocking lock situations can give the appearance of a “frozen” database almost more than anything else. A single blocking user has the potential to stop work for nearly all other processes on a small system, and can cause major headaches even on large systems.
Metrics The Blocked By tab contains information relating to processes that are currently blocking the process featured in the Session Detail view. The table below describes the information available on the Blocked By tab of the Session Detail view for Sybase:
TIP: To configure the grid to show/hide row numbers, use the Options Editor.
TroubleshootingOnce discovered, a blocking lock situation can normally be quickly remedied - the DBA issues a KILL against the offending process, which eliminates the user's stranglehold on the objects the user was accessing. Other user processes then nearly almost always complete in an instant. Discovering the blocked lock situation is made easier by using tools like Performance Center, but preventing the blocking lock situation in the first place is tricky.
The culprit of blocking lock scenarios is usually the application design, or the SQL being used within the application itself. Properly coding an application to reference database objects in an efficient order, and then using the right SQL to get the job done, is an art. The key to avoiding lock contention is to process user transactions in the quickest and most efficient manner possible - something not always easy to do.
Blocking Tab for Sybase• Metrics
• Troubleshooting
Column Description
SPID The Sybase process ID. This is a unique value across all processes.
Status Indicates if the process is actively performing work, is idle, blocked by another process, etc.
Login The Sybase login name of the process.
Host The machine name that originated the process.
Program The executable the process is using against the server.
Memory The number of pages in the procedure cache (SQL Cache) that are currently allocated to this process. A negative number indicates that pages are being released (freed) from this process.
CPU The cumulative CPU time for the process. The CPU usage is updated regardless of the value of the SET STATISTICS TIME ON option.
Physical I/O The current cumulative number of physical disk reads and writes issued by the process.
Database The database in which the process is running.
Command The current command being executed by the process.
Time Blocked The time that the process has been blocked, in seconds.
Transaction The name of any transaction.
EMBARCADERO TECHNOLOGIES > EMBARCADERO PERFORMANCE CENTER 2.7 EXPERT GUIDE: SYBASE 98

OTHER VIEWS AND STATISTICS > SESSION DETAIL VIEW
Without a doubt, blocking lock situations can give the appearance of a “frozen” database almost more than anything else. A single blocking user has the potential to stop work for nearly all other processes on a small system, and can cause major headaches on large systems.
Metrics The Blocking tab contains information on blocks issued by the featured process that are blocking other processes. The table below describes the information available on the Blocking tab of the Session Detail view for Sybase:
TIP: To configure the grid to show/hide row numbers, use the Options Editor.
TroubleshootingOnce discovered, a blocking lock situation can normally be quickly remedied - the DBA issues a KILL against the offending process, which eliminates the user's stranglehold on the objects they were accessing. Other user processes then nearly almost always complete in an instant. Discovering the blocked lock situation is made easier by using tools like Performance Center, but preventing the blocking lock situation in the first place is tricky.
The culprit of blocking lock scenarios is usually the application design, or the SQL being used within the application itself. Properly coding an application to reference database objects in an efficient order, and then using the right SQL to get the job done, is an art. The key to avoiding lock contention is to process user transactions in the quickest and most efficient manner possible - something not always easy to do.
All Locks Tab for Sybase• Metrics
• Troubleshooting
Without a doubt, blocking lock situations can give the appearance of a “frozen” database almost more than anything else. A single blocking user has the potential to stop work for nearly all other processes on a small system, and can cause major headaches on large systems.
Column Description
SPID The Sybase process ID. This is a unique value across all processes.
Status Indicates if the process is actively performing work, is idle, blocked by another process, etc.
Login The Sybase login name of the process.
Host The machine name that originated the process.
Program The executable the process is using against the server.
Memory The number of pages in the procedure cache (SQL Cache) that are currently allocated to this process. A negative number indicates that pages are being released (freed) from this process.
CPU The cumulative CPU time for the process. The CPU usage is updated regardless of the value of the SET STATISTICS TIME ON option.
Physical I/O The current cumulative number of physical disk reads and writes issued by the process.
Database The database in which the process is running.
Command The current command being executed by the process.
Time Blocked The time that the process has been blocked, in seconds.
Transaction The name of any transaction.
EMBARCADERO TECHNOLOGIES > EMBARCADERO PERFORMANCE CENTER 2.7 EXPERT GUIDE: SYBASE 99

OTHER VIEWS AND STATISTICS > SESSION DETAIL VIEW
Metrics The All Locks tab contains information on all locks associated with the featured SPID, including locks that are held by the process and locks that are blocking the process. The table below describes the information available on the All Locks tab of the Session Detail view for Sybase:
TIP: To configure the grid to show/hide row numbers, use the Options Editor.
TroubleshootingOnce discovered, a blocking lock situation can normally be quickly remedied—the DBA issues a KILL against the offending process, which eliminates the user's stranglehold on the objects the user was accessing. Other user processes then nearly almost always complete in an instant. Discovering the blocked lock situation is made easier by using tools like Performance Center, but preventing the blocking lock situation in the first place is tricky.
The culprit of blocking lock scenarios is usually the application design, or the SQL being used within the application itself. Properly coding an application to reference database objects in an efficient order, and then using the right SQL to get the job done, is an art. The key to avoiding lock contention is to process user transactions in the quickest and most efficient manner possible - something not always easy to do.
DB2 Session Detail ViewThe following tabbed pages are available on the Session Detail view for DB2:
• Application Tab for DB2
• Unit of Work Tab for DB2
• Locking Tab for DB2
• Memory Tab for DB2
• I/O Tab for DB2
• SQL Statistics Tab for DB2
The following information about the selected application is available on each page:
Column Description
Database The database where the locks are occurring.
Lock Type The type of lock (database, table, row ID, etc.)
Object Name The name of the object being blocked.
Status Indicates if the process is actively performing work, is idle, blocked by another process, etc.
Lock Page The page number where the lock is currently applied.
Lock Class The name of the cursor the lock is associated with (if any).
Host The machine name that originated the process.
Program The executable the process is using against the server.
Command The command the process is currently issuing.
Transaction The name of any transaction.
Field Description
Agent ID This is a system-wide unique indentifier for the application.
Auth ID This is the authorization ID of the user who invoked the application being monitored.
EMBARCADERO TECHNOLOGIES > EMBARCADERO PERFORMANCE CENTER 2.7 EXPERT GUIDE: SYBASE 100

OTHER VIEWS AND STATISTICS > SESSION DETAIL VIEW
Application Tab for DB2The Application tab contains application and client detail information from the application snapshot record for the selected application.
Application Details
OS User ID This is the authorization ID used to access the operating system.
Application This is the name of the application executable.
Statistic Description
Application Agent ID This is a system-wide unique indentifier for the application.
Application Agent PID The process ID (UNIX) or thread ID (Windows) of a DB2 agent.
Application Agent System CPU (sec) This is the total system CPU time (in seconds) used by the database manager agent process.
Application Agent User CPU (sec) This is the total CPU time (in seconds) used by database manager agent process.
Application Agents This is the number of agents currently executing statements or subsections.
Application Agents Stolen This is the number of times agents are stolen from the application. Agents are stolen when an idle agent is reassigned from one application to another.
Application Assoc Agents HWM This is the maximum number of subagents associated with the application.
Application Assoc Sub-Agents This is the number of subagents associated with the application.
Application Authorization ID This is the authorization ID of the user who invoked the application being monitored.
Application Codepage This is the code page identifier.
Application Connect Complete Time This is the date and time a connection request was granted.
Application Connect Start Time This is the date and time an application started a connection request.
Application Coord Agent PID This is the process ID (UNIX) or thread ID (Windows) of the coordinator agent for the selected application.
Application Coord Node In a multi-node system, this is the node number of the node where the selected application connected or attached to the instance.
Application Coord Token This is the DRDA AS correlation token.
Application ID This is generated when the application connects to the database at the database manager or when DDCS receives a request to connect to a DRDA database.
Application Idle Time This is the number of seconds since the selected application last issued any requests to the server. This includes applications that have not terminated a transaction, for example not issued a commit or rollback.
Application Name Name of the application executable.
OS User ID The authorization ID used to access the operating system.
Application Priority This is the priority of the agents working for this application.
Application Priority Type This is the operating system priority type for the agent working on behalf of the application.
Application Sequence Number This identifier is incremented when a unit of work ends (when a COMMIT or ROLLBACK terminates a unit of work). Together, the application ID and application sequence number uniquely identify a transaction.
Field Description
EMBARCADERO TECHNOLOGIES > EMBARCADERO PERFORMANCE CENTER 2.7 EXPERT GUIDE: SYBASE 101

OTHER VIEWS AND STATISTICS > SESSION DETAIL VIEW
Application Authorities
Client Details
Unit of Work Tab for DB2The Unit of Work tab contains the SQL statement for the selected application, as well as statistics related to that statement.
SQL Statement
The SQL Statement field displays the SQL statement for the application. You can click Explain SQL to view an explain plan for the statement.
Application Session Auth ID This is the current authorization ID for the session being used by this application.
Application Status This is the current status of the application.
Application Status Change Time This is the date and time the application entered its current status.
Application Territory Code This is the territory code (formerly country code) of the database for which the monitor data is being collected.
Column Description
Authority This is the highest authority level granted to the application.
Explicit Authorizations granted explicitly to a user.
Indirect Indirect authorizations inherited from group or public.
Statistic Description
Client Database Alias This is the alias of the database provided by the application to connect to the database.
Client Inbound Comm Address This is the communication address of the client.
Client Node Name This is the node name (nname) in the database manager configuration file at the client database partition.
Client PID This is the process ID of the client application that made the connection to the database.
Client Platform This is the operating system on which the client application is running.
Client Product and Version This is the product and version that is running on the client.
Client Protocol This is the communication protocol that the client application is using to communicate with the server.
TP Client Accounting String This is the data passed to the target database for logging and diagnostic purposes (if the sqleseti API was issued in this connection).
TP Client Application Name This name identifies the server transaction program performing the transaction (if the sqleseti API was issued in this connection).
TP Client User ID This is the client user ID generated by a transaction manager and provided to the server (if the sqleseti API is used).
TP Client Workstation Name This name identifies the client's system or workstation, for example CICS EITERMID, if the sqleseti API was issued in this connection.
Statistic Description
EMBARCADERO TECHNOLOGIES > EMBARCADERO PERFORMANCE CENTER 2.7 EXPERT GUIDE: SYBASE 102

OTHER VIEWS AND STATISTICS > SESSION DETAIL VIEW
Statement Detail
Statement Statistics
Statistic Description
SQL Statement This is the text of the dynamic SQL statement.
Node This is the node where the statement was executed.
Type This is the type of statement processed.
Creator This is the authorization ID of the user that pre-compiled the application.
Operation This is the statement operation currently being processed or that was most recently processed (if none are currently running).
Agents Created This is the maximum number of agents that were used when executing the statement.
Agents Working This is the number of concurrent agents currently executing a statement or subsection.
Cursor Name This is the name of the cursor corresponding to this SQL statement.
Blocking Cursor This indicates if the statement being executed is using a blocking cursor.
Package Name This is the name of the package that contains the SQL statement that is currently executing.
Package Version This identifies the version identifier of the package that contains the currently executing SQL statement.
Section Number This is the internal section number in the package for the SQL statement currently processing or most recently processed.
Parallelism Degree This is the degree of parallelism requested when the query was bound.
Query Cost Estimate This is the estimated cost for a query (in timerons) as determined by the SQL compiler.
Query Card Estimate This is an estimate of the number of rows that will be returned by a query.
Statistic Description
Statement Start Time This is the date and time when the statement operation (stmt_operation) monitor element started executing.
Statement Stop Time This is the date and time when the statement operation (stmt_operation) monitor element stopped executing.
Statement Sort Time (sec) This is the total elapsed time (in seconds) for all sorts that have been executed.
Statement User CPU (sec) This is the total user CPU time (in seconds) used by the currently executing statement.
Statement System CPU (sec) This is the total system CPU time (in seconds) used by the currently executing statement.
Statement Elapsed Time (sec) This is the elapsed execution time (in seconds) of the most recently completed statement.
UOW Start Time This is the date and time that the unit of work first required database resources.
UOW Stop Time This is the date and time that the most recent unit of work completed. This occurs when database changes are committed or rolled back.
UOW Prev Stop Time This is the time the previous unit of work completed.
UOW Elapsed Time (sec) This is the elapsed execution time (in seconds) of the most recently completed unit of work.
UOW Lock Wait Time (sec) This is the total amount of elapsed time (in seconds) this unit of work has spent waiting for locks.
UOW Log Space Used (KB) This is the amount of log space (in kilobytes) used in the current unit of work of the monitored application.
UOW Completion Status This is the status of the unit of work and how it stopped.
EMBARCADERO TECHNOLOGIES > EMBARCADERO PERFORMANCE CENTER 2.7 EXPERT GUIDE: SYBASE 103

OTHER VIEWS AND STATISTICS > SESSION DETAIL VIEW
Statement Activity
Locking Tab for DB2The Locking tab is a single application view of the Lock View. Information that is found in the Locks Held and Locks Waiting tabs of the Lock View will be available here for the selected application.
Locks Held
Statistic Description
Sorts This is the total number of times a set of data was sorted in order to process the statement operation (stmt_operation).
Sort Overflows This is the total number of sorts that ran out of sort heap and may have used disk space for temporary storage.
Fetches This is the number of successful fetches that were performed on a specific cursor.
Rows Read This is the number of rows read from the table.
Rows Written This is the number of rows changed (inserted, deleted, or updated) in the table.
Internal Rows Deleted This is the number of rows deleted from the database as a result of internal activity.
Internal Rows Updated This is the number of rows updated from the database as a result of internal activity.
Internal Rows Inserted This is the number of rows inserted into the database as a result of internal activity that was caused by triggers.
Temporary Data Logical Reads This indicates the number of data pages that have been requested from the buffer pool (logical) for temporary table spaces.
NOTE: The functionality to record buffer pool information at the statement level is supported for API and CLP snapshot requests.
Temporary Data Physical Reads Indicates the number of data pages that have been read in from the table space containers (physical) for temporary table spaces.
NOTE: The functionality to record buffer pool information at the statement level is supported for API and CLP snapshot requests.
Temporary Index Logical Reads Indicates the number of index pages that have been requested from the buffer pool (logical) for temporary table spaces.
NOTE: The functionality to record buffer pool information at the statement level is supported for API and CLP snapshot requests.
Temporary Index Physical Reads Indicates the number of index pages that have been read in from the table space containers (physical) for temporary table spaces.
NOTE: The functionality to record buffer pool information at the statement level is supported for API and CLP snapshot requests.
Column Description
Lock Mode This is the type of lock being held.
Object Type This is the type of object against which the application holds a lock (for object-lock-level information), or the type of object for which the application is waiting to obtain a lock (for application-level and deadlock-level information).
Table Schema This is the schema of the table that the lock is on.
Table Name This is the name of the table that the lock is on. This element is only set if Object Type indicates Table.
Tablespace This is the name of the table space against which the lock is held.
Lock Status This is the lock's status (waiting or granted).
EMBARCADERO TECHNOLOGIES > EMBARCADERO PERFORMANCE CENTER 2.7 EXPERT GUIDE: SYBASE 104

OTHER VIEWS AND STATISTICS > SESSION DETAIL VIEW
Locks Waiting
Memory Tab for DB2The Memory tab displays all the memory pools for the application and key cache statistics specific to the application.
Memory Pools
Memory Statistics
Escalation This indicates whether a lock request was made as part of a lock escalation.
Column Description
Agent ID This is the application handle of the agent holding a lock for which this application is waiting.
Application ID This is the application ID of the application that is holding a lock on the object that this application is waiting to obtain.
Lock Mode This is the type of lock being held.
Mode Requested This is the lock mode being requested by the application.
Object Type This is the type of object against which the application holds a lock.
Table Schema This is the schema of the table that the lock is on.
Tablespace This is the name of the table that the lock is on. This element is only set if Object Type indicates Table.
Wait Start Time This is the date and time that this application started waiting to obtain a lock on the object that is currently locked by another application.
Escalation This indicates whether a lock request was made as part of a lock escalation.
Column Description
Node This is the number assigned to the node in the db2nodes.cfg file.
Memory Pool This is the type of memory pool.
Utilization This is the percentage of memory pool used.
High Watermark (MB) This is the largest size of a memory pool (in megabytes) since its creation.
Current Size (MB) This is the current size of a memory pool (in megabytes).
Max Size (MB) This is the internally configured size of a memory pool (in megabytes) in DB2.
Statistic Description
Application Section Inserts This is the number of inserts of SQL sections by an application from its SQL work area.
Application Section Lookups This is the number of lookups of SQL sections by an application from its SQL work area.
Catalog Cache Inserts This is the number of times that the system tried to insert table descriptor or authorization information into the catalog cache.
Catalog Cache Lookups This is the number of times that the catalog cache was referenced to obtain table descriptor information or authorization information.
Catalog Cache Overflows This is the number of times that the catalog cache overflowed the bounds of its allocated memory.
Column Description
EMBARCADERO TECHNOLOGIES > EMBARCADERO PERFORMANCE CENTER 2.7 EXPERT GUIDE: SYBASE 105

OTHER VIEWS AND STATISTICS > SESSION DETAIL VIEW
Cache Hit Ratios
I/O Tab for DB2The I/O tab displays detailed I/O information from the application snapshot record for the selected application.
I/O Statistics
Package Cache Inserts This is the total number of times that a requested section was not available for use and had to be loaded into the package cache. This includes any implicit prepares performed by the system.
Package Cache Lookups This is the number of times an application looked for a section or package in the package cache.
Private Workspace Inserts This is the number of inserts of SQL sections by an application into the private workspace.
Private Workspace Lookups This is the number of lookups of SQL sections by an application in its agents' private workspace.
Private Workspace Overflows This is the number of times that the private workspaces overflowed the bounds of its allocated memory.
Private Workspace HWM (KB) This is the largest size (in kilobytes) reached by the private workspace.
Shared Workspace Inserts This is the number of inserts of SQL sections by applications into shared workspaces.
Shared Workspace Lookups This is the number of lookups of SQL sections by applications in shared workspaces.
Shared Workspace Overflows This is the number of times that shared workspaces overflowed the bounds of their allocated memory.
Shared Workspace HWM (KB) This is the largest size (in kilobytes) reached by shared workspaces.
Ratio Description
Catalog Cache The catalog cache hit ratio indicates how well the catalog cache is helping to avoid actual accesses to the catalog on disk. A high ratio indicates successful avoidance of actual disk I/O accesses.
Package Cache The package cache hit ratio indicates how well the package cache is helping to avoid reloading packages and sections for static SQL from the system catalogs as well as helping to avoid recompiling dynamic SQL statements. A high ratio indicates successful avoidance of these activities.
Shared Workspace The shared workspace hit ratio indicates how well the shared SQL workspace is helping to avoid having to initialize sections for SQL statements that are about to be executed. A high ratio indicate successful avoidance of this action.
Private Workspace The private workspace hit ratio indicates how well the private SQL workspace is helping to avoid having to initialize sections for SQL statements that are about to be executed. A high ratio indicate successful avoidance of this action.
Application Workspace The application workspace hit ratio indicates how well the application SQL workspace is helping to avoid having to initialize sections for SQL statements that are about to be executed. A high ratio indicate successful avoidance of this action.
Statistic Description
Buffered Data Logical Reads This indicates the number of data pages that have been requested from the buffer pool (logical) for regular and large table spaces.
Statistic Description
EMBARCADERO TECHNOLOGIES > EMBARCADERO PERFORMANCE CENTER 2.7 EXPERT GUIDE: SYBASE 106

OTHER VIEWS AND STATISTICS > SESSION DETAIL VIEW
I/O Distribution Ratios
Buffered Data Physical Reads This indicates the number of data pages that have been read from the table space containers (physical) for regular and large table spaces.
Buffered Data Writes This indicates the number of times a buffer pool data page was physically written to disk.
Buffered Index Logical Reads This indicates the number of index pages that have been requested from the buffer pool (logical) for regular and large table spaces.
Buffered Index Physical Reads This indicates the number of index pages that have been read from the table space containers (physical) for regular and large table spaces.
Buffered Index Writes This indicates the number of times a buffer pool index page was physically written to disk.
Buffered Read Time (sec) This indicates the total amount of time (in seconds) spent reading data and index pages from the table space containers (physical) for all types of table spaces.
Buffered Write Time (sec) This indicates the total amount of time (in seconds) spent physically writing data or index pages from the buffer pool to disk.
Direct Reads This is the number of read operations that do not use the buffer pool.
Direct Read Requests This is the number of requests to perform a direct read of one or more sectors of data.
Direct Writes This is the number of write operations that do not use the buffer pool.
Direct Write Requests This is the number of requests to perform a direct write of one or more sectors of data.
Direct Read Time (sec) This is the elapsed time (in seconds) required to perform the direct reads.
Direct Write Time (sec) This is the elapsed time (in seconds) required to perform the direct writes.
Extended Storage – Data Pages From This is the number of buffer pool data pages copied from extended storage.
Extended Storage – Data Pages To This is the number of buffer pool data pages copied to extended storage.
Extended Storage – Index Pages From This is the number of buffer pool index pages copied from extended storage.
Extended Storage – Index Pages To This is the number of buffer pool index pages copied to extended storage.
Prefetch Pages Unread This indicates the number of pages that the prefetcher read in that were never used.
Prefetch Wait Time (sec) This is the time an application spent waiting for an I/O server (prefetcher) to finish loading pages into the buffer pool.
Temporary Data Logical Reads This indicates the number of data pages which have been requested from the buffer pool (logical) for temporary table spaces.
Temporary Data Physical Reads This indicates the number of data pages read in from the table space containers (physical) for temporary table spaces.
Temporary Index Logical Reads This indicates the number of index pages which have been requested from the buffer pool (logical) for temporary table spaces.
Temporary Index Physical Reads This indicates the number of index pages read in from the table space containers (physical) for temporary table spaces.
Ratio Description
Direct Read Ratio Direct Reads are read operations that do not use the buffer pool. Direct Read Ratio is the percentage of all reads that were direct reads.
Statistic Description
EMBARCADERO TECHNOLOGIES > EMBARCADERO PERFORMANCE CENTER 2.7 EXPERT GUIDE: SYBASE 107

OTHER VIEWS AND STATISTICS > SESSION DETAIL VIEW
SQL Statistics Tab for DB2The SQL Statistics tab contains statistics about the SQL statement for the selected application.
SQL Statistics
Logical Read Ratio Logical Reads is the sum of all Buffer Pool Data Logical Reads and Buffer Pool Index Logical Reads. Logical Read Ratio is the percentage of all reads that were logical reads.
Physical Read Ratio Physical Reads is the sum of all Buffer Pool Data Physical Reads and Buffer Pool Index Physical Reads. Physical Read Ratio is the percentage of all reads that were physical reads.
Direct Write Ratio Direct Writes are write operations that do not use the buffer pool. Direct Write Ratio is the percentage of all writes that were direct writes.
Buffered Write Ratio Buffered Writes is the sum of all Buffer Pool Data Writes and Buffer Pool Index Writes. Buffered Write Ratio is the percentage of all writes that were buffered writes.
Statistic Description
Binds and Pre-Compiles This is the number of binds and pre-compiles attempted.
Cursor Block Requests Accepted This is the number of times a request for an I/O block was accepted.
Cursor Block Requests Rejected This is the number of times a request for an I/O block at the server was rejected and the request was converted to non-blocked I/O.
Cursors Open Local This is the number of local cursors currently open for this application, including those cursors counted by Cursors Open Local with Blocking.
Cursors Open Local with Blocking This is the number of local blocking cursors currently open for this application.
Cursors Open Remote This is the number of remote cursors currently open for this application, including those cursors counted by Cursors Open Remote with Blocking.
Cursors Open Remote with Blocking This is the number of remote blocking cursors currently open for this application.
Internal Automatic Rebinds This is the number of automatic rebinds (or recompiles) that have been attempted.
Internal Commits This is the total number of commits initiated internally by the database manager.
Internal Rollbacks This is the total number of rollbacks initiated internally by the database manager.
Internal Deadlock Rollbacks This is the total number of forced rollbacks initiated by the database manager due to a deadlock. A rollback is performed on the current unit of work in an application selected by the database manager to resolve the deadlock.
Internal Rows Deleted This is the number of rows deleted from the database as a result of internal activity.
Internal Rows Inserted This is the number of rows inserted into the database as a result of internal activity caused by triggers.
Internal Rows Updated This is the number of rows updated from the database as a result of internal activity.
Rows Deleted This is the number of row deletions attempted.
Rows Inserted This is the number of row insertions attempted.
Rows Read This is the number of rows read from the table.
Rows Selected This is the number of rows that have been selected and returned to the application.
Rows Updated This is the number of row updates attempted.
Rows Written This is the number of rows changed (inserted, deleted, or updated) in the table.
Ratio Description
EMBARCADERO TECHNOLOGIES > EMBARCADERO PERFORMANCE CENTER 2.7 EXPERT GUIDE: SYBASE 108

OTHER VIEWS AND STATISTICS > TOP SESSIONS VIEW
SQL Distribution Ratios
Top Sessions ViewThe following tabbed pages are available on the Top Sessions view:
• Memory Tab
• I/O Tab
• CPU Tab
Memory TabThe information on the Memory tab of the Top Sessions view depends on the target DBMS:
• Memory Tab for Oracle
• Memory Tab for SQL Server
• Memory Tab for Sybase
• Memory Tab for DB2
SQL DDL Statements This indicates the number of SQL Data Definition Language (DDL) statements that were executed.
SQL Commit Statements This indicates the total number of SQL COMMIT statements that have been attempted.
SQL Dynamic Statements This indicates the number of dynamic SQL statements that were attempted.
SQL Failed Statements This indicates the number of SQL statements that were attempted and failed.
SQL Requests Since Last Commit This indicates the number of SQL requests submitted since the last commit.
SQL Rollback Statements This indicates the total number of SQL ROLLBACK statements that have been attempted.
SQL Select Statements This indicates the number of SQL SELECT statements that were executed.
SQL Static Statements This indicates the number of static SQL statements that were attempted.
SQL UID Statements This indicates the number of SQL UPDATE, INSERT, and DELETE statements that were executed.
Column Description
DDL Statements This is the percentage of all executed statements that were SQL DDL Statements.
UID Statements This is the percentage of all executed statements that were SQL UID Statements.
Failed Statements This is the percentage of all executed statements that were SQL Failed Statements.
Select Statements This is the percentage of all executed statements that were SQL Select Statements.
Statistic Description
EMBARCADERO TECHNOLOGIES > EMBARCADERO PERFORMANCE CENTER 2.7 EXPERT GUIDE: SYBASE 109

OTHER VIEWS AND STATISTICS > TOP SESSIONS VIEW
Memory Tab for Oracle• Metrics
It is frequently the case that one or two users cause the majority of run-time problems. The problem could originate with a runaway process, an untuned batch procedure, or other user-initiated operation. User connections can get out of hand with memory consumption, and extreme cases have caused difficulties at both the database and operating system levels (ORA-4030 errors).
The table below describes the information available on the Leading Sessions tab of the Memory Detail view and the Memory tab of the Top Sessions view for Oracle:
NOTE: This information is available on both the Leading Sessions tab of the Memory Detail view and the Memory tab of the Top Sessions view.
TIP: To configure the grid to show/hide row numbers, use the Options Editor.
MetricsIf your database server does not have an overabundance of memory, you should check periodically to see who your heavy memory users are and the total percentage of memory each takes up. If you see that one or two users use more than 5-15 percent of the total memory, you should investigate the sessions further to see what activities they are performing.
Memory Tab for SQL Server• Metrics
It is not uncommon for one or two users to cause the majority of runtime problems that plague a database. The problem could be a runaway process, an untuned batch procedure, or other user-initiated operation. User connections can get out of hand with memory consumption, and extreme cases have caused headaches at both the database and operating system levels.
Performance Center displays information to find processes that are using the most memory on the server on the Leading Sessions tab of the Memory Detail view and the Memory tab of the Top Sessions view.
Column Description
User Name The logon name the session is using.
SID The unique Oracle identifier for the session.
Serial # The serial number assigned to the session.
Status The status of the session, ACTIVE or INACTIVE.
Machine The name of the client machine name that the session is using.
PGA Memory (KB) The Program Global Area (PGA) is a private memory area devoted to housing the global variables and data structures for a single Oracle process, in KB.
UGA Memory (KB) The User Global Area (UGA) contains session specific information regarding open cursors, state information for packages, database link information, and more. When using Oracle's Multi-threaded Server (MTS), the UGA can be moved up into the SGA, in KB.
Memory Sorts (KB) The total number of memory sorts a session has performed.
Total Memory (KB) The memory (PGA + UGA) that the session is consuming, in KB.
EMBARCADERO TECHNOLOGIES > EMBARCADERO PERFORMANCE CENTER 2.7 EXPERT GUIDE: SYBASE 110

OTHER VIEWS AND STATISTICS > TOP SESSIONS VIEW
The table below describes the information available on these tabs:
NOTE: This information is available on both the Leading Sessions tab of the Memory Detail view and the Memory tab of the Top Sessions view.
TIP: To configure the grid to show/hide row numbers, use the Options Editor.
MetricsIf your database server does not have an overabundance of memory, you should periodically check to see who your heavy memory users are along with the total percentage of memory each takes up. If you see one or two users who have more than 5-15 percent of the total memory usage, you should investigate the sessions further to see what activities they are performing.
Memory Tab for Sybase• Metrics
It is not uncommon for one or two users to cause the majority of runtime problems that plague a database. The problem could be a runaway process, an untuned batch procedure, or other user-initiated operation. Often, user connections can get out of hand with memory consumption, and extreme cases have caused headaches at both the database and operating system levels.
Column Description
PID The process ID of the connected session.
User Name The user name assigned to the process.
Status Indicates if the process is actively performing work, is idle, blocked by another process, etc.
Host The machine name that originated the process.
Program The program the process has invoked against SQL Server.
Memory Usage The total number of memory pages allocated to the process.
Pct Mem Used The percentage of overall memory among all processes that can be attributed to the process.
Database The database in which the process is currently running.
Command The command the process is currently issuing.
Open Trans The number of open transactions for the process.
Blocked The PID of any process blocking the current process.
Wait Time The current wait time for the process, in milliseconds.
EMBARCADERO TECHNOLOGIES > EMBARCADERO PERFORMANCE CENTER 2.7 EXPERT GUIDE: SYBASE 111

OTHER VIEWS AND STATISTICS > TOP SESSIONS VIEW
This tab displays information to find processes that are using the most memory on the server. The table below describes the information available on the Leading Sessions tab of the Memory Detail view and the Memory tab of the Top Sessions view for Sybase:
TIP: To configure the grid to show/hide row numbers, use the Options Editor.
MetricsIf your database server does not have an overabundance of memory, you should periodically check to see who your heavy memory users are along with the total percentage of memory each takes up. If you see one or two users who have more than 5-15 percent of the total memory usage, you should investigate the sessions further to see what activities they are performing.
Memory Tab for DB2• Metrics
It is not uncommon for one or two users to cause the majority of runtime problems that plague a database. The problem could be a runaway process, an untuned batch procedure, or other user-initiated operation. Often, user connections can get out of hand with memory consumption, and extreme cases have caused headaches at both the database and operating system levels.
Column Description
PID The process ID.
User Name The user name assigned to the process.
FID The process ID of the worker process’ parent.
Status Indicates if the process is actively performing work, is idle, blocked by another process, etc.
Host The machine name that originated the process.
Program The executable the process is using against the server.
Memory Usage The memory currently used by the process.
Pct Mem Used The percentage of memory currently used by the process.
Database The database in which the process is running.
Command The command the process is currently issuing.
Transaction The name of any transaction.
Blocked The PID of any process blocking the current process.
Time Blocked The time that the process has been blocked, in seconds.
EMBARCADERO TECHNOLOGIES > EMBARCADERO PERFORMANCE CENTER 2.7 EXPERT GUIDE: SYBASE 112

OTHER VIEWS AND STATISTICS > TOP SESSIONS VIEW
This tab displays information to find processes that are using the most memory on the server. The table below describes the information DB2 on the Leading Sessions tab of the Memory Detail view and the Memory tab of the Top Sessions view for DB2:
TIP: To configure the grid to show/hide row numbers, use the Options Editor.
MetricsIf your database server does not have an overabundance of memory, you should periodically check to see who your heavy memory users are along with the total percentage of memory each takes up. If you see one or two users who have more than 5-15 percent of the total memory usage, you should investigate the sessions further to see what activities they are performing.
I/O TabThe information on the I/O tab of the Top Sessions view depends on the target DBMS:
• I/O Tab for DB2
• I/O Tab for SQL Server
• I/O Tab for Sybase
• I/O Tab for DB2
I/O Tab for Oracle• Metrics
When a system undergoes heavy I/O activity, all the user connections can contribute somewhat equally to the overall load. Frequently, however, one or two user connections are responsible for 75 percent or more of the I/O activity. It may be that a large batch load or other typical process is running, and that is perfectly okay for your system. Or, it may be a runaway process or rogue connection that you should track down and eliminate.
Column Description
Agent ID The application handle of the agent holding a lock for which this application is waiting.
Auth ID The authorization ID of the user who invoked the application that is being monitored.
OS User ID The operating system ID of the process.
Client PID The process ID of the client application that made the connection to the database.
Application The name of the application executable.
Status The current status of the application.
UOW Elapsed Time (sec) The elapsed execution time of the most recently completed unit of work.
Memory Overflows Total number of memory overflows.
Memory Used (KB) Total memory pool usage for the application.
EMBARCADERO TECHNOLOGIES > EMBARCADERO PERFORMANCE CENTER 2.7 EXPERT GUIDE: SYBASE 113

OTHER VIEWS AND STATISTICS > TOP SESSIONS VIEW
It is a good idea to periodically check the leading sessions in your system with respect to I/O and make sure all is well. You can use Performance Center to perform this function with the information available on this tab. The table below describes the information available on the Leading Sessions tab of the I/O Detail view and the I/O tab of the Top Sessions view for Oracle:
NOTE: This information is available on both the Leading Sessions tab of the I/O Detail view and the I/O tab of the Top Sessions view.
TIP: To configure the grid to show/hide row numbers, use the Options Editor.
MetricsPinpointing sessions with abnormally high I/O activity relative to other sessions in the system can aid in ferreting out accounts that are dragging down overall system performance. You should examine the activity of each session to determine the system workload and to see if you can reduce the workload or tune the system for better performance.
I/O Tab for SQL Server• Metrics
When a system undergoes heavy I/O activity, sometimes you find that all the user connections are contributing somewhat equally to the overall load. Frequently, however, one or two user connections are responsible for 75 percent or more of the I/O activity. It can be that a large batch load or other typical process is running that is perfectly okay for your system. Alternatively, it can be a runaway process or other rogue connection that you should track down and possibly eliminate.
Performance Center displays information to find processes that are using the most memory on the server on the Leading Sessions tab of the I/O Detail view and the I/O tab of the Top Sessions view.
Column Description
User Name The logon name the session is using.
SID The unique Oracle identifier for the session.
Serial # The serial number assigned to the session.
Status The status of the session, ACTIVE or INACTIVE.
Machine The name of the client machine name that the session is using.
Reads The number of physical reads.
Writes The number of physical writes.
Total I/O The total of all physical I/O operations for the session.
EMBARCADERO TECHNOLOGIES > EMBARCADERO PERFORMANCE CENTER 2.7 EXPERT GUIDE: SYBASE 114

OTHER VIEWS AND STATISTICS > TOP SESSIONS VIEW
The table below describes the information available on these tabs:
NOTE: This information is available on both the Leading Sessions tab of the I/O Detail view and the I/O tab of the Top Sessions view.
TIP: To configure the grid to show/hide row numbers, use the Options Editor.
MetricsFinding one more two users that are consuming more than 75 percent of the total I/O load can indicate a runaway or improper process. By drilling down into the I/O activity of all users, you can quickly see if this is the case.
I/O Tab for Sybase• Metrics
When a system undergoes heavy I/O activity, sometimes you find that all the user connections are contributing somewhat equally to the overall load. More often than not, however, one or two user connections are responsible for 75 percent or more of the I/O activity. It can be that a large batch load or other typical process is running that is perfectly okay for your system. Or it can be a runaway process or other rogue connection that needs to be tracked down and possibly eliminated.
Column Description
PID The process ID.
User Name The user name assigned to the process.
Status Indicates if the process is actively performing work, is idle, blocked by another process, etc.
Host The machine name that originated the process.
Program The executable the process is using against the server.
Physical I/O The current cumulative number of reads and writes issued by the process.
Pct I/O Used The percentage of overall I/O that can be attributed to the process.
Database The database in which the process is running.
Command The command the process is currently issuing.
Open Trans The number of open transactions for the process.
Blocked The PID of any process blocking the current process.
Wait Time The current wait time for the process, in milliseconds.
EMBARCADERO TECHNOLOGIES > EMBARCADERO PERFORMANCE CENTER 2.7 EXPERT GUIDE: SYBASE 115

OTHER VIEWS AND STATISTICS > TOP SESSIONS VIEW
It is a good idea to periodically check who the leading sessions are in your system with respect to I/O and make sure all is well. You can use Performance Center to easily perform this function with the leading sessions tab of the I/O Detail view. The table below describes the information available on the I/O tab of the Top Sessions view for Sybase:
TIP: To configure the grid to show/hide row numbers, use the Options Editor.
MetricsPinpointing sessions with abnormally high I/O activity relative to other sessions in the system help you ferret out accounts dragging down overall system performance. You should examine the activity of each session to determine the workload being placed on the system and if you can reduce or tune that workload for better performance.
I/O Tab for DB2• Metrics
When a system undergoes heavy I/O activity, sometimes you find that all the user connections are contributing somewhat equally to the overall load. More often than not, however, one or two user connections are responsible for 75 percent or more of the I/O activity. It can be that a large batch load or other typical process is running that is perfectly okay for your system. Or it can be a runaway process or other rogue connection that needs to be tracked down and possibly eliminated.
Column Description
PID The process ID.
User Name The user name assigned to the process.
FID The process ID of the worker process’ parent.
Status Indicates if the process is actively performing work, is idle, blocked by another process, etc.
Host The machine name that originated the process.
Program The executable the process is using against the server.
Physical I/O The current cumulative number of reads and writes issued by the process.
Pct I/O Used The percentage of overall I/O that can be attributed to the process.
Database The database in which the process is running.
Command The command the process is currently issuing.
Transaction The name of any transaction.
Blocked The PID of any process blocking the current process.
Time Blocked The time that the process has been blocked, in seconds.
EMBARCADERO TECHNOLOGIES > EMBARCADERO PERFORMANCE CENTER 2.7 EXPERT GUIDE: SYBASE 116

OTHER VIEWS AND STATISTICS > TOP SESSIONS VIEW
It is a good idea to periodically check who the leading sessions are in your system with respect to I/O and make sure all is well. You can use Performance Center to easily perform this function with the leading sessions tab of the I/O Detail view. The table below describes the information available on the I/O tab of the Top Sessions view for DB2:
TIP: To configure the grid to show/hide row numbers, use the Options Editor.
MetricsPinpointing sessions with abnormally high I/O activity relative to other sessions in the system help you ferret out accounts dragging down overall system performance. You should examine the activity of each session to determine the workload being placed on the system and if you can reduce or tune that workload for better performance.
CPU TabThe information on the CPU tab of the Top Sessions view depends on the target DBMS:
• CPU Tab for Oracle
• CPU Tab for SQL Server
• CPU Tab for Sybase
• CPU Tab for DB2
Column Description
Agent ID The application handle of the agent holding a lock for which this application is waiting.
Auth ID The authorization ID of the user who invoked the application that is being monitored.
OS User ID The operating system ID of the process.
Client PID The process ID of the client application that made the connection to the database.
Application The name of the application executable.
Status The current status of the application.
UOW Elapsed Time (sec) The elapsed execution time of the most recently completed unit of work.
Buffered I/O Time (ms) The total time spent by application in performing buffered reads and writes.
Direct I/O Time (ms) The total time spent by application in performing non-buffered reads and writes.
Total I/O Time (ms) The total time spent by application in performing buffered and non-buffered reads and writes.
EMBARCADERO TECHNOLOGIES > EMBARCADERO PERFORMANCE CENTER 2.7 EXPERT GUIDE: SYBASE 117

OTHER VIEWS AND STATISTICS > TOP SESSIONS VIEW
CPU Tab for OracleThe table below describes the information available on the CPU tab of the Top Sessions view for Oracle:
TIP: To configure the grid to show/hide row numbers, use the Options Editor.
CPU Tab for SQL ServerThe table below describes the information available on the CPU tab of the Top Sessions view for SQL Server:
TIP: To configure the grid to show/hide row numbers, use the Options Editor.
CPU Tab for SybaseThe table below describes the information available on the CPU tab of the Top Sessions view for Sybase:
Column Description
User Name The logon name the session is using.
SID The unique Oracle identifier for the session.
Serial # The serial number assigned to the session.
Status The status of the session, ACTIVE or INACTIVE.
Machine The name of the client machine name that the session is using.
Program The executable the process is using against the server.
CPU The CPU used by the process when the call started.
Column Description
PID The process ID.
User Name The user name assigned to the process.
Status Indicates if the process is actively performing work, is idle, blocked by another process, etc.
Host The machine name that originated the process.
Program The executable the process is using against the server.
CPU The cumulative CPU time for the process.
Pct CPU Used The percentage of the CPU dedicated to this process.
Database The database in which the process is running.
Command The command the process is currently issuing.
Open Trans The number of open transactions for the process.
Blocked The PID of any process blocking the current process.
Wait Time The current wait time for the process, in milliseconds.
Column Description
PID The process ID.
User Name The user name assigned to the process.
FID The process ID of the worker process’ parent.
EMBARCADERO TECHNOLOGIES > EMBARCADERO PERFORMANCE CENTER 2.7 EXPERT GUIDE: SYBASE 118

OTHER VIEWS AND STATISTICS > TOP SQL VIEW
To configure the grid to show/hide row numbers, use the Options Editor.
CPU Tab for DB2The table below describes the information available on the CPU tab of the Top Sessions view for DB2:
To configure the grid to show/hide row numbers, use the Options Editor.
Top SQL View• Metrics
One or two bad queries can cause a lot of trouble for the remaining sessions in a database. It is important to find them before they get into a production system, but sometimes a few sneak through.
Status Indicates if the process is actively performing work, is idle, blocked by another process, etc.
Host The machine name that originated the process.
Program The executable the process is using against the server.
CPU The cumulative CPU time for the process in ticks.
Pct CPU Used The percentage of the CPU dedicated to this process.
Database The database in which the process is running.
Command The command the process is currently issuing.
Transaction The name of any transaction.
Blocked The PID of any process blocking the current process.
Time Blocked The time that the process has been blocked, in seconds.
Column Description
Agent ID The application handle of the agent holding a lock for which this application is waiting.
Auth ID The authorization ID of the user who invoked the application that is being monitored.
OS User ID The operating system ID of the process.
Client PID The process ID of the client application that made the connection to the database.
Application The name of the application executable.
Status The current status of the application.
UOW Elapsed Time (sec) The elapsed execution time of the most recently completed unit of work.
Agent ID The application handle of the agent holding a lock for which this application is waiting.
User CPU Time (sec) The total user CPU time used by the application agents.
System CPU Time (sec) The total system CPU time used by the application agents.
Total CPU Time (sec) The total user + system CPU time used by the application agents.
Column Description
EMBARCADERO TECHNOLOGIES > EMBARCADERO PERFORMANCE CENTER 2.7 EXPERT GUIDE: SYBASE 119

OTHER VIEWS AND STATISTICS > TOP SQL VIEW
By applying custom filters and performance-related thresholds, the Top SQL view locates inefficient SQL. By applying filters to certain I/O and statistical counters, you hope to isolate queries that far exceed their nearest competitors in the same area (like disk reads). When you find them, you should reduce the number of sorts a query performs. Or, for a query that returns only a few records, you should try to minimize the number of rows a query processes.
The Top SQL view displays requested SQL for SQL Server, Oracle, DB2, and Sybase datasources.
MetricsWhen you begin to look for inefficient SQL in a database, there are two primary questions you need to answer:
1 What has been the worst SQL that has historically been run in my database?
2 What is the worst SQL that’s running right now in my database?
When troubleshooting a slow system, you should be on the lookout for any query that shows an execution count that is significantly larger than any other query on the system. It may be that the query is in an inefficient Transact SQL loop, or other problematic programming construct. Only by bringing the query to the attention of the application developers will you know if the query is being mishandled from a programming standpoint.
EMBARCADERO TECHNOLOGIES > EMBARCADERO PERFORMANCE CENTER 2.7 EXPERT GUIDE: SYBASE 120

>
Symbols% Privileged Time 79% User Time 79
AAIX 71All Locks Tab
Oracle 62SQL Server 62Sybase 63
All User Locks Tab 64Archive View 59Available Paged Memory 76Available Physical Memory 75Available Swap Memory 76Average Disk Queue 82Average Disk Queue Length 74
BBlocking Locks Tab
Oracle 65SQL Server 66Sybase 67
Blocks Input/Sec 82Blocks Output/Sec 82Bottleneck Analysis
OS 72Buffer Size 84Bytes per I/O Operation 82
CCache Efficiency 84Cache Size 84Clock Algorithm Scans 84Contention Health Index 60Contention Page Statistics DB2
Applications Waiting on Locks 36Average Lock Wait Time 37Deadlocks 34Lock Escalations 35Lock List Utilization 36Lock Overview 36Lock Timeouts 35Lock Wait Time 37Lock Waits 35
Context Switches/Sec 80Copy Read Hits % 84CPU Events 79CPU Tab 78CPU Utilization 79
DData Map Hits % 84Datasource Health Index 60DB2 Expert Guide 10Device Detail 86Device Summary 86Disk Analysis
OS 72Disk I/O Time 82Disk Time 73Disk Transfers/Sec 82
EMBARCADERO TECHNOLOGIES > EMBARCADERO PERFORMANCE CENTER 2.7 EXPERT GUIDE: DB2 121

>
FFree Disk Space 77
HHealth Index View 60HIDD_OS_PC_TOPMEMPROC_ORA 77Home View Statistics
DB2Hash Join Overflow Percentage 14Sort Overflow Percentage 14
Hot Objects View 60Hot Code Tab 61Hot Tables Tab 60
HP-UX 71
II/O Details 81I/O Page Statisitics
Asynchronous Read Rate 21Asynchronous Write Rate 22Asynchronous Write Ratio 20Buffer Pool Hit Ratio 23Buffer Pool Index Hit Ratio 24Direct Read Rate 21Direct Write Rate 21Direct Write Ratio 20Dirty Page Cleans 23Log Read Rate 21Log Space Cleans 22Log Space Cleans Ratio 24Log Write Rate 21Page Cleaners 22Prefetch Wait Time 23Prefetchers 22Session Leaders – I/O 25Synchronous Read Rate 21Synchronous Write Rate 22Synchronous Write Ratio 20Threshold Cleans Ratio 24Victim Cleans Hit Ratio 24
I/O Performance Category ViewStatistics 18
I/O Tab 113Inbound Packet Errors 86Inbound Packets Discarded 86INET Address 86
EMBARCADERO TECHNOLOGIES > EMBARCADERO PERFORMANCE CENTER 2.7 EXPERT GUIDE: DB2 122
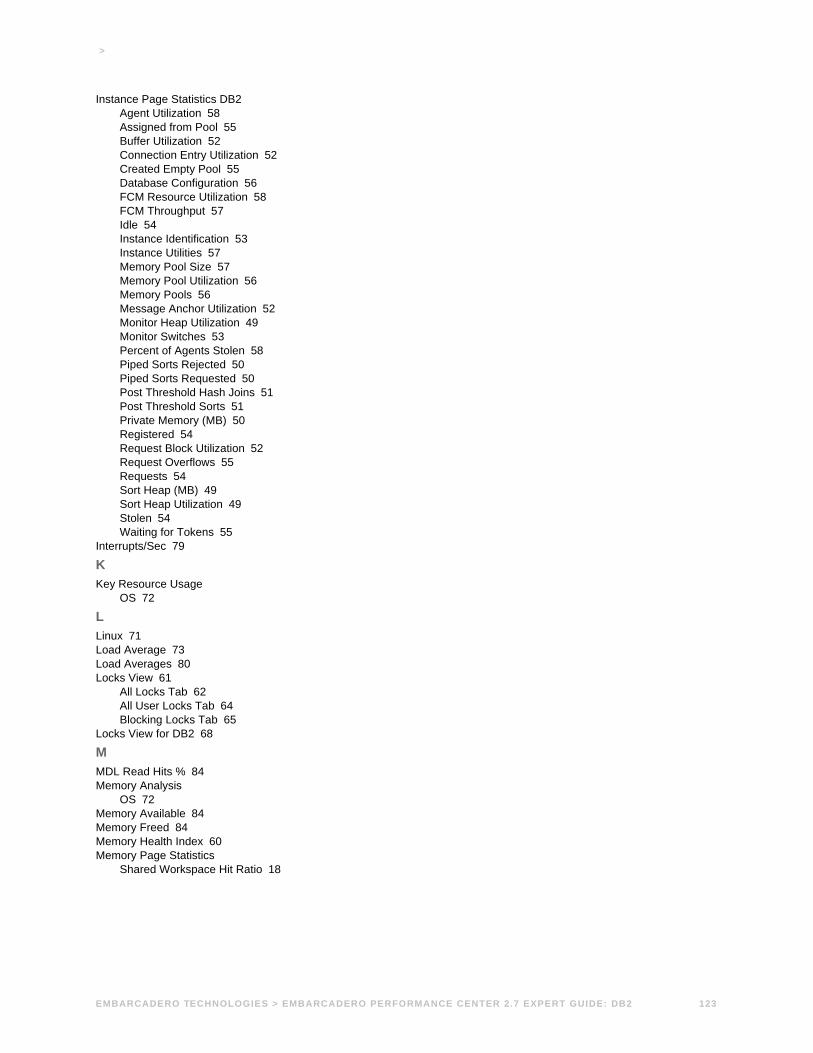
>
Instance Page Statistics DB2Agent Utilization 58Assigned from Pool 55Buffer Utilization 52Connection Entry Utilization 52Created Empty Pool 55Database Configuration 56FCM Resource Utilization 58FCM Throughput 57Idle 54Instance Identification 53Instance Utilities 57Memory Pool Size 57Memory Pool Utilization 56Memory Pools 56Message Anchor Utilization 52Monitor Heap Utilization 49Monitor Switches 53Percent of Agents Stolen 58Piped Sorts Rejected 50Piped Sorts Requested 50Post Threshold Hash Joins 51Post Threshold Sorts 51Private Memory (MB) 50Registered 54Request Block Utilization 52Request Overflows 55Requests 54Sort Heap (MB) 49Sort Heap Utilization 49Stolen 54Waiting for Tokens 55
Interrupts/Sec 79
KKey Resource Usage
OS 72
LLinux 71Load Average 73Load Averages 80Locks View 61
All Locks Tab 62All User Locks Tab 64Blocking Locks Tab 65
Locks View for DB2 68
MMDL Read Hits % 84Memory Analysis
OS 72Memory Available 84Memory Freed 84Memory Health Index 60Memory Page Statistics
Shared Workspace Hit Ratio 18
EMBARCADERO TECHNOLOGIES > EMBARCADERO PERFORMANCE CENTER 2.7 EXPERT GUIDE: DB2 123

>
Memory Page Statistics DB2Catalog Cache Overflows 15Lock List Utilization 16Package Cache Hit Ratio 17Package Cache Overflows 15Private Workspace Overflows 15Session Leaders – Memory 17Shared Workspace Overflows 16Sort Heap Utilization 17
Memory Tab 82, 110
NNetwork Details 86Network Queue Length 75Number of Logins 78Number of Processes 78
OObject Page Statistics DB2
Buffer Pools Tab – I/O Analysis 30Buffer Pools Tab – Overview 30Containers Tab 33Tables Tab 33Tablespaces Tab – I/O Analysis 32Tablespaces Tab – Overview 31
Objects Accessed 88Objects Health Index 60Operating System Statistics 71Operating System View 70OS Detail 78OS Drill Down 78OS Statistics 71OS View
Processor 73Processor Speed 73
Outbound Packet Errors 86Outbound Packets Discarded 86
PPacket Collisions 86Packet Discard 86Packet Discards 86Packet Errors 86Packets Received/Sec 86Packets Sent/Sec 86Page Faults/Sec 74Page Replacements 84Paged In 82Paged Memory Used 73Paged Out 82Pages Input/Sec 82Pages Output/Sec 82Paging Activity 82Partition 85
EMBARCADERO TECHNOLOGIES > EMBARCADERO PERFORMANCE CENTER 2.7 EXPERT GUIDE: DB2 124

>
Performance Analyst for Oracle StatisticsOS Page 71
Available Paged Memory 76Available Physical Memory 75Available Swap Memory 76Average Disk Queue Length 74Disk Time 73Free Disk Space 77Load Average 73Network Output Queue Length 75Network Queue Length 75Number of Logins 78Number of Processes 78OS Detail
CPU Tab 78CPU Events Context Switches/Sec 80CPU Events Interrupts/Sec 79CPU Utilization 79CPU Utilization % Privileged Time 79CPU Utilization % User Time 79Processor Queue Length 80
I/O Tab 81Memory Tab 82
Cache Efficiency 84Cache Efficiency Copy Read Hits % 84Cache Efficiency Data Map Hits % 84Cache Efficiency MDL Read Hits % 84Cache Efficiency Pin Read Hits % 85Paging Activity 82Paging Activity Pages Input/Sec 82Paging Activity Pages Output/Sec 82
Network Tab 86Processes Tab 80Space Tab 85
Page Faults/Sec 74Paged Memory Used 73Processor Queue Length 75Processor Time 72Swap Memory Used 74Top CPU Process 78Top I/O Process 78Top Memory Process 77Total Disk Space 77Total Paged Memory 76Total Physical Memory 76Total Swap Memory 76Used Disk Space 77
Pin Read Hits % 85Processes Tab 80Processor Queue Length 80Processor Time 72
RReceived (KB/Sec) 86Rollback Segments Accessed 88
EMBARCADERO TECHNOLOGIES > EMBARCADERO PERFORMANCE CENTER 2.7 EXPERT GUIDE: DB2 125

>
SSent (KB/Sec) 86Session Contention Tab 87Session Detail View
Oracle 86SQL Server 90Sybase 96
Session I/O Tab 87Session Memory Tab 87Session Network Tab 89Session Objects Tab
Oracle 88Session SQL Tab 89Session Statistics Tab 89Solaris 71Space Health Index 60Space Page Statistics DB2
Abnormal State Tablespaces 29Active Log Free 27Active Log Size 27Active Log Used 27Active Log Utilization 27DMS Free 26DMS Used 26DMS Utilization 26Inaccessible Containers 28Secondary Log Used HWM 28Secondary Logs Allocated 27SMS Free 26SMS Used 26SMS Utilization 27Tablespace Low on Space 28Tablespace Overview 29
Space Performance Category ViewStatistics 25
Space Tab 85Swap Memory Used 74System Calls/Sec 80
TTop CPU Process 78Top I/O Process 78Top Memory Process 77Top Sessions View 109
DB2CPU Tab 119I/O Tab 116Memory Tab 112
OracleCPU Tab 118I/O Tab 113Memory Tab 110
SQL ServerCPU Tab 118I/O Tab 114Memory Tab 110
SybaseCPU Tab 118I/O Tab 115Memory Tab 111
Total Disk Queue 82
EMBARCADERO TECHNOLOGIES > EMBARCADERO PERFORMANCE CENTER 2.7 EXPERT GUIDE: DB2 126

>
Total Disk Space 77Total Paged Memory 76Total Physical Memory 76Total Swap Memory 76Transfer Rate 82Transmission Queue Length 86Transmission Rate
Bytes 86Packets 86
UUnix 71Used Disk Space 77Users Health Index 60Users Page Statistics DB2
Connections 38Connections Active 39Connections Idle 39Connections Waiting 39Dynamic SQL Statements 39Lock Waits Per Transaction 40Max. Connections 42Percent Executing 42Percent of Maximum 42Rows Selected Per Transaction 40Selects Per Transaction 40Session Leaders – CPU 41Session Leaders – I/O 41Session Leaders – Memory 40Sorts Per Transaction 40Static SQL Statements 39Transactions 40Transactions Per Second 40
Users Performance Category ViewStatistics 38
WWindows 71
EMBARCADERO TECHNOLOGIES > EMBARCADERO PERFORMANCE CENTER 2.7 EXPERT GUIDE: DB2 127