ellipsometric study of the transition layer on the surface of an ice
TRANSCRIPT

Journal of Crystal Growth 82 (1987) 665-677North-Holland, Amsterdam
ELLIPSOMETRIC STUDY OF THE TRANSmON LAYER ON THE SURFACEOF AN ICE CRYSTAL
Yoshinori FURUKAWAThe Inst itute of Low Temperature Science, Hokkaido University. Sapporo 060. Japan
Masaki YAMAMOTOResearch Institute for Scientific Measurements. Tohoku University. Sendai 980. Japan
and
Toshio KURODAThe Institute 0/ Low Temperature Science. Hokkaido University. Sapporo 060, Japan
Received 9 December 1986
665
The purpose of this work is to examine the properties of the transition layer (quas i-liquid layer, QLL) on the surface of an icecrystal at temperatures just below its bulk melting point (0 ° q using ellipsometry. The refractive index nl and thickness d of thetransition layer were measured on both basal {OOOl) and prismatic {lola} faces of ice crystals . The ice surface sample used was aslice section of a negative crystal, which is a hole growing to the shape of a sharp hexagonal prism in an ice single crystal. The surfaceprepared in this way was molecularly smooth and free from contaminations. Transition layers were detected on the {OOOl} and{lola} faces at the condition of equilibrium vapor pressure. The measured nl was 1.330 for both faces, which is quite close to therefractive index of bulk water at 0 0 C (n w -1.3327) rather than that of ice (n, -1.3079). Consequently, the transition layer should bewater-like (namely, QLL), and this result gives direct evidence of surface melting . The critical temperatures (Tw ) at which the QLLwas detected on the surface were - 2° C for the {OOOl} face and - 2 to -4° C for the {lOIO} face. The thickness of the layer steeplyincreases as the temperature approached the melting point. However, the temperature dependences of the layer thickness showed asystematic difference between the {OOOI} and {lOIO} faces. That is, Tw(OOOl) > Tw(lOIO) and d(OOOl) < d(lOIO) for a giventemperature above - 4 ° C. These characteristics were qualitatively explained by theoretical arguments on the basis of thethermodynamics of the surface. Finally, it was indicated that the structure of the interface between the QLL and the ice crystal on the{lola} face changes from smooth to rough at a temperature of -2°C, and that the roughening transition temperature (T.) at whichthe facets disappear from the growing negative crystals or snow crystals is higher than Tw •
1. Introduction
The structure of crystal surface at temperaturesjust below the bulk melting point has awakenedthe special interest of many researchers in connection with the basic problems of crystal growth,such as the growth mechanism, the surfaceroughening transition, the surface melting and theequilibrium form of crystal. The crystal surfacehas been generally considered to change to thegeometrically rough surface above a critical temperature (T,.) whereas to be molecularly flat below
1;. [1]. On the other hand, several researchers [2-8]have pointed out theoretically that the crystalsurface may be covered with a transition layer (aso-called quasi-liquid layer, QLL) in which thelong range order of molecular arrangement disappears, at temperatures just below its melting point.Consequently, it is very important to investigateexperimentally the physical property of the transition layer, the configuration of molecules insidethe layer, the temperature range for which it isstable and the thickness of layer. The structureand the physical property of a surface like this,
0022-0248/87/$03.50 © Elsevier Science Publishers B.V.(North-Holland Physics Publishing Division)

666 Y. Furukawa et al. I Ellipsometricstudy of transition layeron surfaceof icecrystal
however, have not been clarified yet because ofthe difficulty of examining the crystal surface atthe vicinity of the melting point.
Ice crystal surfaces have been considered to becovered with a transition layer, since Faraday [9]first proposed in the 1850's that the unusual slipperiness of ice and the regelation phenomenonwere due to the thin water layer existing on the icesurface in equilibrium with the bulk ice at temperatures below the bulk melting point (O°C). Thisargument was taken up again by Wyle [10] in1951. Many theoretical and experimental studiesabout the layer have been carried out ever since.Fletcher [11] discussed theoretically the stabilityof the supercooled water layer on the basis of theinteraction energy between water molecules at theice crystal surface, and indicated that the layer isenergetically favored at temperatures above -(5± 3)OC and its thickness increases as the temperature approaches o°c. Recently, Turner [12] hasdiscussed this problem again.
In order to examine the existence of the transition layer, a variety of experiments have beencarried out by the use of regelation property[13-16], electrical conductivity of surface [17,18],NMR [19], Rutherford backscattering at the proton channeling [20], gas adsorption [21-23] , photoemission [24], Volta effect [25] and thermal expansion coefficient [26]. Although all of them indirectly show the existence of the transition layer,conclusions differ from each other on the physicalproperties of the layer, its thickness and the temperature range for which it is stable. Recently,Beaglehole and Nason [27] measured the ellipticitycoefficient for the reflected light from the icesurface and showed that the layer thickness depends on the crystal orientations. However, therewere some problems in their measurements; forexample, they assumed that the refractive index ofthe transition layer was equal to that of the bulkwater and the ice surfaces used in their experiment'were prepared destructively. Consequently,we do not know yet whether the transition layeron the ice surface is "water-like" indeed or notand how thick it is.
On the other hand, Kuroda and Lacmann [6]proposed a new theoretical interpretation to explain the basic habits of ice crystals growing from
vapor (snow crystals), resulting from the view_point that ice surfaces are covered with QLLs justbelow DOC. It has been definitely shown that theQLL is thermodynamically stable above a criticaltemperature (Tw ) and its thickness increases Withincreasing temperature.
Lately, studies about the transition layers Onother crystalline materials in addition to the icecrystal have been carried out . Broughton andothers [28,29] carried out the simulation of thesurface melting on the (111), (100) and (110) facesof Lennard-Jones fcc crystals by the method ofmolecular dynamics. Matsubara et al. [30] shOwedthat the melting point of ultra fine particles islowered from the melting point of its bulk crystalon the basis of such an argument that the arnpjj,tude of thermal vibrations of the atoms at thesurface is larger than that of the internal atoms.Stock and Menzel [31] and Stock and Grosser [32]performed experiments to observe solidifyingspherical crystals of Cu or Ag in their thermallight. As a result, they showed that the high indexfaces, except for the (111) and (001) faces of Cu OrAg, may be covered with their own melts in thevicinity of the bulk melting point. Nenow andco-workers [7,33,34] discussed the relation between the surface melting and the temperaturedependence of equilibrium forms using severalorganic crystals. Frenken and Van der Veen [35]showed, using an ion shadowing and blockingmeasurement of Rutherford scattering, that the(110) face of Pb is covered with a transition laYer(liquid surface film), which appears at 40 K belowthe bulk melting point of Pb and the thickness ofwhich increases dramatically as the temperatureapproaches the melting point. Chernov andJakovlev [36] also showed using ellipsometry thata transition layer exists at the interface betweenglass and the (100) or (010) face of biphenylcrystal at temperatures just below the meltingpoint. Recently, Kaito [37] discussed the relationbetween the surface melting and the coagulationgrowth mechanism of smoke particles of SUchcrystals as Ag.
The aim of this work is to examine directly thephysical properties and the thickness of the trans],tion layer on basal {OOOl} and prismatic {lOIO}faces of ice crystals. The thickness and the rerrac_

Y. Furukawa et al. / E//ipsometric study of transition layeronsurfaceof icecrystal 667
tive index are measured for both faces of ice singlecrystals using ellipsometry, and the temperaturedependence and the anisotropy of the layer thickness are clarified . Finally, the microscopic surfacestructure of ice crystal and the relation betweenthe surface melting and the surface rougheningwill be discussed in combination with the habitchange of ice crystals observed near the meltingpoint.
2. Ellipsometry
Ellipsometry is a method to analyze the microscopic surface structures of materials. When apolarized light wave interacts with a surface, itspolarization state is changed. An analysis of thismodification gives much information on thesurface structure. It is advantageous to have anin-situ method which does not disturb the surfacestudied and to need no such special conditions asan ultra-high vacuum to operate. The particularsof the theoretical argument about the ellipsometryused in this work will be published in a separatepaper [38]. Consequently, we shall give only itsoutline, here.
When linearly polarized light is reflected at thesurface covered with a thin transition layer (fig. I),it is changed to the elliptically polarized light. Thecomplex relative amplitude attenuation p, which isthe ratio of complex amplitude reflectivities(i~p, R.), is given by:
p = ~p = ~p exp[ i( s, - c5.)] = tan 1/1 exp(L1),R, •
(1)
where L1 .. c5p - 8. represents the relative phaseshift and tan 1/1 = Rp/R. the relative amplitudeattenuation on the reflection at the sample surface.
Assuming a proper model of surface structure,we can obtain a diagram which shows the simulated changes of (1/1, L1). As the simplest model,we consider a single layer model as shown in fig.I, in which the transition layer is homogeneousand isotropic, and the interface between the substrate and transition layer is smooth. 1/1 and L1 areindependently given as functions of wave length
Table 1Optical constants of ice crystal and water concerned with thepresent work [39)
Crystallographic struc- Hexagonal, wurtzite structureture of ice
Optical structure of ice Doubly refracting, uniaxial,optically positiveOptic axis IIcrystallographic[0001] axis
Refractive index of ice n~ - n~J -(11.5+ 3.84T)XI0-'n~J -1.30763 (X - 632.8 nm)n~ - n:3 -(11.4+3.8T)XI0-'n:J -1.30903 (X - 632.8 nm)
Refractive index of n w -1.3327 (T - 0 0 C,water X- 632.8 nm)
T - temperature in 0 C.
A, angle of incidence epo, refractive index of substrate n2' refractive index of transition layer n1and layer thickness d.
The values of the parameters used to take thesimulation were as follows. The optical constantsof ice and water are given in table 1. The icecrystal is a doubly-refracting, uniaxial and optically positive crystal. Since the birefringence (no- nE
) is extremely small, we assume that the icecrystal is optically isotropic. Therefore, n2 = n j -
p
1-----~.....-~-_.transmon
layer2-------joLq--~
Ice
Fig. 1. Parameter des ignation for analysis with a single layermodel. nl' n2' refractive indices of the transition layer and theice crystal; d, thickness of the layer; 4>0' angle of incidence; X,wave length. The p-component is the component of the electricwave vector parallel to the plane of incidence, and the s-corn-
ponent is perpendicular to that plane.

668 Y. Furukawa et al. I Ellipsometric study of transition layeron surfaceof icecrystal
150",l'I-F--"'~==1F_+-t-150
Fig. 2. Simulated changes of the complex amplitude attenuation. p - RpiR.- tan IJ- exp(i A) in polar coordinates (IJ-. A). Solidcurves show the change of (IJ-. A) for thickening layers with various refractive indices n\ and broken curves show the equi-thickness
lines: (a) nl ~ 1.310; (b) nl -1.305. n2 -1.3079. n...-1.3327.
1.3079, A= 632.8 nm (He-Ne laser beam) andq>o = 52.950 0
•
Fig. 2 shows a diagram obtained by the calculation of (If, .1) for various combinations of n1
and d given as parameters, and plotted in polarcoordinates. The length of the radius vector istaken equal to the value of If, and the azimuth isequal to .1. If no transition layer exists on the icesurface, (If, .1) is plotted at the point S (.1 = 0)which locates on the real axis. Solid curves are theequi-refractive index lines and broken curves arethe equi-thickness lines.
As may be readily understood, q>o was chosenas if the equi-refractive index line for water layer(n
1= nw = 1.3327) nearly coincides to a circle
around the coordinate origin (0). Consequently,the change in n1 appears mainly in If, whereas dappears in .1, if the transition layer is actuaUywater-like. This diagram also indicates that (If, .1)changes in clockwise direction from the point Swith thickening layer of constant n1 when n1 > n2 ,
and in anticlockwise direction when n1 < n2 •
By plotting the measured (If, .1) on thisdiagram, we can graphically obtain the values ofn1 and d of the transition layer on the ice surface.We used firstly this graphical method to survey
the behavior of the transition layer depending ontemperature, and then numerically calculated thevalues of n1 and d by inserting the measured(If, .1) into the relations If(n1, d) and .1(n1, d).
3. Experimental
3.1. Experimentalapparatus
A null eIIipsometry was operated in a walk-incold room, using an eIIipsometer which wasimproved to use at a temperature of about -100C.Fig. 3 schematically shows the optical system ofthe eIIipsometer. The light source (L) was a 1 lllWHe-Ne laser. The laser beam was changed to thelinearly polarized light by a polarizer (P) andreflected at the ice surface. The reflected light Wasanalyzed by a compensator (C) and an analYzer(A). A state of extinction was examined through atelescope (1) by the naked eye and the reflectionspot and the scattering pattern could be photo_graphed. The rotation angles Op and 0A of P andA around the optical axis were measured UsingSony magnescales with an accuracy of 0.005 0
• and()c of C by a divided circle with the same accuracy.

Y. Furukawa et 01. / Ellipsometric study of transition layer.on surfaceof icecrystal 669
Fig. 4. illustration of the sample chamber: (a) sample chamber; (b) modified sample head which was used at the secondhalf of the experiments. I, ice sample; IS, ice sheet; G, glass; C.
copper plate; T, Teflon cover; TP , thermo panel; H 1,2 ' hole.
x
I
IX
Ir'-coolant rn
x·
xI
b
a
center and inclination of the ice sample.The temperatures of the ice surface (J:) and the
ice sheet (Tv) were measured by copper-constantan thermocouples of 0.1 mm diameter. whichwere frozen on the ice surfaces. The temperatureof the vapor source was controlled with a PIDcontroller and the temperature of the ice sample
I.x
Fig. 3. Optical system of ellipsometry: P, polarizer.(Glan-Thomson prism) ; C, compensator (quater-wave plate);A, analyzer (Glan-Thomson prism) ; T and T', telescopes ; M,
mirror.
All optical devices were mounted on opticalbenches (1 m long) which were connected at ajoint.
An ice sample was put in a sample chamberwhich was mounted over the joint of the ellipsometer. Fig. 4a shows an illustration of the samplechamber used. It was constructed by two separable parts. namely a chamber and a sampleholder. The chamber, which was made of stainlesssteel, was a cylinder with double walls and fixedover the joint of the ellipsometer. The inside diameter and length of the cylinder were 70 and 65rom, respectively. In order to make way for thelight beam, two small holes (HI and H 2) weremade in both sides of wall. The inside wall of thechamber was covered with a thin ice sheet whichworked as a vapor source.
The sample holder could be easily taken awayfrom or fitted up to the chamber. A system torotate the sample head around the axis XX', toshift it within ± 3 rom and to incline it delicatelywithin ±50
, was installed in the sample holder.By this system, the angle of incidence could becontrolled precisely.
Two types of sample heads were used in orderto mount an ice sample. The sample head illustrated in fig. 4a was used at the first half of theexperiments. A sample S was mounted by contactfreezing on the base of a cylindrical cavity. Toavoid the difficulty of mounting the ice sample,another type of head - as shown in fig. 4b - wasused at the second half of the experiments. Adevice was installed to manipulate in advance the
670 Y. Furukawa et al. / E/lipsometric study 01 transition layer on surface 01ice crystal
was adjusted by a thermo-electric cooling panel(TP) mounted in the sample head. Consequently,the ice surface temperature and the supersaturation or undersaturation could be controlled independently. The absolute accuracy of the temperature measurements was within 0.1°e.
3.2. Operating method
First of all, the angle of incidence was calibratedusing a triangular prism with apex angles of52.950°, which was mounted on the sample head.
An ice sample prepared by such a method asexplained in the next section was mounted on thesample head in a cold room. Then the normal ofthe measured surface was coincided roughly to theaxis xx',
The sample holder with the ice sample wasfitted upon the chamber and the angle of incidence for the ice surface was adjusted. The sampleposition was also adjusted simultaneously in orderfor the laser beam to be reflected under the bestconditions (smaller spot expansion and lowerscattering).
At each measurement, (I/I,~) was obtainedfrom a combination of BA , Bp and Be when theextinction condition of the laser beam had beenestablished. When Be was initially fixed at +45°or -45°, there were four independent combinations (zone) of rotation angles for the extinctioncondition. First the extinction angles for four zoneswere measured (zone measurements) as an initialcondition at T. lower than -to°e. The subsequent measurements were carried out for a properly fixed zone, and the (1/1, M obtained wasanalyzed under the correction which had originatedas the result of initial zone measurements. Themethod of correction will be explained in theseparate paper [38].
4. Preparation of the sample of ice surface
4.1. Method to prepare an ice surface
Surfaces surrounding a negative crystal (see fig.6) grown in an ice single crystal were used assamples of ice surfaces in this experiment. The
NEGATIVE CRYSTAl
GlASS r====;F=,
TO VACUUI1 _ , "5Z ~GAUGE _ ZSTO VACWH PU.....I I I WITH A COLDTRAP
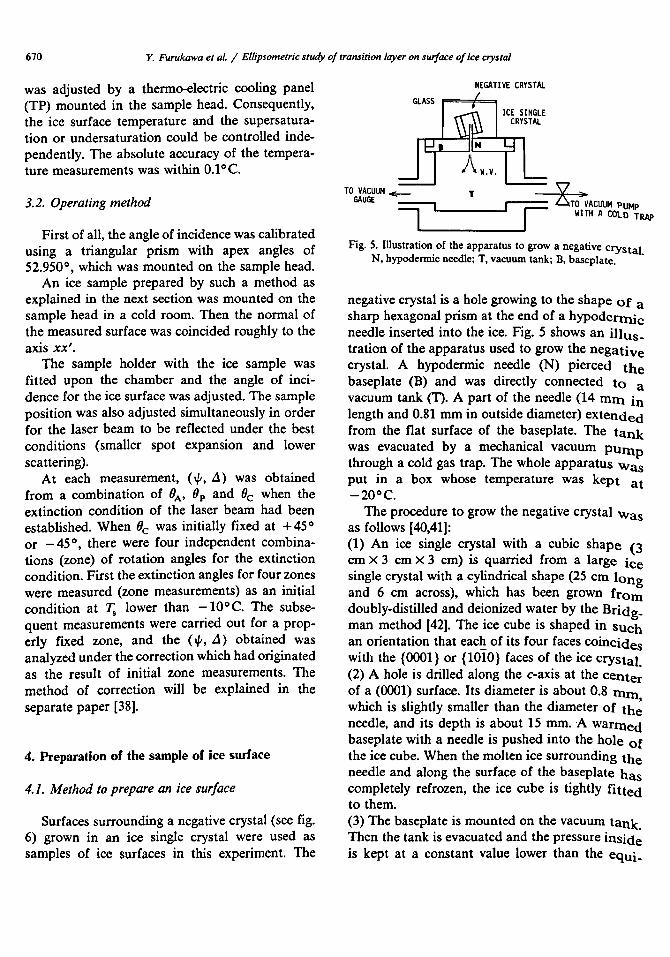
Fig. S. Illustration of the apparatus to grow a negative crystalN, hypodermic needle; T. vacuum tank; B, baseplate. .
negative crystal is a hole growing to the shape of asharp hexagonal prism at the end of a hypoder:rnicneedle inserted into the ice. Fig. 5 shows an illus.tration of the apparatus used to grow the negativecrystal. A hypodermic needle (N) pierced thebaseplate (B) and was directly connected to avacuum tank (T). A part of the needle (14 rnm inlength and 0.81 nun in outside diameter) extendedfrom the flat surface of the baseplate. The tankwas evacuated by a mechanical vacuum Pumpthrough a cold gas trap. The whole apparatus Wasput in a box whose temperature was kept at-20°C.
The procedure to grow the negative crystal Wasas follows [40,41]:(1) An ice single crystal with a cubic shape (3em X 3 em X 3 ern) is quarried from a large icesingle crystal with a cylindrical shape (25 em longand 6 em across), which has been grown fromdoubly-distilled and deionized water by the Bridg_man method [42]. The ice cube is shaped in SUchan orientation that each of its four faces coincideswith the {OOOI} or {10to} faces of the ice crystal.(2) A hole is drilled along the e-axis at the centerof a (0001) surface. Its diameter is about 0.8 mm,which is slightly smaller than the diameter of theneedle, and its depth is about 15 nun. A warmedbaseplate with a needle is pushed into the hole ofthe ice cube. When the molten ice surrounding theneedle and along the surface of the baseplate hascompletely refrozen, the ice cube is tightly fittedto them.(3) The baseplate is mounted on the vacuum tank.Then the tank is evacuated and the pressure inSideis kept at a constant value lower than the equt,
Y. Furukawa et al. / Ellipsometric study of transition layer on surface of ice crystal 671
10)
0.5mm
Fig . 6. A negative crystal of ice bounded by both {OOOl} and(1010 ) faces being molecularly smooth. Temperature is
- 20° C.
librium vapor pressure of ice at - 20°e. In ashort time, a small negative crystal with a hexagonal shape appears at the end of the needle (fig. 6).
After continuous evacuation for 40 to 50 h. thediameter of the negative crystal reaches 3 to 4mm.(4) Then the negative crystal is leaked with coldair. In order to use it as a sample of ellipsometry,a target surface (either a {0001} or a {l010} face)is cut out from this negative crystal. A groove isfirst made at the outside of the interior surfaceand then the surface is cleft using a thin blade.
4.2. Characteristics of the surfaces
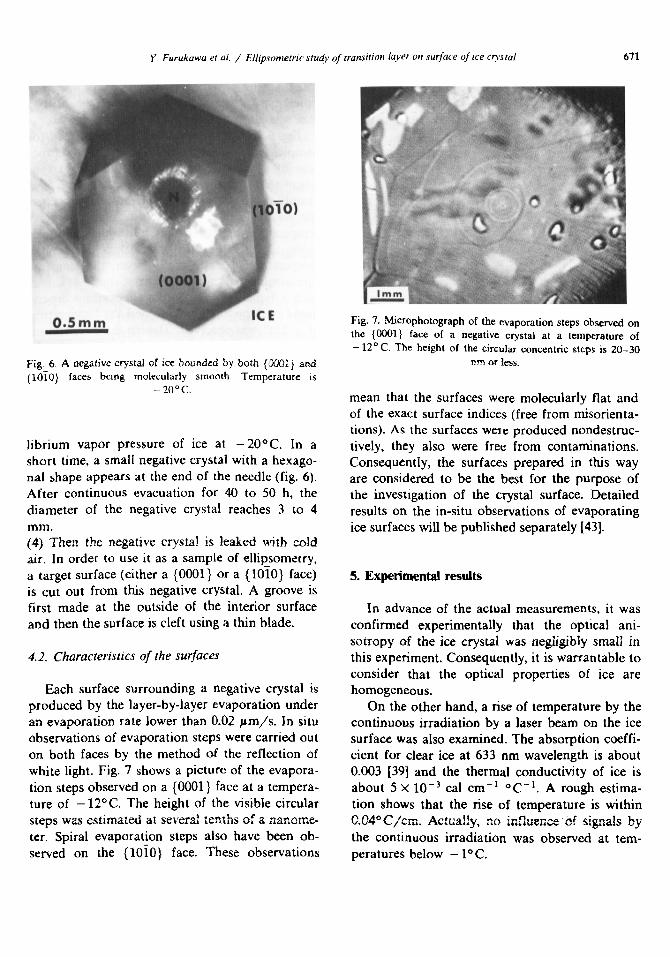
Each surface surrounding a negative crystal isproduced by the layer-by-layer evaporation underan evaporation rate lower than 0.02 pm/so In situobservations of evaporation steps were carried outon both faces by the method of the reflection ofwhite light. Fig. 7 shows a picture of the evaporation steps observed on a {GOOI} face at a temperature of -l2 0 e. The height of the visible circularsteps was estimated at several tenths of a nanometer. Spiral evaporation steps also have been observed on the {lOIO} face. These observations
Fig. 7. Microphotograph of the evaporation steps observed onthe (00(1) face of a negative crystal at a temperature of-12°C. The height of the circular concentric step s is 20-30
nm Of less.
mean that the surfaces were molecularly flat andof the exact surface indices (free from rnisorientations). As the surfaces were produced non des truetively, they also were free from contaminations.Consequently, the surfaces prepared in this wayare considered to be the best for the purpose ofthe investigation of the crystal surface. Detailedresults on the in-situ observations of evaporatingice surfaces will be published separately [43].
5. Experimental results
In advance of the actual measurements, it wasconfirmed experimentally that the optical anisotropy of the ice crystal was negligibly small inthis experiment. Consequently. it is warrantable toconsider that the optical properties of ice arehomogeneous.
On the other hand. a rise of temperature by thecontinuous irradiation by a laser beam On the icesurface was also examined. The absorption coefficient for clear ice at 633 om wavelength is about0.003 [39] and the thermal conductivity of ice isabout 5 X 10- 3 cal cm "! °C- 1. A rough estimation shows that the rise of temperature is withinC.04°C/cm. Actually, no influenceof signals bythe continuous irradiation was observed at temperatures below - I ° e.

672 Y. Furukawa et al . / Ellipsometric st udv of transuton layer 01/ surface of icc ""yslal
A series of experiments were carried out undervarious conditions. For all the experiments underequil ibrium conditions, Ts was first set at a temperature lower than -lOoC, and then it wascontinuously increased at a constant rate ofO.loC/min or less in order for all measurementsfor each ice sample to be finished as quickly aspossible. Tv also was increased at the same rateand was kept slightly higher than r. (0.2- 1.0 K) inorder to compensate the deviation from the equilibrium vapor pressure for the ice surface sample.Consequently, the ice surface measured was always kept in the condition close to the equilibrium. The measurements of (tf, L1) and temperature were carried out at intervals and also thereflection spot and scattering pattern were photographed.
Fig. 8 shows pictures of the reflection spots andtheir surroundings observed through a telescope.The reflection spot from the {OOOI} face concentrated on a narrow area as shown in fig. 8a.
Fig. 8. Photog raphs of the reflection spots observed throughthe telescope: (a) for the {OOOl} face; (b) for the {l OlO} face.
The diameter of the spot was within 0.05°. On theother hand . the reflection spot from the {lOIO}face was always elongated, as shown in fig. 8b.
Fig. 9 shows typical changes of L1 obtained forsamples from {OOOI } and {lOIO} faces as a func_tion of T". The value of L1 for the {OOOI} facebegan to decrease at a temperature of - 2° C andsteepl y decreased as the temperature approachedthe melting point , while it was nearly zero attemperatures below - 2° C. On the other hand, thevalue of L1 for the {lOIO} face showed a similartemperature dependence. However, the tempera_ture at which L1 began to decrease was -4°C andsuch a typical change as the temperature depen_dence of .1 became weak around the temperatureof - 2°C was observed. Though the temperaturedependence of .:l for the {0001} faces w~s nearlythe same for all samples, that for the {lOlO} facesshowed differences from sample to sample. Forexample, the temperatures at which .:l began todecrease scattered within the limits between - 2and - 4°C, and the extent of weak temperaturedependence of .:l around - 2°C also scattered.
Fig. 10 shows changes of tf obtained for thesame samples of fig. 9 as a function of r.. It is tobe noted that the values of tf for both samples are
_ 0001 - t ace
- - - 1010· eac e
Fig. 9. Temper ature dependences of 11 measured for typical icesamples. The thickness of the layer obtained by the analysis ofmeasured (1/- . 11) is also shown. Solid line: {OOO l} face; broken
line : {lOI O} face.

Y. Furukawa et al. I Ellipsometric study of transition layeron surfaceof icecrystal 673
(t/!, A) for both samples move nearly along theequi-refractive index line for n1 = 1.330. It meansthat the single layer model holds as the model ofice surface structure and the refractive index ofthe transition layer is around 1.330, which is quiteclose to that of water rather than to that of ice.Although the exact traces of (I/;, A) were differentfrom sample to sample, the systematic differencesbetween the temperature dependence of (I/;, A)for {Oool} and {lOIO} faces were confirmed by aseries of experiments.
Under the conclusion that the refractive indexof the transition layer is 1.330, the change of Acan be read as the thickness change of the layer.The result is shown in fig. 9. These results showthat the temperatures at which the transition layerappears are -2°C for the {000l} face and -2 to-4°C for the {lOIO} face, and also that thetemperature dependences of the thickness systematically differ from each other between bothfaces.
As a general tendency, the value of A measuredfor the {loIO} face at temperatures below -4°Calways shifted slightly in the region of positive A,
-5
_ (OOO1)-face
---- (10t Ol - fa co
.._--............--..-
1.0
nearly constant at temperatures below -0.7°C.In fig. 11, the changes of (1/;, A) for these
samples are plotted in a diagram of simulated(t/!, A) for the single layer model. The solid andbroken lines indicate the changes of (I/;, A) for the{D001} and {lOIO} faces, respectively. The crossedmarks for each line indicate the starting points ofthe measurements and the values of ( 1/;, A) changein the direction of arrows as the temperatureincreases. One may observe that the traces of
-5 -10Is : IEMPERATURE(DC)
Fig. 10. Temperature dependences of I/J measured for the samesamples as fig. 9.
1.290
"'2.0
- {OOOll-face._-- {l010}-face
Fig. 11. Plotting of measured (.p, ~) for samples shown in figs. 9 and 10 on the diagram of fig. 2. Crossed marks indicate the startingpoints of each measurement. The traces of (.p, ~) for both faces nearly coincide with the simulated curve for the thickening layer of
nl -1.330. The equi-thickness lines and part of the equi-refractive index lines are neglected.

674 Y. Furukawa et al. / Ellipsometnc study of transition layer on surface of ice crystal
5. Discussion
5.1. Thermodynamic consideration of the surfacecovered with QLL
where 0'1' O'w and O'I;W are the surface free energies per unit area (surface tensions) for inter_faces of vapor/ice, vapor/water and ice/waterrespectively. It means that an ice surface with aQLL is more stable than a surface without QLL.In this case, the equilibrium thickness de of theQLL, which is determined by the balance betweenthe disadvantage of the bulk free energy and thefall of the surface free energy, is given by theequation:
(2)
(3)
Kuroda and Lacmann [6] theoretically dis_cussed the temperature dependence of the thick_ness of the QLL on an ice surface and its arri ,sotropy with respect to the crystallographic orien.,tations of surfaces.
The existence of a QLL on the surface is disad_vantageous due to the bulk free energy of theliquid phase. However, it lowers the surface freeenergy of the system, so that it is possible that theQLL stably exists on the surface. For ice surfacescovered with a QLL, they indicated that the werrs;bility parameters .dO'oo become positive. That is,
where n and A are parameters connected with theinteraction between water molecules in the icecrystal, Vm is the molecular volume in the ice, Tthe melting temperature of ice, .dT = Tm - T andQm the latent heat of melting per molecule.
From eq. (3), dcq increases with .daoo' As thesurface energy per unit area is proportional to thenumber density of broken hydrogen bonds alongthe ~rface (broken bond model), 0 1(0001) -c0'1(1010). Consequently, the following relations areexpected for ice surfaces:
as shown in fig. 9. It means that the {lOIO} facewas geometrically rough (n} < nz) in this temperature region, compared with the smooth surface of{OOOI} (.:1 = 0). The laser spots observed for the{l010} faces were more diffuse than those for the{OOOI} faces, as shown in fig. 8. This result alsosupports this consideration about the surfaceroughness.
In fig. 9, the values of .:1 for both faces arecrossing each other at a temperature of about-0.7°C. However, we were not able to confirmwhether a crossing like this made sense or not.The contact of the ice sample with the samplehead became loose at the temperatures closest tothe melting point, because of the appearance ofthe melted layer at the interface between the icesample and the sample head. It may cause a littlechange of the angle of incidence. Consequently,the accuracy of the measurements was not alwayssufficient at temperatures above about - 0.5°C.
Furthermore, the experiments were also carriedout under the condition of nonequilibrium vaporpressure. Though it was very difficult to obtainstable reflection spots from the growing orevaporating ice surface, the measurements werecarried out with sufficient accuracy. However, nosystematic deviation of (tP, .d) from the resu'ltsobtained under equilibrium conditions was observed.
The results obtained in this experiment aresummarized as follows:(1) The refractive index of the transition layer isabout 1.330 for both faces, which is quite close tothat of bulk water.(2) The temperatures at which the transition layeris detected are - 2°C for the {OOOl} face and - 2to - 4°C for the {WiO} face.(3) The thickness of the transition layer increaseswith increasing temperature, and d(OOOI) <d(10IO) for a given temperature above -4°C.(4) Systematic dependences of the layer thicknesson the supersaturation or undersaturation werenot observed.
.dO'oo (0001) < .dO'oo(loIO) -+ dcq(OOOl) < deq(lOlO)
-+ Tw(OOOl) > Tw(loIO) . (4)

Y. Furukawa et al. / Ellipsometric studv of transition layer IJI/ surface of ice crvstal 675
In the present experiments, it was clarified thatn] is quite close to n w ' It means that the densityof the transition layer is quite close to that of thebulk water, since the refractive index is proportional to the density. Consequently, we concludethat the transition layer on the ice surface hasproperties close to those of the bulk water (namely,the transition layer is just the quasi-liquid layer).In other words, the present experimental result isdirect evidence of the surface melting. Furthermore, the present experimental results show thatTw(OOOI) = -2°C,-- Tw(lOI0) = -2 to -4°C anddeq(OOOl) < deq(lOlO) for a given temperature. Itis to be noted that these results about the QLLqualitatively coincide with the theoretical explanation by Kuroda and Lacmann [6].
The temperatures T; obtained in the presentexperiments are extremely high compared withthose temperatures which have been obtained byprevious experiments [13,14,16-27]. The reasonfor this difference is considered to be as follows.The surfaces used in our experiment were molecularly flat, free from misorientation and super-clean,as mentioned in the previous section, in comparison with the rough and high-index surfaces usedin other experiments. Because 0] for rough orhigh-index surface is higher than 0](0001) or0'1(1010), surfaces like this are more wettable than{0001} or {l01O} faces (namely, Tw(OOOI) >Tw(lOlO) > T; (high index».
At temperatures above Tw ' the QLL can stablyexist on the ice surfaces. It is considered that theQLL is formed by the melting of the surface(phase change of the surface structure). Generallyspeaking, the advance of the phase change is expected with the difficulty of nucleation. Consequently, it is to be expected that the scattering ofT; measured for {lOlO} faces (- 2 to - 4° C)reflects the nucleation process of the surface melting.
5.2. Microscopic structure of interface between theQLL and the ice crystal
In fig. 9, the temperature dependence of .1obtained for the {I 010 } face becomes weak around-laC, as compared with the monotonous decrease of .1 for the {0001} face. This trend ap-
peared in a greater or lesser degree for all measurements of POlO} faces. It may be indicatedtha~ the microscopic structure of the QLL on the{lOlO} face changes at - l°C.
On the other hand, it has been observed thatthe conspicuous habit change of ice crystals occursat a temperature of - 2°C. Kohata et al. [41]showed that the shape of a negative crystal(evaporation form) changes to a sphere which istruncated only by small {000l} Iaces. above - lOC(fig. 12), compared with a hexagonal prism surrounded by both {OOOI} and {l010} faces below-2°C (see fig. 6). Yamashita and Asano [44]found that the shape of snow crystals (growthform) also changes from a hexagonal plate to acircular disk at temperatures above - 2° C. Nenowand Stoyanova [45] obtained the same result forthe shapes of ice crystals grown from the vapor ona glass substrate. These observational results meanthat the anisotropy of growth or evaporation rateswith respect to all surfaces with crystallographicorientations except the {0001} face disappears attemperatures above - 2° C. The disappearance ofanisotropy like this occurs when the differences ofsurface structures vanish as a consequence of thesurface roughening transition. That is, ~he
roughening transition temperature for the {lOlO}face, Tr(10l0), is - 2°C.
The present experimental results showed that
Fig. 12. A spherical negative crystal of ice with two small basalfacets. observed at temperatures above -2°C (after Kohata et
al. [41)).

676 Y. Furukawa et al. / E//ipsometric study 0/transition layer on surface 0/ice crystal
m.p.o -1
TEMPERATURE (oel-2 -3 -4 -5
MORPHOLOGYOF
ICE CRYSTAL
Spherical negativecrystal with basa Ifacets
Circular-disksnow crystal
?
Hexagonal prism ofnegative crysta I
Hexagonal plate ofsnow crystal
~rcE
SURFACE STRUCTUREOF
ICE CRYSTAL
~:~~~l ITr TwlOOOI)---- -.--
I
~Jr~;;m)II: ~I~J ICE + I ICEr,11010)
,---IIIII
TwIIOTo)
Type I : sn~oth interface, Type II : rough interface
Fig. 13. Schematic diagram to show the relation between the change of the microscopic surface structure and the surface rougheningtransition .
the critical temperature Tw(lOIO) for the appearance of QLLs is between - 2 and -4°C,which is lower than 1;.(1010). Consequently, inorder to explain the temperature difference between T, and Tw ' we should consider that theinterface structure between the QLL and the ice,for the {lOIO} face, changes from smooth to roughat a temperature of - 2° C, though either thisinterface for the {OOOl} face is kept smooth as thewhole temperature range (0 to - 2° C), 'Or 1;. forthe {OOOI} face is quite close to the melting point.In other words, the roughening transition shouldoccur at the interface between the QLL and theice crystal. These relations are summarized in fig.13. It is to be noted that the phenomenon ofsurface melting must be clearly distinguished fromthe surface roughening and 1;. is higher than T;for ice surfaces.
6. Conclusions
The conclusions obtained by the present experimental study are summarized as follows:
(1) The refractive index of the transition layer is1.330 for both {OOOl} and {lOla} faces of an icecrystal (1.3327 for the bulk water and 1.3079 forthe ice crystal). It means that the density of thetransition layer is quite close to that of the bUllewater. That is, the transition layer is a so-calledquasi-liquid layer, and it gives direct evidence ofthe surface melting.(2) The critical temperatures at which the QLLappears on the surface of an ice crystal areTw(OOOl) = -2°C and Tw(1010) = -2 to -4°C.The thickness of the QLL increases as the temper.ature approaches the melting point and deq(OOOl)< deq(1010) for a given temperature above -4°C.(3) These results are qualitatively explained by thetheory of Kuroda and Lacmann [6].(4) The habit change observed for the negativecrystals and the snow crystals indicates that theroughening transition occurs at the interface be.tween the QLL and the ice crystal on the {lOIO}face at a temperature of -2°C.(5) For ice crystal surfaces, the roughening trans];tion temperature at which the facets disappear

Y. Furukawa et al. / El/ipsometric study of transition layer on surface of Ice crystal 677
from the growth morphology or the negativecrystal is higher than the critical temperature atwhich the QLL appears on the surface.
Acknowledgements
The authors would like to express their thanksto Professor T. Kobayashi of the Hokkaido University for his continuous encouragements. Theyare also indebted to Professor M. Oguro of theHokkaido University of Education for his kindoffer of the ice single crystal which was used inpart of the experiment. This work was supportedby a Grant-in-Aid for Scientific Research (No.5940235) from the Japanese Ministry of Education, Science and Culture.
References
[11 W.K. Burton, N. Cabrera and F.C. Frank, Phil. Trans.Roy. Soc. London A243 (1951) 299.
[2] LN. Stranski, Z. Physik 119 (1942) 22; Naturwissenschaften 30 (1942) 425; 31 (1943) 144.
[3] A.R. Ubbelohde, The Molten State of Matter (Wiley, NewYork, 1977).
[4] R. Lacmann and I.N. Stranski, J. Crystal Growth 13/14(1972) 236.
[5] A.A. Chemov, J. Crystal Growth 42 (1977) 55;A.A. Chemov, in: Modem Crystallography III: CrystalGrowth (Springer, Berlin, 1984) p. 156.
[6] T. Kuroda and R. Lacmann, J. Crystal Growth 56 (1982)189.
[7] D. Nenow, in: Progress in Crystal Growth and Characterization, Vol. 9, Ed. B.R. Pamplin (Pergamon, Oxford,1984) p. 185.
[8] A. Trayanov and D. Nenow, J. Crystal Growth 74 (1986)375.
[9] M. Faraday, Lecture given at Royal Institution, London,7 June 1850, reported in Athenaeum 1850, p. 640.
[l0] W.A. Wyle, J. Colloid Sci. 6 (1951) 389.[11] N.H. Fletcher, Phil. Mag. 7 (1962) 255; 18 (1968) 1287;
N.H. Fletcher, in: Physics and Chemistry of Ice, Eds. E.Whalley et al. (Royal Soc. Canada, Ottawa, 1973) p. 132.
[l2] G.J. Turner, Phil. Mag. 48 (1983) L45.[13] U. Nakaya and A. Matsumoto, J. Colloid Sci. 9 (1954) 41.[14] H.H.G. Jellinek, J. Colloid Sci. 14 (1959) 268; J. Colloid
Interface Sci. 25 (1967) 192.
[15] J.W. Telford and J.S. Turner, Phil. Mag. 8 (1963) 527.[16] R.R. Gilpin, J. Colloid Interface Sci. 68 (1979) 235.[17] C. Jaccard, in: Physics of Snow and Ice, Vol. 1 (Hokkaido
Univ., Sapporo, 1967) p. 173.[18] N. Maeno and H. Nishimura, J. Glaciology 21 (1978) 193.[19] V.I. Kvlividze, V.F. Kiselev, A.B. Kuraev and L.A.
Ushakova, Surface Sci. 44 (1974) 60.[20] I. Golecki and C. Jaccard, Phys. Letters 63A (1977) 374.[21] A.W. Adamson, L.W. Dormant and M.W. Orem, J. Col
loid Interface Sci. 25 (1967) 206.[22] M.W. Orem and A.W. Adamson, 1. Colloid Interface Sci.
31 (1969) 278.[23] I. Watanabe and T. Okita, Bull. Inst. Publ. Health 25 (2)
(1976) 67.[24] D. Nason and N.H. Fletcher, J. Chern. Phys. 64 (1975)
4444.[25] E. Mazzega, U. del Pennino, A. Loria and S. Mantovani,
J. Chern. Phys. 63 (1976) 1028.[26] S. Valeri and S. Mantovani, J. Chern. Phys. 69 (1978)
5207.[27] D. Beaglehole and D. Nason, Surface Sci. 96 (1980) 357.[28] J.Q. Broughton and L.V. Woodcock, J. Phys. C11 (1978)
2743.[29] J.Q. Broughton and G.H. Gilmer, J. Chern. Phys. 79
(1983) 5059, 5105, 5119.[30] T. Matsubara, Y. Iwase and A. Momokita, Progr. Theoret.
Phys. 58 (1977) 1102.[31] K.D. Stock and E. Menzel, Surface Sci. 61 (1976) 272; J.
Crystal Growth 43 (1978) 135.[32] K.D. Stock and B. Grosser, J. Crystal Growth 50 (1980)
485.[33] A. Pavlovska and D. Nenow, Surface Sci. 27 (1971) 211; J.
Crystal Growth 39 (1977) 346.[34] E.D. Dukova and D. Nenow, Kristallografiya 14 (1969)
106.[35] J.W.M. Frenken and J.F. van der Veen, Phys. Rev. Letters
54 (1985) 134.[36] A.A. Chemov and VA Yakovlev, presented at Oji Intern.
Seminar on Morphology and Growth Units of Crystals,Zao,1985.
[37] C. Kaito, Japan. J. Appl. Phys. 24 (1985) 261.[38] M. Yamamoto, Y. Furukawa and T. Kuroda, to be pub-
lished.[39] P.V. Hobbs, Ice Physics (Clarendon, Oxford, 1974).[40] CA Knight and N.C. Knight, Science 150 (1965) 1819.[41] S. Kohata, Y. Furukawa and T. Kobayashi, J. Crystal
Growth, to be published.[42] A. Higashi, J. Crystal Growth 24/25 (1974) 102.[43] Y. Furukawa, to be published.[44] A. Yamashita and A. Asano, J. Meteorol. Soc. Japan 62
(1984) 140.[45] D. Nenow and V. Stoyanova, J. Crystal Growth 46 (1979)
779.